Abstract
In this paper, the SCO2 Brayton regenerative and recompression cycles are studied and optimized for a next-generation solar power tower under a maximum cycle temperature of over 700 °C. First, a steady-state thermodynamic model is developed and validated, and the impacts of different operating parameters on three critical performance indexes, including the cycle thermal efficiency, specific work, and heat storage temperature difference, are analyzed. The results reveal that these performance indexes are influenced by the operating pressures, the SCO2 split ratio, and the effectiveness of the regenerators in complex ways. Subsequently, considering the three performance indexes as the optimization objectives, a triple-objective optimization is carried out to determine the optimal operating variables with the aim of obtaining Pareto solutions for both cycles. The optimization indicates that the regenerative cycle can achieve the maximum heat storage temperature difference and the maximum specific work of 396.4 °C and 180.6 kW·kg−1, respectively, while the recompression cycle can reach the maximum thermal efficiency of 55.95%. Moreover, the optimized maximum and minimum pressure values of both cycles are found to be around 30 MPa and 8.2 MPa, respectively. Additionally, the distributions of the optimized values of the regenerator effectiveness and the SCO2 split ratio show different influences on the performance of the cycles. Therefore, different cycles with different optimized variables should be considered to achieve specific cycle performance. When considering thermal efficiency as the most important performance index, the recompression cycle should be adopted. Meanwhile, its SCO2 split ratio and the regenerator effectiveness should be close to 0.7 and 0.95, respectively. When considering heat storage temperature difference or specific work as the most important performance index, the regenerative cycle should be adopted. Meanwhile, its regenerator effectiveness should be close to 0.75. The results from this study will be helpful for the optimization of superior SCO2 cycles for next-generation solar tower plants.
1. Introduction
In recent years, the escalating global consumption of fossil fuels has led to the more pronounced occurrence of environmental pollution and ecological degradation [1,2]. To reduce reliance on traditional fossil fuels and mitigate their negative impacts, renewable energy technologies have experienced rapid advancements [3,4]. Solar thermal power is an important alternative solar power generation technology possessing the ability of heat storage [5,6]. The primary objective of solar thermal power technology development is to enhance thermal efficiency, elevate specific work, and accomplish large-scale heat storage. Among the available solar thermal power technologies, including the solar power tower (SPT) [7,8], solar dish collector [9,10], linear Fresnel reflector [11,12] and parabolic trough collector [13,14,15], the SPT is a promising option that is expected to meet the above development requirements [16].
Currently, commercial SPT plants operate with receiver outlet temperatures below 565 °C and use the steam Rankine cycle as their power cycle [17]. This cycle yields a maximum cycle temperature of around 550 °C and a thermal efficiency of no more than 44% [18]. To increase the economic competitiveness of these plants, it is essential to increase their thermal efficiency by elevating their maximum cycle temperature [19] and developing a more advanced power cycle [20]. Recent studies have shown that next-generation SPT plants could achieve maximum cycle temperatures exceeding 700 °C [18,21]. Additionally, at a maximum cycle temperature of above 600 °C, the supercritical carbon dioxide (SCO2) Brayton cycle has the potential to outperform the steam Rankine cycle in terms of thermal efficiency [22,23]. Meanwhile, Chen et al. [24] found that the SCO2 Brayton cycle can produce a larger net work output than the steam Rankine cycle at a maximum cycle temperature of 620 °C, making it more competitive. These two performance advantages become more significant as the maximum cycle temperature increases [25]. Moreover, the SCO2 cycle’s heater can achieve a temperature difference exceeding 200 °C between its two terminals [26], making it highly compatible with the heat storage unit [27]. Furthermore, employing the SCO2 cycle in an SPT grants several advantages over the steam Rankine cycle, including greater adaptability to off-design operating conditions [28], applicability to arid areas using dry-cooling methods [29], and a smaller heat exchanger and turbomachinery [30]. In summary, the SCO2 Brayton cycle has shown great potential to integrate with next-generation SPT plants.
In an SPT plant, improving the thermal efficiency, specific work, and compatibility with the heat storage unit has always been a critical aspect of the SCO2 Brayton cycle. Consequently, numerous studies have recently been conducted to optimize the performance of various SCO2 cycle layouts in SPT systems. Many of these studies have advocated for regenerative and recompression cycles due to their simplicity, compactness, and favorable cycle performance [31]. For instance, Wang et al. [28] and Guo et al. [32] optimized several SCO2 Brayton cycle layouts incorporated in the SPT plant and compared the optimization results. Their results indicated that the recompression cycle could offer relatively high thermal efficiency with a relatively simple layout, while the regenerative cycle could provide relatively high specific work and heat storage temperature difference with the simplest layout. Fahad et al. [33] integrated and optimized five SCO2 Brayton cycles within an SPT system, comparing their net work outputs and thermal efficiencies at different time points. Their results indicated that the regenerative and recompression cycles could achieve the best performance at different time. Similarly, Chen et al. [34] evaluated six SCO2 Brayton cycles in a next-generation SPT system and optimized each cycle based on thermal efficiency and specific work under varying temperatures. They concluded that the recompression and regenerative cycles were the most suitable options for the next-generation SPT system. Wang et al. [35] further optimized the recompression cycle to enhance the SPT system’s exergy efficiency. Their findings highlighted the importance of increasing the system’s operating temperature to improve the recompression and overall system performance. However, most optimization studies on SCO2 Brayton cycles have mainly focused on single-objective or dual-objective optimizations, aiming to improve thermal efficiency, specific work, or compatibility with the heat storage unit. Few studies have explored the triple-objective optimization of the three critical performance indexes.
In this paper, parameter analysis and the triple-objective optimization of the regenerative and recompression cycles are conducted for a next-generation SPT system wherein a typical maximum cycle temperature of 750 °C is considered. Initially, the impacts of changes in operating pressure, regenerator effectiveness, and the SCO2 split ratio on thermal efficiency, specific work (which denotes the net work output), and the heat storage temperature difference (which denotes the ability to pair with the heat storage unit) are investigated. Subsequently, a triple-objective optimization for each SCO2 cycle is conducted, and the optimization results are compared and discussed. Finally, the relationships between the optimized variables and the three optimization objectives are further analyzed.
In a typical next-generation solar power tower plant operating at above 700 °C, the operational processes follow a defined sequence, as illustrated in Figure 1 and Figure 2. Firstly, a heliostat field is employed to reflect the incident solar radiation to a receiver located at the top of a central tower. Then, a molten chloride salt [36] that can operate at above 700 °C is used as the heat transfer fluid (HTF) to flow into the receiver, where it undergoes heating, resulting in a high-temperature state that is denoted as A in Figure 1 and Figure 2. Subsequently, the high-temperature molten chloride salt at state A bifurcates into two streams. One of the streams flows into the heater to heat the SCO2 and is subsequently cooled to state B. The other stream is reserved in the hot tank of the heat storage unit. Eventually, the SCO2 propels the power cycle after undergoing heating in the heater, and the cold HTF at state B is returned to the receiver or stored in the cold tank of the heat storage unit.
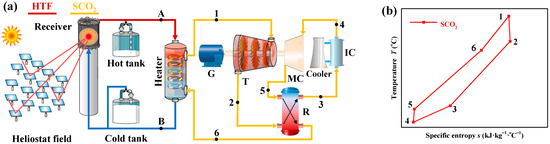
Figure 1.
(a) Schematic of the next-generation SPT applying the SCO2 regenerative cycle and (b) its T-s plot.
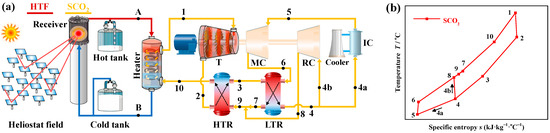
Figure 2.
(a) Schematic of the next-generation SPT applying the SCO2 recompression cycle and (b) its T-s plot.
The SPT plant utilizing a typical SCO2 regenerative cycle is delineated in Figure 1a, while the correlation between entropy and temperature (s-T) at each point in this cycle is illustrated in Figure 1b. During the operation of the SCO2 regenerative cycle, the process commences with the heating of SCO2 to its maximum pressure and temperature state, denoted as state 1, at the heater outlet. The heated SCO2 then enters the turbine to expand and is subsequently discharged when it attains its minimum pressure state, which is referred to as state 2. The SCO2 then undergoes a regeneration process in the regenerator (R) and a cooling process in the dry-cooling inter-cooler (IC) in succession, reaching state 3 and its minimum-temperature state 4, respectively. Then, in order to transition the SCO2 from state 4 to the maximum-pressure state 5, the main compressor (MC) is operated. The SCO2 then undergoes another regeneration process in the regenerator (R), improving its temperature to state 6. Eventually, the SCO2 returns to the heater to complete a cycle process.
An SPT plant utilizing a typical SCO2 recompression cycle is delineated in Figure 2a along with an illustration of the correlation between entropy and temperature (s-T) in the cycle (see Figure 2b). In contrast to the SCO2 regenerative cycle, the SCO2 recompression cycle substitutes the regenerator (R) with a high temperature regenerator (HTR) and a low temperature regenerator (LTR), while also including a re-compressor (RC). The cycle begins with the SCO2 being heated by the heater and expanding from state 1 to state 2 in the turbine. Then, the SCO2 at the turbine outlet (state 2) enters the HTR and LTR successively, ultimately arriving at states 3 and 4, respectively. The SCO2 subsequently splits into two streams, with stream 4a undergoing a cooling process in the dry-cooling inter-cooler (IC) to achieve the minimum temperature state 5 and stream 4b progressing directly to reach the maximum pressure state 8 via the compression process in the re-compressor (RC). Following this, the SCO2 at the minimum pressure state 5 reaches the maximum-pressure state 6, and state 7, through the main compressor (MC)’s compression process and the LTR’s regeneration process, respectively. Finally, the two streams at states 7 and 8 converge and participate in the HTR’s regeneration process, ultimately arriving at state 10.
2. Methods
In this section, an optimization model combining a steady-state thermodynamic model and a multi-objective genetic algorithm is developed for the SCO2 Brayton cycle. This model can not only predict the cycle performance reliably but also optimize the cycle by considering three critical performance indexes as its objectives. The details of the thermodynamic model and the multi-objective genetic algorithm are provided as follows.
2.1. Thermodynamic Simulation Model
As the main objective of this work is to examine and improve the performance of the two studied SCO2 Brayton cycles, for the sake of simplicity, precise simulations of the heliostat field, receiver, and heat storage unit were ignored in our simulation. However, comprehensive steady-state thermodynamic simulation models were meticulously constructed to assess the performance of the two cycles. During the simulation, the thermodynamic variables related to SCO2 at different temperatures and pressures were obtained by using REFPROP [37]. In addition, the following plausible assumptions were implemented to streamline the simulation procedures:
- (1)
- The cycles always maintained stable operation [38].
- (2)
- The potential energy and kinetic energy of each cycle was maintained unaltered [39].
- (3)
- Heat dissipations and pressure reductions in the cycle were insignificant [40].
- (4)
- The effectiveness model was suitable while modeling the regenerator [41].
- (5)
- The cycle performance was not influenced by the mass flow rate of SCO2 [42].
The fundamental settings utilized in the thermodynamic simulation of the two SCO2 cycles are presented in Table 1, while Section 3.1.1 outlines the elaborate simulation procedures for both cycles.

Table 1.
Fundamental settings utilized in the thermodynamic simulation.
2.1.1. Modeling of the Two SCO2 Brayton Cycles
After assuming the operating conditions and the fundamental settings of the two SCO2 cycles, the detailed modeling processes for the cycles are introduced as follows.
For the SCO2 regenerative cycle, the work contributed by the expansion of the SCO2 in the turbine (WT) is firstly determined using Equation (1). Next, the work spent by the compression process of the main compressor (WMC) is expressed by Equation (2). Hence, the net work output (Wnet) generated by the SCO2 regenerative cycle thus allows for being determined via Equation (3).
Here, hi indicates the SCO2’s specific enthalpy at each state i; the subscript “s” represents the SCO2 under ideal conditions.
For the regenerator, the definition equations of its effectiveness, Equations (4) and (5) [35,41], are utilized to derive the thermodynamic variables of the SCO2 at its outlets and inlets. In this way, h6 is derived, and the heat obtained by the SCO2 from the heater (Q) is then determined using Equation (6).
Here, hp3,T5 is the specific enthalpy predicted by selecting the pressure of SCO2 at state 3 and the temperature of SCO2 at state 5; hp6,T2 is the specific enthalpy predicted by selecting the pressure of SCO2 at state 6 and the temperature of SCO2 at state 2.
For calculating the minimum temperature of the HTF (TB), as indicated in Equation (7), it is reasonable to assume that the entropy generations at the heater’s two terminals are equivalent [46]. As a result, Equation (8) can be derived to determine the minimum HTF temperature (TB) at the heater outlet.
Here, TA represents the maximum HTF temperature of the heater; ΔQ represents the heat power that is exchanged by the fluids between the two sides of the heater.
The procedures employed to simulate the SCO2 recompression cycle bear similarities to those employed in the SCO2 regenerative cycle. This similarity is supported by the presence of energy equilibrium equations, as shown in Table 2. For the sake of brevity, detailed explanations of these equations have been omitted.
Table 2.
Energy equilibrium equations for the SCO2 recompression cycle.
2.1.2. Model Validation
To validate the present model, an SCO2 recompression cycle previously studied by Turchi et al. [47] is simulated using the present model. The specific input variables in Table 3 and other simulation settings are left unchanged from those of Turchi et al. [47]. As seen in Figure 3, the discrepancies between the present thermal efficiency data and Turchi et al.’s data [47] are all in the range of −1.81 to 0.15 percentages, with a small standard deviation of only 0.486 percentages for the absolute values of these discrepancies. Due to the good consistency between the present results and those of Turchi et al. [47], the present model can be considered trustworthy.
Table 3.
Input variables for the validation [47].
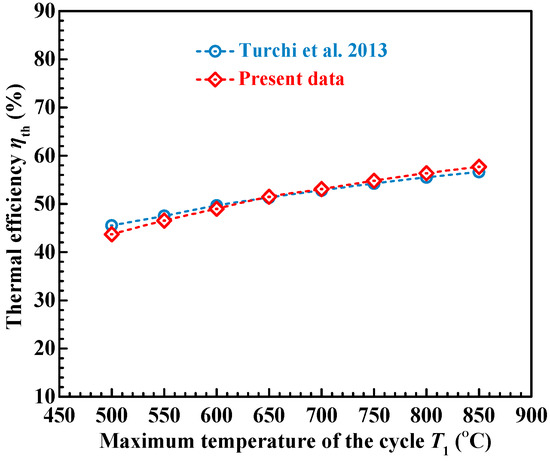
Figure 3.
Thermal efficiency data predicted by present model and Turchi et al.’s model [47].
2.2. Cycle Performance Indexes
The thermodynamic performance of the two SCO2 cycles for the next-generation SPT plant can be evaluated by considering three parameters as essential performance indexes.
Firstly, it is important to acknowledge that a larger heat storage temperature difference (ΔT) between the two heat storage tanks can significantly improve each cycle’s compatibility with the heat storage unit, thus playing a crucial role in the plant’s efficient operation [48,49]. Therefore, ΔT is selected as a critical performance index, as expressed in Equation (9).
Here, TA is the HTF temperature in the hot tank or at the heater inlet/°C; TB is the HTF temperature in the cold tank or at the heater outlet/°C.
Secondly, the specific work (w) and thermal efficiency (ηth) of an SCO2 Brayton cycle are crucial factors in reducing the sizes of the cycle equipment and the heliostat field, respectively. ηth is defined as the ratio between the net power produced by the cycle (Wnet) and the heat power absorbed by the cycle (Q). w represents the output power that can be generated by one kilogram working fluid. Therefore, improving these parameters can contribute to lowering the overall capital cost of the cycle.
2.3. Optimization Approach
The Non-dominated Sorting Genetic Algorithm II (NSGA-II) is a multi-objective optimization algorithm developed by Kalyanmoy Deb in 2002 [50].
NSGA-II operates through iterative improvements of a population of individuals across multiple generations. Each generation begins with non-dominated sorting being performed by NSGA-II to partition the individuals into different fronts based on their non-dominance levels. Subsequently, NSGA-II assigns a fitness value to each individual, taking into account both their front assignment and crowding distance. To generate new offspring solutions from the existing population, NSGA-II employs genetic operators such as crossovers and mutations. These offspring solutions are then evaluated and added to the population considering their non-dominances and crowding distances. This iterative process continues for multiple generations until NSGA-II converges to a set of solutions that are non-dominated, representing an optimal trade-off among conflicting objectives.
Due to its proven capability to optimize several conflicting objectives simultaneously, NSGA-II has been widely used in solving various real-world optimization problems [51,52]. In the current optimization, NSGA-II has also been chosen to optimize the SCO2 cycles for next-generation SPT plants. The variables selected for optimization are the operating pressures (pmax, pmin), SCO2 split ratio (SR), and effectiveness of the regenerators (εR, εHTR, εLTR). The optimization ranges for these variables are provided in Table 4. The optimization objectives include the specific work (w), the heat storage temperature difference (ΔT), and the thermal efficiency (ηth).
Table 4.
Variable optimization ranges settings.
To begin the optimization process, a first-generation population of 200 individuals is created. Each individual’s phenotype represents the three optimization objectives. The genes in the ith individual’s chromosome (Xi) determine its phenotypes and represent the variables to be optimized, which can be expressed using Equation (10).
Here, i = 1, 2, …, 200.
The optimization process involves the utilization of genetic operators such as selection, crossover, and mutation, as well as techniques like fast non-dominant sorting, elite strategy, and crowding distance. These approaches are implemented to enhance the efficiency and effectiveness of the optimization process. Following 300 generations of evolution, the population converges into the final optimized population, where each individual exhibits optimized phenotypes including optimized ΔTi, wi, and ηth,i.
3. Results and Discussion
In this section, firstly, a variable analysis will be employed to investigate the impacts of operating pressure, regenerator effectiveness, and SCO2 split ratio on thermal efficiency, specific work, and heat storage temperature difference. Subsequently, a triple-objective optimization for each SCO2 cycle will be conducted, and the optimization results will be compared and discussed. Finally, the relationships between the optimized variables and the three optimization objectives will be further analyzed.
3.1. Variable Analysis
This section investigates the influences of key variables on the cycle performance of the relevant SCO2 Brayton cycles. The variables of interest include the maximum and minimum pressures (pmax, pmin), SCO2 split ratio (SR), and the effectiveness of all regenerators (εR, εHTR, εLTR). To fully comprehend the impacts of these variables on the cycle performance, it is imperative to examine the change in each performance index as each variable is raised. During the variable analysis, while one variable is being raised, the other variables maintain constant values, as indicated in Table 5. By comprehensively analyzing the influences of each variable, a deeper understanding of their individual contributions to the cycle performance can be attained.
Table 5.
Settings of input variables for variable analysis.
3.1.1. Influences of the Maximum Cycle Pressure
Firstly, the impacts of the maximum pressure (pmax) on the specific work (w), heat storage temperature difference (ΔT) and thermal efficiency (ηth) of each of the two SCO2 cycles are analyzed. The results are displayed in Figure 4, where pmax = 14~30 MPa.
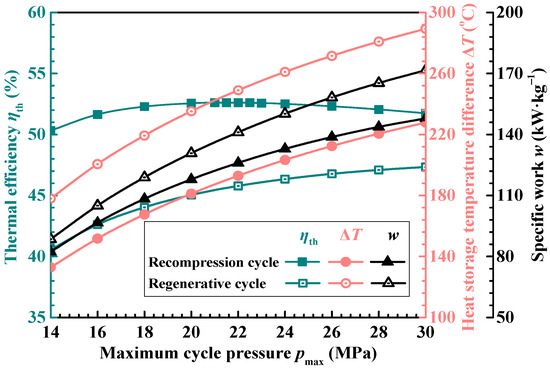
Figure 4.
Influences of the maximum cycle pressure (pmax).
With the rise of pmax, Figure 4 reveals, specific work (w) increases monotonically for both cycles. The reason for this is that the work output by the turbine and the work consumed by the compressor are both increased. However, since the work output increases more rapidly than the work consumed, the cycle net work (Wnet) and the specific work (w) keep increasing. Secondly, ΔT also increases monotonically for both cycles as the SCO2 temperatures at the regenerator’s hot terminal (t2 and t6 in Figure 1; t2 and t10 in Figure 2) decrease with a rising pmax. Furthermore, the change trend of the heat obtained by the SCO2 from the heater (Q) is always consistent with that of the ΔT. Figure 4 illustrates that the regenerative cycle’s ηth rises with a rising pmax since the improvement in cycle net work (Wnet) outpaces that of the heat obtained by the SCO2 from the heater (Q) in the regenerative cycle, resulting in an increasing trend for ηth. However, the recompression cycle’s ηth initially rises, achieving its highest value of 52.61% when pmax reaches around 22 MPa, and then monotonously decreases. This is due to the fact that when pmax is within 14~22 MPa, the increment in cycle net work (Wnet) outpaces that of the heat obtained by the SCO2 from the heater (Q), while the situation reverses after pmax exceeds 22 MPa.
By comparing the performance of the two cycles in Figure 4, it can be found that the regenerative cycle generates larger specific work (w) and a wider heat storage temperature difference (ΔT) than the recompression cycle. Additionally, it achieves its maximum ΔT and w of 289.3 °C and 171.6 kW·kg−1, respectively, at a pmax of 30 MPa. Meanwhile, the recompression cycle is able to generate a higher thermal efficiency (ηth).
3.1.2. Influences of the Minimum Cycle Pressure
The impacts of the minimum cycle pressure (pmin) on the specific work (w), the thermal efficiency (ηth), and the heat storage temperature difference (ΔT) performed by each of the two SCO2 cycles are displayed in Figure 5, where pmin = 7.4~10 MPa.
Figure 5.
Influences of the minimum cycle pressure (pmin).
Firstly, the rise in pmin results in increases in the specific work (w) for both cycles at the initial stage. When pmin reaches the pseudo-critical pressure of 8.2 MPa [53,54], the two cycles reach their maximum w values. For the recompression cycle, its maximum w is 146.3 kW·kg−1, and the corresponding value is 159.9 kW·kg−1 for the regenerative cycle. Moreover, when pmin exceeds 8.2 MPa, the w values of both cycles decrease monotonically.
Secondly, Figure 5 indicates that the two cycles’ ΔT values marginally improve as pmin rises from 7.4 MPa to 8.2 MPa and that these values attain their maxima (of 213.4 °C for the recompression cycle and 283.4 °C for the regenerative cycle) at 8.2 MPa. When pmin exceeds 8.2 MPa, the ΔT values of both cycles begin to monotonously decline. In general, an increase in pmin leads to a rise in the turbine outlet temperature (T2 in Figure 1 and Figure 2) and an increase in the SCO2 temperature at the outlet of the regenerator (T6 in Figure 1 and T10 in Figure 2), resulting in a monotonic decrease in ΔT. However, when pmin is below 8.2 MPa, the high-pressure SCO2 temperature at the regenerator’s outlet decreases slightly with the rising pmin. Hence, it is not surprising that the ΔT values of both cycles increase slightly within this pmin range.
Lastly, as illustrated in Figure 5, an increase in pmin initially results in an improvement in the ηth of the recompression cycle. Subsequently, the ηth remains almost constant at its maximum value of 55.1% within the pmin range of 8 MPa to 9 MPa. When pmin exceeds 9 MPa, the ηth starts to decrease. In contrast, the ηth of the regenerative cycle first declines to its minimum value of 44.69% at the pmin of 9.2 MPa and then starts to rise slightly.
3.1.3. Influences of the Regenerator Effectiveness
The impacts of the effectiveness of the regenerators on the thermal efficiency (ηth), the specific work (w), and the heat storage temperature difference (ΔT) performed by the two SCO2 cycles are displayed in Figure 6. To simplify the analysis, the effectiveness of the LTR and HTR in the recompression cycle (εLTR, εHTR) are always equal to the regenerator effectiveness (εR), and εR is in the range of 0.75~0.95.
Figure 6.
Influences of the regenerator effectiveness (εR).
Firstly, there is no doubt that the w of the regenerative cycle is not changed by an increasing εR. This is because changing εR will not affect the work output by the turbine and the work consumed by the compressor. However, the SCO2 temperature at the re-compressor inlet (T4b in Figure 2) is decreased with an increasing εR, resulting in a decrease in the re-compressor’s work consumption. Therefore, for the recompression cycle, its w increases slightly with an increasing εR.
Secondly, as depicted in Figure 6, the heat storage temperature differences (ΔT) of both cycles narrow with an increasing εR. This is because an increase in εR raises the high-pressure SCO2 temperature at the regenerator outlet (T6 in Figure 1 and t10 in Figure 2), resulting in an increase in the temperature of the heat transfer fluid at the heater outlet (TB). Moreover, the regenerative cycle exhibits a maximum ΔT of 352.3 °C when the εR value is 0.75.
Finally, the analysis reveals that the net work (Wnet) values of both cycles remain almost unchanged while the amount of heat transferred to the SCO2 from the heater (Q) gradually decreases. Consequently, the thermal efficiencies (ηth) of both cycles monotonously increase. Additionally, compared to the regenerative cycle, the recompression cycle demonstrates a higher ηth, with a maximum ηth of 52.42% achieved at an εR of 0.95.
3.1.4. Influences of the SCO2 Split Ratio
The impacts of the split ratio (SR) of the SCO2 on the heat storage temperature difference (ΔT), the thermal efficiency (ηth), and the specific work (w) of the SCO2 recompression cycle are illustrated in Figure 7, where SR ranges from 0.3 to 1.0.
Figure 7.
Influences of the SCO2 split ratio (SR).
As demonstrated in Figure 7, an increase in SR yields improvements in both w and ΔT in the recompression cycle. This is due to the reduction in SCO2 compressed by the re-compressor with an increasing SR, allowing the main compressor to compress more SCO2 at a lower temperature. As a result, the compression work consumed by the recompression cycle is decreased, thereby increasing its net work (Wnet) and w. Furthermore, a greater amount of SCO2 flows back to the LTR with an increasing SR, decreasing the outlet temperatures of LTR and HTR (T7 and T10), ultimately reducing TB. Simultaneously, an increase in SR first leads to an increase in ηth, which reaches its maximum value of 53.82% at SR = 0.75, and is then followed by a gradual decrease.
Based on the results presented in Figure 4, Figure 5 and Figure 6, it is evident that the regenerative cycle outperforms the recompression cycle in terms of specific work (w). This is due to the fact that the expansion processes of the two SCO2 cycles produce comparable power (WT). In the simple regenerative cycle, all SCO2 enters the main compressor and is compressed at the lowest temperature. In contrast, a portion of SCO2 in the recompression cycle (state 4b in Figure 2) is compressed at a higher temperature by the re-compressor (RC), requiring additional compression work. Consequently, the recompression cycle consumes more compression work, resulting in lower Wnet and w. Nonetheless, the recompression cycle improves the temperature of high-pressure SCO2 at the outlet of each regenerator by splitting SCO2, thereby achieving lower ΔT and Q. Although the Q and the Wnet of the recompression cycle are lower than those of the regenerative cycle, the effect of Q reduction is greater, resulting in higher ηth than in the regenerative cycle.
3.2. Results of the Triple-Objective Optimization
The preceding analysis of variables demonstrates the intricate effects of the operating pressures (pmax, pmin) of the SCO2 Brayton cycle, the SCO2 split ratio (SR), and the effectiveness of all regenerators (εR, εHTR, εLTR) on the specific work (w), the heat storage temperature difference (ΔT), and the thermal efficiency (ηth) of each of the two SCO2 cycles. On one hand, when any of these variables change, the resulting trends in the three performance indicators vary. On the other hand, the trends of individual performance indicators are not always monotonic. In other words, a specific combination of these variables cannot maximize all performance indicators simultaneously. To reach a compromise among the different performance indicators, a triple-objective optimization approach is employed.
3.2.1. Pareto Solutions for the Two SCO2 Brayton Cycles
Triple-objective optimization is performed for the two SCO2 cycles in accordance with the optimization approach described in Section 2.3. The essential operational variables are outlined in Table 1, while the variables subject to optimization are provided in Table 4. During the optimization of each cycle, each cycle underwent three optimization runs, resulting in three Pareto solutions. The Pareto solution that demonstrated the highest overall performance was chosen to represent the optimization outcomes for each cycle. Figure 8 illustrates the final Pareto solutions for the two cycles in a spatial coordinate system consisting of “ηth, ΔT and w”. To facilitate a comparison between the two cycles, their Pareto solutions were plotted on separate plane coordinate systems, which have been presented in Figure 9 and Figure 10.
Figure 8.
Pareto solutions of the regenerative cycle and the recompression cycle.
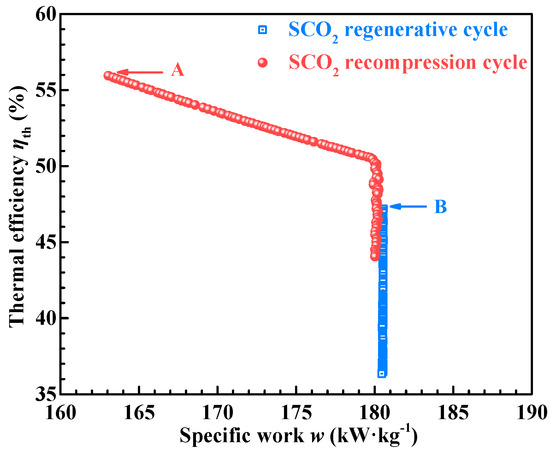
Figure 9.
Pareto solutions in the “w and ηth” system.
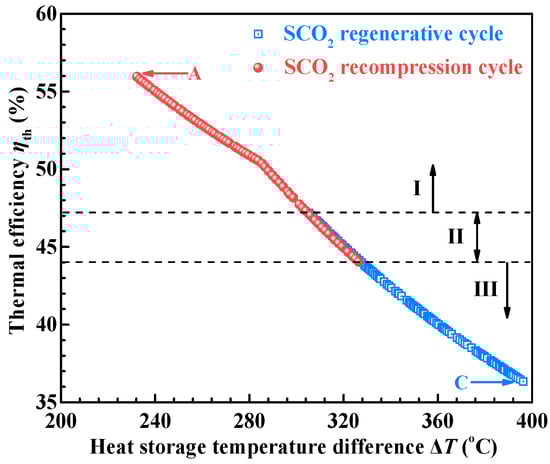
Figure 10.
Pareto solutions in the “ΔT and ηth” system.
Figure 9 depicts the mapping of all points in Figure 8 onto the “w and ηth” coordinate system. The results reveal that the recompression cycle cannot improve both w and ηth simultaneously. Specifically, a decrease in ηth cannot always lead to a larger w, and when w is lower than 180 kW·kg−1, an improvement in w will result in a deterioration in ηth. At point A, the recompression cycle achieves its maximum ηth of 55.95%, which is 8.76% higher than the maximum ηth of the regenerative cycle. Additionally, for the regenerative cycle, an increase in ηth does not affect its w within the range of the entire optimization results, and its w values are consistently higher than those of the recompression cycle. At point B, the two optimization objectives of the regenerative cycle are maximized simultaneously (ηth = 47.19%, w = 180.6 kW·kg−1).
Figure 10 illustrates the mapping of all points in Figure 8 onto the “ΔT and ηth” coordinate system. The results reveal that the ηth values of the two cycles exhibit a conflicting relationship with their ΔT values and that both objectives cannot be maximized concurrently. Specifically, the optimized recompression cycle achieves higher ηth, while the regenerative cycle obtains higher ΔT. By dividing Figure 10 into three areas, a detailed analysis of the results can be conducted. In area I, only the recompression cycle can achieve an ηth higher than 47.19% and a ΔT narrower than 305.4 °C, it and achieves the maximum ηth value of 55.95% and the minimum ΔT value of 232.2 °C at point A. In area II, where ηth is between 43.92% and 47.19%, the optimized ΔT values for both cycles are between 305.4 °C and 327.3 °C, and the two cycles exhibit similar optimization performance. In area III, only the regenerative cycle can provide a ΔT wider than 327.3 °C and an ηth lower than 43.92% and reach the maximum ΔT value of 396.4 °C and the minimum ηth value of 36.34% at point C.
3.2.2. Optimizing the Relations between Variables and Objectives
To further analyze the relationships between the optimized variables and the three optimization objectives (ηth, w, and ΔT) of each cycle, Figure 11, Figure 12, Figure 13 and Figure 14 display the distributions of the six optimized variables relating to the Pareto solution of each cycle.
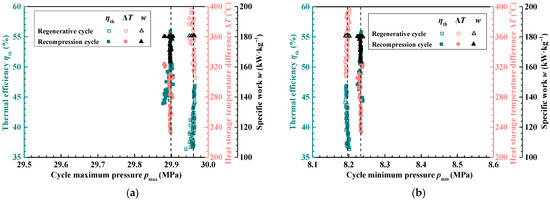
Figure 11.
The distributions of the optimized pressures corresponding to the Pareto solutions of the two cycles. (a) Maximum pressure (pmax); (b) Minimum pressure (pmin).
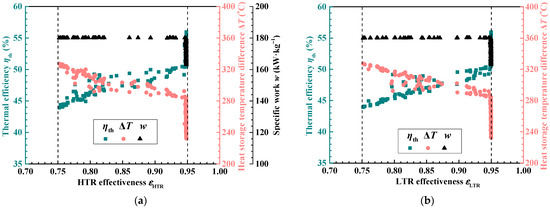
Figure 12.
The distributions of the optimized regenerator effectiveness values of the recompression cycle. (a) HTR effectiveness (εHTR); (b) LTR effectiveness (εLTR).
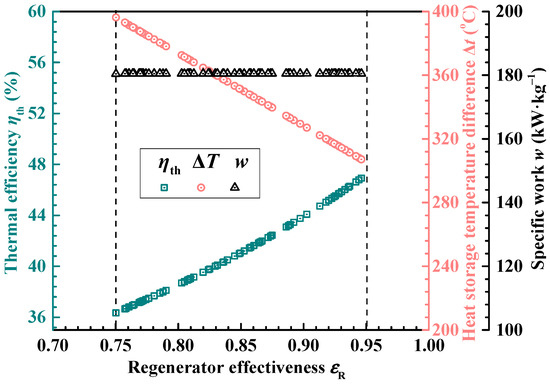
Figure 13.
The distribution of the optimized regenerator effectiveness (εR) of the regenerative cycle.
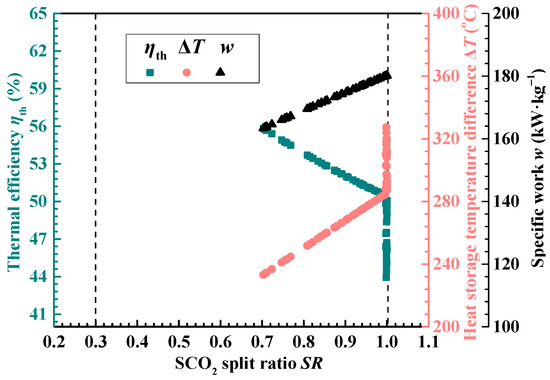
Figure 14.
The distribution of the optimized SCO2 split ratio (SR) of the recompression cycle.
Figure 11 shows the distributions of the optimized cycle pressures (pmax and pmin) corresponding to the Pareto solutions. It is obvious from Figure 11a,b that the optimized pmax values of the regenerative cycle and the recompression cycle are fixed at around 29.96 MPa and 29.9 MPa, respectively, while their optimized pmin values are fixed at 8.20 MPa and 8.23 MPa, respectively. Therefore, the pmax and the pmin of each cycle should be close to these fixed values regardless of any requirements for the cycle’s performance.
Figure 12 shows the distributions of the optimized regenerator effectiveness (εHTR and εLTR) corresponding to the recompression cycle’s Pareto solution. Figure 12a,b show that the influence of the varying optimized εHTR on each optimization objective is similar to that of the varying optimized εLTR, and their distributions both cover the entire optimization range.
Firstly, when the optimized εHTR and εLTR are lower than the upper bounds of their optimization ranges (0.95), the w of the recompression cycle remains at its maximum value of about 180 kW·kg−1, and the ηth generally increases with the optimized εHTR and εLTR while the ΔT has an opposite variation. Secondly, when the optimized εHTR and εLTR almost reach their upper bounds of 0.95, the three optimization objectives also change within a certain range. In this case, the ηth can be increased from 50.55% to its maximum value of 55.95%, and the ΔT and the w can be decreased from 284.4 °C and 180 kW·kg−1 to their minimum values of 232.2 °C and 163.1 kW·kg−1, respectively. Therefore, under the optimized operating condition, the εHTR and the εLTR of the recompression cycle should reach their upper bounds of 0.95 when the ηth is required to be as high as possible, which may also lead to the reduction of the w. On the contrary, the εHTR and εLTR should reach their lower bounds of 0.75 when the ΔT is required to be as high as possible.
Figure 13 displays the distribution of the optimized regenerator effectiveness (εR) corresponding to the regenerative cycle’s Pareto solution. Figure 13 demonstrates that the range of optimized εR and its influences on the three optimization objectives align with those observed for εHTR and εLTR in Figure 12. The notable distinction lies in the fact that the three optimization objectives remain unchanged when the optimized ɛR approaches its upper bound of 0.95.
Figure 14 depicts the distribution of the optimized SCO2 split ratio (SR) corresponding to the recompression cycle’s Pareto solution. Figure 14 clearly demonstrates that the distribution of the optimized SR is concentrated in the range of 0.7–1.0, and the variation of the optimized SR within this range has a significant impact on the three optimization objectives. Firstly, when the optimized SR is lower than the upper bound of its optimization range, the ηth generally decreases with the increase of the optimized SR while the ΔT and the w have opposite variations. Secondly, when the optimized SR almost reaches its upper bound of 1.0, the w reaches its maximum value of 180 kW·kg−1 and remains unchanged. Meanwhile, the ηth could be further decreased from 50.07% to its minimum value of 43.92%, and the ΔT could be further increased from 287.3 °C to its maximum value of 327.3 °C. It can be found that when SR reaches 1.0, the recompression cycle can produce almost the same maximum w as the regenerative cycle.
4. Conclusions
In this work, an optimization model combining a steady-state thermodynamic model and a multi-objective genetic algorithm has been developed for SCO2 Brayton cycles. Compared with existing models, the present optimization model not only can predict the cycle performance reliably but also can optimize the cycle by considering three critical performance indexes, including the thermal efficiency, the specific work, and the heat storage temperature difference, as the objectives. Based on this model, the SCO2 regenerative cycle and the SCO2 recompression cycle for a next-generation SPT system have been studied and optimized, and the following conclusions can be obtained.
- (1)
- Variable analysis reveals that the minimum and maximum cycle pressures, the SCO2 split ratio, and the effectiveness of the regenerators have complex influences on the three performance indexes—thermal efficiency (ηth), specific work (w), and heat storage temperature difference (ΔT). The variation trends of the three performance indexes are different and not always monotonous. A set of certain values of the above variables cannot make the three performance indexes reach their maximum values at the same time.
- (2)
- By comparing the two Pareto solutions obtained by the triple-objective optimization, the variation relationships among the three performance indexes are obtained. It is found that the ηth of the recompression cycle exhibits a conflicting relationship with its ΔT and w. Meanwhile, there is also a conflicting relationship between ηth and ΔT in the regenerative cycle, while the changes between ηth and w do not affect each other. For the three performance indexes, the recompression cycle can produce a higher optimal ηth, while the regenerative cycle can produce a wider optimal ΔT and larger optimal w. Meanwhile, the recompression cycle could obtain the highest ηth of 55.95%, while the widest ΔT and the largest w of 396.4 °C and 180.6 kW·kg−1 can be obtained by the regenerative cycle, respectively.
- (3)
- When analyzing the distributions of the six optimized variables, it is found that the minimum and maximum cycle pressures in the two cycles have their fixed optimized values. Meanwhile, the solution of the regenerator effectiveness covers the entire optimization range, and the solution of the optimized SCO2 split ratio is concentrated in the range of 0.7–1.0. Moreover, the largest optimal w generated by the two cycles is almost the same when the optimized SCO2 split ratio is close to 1.0.
- (4)
- In realistic applications, different SCO2 cycles and corresponding optimized variables could be considered when running the SCO2 cycles with different specific performance demands. If the ηth is required to be as high as possible, the recompression cycle should be adopted, and its regenerator effectiveness should be increased, while the split ratio should be reduced. If the requirement for the ΔT or the w need to be considered as the key index, the regenerative cycle should be applied, and the optimized regenerator effectiveness should be reduced.
The developed model only can investigate the performance of SCO2 cycles under steady state. Future work can focus on establishing a dynamic model that considers the whole SPT system including the heliostat field, the solar receiver, the thermal storage, and the SCO2 cycle.
Author Contributions
Y.Q.: Conceptualization, Methodology, Investigation, Writing—original draft, Writing—review & editing. E.E.: Investigation, Validation, Formal analysis, Visualization, Writing—original draft. Q.L.: Conceptualization, Investigation, Validation, Formal analysis, Writing—original draft, Writing—review & editing. All authors have read and agreed to the published version of the manuscript.
Funding
The research team acknowledges the funding and support from the National Natural Science Foundation of China (52006247, 52176093), the Central South University Innovation-Driven Research Programme (2023CXQD055), and the Hunan Provincial Natural Science Foundation (2021JJ40753). We are grateful for resources from the High Performance Computing Center of Central South University.
Data Availability Statement
The data presented in this study are available on request from the corresponding author.
Conflicts of Interest
The authors declare no conflict of interest.
Notations
| HTR | high temperature regenerator | SR | split ratio of SCO2 |
| HTF | heat transfer fluid | s | specific entropy/kJ·kg−1 °C−1 |
| IC | intercooler | Tmin | temperature at the main compressor inlet/°C |
| LTR | low temperature regenerator | TA | HTF temperature in the hot tank or at the heater inlet/°C |
| MC | main compressor | TB | HTF temperature in the cold tank or at the heater outlet/°C |
| RC | re-compressor | T0 | ambient temperature/°C |
| SPT | solar power tower | T1 | maximum temperature in the cycle/°C |
| SCO2 | supercritical carbon dioxide | w | SCO2 specific work/kW·kg−1 |
| A | point with the maximum cycle thermal efficiency | WMC | power consumption of the main compressor/kW |
| B | point with the largest SCO2 specific work | WRC | power consumption of the re-compressor/kW |
| C | point with the widest heat storage temperature difference | Wnet | net work of the cycle/kW |
| h | specific enthalpy/kJ·kg−1 | WT | power generated in the turbine/kW |
| i | sequence number | Xi | chromosome of the ith individual |
| mSCO2 | mass flow rate of SCO2/kg·s−1 | ΔT | heat storage temperature difference/ °C |
| pmax | maximum cycle pressure/MPa | ηth | thermal efficiency of the cycle/% |
| pmin | minimum cycle pressure/MPa | ηMC, ηRC | isentropic efficiency of the compressor/% |
| p0 | ambient pressure/MPa | ηT | isentropic efficiency of the turbine/% |
| Q | heat obtained from the heater/kW | effectiveness of the regenerator |
References
- Iyer, G.; Ou, Y.; Edmonds, J.; Fawcett, A.A.; Hultman, N.; McFarland, J.; Fuhrman, J.; Waldhoff, S.; McJeon, H. Ratcheting of climate pledges needed to limit peak global warming. Nat. Clim. Chang. 2022, 12, 1129–1135. [Google Scholar] [CrossRef]
- Xiao, Y.; Bao, Y.; Yu, L.; Zheng, X.; Qin, G.; Chen, M.; He, M. Ultra-stable carbon quantum dot nanofluids as excellent spectral beam splitters in PV/T applications. Energy 2023, 273, 127159. [Google Scholar] [CrossRef]
- Zhang, P.; Qiu, Y.; Ye, C.; Li, Q. Anisotropically conductive phase change composites enabled by aligned continuous carbon fibers for full-spectrum solar thermal energy harvesting. Chem. Eng. J. 2023, 461, 141940. [Google Scholar] [CrossRef]
- PraveenKumar, S.; Agyekum, E.B.; Kumar, A.; Velkin, V.I. Performance evaluation with low-cost aluminum reflectors and phase change material integrated to solar PV modules using natural air convection: An experimental investigation. Energy 2023, 266, 126415. [Google Scholar] [CrossRef]
- Shi, X.; Zhao, X.; Wang, F.; Cheng, Z.; Dong, Y.; Xu, J. Improving overall heat transfer performance of parabolic trough solar receiver by helically convex absorber tube. Appl. Therm. Eng. 2022, 213, 118690. [Google Scholar] [CrossRef]
- Praveenkumar, S.; Agyekum, E.B.; Kumar, A.; Ampah, J.D.; Afrane, S.; Amjad, F.; Velkin, V.I. Techno-economics and the identification of environmental barriers to the development of concentrated solar thermal power plants in India. Appl. Sci. 2022, 12, 10400. [Google Scholar] [CrossRef]
- Zhang, Y.; Qiu, Y.; Li, Q.; Henry, A. Optical-thermal-mechanical characteristics of an ultra-high-temperature graphite receiver designed for concentrating solar power. Appl. Energy 2022, 307, 118228. [Google Scholar] [CrossRef]
- Ye, K.; Li, Q.; Zhang, Y.; Qiu, Y.; Liu, B. An efficient receiver tube enhanced by a solar transparent aerogel for solar power tower. Energy 2022, 261, 125313. [Google Scholar] [CrossRef]
- Lanchi, M.; Al-Zaili, J.; Russo, V.; Falchetta, M.; Montecchi, M.; Aichmayer, L. A Quasi-Steady State Model of a Solar Parabolic Dish Micro Gas Turbine Demonstration Plant. Energies 2022, 15, 1059. [Google Scholar] [CrossRef]
- Wang, J.; Qiu, Y.; Li, Q.; Xu, M.; Wei, X. Design and experimental study of a 30 kWe adjustable solar simulator delivering high and uniform flux. Appl. Therm. Eng. 2021, 195, 117215. [Google Scholar] [CrossRef]
- Montenon, A.C.; Meligy, R. Control Strategies Applied to a Heat Transfer Loop of a Linear Fresnel Collector. Energies 2022, 15, 3338. [Google Scholar] [CrossRef]
- Qiu, Y.; He, Y.; Wu, M.; Zheng, Z. A comprehensive model for optical and thermal characterization of a linear Fresnel solar reflector with a trapezoidal cavity receiver. Renew. Energy 2016, 97, 129–144. [Google Scholar] [CrossRef]
- Li, Q.; Zhang, Y.; Wen, Z.; Qiu, Y. An evacuated receiver partially insulated by a solar transparent aerogel for parabolic trough collector. Energy Convers. Manag. 2020, 214, 112911. [Google Scholar] [CrossRef]
- Qiu, Y.; Zhang, Y.; Li, Q.; Xu, Y.; Wen, Z. A novel parabolic trough receiver enhanced by integrating a transparent aerogel and wing-like mirrors. Appl. Energy 2020, 279, 115810. [Google Scholar] [CrossRef]
- Qiu, Y.; Xu, M.; Li, Q.; Xu, Y.; Wang, J. A novel evacuated receiver improved by a spectral-selective glass cover and rabbit-ear mirrors for parabolic trough collector. Energy Convers. Manag. 2021, 227, 113589. [Google Scholar] [CrossRef]
- Yang, J.; Yang, Z.; Duan, Y. A review on integrated design and off-design operation of solar power tower system with S–CO2 Brayton cycle. Energy 2022, 246, 123348. [Google Scholar] [CrossRef]
- Wang, J.; Zhang, Y.; Zhang, W.; Qiu, Y.; Li, Q. Design and evaluation of a lab-scale tungsten receiver for ultra-high-temperature solar energy harvesting. Appl. Energy 2022, 327, 120135. [Google Scholar] [CrossRef]
- He, Y.L.; Qiu, Y.; Wang, K.; Yuan, F.; Wang, W.Q.; Li, M.J.; Guo, J.Q. Perspective of concentrating solar power. Energy 2020, 198, 117373. [Google Scholar] [CrossRef]
- Li, Q.; Erqi, E.; Qiu, Y. Triple-objective optimization of He Brayton cycles for ultra-high-temperature solar power tower. Energy Convers. Manag. 2022, 270, 116210. [Google Scholar] [CrossRef]
- Khatoon, S.; Kim, M.-H. Preliminary design and assessment of concentrated solar power plant using supercritical carbon dioxide Brayton cycles. Energy Convers. Manag. 2022, 252, 115066. [Google Scholar] [CrossRef]
- Yin, J.M.; Zheng, Q.Y.; Peng, Z.R.; Zhang, X.R. Review of supercritical CO2 power cycles integrated with CSP. Int. J. Energy Res. 2020, 44, 1337–1369. [Google Scholar] [CrossRef]
- Xu, J.; Liu, C.; Sun, E.; Xie, J.; Li, M.; Yang, Y.; Liu, J. Perspective of S−CO2 power cycles. Energy 2019, 186, 115831. [Google Scholar] [CrossRef]
- Yang, H.; Li, J.; Wang, Q.; Wu, L.; Rodríguez-Sanchez, M.R.; Santana, D.; Pei, G. Performance investigation of solar tower system using cascade supercritical carbon dioxide Brayton-steam Rankine cycle. Energy Convers. Manag. 2020, 225, 113430. [Google Scholar] [CrossRef]
- Chen, Z.; Wang, Y.; Zhang, X.; Xu, J. The energy-saving mechanism of coal-fired power plant with S–CO2 cycle compared to steam-Rankine cycle. Energy 2020, 195, 116965. [Google Scholar] [CrossRef]
- Liu, Y.; Wang, Y.; Huang, D. Supercritical CO2 Brayton cycle: A state-of-the-art review. Energy 2019, 189, 115900. [Google Scholar] [CrossRef]
- Wang, K.; Li, M.-J.; Zhang, Z.-D.; Min, C.-H.; Li, P. Evaluation of alternative eutectic salt as heat transfer fluid for solar power tower coupling a supercritical CO2 Brayton cycle from the viewpoint of system-level analysis. J. Clean. Prod. 2021, 279, 123472. [Google Scholar] [CrossRef]
- Li, Q.; Erqi, E.; Qiu, Y.; Wang, J.; Zhang, Y. Conceptual design of novel He-SCO2 Brayton cycles for ultra-high-temperature concentrating solar power. Energy Convers. Manag. 2022, 260, 115618. [Google Scholar] [CrossRef]
- Wang, K.; Li, M.J.; Guo, J.Q.; Li, P.W.; Liu, Z.B. A systematic comparison of different S-CO2 Brayton cycle layouts based on multi-objective optimization for applications in solar power tower plants. Appl. Energy 2018, 212, 109–121. [Google Scholar] [CrossRef]
- Ehsan, M.M.; Guan, Z.; Gurgenci, H.; Klimenko, A. Feasibility of dry cooling in supercritical CO2 power cycle in concentrated solar power application: Review and a case study. Renew. Sustain. Energy Rev. 2020, 132, 110055. [Google Scholar] [CrossRef]
- Maher, S.D.; Sarvghad, M.; Olivares, R.; Ong, T.-C.; Will, G.; Steinberg, T.A. Critical components in supercritical CO2 Brayton cycle power blocks for solar power systems: Degradation mechanisms and failure consequences. Sol. Energy Mater. Sol. Cells 2022, 242, 111768. [Google Scholar] [CrossRef]
- Guo, J.Q.; Li, M.J.; He, Y.L.; Jiang, T.; Ma, T.; Xu, J.L.; Cao, F. A systematic review of supercritical carbon dioxide (S-CO2) power cycle for energy industries: Technologies, key issues, and potential prospects. Energy Convers. Manag. 2022, 258, 115437. [Google Scholar] [CrossRef]
- Guo, J.Q.; Li, M.J.; He, Y.L.; Xu, J.L. A study of new method and comprehensive evaluation on the improved performance of solar power tower plant with the CO2-based mixture cycles. Appl. Energy 2019, 256, 113837. [Google Scholar] [CrossRef]
- Al-Sulaiman, F.A.; Atif, M. Performance comparison of different supercritical carbon dioxide Brayton cycles integrated with a solar power tower. Energy 2015, 82, 61–71. [Google Scholar] [CrossRef]
- Chen, R.; Romero, M.; González-Aguilar, J.; Rovense, F.; Rao, Z.; Liao, S. Design and off-design performance comparison of supercritical carbon dioxide Brayton cycles for particle-based high temperature concentrating solar power plants. Energy Convers. Manag. 2021, 232, 113870. [Google Scholar] [CrossRef]
- Wang, K.; He, Y.L. Thermodynamic analysis and optimization of a molten salt solar power tower integrated with a recompression supercritical CO2 Brayton cycle based on integrated modeling. Energy Convers. Manag. 2017, 135, 336–350. [Google Scholar] [CrossRef]
- Xu, X.K.; Dehghani, G.; Ning, J.X.; Li, P.W. Basic properties of eutectic chloride salts NaCl-KCl-ZnCl2 and NaCl-KCl-MgCl2 as HTFs and thermal storage media measured using simultaneous DSC-TGA. Sol. Energy 2018, 162, 431–441. [Google Scholar] [CrossRef]
- Huber, M.L.; Lemmon, E.W.; Bell, I.H.; McLinden, M.O. The NIST REFPROP database for highly accurate properties of industrially important fluids. Ind. Eng. Chem. Res. 2022, 61, 15449–15472. [Google Scholar] [CrossRef]
- Wang, X.; Li, X.; Li, Q.; Liu, L.; Liu, C. Performance of a solar thermal power plant with direct air-cooled supercritical carbon dioxide Brayton cycle under off-design conditions. Appl. Energy 2020, 261, 114359. [Google Scholar] [CrossRef]
- Habibi, H.; Zoghi, M.; Chitsaz, A.; Javaherdeh, K.; Ayazpour, M.; Bellos, E. Working fluid selection for regenerative supercritical Brayton cycle combined with bottoming ORC driven by molten salt solar power tower using energy–exergy analysis. Sustain. Energy Technol. Assess. 2020, 39, 100699. [Google Scholar] [CrossRef]
- Zhou, T.; Liu, Z.; Li, X.; Zhao, M.; Zhao, Y. Thermodynamic design space data-mining and multi-objective optimization of SCO2 Brayton cycles. Energy Convers. Manag. 2021, 249, 114844. [Google Scholar] [CrossRef]
- Chen, Y.; Wang, M.; Liso, V.; Samsatli, S.; Samsatli, N.J.; Jing, R.; Chen, J.; Li, N.; Zhao, Y. Parametric analysis and optimization for exergoeconomic performance of a combined system based on solid oxide fuel cell-gas turbine and supercritical carbon dioxide Brayton cycle. Energy Convers. Manag. 2019, 186, 66–81. [Google Scholar] [CrossRef]
- Khanmohammadi, S.; Kizilkan, O.; Ahmed, F.W. Tri-objective optimization of a hybrid solar-assisted power-refrigeration system working with supercritical carbon dioxide. Renew. Energy 2020, 156, 1348–1360. [Google Scholar] [CrossRef]
- Benoit, H.; López, I.P.; Gauthier, D.; Sans, J.-L.; Flamant, G. On-sun demonstration of a 750 C heat transfer fluid for concentrating solar systems: Dense particle suspension in tube. Sol. Energy 2015, 118, 622–633. [Google Scholar] [CrossRef]
- Ho, C.K. A review of high-temperature particle receivers for concentrating solar power. Appl. Therm. Eng. 2016, 109, 958–969. [Google Scholar] [CrossRef]
- Zhao, G.; Yang, X.Y.; Ye, P.; Wang, J.; Peng, W. Comparative Study of Helium Turbine Brayton Cycle and Supercritical CO2 Brayton Cycle for HTGR. In Proceedings of the International Conference on Nuclear Engineering, London, UK, 22–26 July 2018; p. V001T013A011. [Google Scholar]
- Garg, P.; Kumar, P.; Srinivasan, K. Supercritical carbon dioxide Brayton cycle for concentrated solar power. J. Supercrit. Fluids 2013, 76, 54–60. [Google Scholar] [CrossRef]
- Turchi, C.S.; Ma, Z.; Neises, T.W.; Wagner, M.J. Thermodynamic study of advanced supercritical carbon dioxide power cycles for concentrating solar power systems. J. Sol. Energy Eng. 2013, 135, 041007. [Google Scholar] [CrossRef]
- Neises, T.; Turchi, C. A comparison of supercritical carbon dioxide power cycle configurations with an emphasis on CSP applications. Energy Procedia 2014, 49, 1187–1196. [Google Scholar] [CrossRef]
- Crespi, F.; Sánchez, D.; Rodríguez, J.M.; Gavagnin, G. A thermo-economic methodology to select sCO2 power cycles for CSP applications. Renew. Energy 2020, 147, 2905–2912. [Google Scholar] [CrossRef]
- Deb, K.; Pratap, A.; Agarwal, S.; Meyarivan, T. A fast and elitist multiobjective genetic algorithm: NSGA-II. IEEE T Evol. Comput. 2002, 6, 182–197. [Google Scholar] [CrossRef]
- Entezari, A.; Bahari, M.; Aslani, A.; Ghahremani, S.; Pourfayaz, F. Systematic analysis and multi-objective optimization of integrated power generation cycle for a thermal power plant using Genetic algorithm. Energy Convers. Manag. 2021, 241, 114309. [Google Scholar] [CrossRef]
- Qiu, Y.; Li, M.-J.; Wang, K.; Liu, Z.-B.; Xue, X.-D. Aiming strategy optimization for uniform flux distribution in the receiver of a linear Fresnel solar reflector using a multi-objective genetic algorithm. Appl. Energy 2017, 205, 1394–1407. [Google Scholar] [CrossRef]
- Wang, K.; He, Y.L.; Zhu, H.H. Integration between supercritical CO2 Brayton cycles and molten salt solar power towers: A review and a comprehensive comparison of different cycle layouts. Appl. Energy 2017, 195, 819–836. [Google Scholar] [CrossRef]
- Liu, Z.Y.; Chen, L.; Chen, H. Characterization of dynamic fluctuations of CO2 fluid parameters at critical regions near the pseudo-critical line. Phys. Fluids 2022, 34, 062003. [Google Scholar] [CrossRef]


Disclaimer/Publisher’s Note: The statements, opinions and data contained in all publications are solely those of the individual author(s) and contributor(s) and not of MDPI and/or the editor(s). MDPI and/or the editor(s) disclaim responsibility for any injury to people or property resulting from any ideas, methods, instructions or products referred to in the content. |
© 2023 by the authors. Licensee MDPI, Basel, Switzerland. This article is an open access article distributed under the terms and conditions of the Creative Commons Attribution (CC BY) license (https://creativecommons.org/licenses/by/4.0/).