Article

A Spatially Explicit Evaluation of the Economic Performance of a Perennial Energy Crop on the Marginal Land of the Loess Plateau and China

1
Integrated Research on Energy, Environment and Soc—Energy and Sustainability Research Institute Groningen, University of Groningen, Nijenborgh 6, 9747 AG Groningen, The Netherlands
2
Institute of Biological and Environmental Science, University of Aberdeen, Aberdeen AB24 2TZ, UK
3
Biomass Energy Center for Arid and Semi-Arid Lands, Northwest A&F University, Xianyang 712100, China
4
Energy Transition Studies, Netherlands Organization for Applied Scientific Research (TNO), 1043 NT Amsterdam, The Netherlands
5
Copernicus Institute for Sustainable Development, Utrecht University, Princetonlaan 8a, 3584 CB Utrecht, The Netherlands
*
Author to whom correspondence should be addressed.
Energies 2023, 16(14), 5282; https://doi.org/10.3390/en16145282
Submission received: 12 May 2023 / Revised: 26 June 2023 / Accepted: 5 July 2023 / Published: 10 July 2023
(This article belongs to the Special Issue Biomass Resources and Bio-Energy Potential)

Abstract

:
The Loess Plateau, with a large area of marginal land, holds the potential to produce 62–106 Tg per year of switchgrass biomass; however, the economic feasibility of producing bioenergy in the region is unclear. The farm-gate feedstock production (FGFP) cost of switchgrass was calculated in a spatially explicit way by taking the geographic variation in crop yield, soil properties, land quality, and input costs into consideration in order to evaluate the economic performance of bioenergy production. Cost–supply curves were constructed to explore the energy supply potential of switchgrass feedstock. The calculations were conducted using ArcGIS in a 1 km grid and all the evaluations were conducted under different agricultural management practice (AMP) scenarios in parallel. The FGFP costs showed significant spatial variation ranging from 95 to 7373 CNY (Chinese Yuan) per tonne−1 and that the most economically desirable areas are scattered in the south and southeast region. The weighted average FGFP costs are 710, 1125, and 1596 CNY per tonne−1 for small bale (SB), large bale (LB), and chipping (CP) harvest methods, respectively. The projected energy supply potential is 1927 PJ (Petajoules) per year−1, of which 30–93% can be supplied below the market prices of different fossil fuels according to feedstock formats. Compared to current biomass residual pricing, 50–66 Tg (Teragrams) switchgrass feedstock is competitive. The results demonstrated that the Loess Plateau holds the potential to produce bioenergy that is economically feasible. This study provides a methodological framework for spatially explicit evaluation of the economic performance of perennial energy crops. Detailed information obtained from this study can be used to select the optimal locations and AMPs to produce feedstock production at minimum cost.

1. Introduction

China’s remarkable economic growth over the past four decades has expanded China’s energy demand, which has consequently made China the largest energy consumer and carbon emitter globally [1,2]. To strengthen domestic energy security, confront global climate change, and increase social and economic benefits, China has announced its intent to achieve peak carbon emission levels by 2030 and carbon neutral emissions by 2060 by transitioning to renewable energy [3]. Bioenergy is one of the most promising renewable energy sources to replace fossil fuels [4]. China’s newly released 14th Five-Year Plan (FYP) for 2021–2025 aims to reduce energy intensity by 13.5%, carbon intensity by 18%, and to reach a 20% share of non-fossil fuel in primary energy use by 2025 [5].
Bioenergy, which can sequester CO2 by photosynthesis during biomass growth stages—the utilization of which could result in neutral or even negative carbon emissions if coupled with carbon capture and storage (CCS)—is one of the most promising renewable energy sources in China. According to data from the National Energy Administration, by the end of 2020, the accumulatively installed capacity of biomass power generation reached 29.52 million kW, and biomass power generation reached 132.6 billion kW·h. Until November 2021, the installed biomass power generation capacity reached 35.34 million kW, ranking first in the world [6]. Biomass is expected to generate 158.3 billion kW·h in 2021 and more than 383.4 billion kW·h in 2026 (14th FYP). The subsidy budget for biomass electricity for 2022 is 38.24 million CNY (6 million USD) [7]. To fulfill the target of biomass electricity generation, a stable and sufficient biomass supply is required. Planting energy crops on marginal land has been demonstrated as a good solution with multiple advantages that not only relieve energy pressure, but improve the local environmental and provide extra income for local farmers without threatening food security [8,9,10].
The Loess plateau, which is located in the northwest of China, is one of the most erosion-prone regions in the world, and the economic situation in this region is backward [11]. Consequently, ecology restoration and poverty alleviation are two of its development goals [12]. It was estimated that there are approximately 13–21 Mha of marginal land in this region [13]. Switchgrass is a strong candidate as a dedicated energy crop for marginal land that can be used for biofuel production because of its high yield, wide environmental growing window, low fertilizer input requirement, and high water use efficiency [14,15]. It was estimated that the Loess plateau’s marginal land could yield between 62 and 106 Tg of biomass, which might serve as a significant quantity of biofuel, if it can be properly utilized for the planting of energy crops [13]. Despite projected results demonstrate that the region holds significant potential to produce a substantial amount of biomass yield [13] and that the planting of switchgrass might, at the same time, achieve the environmental improvement aim, not all the biomass feedstock produced from the marginal land is feasible because the poor condition of the marginal land might lead to high feedstock production costs. As a consequence, a spatially explicit economic evaluation is required to provide geographic information on where to feasibly plant switchgrass.
The economic viability of switchgrass production has been investigated by researchers for many years—mainly in the USA [16,17] and Europe [18,19,20,21]—at regional, national, and global scales [19,22,23,24]. The associated cost of producing switchgrass biomass was shown to vary widely among studies, mostly due to the diversity of biomass yield (location and time), methodology, research scales, cost components, input data sources, etc. [16,17,25,26]. Perrin et al. (2008) investigated the real commercial-scale economics of producing switchgrass feedstock as biomass by contracting 10 farmers from North Dakota to south Nebraska, US. The experimental results demonstrated that the production costs hinge on yields. The average FGFP cost of switchgrass is USD 65.86 Mg−1 of biomass dry matter with an annualized yield of 5.0 Mg ha−1 [25]. According to CenUSA, the FGFP cost is USD 65.86 Mg−1 of DM with an average yield of 3.5 tons (t) of DM, USD 110 per t at 2 t DM per acre, and USD 38 per t at 6 t per acre [26]. The total cost of switchgrass feedstock production is USD 83.85 per t in 2001 in southern lowa [27]. The production cost in Iowa in 2007 was USD 82.23 per t [28]. The annual production cost is CAD 66.67 and CAD 64.50 for Fredericton and Quebec City, respectively (the yield is 9.6 and 9.7 t ha−1, respectively). It is CAD 60.10, CAD 62.82, and CAD 60.08 for Saint-Hubert, Ottawa, and London, respectively (the yield is 10.8, 10.4, and 11.0 t ha−1, respectively) [29].
As China is in the early stages of the switchgrass investigation, relevant economic studies are scarce. Research on the switchgrass crop in China is relatively early-stage and switchgrass is usually planted at small scale. Most of the research on its cost calculation is based on ready-made data reported in the US and Europe [30,31], such as the machinery cost of agronomic procedures such as ploughing, harrowing, seeding, etc., in each unit area. Using ready-made data from other countries may not practically reflect the situation in China because the cost of labor, input materials (such as chemical fertilizer, pesticide, and seed), the machinery’s fuel, land rent, and incentive are regionally dependent and may vary from location to location, let alone among countries. The biophysical environment and socioeconomic circumstances have a significant impact on the feedstock output of an energy crop [32]. Key cost components like crop yield, input material costs, labor costs, fuel costs, land rent, incentives, etc., are typically spatially heterogeneous. As a result, rather than using aggregated data, economic analysis should be carried out in a spatially explicit way.
Different AMPs for cultivating and harvesting involve varying intensities of machinery operation, which results in various fuel consumption amounts and labor hours, which in turn impact production costs and the environment [33,34]. There are three common cultivation methods: conventional tillage (CT), reduced tillage (RT), and no tillage (NT), each of which has environmental benefits and drawbacks. CT has a positive effect on weed control; however, intensive plowing of CT has a risk of soil damage and soil erosion, for example, loss of soil organic matter (SOM), loss of nutrients, and death or disruption to microbe and macrofauna communities [35]. RT and NT could significantly improve surface soil quality regarding biological, chemical, and physical properties; however, they may result in a higher occurrence of crop diseases, pests, and weeds, as well as soil compaction [36]. The formats of biomass feedstock corresponding to various harvesting modes make a difference to the cost of biofuel supply chains, especially transportation cost, which depends on the distance between farmland, biorefinery factories or power plants, and final use [37,38]. The cost of the various AMPs must be known to balance the trade-offs between economic benefits and environmental repercussions to build sustainable switchgrass-based bioenergy production [39,40]. However, no research has been conducted to determine which methods of cultivation and harvesting are more economical on the Loess Plateau under the highly variable environmental conditions.
Therefore, the aim of this study is to assess the economic performance of switchgrass on the marginal land of the Loess Plateau to fill the gap in the literature. The evaluation was conducted in a spatially explicit way based on real investigation of input data from the studied region, providing realistic estimated results. Moreover, economic evaluation was undertaken under various AMP scenarios (cultivation methods and harvest methods) to evaluate their effects on feedstock production costs in order to select the most beneficial AMPs for a specific site. The results of this study will provide farmers, investigators, and policymakers information for making smart decisions to choose the most profitable locations and best AMPs to produce switchgrass biomass feedstock. Furthermore, the framework and results generated from this research can be further used to examine the environmental impacts of producing switchgrass feedstock on the Loess plateau, which can then be combined with the economic results generated in this study to make a comprehensive analysis that takes the trade-off between economic and environment impacts into account.

2. Methodology and Data

2.1. FGFP Cost

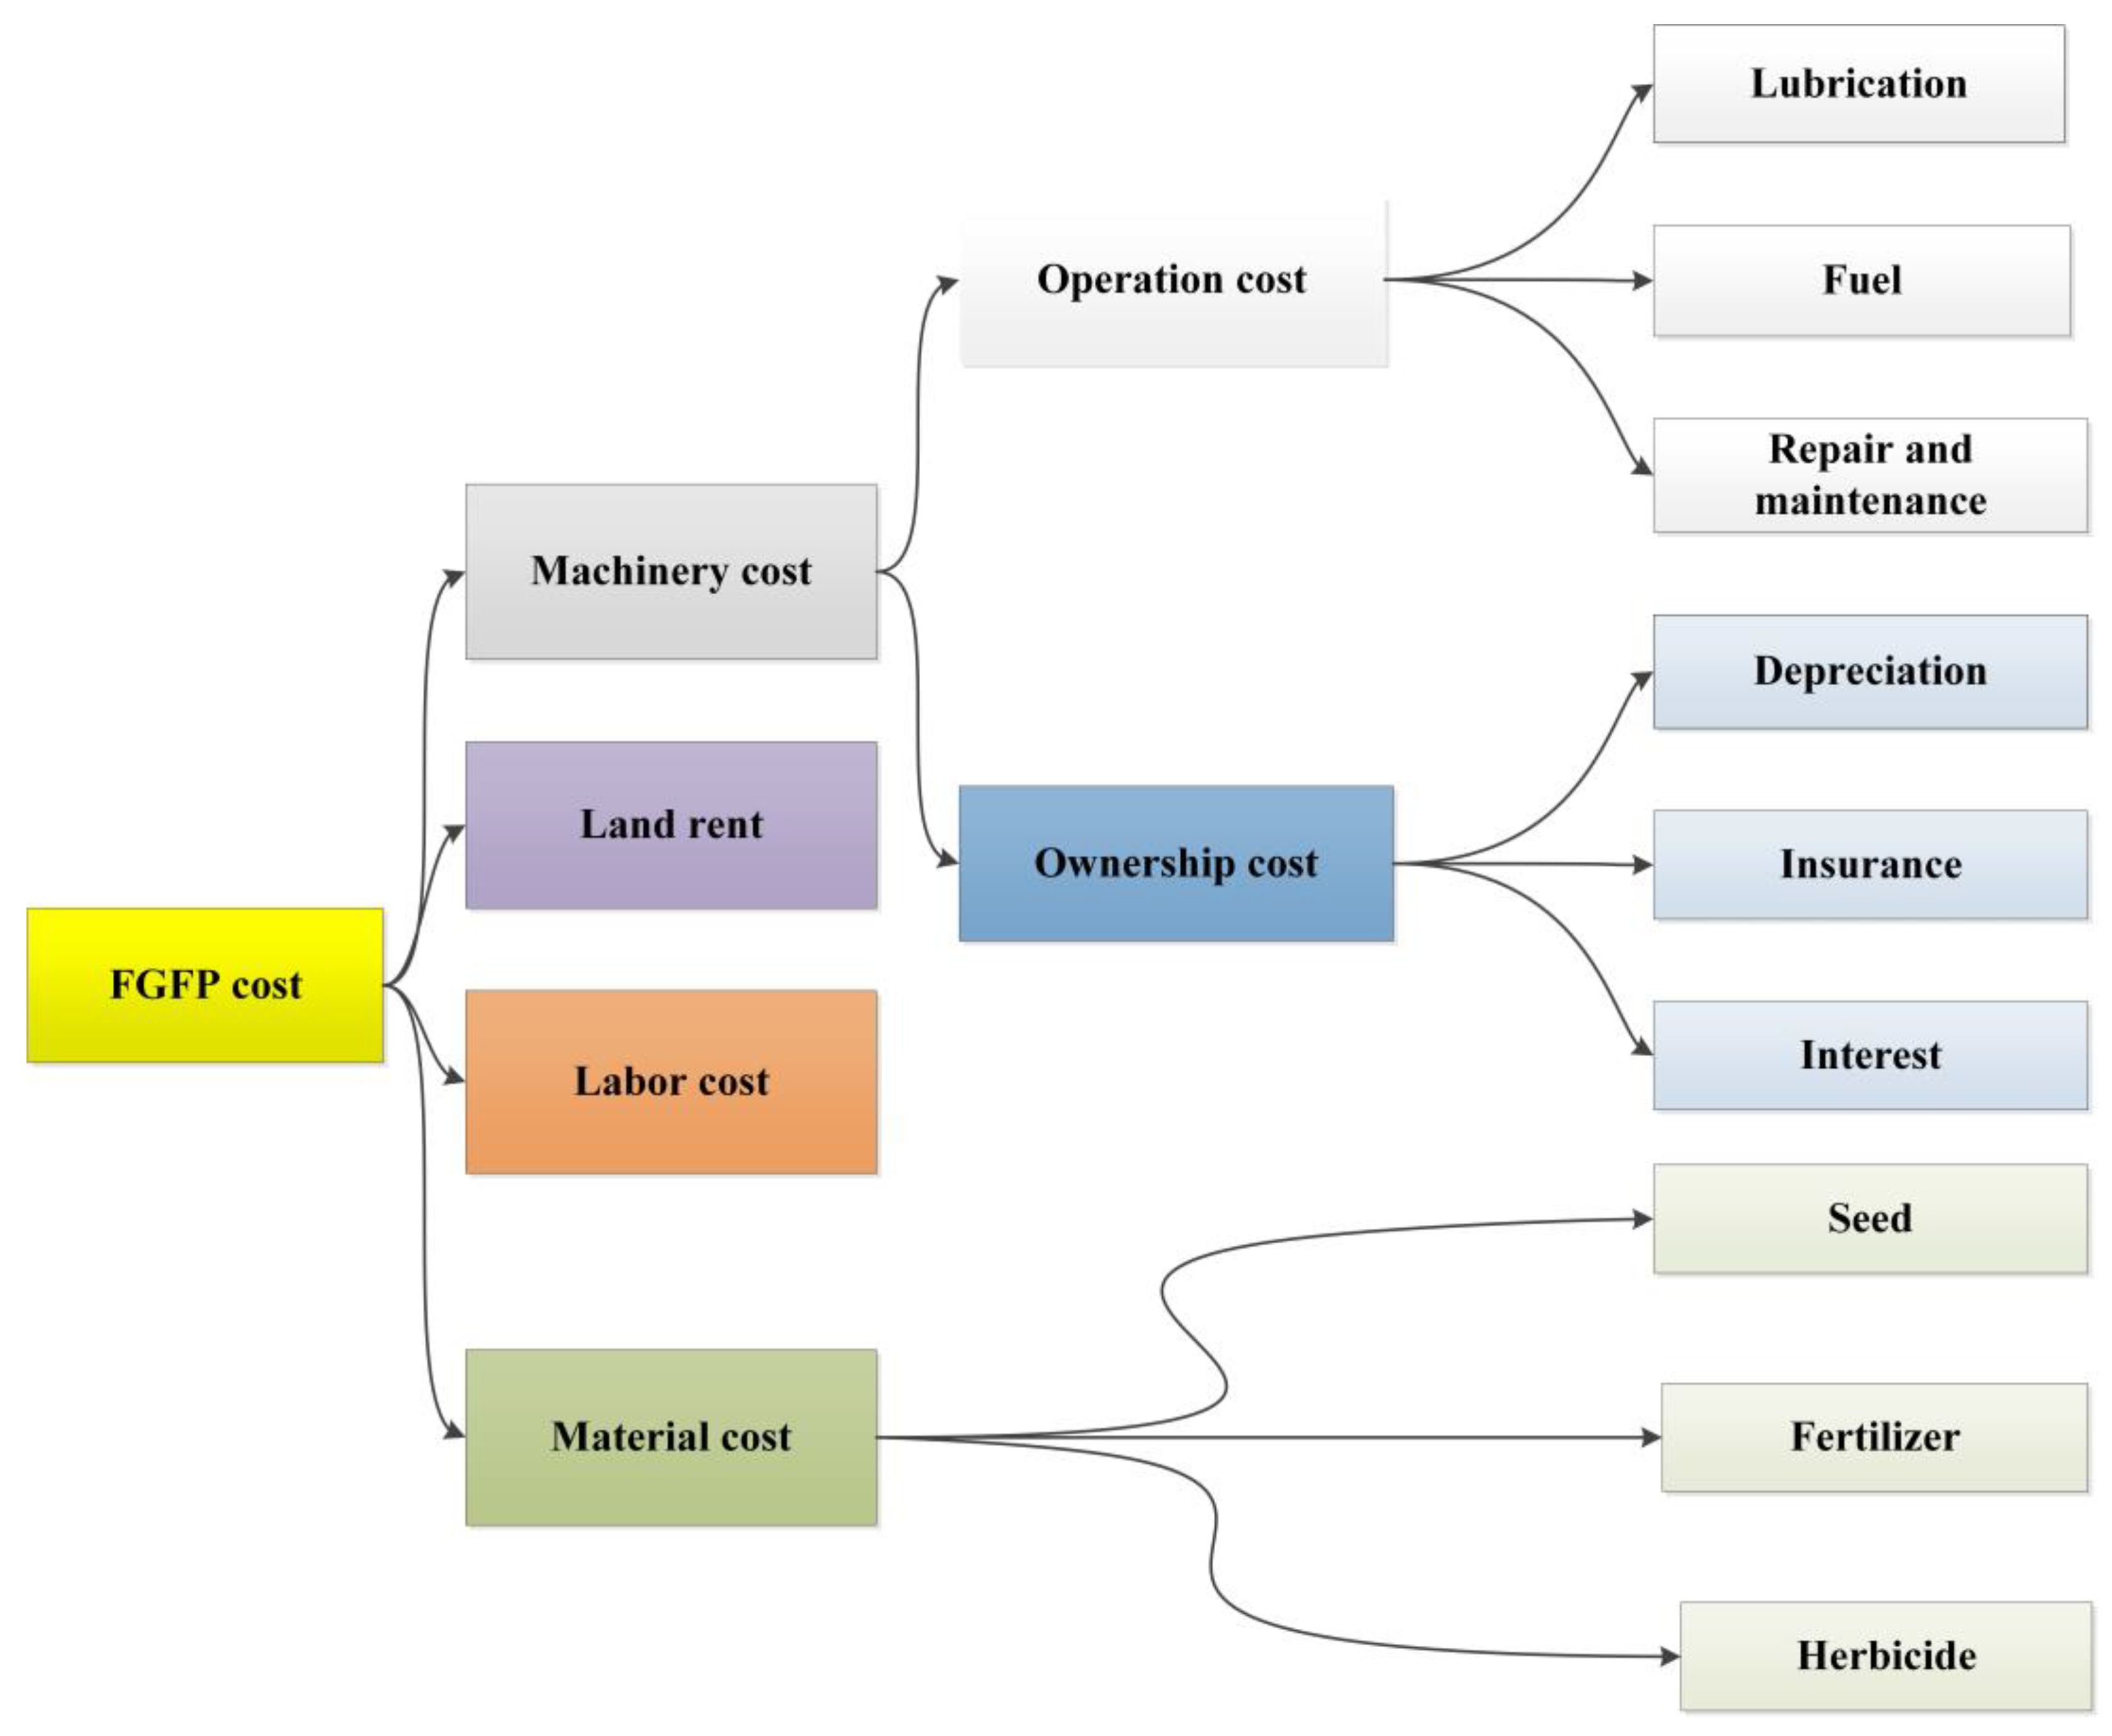
FGFP includes two stages: cultivation stage and harvest stage. Pre-year land preparation, seedbed preparation, sowing, weeding, and fertilization are all included in the cultivation process. Cultivation practices are presented in three scenarios (CT, RT, and NT), each presenting a possible cultivation strategy that could be chosen depending on the particular situation (tillage method, AMPs, and machinery available). The harvest practices are also presented in three scenarios according to different formats of the harvested biomass, which are small bale (SB), large bale (LB), and chipping (CP). In this study, FGFP costs were calculated under different AMP scenarios (combinations of cultivation scenarios and harvest scenarios). Detailed information on AMP scenarios relating to different cultivation methods and harvest methods are described in Section 2.2. The flow chart of FGFP cost calculation of this study is shown in Figure 1.
FGFP costs (CNY t−1) were calculated using Equation (1).
C =   t = 0 n C t / 1 + d t t = 0 n Y t / 1 + d t
where C = costs of FGFP (CNY t−1); Yt = yield in year t (t ha−1); Ct = the costs of production in year t (CNY), and this is a sum of all the cost components shown in Figure 2; n = number of years of plantation lifetime (year); and d = discount rate (dimensionless). In this study, the lifetime of switchgrass was assumed as 20 years [41]. The agronomy management scheme is displayed in Table 1 [42,43]. For each cost item in Table 1, the machinery, labor, and input material costs were calculated separately, the components of which are shown in Figure 2. All costs were spread equally over the years and expressed as net present value (NPV) in CNY in 2020. The discount rate used was 8%, which is rational for middle- and short-term projects [44].
Yield is a crucial parameter in FGFP cost calculation. The dynamic yield of switchgrass over the period of a 20-year lifetime was used rather than a single average yield to reflect the yield for all years.
The dynamic yield of switchgrass during its 20-year lifetime follows a growth curve that is a function of the peak yield of switchgrass. The switchgrass’ biomass yield reaches peak yield in the 4th year and remains constant until the 15th year, after which it declines by 5% per year until the 20th year [18,45,46]. The growth curve is shown in Figure S1. The spatially explicit of peak yield of switchgrass was derived from a study by Liu et al., who developed a model predicated upon results from SwitchFor [47].The spatially explicit peak yield map of switchgrass on the marginal land of the Loess Plateau is shown in Figure S2.
All the calculations were conducted in each 1 km2 grid in ArcGIS using detailed and high-resolution input data that reflected the spatial variations across the region. All the cost items and the costs involved in the calculations are from an investigation of the Loess plateau region.

2.1.1. Agricultural Machinery Cost

The agricultural machinery that should be chosen depends on, among others, the previous land use types, soil quality, terrain, size of the fields, etc. With the large area of the Loess Plateau, the characteristic of the land is complex and split. Some of the lands are terraced land distributed on the slope or scattered land that is not contiguous to other lands. In those lands, large machinery is hard to operate; consequently, traditional agricultural techniques are still used, which are usually labor-intensive. However, some of the lands are flat land and have large areas where advanced agricultural technology has been applied. As agricultural technology is difficult to distinguish in a spatially explicit way, two machinery system scenarios were used in this study. The first one is a commonly used machine system that usually makes use of small machinery for CT, and the second is an advanced integrated machine system that is suitable for RT and NT. The types of both conventional small machinery and advanced integrated machinery and information connected to the parameters used to calculate the costs were all based on an investigation undertaken in China.
The cost of agricultural machinery, including ownership costs and operating costs, was annualized and calculated based on a 1 km2 grid cell. The annualized costs for machines C m a c h i n e r y (CNY t−1) in each grid were calculated using Equation (2). The input parameters used to calculate the machinery costs for all the machinery used in this study are shown in Table 2.
C m a c h i n e r y = C o w n e r + C o p e r a t i o n Y D M
where C o w n e r (CHY) is the annual ownership cost, C o p e r a t i o n (CHY) is the annual operation cost, and Y D M (t) is the dry matter yield in each grid.
The annualized ownership cost C o w n e r (CNY) of machines includes depreciation, insurance, interest, and storage costs and was calculated as Equation (3):
C o w n e r = C d e p + C I n s + C i n t + C s t o
where annual depreciation cost C d e p   CNY , insurance cost C I n s (CNY), interest cost (CNY), and storage cost (CNY) were calculated using Equations (4)–(7), respectively.
C d e p = C P P C S T
C i n t = ( C P P + C S )   I 2
C i n s = C P P   ·   K
C s t o = C P P ·   S
where C P P (CNY) is the purchase price of a new machine, C S (CNY) is the salvage value of a machine at the end of machine life, T (year) is the lifetime of the machinery, and I, K, and S are the interest rate, insurance factor, and storage factor, respectively.
The annual machinery operation cost C o p e r a t i o n (CHY) includes repair and maintenance, fuel, and lubrication costs and was calculated as Equation (8).
C o p e r a t i o n = C R M + C f u e l + C l u b r i c a t i o n
The annual repair and maintenance costs of the machinery C R M (CHY) follows the Agricultural Machinery Management Standard published by the American Society of Agricultural Engineers [48] and was calculated as Equation (9).
C R M = C P P ·   R F 1 · h 1000 R F 2 T
where R F 1 and R F 2 are the repair and maintenance factors, h (hours) is lifetime accumulated use hours of a machine, and T (year) is the lifetime of a machine.
The annual fuel cost C f u e l (L h−1) was figured by the fuel consumption rate per hour Q f u e l (L h−1) and the actual working hours of a given machine per year H m a c h i n e (h), and the price of fuel P f u e l (CHY L−1) using Equation (10),
C f u e l = Q f u e l ·   H m a c h i n e · P f u e l
where Q f u e l was calculated using Equation (11), which follows the ASAE standards (2000).
Q f u e l = 0.305 × 0.73 × P p t o
where P p t o (kW) is maximum PTO (power take off) power. H m a c h i n e (h) was calculated using Equation (12) or Equation (13) because the unit of working efficiency of some machinery is t per hour and for others it is hectare per hour.
H m a c h i n e 1 = Y f r e s h W E 1 · N    
H m a c h i n e 2 = 100 W E 2 · N
where WE1 (t h−1) or WE2 (ha h−1) is the working efficiency of a machine and N is the number of machines needed in each grid, and was calculated using Equation (14),
N = i n t Y f r e s h C a p + 1  
where Cap (t) is the maximum quantity of harvested biomass processed by a given machine per year.
Y f r e s h = Y D M 1 M C  
where the Y f r e s h (t) is the fresh harvest yield in one grid cell, and MC is the moisture content of the fresh harvest yield. In the SwitchFor model, it was assumed that the freshly harvested biomass moisture content is 15%.
The annual lubrication costs C l u b r i c a t i o n (CHY) was figured by the lubrication consumption rate per hour Q l u b r i c a t i o n (L h−1), the actual working hours of a given machine per year H m a c h i n e (h), and the price of lubricating oil, and calculated using Equations (16) and (17).
C l u b r i c a t i o n = Q f u e l · H m a c h i n e · P l u b r i c a t i o n  
Q l u b r i c a t i o n = 0.021 + 0.00059 P p t o
Table 2. The input parameters for agricultural machinery cost calculation.
Machinery PP *: Purchase Price (CNY) aSalvage Value (CNY)Lifetime(Years) bInterest Rate cInsurance Rate cStorage Rate bRF1 bRF2 bLifetime Accumulated Use in Hours (h) bMaximum PTO Power (kW) aWorking Capacity (t h−1) or (ha h−1) aNumber of Laborers (People) Additional Equipment a
Plough 6220311200.060.0060.01750.291.81400-0.8 e-80 hp tractor
Harrow 40,6202031200.060.0060.01750.231.41400-2.4 e-130 hp tractor
Roll4990250200.060.0060.01750.161.31400-2 e-80 hp tractor
Seed drill 140,7007035200.060.0060.01750.322.11400-2.4 e-80 hp tractor
Fertilizer spreader 80,5884029100.060.0060.01750.631.3500-19.2 e-130 hp tractor
Herbicide sprayer 15,800790100.060.0060.01750.411.31000-9.6 e-80 hp tractor
Mower69,8003490200.060.0060.01750.181.61400-1.6 e-80 hp tractor
Weed cultivator 110055100.060.0060.01750.231.41000-2.3 e-80 hp tractor
Light tillage land preparation machinery21,8581093200.060.0060.01750.291.81400-0.12 e-180 hp tractor
No tillage seed drill176,0008800200.060.0060.01750.322.11400-4.9 e-255 hp tractor
Self-propelled forage chopper 2,380,000119,00050.060.0060.01750.03225003505.6 e1-
Silage trailer 42,5002125120.060.0060.01750.191.33000-5.6 e180 hp tractor
Mower265,00013,250200.060.0060.01750.181.61400-3.2 e-80 hp tractor
Small square baler 123,1756159100.060.0060.01750.231.82000-4 d-80 hp tractor
Large square baler 1,178,70058,935100.060.0060.01750.231.82000-8 d-130 hp tractor
Fork loader 85,00019,465100.060.0060.01750.003210,00032.412 d2-
Trail42,5002125120.060.0060.01750.191.33000---80 hp tractor
Tractor (80 hp)68,52815,693120.060.0060.01750.0032960050.2-1-
Tractor (130 hp)97,64322,360120.060.0060.01750.0032960081-1-
Tractor (180 hp)191,80043,922120.060.0060.01750.00329600112.5-1-
Tractor (225 hp)940,000215,260120.060.0060.01750.00329600190-1-
Notes: a: Internet investigation from https://www.nongjitong.com (accessed on 4 October 2021), PP * is the price after the subsidy; b: data source from [49] (accessed on 10 January 2021); c: data source from [50] (accessed on 3 September 2009); d: unit is t h−1; e: unit is ha h−1.

2.1.2. Labor Cost

Annualized labor cost was calculated using the cost of labor per hour and the actual working hours (Equation (18)).
C l a b o u r = W h · H l a b o u r   Y D M · N w o r k e r
where C l a b o u r   CNY   ton 1 is the labor cost per year per grid, and W h   CNY   h 1 is the hourly wage, which was calculated based on the daily wage of a worker under the assumption that a worker works 8 h a day (Equation (19)). H l a b o u r   h is the working hours of a worker per year and was calculated based on H m a c h i n e (Equation (20)). N w o r k e r is the number of workers required. The number of workers is based on the type of machinery and operation.
H l a b o r = H m a c h i n e ·   F l a
where F l a is the labor adjustment factor, which was used to calculate total labor hours for machinery operation, including time for locating, hooking up, adjusting, and transporting machinery. For example, a labor adjustment factor of 1.1 would increase the time required to complete a task by 10%. F l a was assumed as 1.1 in this study.
W h = W d     8            
where W d   CNY   d 1 is the daily wage of a worker, assuming that a worker works 8 h a day. The wage of an agricultural machinery driver is higher than that of a general worker. The average daily wage of a general worker is 120 CNY d−1 and 200 CNY d−1 for an agricultural machinery driver.

2.1.3. Land Rent

Chinese land contract policy does not set a standard price for land rent. Land rent varies significantly among sites depending on multiple factors, such as the local economy, the land use type, the surrounding roads and traffic, and land quality. Through an investigation of Chinese land transaction websites and communication with local farmers, land rents were determined as ranging from 400 to 600 CNY mu−1 per year−1 (mu is a Chinese area unit, 1 mu = 0.067 ha), which equals 6000–9000 CNY ha−1 per year−1, and marginal land rent ranged from CNY 30 to 800 CNY mu−1 per year−1, which is equal to 450–11,940 CNY ha−1 per year−1. It was also revealed that land quality is one of the most important factors impacting arable land rent. As a result, marginal land suitability was used as a proxy for marginal land rent. The ceiling for marginal land rent was set to 6000 CNY ha−1 year−1 because the marginal land rent should not surpass that of the arable land. By coupling the marginal land suitability map with the actual investigation of the marginal land rent ranges, a spatial marginal land rent distribution map across the Loess Plateau was generated and is displayed in Figure S3. The marginal land suitability spatial map of the Loess Plateau was extracted from Liu et al.’s study [13].

2.2. Land Management

2.2.1. Pre-Year Land Preparation

For marginal land, it is very important to conduct an additional year of site preparation to control for weeds, correct nutrient deficiencies, and adjust soil pH [51,52]. Soil texture is required to provide quantitative guidance, and five soil samples are required per ha [17]. The optimal soil pH for switchgrass is ≥5.5, and liming is applied if the pH is lower. The optimal soil nutrient levels are soil P > 25 mg kg−1 and soil K > 90 mg kg−1 [20,42,53], and an additional 45 kg ha−1 P2O5 and 100 kg ha−1 K2O fertilizer should be applied if the soil nutrient is below the standard [20,51].
In this study, spatial soil attribute data with a resolution of 30 m extracted from the NESDA (National Earth System Science Data Center) were used to calculate the amount of each material that should be applied and in turn calculate the cost in each grid cell. Liming was not needed because the soil pH of the entire Loess Plateau is above 5.5 according to the spatial soil data (Figure S4). An additional 45 kg ha−1 P2O5 and 100 kg ha−1 K2O of fertilizer should be applied in each grid cell because the soil nutrient level is below the standard required on the Loess Plateau, with the soil P ranging 0–19.9 mg kg−1 (Figure S5) and soil K ranging 0–44 mg kg−1 (Figure S6). In addition, an initial N loading of around 168 kg ha−1 should be applied to enable the successful establishment and obtain the expected yield on the marginal land [21,54,55]. The soil test and fertilizer costs are displayed in Table 3.

2.2.2. Establishment

There are many switchgrass establishment guides available that describe how to successfully plant switchgrass and achieve high quality and quantity biomass based on experience from practical plantations. In this study, agronomy management and technology for switchgrass plantation on the marginal land of the Loess Plateau were carefully selected by intensively reviewing the preexisting literature [16,20,21,25,51,52,56,57,58] and integrating the actual environmental and socioeconomic situation of the research region.
The difference between the three cultivation methods include agronomy management practice in the establishment, agricultural machinery used, and seed application rate. In CT, the establishment starts with soil bed preparation including ploughing and harrowing. The soil is inversion-ploughed and worked to a fine tilth with a power harrow twice. The tilled seedbeds are then compacted with a roller before and after seed drilling. This is because compacted soil improves seed-to-soil contact, which reduces seedling emergence time and increases seedling numbers when compared with unrolled seedbeds [59,60]. Seeds are planted at a depth of 1 to 2 cm with a sower [60,61]. The planting date is 3 weeks before the recommended maize planting date [62]. In RT, the agronomy management practice is the same as with CT except for the intensity (depth) of the tillage. In NT, the land is not tilled at all, and the seeds are sowed directly into a killed sod using a seed driller.
The seed application rate depends on several factors: the seed’s weight, cultivars, soil quality, and cultivation methods [42]. The reported seed application rate varies from 7.8 to 15 kg ha−1 of pure live seed (PLS) in published papers [19,42,61,63,64,65]. The RT and NT require a higher seeding rate compared with CT [56]. In the research of [64], they applied 9 kg PLS for the CT using a cultipacker seeder (Brillion) and 11 kg PLS for a no-till drill. The seed weight of the Cave-in-Rock (CIR) genotype, 130 mg 100−1, is heavier than Alamo, 82 mg 100−1 [60]. In this study, the following seed application rates were considered by comprehensively analyzing tillage methods, cultivars, seed weight, and poor soil quality of the marginal land. The seed application rate of upland switchgrass is 15 kg ha−1 of PLS for RT and NT and 12 kg of PLS (82% of NT) for CT, for lowland switchgrass it is 10 kg ha−1 of PLS (63% of CIR) for RT and NT, and 8 kg ha−1 of PLS for CT. The seed rate and price are depicted in Table 3.
Table 3. The cost of the input material and other costs.
MaterialsAMPs Materials or Labor Application Rate Price Cost (CNY ha−1)
Value UnitValueUnit
Fertilizer Harvest year fertilizer application N0.6% y t ha−15435 aCNY t−132.6 y
P0.09% y t ha−18584 aCNY t−17.7 y
K0.28% y t ha−13194 aCNY t−18.9 y
Pre-year nutrient adjustmentCO (NH2)216.8%t ha−12554 aCNY t−1429
P2O54.5%t ha−13750 aCNY t−1169
K2O10.0%t ha−14274 aCNY t−1427
Seed RT and NTUpland seed 15kg ha−1 PLS210 bCNY kg−13250
Lowland seed 10kg ha−1 PLS210 bCNY kg−12100
CTUpland seed 12kg ha−1 PLS210 bCNY kg−12520
Lowland seed 8kg ha−1 PLS210 bCNY kg−11680
Herbicides Pre-weedingGlyphosate2.5 ckg ha−130 bCNY kg−175
Post-weeding2,4-D0.12 dkg ha−1500 aCNY kg−161
Other cost itemsSoil test -5 Samples per ha200 CNY per sample-
Fuel ---6.7CNY L−1-
Lubricating oil---12.3CNY L−1-
Labor Drivers --200CNY d−1-
Normal worker--120CNY d−1-
Notes: a: Internet investigation from https://b2b.baidu.com/ (accessed on 4 October 2021)); b: data source was extracted from [64]; c: data source was extracted from [17]; d: data source was extracted from [66,67,68]; y: harvest DM yield.

2.2.3. Fertilization

The fertilization for pre-year land preparation is described in Section 2.2.1. Fertilizer is not recommended in the establishment year because this only benefits the weeds [56]. To avoid the growth of weeds, fertilizer is applied from the second year and follows a schedule of twice and once in alternate years (Table 1). The amounts of nitrogen (N), phosphorus (P), and potassium (K) removed from the field in the harvested matter were used as a proxy for the application rate [19]. The rationale is that all nutrients removed from the field need to be replaced to avoid soil mining. The N, P, and K content of switchgrass on a dry matter basis is 0.6%, 0.09%, and 0.28%. The resulting fertilizer application rates and prices are shown in Table 3. The fertilizer is applied using a fertilizer spreader.

2.2.4. Weeding

Weed control is critical during the establishment year, as after that year, weeds pose less of a management or production problem. The soil is disturbed less, and as switchgrass plants mature and develop more tillers, they shade the weeds and become more competitive. C3 weeds emerge early and can outcompete young switchgrass plants. Therefore, before ploughing, to remove the previous crop and/or weeds, 2.5 kg ha−1 per year−1 of Glyphosate (N-(phosphonomethyl) glycine) is used to control C3 weeds as pre-weeding [18,19]. In the establishment year, it is often beneficial to mow weeds because mowing weeds just above the height of the switchgrass plant can help control weeds [56]. When weeds are 6 to 10 inches high and grass seedlings have tillered and have about four leaves to open the canopy, spray with 2,4-D to control broadleaf weeds [61,66]. The application rate and the price of herbicide are presented in Table 3. Herbicide is sprayed using a pesticide sprayer and weeds are mowed using a weed cultivator. The related machinery required is shown in Table 2.

2.2.5. Harvest

Harvest systems vary with respect to economic and environmental performance and the form in which the harvested biomass is required for delivery. Two harvest systems have been used commercially in C4 perennial energy crop feedstock production. These are chopping and baling. Chopping or baling depends on how far the material is transported, as the density of chopped material is lower at 0.2 g cc−1 and the bales are more compact at 0.5 g cc−1. Therefore, transporting chopped material is more expensive and emits more GHG.
In this study, the harvest costs of three harvest systems were calculated according to three forms of feedstock. The first system is a direct chipping system that harvests biomass with a forage harvester that collects and chops the biomass into chips and then delivers it into the following trailer [18]. This operation requires at least two people, but an additional person is required for the trailer in the case of commercial production in large fields. The second system is the large bale system, swathing and baling, which involves using a mower that harvests biomass into swath, followed by a tractor with a large baler, which is then followed by a telehandler and a tractor with a trailer. At least five staff are required for continuous operation on a large scale [18,19]. The third system is the small bale system, which is the same as the large bale system, and the only distinction is the size of the bale, which is related to the different baler. The agricultural machinery of harvest is displayed in Table 3.

2.3. Cost–Supply Curves

Based on the spatially explicit yield of switchgrass, the spatially explicit energy supply potential of switchgrass was calculated using the HHV (higher heating value) of switchgrass, which is 18 MJ kg−1 [56]. Switchgrass cost–supply curves were created by building a cumulative distribution function between the FGFP cost and energy potential by ranking the FGFP cost and accumulating the energy potential of each cell of all the grid cells on the marginal land of the Loess Plateau. Cost–supply curves were constructed to reflect the economical energy supply potential of the switchgrass on the marginal land of the Loess plateau. The cost supply curves were drawn using STATA (17.0).

3. Results

3.1. FGFP Cost

Figure 3 shows the spatially explicit FGFP cost of switchgrass on the marginal land of the Loess Plateau under different AMP scenarios, and the statistical results are shown in Table 4. The Loess Plateau has wide variations in FGFP cost, which are closely correlated with switchgrass yield under all AMP scenarios. The cost of FGFP is cheap in the region’s south and southeast, where switchgrass yields are high, but it is expensive in the north and northwest, where yields are low. The statistical findings in Table 4 show that CT_SB has the lowest FGFP costs, which range from 95 to 3350 CNY t−1 (14.8 to 679.7 USD t−1); the weighted average cost for the region is 702 CNY t−1 (109.7 USD t−1). The most costly FGFP expenses are associated with RT_CP, with costs ranging from 141 to 7380 CNY t−1 (22.0−1153 USD t−1) and a weighted average of 1610 CNY t−1 (251.6 USD t−1).
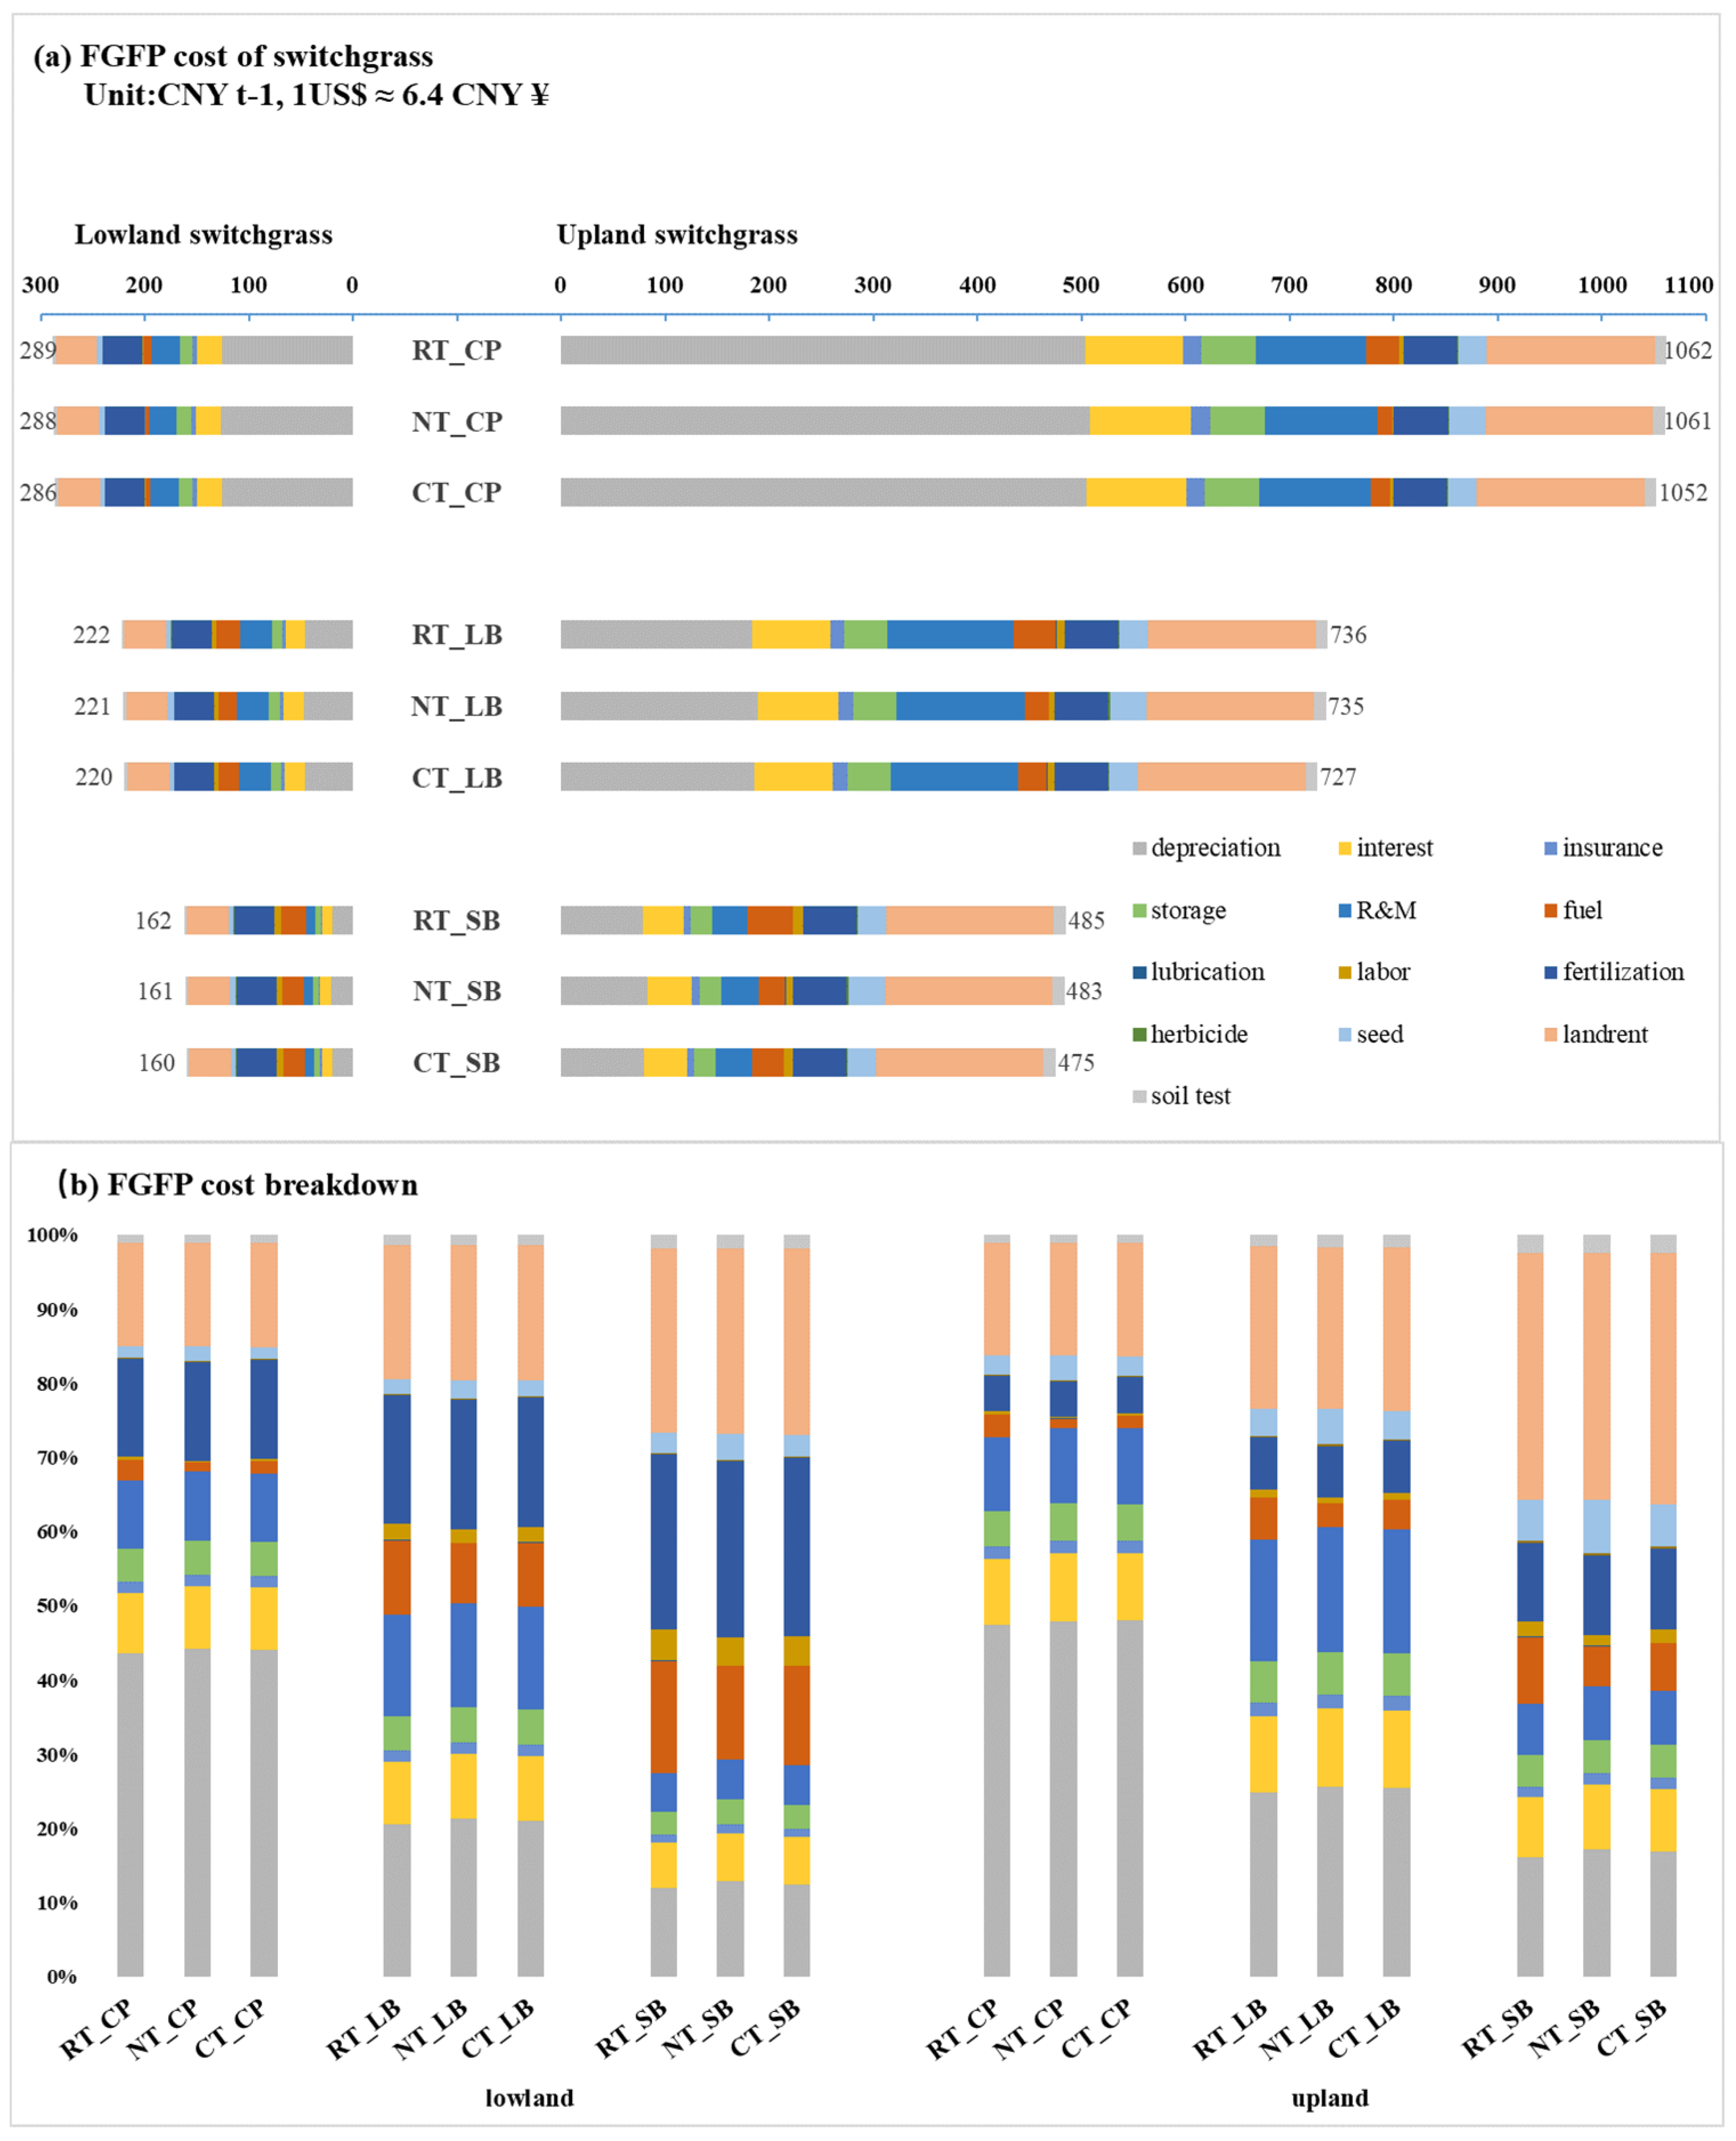
Figure S7 illustrates the FGFP cost breakdowns under different switchgrass yields, showing that FGFP cost decreases with the increase in yield. Figure 4 shows an example of the FGFP cost breakdown with an average yield of 5 t ha−1 for upland switchgrass and 20 t ha−1 for lowland switchgrass. It demonstrates that whereas harvest methods have a large impact on FGFP cost, cultivation methods have a relatively small impact. The cost of FGFP is highest when biomass is harvested using CP; LB comes in second, and SB is the least expensive. FGFP cost is around 1056 CNY t−1, 735 CNY t−1, and 481 CNY t−1 for CP, LB, and SB, respectively, for upland switchgrass, and for lowland switchgrass it is 288 CNY t−1, 221 CNY t−1, and 161 CNY t−1 for CP, LB, and SB, respectively (Figure 4a). The individual cost items and their contribution to FGFP cost vary amongst AMP scenarios. The depreciation costs, land rent, and fertilizer costs contribute significantly to FGFP cost, accounting for 16–44%, 14–33%, and 5–23%, respectively (Figure 4a,b).
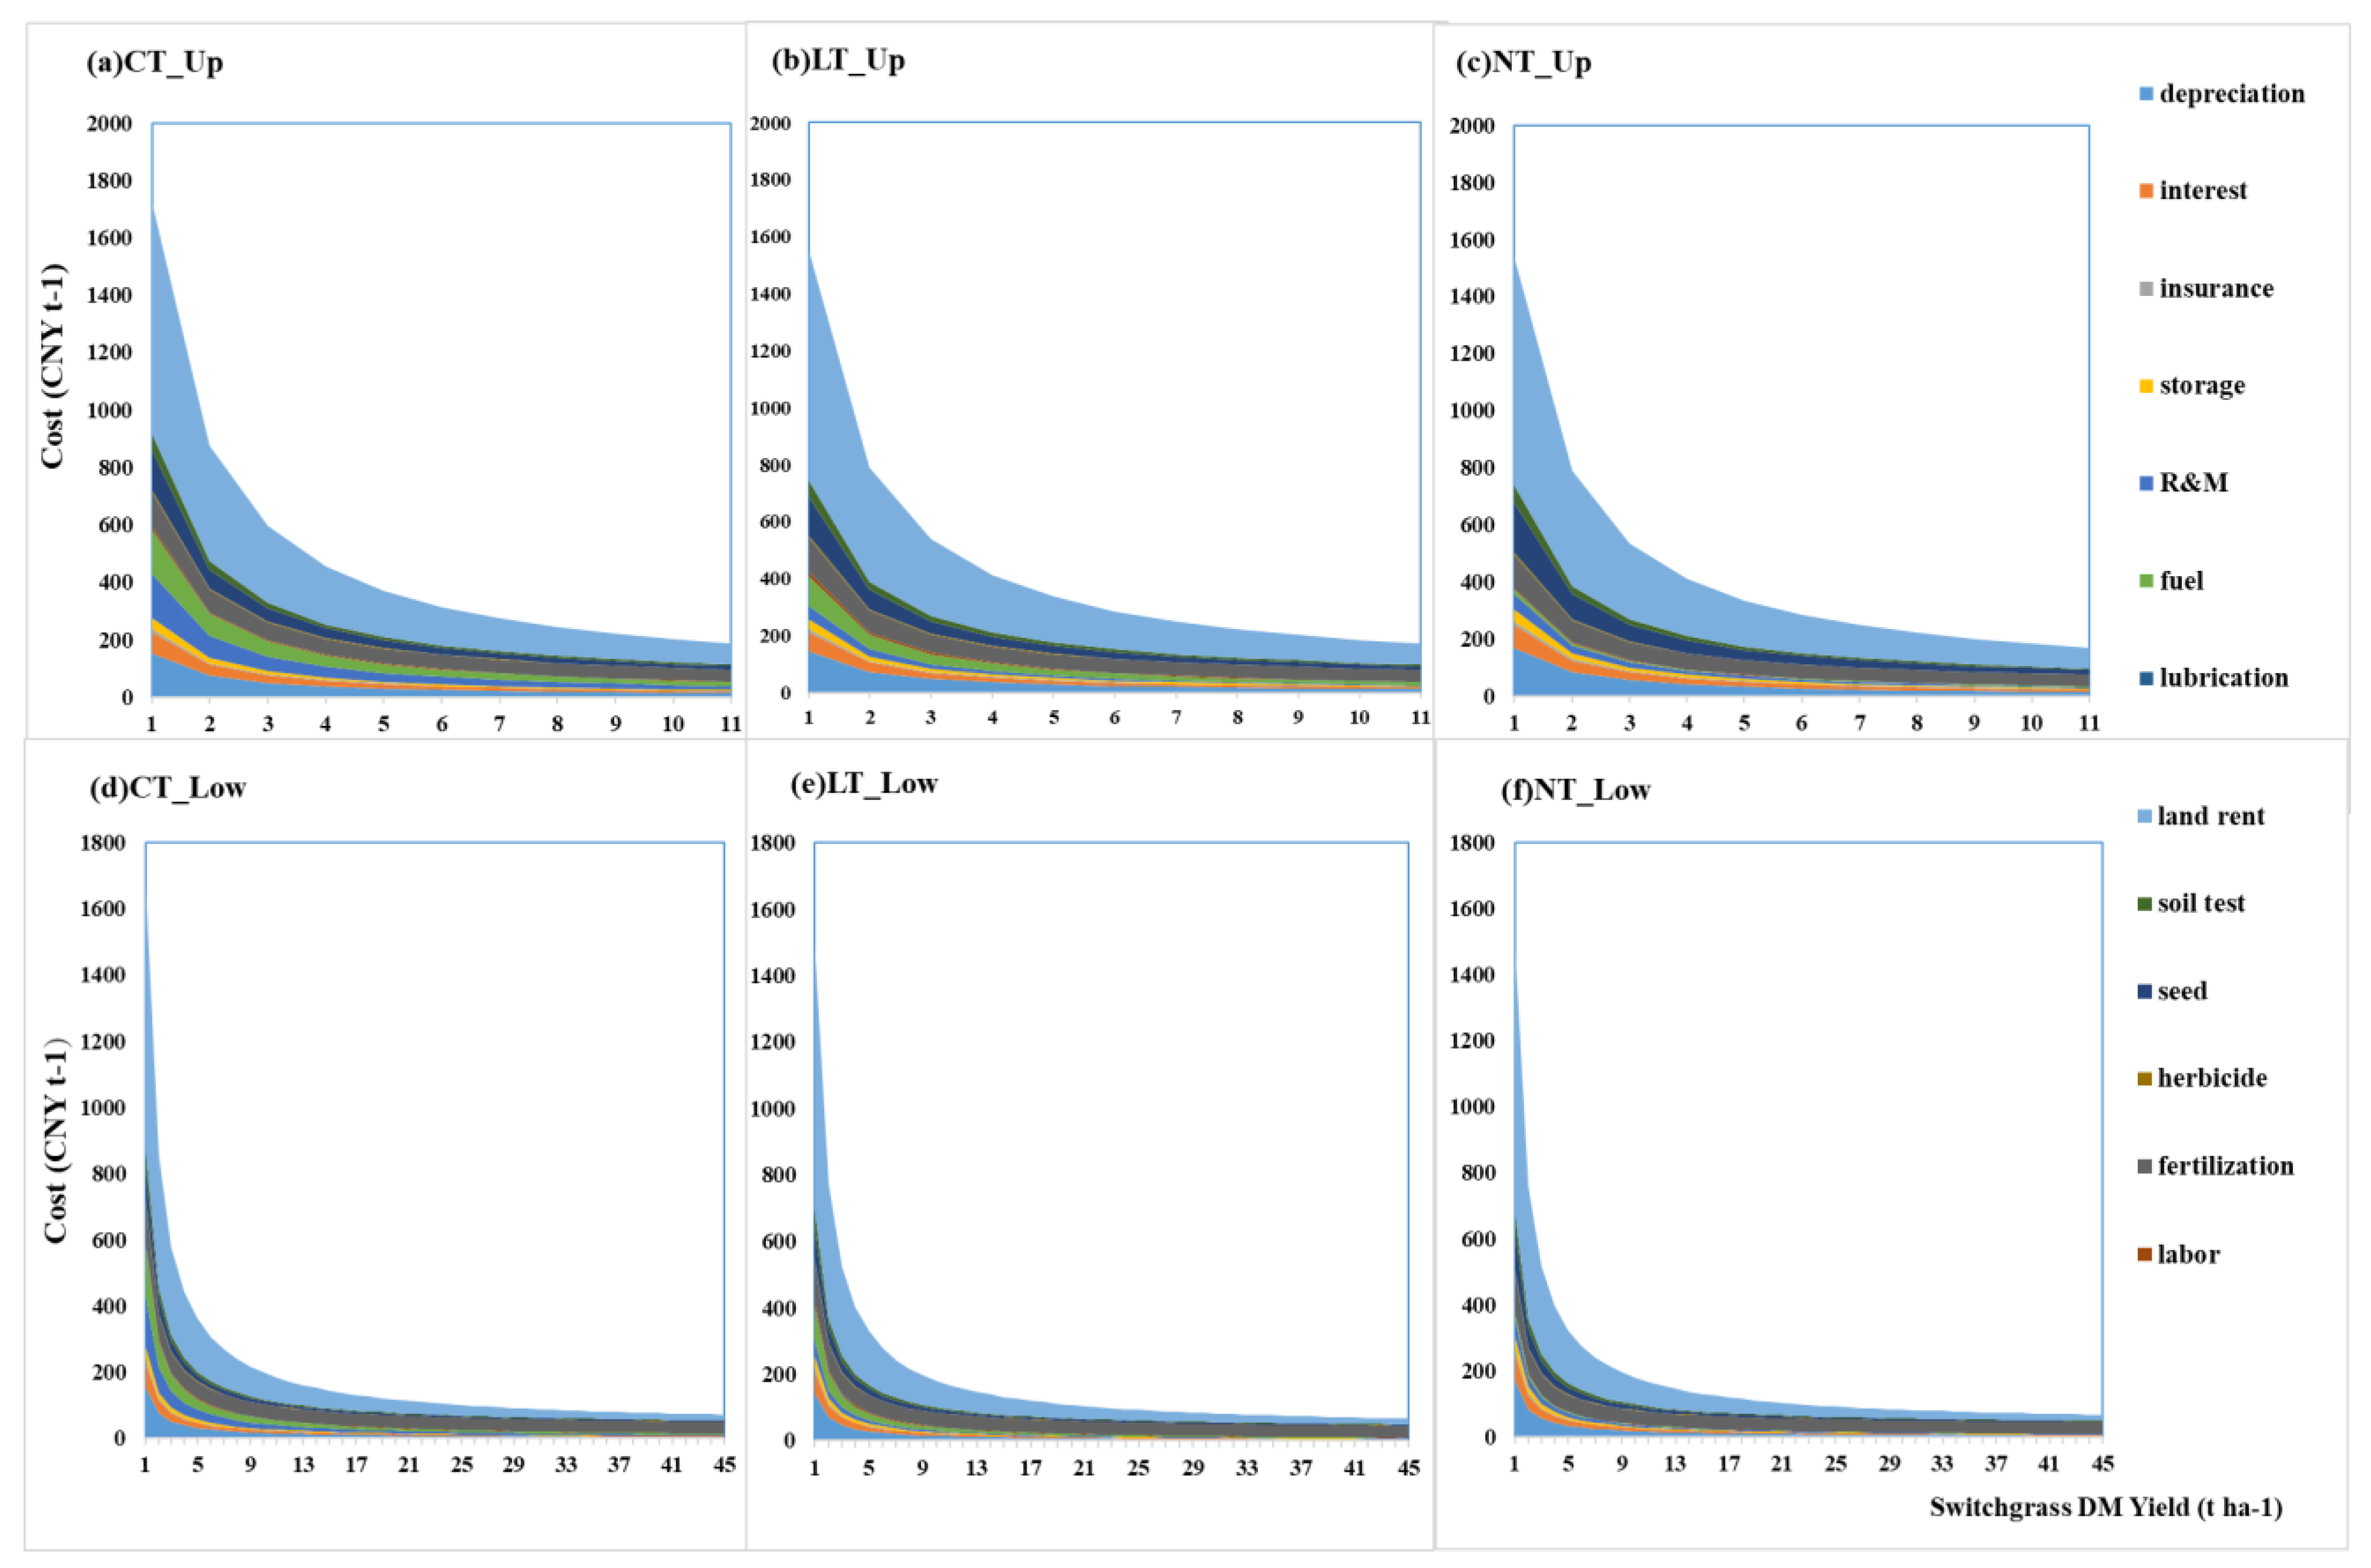
The cost of different cultivation methods and harvest methods were contrasted independently to examine their impact on FGFP costs. Figure 5 displays the cultivation cost breakdown for upland and lowland switchgrass with different yield levels. The cultivation cost is distinguished between upland and lowland switchgrass because seed application rates relating to seed weight and the fertilizer amount relating to yield are different between upland and lowland switchgrass. The total cultivation cost decreases with an increase in biomass yield since some of the cost items are cost “per hectare”, such as land rent, soil test costs, herbicides, and seed costs. The cultivation cost ranking is RT > NT > CT under the same yield, but the difference is negligible. The main different cost items are machinery-related costs, labor costs, and seed costs. As different agricultural machinery is used in different cultivation methods, the cost items relating to machinery cost differ among cultivation methods and the labor cost also changes, as it is closely related to the machinery.
Figure 6 displays an example of the cultivation cost breakdown of three cultivation methods under average yield of upland switchgrass, 5 t ha−1, and lowland switchgrass, 20 t ha−1. Considering the average yield, the total cultivation cost of RT, NT, and CT for upland switchgrass is 337 CNY t−1, 336 CNY t−1, and 328 CNY t−1, respectively. For lowland switchgrass, costs are 82 CNY t−1, 81 CNY t−1, and 80 CNY t−1, respectively. NT is the most fuel- and labor-efficient cultivation method. In the case of Figure 6, the fuel cost of NT is 41% of CT and 15% of RT, and the labor cost of NT is 32% of CT and 21% of LT. In addition, seed costs for NT are higher than for RT and CT.
In conclusion, the total cultivation cost decreases with increasing yield. Although the total cultivation costs differ little, the cost of some cost items differs significantly among the three cultivation methods, especially fuel costs and labor costs. NT is the most energy- and labor-efficient cultivation method.
Figure 7 displays the harvest cost breakdowns of three different harvest methods with different yield levels. Harvest costs decrease with an increase in switchgrass yield. Total harvest costs vary significantly between the three harvest methods and the ranking is CP > LB > SB considering the same yield. The contribution of the cost items also varies significantly among harvest methods. The depreciation costs contribute most where the yield is low, with the contribution decreasing as the yield increases. The fuel and labor costs in the SB contribute more than other harvest methods.
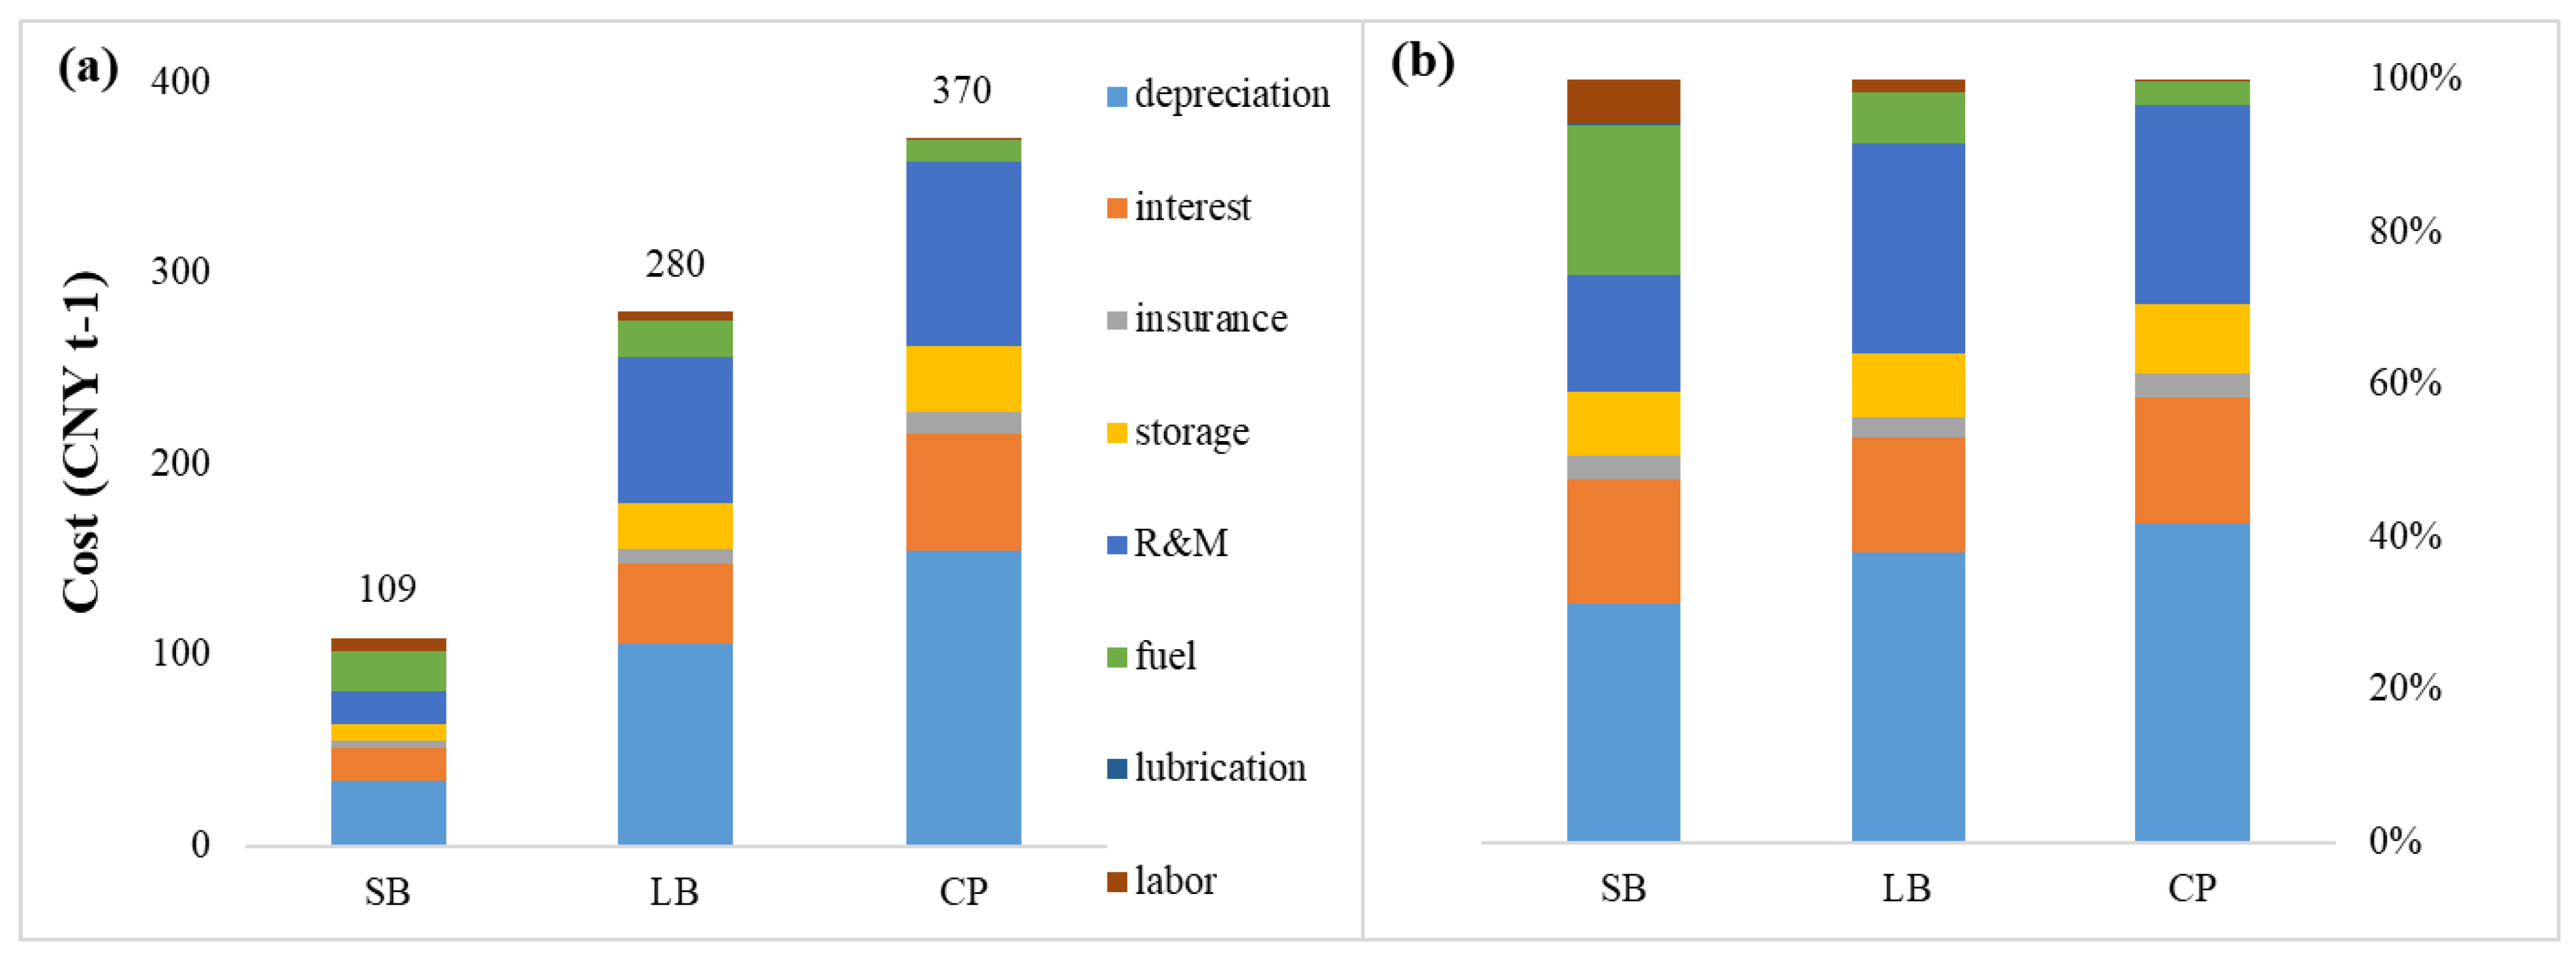
Figure 8 shows an example of the harvest cost breakdown of the three harvest methods, considering the average optimal switchgrass yield. The harvest cost of SB is 109 CNY t−1, the LB cost is 280 CNY t−1, and the CP cost is 370 CNY t−1. CP is the most expensive harvest method, which is 3.4 times the SB and 1.3 times the LB. The machinery costs of CP are much higher than SB and LB. While the fuel costs and the labor costs of CP are the lowest, the fuel costs are 52% for SB and 58% for LB, and the labor costs are 17% for SB and 25% for CP. SB has the most fuel consumption and is the most labor intensive, while CP is the most energy- and labor-efficient method, and LB is in between.

3.2. Cost–Supply Curves

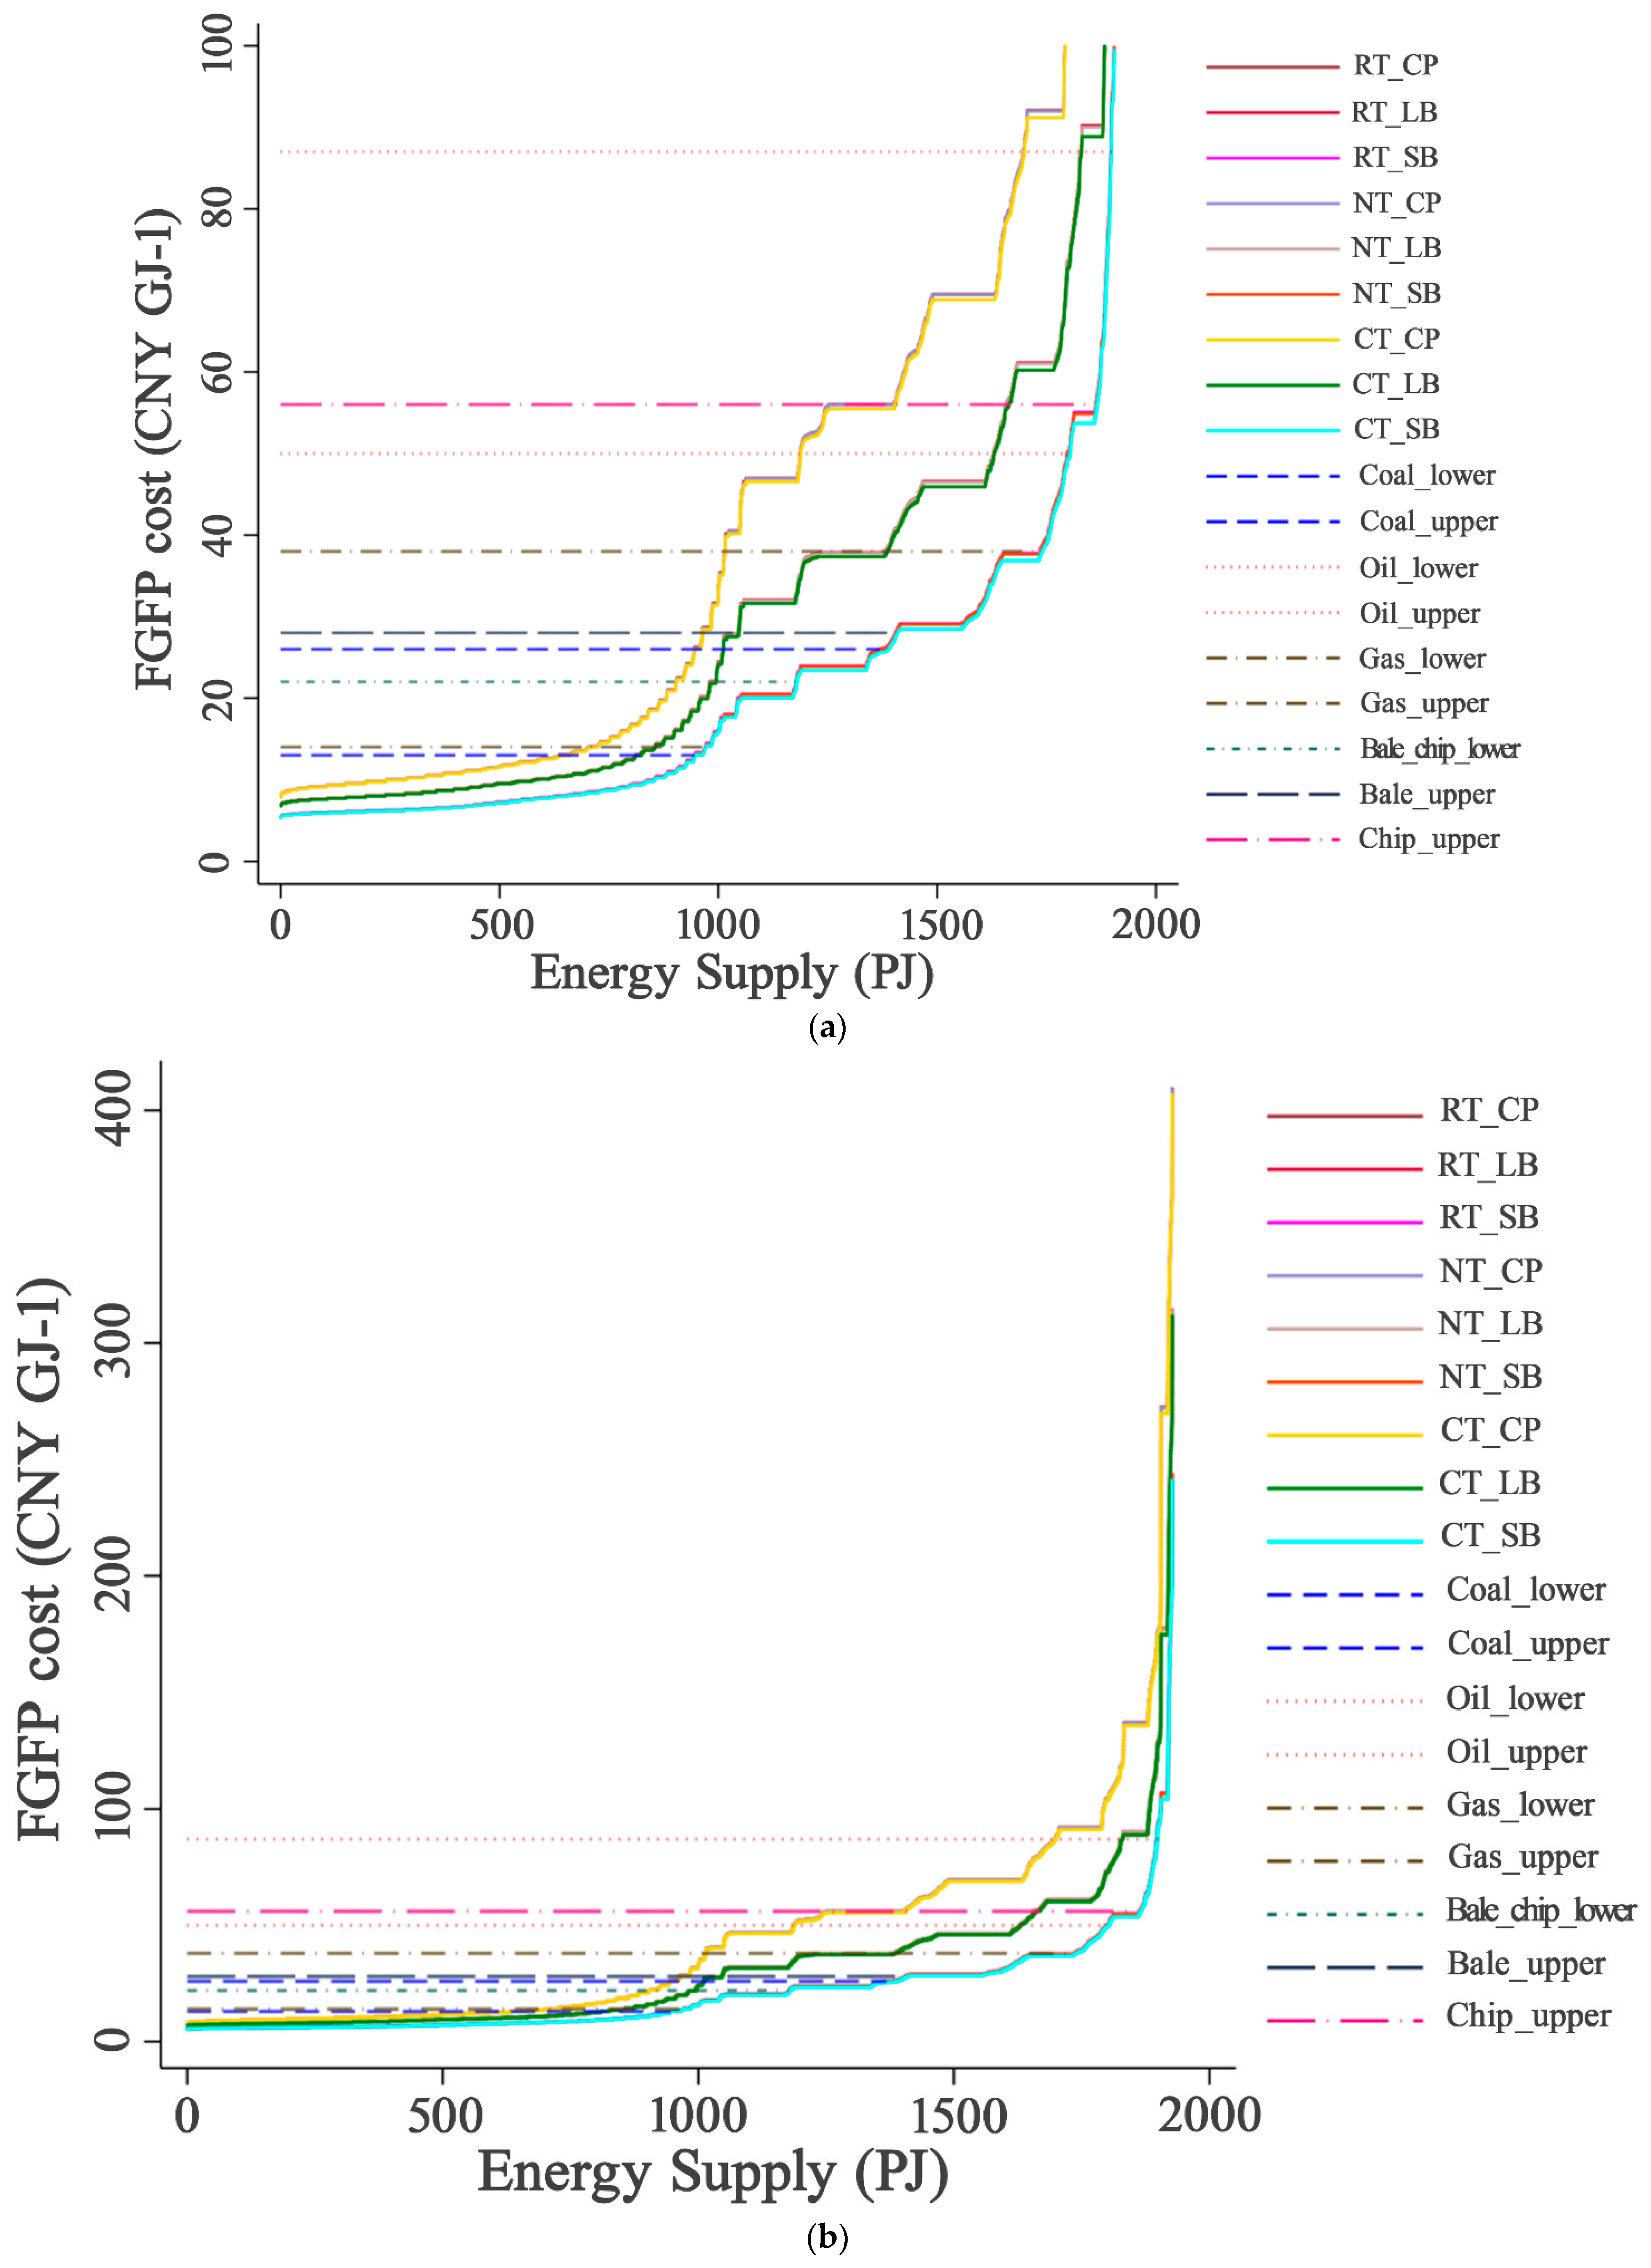
Based on the spatially explicit FGFP costs, cost–supply curves (Figure 9) were constructed to show the energy supply potential of different AMP scenarios on the marginal land of the Loess Plateau. To supply a certain amount of energy, the scenarios with the LB harvest method can supply energy at a relatively lower cost, followed by the LB harvest method, and the cost of the CP harvest method is the highest. The total energy potential is 1927 PJ so that at least 1793 PJ (93%) of the energy could be supplied under the cost of 100 CNY GJ−1 (15.6 USD GJ−1) for all AMP scenarios with the price increasing dramatically after 100 CNY GJ−1.
The reported free-on-board (FOB) price in 2019 and 2020 for thermal coal was 13–26 CNY GJ−1 (2.0–4.0 USD GJ−1), 14–38 CNY GJ−1 (2.2–6.0 USD GJ−1) for natural gas, and 50–87 CNY GJ−1 (7.7–13.6 USD GJ−1) for crude oil cost [69]. In comparison to the energy potential of fossil fuel, Table 5 displays the energy supply potential of switchgrass on the marginal land of the Loess Plateau within and below the ranges of current fossil fuel prices. The detailed value of all AMP scenarios can be found in Supplemental Table S1. Switchgrass can provide 49–90% of its total potential energy under the upper price of thermal coal and natural gas, and 30–50% of its total energy, which is very attractive, as it can provide below the lower price range of thermal coal and natural gas. Compared to the higher price of crude oil, switchgrass biomass is competitive, as 88–98% of the total energy can be supplied under the upper crude oil price and 61–93% can be supplied under the lower price range.
Unfortunately, there is currently no switchgrass feedstock market in China. The cellulose feedstock market in China is mainly composed of the straw and residue of wheat, corn, and peanut, which is used for forage or pellet fuel. The market price of straw bales in the Loess Plateau region is approximately 400–500 CNY t−1, while chopped straw is around 400–1000 CNY t−1. Table 5 depicts the area and potential feedstock that is within and below market price. There is 2.1–6.3 Mha marginal land that has the potential to supply 53–79 Tg feedstock within the range of the straw and residue market price, of which 3.9 Mha, 2.3 Mha, and 1.8 Mha marginal land is competitive and supplies 66 Tg SB, 55 Tg LB, and 50 Tg CP at a price lower than market price.
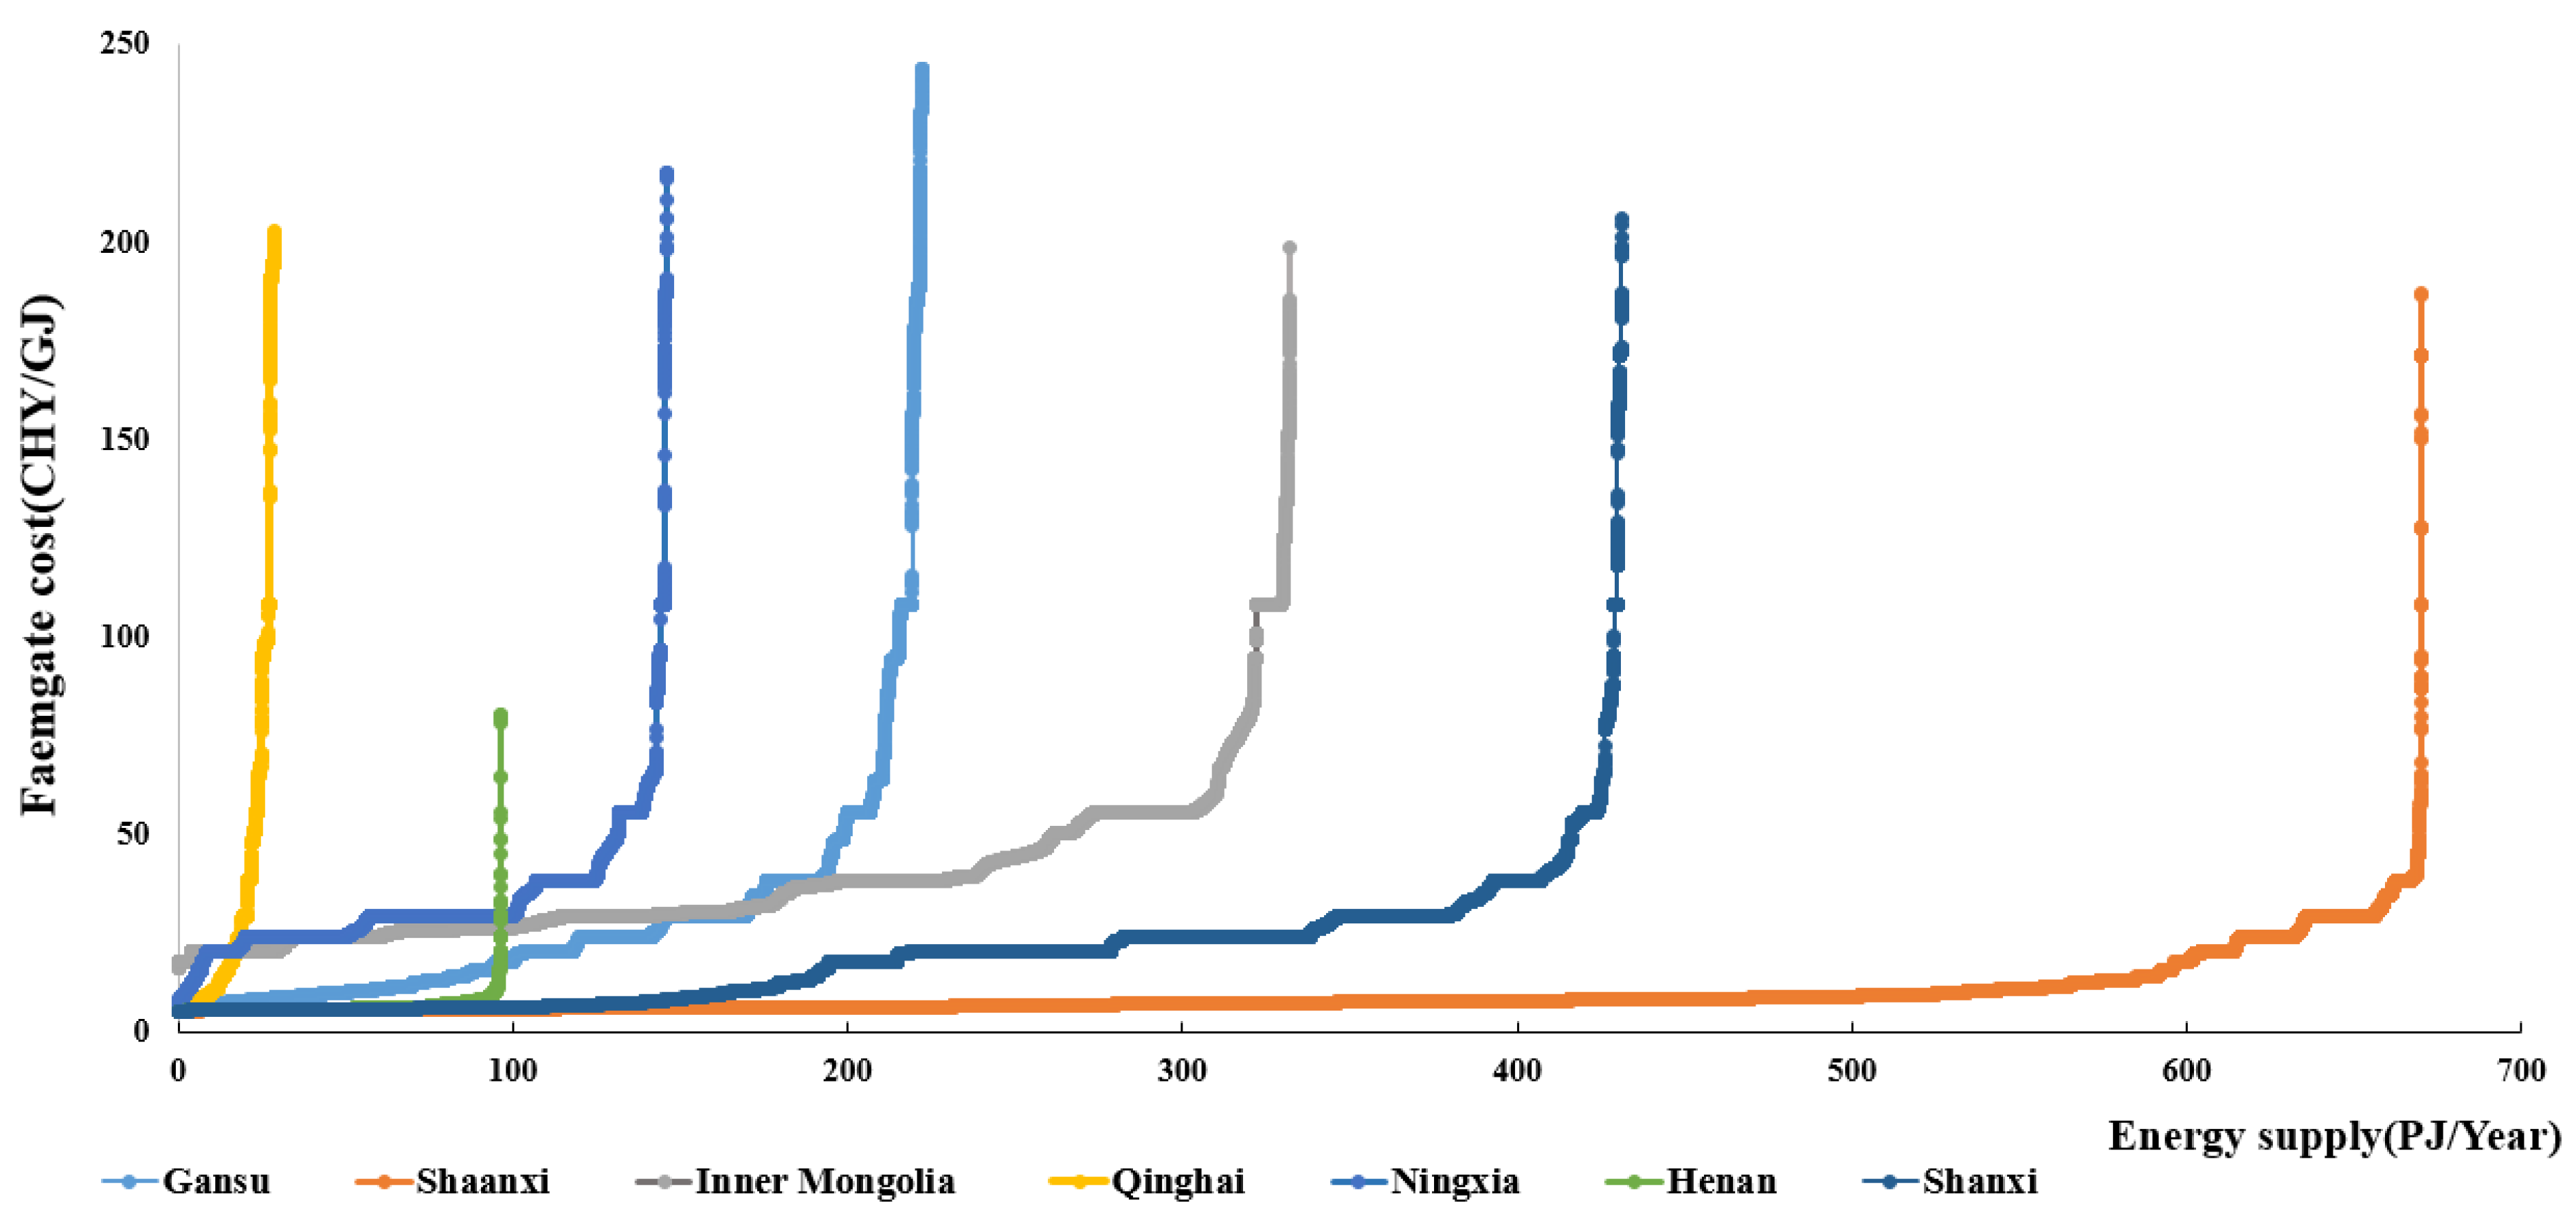
To demonstrate the energy supply potential in each province of the Loess Plateau, the provincial cost–supply curves of the AMP scenario with the lowest cost (CT_SB) were constructed (Figure 10). Table 6 depicts the total energy potential and the potential energy supply under the price of thermal coal ranges 13 CNY GJ−1 (2 USD GJ−1) and 26 CNY GJ−1(4 USD GJ−1) in each province. Shaanxi has the largest energy supply potential amongst provinces with the capability to provide 574 PJ (86%) and 633 PJ (94%) under the cost of 13 CNY GJ−1 and 26 CNY GJ−1, respectively. Shaanxi has the potential to supply a considerable amount of energy even lower in price, for example, 500 PJ (75%) and 200 PJ (30%) energy could be supplied with a feedstock cost under the price of 1.4 USD GJ−1 and 1.0 USD GJ−1, respectively. This is mainly due to the large area of the southeast of Shaanxi where switchgrass is very productive and hence the FGFP cost is low. Similar to Shaanxi, Shanxi is also a productive region for switchgrass such that 339 PJ and 185 PJ of energy can be sold under the prices of 13 CNY GJ−1 and 26 CNY GJ−1, respectively. Gansu also has a large energy potential such that 74 PJ (33%) and 143 PJ (64%) could be supplied under the price of 13 CNY GJ−1 and 26 CNY GJ−1, respectively. Even though up to 332 PJ energy could be technologically produced in the Inner Mongolia region, located north of the Loess Plateau, the yield in some areas is relatively low, which leads to a higher production cost. Consequently, it cannot supply energy under the price of 2 USD GJ−1, and can only supply 20% (68 PJ) of its potential energy under the price of 4 USD GJ−1. Ningxia has a similar profile to Inner Mongolia, as it can supply 5% (5 PJ) and 36% (53 PJ) of its technical potential energy under the price of 2 USD GJ−1 and 4 USD GJ−1, respectively. The areas of Qinghai and Henan, located in the Loess Plateau, are very small and their energy supply potentials are very different. Henan is located in the south part of the Loess Plateau in a productive region, where it can provide 99% (96 PJ) of its energy under 2 USD GJ−1, and even 90% (87PJ) under the lower cost of 1.2 USD GJ−1, while Qinghai is located in the west, where the yield of switchgrass is low and can supply 12 PJ of energy under the price of 2 USD GJ−1, and 19 PJ of energy under the price of 4 USD GJ−1.

4. Discussion

4.1. Results Discussion

It seems that the average cost for each harvest method is insensitive to the cultivation method. The findings of this research are credible, based on the survey data of the Loess Plateau at the time and a trusted methodology. There are two main reasons that result in the negligible difference amongst cultivation methods: (1) Even while there is little difference in the overall cost of cultivation, there are differences in the cost of the individual components. Some components for a given cultivation method are expensive, while others are cheap. For another cultivation method, the opposite is true. For example, CT requires more machinery intensity than NT, which raises the cost of fuel and labor, while CT’s machinery is substantially less expensive to purchase than NT’s. However, the overall cost of CT and NT does not vary all that much. (2) The scale of the calculation has a significant impact on the price. When working on huge farmlands, it is typically more profitable to use large agricultural machinery. In this study, the calculation is based on the 1 km2 grid, which makes the cultivation cost not differ too much amongst cultivation methods. There would be much difference if the scale of the calculation changed.

4.2. The Advancement of This Study

This study explored the economic performance of growing switchgrass on the marginal land of the Loess Plateau in a spatially explicit way. This study makes advancements in the methodology and input data in assessing FGFP. (1) The accuracy of the yield data has a significant impact on the cost assessments because some of the factors are cost “per hectare”, and the cost “per t” decreases with the increase in the yield for a hectare. In addition, some of the cost items are closely related to yield, such as the fertilizer amount. FGFP cost decreases from 5105 to 146 CNY t−1 when yield increases from 1 to 45 t ha−1 (Supplemental Figure S7). In this study, the precise spatially explicit switchgrass yield data that were predicted using the cultivar-specific SwitchFor model [47] were used in the calculation. The assessment results were highly improved by distinguishing the yield, seed application rate, and fertilizer application rate (yield-based) between upland and lowland switchgrass. (2) Land rent plays a very important role in the cost, which accounts for 15–34% of the FGFP cost with an average upland switchgrass yield of 5 t ha−1. In this study, the marginal land quality data on the Loess Plateau derived from our previous study [13] was used as a proxy to generate a spatial land rent map. The land quality was assessed by fully considering the spatial variation in the climate, soil properties, and topography across the marginal land of the Loess Plateau, and the calculation was based on high-resolution data. The spatially explicit land rent data generated in this study made much improvement on the FGFP cost compared with previous studies. If more factors such as accessibility to economic activities, neighborhood amenities, geographic locations, and transportation linkages are added in the future, the results could be improved more.

4.3. Uncertainties, Limitations of This Study, and Suggestions

However, there are still uncertainties regarding FGFP assessment. (1) The morphological differences between upland and lowland switchgrass was not taken into account in this study. The morphological differences, such as leaf share and stem diameter, might impact the working efficiency of agricultural machines during harvest, which would consequently impact the machinery-related cost [18,70,71]. (2) The results demonstrated that the cultivation cost is almost the same amongst the cultivation methods, while RT and NT reduced machinery use intensity and savings in fuel costs and labor. RT and NT have been demonstrated to benefit soil structure and soil nutrients. However, it does not mean that NT is always the best option in a given location on the Loess Plateau. This is because RT and NT are likely to cause yield reduction [33], loss of control of aggressive local weeds, and soil compaction, and the heavy stubble can be an intractable problem for RT and NT seeder operations, which require extra measures to clean stubble. All these may result in extra cost, which was not considered in the cost calculation in this study. Moreover, the fertilizer and herbicide application rates that might vary among cultivation methods were not distinguished because of the lack of data and might cause some uncertainties. (3) The harvesting cost of three formats of biomass was accessed in this study, and the results demonstrated that the harvest cost sequence is CP > LB > SB. However, the cost ultimately depends on the feedstock format preferred by the end user and the transportation distance from the farm to the factory or power station. The transportation cost, storage cost, and pretreatment cost are closely dependent on the feedstock format. The harvesting costs of the three different feedstock formations assessed in this study provide a reference for the cost assessment of future supply chains.
The limited available data from the field trials of switchgrass on the marginal land of the Loess Plateau region are the largest obstacle to evaluating the potential of switchgrass. As the marginal land of the Loess Plateau is slope land, low-quality land, and soil and wind erosion land, planting energy crops on the marginal land by choosing the right cultivation methods will benefit ecological restoration. We recommend that tillage experiments be conducted on the marginal land of the Loess plateau beforehand to provide information to choose the best options for large-scale plantations. In addition, more field trials should be conducted to provide more reliable and practical information in diverse environmental and soil conditions. There are possibilities to make some improvements to the assessment if the related data are available in the future.

5. Conclusions

This study evaluated the switchgrass FGFP cost and supply potential of the marginal land of the Loess Plateau in a spatially explicit way by fully considering the spatial variation in soil properties, land quality, and crop yield. The assessment was conducted in parallel under different AMP scenarios. The results demonstrated that harvest methods significantly impacted FGFP cost, while cultivation methods had a limited impact on it. The FGFP cost varied across the Loess Plateau with estimated ranges of 95–4399 CNY t−1, 120–5700 CNY t−1, and 140–7400 CNY t−1 for SB, LB, and CP, respectively. The lower FGFP cost region is located in the south and southeast areas of the Loess Plateau. Compared with the market price of fossil fuel in 2020, 49–98% of the total energy could be supplied under the upper price of thermal coal, natural gas, and crude oil, and 30–93% of its total energy is attractive as it could be supplied below the lower price range. These results demonstrated that the marginal land of the Loess Plateau region holds considerable potential to produce bioenergy from the perspective of the economic feasibility. The spatially explicit FGFP cost and potential supply information for switchgrass on the marginal land of the Loess Plateau can provide information to farmers, investigators, and policymakers to make decisions on choosing the optimal locations to plant switchgrass that are most profitable. The methodology provides a framework for the economic evaluation of perennial energy crops’ FGFP in a spatially explicit way.

Supplementary Materials

The following supporting information can be downloaded at: https://www.mdpi.com/article/10.3390/en16145282/s1, Figure S1:The dynamic yield of switchgrass during the 20-year life cycle of switchgrass. The switchgrass starts to accumulate biomass yield in the 0th year, and the yield reaches the peak in the 4th year. The peak yield remains constant until the 15th year and declines by 5% per year from the 15th year until the 20th year; Figure S2: The spatially explicit yield of the peak yield of switchgrass on the marginal land of the Loess Plateau. The yield map was the optimal yield map derived from the research of Liu et al. [47]. In the Liu et al.’s research, the upland and lowland switchgrass yields were estimated separately using a genotype-specific SwitchFor model and the optimal switchgrass yield distribution map was generated by comparing the upland and lowland switchgrass yields and extracting the higher yield in each 1 km2 grid.; Figure S3: The spatially explicit rent of the marginal land; Figure S4: The spatially explicit of soil PH; Figure S5: The spatially explicit of Soil P; Figure S6: The spatially explicit of soil K; Figure S7: The cost breakdown of the switchgrass feedstock production cost. (a) Upland switchgrass; (b) Lowland switchgrass; Table S1: The energy supply on the marginal land of the Loess plateau.

Author Contributions

Y.L. contributed to conceptualization, methodology, software, validation, formal analysis, investigation, resources, data curation, writing—original draft preparation, writing—review and editing, visualization, and funding acquisition. A.F. contributed to conceptualization, methodology, validation, writing—review and editing, supervision, and project administration. A.H. contributed to conceptualization, methodology, validation, writing—review and editing, supervision, and funding acquisition. S.C. contributed to conceptualization, methodology, validation, writing—review and editing, supervision, project administration, and funding acquisition. All authors have read and agreed to the published version of the manuscript.

Funding

This study was supported by the Chinese Scholarship Council (CSC) and partially supported by the National Key Project of Intergovernmental Cooperation in International Scientific and Technological Innovation (2018YFE0112400 to SC). Astley Hastings was funded by the ADVENT project funded by the UK Natural Environment Research Council (NE/M019691/1) and ADVANCES funded by the UK Natural Environment Research Council (NE/M019691/1), EPSRC-funded UKERC-4, and the BBSRC-funded PCB4GGR project (BB/V011553/1).

Data Availability Statement

The basic data on land use, climate, and soil properties were supported by the Loess Plateau Data Center, the National Earth System Science Data Sharing Infrastructure, and the National Science & Technology Infrastructure of China (http://loess.geodata.cn (accessed on 1 January 2021). The marginal land data and land suitability data of the Loess Plateau are available in [13]. The spatially explicit yield data of switchgrass on the Loess plateau are available in [47], and the data can download at https://figshare.com/articles/figure/Spatial_distribution_of_the_yield_biomass_of_switchgrass_on_the_marginal_land_of_the_Loess_plateau/21047224 (accessed on 6 May 2022).

Acknowledgments

We thank Chao Zhong from the business school of Beijing Normal University for his contribution to drawing some graphics with STATA. We also thank Bingquan Zhang from Yale School of Environment for his knowledge of some data and calculations.

Conflicts of Interest

All authors declare that they have no conflict of interest.

References

  1. IEA. China Has a Clear Pathway to Build a More Sustainable, Secure and Inclusive Energy Future. Available online: https://www.iea.org/news/china-has-a-clear-pathway-to-build-a-more-sustainable-secure-and-inclusive-energy-future (accessed on 4 October 2021).
  2. Zheng, X.; Lu, Y.; Yuan, J.; Baninla, Y.; Zhang, S.; Stenseth, N.C.; Hessen, D.O.; Tian, H.; Obersteiner, M.; Chen, D. Drivers of Change in China’s Energy-Related CO2 Emissions. Proc. Natl. Acad. Sci. USA 2020, 117, 29–36. [Google Scholar] [CrossRef] [PubMed] [Green Version]
  3. The State Council the People’s Republic of China. China Maps Path to Carbon Peak, Neutrality under New Development Philosophy. Available online: http://english.www.gov.cn/policies/latestreleases/202110/24/content_WS61755fe9c6d0df57f98e3bed.html#:~:text=By2030%2CChina’scarbondioxide,reiteratingthecountry’spreviouspledge (accessed on 4 October 2021).
  4. Appels, L.; Lauwers, J.; Degrve, J.; Helsen, L.; Lievens, B.; Willems, K.; Van Impe, J.; Dewil, R. Anaerobic Digestion in Global Bio-Energy Production: Potential and Research Challenges. Renew. Sustain. Energy Rev. 2011, 15, 4295–4301. [Google Scholar] [CrossRef]
  5. NDRC. China’s 14th Five-Year Plan. Available online: https://www.ndrc.gov.cn/xxgk/zcfb/ghwb/202203/t20220322_1320016.html (accessed on 10 May 2023).
  6. National Energy Administration China’s Installed Renewable Power Capacity Has Exceeded 1 Billion KW. Available online: http://www.nea.gov.cn/2021-11/20/c_1310323021.htm (accessed on 6 July 2022).
  7. Central Budjet and Final Accounts Public Platform Notice of the Ministry of Finance on Allocating the Budget of Local Funds for Additional Subsidies for Renewable Energy Electricity Prices in 2022 Ahead of Schedule. Available online: http://www.mof.gov.cn/zyyjsgkpt/zyddfzyzf/zfxjjzyzf/kzsnydjfjsr/202111/t20211116_3766024.htm (accessed on 4 October 2021).
  8. Zheng, Y.H.; Li, Z.F.; Feng, S.F.; Lucas, M.; Wu, G.L.; Li, Y.; Li, C.H.; Jiang, G.M. Biomass Energy Utilization in Rural Areas May Contribute to Alleviating Energy Crisis and Global Warming: A Case Study in a Typical Agro-Village of Shandong, China. Renew. Sustain. Energy Rev. 2010, 14, 3132–3139. [Google Scholar] [CrossRef]
  9. Berndes, G. Bioenergy, Land Use Change and Climate Change Mitigation—Background Technical Report. Rep. Policy Advis. Policy Makers. IEA Bioenergy ExCo 2011, 3, 1–62. [Google Scholar]
  10. Von Cossel, M.; Wagner Lask, J.; Magenau, E.; Bauerle, A.; Cossel, V.; Von Warrach-Sagi, K.; Elbersen, B.; Staritsky, I.; van Eupen, M. Prospects of Bioenergy Cropping Systems for a More Social-Ecologically Sound Bioeconomy. Agronomy 2019, 9, 605. [Google Scholar] [CrossRef] [Green Version]
  11. Zhao, G.; Mu, X.; Wen, Z.; Wang, F.; Gao, P. Soil Erosion, Conservation, and Eco-Environment Changes in the Loess Plateau of China. L. Degrad. Dev. 2013, 24, 499–510. [Google Scholar] [CrossRef]
  12. NDRC. Outline of Comprehensive Control Plan for Loess Plateau Region 2010–2030; NDRC: Beijing, China, 2010.
  13. Liu, Y.; Chen, S.; von Cossel, M.; Xu, B.; Gao, H.; Jiang, R.; Faaij, A. Evaluating the Suitability of Marginal Land for a Perennial Energy Crop on the Loess Plateau of China. GCB Bioenergy 2021, 13, 1388–1406. [Google Scholar] [CrossRef]
  14. Monti, A. Switchgrass: A Valuable Biomass Crop for Energy; Green Energy and Technology; Springer: Berlin/Heidelberg, Germany, 2012; Volume 94. [Google Scholar] [CrossRef]
  15. Quinn, L.D.; Straker, K.C.; Guo, J.; Kim, S.; Thapa, S.; Kling, G.; Lee, D.K.; Voigt, T.B. Stress-Tolerant Feedstocks for Sustainable Bioenergy Production on Marginal Land. Bioenergy Res. 2015, 8, 1081–1100. [Google Scholar] [CrossRef] [Green Version]
  16. Griffith, A.P.; Epplin, F.M.; Redfearn, D.D. Cost of Producing Switchgrass for Biomass Feedstock; Oklahoma State University: Stillwater, OK, USA, 2010; pp. 1–7. [Google Scholar]
  17. Jacobson, M.; Helsel, Z. NEWBio Switchgrass Budget for Biomass Production. Penn State Coll. Agric. Sci. Res. Ext. Progr. 2014. Available online: https://extension.psu.edu/newbio-switchgrass-budget-for-biomass-production (accessed on 9 October 2021).
  18. Hastings, A.; Mos, M.; Yesufu, J.A.; McCalmont, J.; Schwarz, K.; Shafei, R.; Ashman, C.; Nunn, C.; Schuele, H.; Cosentino, S.; et al. Economic and Environmental Assessment of Seed and Rhizome Propagated Miscanthus in the UK. Front. Plant Sci. 2017, 8, 1058. [Google Scholar] [CrossRef] [Green Version]
  19. Smeets, E.M.W.; Lewandowski, I.M.; Faaij, A.P.C. The Economical and Environmental Performance of Miscanthus and Switchgrass Production and Supply Chains in a European Setting. Renew. Sustain. Energy Rev. 2009, 13, 1230–1245. [Google Scholar] [CrossRef]
  20. Smith, S.R.; Schwer, L.; Keene, T.; Sena, K. Switchgrass for Biomass Production in Kentucky. In Proceedings of the4-H Youth Development Center at Lone Oaks Farm, Middleton, TN, USA, 22 May 2011; Available online: http://www2.ca.uky.edu/agcomm/pubs/agr/agr201/agr201.pdf (accessed on 8 August 2022).
  21. Fike, J.H.; Pease, J.W.; Owens, V.N.; Farris, R.L.; Hansen, J.L.; Heaton, E.A.; Hong, C.O.; Mayton, H.S.; Mitchell, R.B.; Viands, D.R. Switchgrass Nitrogen Response and Estimated Production Costs on Diverse Sites. GCB Bioenergy 2017, 9, 1526–1542. [Google Scholar] [CrossRef]
  22. English, B.C.; Yu, T.-H.E.; Larson, J.A.; Menard, R.J.; Gao, Y. Economic Impacts of Using Switchgrass as a Feedstock for Ethanol Production: A Case Study Located in East Tennessee. Econ. Res. Int. 2013, 2013, 138485. [Google Scholar] [CrossRef] [Green Version]
  23. Yu, T.E.; English, B.C.; He, L.; Larson, J.A.; Calcagno, J.; Fu, J.S.; Wilson, B. Analyzing Economic and Environmental Performance of Switchgrass Biofuel Supply Chains. Bioenergy Res. 2016, 9, 566–577. [Google Scholar] [CrossRef]
  24. Clifton-Brown, J.; Harfouche, A.; Casler, M.D.; Dylan Jones, H.; Macalpine, W.J.; Murphy-Bokern, D.; Smart, L.B.; Adler, A.; Ashman, C.; Awty-Carroll, D.; et al. Breeding Progress and Preparedness for Mass-Scale Deployment of Perennial Lignocellulosic Biomass Crops Switchgrass, Miscanthus, Willow and Poplar. GCB Bioenergy 2019, 11, 118–151. [Google Scholar] [CrossRef] [Green Version]
  25. Perrin, R.; Vogel, K.; Schmer, M.; Mitchell, R. Farm-Scale Production Cost of Switchgrass for Biomass. BioEnergy Res. 2008, 1, 91–97. [Google Scholar] [CrossRef] [Green Version]
  26. Perrin, R. The Economics of Switchgrass for Biofuel. Available online: https://farm-energy.extension.org/the-economics-of-switchgrass-for-biofuel/ (accessed on 2 May 2023).
  27. Agricultural Marketing Resource Center Switchgrass. Available online: https://www.agmrc.org/commodities-products/biomass/switchgrass (accessed on 9 May 2023).
  28. Duffy, M. Estimated Costs for Production, Storage, and Transportation of Switchgrass; Iowa State University, Department of Economics: Ames, IA, USA, 2008; pp. 1–8. [Google Scholar]
  29. Duchemin, M.; Jégo, G.; Morissette, R. Simulating Switchgrass Aboveground Biomass and Production Costs in Eastern Canada with the Integrated Farm System Model. Can. J. Plant Sci. 2019, 99, 785–800. [Google Scholar] [CrossRef]
  30. Zhang, B.; Hastings, A.; Clifton-Brown, J.C.; Jiang, D.; Faaij, A.P.C. Spatiotemporal Assessment of Farm-Gate Production Costs and Economic Potential of Miscanthus × Giganteus, Panicum virgatum L., and Jatropha Grown on Marginal Land in China. GCB Bioenergy 2020, 12, 310–327. [Google Scholar] [CrossRef] [Green Version]
  31. Shuai, X. Benefit-Cost Analysis and Utilization Potential Evaluation of Different Miscanthus Progagation System. J. China Agric. Univ. 2013, 18, 27–34. [Google Scholar]
  32. Van Der Hilst, F. Location, Location, Location. Nat. Energy 2018, 3, 164–165. [Google Scholar] [CrossRef]
  33. Morris, N.L.; Miller, P.C.H.; Orson, J.H.; Froud-Williams, R.J. The Adoption of Non-Inversion Tillage Systems in the United Kingdom and the Agronomic Impact on Soil, Crops and the Environment-A Review. Soil Tillage Res. 2010, 108, 1–15. [Google Scholar] [CrossRef]
  34. Kwaśniewski, D.; Płonka, A.; Mickiewicz, P. Harvesting Technologies and Costs of Biomass Production from Energy Crops Cultivated on Farms in the Małopolska Region. Energies 2022, 15, 131. [Google Scholar] [CrossRef]
  35. Townsend, T.J.; Ramsden, S.J.; Wilson, P. Analysing Reduced Tillage Practices within a Bio-Economic Modelling Framework. Agric. Syst. 2016, 146, 91–102. [Google Scholar] [CrossRef] [PubMed]
  36. Townsend, T.J.; Ramsden, S.J.; Wilson, P. How Do We Cultivate in England? Tillage Practices in Crop Production Systems. Soil Use Manag. 2016, 32, 106–117. [Google Scholar] [CrossRef] [Green Version]
  37. Gonzales, D.; Searcy, E.M.; Ekşioĝlu, S.D. Cost Analysis for High-Volume and Long-Haul Transportation of Densified Biomass Feedstock. Transp. Res. Part A Policy Pract. 2013, 49, 48–61. [Google Scholar] [CrossRef]
  38. Suardi, A.; Bergonzoli, S.; Alfano, V.; Scarfone, A.; Pari, L. Economic Distance to Gather Agricultural Residues from the Field to the Integrated Biomass Logistic Centre: A Spanish Case-Study. Energies 2019, 12, 3086. [Google Scholar] [CrossRef] [Green Version]
  39. Bacenetti, J. Economic and Environmental Impact Assessment of Renewable Energy from Biomass. Sustainability 2020, 12, 5619. [Google Scholar] [CrossRef]
  40. Choi, H.S.; Grethe, H.; Entenmann, S.K.; Wiesmeth, M.; Blesl, M.; Wagner, M. Potential Trade-Offs of Employing Perennial Biomass Crops for the Bioeconomy in the EU by 2050: Impacts on Agricultural Markets in the EU and the World. GCB Bioenergy 2019, 11, 483–504. [Google Scholar] [CrossRef]
  41. McCalmont, J.P.; Hastings, A.; McNamara, N.P.; Richter, G.M.; Robson, P.; Donnison, I.S.; Clifton-Brown, J. Environmental Costs and Benefits of Growing Miscanthus for Bioenergy in the UK. GCB Bioenergy 2017, 9, 489–507. [Google Scholar] [CrossRef]
  42. Sanderson, M. Crop Management of Switchgrass; Green Energy and Technology; Springer: London, UK, 2012; Volume 94. [Google Scholar] [CrossRef] [Green Version]
  43. Cooney, D.; Kim, H.; Quinn, L.; Lee, M.S.; Guo, J.; Chen, S.; Xu, B.; Lee, D.K. Switchgrass as a Bioenergy Crop in the Loess Plateau, China: Potential Lignocellulosic Feedstock Production and Environmental Conservation. J. Integr. Agric. 2017, 16, 1211–1226. [Google Scholar] [CrossRef]
  44. Zhuang, J.; Liang, Z.; Lin, T.; De Guzman, F. Theory and Practice in the Choice of Social Discount Rate for Cost-Benefit Analysis: A Survey; Asian Development Bank: Metro Manila, Philippines, 2007. [Google Scholar]
  45. Arundale, R.A.; Dohleman, F.G.; Heaton, E.A.; Mcgrath, J.M.; Voigt, T.B.; Long, S.P. Yields of Miscanthus × Giganteus and Panicum virgatum Decline with Stand Age in the Midwestern USA. GCB Bioenergy 2014, 6, 1–13. [Google Scholar] [CrossRef]
  46. Lesur, C.; Jeuffroy, M.; Makowski, D.; Riche, A.B.; Shield, I.; Yates, N.; Fritz, M.; Formowitz, B.; Grunert, M.; Jorgensen, U.; et al. Field Crops Research Modeling Long-Term Yield Trends of Miscanthus × Giganteus Using Experimental Data from across Europe. F. Crops Res. 2013, 149, 252–260. [Google Scholar] [CrossRef]
  47. Liu, Y.; Hasting, A.; Chen, S.; Xu, B.; Faaij, A.P.C. SwitchFor: A New Crop Growth Model for Yield Mapping of Switchgrass. GCB Bioenergy 2022, 14, 1281–1302. [Google Scholar] [CrossRef] [PubMed]
  48. ASAE/ASABE D497.7 (R2020); Agricultural Machinery Management Data; ASAE: Washington, DC, USA, 2020.
  49. Smeets, E.M.W.; Bouwman, L.F.; Stehfest, E.; van Vuuren, D.P.; Posthuma, A. Contribution of N2O to the Greenhouse Gas Balance of First-Generation Biofuels. Glob. Chang. Biol. 2009, 15, 1–23. [Google Scholar] [CrossRef]
  50. Zhang, B.; Xu, J.; Lin, Z.; Lin, T.; Faaij, A.P.C. Spatially Explicit Analyses of Sustainable Agricultural Residue Potential for Bioenergy in China under Various Soil and Land Management Scenarios. Renew. Sustain. Energy Rev. 2021, 137, 110614. [Google Scholar] [CrossRef]
  51. Douglas, J.; Lemunyon, J.; Wynia, R.S.P. Planting and Managing Switchgrass as a Biomass Energy Crop; Natural Resources Conservation Service, US Department of Agriculture: New York, NY, USA, 2009. [CrossRef]
  52. Shankle, M.W.; Garrett, T.F. Switchgrass Production as a Bioenergy Crop in Mississippi; Office of Agricultural Communications, Division of Agriculture, Forestry and Veterinary Medicine at Mississippi State University: Starkville, MS, USA, 2014. [Google Scholar]
  53. Rehm, G.W. Yield and Quality of a Warm-Season Grass Mixture Treated with N, P, and Atrazine. Agron. J. 1984, 76, 731–734. [Google Scholar] [CrossRef]
  54. Muir, J.P.; Sanderson, M.A.; Ocumpaugh, W.R.; Jones, R.M.; Reed, R.L. Biomass Production of “Alamo” Switchgrass in Response to Nitrogen, Phosphorus, and Row Spacing. Agron. J. 2001, 93, 896–901. [Google Scholar] [CrossRef]
  55. Axelsson, L.; Franzén, M.; Ostwald, M.; Berndes, G.; Lakshmi, G.; Ravindranath, N.H. Perspective: Jatropha Cultivation in Southern India: Assessing Farmers’ Experiences. Biofuels Bioprod. Biorefin. 2012, 6, 246–256. [Google Scholar] [CrossRef]
  56. Elbersen, H.W.; Poppens, R.P.; Bakker, R.R.C. Switchgrass (Panicum virgatum L.). A Perennial Biomass Grass for Efficient Production of Feedstock for the Biobased Economy; NL Agency, Ministry of Economic Affairs, Agriculture and Innovation: Utrecht, The Netherlands, 2013.
  57. Rothbart, P.; Capel, S. Chapter 3. Maintaining and Restoring Grasslands. In Comparative and General Pharmacology; 2006; pp. 14–27. Available online: https://dep.nj.gov/njfw/wp-content/uploads/njfw/ch03_maintaining_grasslands.pdf (accessed on 4 July 2023).
  58. Samson, R.; Delaquis, E.; Deen, B.; Debruyn, J.; Eggimann, U. Switchgrass Agronomy; Ontario Biomass Producers Co-Operative Inc.: Markdale, ON, Canada, 2016; p. 82. [Google Scholar]
  59. Radford, B.J. Effect of a Press Wheel and Depth of Sowing on the Establishment of Semidwarf and Tall Wheats. Aust. J. Exp. Agric. 1986, 26, 697–702. [Google Scholar] [CrossRef]
  60. Monti, A.; Venturi, P.; Elbersen, H.W. Evaluation of the Establishment of Lowland and Upland Switchgrass (Panicum virgatum L.) Varieties under Different Tillage and Seedbed Conditions in Northern Italy. Soil Tillage Res. 2001, 63, 75–83. [Google Scholar] [CrossRef]
  61. Mitchell, R.; Vogel, K.P.; Sarath, G. Managing and Enhancing Switchgrass as a Bioenergy Feedstock. Biofuels Bioprod. Biorefin. 2008, 2, 530–539. [Google Scholar] [CrossRef] [Green Version]
  62. Mitchell, J.L.B.; Barney, J.N. Cool Temperature Effects on Productivity and Photosynthesis of Two Biomass Fuel Species: Switchgrass (Panicum Virgatum) and Miscanthus (Miscanthus × Giganteus). Ph.D. Thesis, Virginia Tech, Blacksburg, VA, USA, 2012. [Google Scholar]
  63. Lee, D.K.; Boe, A. Biomass Production of Switchgrass in Central South Dakota. Crops Sci. 2005, 45, 2583–2590. [Google Scholar] [CrossRef]
  64. Sadeghpour, A.; Hashemi, M.; DaCosta, M.; Jahanzad, E.; Herbert, S.J. Switchgrass Establishment Influenced by Cover Crop, Tillage Systems, and Weed Control. Bioenergy Res. 2014, 7, 1402–1410. [Google Scholar] [CrossRef]
  65. Shield, I.F.; Barraclough, T.J.P.; Riche, A.B.; Yates, N.E. The Yield Response of the Energy Crops Switchgrass and Reed Canary Grass to Fertiliser Applications When Grown on a Low Productivity Sandy Soil. Biomass Bioenergy 2012, 42, 86–96. [Google Scholar] [CrossRef]
  66. FARM ENERGY. Control Weeds in Switchgrass (Panicum virgatum L.) Grown for Biomass. Available online: https://farm-energy.extension.org/control-weeds-in-switchgrass-panicum-virgatum-l-grown-for-biomass/#WhenUsingHerbicides (accessed on 19 July 2021).
  67. Plant Protection Technology. How to Use 2,4-D of Herbicides to Control Weeds in Wheat Fields. Available online: http://www.weinongzi.com/js/87.html (accessed on 19 July 2021).
  68. Renz, M.; Undersander, D.; Casler, M. Establishing and Managing Switchgrass. UW Ext. Factsheet 2009, 1–4. Available online: https://fyi.extension.wisc.edu/forage/establishing-and-managing-switchgrass/ (accessed on 10 January 2022).
  69. IEA. Coal Prices Withstand despite COVID-19 and Chinese Import Quotas; IEA: Paris, France, 2022. [Google Scholar]
  70. Van Esbroeck, G.A.; Hussey, M.A.; Sanderson, M.A. Variation between Alamo and Cave-in-Rock Switchgrass in Response to Photoperiod Extension. Crops Sci. 2003, 43, 639–643. [Google Scholar] [CrossRef]
  71. Aurangzaib, M.; Moore, K.J.; Lenssen, A.W.; Archontoulis, S.V.; Heaton, E.A.; Fei, S. Developmental Morphology and Biomass Yield of Upland and Lowland Switchgrass Ecotypes Grown in Iowa. Agronomy 2018, 8, 61. [Google Scholar] [CrossRef] [Green Version]
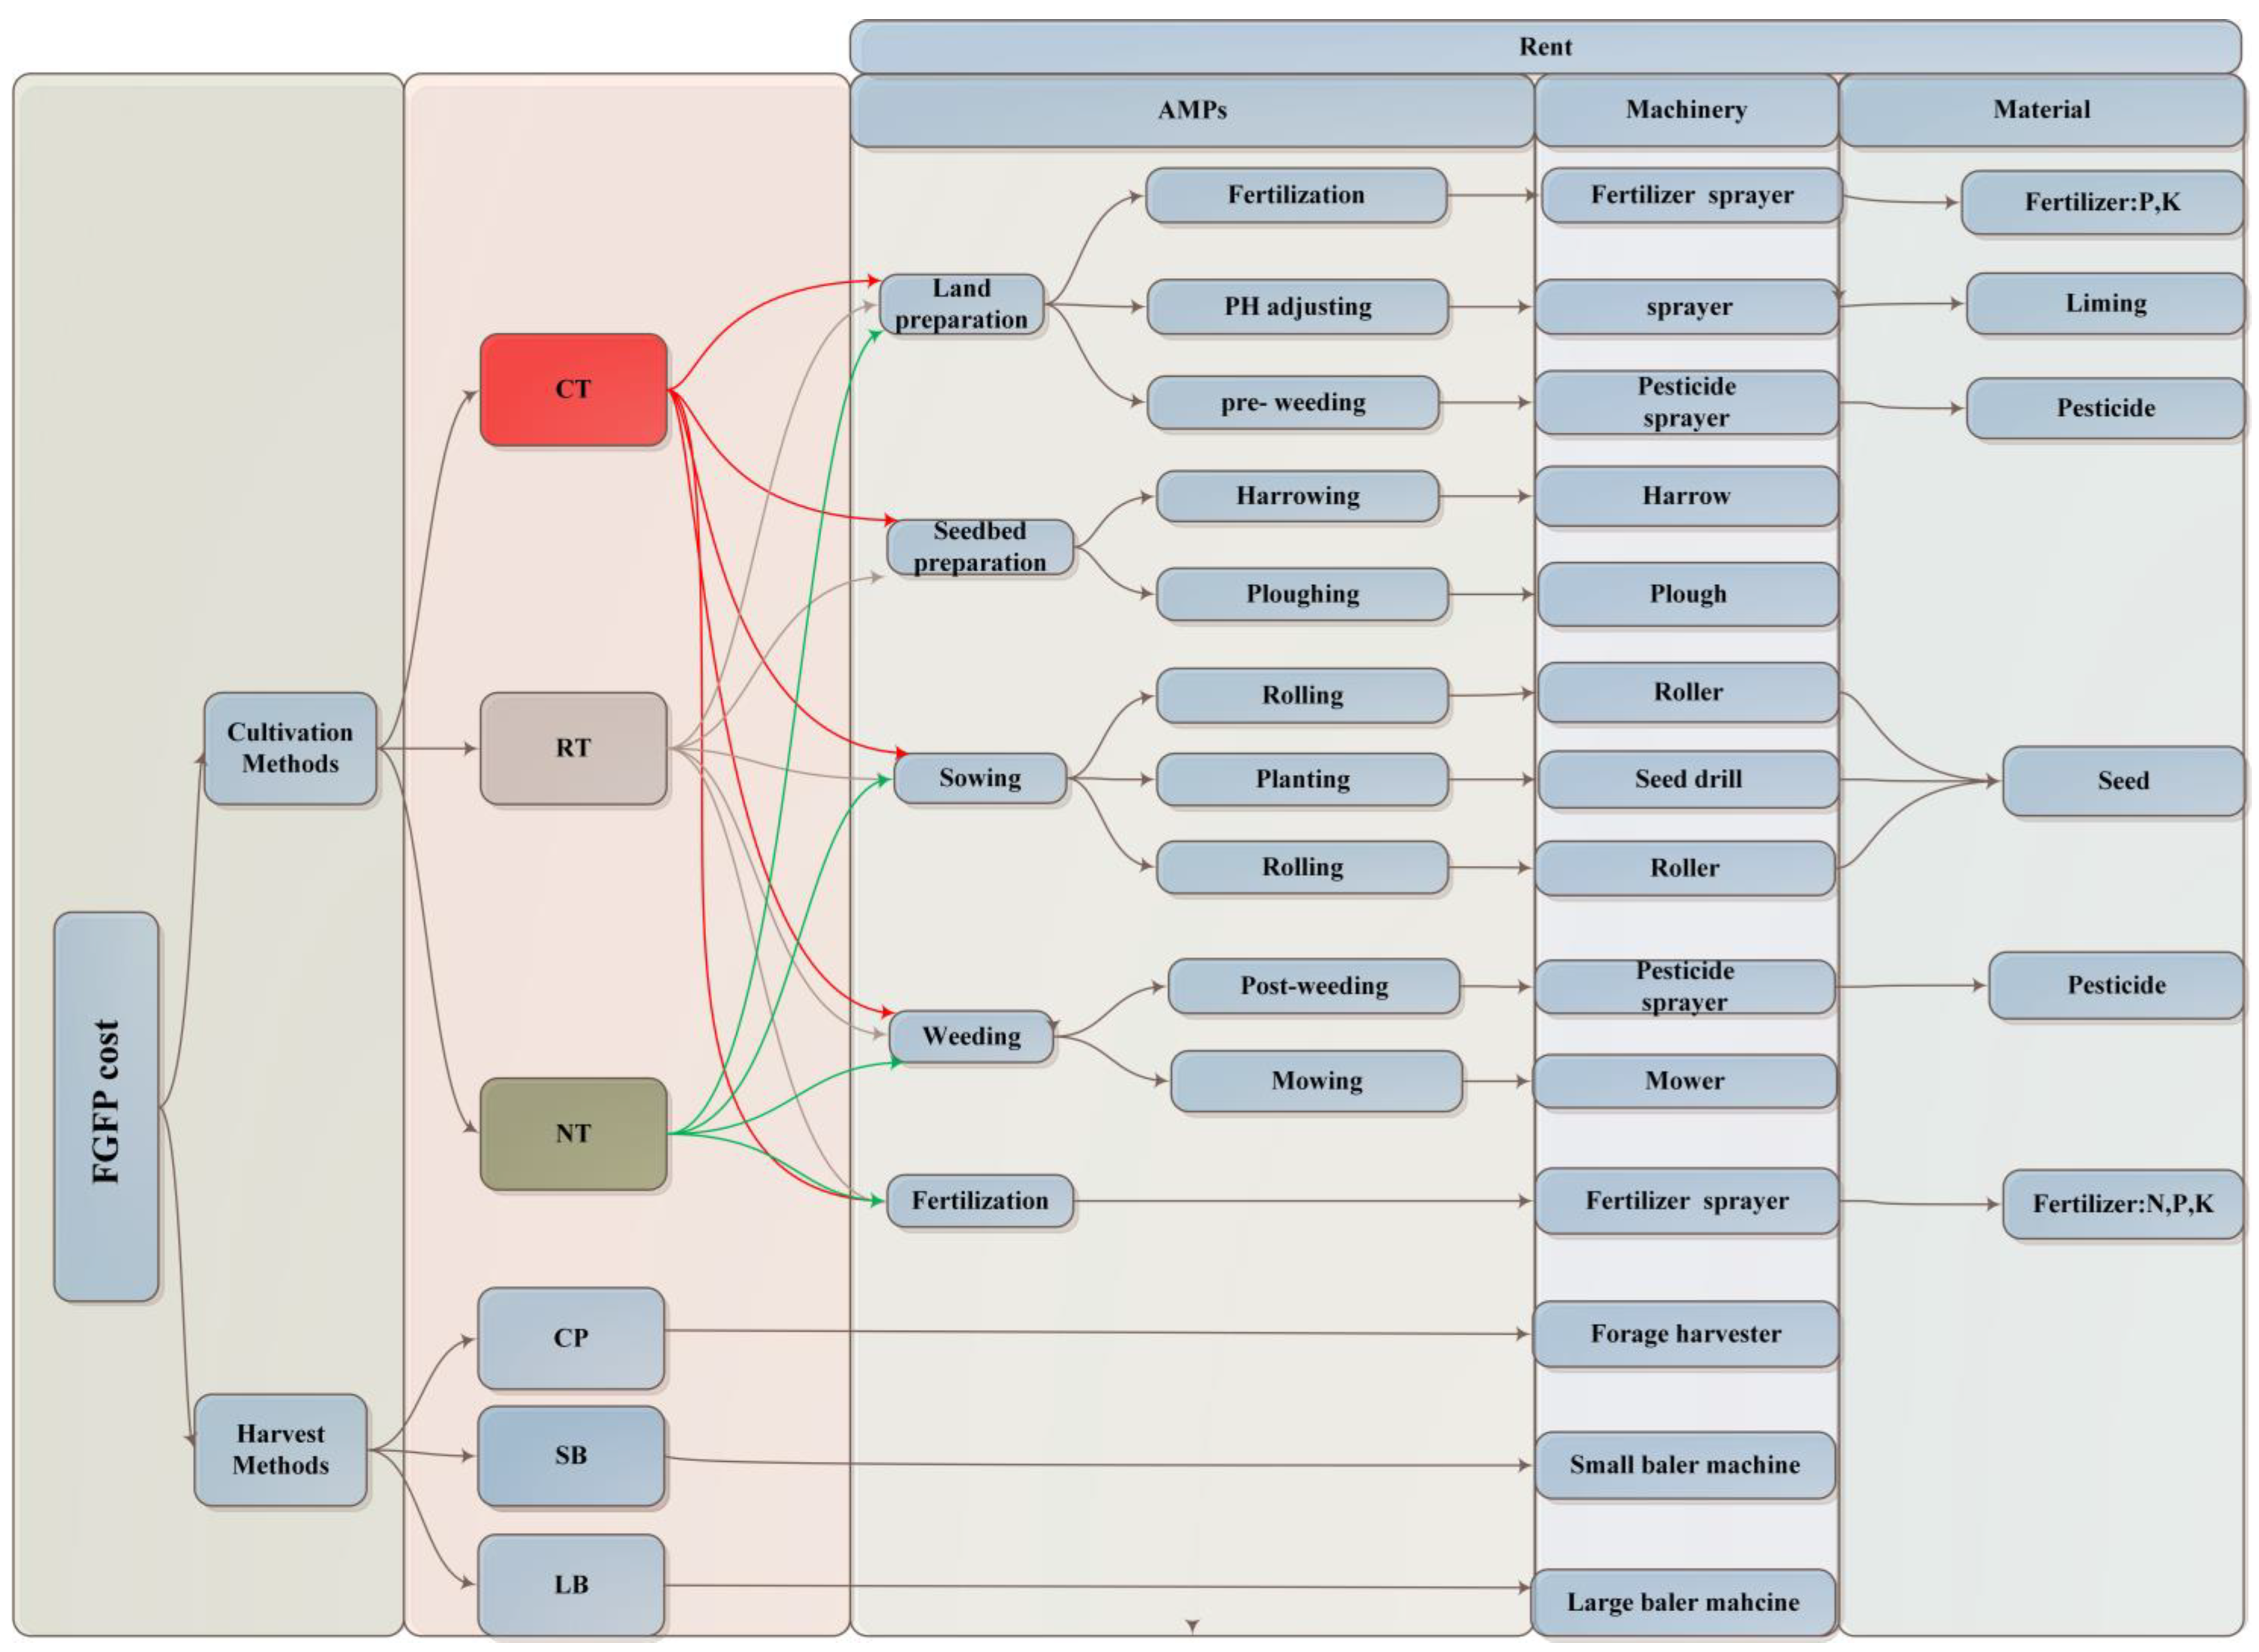
Figure 1. Flowchart of FGFP cost calculation under three cultivation methods (CT, RT, and NT) and three harvest methods (SB, LB, and CP) corresponding to different agricultural management practice (AMP) scenarios.
Energies 16 05282 g001
Figure 2. The components of FGFP cost.
Energies 16 05282 g002
Figure 3. The spatially explicit FGFP cost on the marginal land of the Loess Plateau under different AMP scenarios. (a) CT_SB; (b) CT_LB; (c) CT_CP; (d) LT_SB; (e) LT_LB; (f) LT_CP; (g) NT_SB; (h) NT_LB; (i) NT_CP.
Energies 16 05282 g003aEnergies 16 05282 g003b
Figure 4. FGFP (farm-gate feedstock production cost) cost breaks down with the average yield of upland and lowland switchgrass. (a) FGFP cost breaks down. (b) Percentage of the cost items of FGFP cost.
Energies 16 05282 g004
Figure 5. Cultivation cost breakdown of upland and lowland switchgrass under different yield levels. (a) CT, (b) LT, and (c) NT are for upland switchgrass; (d) CT, (e) LT, and (f) NT are for lowland switchgrass.
Energies 16 05282 g005
Figure 6. Cultivation cost breakdown of three cultivation methods under average yield of upland and lowland switchgrass. (a) Cultivation cost breakdowns; (b) percentage of cultivation cost breakdowns.
Energies 16 05282 g006
Figure 7. Harvest cost breakdown of (a) SB, (b) LB, and (c) CP.
Energies 16 05282 g007
Figure 8. Harvest cost breakdown of SB, LB, and CP under average optimal average switchgrass yield. (a) Harvest cost breakdowns; (b) percentage of harvest cost breakdowns.
Energies 16 05282 g008
Figure 9. Cost–supply curves of switchgrass on the marginal land of the Loess Plateau compared with the current market price of fossil fuel and residue (The pricing range for fossil fuels and residue is projected for 2020). (a) Global view graphic and (b) partial view graphic.
Energies 16 05282 g009
Figure 10. Cost–supply curves of switchgrass in provinces of the Loess Plateau.
Energies 16 05282 g010
Table 1. Agronomy management scheme of switchgrass during the 20-year lifetime.
Year0 b1234567891011121314151617181920
AMPs
Pre-weed weeding (herbicide)1
Ploughing a 1
Power harrowing a 2
Planting 1
Rolling (rolling before sowing + rolling after sowing) 2
Post-weeding (herbicide) 1
Mowing 1
Fertilization (NPK) 2121212121212121212
Mowing 1
Harvest 1111111111111111111
Notes: The numbers in the table stand for the times of the AMP in a certain year during the lifetime of switchgrass; 1 and 2 indicate first and second AMP. a: This AMP is not for NT; b: year 0 is the pre-year of the establishment year.
Table 4. The FGFP cost of different AMPscenarios.
Cultivation MethodsHarvest MethodsFGFP Cost Ranges (CNY t−1 )Weighted Average FGFP Cost (CNY t−1)
CTSB95–4350702
LB121–56201080
CP140–73311588
RTSB96–4399715
LB123–56691098
CP141–73801601
NTSB96–4391713
LB122–56621196
CP140–73731599
Table 5. The energy supply potential on the marginal land of the Loess Plateau compared to the current market price of fossil fuel and residue and the potential area for energy supply and its proportion to the overall area land of the Loess plateau (The pricing range for fossil fuels and the residue is projected for 2020).
Energy Supply (PJ year−1) Potential Energy Supply Area (Mha)Percentage of Potential Energy Supply Area Compared with the Total Area of the Loess Plateau (%)Energy Supply (PJ year−1) Potential Energy Supply Area
(Mha)
Percentage of Potential Energy Supply Area Compared with the Total Area of the Loess Plateau
(%)
Lower cost of thermal coal (≤CHY13 GJ−1)Upper cost of thermal coal (≤CHY26 GJ−1)
SB9452.03.113595.89.1
LB8091.52.310102.43.8
CP6311.11.79452.03.1
Lower cost of natural gas (≤CHY14 GJ−1)Upper cost of natural gas (≤CHY38 GJ−1)
SB9712.13.3174711.017.2
LB8561.72.713846.19.5
CP7101.21.910152.43.8
Lower cost of crude oil (≤CHY50 GJ−1)Upper cost of crude oil (≤CHY87 GJ−1)
SB179911.818.4189714.322.3
LB16299.114.2182812.419.4
CP11873.96.1179810.015.6
Lower cost of residue bale of Chinese market (≤CHY400 tonon−1)Upper cost of residue bale of Chinese market (≤CHY500 GJ−1)
SB11793.96.114076.29.7
LB9902.33.610472.53.9
Lower cost of residue chip of Chinese market (≤CHY400 GJ−1)Upper cost of residue chip of Chinese market (≤CHY1000 GJ−1)
CP9041.82.89643.96.1
Table 6. The provincial energy supply on the marginal land of the Loess Plateau.
Total Energy Supply (PJ)Energy Supply (PJ)Percentage (%)Area (Mha)Energy Supply (PJ)Percentage
(%)
Area (Mha)
Lower cost (≤13 CNY GJ−1)Upper cost (≤26 CNY GJ−1)
Shaanxi670574861.33633942.00
Shanxi431185430.47339792.52
Inner Mongolia332---68201.96
Gansu22274330.35143641.21
Ningxia146530.0353361.22
Henan9796990.1696990.17
Qinghai2912410.0519660.10
Disclaimer/Publisher’s Note: The statements, opinions and data contained in all publications are solely those of the individual author(s) and contributor(s) and not of MDPI and/or the editor(s). MDPI and/or the editor(s) disclaim responsibility for any injury to people or property resulting from any ideas, methods, instructions or products referred to in the content.