Article

Numerical Study of the Impact of Transverse Ribs on the Energy Potential of Air-Based BIPV/T Envelope Systems

1
Department of Civil & Environmental Engineering, University of Western Ontario (UWO), London, ON N6A 3K7, Canada
2
British Columbia Institute of Technology, BCIT-Building Science Centre of Excellence, Burnaby, BC V5G 3H2, Canada
*
Author to whom correspondence should be addressed.
Energies 2023, 16(14), 5266; https://doi.org/10.3390/en16145266
Submission received: 4 April 2023 / Revised: 2 June 2023 / Accepted: 5 July 2023 / Published: 10 July 2023
(This article belongs to the Section A2: Solar Energy and Photovoltaic Systems)

Abstract

:
Overheating in BIPV/T applications is a concern due to its negative impacts on the electrical conversion efficiency of the solar cells. Forced air cooling can be an effective thermal management strategy. However, its effectiveness is limited by the thermal resistance associated with the boundary layer formation on the walls of the air channel. The heat transfer effectiveness can be improved by appending transverse ribs to the BIPV/T air channel. This study numerically investigates the energy improvements associated with appending transverse ribs to a BIPV/T air channel using CFD. The impact of the varying the transverse rib roughness shape, pitch and height on the thermo-hydraulic performance parameter, electrical efficiency of the BIPV and building heating/cooling load is quantified. With the optimized transverse rib geometry, the heat removal rate is 2.73 times greater than with the smooth channel. This translated to a 30.5% reduction in the PV surface temperature and an increase in the electrical efficiency by 11.3% compared with the smooth channel under peak summer conditions for a mild oceanic climate. The wall heat gain during summer is also reduced by 45.2%.

1. Introduction

Building-integrated photovoltaic and thermal (BIPV/T) systems are a class of solar facades that either reject, absorb or reutilize solar energy for other purposes [1]. BIPV/Ts convert the absorbed solar energy into thermal and electrical energy. BIPV/Ts substitute traditional construction materials within specific sections of a building structure, thus making BIPV/Ts cost effective [2,3]. BIPV/Ts also facilitate the incorporation of photovoltaics into buildings, especially in urban built environments because there is no need for land allocation. Some have alluded to BIPVs being one of the key factors that are essential for the future success of photovoltaics [4].
Integrating photovoltaics into a building envelope is challenging. BIPV systems overheat, as a substantial portion of the absorbed energy is converted into heat. This leads to higher cell temperatures and a decline in overall cell efficiency. Hence, flow passages are created behind the solar panels for thermal management either by natural convection or forced air cooling [5]. While cooling with natural convection can be more cost-effective, forced air cooling channels can more easily be adapted to a building’s energy systems (i.e., HVAC) to offset some of the building heating loads. The effectiveness of forced air cooling as a thermal management strategy has been demonstrated [6,7,8,9,10,11,12,13]. However, the effectiveness is limited by the thermal resistance created by the viscous sublayer that forms on the walls of the air channel [14,15,16].
To enhance the heat transfer effectiveness of a BIPV/T air channel, solar panels were installed in an open-jointed configuration to disrupt the boundary layer growth [17,18,19]. The mismatch between the desired PV module surface temperature and the outlet air temperature demand may limit the application of this concept. Another alternative is to append transverse roughness elements (or ribs) behind the solar panels in the airflow path. This method has especially found application in solar air heaters. These roughness elements are also referred to as turbulence generators because they promote turbulence in the near-wall region, thereby enhancing heat transfer [16,20,21]. The increase in heat transfer for rib geometries is accompanied by an increase in pressure loss. Hence, the goal is to optimize the thermo-hydraulic performance (i.e., maximize the heat transfer and minimize the pumping penalty).
The literature on heat transfer enhancement for solar air heater channels roughened with transverse roughness elements is extensive and has been reviewed in [22]. The findings in the literature suggest that the thermo-hydraulic performance can be enhanced by a factor of up to 3.7 with roughness elements. This can be beneficial for BIPV/T applications where cooling of the solar cells is a concern, as mentioned earlier; from our review of the literature, this has yet to be investigated. Hence, the aim of this study is to investigate the energy improvements associated with appending transverse ribs to a BIPV/T air channel. In this study, the improvement of the electrical conversion efficiency of a BIPV/T system with a transverse-rib-roughened channel is quantified. Furthermore, the thermal comfort improvement in the indoor space adjacent to the BIPV/T system with the transverse-rib-roughened air channel is assessed by quantifying the wall heat flow attenuation under peak summer conditions in a mild oceanic climate. As part of the study, the near-wall flow structures for the transverse-rib-roughened air channel are investigated in detail to understand the heat transfer and flow phenomena, and how they translate to energy improvements in the BIPV/T system. It is clear from the literature that the enhancement in heat transfer for an air channel roughened with transverse ribs is dependent on key geometric parameters including the shape of the transverse rib profile, the rib height and the rib pitch (i.e., the distance between consecutive rib elements) [9,11,13]. Hence, the impact of varying the transverse rib roughness shape, pitch and height on the improvement of the heat transfer, electrical conversion efficiency and wall heat flow is studied. In the end, the optimal rib geometry from the range of parameters considered that maximizes heat transfer effectiveness and electrical conversion efficiency and minimizes the wall heat gain in the summer will be deduced. The study employed the computational fluid dynamics (CFD) numerical approach to first characterize the near-wall flow structure. Then the impact of varying the transverse rib roughness element shape, pitch and height on the heat transfer effectiveness, electrical conversion efficiency of the BIPV and building cooling load is quantified. A detailed description of the methodology is provided in the next section.

2. Methodology

Figure 1 shows a schematic of the air-cooled BIPV/T system with square transverse ribs considered. The system consists of an inner and outer wall (i.e., solar panel cladding) that are separated by an air channel for forced air flow. The system is described by the following geometrical parameters: the roughness height, e, which is the depth the roughness element in the flow channel; the roughness pitch, p, which is the distance between successive ribs; and the channel height, H.
The physical model of the BIPV with transverse rib roughness is numerically represented in CFD software. Star CCM+ is used for the CFD analysis. The numerical model of the BIPV/T system is first validated using experimental data from the literature. The experimental study investigated the heat transfer augmentation associated with solar air heater channels with transverse square ribs [24]. The experimental data for a solar air heater was selected for validation of the CFD model due to the lack of available data in the literature on transverse ribs’ application for heat transfer augmentation in BIPV/T systems. However, the authors believe that, barring the additional heat loss associated with the electrical conversion efficiency, the boundary conditions for the solar air heater and the BIPV/T system presented earlier are similar.
The experimental setup is detailed in [24]; however, a brief description is provided herein. The experimental setup consists of a 440 mm by 300 mm by 30 mm air channel (Figure 2a,b). The top wall of the channel is roughened with square ribs with a roughness height and pitch of 6 mm and 40 mm, respectively. A uniform heat flux is applied on the roughened wall. The experimental setup is instrumented to measure the absorber plate temperature, inlet temperature, outlet temperature and pressure drop across the test section, from which the dimensionless heat transfer coefficient (i.e., Nusselt number) and pressure drop (i.e., friction factor) are derived.
The Nusselt number (Nu) characterizes the effectiveness of convective heat transfer (Equation (1)).
N u = h   D k
where D is the hydraulic diameter, k is the thermal conductivity of air taken at the bulk fluid temperature (i.e., the average of the inlet and outlet temperature; ( T o u t + T i n ) / 2 )) and h is the average convective heat transfer coefficient. The friction factor gives an indication of the pressure loss in the air channel (Equation (2)).
f =   ( Δ P L ) 1 2 ρ U 2 D
where Δ P is the pressure drop from the inlet to the outlet, L is the length of the solution domain (i.e., 3 m), D is the hydraulic diameter, ρ is the density at the bulk fluid temperature and U is the inlet velocity derived from the Reynolds number (i.e., R e = ρ U D μ ). The thermo-hydraulic performance parameter ( T h P P ) is derived from the Nusselt number and friction factor. The thermo-hydraulic performance parameter gives an indication of the worthiness of a heat transfer augmentation approach in reference to a smooth channel (Equation (3)) [26].
T h P P = ( N u r / N u s ) ( f r / f s ) 1 3
where the subscripts r and s indicate the Nusselt number and friction factor for the ribbed and non-ribbed channel, respectively. ThPP > 1 is preferred, as it indicates that the enhancement in heat transfer outweighs the pressure loss experienced by the system. The Nusselt number and friction factor for the smooth channel are derived according to the Dittus–Boelter (Equation (4)) and Blasius equation (Equation (5)).
Dittus–Boelter equation [27]:
N u = 0.0243 R e 0.8 P r 0.4
Blasius equation [27]:
f = 0.079 R e 0.25
The CFD model is validated if the numerically determined Nusselt number and friction factor values are within the experimental error margin. Using the validated CFD model, a sensitivity analysis is conducted to optimize the rib geometry and flow parameters. The variables considered in this paper are the rib shape, relative rib height (e/D) and relative rib pitch (p/e) under the different heat transfer and flow conditions specified by the available heat flux and the Reynolds number, respectively (See Figure 2 and Table 1).
The optimal rib geometry is determined or sought by considering two performance scales: the component model performance scale and the building model performance scale. Regarding the component scale, the goal is to optimize the thermo-hydraulic performance (i.e., maximize the heat transfer effectiveness and minimize the pressure loss). With this component performance scale, the model is simplified and does not consider the interaction of the immediate indoor and outdoor environment or the electrical energy production. A constant heat flux is specified with no heat losses/gains from the immediate environment and considering how the rib arrangement and geometry impact the heat transfer and flow characteristics. The effectiveness is evaluated based on the Nusselt number (Equation (1)), friction factor (Equation (2)) and thermo-hydraulic performance parameter (Equation (3)).
For the building performance scale, the interaction of the immediate indoor and outdoor environment or the electrical energy production are considered. The goal is to maximize the electrical conversion efficiency and minimize the building cooling load (i.e., the wall heat flux) by considering the parameters in Table 1. The electrical efficiency is then derived according to Equation (6) [1].
η c = η r e f [ 1 β r e f ( T c T r e f ) ]
where ηref and βref and are the cell efficiency (i.e., 15.4% [28]) and temperature coefficient (−0.45%/°C given at standard test conditions (Tref = 25 °C and Irad = 1000 W/m2)), respectively, and Tc is the cell temperature. The temperature coefficient is −0.45%/°C for monocrystalline silicon (mono-Si) PV [1]. The wall heat flux is provided by Equation (7).
Q i n t = T s T i n t R t h
where T s is the exterior surface temperature of the inner wall, T i n t is the interior surface temperature of the inner wall and R t h is the thermal resistance of the inner wall (derived as a 3.56 m2 K/W value for a typical 2 × 6 wood-framed wall assembly).
For the building scale assessment, typical peak summer conditions (i.e., 400 W/m2 heat flux and 30 °C outdoor temperature) for a mild climate like Vancouver, British Columbia, Canada [29]. For the typical summer conditions, it is assumed that the indoor air temperature is 24 °C [30]. The heat flux boundary condition is applied to simulate an opaque inner wall (See Equation (7)). Radiation in the air channel is modelled by specifying a surface emissivity of 0.8 for all surfaces.

3. Validation of the Numerical Model

The conjugate heat transfer problem in the BIPV/T envelope system is solved by implementing the steady Reynolds-averaged Navier–Stokes and energy equations. Turbulence is modeled using the standard Reynolds number k-epsilon turbulence model. The k-epsilon turbulence model is accurate for simulating wall-bounded forced convection flows [31]. The radiation heat exchange is modeled using the discrete ordinate method (DOM).

3.1. Numerical Simulation Setup

3.1.1. Computational Domain

The 2D representation of the solution domain is seen in Figure 1c. The computational domain consists of the 600 mm entrance section, the 440 mm heated section and the 600 mm exit section. A fully developed flow condition is ensured by the entrance section. The exit length is also provided to ensure a settled flow at the outlet. The entrance and exit lengths satisfy the condition for fully developed flow (i.e., x f d / D 10 —[27]). The top surface of the test section is roughened, as shown in Figure 1c. The transverse ribs are 6 mm squares and are spaced at 40 mm such that the relative roughness height (e/D) and the relative roughness pitch (p/e) are 0.10 and 6.67, respectively. The PV module is not directly modelled in the solution domain because its thermal conductivity is three orders of magnitude higher than that of the fluid.

3.1.2. Boundary Conditions and Solution Strategy

An accurate specification of the boundary conditions is essential to obtain meaningful computational results. A no-slip boundary condition is assigned to all the walls. All the walls are assumed to be adiabatic except the flat surfaces at the top of the test section (see Figure 2c). A uniform constant heat flux is applied at the top of the test section that varies depending on the simulation scenario. At the inlet, a constant velocity profile is imposed depending on the flow condition that is being simulated. The 600 mm entrance length of the solution domain is sufficient to attain a fully developed velocity profile. Air at 300 K enters the solution domain. Variable air properties are specified due to the high temperature gradients expected in the BIPV/T envelope system. The turbulence characteristics at the inlet are described by specifying the turbulence intensity. The turbulence intensity is estimated by Equation (8) [32].
I = 0.16 ( R e ) 1 8
At the outlet, a pressure outlet boundary condition is assigned with a gauge pressure of 0 Pa. The turbulence intensity at the outlet is specified, similar to the inlet. The conservation equations of mass, momentum and energy are solved simultaneously using a pseudo-time-marching approach. The pseudo-time-marching approach is implemented in the coupled flow model. The second-order upwind scheme is used to discretize the governing equations. The solution is converged for all residuals (i.e., continuity, velocity components and energy) less than 10−5.

3.1.3. Mesh Generation

The governing equations are solved by discretizing the computational domain into finite control volumes. The computational domain is discretized using polyhedral mesh. In addition, 4 prism layers have been employed in the near-wall region with a geometric stretching factor of 1.5. The purpose of this is to capture important details of the temperature gradient near the heated top surface. The size of the mesh in the computational domain has been globally scaled to a fraction of the characteristic length. The height of the channel, H, is the characteristic length. The mesh is refined around the roughness elements to capture the complex flow structures due to flow separation and possible reattachment. Figure 3 illustrates the typical mesh scheme. In Figure 3, the global reference size is 1 15 H . The size of the mesh is 3 40 ( 1 15 H ) , closer to the roughness elements and the top of the test section. A growth rate of 1.05 allows for a smooth transition from the finer mesh to the relatively coarser mesh in the undisturbed entrance and exit lengths. The thickness of the prism layer is 1 10 ( 1 15 H ) ; this ensured that y+ ≤ 0.41. The meshing scheme yielded 97,553 grid cells.
The mesh is further refined such that the base size is 1 25 H and 1 50 H , amounting to 172,916 and 377,007 cells, respectively, and a mesh independency study is performed. The mesh independency study is conducted for the rib geometry described by an e/D value of 0.2 and a p/e value of 6.67, and for an Re value of 7000 for the inflow. Table 2 shows that with further refinement of the mesh beyond 172,916 grid cells, the change in both the Nusselt number (Nu) and friction factor (f) is less than 1%. The numerical model with 172,916 grid cells can accurately capture the heat transfer and flow characteristics.

3.2. CFD Validation Results

The accuracy of the CFD model is compared with the experimental data. The Nusselt number and friction factor are the parameters of interest. The root mean square error (RMSE) analysis approach given in Equation (9) is adopted to quantify the numerical error [33].
R M S E = 1 n i = 1 n ( y s i m y e x p ) 2
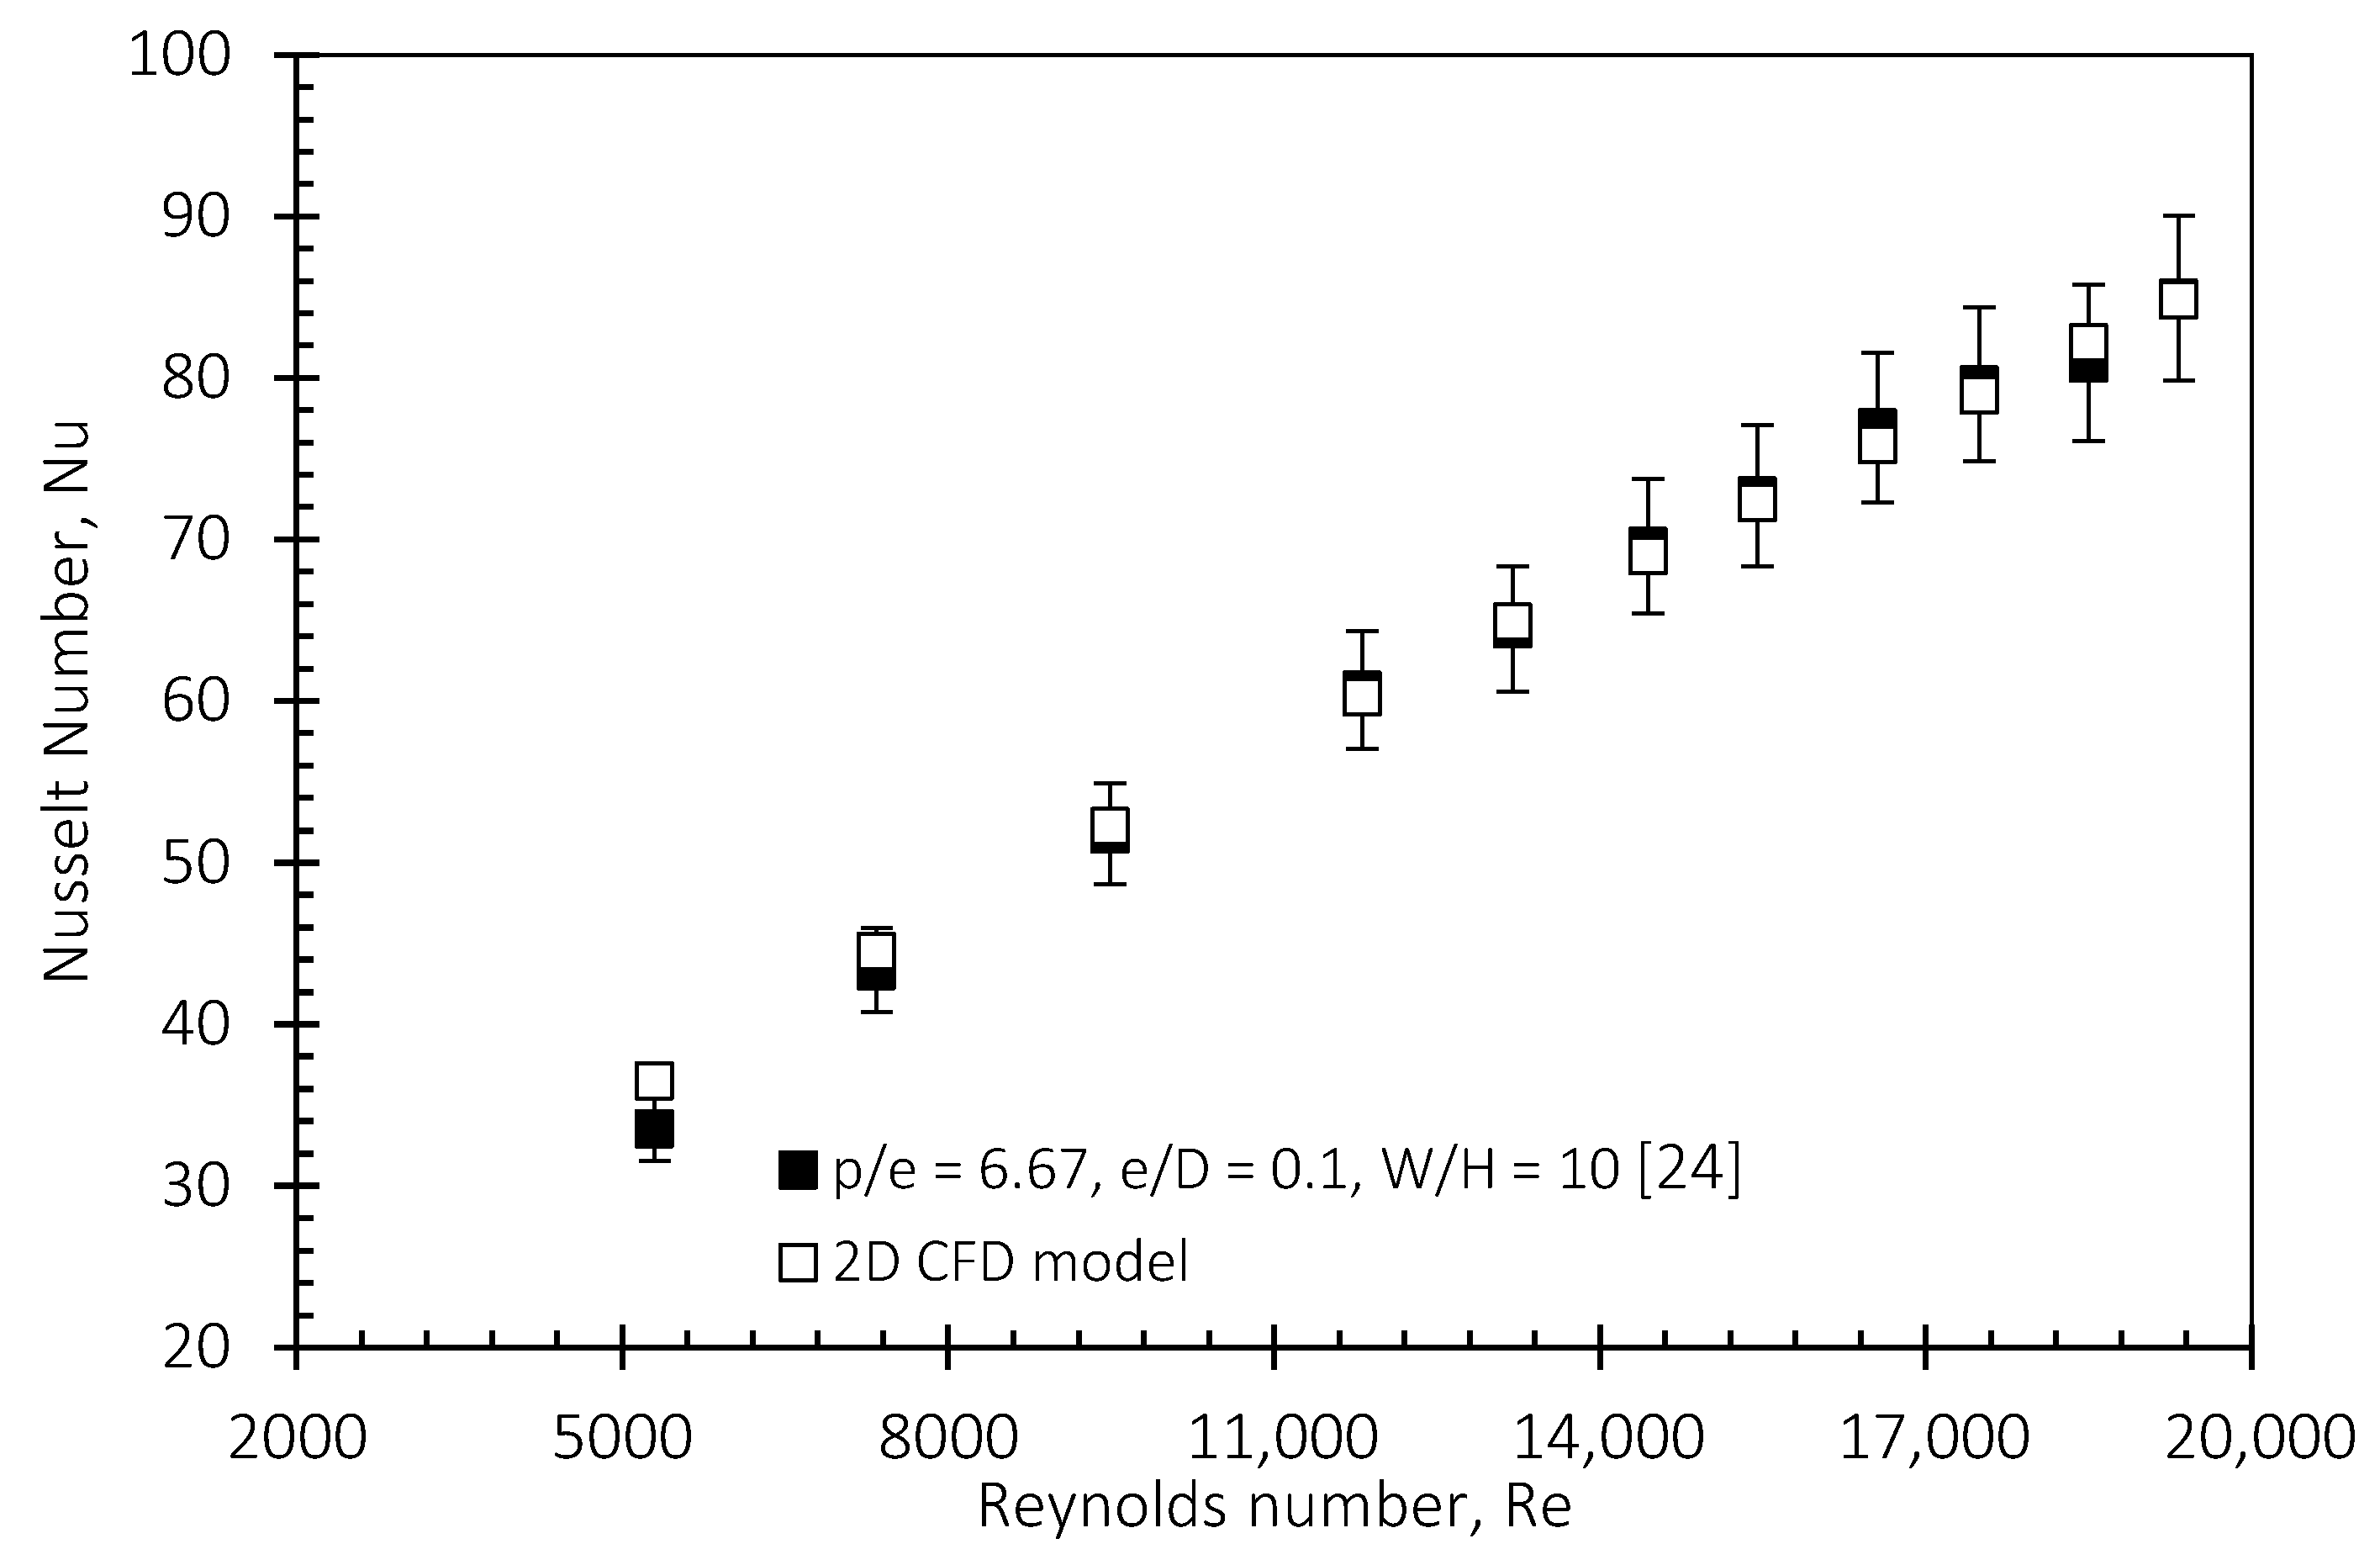
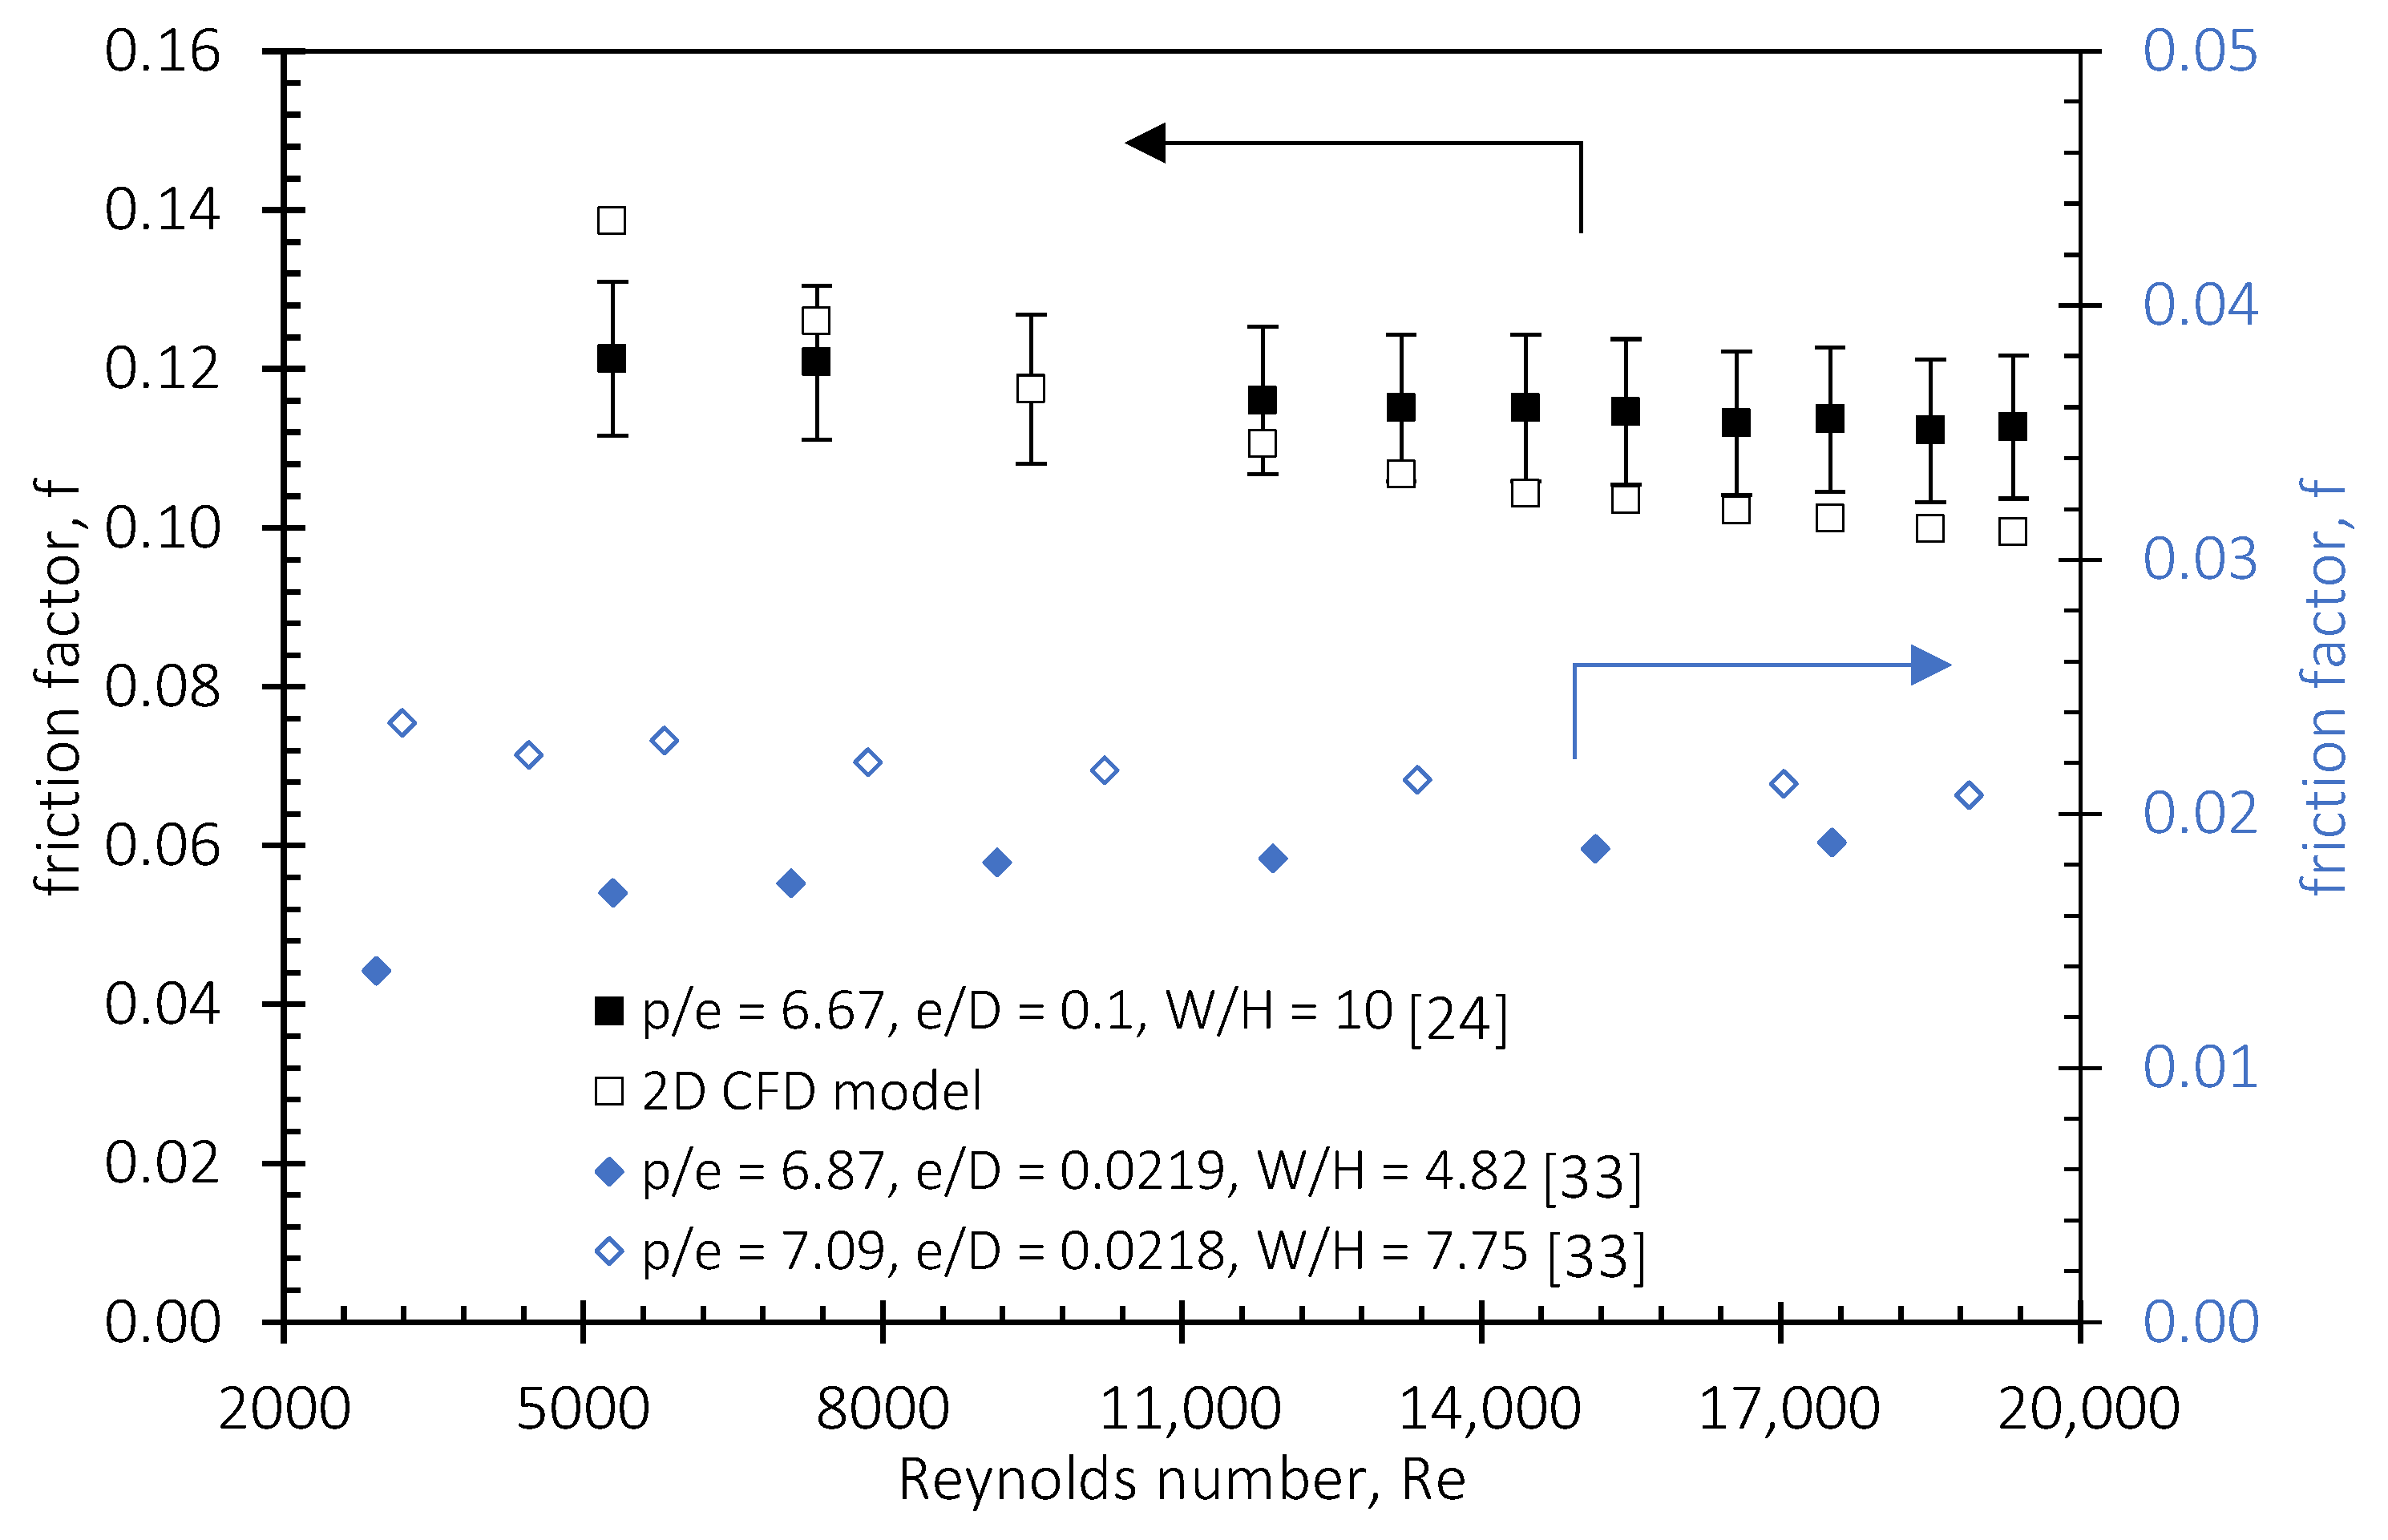
where y e x p is the experimental data, is the numerically predicted data and n is the number of data points. Figure 4 compares the numerical prediction of the average Nusselt number against the experiment. There is a very good agreement between the numerical model prediction of the Nusselt number and the experimental data for the Reynolds number range considered. The RMSE for the numerical prediction of Nu is 1.14 for values from 35 to 85 over the Reynolds number range, and the coefficient of variation of the RMSE is 2%. This is within the experimental error of ± 6% for Nu. For a roughened duct, the thermally fully developed flow is established in a short length of 2–3 hydraulic diameters [34], and periodicity is attained, hence the accuracy of prediction of Nu. However, the friction loss is more complex and dependent on the Reynolds number and the entrance and exit lengths. In Figure 5, the friction loss in the roughened duct is accurately predicted in the Re range from 7325 to 14,512. The friction factor is overpredicted and underpredicted at lower and higher values of the Reynolds number, respectively. The discrepancy may be attributed to the truncation of the secondary flow associated with flow in roughened ducts for a 2D approximation of a 3D phenomenon. This is supported with experimental data in [34], in which the impact of the duct aspect ratio on the frictional loss and heat transfer is investigated (Figure 5). It is seen that the frictional loss is higher for higher-aspect-ratio channels. The difference is more pronounced at lower Reynolds numbers. Similarly, the numerical prediction error for the frictional loss for Re < 7325 is 14% compared to 11% for Re > 14,512. The RMSE for the numerical prediction of the friction factor is 0.0108 for values in the range of 0.099 to 0.139, and the CV(RMSE) is 8% for the range of Re considered. Because the CV(RMSE) for the Nusselt number and friction factor is within the experimental error of the published data, the numerical model is considered sufficiently accurate for further computational analysis.

4. Parametric Analysis Results and Discussion

The results of the parametric analysis are presented and discussed in this section. First, the impact of the geometric parameters (i.e., e/D and p/e) on the flow structures is presented. The effects of the rib shape, rib height (e/D) and rib spacing (p/e) on the thermo-hydraulic performance, electrical efficiency and building heat gain/loss are outlined for different flow conditions.

4.1. Flow Structure Characterization: Near-Wall Flow

The impact of the relative pitch ratio (p/e) and relative roughness height (e/D) on the flow structures in the roughened channel is quantitatively assessed by analyzing the velocity contours. Table 3 shows the three different flow structures identified for the range of relative roughness pitches considered. The flow structure nomenclature is consistent with the atmospheric layer flow in the built environment [35]. As seen in Table 3, for p/e < 3.5, the vortex is trapped between consecutive roughness elements, and the mean flow skims over the roughness elements. This is referred to as skimming flow. For 3.5 < p/e < 9.5, there is interaction between vortices formed in the immediate downstream and upstream areas of the preceding and ensuing roughness elements, respectively. This is a wake interference flow regime. As the distance between consecutive roughness elements is increased (i.e., p/e > 9.5), an isolated roughness flow regime ensues and is characterized by no interaction between the vortices formed in the upstream and downstream areas of consecutive roughness elements.
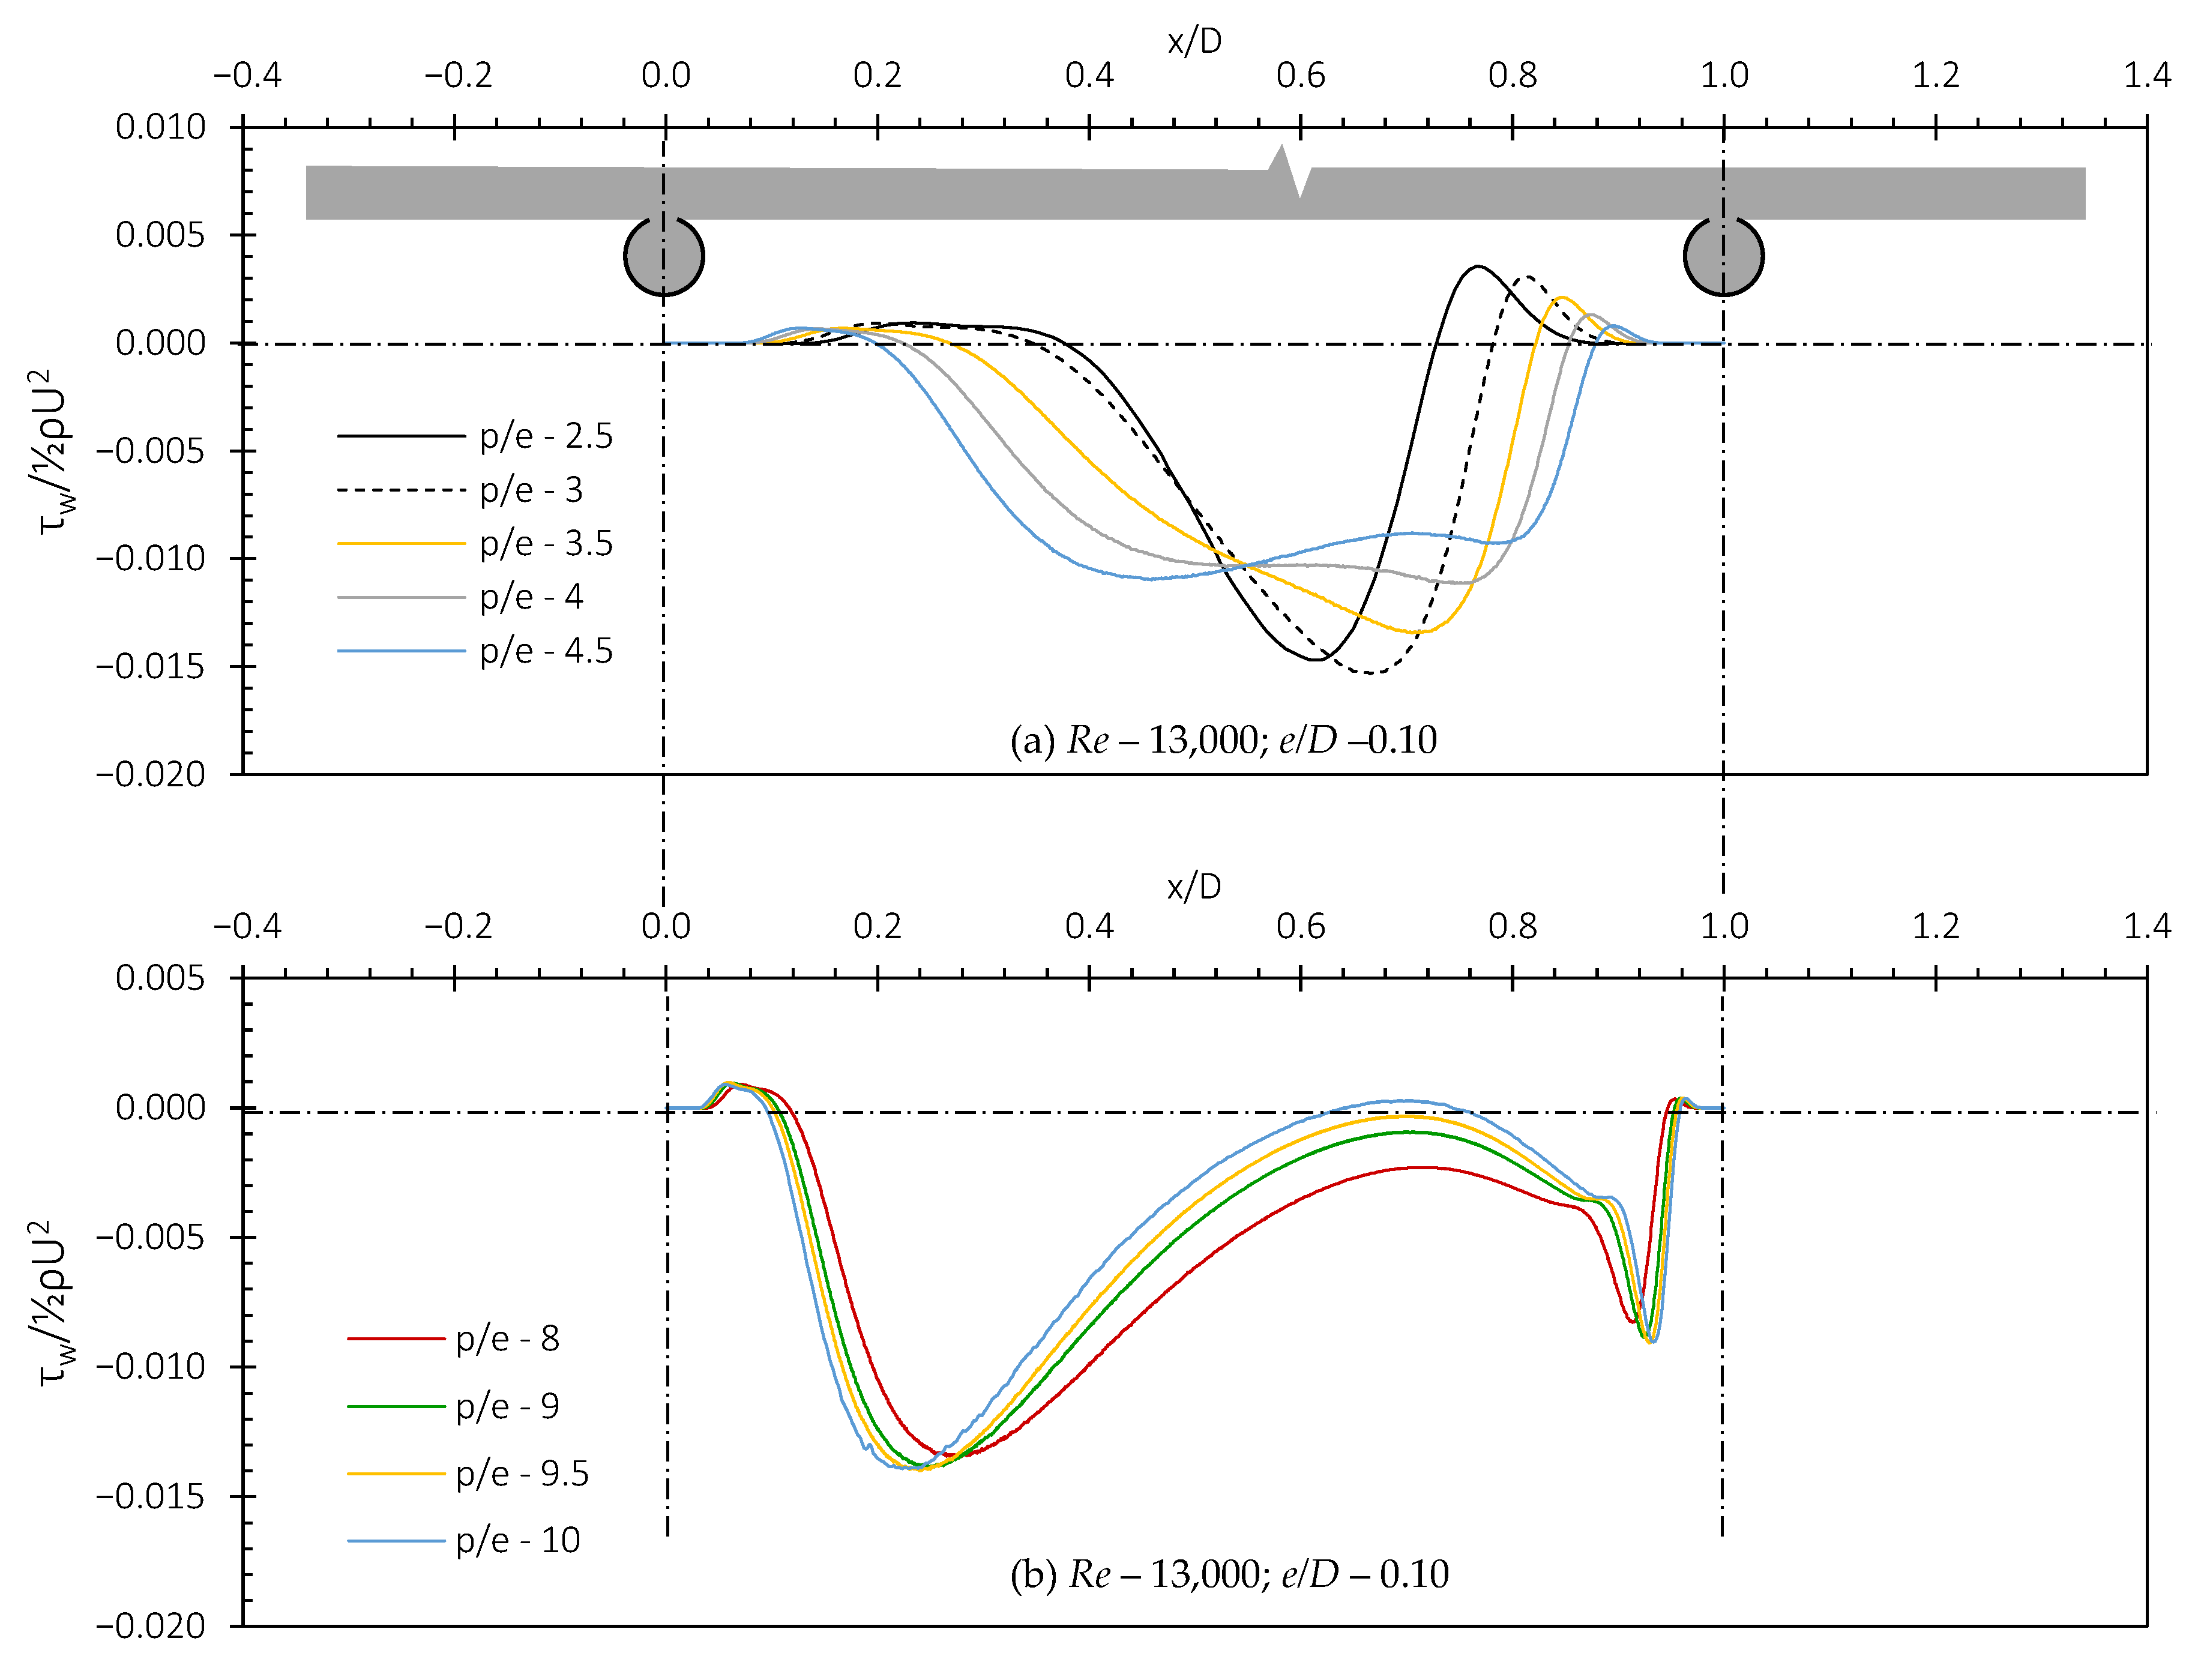
The upper and lower bounds of the wake interference flow regime, which inherently determine the bounds for the isolated roughness flow regime and the skimming flow regime, are determined by observing trends in the wall shear stress determined from the CFD simulation. Figure 6a shows the dimensionless wall shear stress between consecutive roughness elements for different rib spacings. The shear stress peak is highest and lowest for p/e values of 3 and 4.5, respectively, which indicates that the strength of a vortex diminishes as the spacing between the ribs increases. The positive wall shear stress that occurs in the immediate upstream and downstream areas of the preceding and ensuing roughness elements indicates the presence of smaller-magnitude trapped vortices. This is the reason for the hot spot problem inherent in transverse roughness elements. As the spacing is increased (i.e., p/e > 3.5), an inflection point in the wall shear stress profile is evident. This indicates the start of the wake interference flow regime.
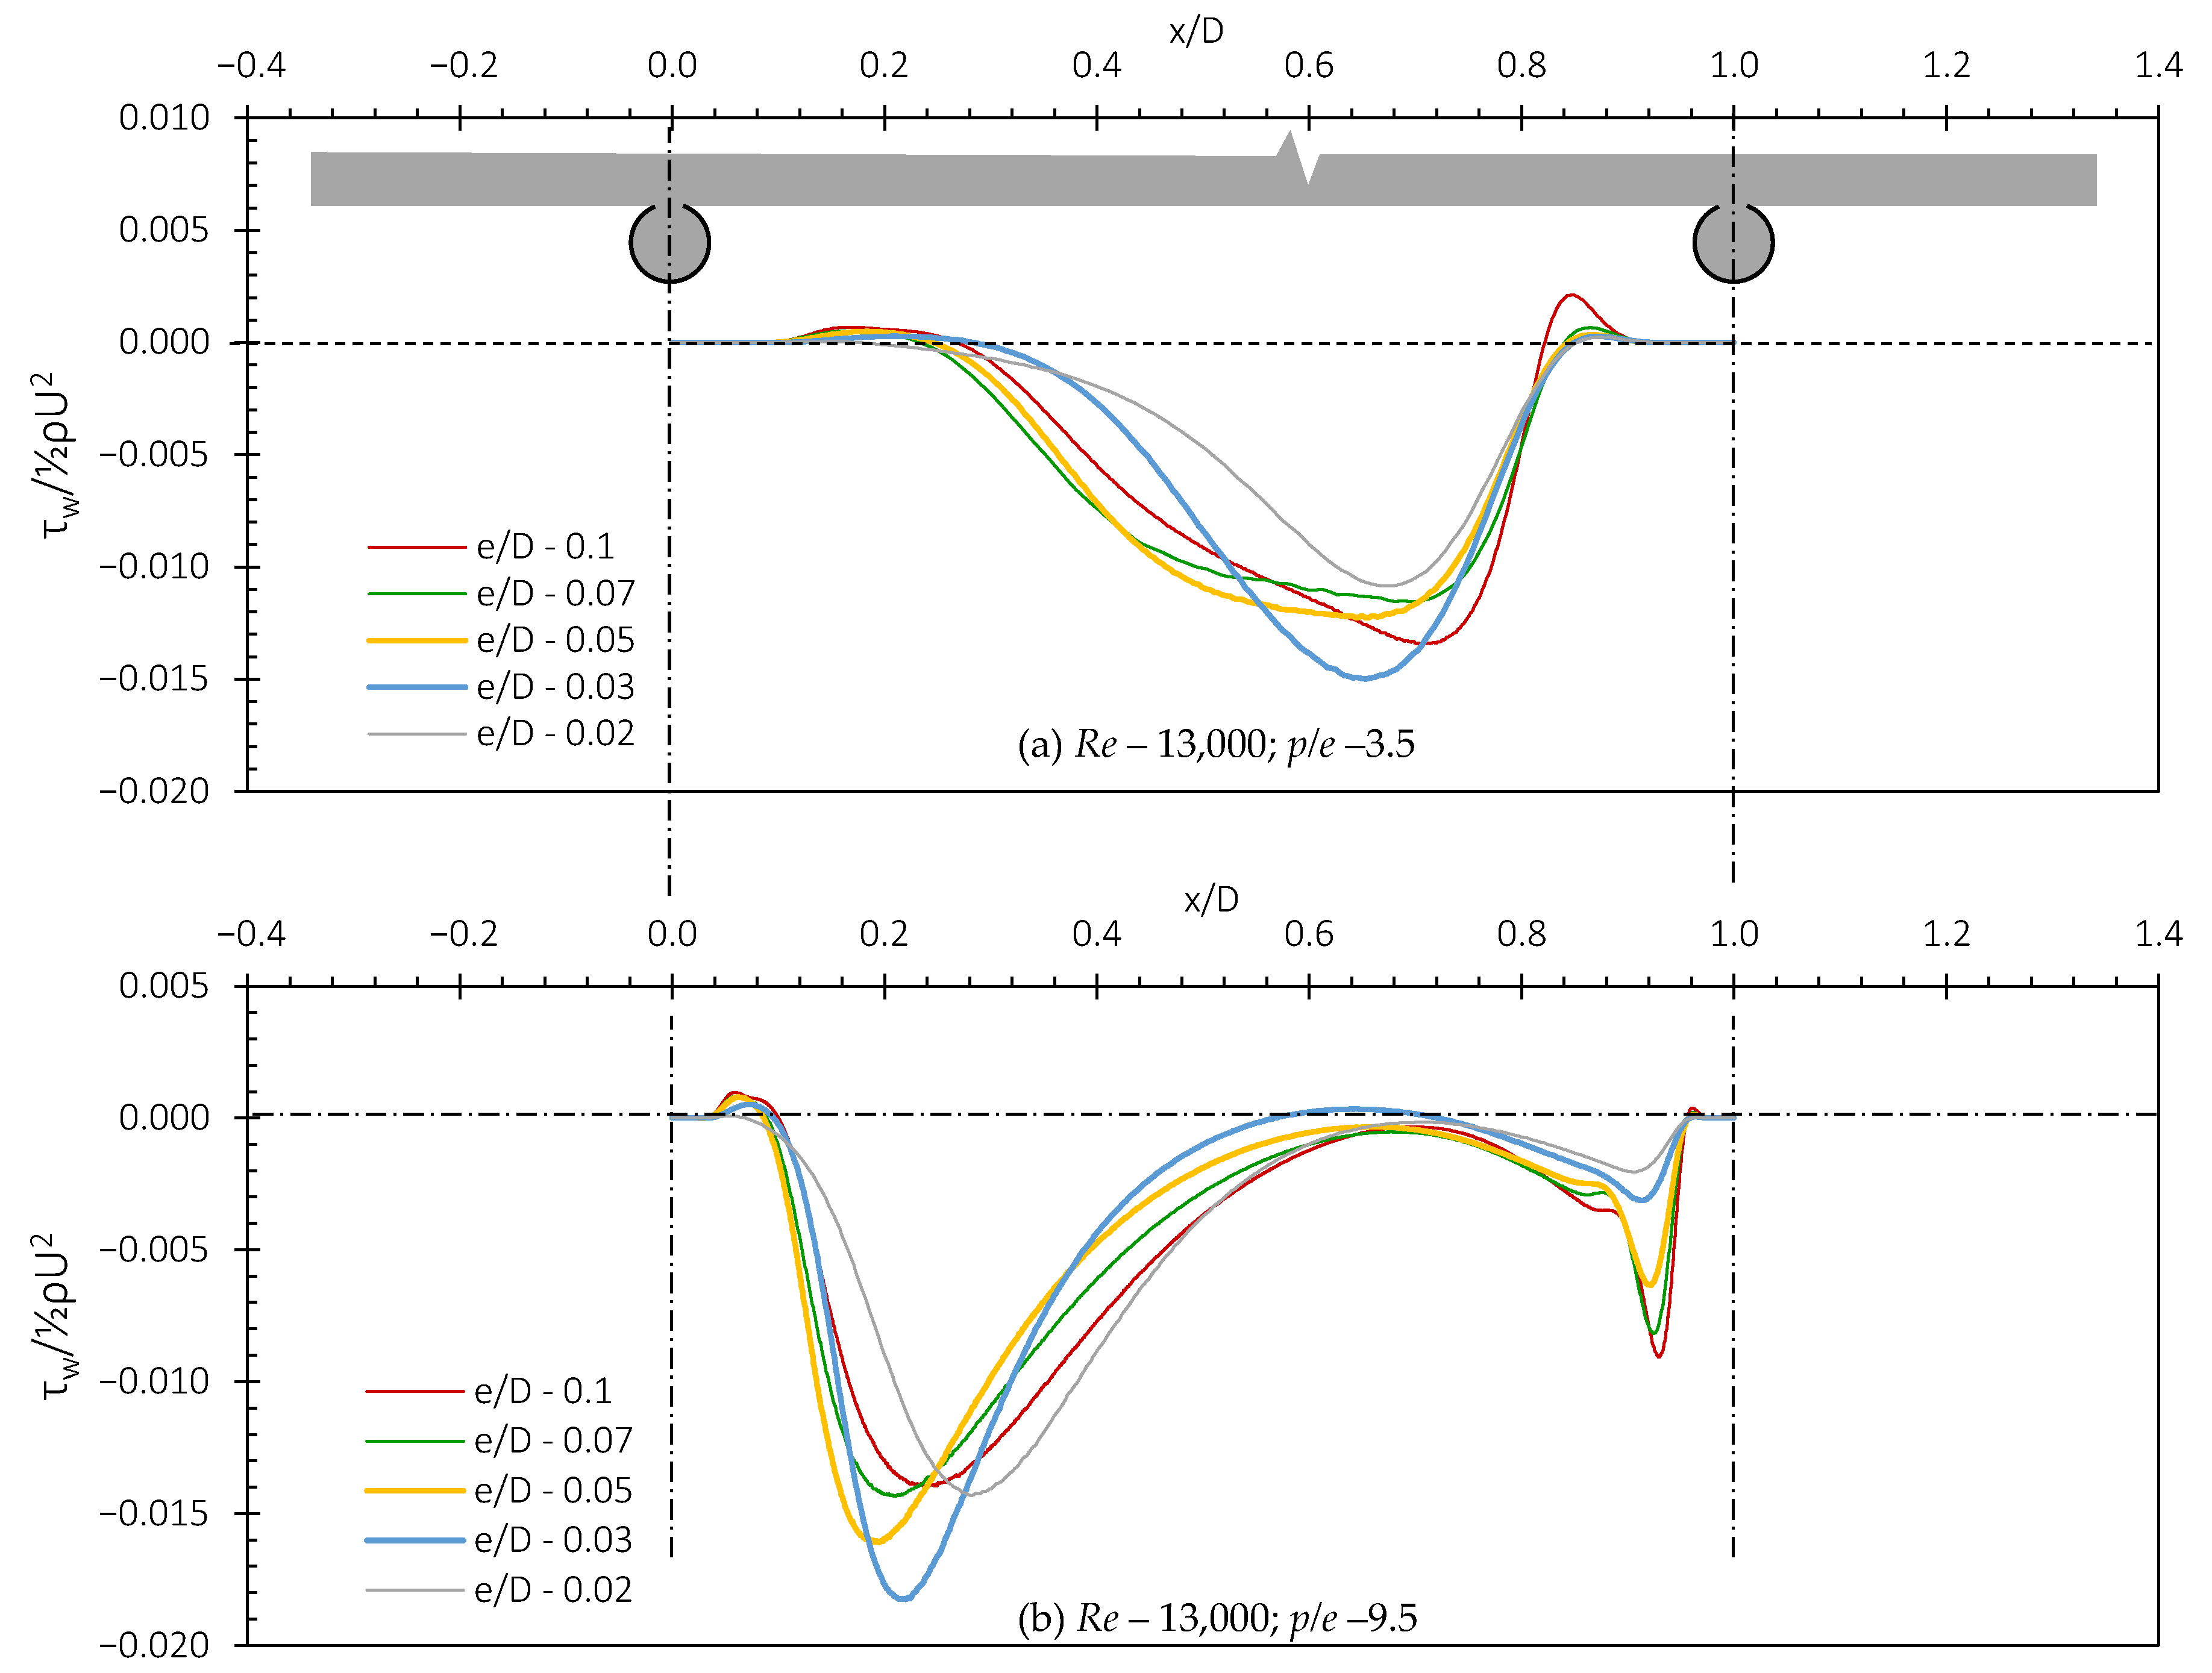
Similarly, the wall shear stress profile is plotted to determine the upper bound of the wake interference region (Figure 6b). The wall shear stress is plotted for p/e values of 8, 9, 9.5 and 10. The upper bound of the wake interference flow regime is determined as the p/e value for which the shear stress becomes positive at the inflection point. This indicates flow reattachment. As seen in Figure 6b, this occurs for p/e > 9.5. Beyond this value, the isolated roughness flow regime begins. However, when the wall shear stress profile is illustrated for an e/D value of 0.10, a similar trend is noticed for the e/D values considered and is shown in Figure 7a,b. The shear stress profiles are similar, and the flow regime is applicable for all relative roughness heights.

4.2. Effect of Shape of the Transverse Rib Profile

4.2.1. Effect of Shape of the Transverse Rib Profile on Nusselt Number, Friction Factor and Thermohydraulic Performance Parameter

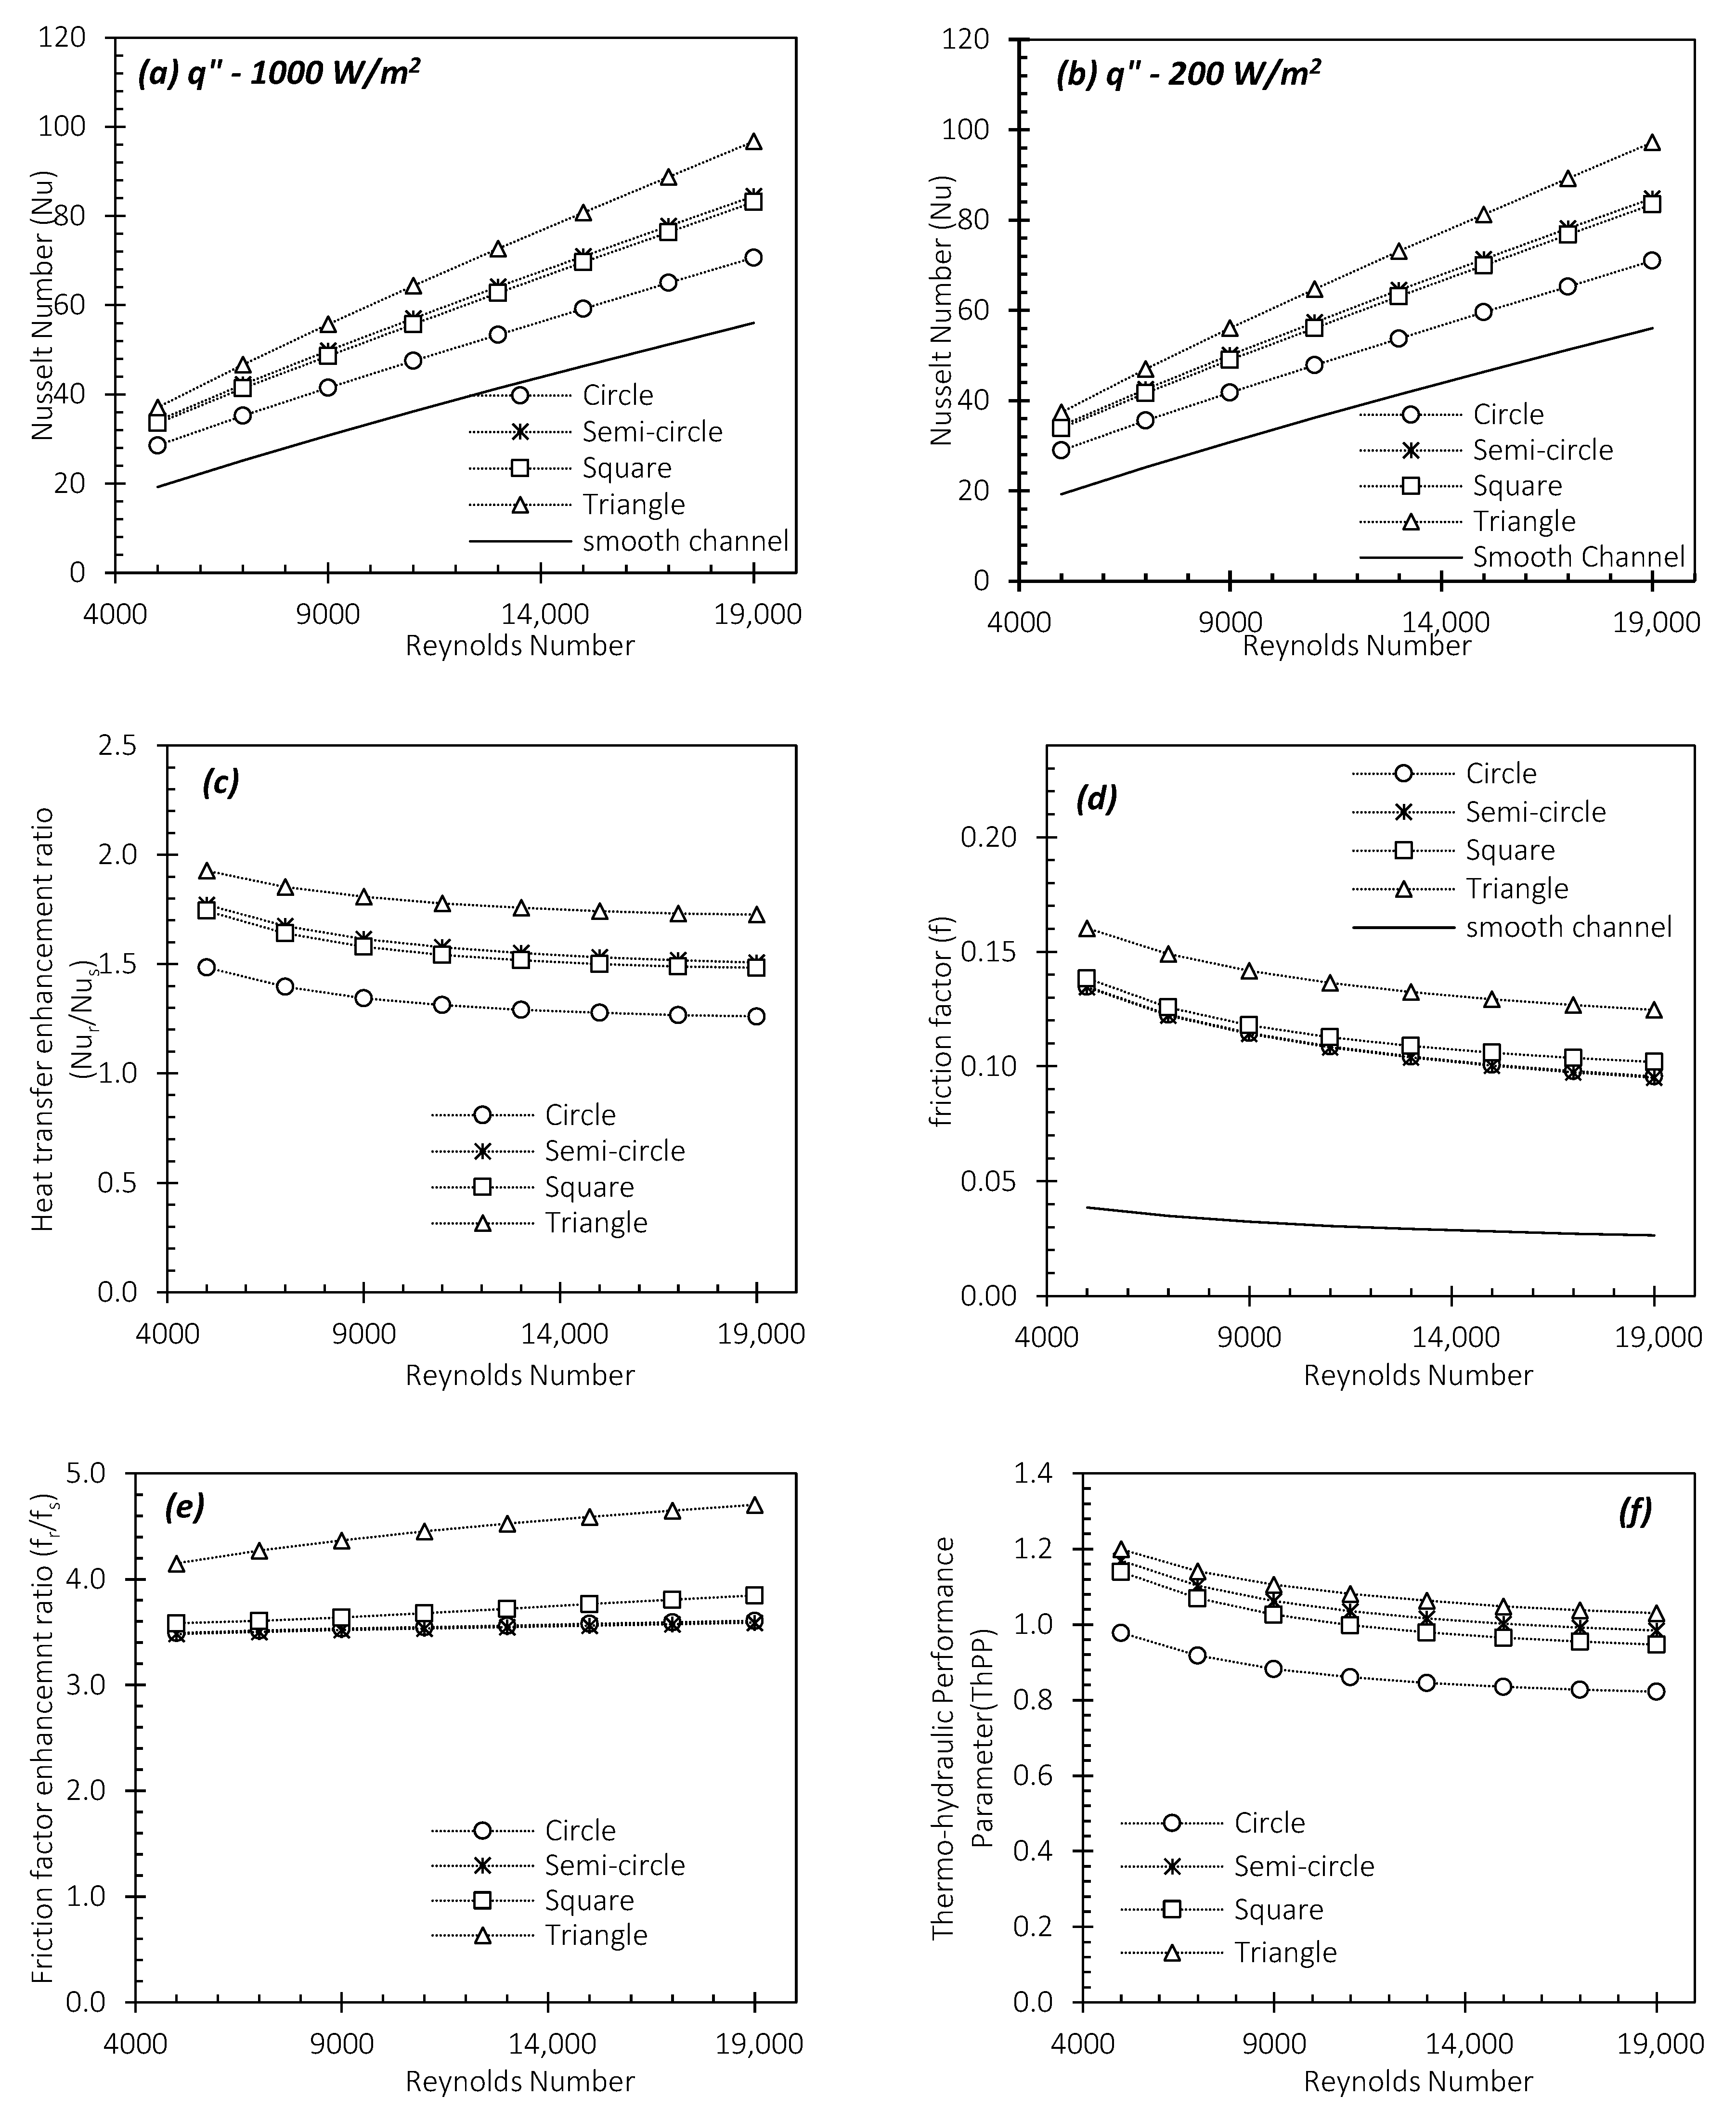
Figure 8a,b illustrates a comparison of the heat transfer coefficients in the channel roughened with transverse roughness elements of different shapes and a smooth channel. The comparison is performed for an e/D of 0.10 and a p/e of 7.5. The insensitivity of the Nusselt number to the available heat flux is demonstrated by comparing Figure 8a,b. Using the triangular rib as a case study, Figure 8a shows that the Nusselt number varies from 37.1 to 96.7 as the Reynolds number increases from 5000 to 19,000 for an available heat flux of 1000 W/m2. Similarly, Figure 8b shows that the Nusselt number varies from 37.4 to 97.2 as the Reynolds number increases from 5000 to 19,000 for an available heat flux of 200 W/m2. Furthermore, the heat transfer enhancement attributed to the presence of the transverse roughness elements for the different shapes can be seen in Figure 8c compared with the smooth channel. The channel roughened with the triangular rib demonstrated the most improvement in heat transfer compared with the smooth channel. A heat transfer enhancement of up to 1.93 is possible with the triangular rib for a Reynolds number inflow of 5000. The circular rib provides the least heat transfer enhancement of 1.48 at the same flow conditions. The channels roughened with the semi-circular and square ribs showed similar heat transfer enhancement values. The friction penalty associated with transverse ribs can be seen in Figure 8d,e. For all the rib shapes considered, the friction penalty increases with an increase in the Reynolds number. The friction penalty associated with the triangular rib is the most significant of the shapes considered. Consequently, the thermo-hydraulic performance parameter (ThPP) is maximized for the triangular rib for a Reynolds number of 5000 and minimized for the circular rib for a Reynolds number of 19,000 (Figure 8f).
The better heat transfer enhancement of the triangular roughness element for heat transfer enhancement is further explained by the wall shear stress profile between consecutive ribs (Figure 9). The highlighted regions in Figure 9 give an indication of the presence of hot spots in the vicinities of the roughness protrusions due to trapped vortices. The region covered by the trapped vortex is more significant for the circular rib than the triangular rib. The trapped vortex covers about 10% of the pitch length for the case with the circular rib and less than 5% of the pitch length for the triangular rib. In addition, the wall shear stress profile shows the highest negative peak for the triangular rib, which is indicative of a higher induced turbulence and better heat transfer enhancement. All these factors contribute to the better heat transfer performance of the triangular roughness element over the other shapes considered.

4.2.2. Effect of Shape of the Transverse Rib Profile on Building Heat Gain and Electrical Efficiency

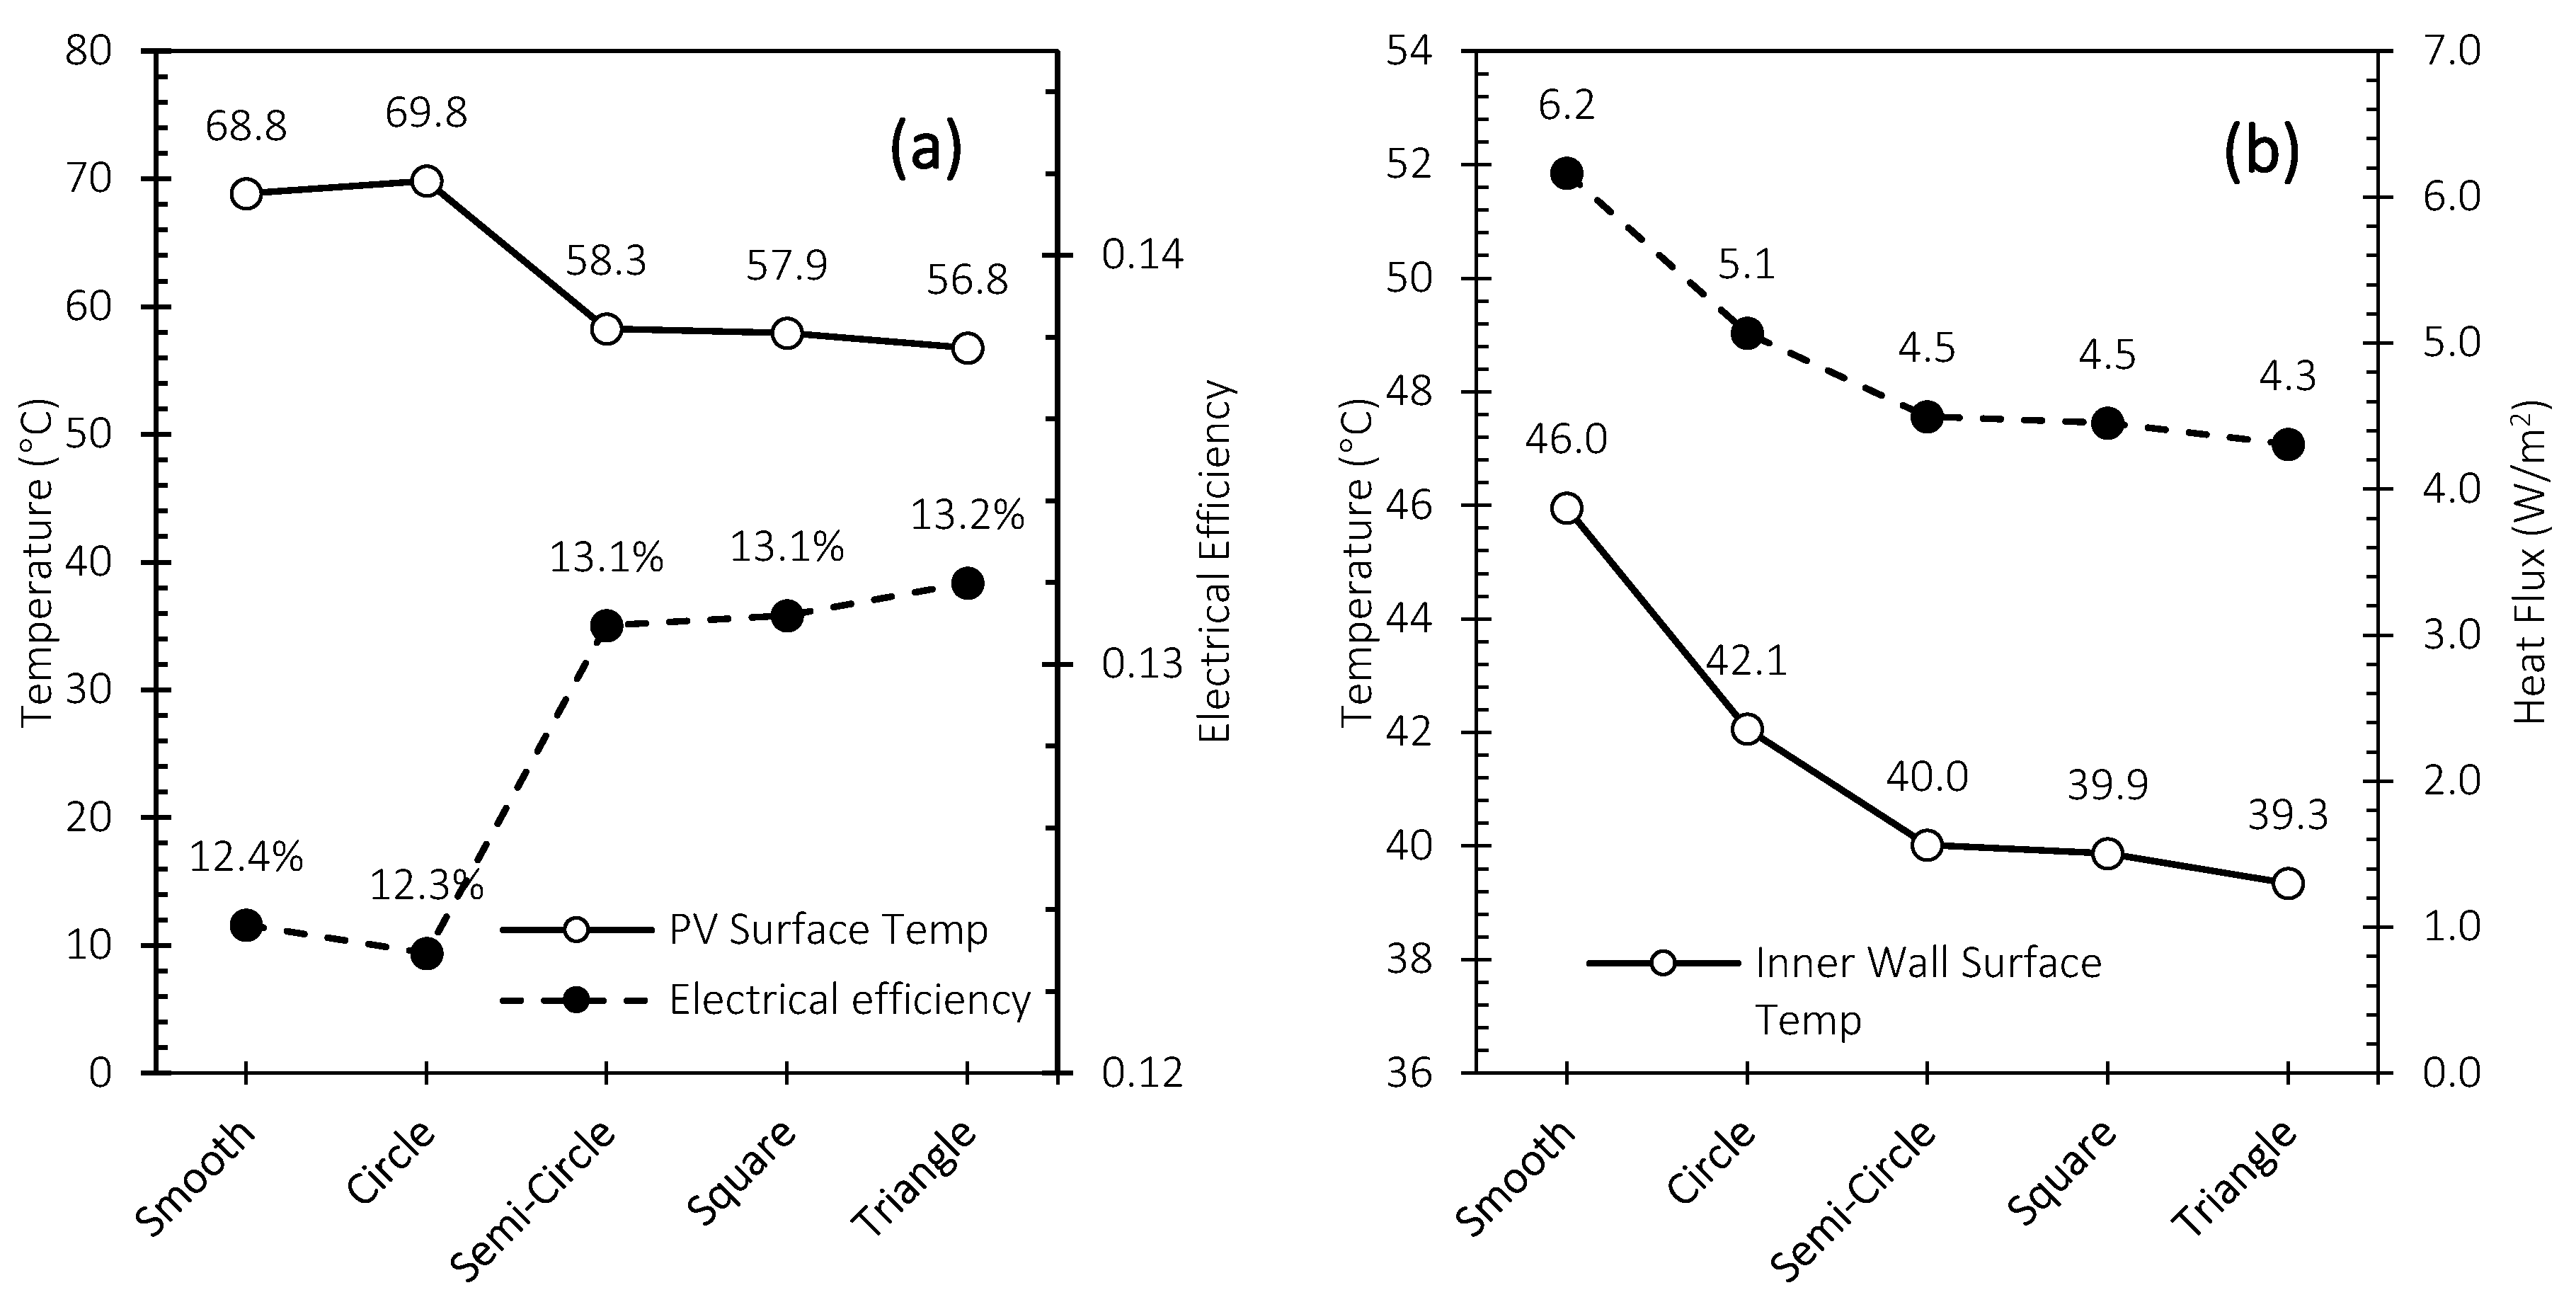
The effect of the rib shape on the conductive heat transfer of the inner wall and the electrical efficiency was studies for the case of a Reynolds number of 5000 because this flow rate provided the highest thermo-hydraulic performance, as seen in Figure 8f. For the peak summer conditions, the PV surface temperatures for the BIPV/T channel with no ribbing (i.e., smooth channel), circular ribbing, semi-circular ribbing, square ribbing and triangular ribbing are 68.8 °C, 69.8 °C, 58.3 °C, 57.9 °C and 56.8 °C, respectively (Figure 10a). The better heat transfer enhancement exhibited by the triangular ribs is reflected in the reduction in the PV surface temperature. Consequently, the electrical efficiency is increased from 12.4% for the BIPV/T with a smooth channel to 13.2% for the BIPV/T with triangular ribs. Furthermore, the inner wall surface temperatures for the BIPV/T channel with no ribbing (i.e., smooth channel), circular ribbing, semi-circular ribbing, square ribbing and triangular ribbing are 46.0 °C, 42.1 °C, 40.0 °C, 39.9 °C and 39.3 °C, respectively. These values correspond to building heat gains of 6.16 W/m2, 5.07 W/m2, 4.50 W/m2, 4.45 W/m2 and 4.31 W/m2, respectively (Figure 10b). The building heat gain is reduced by 30% for the BIPV/T air channel with triangular ribs.

4.3. Effect of Relative Pitch Ratio (p/e)

4.3.1. Effect of Relative Pitch Ratio on Nusselt Number, Friction Factor and Thermohydraulic Performance Parameter

The transverse roughness rib with the triangular shape showed the optimal thermo-hydraulic performance; hence, further parametric analysis is conducted to understand the impacts of the relative roughness pitch (p/e) on the Nusselt number, friction factor and thermodynamic performance parameter. The impact of p/e on the heat transfer and flow characteristics is studied for a triangular rib with a relative roughness height of 0.10.
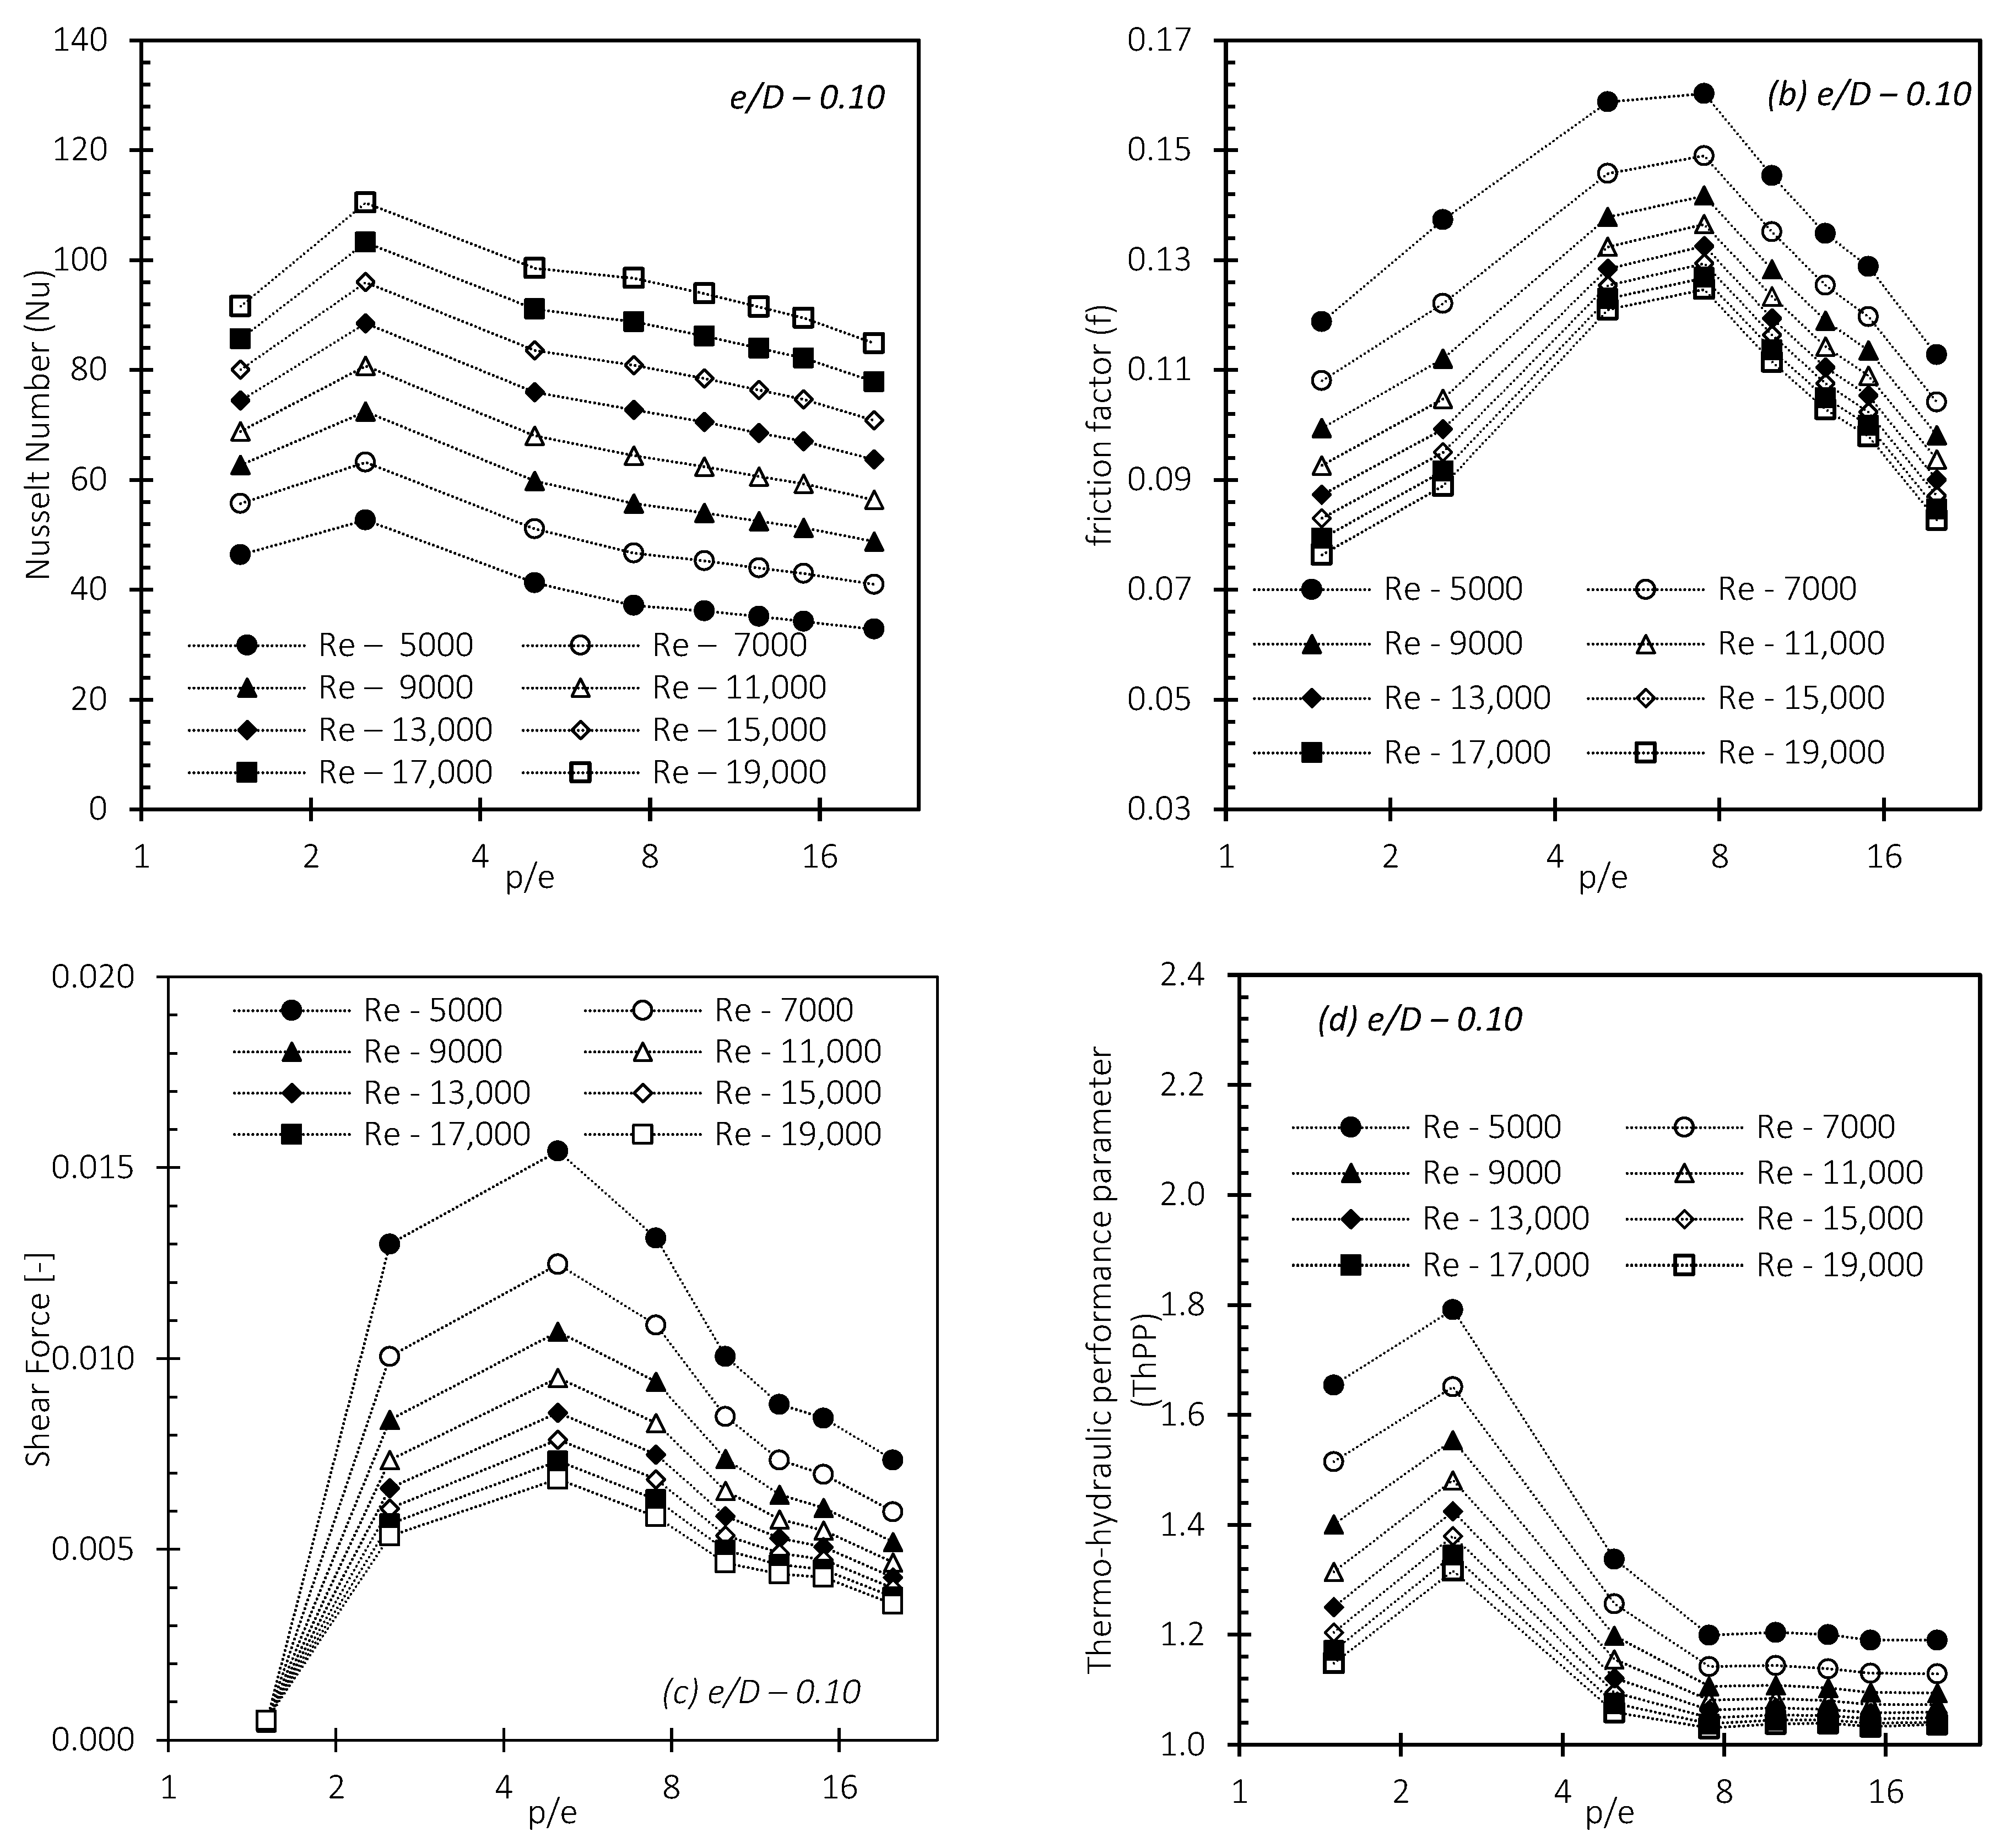
Figure 11a shows the effects of varying p/e values on the Nusselt number. As seen in Figure 11a, the Nusselt number is maximized at a p/e of 2.5 for the range of Reynolds number values considered. This corresponds to a maximum heat transfer enhancement ratio of 2.74 for a flow condition of Re = 5000 when compared with a smooth channel at the same flow conditions. The optimal p/e value of 2.5 is suggestive of a skimming flow regime. Under this optimal rib arrangement, the secondary vortex flow structures formed between consecutive ribs aid efficient heat exchange between the heat source and the heat sink (i.e., the heat transfer medium) in the near-wall flow.
In Figure 11b, the p/e that maximizes the friction factor is not clear because the friction factors for p/e values of 5 and 7.5 are similar (i.e., within the error limits of the validated CFD model). For instance, for the Re = 5000 flow condition, the friction factors for p/e values of 5 and 7.5 are 0.1568 and 0.1603, respectively, which are within 1% of each other. Recall that the friction factor was validated to within ±8% of the experimental value; hence, it can be said that the friction factors for p/e values of 5 and 7.5 are similar. The true optimal p/e value that maximizes the friction factor can be determined by integrating the wall shear stress profiles under the fully developed flow condition. The integral of the wall shear stress quantifies the pressure loss associated with either the recirculation flow, the reattached flow or both. Figure 11c shows that the relative pitch ratio that maximizes the friction factor is p/e = 5 because the shear force (i.e., the integral of the shear stress) is maximized. Furthermore, the thermohydraulic performance parameter is maximized for a p/e of 2.5 and a Re of 5000 (Figure 11d). The maximum thermo-hydraulic performance parameter is 1.79.

4.3.2. Effect of Relative Pitch Ratio on Building Heat Gain and Electrical Efficiency

Figure 12a shows the impact of varying the roughness pitch (p/e) on the PV surface temperature. The PV surface temperature increases from 41.3 °C for a p/e of 1.5 to 62.9 °C for a p/e of 20. As the pitch of the roughness element is increased, the PV surface temperature approaches that of a smooth BIPV channel (i.e., 68.8 °C). Consequently, the electrical efficiency reduces from 14.3% for a p/e of 1.5 to 12.8% for a p/e of 20. The roughness elements typically experience the coldest temperatures because they are immersed in the fluid. The lower the p/e value, the higher the rib count for the same channel length and the colder the PV surface temperature. This translates to a reduced inner surface temperature, as seen in Figure 12b. The inner wall surface temperature increases from 33.7 °C for a p/e of 1.5 to 41.9 °C for a p/e of 20. Consequently, the summer heat gain increases from 2.73 W/m2 for a p/e of 1.5 to 5.03 W/m2 for a p/e of 20. This is an 84% increase in the wall heat gain for the range of p/e values considered. Compared to the smooth channel, the building heat gain can be reduced by up to 126% for a p/e of 1.5.

4.4. Effect of Relative Roughness Height (e/D)

4.4.1. Effect of Relative Roughness Height on Nusselt Number, Friction Factor and Thermohydraulic Performance Parameter

Figure 13a shows the effect of e/D on the convective heat transfer coefficient for a p/e of 2.5 and 5000 ≤ Re ≤ 19,000. For Re ≤ 9000, the Nusselt number is maximized at an e/D of 0.05, while the Nusselt number is maximized at an e/D of 0.03 for Re > 9000. As the height of the roughness is increased, the turbulence is created farther from the surface of the absorber plate, which does not translate to an increase in the heat transfer coefficient. For the list of variables considered, the maximum heat transfer enhancement of 2.73 occurs at the Re = 5000 flow condition and an e/D of 0.07.
The effect of the relative roughness height on the friction factor can be seen in Figure 13b. As expected, the friction factor increases with the increase in the relative roughness height due to an increase in the turbulence kinetic energy. Similarly, the friction penalty increases with the increase in the relative roughness height. The maximum friction penalty is 3.65, and it occurs at an e/D of 0.10 and a flow condition of Re = 5000. The effect of changing e/D on the thermo-hydraulic performance parameter can be seen in Figure 13c. The thermo-hydraulic performance analysis shows that the configuration of the triangular roughness element that maximizes the Nusselt number and minimizes the friction factor of the system is a p/e of 2.5 and an e/D of 0.07 for a flow condition of Re = 5000.

4.4.2. Effect of Relative Roughness Height on Building Heat Gain and Electrical Efficiency

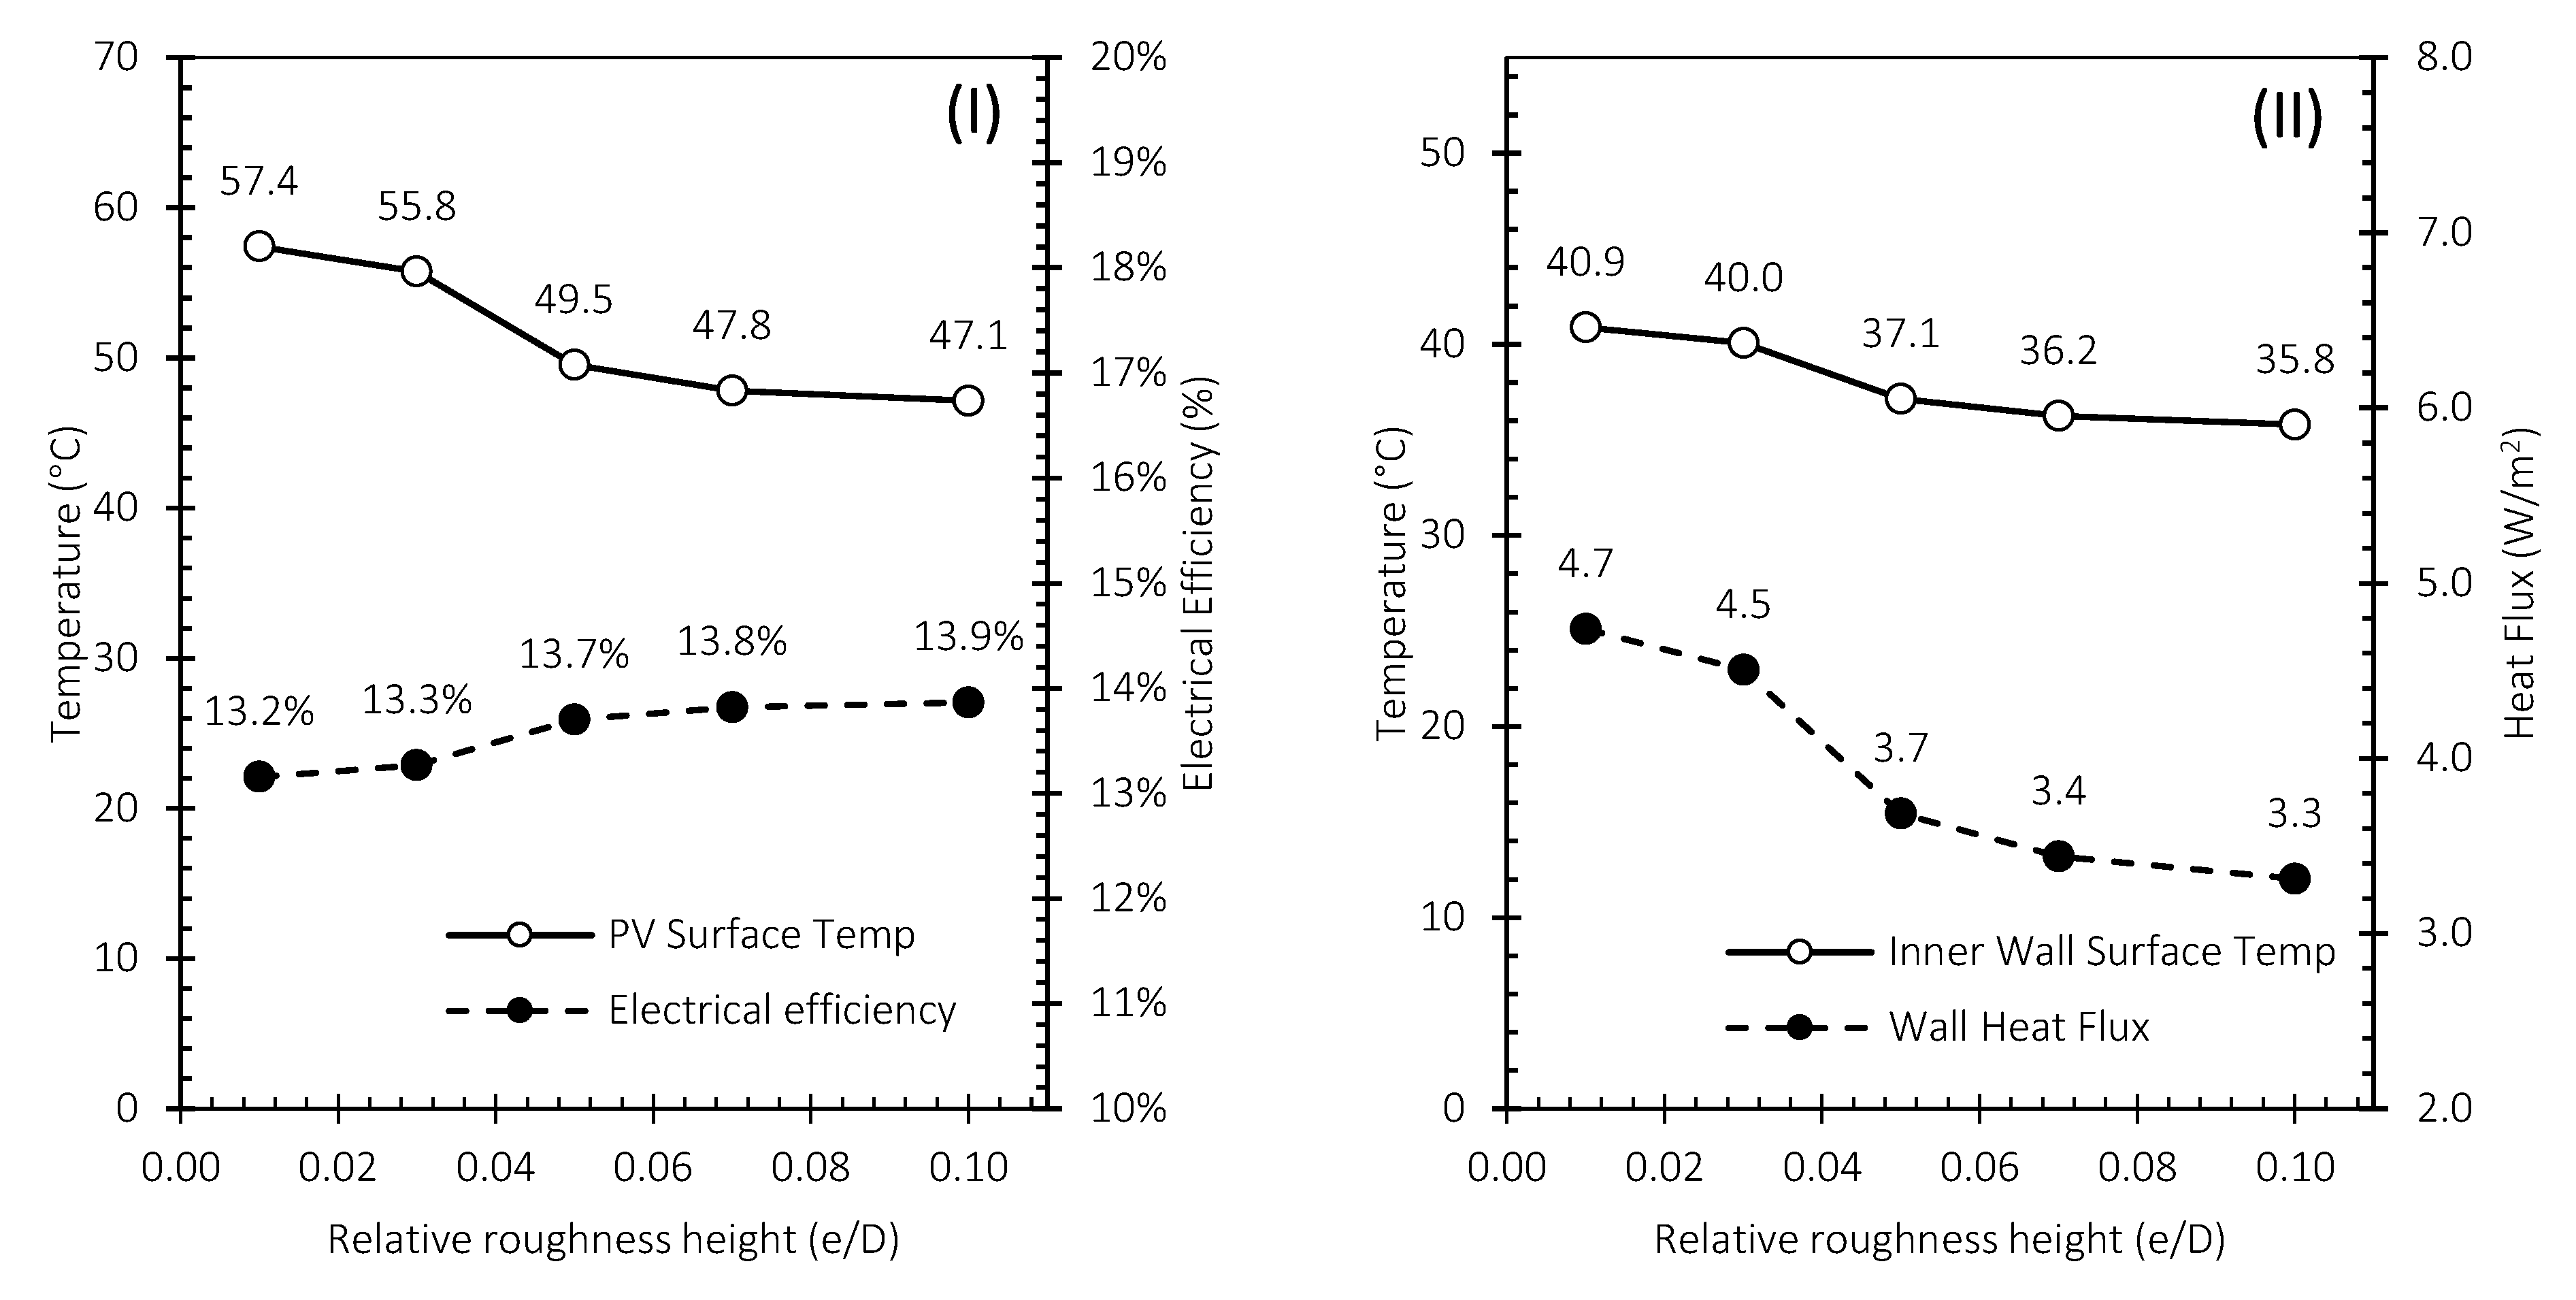
Figure 14I shows the impact of varying the roughness height on the PV surface temperature for peak summer conditions. The PV surface temperature decreases from 57.4 °C for an e/D of 0.01 to 47.1 °C for an e/D of 0.10. This corresponds to an increase in the electrical efficiency from 13.2% for an e/D of 0.01 to 13.9% for an e/D of 0.10. In addition, in Figure 14II, the inner surface temperature also decreases from 40.9 °C to 35.8 °C as the roughness height (e/D) is increased from 0.01 to 0.10. Consequently, the summer heat gain decreases from 4.7 W/m2 for an e/D of 0.01 to 3.3 W/m2 for an e/D of 0.10.

4.5. Development of Correlation for Nusselt Number and Friction Factor

Correlations for the dimensionless heat transfer coefficient and friction factor as functions of the relative roughness pitch (p/e), relative roughness height (e/D) and Reynolds number for the different rib shapes are given in Equation (10) to Equation (17). As seen in Table 4, the developed correlations are accurate in predicting the heat transfer and flow quantities, with R2 values of no less than 91%.

5. Conclusions

In this study, the energy impacts of appending transverse rib roughness elements to a BIPV/T air channel were evaluated using validated CFD. The impacts of the rib shape (i.e., square, triangle, circle and semi-circle), relative rib height (i.e., 0.01 ≤ e/D ≤ 0.10) and relative pitch ratio (i.e., 1.5 ≤ p/e ≤ 20) on the thermo-hydraulic performance parameter, the electrical efficiency and the building heat gain/loss were investigated; e is the rib height, D is the hydraulic diameter, and p is the rib spacing. In each instance, the Reynolds number is varied from 5000–19,000. The detailed CFD study revealed three distinct near-wall flow structures which are dependent only on the relative pitch ratio. The flow structures are categorized as a skimming flow regime for p/e < 3.5, wake interference flow for 3.5 < p/e < 9.5 and isolated roughness flow for p/e > 9.5. Furthermore, the triangular ribbing with a relative pitch ratio (p/e) and relative rib height (e/D) of 0.07 maximized the thermo-hydraulic performance for a Reynolds number flow condition of 5000. The thermo-hydraulic performance parameter is 1.93 for the optimized transverse rib geometry. Under summer conditions, the heat transfer enhancement afforded by the optimized rib geometry was reflected in a reduction in the PV surface temperature of up to 21.0 °C, such that the electrical efficiency was increased by 11.3% compared to a BIPV/T envelope system with a smooth channel. Consequently, the inner wall outside temperature was reduced by 9.8 °C, such that the building heat gain was reduced by 45.2%.

Author Contributions

Conceptualization, B.N., F.T. and G.B.; Methodology, B.N. and F.T.; Software, B.N.; Validation, B.N. and G.B.; Formal analysis, B.N. and F.T.; Investigation, B.N.; Resources, F.T. and G.B.; Data curation, B.N.; Writing—original draft, B.N.; Writing—review & editing, F.T. and G.B.; Visualization, B.N.; Supervision, F.T. and G.B.; Funding acquisition, F.T. All authors have read and agreed to the published version of the manuscript.

Funding

This research received no external funding.

Acknowledgments

The authors would like to acknowledge SharcNet for providing access to their high-performance computation (HPC) facility and excellent support from their technical staff. The research support from the Natural Sciences and Engineering Research Council of Canada (NSERC) Canada Research Chair awards for both the second and the third authors are much appreciated. The financial support provided by the School of Construction and the Environment at the British Columbia Institute of Technology (BCIT) is also acknowledged.

Conflicts of Interest

The authors declare no conflict of interest.

References

  1. Lai, C.M.; Hokoi, S. Solar façades: A review. Build. Environ. 2015, 91, 152–165. [Google Scholar] [CrossRef]
  2. Agathokleous, R.A.; Kalogirou, S.A. Double skin facades (DSF) and building integrated photovoltaics (BIPV): A review of configurations and heat transfer characteristics. Renew. Energy 2016, 89, 743–756. [Google Scholar] [CrossRef]
  3. Peng, C.; Huang, Y.; Wu, Z. Building-integrated photovoltaics (BIPV) in architectural design in China. Energy Build. 2011, 43, 3592–3598. [Google Scholar] [CrossRef]
  4. Jelle, B.P.; Breivik, C.; Røkenes, H.D. Building integrated photovoltaic products: A state-of-the-art review and future research opportunities. Sol. Energy Mater. Sol. Cells 2012, 100, 69–96. [Google Scholar] [CrossRef] [Green Version]
  5. Fossa, M.; Ménézo, C.; Leonardi, E. Experimental natural convection on vertical surfaces for building integrated photovoltaic (BIPV) applications. Exp. Therm. Fluid Sci. 2008, 32, 980–990. [Google Scholar] [CrossRef]
  6. Athienitis, A.K.; Bambara, J.; O’Neill, B.; Faille, J. A prototype photovoltaic/thermal system integrated with transpired collector. Sol. Energy 2011, 85, 139–153. [Google Scholar] [CrossRef]
  7. Chen, Y.; Athienitis, A.K.; Galal, K. Modeling, design and thermal performance of a BIPV/T system thermally coupled with a ventilated concrete slab in a low energy solar house: Part 1, BIPV/T system and house energy concept. Sol. Energy 2010, 84, 1892–1907. [Google Scholar] [CrossRef]
  8. Corbin, C.D.; Zhai, Z.J. Experimental and numerical investigation on thermal and electrical performance of a building integrated photovoltaic–thermal collector system. Energy Build. 2010, 42, 76–82. [Google Scholar] [CrossRef]
  9. Dubey, S.; Sandhu, G.S.; Tiwari, G.N. Analytical expression for electrical efficiency of PV/T hybrid air collector. Appl. Energy 2009, 86, 697–705. [Google Scholar] [CrossRef]
  10. Kamel, R.S.; Fung, A.S. Modeling, simulation and feasibility analysis of residential BIPV/T+ ASHP system in cold climate—Canada. Energy Build. 2014, 82, 758–770. [Google Scholar] [CrossRef]
  11. Pantic, S.; Candanedo, L.; Athienitis, A.K. Modeling of energy performance of a house with three configurations of building-integrated photovoltaic/thermal systems. Energy Build. 2010, 42, 1779–1789. [Google Scholar] [CrossRef]
  12. Peng, J.; Lu, L.; Yang, H.; Han, J. Investigation on the annual thermal performance of a photovoltaic wall mounted on a multi-layer façade. Appl. Energy 2013, 112, 646–656. [Google Scholar] [CrossRef]
  13. Zogou, O.; Stapountzis, H. Energy analysis of an improved concept of integrated PV panels in an office building in central Greece. Appl. Energy 2011, 88, 853–866. [Google Scholar] [CrossRef]
  14. Patil, A.K.; Saini, J.S.; Kumar, K. Experimental Investigation of Enhanced Heat Transfer and Pressure Drop in a Solar Air Heater Duct with Discretized Broken V-Rib Roughness. J. Sol. Energy Eng. 2015, 137, 021013. [Google Scholar] [CrossRef]
  15. Kumar, A.; Kim, M.H. Effect of roughness width ratios in discrete multi V-rib with staggered rib roughness on overall thermal performance of solar air channel. Sol. Energy 2015, 119, 399–414. [Google Scholar] [CrossRef]
  16. Pandey, N.K.; Bajpai, V.K. Experimental investigation of heat transfer augmentation using multiple arcs with gap on absorber plate of solar air heater. Sol. Energy 2016, 134, 314–326. [Google Scholar] [CrossRef]
  17. Yang, T.; Athienitis, A.K. A study of design options for a building integrated photovoltaic/thermal (BIPV/T) system with glazed air collector and multiple inlets. Sol. Energy 2014, 104, 82–92. [Google Scholar] [CrossRef]
  18. Yang, T.; Athienitis, A.K. Experimental investigation of a two-inlet air-based building integrated photovoltaic/thermal (BIPV/T) system. Appl. Energy 2015, 159, 70–79. [Google Scholar] [CrossRef]
  19. Rounis, E.D.; Athienitis, A.K.; Stathopoulos, T. Multiple-inlet Building Integrated Photovoltaic/Thermal system modelling under varying wind and temperature conditions. Sol. Energy 2016, 139, 157–170. [Google Scholar] [CrossRef] [Green Version]
  20. Gawande, V.B.; Dhoble, A.S.; Zodpe, D.B.; Chamoli, S. Experimental and CFD investigation of convection heat transfer in solar air heater with reverse L-shaped ribs. Sol. Energy 2016, 131, 275–295. [Google Scholar] [CrossRef]
  21. Poongavanam, G.K.; Panchabikesan, K.; Leo AJ, D.; Ramalingam, V. Experimental investigation on heat transfer augmentation of solar air heater using shot blasted V-corrugated absorber plate. Renew. Energy 2018, 127, 213–229. [Google Scholar] [CrossRef]
  22. Gawande, V.B.; Dhoble, A.S.; Zodpe, D.B. Effect of roughness geometries on heat transfer enhancement in solar thermal systems—A review. Renew. Sustain. Energy Rev. 2014, 32, 347–378. [Google Scholar] [CrossRef]
  23. Agathokleous, R.A.; Kalogirou, S.A. Part I: Thermal analysis of naturally ventilated BIPV system: Experimental investigation and convective heat transfer coefficients estimation. Sol. Energy 2018, 169, 673–681. [Google Scholar] [CrossRef]
  24. Skullong, S.; Thianpong, C.; Promvonge, P. Effects of rib size and arrangement on forced convective heat transfer in a solar air heater channel. Heat Mass Transf. 2015, 51, 1475–1485. [Google Scholar] [CrossRef]
  25. Nghana, B.; Tariku, F.; Bitsuamlak, G. Numerical assessment of the impact of transverse roughness ribs on the turbulent natural convection in a BIPV air channel. Build. Environ. 2022, 217, 109093. [Google Scholar] [CrossRef]
  26. Yadav, A.S.; Bhagoria, J.L. A CFD based thermo-hydraulic performance analysis of an artificially roughened solar air heater having equilateral triangular sectioned rib roughness on the absorber plate. Int. J. Heat Mass Transf. 2014, 70, 1016–1039. [Google Scholar] [CrossRef]
  27. Incropera, F.P.; Lavine, A.S.; Bergman, T.L.; DeWitt, D.P. Fundamentals of Heat and Mass Transfer; Wiley and Sons: Hoboken, NJ, USA, 2007. [Google Scholar]
  28. Ji, J.; He, H.; Chow, T.; Pei, G.; He, W.; Liu, K. Distributed dynamic modeling and experimental study of PV evaporator in a PV/T solar-assisted heat pump. Int. J. Heat Mass Transf. 2009, 52, 1365–1373. [Google Scholar] [CrossRef]
  29. Nghana, B.; Tariku, F.; Bitsuamlak, G. Assessing ventilation cavity design impact on the energy performance of rainscreen wall assemblies: A CFD study. Build. Environ. 2021, 196, 107789. [Google Scholar] [CrossRef]
  30. ASHRAE. 2017 ASHRAE Handbook: Fundamentals; ASHRAE: Peachtree Corners, GA, USA, 2017. [Google Scholar]
  31. STAR CCM + Users Manual. Available online: http://www.cd-adapco.com/products/star-ccm/documentation (accessed on 14 June 2019).
  32. Kumar, R.; Kumar, A.; Goel, V. Performance improvement and development of correlation for friction factor and heat transfer using computational fluid dynamics for ribbed triangular duct solar air heater. Renew. Energy 2019, 131, 788–799. [Google Scholar] [CrossRef]
  33. Chai, T.; Draxler, R.R. Root mean square error (RMSE) or mean absolute error (MAE)?—Arguments against avoiding RMSE in the literature. Geosci. Model Dev. 2014, 7, 1247–1250. [Google Scholar] [CrossRef] [Green Version]
  34. Karwa, R.; Solanki, S.C.; Saini, J.S. Heat transfer coefficient and friction factor correlations for the transitional flow regime in rib-roughened rectangular ducts. Int. J. Heat Mass Transf. 1999, 42, 1597–1615. [Google Scholar] [CrossRef]
  35. Awol, A.; Bitsuamlak, G.T.; Tariku, F. Numerical estimation of the external convective heat transfer coefficient for buildings in an urban-like setting. Build. Environ. 2020, 169, 106557. [Google Scholar] [CrossRef]
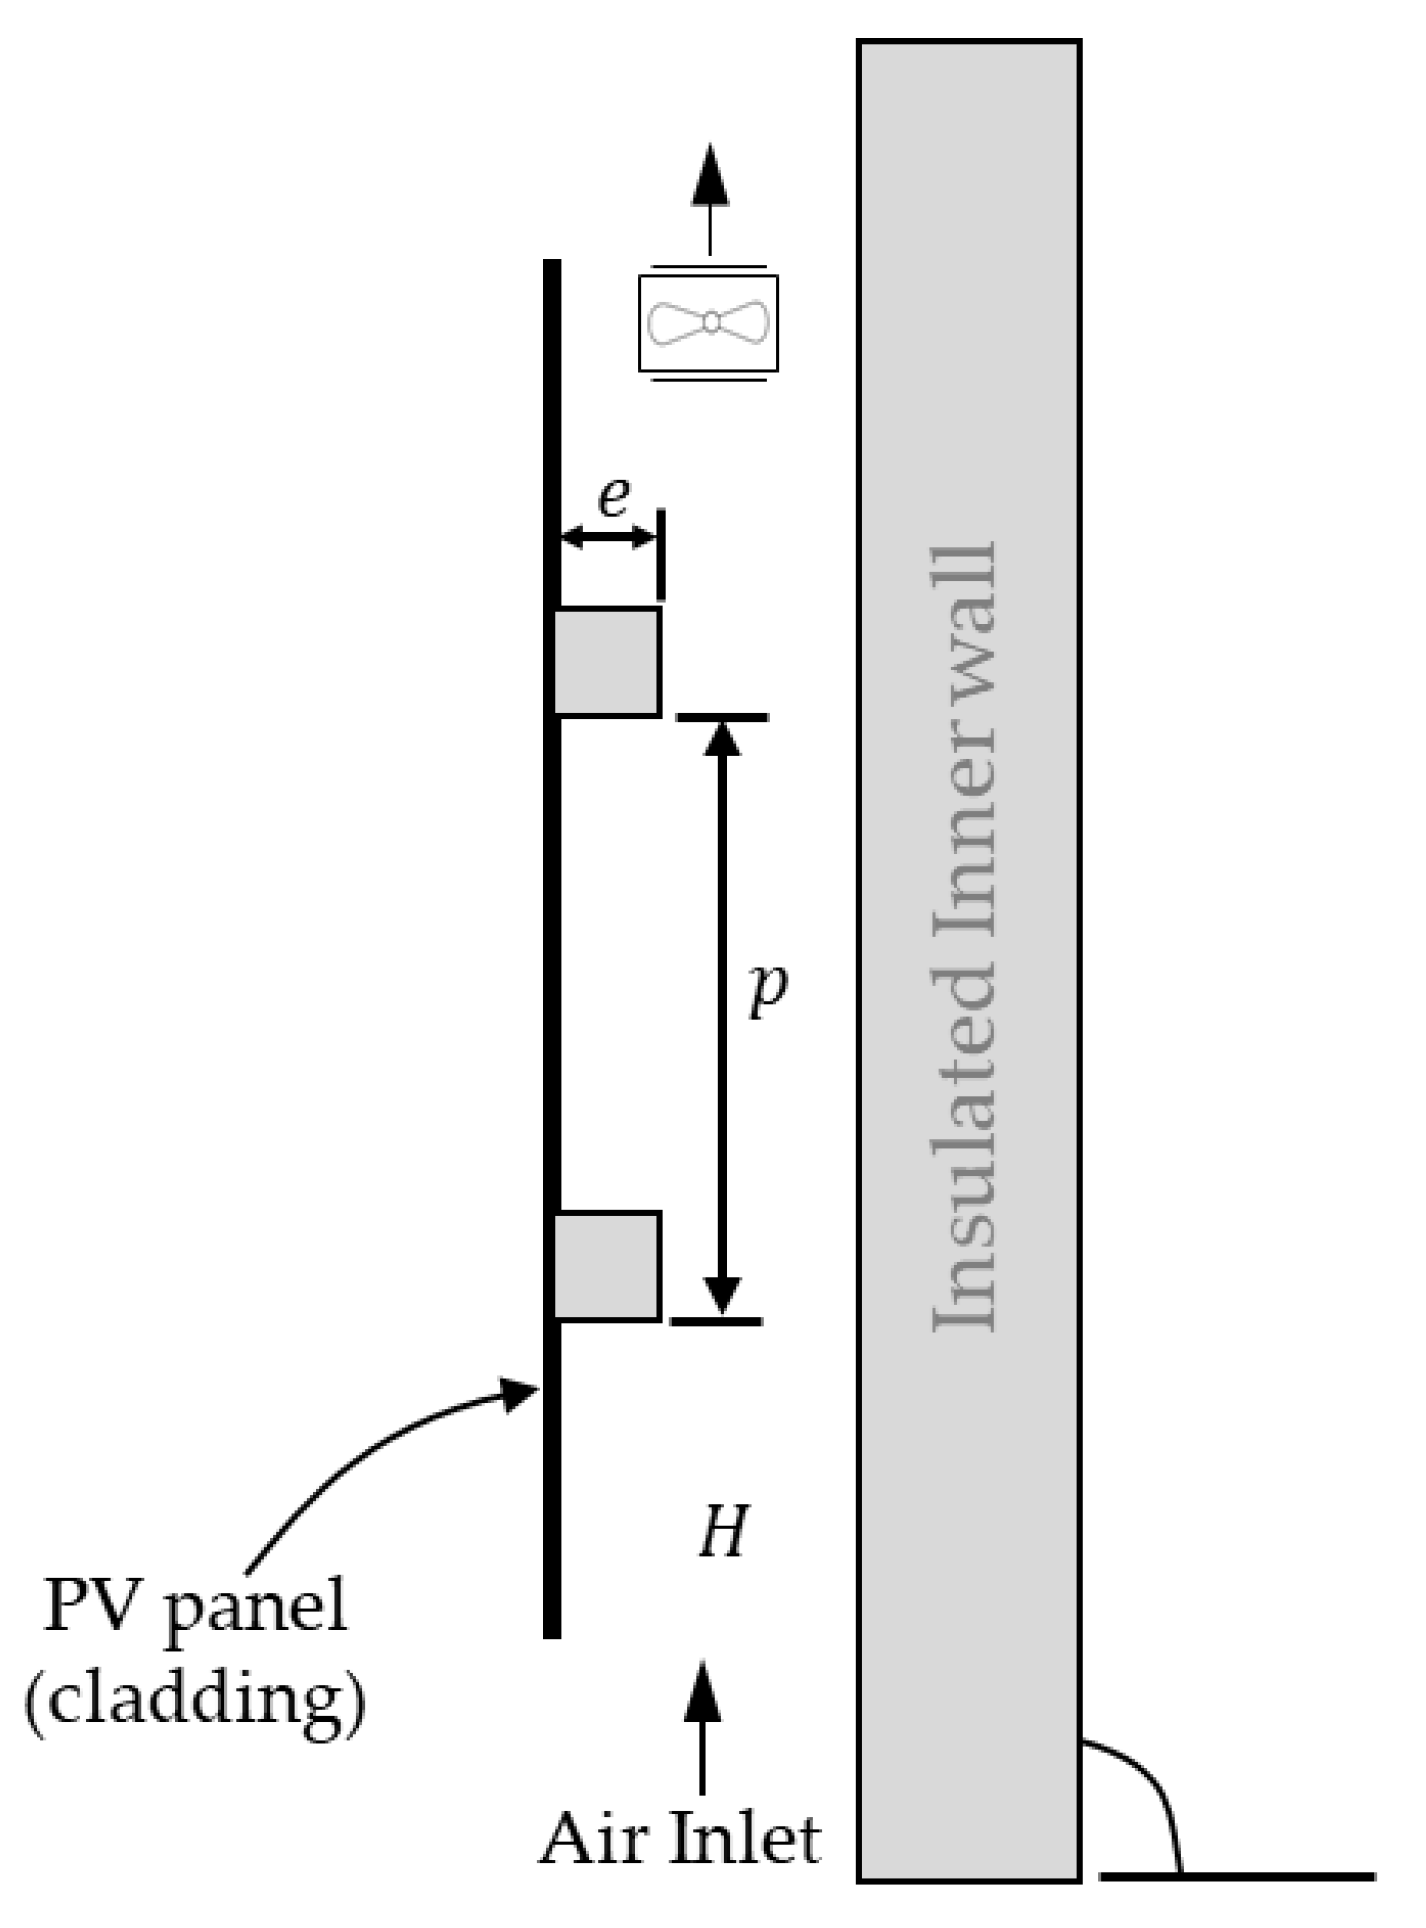
Figure 1. Schematic of the BIPV/T system [23].
Energies 16 05266 g001
Figure 2. Illustration of; (a) the experimental setup [24]; (b) the detailed geometry of the test section; (c) the 2D computational representation of the experimental setup; and (d) the transverse rib geometries considered; (i) square, (ii) triangle, (iii) circle, (iv) semi-circle. [25].
Energies 16 05266 g002
Figure 3. Mesh of computational domain.
Energies 16 05266 g003
Figure 4. Comparison of the numerically derived Nusselt number with experimental data [24].
Energies 16 05266 g004
Figure 5. Comparison of the numerically derived friction factor with experimental data [24,34].
Energies 16 05266 g005
Figure 6. Wall shear stress between consecutive ribs to determine the (a) lower-bound and (b) upper-bound of the wake interference region (Re—3000; e/D—0.10).
Energies 16 05266 g006
Figure 7. Wall shear stress profiles showing similarity of flows for different e/D values for the (a) lower bound and (b) upper bound of the wake interference region factor.
Energies 16 05266 g007
Figure 8. Effects of varying the transverse rib profile on: (a) Nusselt number at high heat flux, (b) Nusselt number at low heat flux, (c) heat transfer enhancement ratio, (d) friction factor, (e) friction factor enhancement ratio and (f) thermo-hydraulic performance parameter, for an e/D of 0.10 and a p/e of 7.5.
Energies 16 05266 g008
Figure 9. Comparison of the unit length, fully developed wall shear stress for the rib shapes considered having an e/D of 0.10 and a p/e of 7.5.
Energies 16 05266 g009
Figure 10. Effect of varying the transverse rib shape on the (a) PV electrical efficiency and the (b) wall heat flux.
Energies 16 05266 g010
Figure 11. Effect of varying the relative roughness pitch on the (a) Nusselt number, (b) friction factor, (c) wall shear stress, (d) thermo-hydraulic performance parameter.
Energies 16 05266 g011
Figure 12. Effect of varying the relative pitch ratio (p/e) on the (a) PV electrical efficiency and the (b) wall heat flux.
Energies 16 05266 g012
Figure 13. The effect of varying the relative roughness pitch on the (a) Nusselt number, (b) friction factor and (c) thermo-hydraulic performance parameter.
Energies 16 05266 g013
Figure 14. Effect of varying the relative roughness height (e/D) on the (I) PV electrical efficiency and the (II) wall heat flux.
Energies 16 05266 g014
Table 1. Summary of parameters examined in the numerical study.
ParameterValues
Geometrical parameters
Rib shapeCircle, semi-circle, square and triangle
Rib height (e), mm1–10
Rib axial pitch (p), mm5–100
Relative rib height (e/D)0.01–0.10
Relative rib pitch (p/e)1.5–20
Heat transfer and flow parameters
Reynolds number (Re)5000–19,000
Heat flux, W/m2200, 400, 1000
Table 2. Summary of mesh independency study.
No.Grid CountNu% Increase in Nuf% Increase in f
197,55344.443-0.1225-
2172,91644.277−0.37%0.12592.74%
3377,00744.202−0.17%0.1250−0.66%
Table 3. Description of flow regime based on the relative roughness pitch (p/e).
Flow RegimeVelocity Contour a,b
p/e < 3.5
Skimming c
Energies 16 05266 i001
Energies 16 05266 i002
3.5 < p/e < 9.5
Wake interference d
Energies 16 05266 i003
Energies 16 05266 i004
p/e > 9.5
Isolated roughness e
Energies 16 05266 i005
Energies 16 05266 i006
a The velocity contours are presented with similar velocity scales ranging from −0.15 m/s to 5 m/s. b The velocity contours are shown for Re = 13,000; e/D = 0.10 (top) and e/D = 0.02 (bottom). c Velocity contour shown for p/e = 2.5 for the top and bottom plots. d Velocity contour shown for p/e = 7.5 for the top and bottom plots. e Velocity contour shown for p/e = 10 for the top plot and p/e = 12.5 for the bottom plot.
Table 4. Correlations of Nusselt number and friction factor for the different rib geometries considered.
Triangular rib:
N u = R e 0.7079 ( p e ) 0.123 ( 4.6596 ( e D ) 2 + 0.7017 ( e D ) + 0.0895 ) R2: 0.93(10)
f = R e 0.299 e 9.3271 ( e D ) ( 0.001625 ( p e ) 2 + 0.034005 ( p e ) + 0.623332 ) R2: 0.94(11)
Circular rib:
N u = 0.0326   R e 0.7079 e x p { 0.1058   l n ( p e ) 2 } × ( e D ) 0.0435 × l n ( p e ) 0.6199 R2: 0.99(12)
f = 4.682   R e 0.338 ( e D ) 1.0413 × ( p e ) 1.5825 × e x p { 0.0884 ln ( p e ) 3 0.6871 ln ( p e ) 2 + 0.1097   ln ( e D ) 2 } R2: 0.96(13)
Square rib:
N u s q u a r e = 0.7669   N u t r i a n g l e + 7.03 R2: 0.93(14)
f s q u a r e = 0.86613   f t r i a n g l e 0.0042564 R2: 0.91(15)
Semi-circular rib:
N u s e m i c i r c l e = 0.7943   N u t r i a n g l e + 5.9965 R2: 0.96(16)
f s e m i c i r c l e = 0.87523   f t r i a n g l e 0.0085587 R2: 0.96(17)
Disclaimer/Publisher’s Note: The statements, opinions and data contained in all publications are solely those of the individual author(s) and contributor(s) and not of MDPI and/or the editor(s). MDPI and/or the editor(s) disclaim responsibility for any injury to people or property resulting from any ideas, methods, instructions or products referred to in the content.