Article

Numerical Study on Sensitivity of Turbofan Engine Performance to Blade Count of Centrifugal Compressor Impeller

by
Arkadiusz Bednarz
1,*,†,
Kirill Kabalyk
2,*,†,
Robert Jakubowski
1 and
Rafał Bartłomowicz
1
1
Faculty of Mechanical Engineering and Aeronautics, Rzeszow University of Technology, Ave. Powstanców Warszawy 12, 35-959 Rzeszów, Poland
2
Institute of Turbomachinery, Lodz University of Technology, Wólczańska 217/221, 93-005 Łódz, Poland
*
Authors to whom correspondence should be addressed.
These authors contributed equally to this work.
Energies 2023, 16(14), 5251; https://doi.org/10.3390/en16145251
Submission received: 26 May 2023 / Revised: 4 July 2023 / Accepted: 6 July 2023 / Published: 8 July 2023

Abstract

:
The aim of this publication was to investigate the effects the blade count of a high-pressure centrifugal compressor’s impeller has on the performance of the DGEN 380 turbine engine at take-off. The study began with the development of a zero-dimensional thermo-fluid model of the engine. The model was matched with experimental data from the WESTT CS/BV virtual test bench for the baseline count and then implemented to analyse the engine behaviour at alternative counts. The corresponding changes in the compressor pressure ratio and efficiency were modelled in a commercial 3D CFD software and transferred to the zero-dimensional model with proper scaling. The results proved that the baseline design lied in the optimal range of thrust-specific fuel consumption. The increase in the blade count led to a crisis of the aerodynamic loading at the splitters, so that no further rise in the pressure ratio could be achieved. The results of the study could be implemented by mechanical engineers while solving the tasks of the maintenance and modernisation of gas turbines with radial compressors.

1. Introduction

The blade number is known to be a crucial design parameter of every annular cascade presented in a modern aircraft jet engine. Its aerodynamic significance lies in the definition of solidity and, therefore, the balance between the effective flow deflection, blade loading, friction losses, and area contraction effects [1]. Its main structural role is to ensure resonance-free rotor–stator interactions inside the nominal range of engine rotational speeds [2,3,4,5,6]. Its acoustic merit stems from its ability to control the amplitude and phase of the tonal noise [7,8]. At a global scale, this implies a direct impact on thrust-specific fuel consumption, carbon footprint, noise emissions, and operational safety.
The impact of cascade solidity (chord-to-pitch ratio) on the aerodynamic performance of either turbines or compressors has been the subject of vast research for more than a century [9]. Decades of experimental activities conducted in wind tunnels resulted in well-established fundamentals of axial cascade aerodynamics available both in the form of reference books [10] and research papers [11]. However, the strong influence of three-dimensional and compressibility effects typical of the fan, HPT, and LPT stages has motivated engineers to go beyond and continuously develop complex design procedures, which would incorporate computational fluid dynamics and mathematical optimisation [12,13,14,15,16].
The radial stages differ from the axial ones by a significantly stronger impact of the Coriolis force on the flow in the impeller [17]. Since stationary wind tunnel tests are unable to reproduce this impact, valid experimental data can come only from a more-expensive rotating rig and are, therefore, less available. Nevertheless, the current state-of-the-art offers a number of approved design strategies, none of which neglects the role of a proper blade number selection [18,19,20]. The majority of researchers agree that, for a given rotational speed and work input factor, the optimal blade number should be searched through the optimisation of the aerodynamic loading.
Recent studies on multi-fidelity “whole-engine” modelling have demonstrated that the approach is able to forecast the sensitivity of engine performance to changes in the geometry of turbo-spool components with substantial accuracy. Turner et al. [21] pioneered the field by coupling the zero-D-cycle procedure, 1D mini-map generator, and 3D CFD APNASA [22] simulations into the technology known as Numerical Propulsion System Simulation (NPSS). It was shown that the initial version of this software could predict the specific fuel consumption ( S F C ) and thrust of the GE90-94B unit within 1% deviation from the data provided by the OEM. In later development stages, the software was fully automated [23] and implemented to study the concepts of novel propulsion systems [24]. Reitenbach et al. [25] presented a DLR version of a multi-fidelity system initially based on the coupling of the zero-D-cycle model to a 2D throughflow solver. The system was linked to the GA optimiser, and then, the Pareto front of the optimal VSV settings discovered substantial room for improvements in both the surge margin and S F C of the IAE-V2500-A5 engine. Later on, Klein et al. [26] integrated 3D high-fidelity simulations with this system, emphasising the role of proper component performance map scaling. The final model was able to reproduce the negative effect of fan blade deterioration at the tip on the engine pressure ratio, S F C , and exit gas temperature [27]. Successes in the application of multi-fidelity modelling have been achieved in the field of stationary GTs as well. Petrović and Wiedermann [28] investigated the performance of an in-house throughflow-based procedure on the cases of single- and twin-shaft industrial gas turbines. The authors finally arrived at the sufficient accuracy of the model to utilise it for maintenance and root-cause analysis purposes.
To the best of the authors’ knowledge, available studies with a focus on the performance of the entire engine have not yet assessed the effect of cascade solidity or blade number on the overall thermodynamic cycle output. The contribution by Saini and Defoe [29] seems to be the closest attempt. The authors investigated the influence of the blade count on the accuracy of Hall’s body-force model [30] applied to an automotive axial fan stage. The highest and the lowest accuracies corresponded to the extreme cases of 5 and 22 blades, respectively, which to a large extent were contributed by the contraction or blade metal blockage effects at the inlet. The model was finally implemented to predict correlations between the blade number, the fan’s work input characteristics, and the distortions of the velocity upstream and downstream of the rotor.
This work intended to introduce the effects of a variable blade count into the zero-dimensional mathematical model of the entire engine in the form of changes in the component’s efficiency borrowed from 3D CFD computations. The considered component was an HPC impeller, since it was found to play a crucial role in the power balance of the studied unit. The ultimate aim of the work was to provide a quantitative insight into the merits of blade number in the resultant engine thrust and specific fuel consumption.

2. Materials and Methods

2.1. Objective and Scope of the Study

The investigation was carried out with the use of the WESTT CS/BV virtual test bench located at the Aerospace Engineering Department of Rzeszów University of Technology (Figure 1a). The test bench was a digital simulator of the DGEN 380 general aviation turbofan offered by Price-Induction SA (currently Akira Technologies [31]). Its hardware incorporates the full-scale performance data of the real engine and enables an execution of virtual manoeuvres with experimental-order accuracy as long as the regions of the flow transients (e.g., rotating stall, surge, etc.) are omitted [32].
The DGEN 380 is a two-spool geared turbofan engine (GTF). Its scheme is presented in Figure 2. It consists of a single-stage fan powered by a single-stage low-pressure turbine with a gear of rotation speed reduction ratio of 3:1 and a single-stage centrifugal compressor in the internal duct powered by a single-stage high-pressure turbine. A reversed flow burner is located between the compressor and the HPT. The engine parameters at take-off are as follows: the air mass flow at the entrance to the engine is 13 kg/s; the maximum thrust is 2550 N; the bypass ratio (BPR) is 7.6; the turbine inlet temperature (TIT) is 1178 K. The weight of the entire engine is approximately 85 kg.
The high-pressure compressor (HPC) stage of the DGEN 380 includes a transonic centrifugal impeller (Figure 1b), a vaned diffuser (VD), and a cascade of outlet guide vanes (OGVs). The baseline impeller has 11 main blades and 11 splitters, an outlet diameter of D 2 = 200 mm, and a backswept configuration ( β b l 2 = 54 ° ). For convenience, the rest of the manuscript will refer to the number of main blades z 1 as the reference blade count. The alternative values of z 1 considered in the study were: 7, 9, and 13.
The research campaign was divided into three steps.
  • In the first step, the reference test data were collected through a series of virtual engine manoeuvres carried out at WESTT CS/BV. The manoeuvres were run at ISA ambient conditions and a take-off thrust level setup, which eventually led to the establishment of a design point for further research.
  • In the second step, the CFD numerical model was developed in ANSYS CFX and then implemented to study the impact of the HPC impeller’s blade number on its performance.
  • In the final step, the results of the CFD simulations were utilised as the input dataset to the analytical zero-D model of the entire engine, and the sensitivity of thrust and specific fuel consumption to z 1 was assessed.
The aforementioned analytical and numerical models are briefly introduced in the following subsections.

2.2. DGEN 380 Engine Analytical Model in MATLAB

The one-dimensional analytical model of the DGEN 380 was prepared in MATLAB and was based on the available representative models of a turbofan with separated core and bypass flows [33,34,35,36,37,38,39,40,41]. The model was split into the main components, i.e., the inlet, fan, HPC compressor, burner, HPT and LPT turbines, bypass and core flow nozzles, and additional components in between: the splitter, as well as intermediate ducts (Figure 3). All components were modelled conservatively and individually in a 1D mean line-averaged fashion. For the turbo components such as the fan, HPT, and LPT, the original DGEN 380 performance maps were implemented, whereas the parameters of the HPC (CPR, efficiency, etc.) were borrowed from the CFD model presented in the following subsection. The pressure losses and efficiencies of the rest of the components (e.g., burner, nozzles, ducts, etc.) were evaluated by matching the thermodynamic cycle parameters of the MATLAB model with the data collected at the WESTT CS/BV test stand for the take-off condition. For convenience, it was assumed that the local losses at these components remained insensitive to the HPC impeller’s blade number.
The model chart in Figure 3 also represents the flow of total temperature T t , total pressure p t , and mass flow rate m ˙ across the system with indexation consistent with the engine’s section nomenclature in Figure 2. The global input parameters were the altitude H, engine (aircraft) flight speed V 0 (assumed as zero for take-off), and ambient temperature correction Δ T , which was omitted in this work. The parameters were utilised to derive the ambient conditions ( p t 0 , T t 0 ) in accordance with the ISA standard and to initialise the model. The model then evaluated the performance of the individual components in a sequence illustrated in the flow-chart (green arrows), matched the power balances of the turbo components (red arrows), and ended at the “Performance calculation” module. The latter served to derive the engine thrust T h and specific fuel consumption S F C :
T h = m ˙ 8 V 8 + m ˙ 18 V 18 m ˙ 0 V 0
S F C = m ˙ f / T h .

2.3. Geometric and CFD 3D Model of HPC Impeller

The 3D CAD model of the baseline HPC impeller (Figure 4b) was built by implementing a reversed-engineering procedure. An STL-model (Figure 4a) was initially acquired through 3D scanning (ATOS Core) and then converted into a solid in the Geomagic Design X 2020.0.2 software. Afterwards, the model was further processed to obtain alternative designs with z 1 = 7 , 9 , 13 , respectively (Figure 4c–e).
Prior to proceeding to the generation of the fluid flow domains, the mass and solidity characteristics of the solid models were compared and are shown in Table 1. The blade number affected the cascade solidity to a significantly larger extent than the impeller’s mass. From the viewpoint of the overall engine performance, this implied that the thrust T h , as well as S F C could be assumed insensitive to the observed changes in m i m p and be treated solely as functions of the impeller’s aerodynamic performance.
The entire CFD modelling workflow was completed in ANSYS Workbench 22R2. The fluid flow domains of the baseline and alternative impellers were prepared in ANSYS SpaceClaim. The grid generation was then carried out in ANSYS Meshing. To first study the sensitivity of the numerical model to the grid size, three tetrahedral meshes of the baseline impeller were built and were categorised as “Medium”, “Fine”, and “Very fine”. The grids differed primarily in the number of elements distributed along the tip gap in the tangential direction. The characteristic parameters of each grid are listed in Table 2.
The resolution of the “Fine” grid (Figure 5b) was found sufficient to bring the grid convergence indices of essential impeller performance parameters under 1%, which will be shown in the next section. This mesh was utilised in the rest of the numerical campaign due to almost three-times faster performance as opposed to the “Very Fine”: 32 s/iteration over 94 s/iteration on an Intel Xeon E2660 (MPI local parallel run on 16 threads).
The solver selected for the implementation of the numerical part of the study was ANSYS CFX 22R2. Since the study focused primarily on the analysis of engine’s performance at the nominal design point, all governing equations were solved in a steady-state Reynolds-averaged fashion. The entire computational domain (Figure 5a) was solved in the rotating frame of reference with counter-rotating walls prescribed at stationary boundaries (whole shroud surface, hub end-wall surfaces upstream and downstream of the impeller’s blade cascade). Turbulence was modelled by the k ω S S T model with the intensity I t u r b and length-scale l t u r b specified at the inlet boundary.
The rest of the boundary conditions involved stagnation pressure and temperature at the inlet ( p t 25 , T t 25 ), integrally averaged static pressure at the outlet p 27 , zero relative velocity at the walls, as well as a lack of external heat transfer. The exact values of the parameters are listed in Table 3. For the spatial discretisation of both the convective, as well as turbulent fluxes, the second-order high-resolution scheme was utilised. The convergence of each simulation was recognised as sufficient after the imbalance parameter lay stably under 0.5% for all governing equations for at least 100 iterations.

3. Results and Discussion

3.1. Virtual Performance Tests

The total pressures, temperatures, and mass flow rates obtained at the WESTT CS/BV test-bench for the reference take-off condition ( z 1 = 11 ) are shown in Table 4. The corresponding engine’s performance parameters are listed in Table 5.
Both datasets were implemented to tune the loss coefficients σ and efficiencies η in the analytical model described in Section 2.2. The parameter set that led the model to a complete match with the virtual experiment is given in Table 6. During the final assessment of the engine’s performance sensitivity to the HPC impeller’s blade number, the only varied parameter was the HPC efficiency η C , whereas the rest of the set was kept constant.

3.2. Mesh Independence

The grid sensitivity study focused on two sets of the HPC performance parameters:
  • Global parameters directly present in the implemented analytical model of the DGEN 380, i.e., HPC total pressure ratio CPR and isentropic efficiency η C ;
  • Local parameters with higher sensitivity to impeller blade number, i.e., inlet relative Mach number M w 1 , work input coefficient I, and slip factor μ [18,42].
The study was based on the procedure recommended by Celik et al. [43], which links the numerical uncertainty of a single parameter with its grid convergence index (GCI). The values of the GCIs were computed for each of the five aforementioned parameters twice: (1) as the grid was coarsened from “Very Fine” to “Fine” resolution ( G C I 32 ) and after further coarsening from “Fine” to “Medium” ( G C I 21 ). The results in Table 7 show that the maximal value of numerical uncertainty reached 2.7% for G C I C P R 21 . This reasonably high uncertainty level resulted in the elimination of the “Medium” grid from the rest of the research. In general, the G C I 32 s were at least by an order of magnitude lower than G C I 21 s and in all cases fell under the magnitude of 1%. The latter served as a solid ground to select the “Fine” resolution as a representative one for further numerical simulations.
Since the blade loading parameter Δ w is known to be a crucial link between the blade number, outlet blade angle, and the resultant theoretic work or CPR [18], its sensitivity to the grid resolution was also assessed. The distributions of the relative flow velocity at the suction ( w s u c ) and pressure ( w p r e s ) sides of the main and splitter blades were plotted over the meridional coordinate M in a normalised fashion (Figure 6a,b). The distributions revealed that the strongest influence of the grid resolution on the blade loading was achieved close to the trailing edge of the main blade, namely at M / L m e r i d = 0.81 . The lower value of w s u c returned by the “Very Fine” grid yielded here a 7% higher local Δ w / w 1 if compared to the “Fine” grid. This also was a reason for the 4.5% difference in the integrally averaged loading of the main blade ( Δ w / w 1 ) a v e M B observed in Figure 6c. Despite their presence, these discrepancies marginally affected the grid convergence of either the global or local parameters reported in Table 7. With the support of this observation, it was eventually decided to affirm the “Fine” resolution as sufficiently accurate to be implemented in the primary part of the numerical study.

3.3. Influence of Blade Number on the Impeller’s Performance

Equation (3) is a classical definition of the CPR as a function of four non-dimensional design parameters: isentropic coefficient κ , tip Mach number M u , total-to-total isentropic efficiency η C , and the work input factor I [18,44]:
C P R = ( 1 + ( κ 1 ) × M u 2 × η C × I ) κ κ 1 .
Since the impeller’s blade number would obviously not affect either κ or M u , the main task of this subsection was to focus on the way it influenced η C and I. To begin with, the numerically derived efficiencies were scaled so that the prediction for z 1 = 11 could match the reference value η C r e f evaluated based on the virtual test data in Table 7. These results are plotted in Figure 7a and demonstrated the possibility of a 1% efficiency rise as the blade number was reduced to z 1 = 9 or 7. There was a rather more pronounced 2% drop of η C as the impeller solidity was raised to z 1 = 13 . The explanation of the flow physics underlying these trends could be based on the contour maps in Figure 7a1–d1, which illustrate the combined inlet-to-outlet distributions of the relative Mach number M w and normalised wall shear stress τ w / τ w r e f . The increase in z 1 obviously resulted in a higher overall friction area, higher contraction (blade metal blockage) at the inlet, and higher levels of M w . Besides, the level of τ w a v e / τ w a v e r e f averaged over the endwall and blades’ surfaces grew gradually from 0.92 at z 1 = 7 to 1.09 at z 1 = 13 (Figure 7b). According to [44], these trends should primarily contribute to the growth of the profile efficiency loss Δ η p r o f expressed as:
Δ η p r o f = 1 1 2 × ζ i m p p r o f I × w 1 2 u 2 2 .
The effect of z 1 on the work input coefficient I was assessed based on Figure 8 and Figure 9. Figure 8a shows that the work input reached the maximum at the baseline z 1 = 11 and declined whenever the solidity decreased ( z 1 = 9 , 7 ) or increased ( z 1 = 13 ). This trend is replicated in Figure 8b in the form of the slip factor plot.
The proportionality of the impeller’s solidity to the work input seen at z 1 11 was apparently a consequence of the growth of the circumferential velocity component at outlet c u 2 [18]. This growth was seen both locally in the form of a larger area covered by higher c u / u 2 in Figure 8c1 over Figure 8a1 and globally in the form of the gradual slip factor increase in Figure 8b. On the other hand, the decline of the work input at z 1 = 13 needs an explanation. The explanation will be based on the analysis of the blade-loading charts in Figure 9.
Reference [45] demonstrated that the relation for the work input factor I could be rewritten as:
I = z 2 2 π τ 1 × Δ w a v e w 1 × w 1 u 2 × 1 D 1 / D 2 s i n ( 0.5 ( β 1 + β 2 ) ) .
In context of this work, the only three variables in Equation (5) are the overall impeller’s blade number z 2 , the integrally averaged blade loading Δ w a v e , and the coefficient of inlet area contraction τ 1 . The graphs and bar charts in Figure 9 show that every consecutive increase of z 2 caused Δ w a v e to drop by a certain rate. Until z 1 11 , this rate was relatively monotonic and remained overweighted by the corresponding increase in solidity, which resulted in an overall incline of the work input. However, as the blade number reached z 1 = 13 , the effect of contraction at the leading edge of the splitter became too high to sustain the amount of splitter loading needed for the further rise of I. It was, therefore, apparent that any increase of z 1 beyond the baseline of z 1 = 11 would affect the performance of the HPC negatively: the increasing friction losses would reduce the efficiency, whereas higher contraction would reduce the work input.

3.4. Analysis of Engine Performance

The implementation of the engine’s zero-D analytical model described in Section 2.2 required a single pre-processing step, namely the determination of the HPC’s total-to-total pressure ratio C P R for each z 1 considered in the study. This was accomplished through the use of Equation (3). The values of η C and I were borrowed from the results of CFD modelling and scaled so that the baseline C P R ( z 1 = 11 ) could match the virtual-test-based value of 4.6. The results normalised by the reference baseline value are presented in Figure 10a. The effect of the blade number on the C P R was minimal (0.2% growth) at z 1 = 9 and maximal (3.1% decline) at z 1 = 13 . The former was a consequence of the higher efficiency counter-balanced by the lower work input, whereas the latter was caused by the mutual efficiency and work input deficit, both explained in Section 3.3 (Figure 7a and Figure 8a).
First, the results of the analytical modelling of the entire engine performance represented the effect of z 1 on the total temperature at either the HPT ( T t 4 ) or LPT ( T t 45 ) inlet and are shown in Figure 10b. The results assumed that variations in T t 45 should imply constant T t 4 and vice versa. Apparently, any change in the HPC blade number did not noticeably affect either T t 45 or T t 4 . The highest impact was achieved at z 1 = 7 , where T t 45 rose by 0.5% and T t 4 fell by 0.4%. Both effects were caused by a lower total enthalpy drop required from the HPT as the HPC work input decreased at z 1 11 .
The influence of z 1 on the engine thrust T h and specific fuel consumption S F C is illustrated in Figure 11 in a normalised form. The reference values correspond to the baseline z 1 = 11 (Table 5). The results suggested that any sensible improvements in engine performance could be gained only at z 1 = 9 . Thrust could be increased by 0.4% with a simultaneous 0.3% decrease in S F C . A higher number of blades ( z 1 = 13 ) introduced a thrust penalty of 1.4% together with a 1.3% S F C rise. The impact of constant total temperature location was negligible, with the exception of z 1 = 7 , where the thrust at T t 4 = c o n s t was higher than at T t 45 = c o n s t to a degree of 0.5%.
From the viewpoint of thermodynamics and the implemented analytical model, the results in Figure 11 reflect the combined effect of the HPC’s efficiency and work input on two quantities:
  • On the isentropic Mach number M s 8 at the outlet of the core nozzle:
    M s 8 = V 8 / κ R T 8 or M s 8 = p t 8 p a t m κ 1 κ 1 × 2 κ 1 1 2 ,
  • On the amount of fuel heat power q ˙ f required to support either the condition of T t 4 = c o n s t or T t 45 = c o n s t :
    q ˙ f = L H V × m ˙ f or q ˙ f = c p × m ˙ 3 × ( T t t u r b T t 3 ) .
The observed inclines in the thrust T h (see Equation (1)) at z 1 = 9 were, therefore, achieved, on the one hand, thanks to the higher p t 8 / p a t m (influence of higher C P R ) and, on the other hand, due to the lower T 8 (influence of higher η C ). The increments in thrust then outweighed the growth of q ˙ f (0.10% for T t 4 = c o n s t and 0.02% for T t 45 = c o n s t ) caused by the decrement of T t 3 (influence of lower work input) and resulted in the observed improvements in S F C .
The above logic is equally applicable to the case of z 1 = 13 . The lowest η C and C P R introduced the strongest thrust deficit, led to the maximal S F C , and eventually, disqualified this design. This also appeared to be consistent with the works [36,37], where the authors emphasised the role of the compressor pressure ratio and efficiency in the optimisation of engine performance.

4. Conclusions

The study considered the sensitivity of the DGEN 380 general aviation geared turbofan’s performance to changes in the HPC impeller’s blade number. The research assumed a steady-state ISA-based take-off condition at sea-level elevation and a constant rotational speed. The performance of the HPC was analysed numerically in a commercial CFD environment. The performance of the entire engine was modelled analytically in MATLAB with the HPC work input and efficiency borrowed from CFD simulations. For the baseline design with 11 main and 11 splitter blades, the analytical model was matched with the virtual test data from the engine’s digital simulator WESTT CS/BV. The most-essential findings are summed up below:
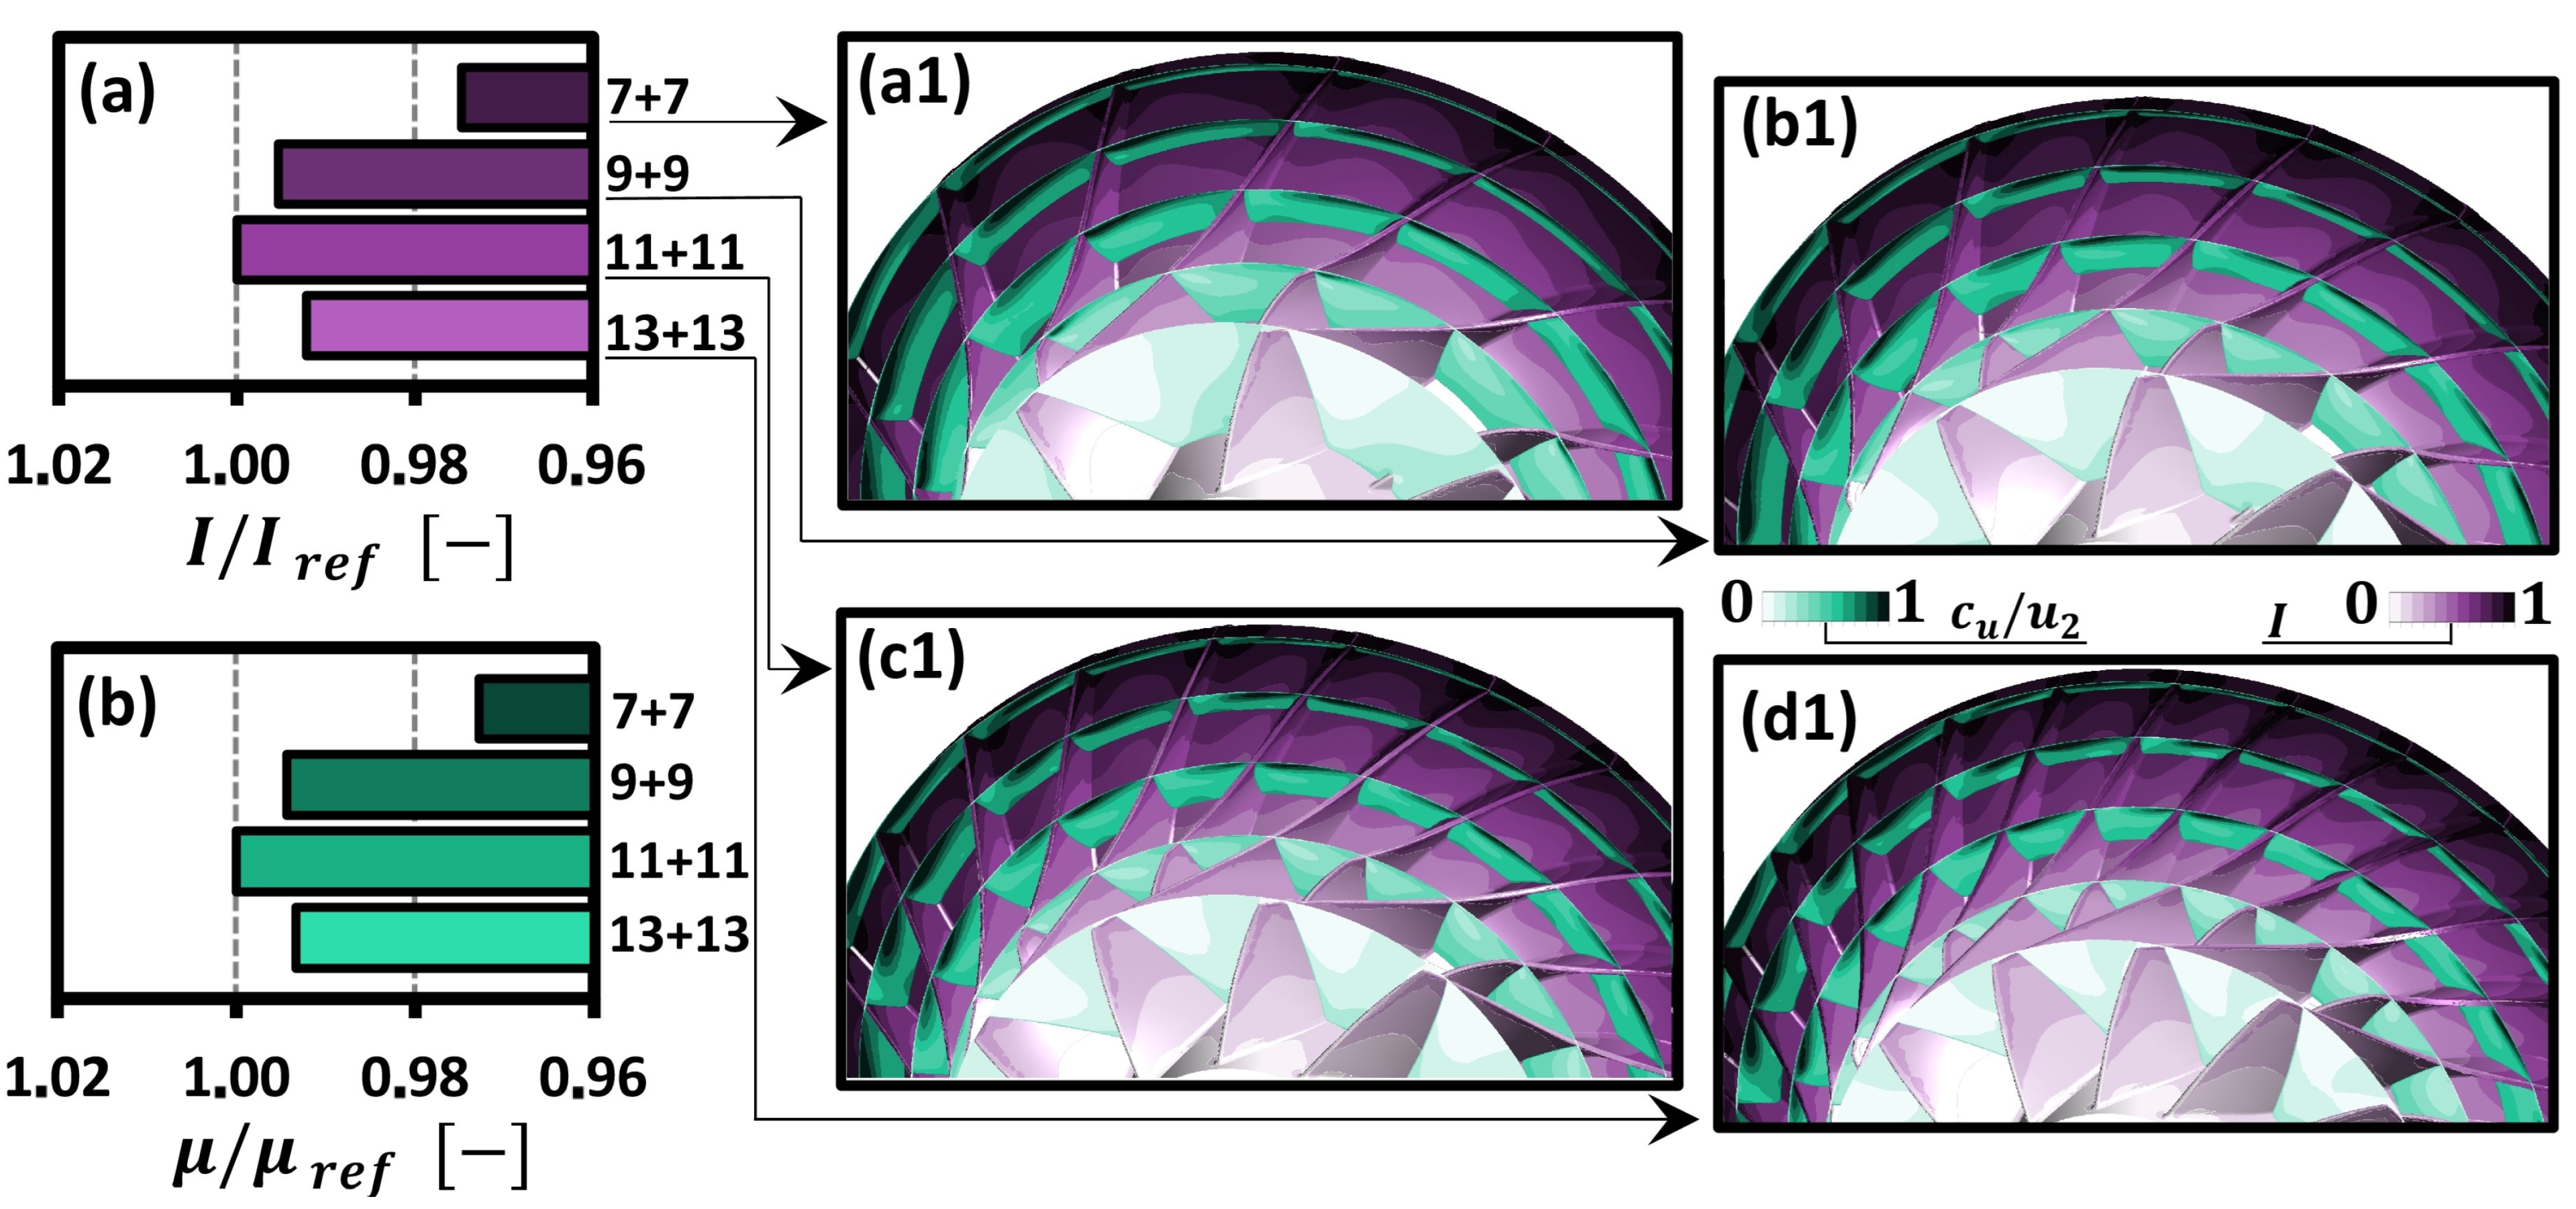
  • The growth in the main blade count from z 1 = 7 to z 1 = 13 (overall blade count from z 2 = 14 to z 2 = 26 ) resulted in a 2% drop in the total-to-total isentropic compression efficiency.
  • The effect of increasing solidity led to an 2.5% incline in the impeller work input between z 1 = 7 and z 1 = 11 . At z 1 = 13 , the aerodynamic loading of the splitters experienced a crisis caused by the highest rate of the inlet area contraction, and the work input fell by 1%.
  • The design with z 1 = 9 was the only one to outperform the baseline z 1 = 11 from the viewpoint of engine thrust and specific fuel consumption. The room left for improvement, however, was marginal: 0.4% of rise in T h and 0.3% of fall in S F C .
  • The poor performance of the HPC at z 1 = 13 translated into the worst engine characteristics: 1.4% drop in thrust and 1.3% rise in S F C .

Author Contributions

Conceptualisation, A.B. and R.B.; methodology, A.B., K.K. and R.J.; software, K.K., R.J. and R.B.; validation, A.B. and K.K.; formal analysis, A.B., K.K., R.J. and R.B.; investigation, A.B., K.K., R.J. and R.B.; resources, A.B.; writing—original draft preparation, A.B., K.K. and R.J.; writing—review and editing, K.K. and R.J.; visualisation, K.K. and R.J.; supervision, A.B. All authors have read and agreed to the published version of the manuscript.

Funding

The research leading to these results received funding from the Smart Growth Operational Programme (Program Operacyjny Inteligentny Rozwój) under Project POIR.01.01.01-00-0529/19.

Data Availability Statement

All data generated or analysed during this study are included in this published article.

Acknowledgments

The CFD simulations presented in the paper were completed with the use of the high-performance cluster at the Institute of Turbomachinery of Lodz University of Technology.

Conflicts of Interest

The authors declare no conflict of interest.

Abbreviations

The following abbreviations are used in this manuscript:
Latin
c u         Circumferential component of absolute flow velocity (m/s)
c p         Specific heat capacity at constant pressure (J/(kg K))
c w         Equivalent friction drag coefficient of impeller [44]
CFD        Computational fluid dynamics
C P R         Compressor pressure ratio (-)
DLR        Deutsches Zentrum für Luft- und Raumfahrt (German Aerospace Center)
e a         Approximate relative error [43]
ER        Expansion ratio
GA        Genetic algorithm
G C I         Grid convergence index [43]
GT        Gas turbine
HPCHigh-pressure compressor
HPTHigh-pressure turbine
IWork input factor t o t a l e n t h a l p y r i s e u 2 2 [18]
ISAInternational Standard Atmosphere
l m a v e Spanwise averaged meridional length of the blade (mm)
L H V Low heating value (J/kg)
L m e r i d Meridional length of the blade at current span (mm)
LPTLow-pressure turbine
m ˙ Mass flow rate (kg/s)
MMeridional coordinate (mm), Mach number (-)
nRotational speed (rev/min)
OEMOriginal equipment manufacturer
rGrid refinement factor [43]
SSTShear stress transport
t a v e Streamwise averaged blade pitch computed for cascade with both main and splitter blades (mm)
u 2 Tangential velocity at impeller outlet (impeller tip speed, m/s)
VSVVariable stator vanes
WESTTWhole-engine simulator turbine technology
y 1 Height of next-to-wall element of the grid (mm)
zNumber of blades (-)
Greek
β Flow angle in relative frame of reference, measured from tangential direction (deg)
β b l 2 Blade angle at impeller outlet, measured from tangential direction (deg)
η Efficiency (-)
μ Slip factor c u 2 c u 2 a t z = [18]
σ Total pressure loss coefficient p t o u t p t i n (-)
τ Coefficient of area contraction (blade metal blockage, -)
ζ i m p p r o f Profile loss coefficient of impeller c w × l m a v e t a v e × w 1 u 2 2 2 [44]
Subscripts
1Refers to HPC impeller leading edge location (equal to 26 in engine scale)
2Refers to HPC impeller trailing edge location (equal to 27 in engine scale)

References

  1. Dixon, S.; Hall, C. Fluid Mechanics and Thermodynamics of Turbomachinery; Butterworth-Heinemann: Oxford, UK, 2010; pp. 68–79. [Google Scholar]
  2. Campbell, W. The Protection of Steam Turbine Disc Wheels from Axial Vibration. Trans. ASME 1924, 46, 31–160. [Google Scholar]
  3. Kushner, F. Disc Vibration-Rotating Blade and Stationary Vane Interaction. ASME J. Mech. Des. 1980, 102, 579–584. [Google Scholar] [CrossRef]
  4. Singh, M.P.; Vargo, J.J.; Schiffer, D.M.; Delio, J.D. SAFE Diagram—A Design and Reliability Tool for Turbine Blading. In Proceedings of the 17th Turbomachinery Symposium, College Station, TX, USA; 1988; pp. 93–102. [Google Scholar] [CrossRef]
  5. Przysowa, R.; Russhard, P. Non-contact measurement of blade vibration in an axial compressor. Sensors 2020, 20, 68. [Google Scholar] [CrossRef] [PubMed] [Green Version]
  6. Bednarz, A. Influence of the Amplitude of Resonance Vibrations on Fatigue Life of a Compressor Blade with Simulated FOD Damage. Adv. Sci. Technol. Res. J. 2020, 14, 22–29. [Google Scholar] [CrossRef]
  7. Milidonis, K.; Semlitsch, B.; Hynes, T. Effect of Clocking on Compressor Noise Generation. AIAA J. 2018, 11, 4225–4231. [Google Scholar] [CrossRef]
  8. Błaszczak, J. Performance Improvement and Noise Reduction through Vane and Blade Indexing of a Two-Stage Turbine. In Proceedings of the 14th AIAA/CEAS Aeroacoustics Conference (29th AIAA Aeroacoustics Conference), Reston, VA, USA, 5–7 May 2008. [Google Scholar] [CrossRef]
  9. Stodola, A. Dampf- und Gasturbinen; Springer: Berlin/Heidelberg, Germany, 1924; pp. 144–145, (In German). [Google Scholar] [CrossRef]
  10. Dejch, M.E.; Filippov, G.A.; Lazarev, L.J. Collection of Profiles for Axial Turbine Cascades; Mashinostroenie: Moscow, Russia, 1965. (In Russian) [Google Scholar]
  11. Howell, A.R. Fluid Dynamics of Axial Compressors. Proc. Inst. Mech. Eng. 1945, 153, 441–452. [Google Scholar] [CrossRef]
  12. Cuciumita, C.; Qin, N.; Shahpar, S. Adjoint based aero-structural design optimisation of a transonic fan blade. Proc. Inst. Mech. Eng. Part J. Power Energy 2023. [Google Scholar]
  13. Rusanov, A.; Subotin, V.; Shvetsov, V.; Rusanov, R.; Palkov, S.; Palkov, I.; Chugay, M. Application of innovative solutions to improve the efficiency of the LPC flow part of the 220 MW NPP steam turbine. Arch. Thermodyn. 2022, 43, 63–87. [Google Scholar] [CrossRef]
  14. Głuch, S.J.; Ziółkowski, P.; Witanowski, Ł.; Badur, J. Design and computational fluid dynamics analysis of the last stage of innovative gas-steam turbine. Arch. Thermodyn. 2021, 42, 255–278. [Google Scholar] [CrossRef]
  15. Pakatchian, M.; Saeidi, H.; Ziamolki, A. CFD-based blade shape optimization of MGT-70(3) axial flow compressor. Int. J. Numer. Methods Heat Fluid Flow 2020, 30, 3307–3321. [Google Scholar] [CrossRef]
  16. Waesker, M.; Buelten, B.; Kienzle, N.; Doetsch, C. Optimization of Supersonic Axial Turbine Blades Based on Surrogate Models. In Proceedings of the ASME Turbo Expo 2020, Virtual, Online, 21–25 September 2020. [Google Scholar] [CrossRef]
  17. Casey, M.; Robinson, C. Radial Flow Turbocompressors; Cambridge University Press: Campbridge, UK, 2021; p. 379. [Google Scholar] [CrossRef]
  18. Aungier, R. Centrifugal Compressors: A Strategy for Aerodynamic Design and Analysis; ASME Press: New York, NY, USA, 2000. [Google Scholar]
  19. Japikse, D. Centrigufal Compressor Design and Performance; Concepts ETI: White River Junction, VT, USA, 1996. [Google Scholar]
  20. Moroz, L.; Govoruschenko, Y.; Pagur, P.; Romanenko, L. Integrated Conceptual Design Environment for Centrifugal Compressors Flow Path Design. In Proceedings of the ASME 2008 International Mechanical Engineering Congress and Exposition, Boston, MA, USA, 31 October–6 November 2008; pp. 175–185. [Google Scholar] [CrossRef] [Green Version]
  21. Turner, M.G.; Reed, J.A.; Ryder, R.; Veres, J.P. Multi-Fidelity Simulation of a Turbofan Engine With Results Zoomed Into Mini-Maps for a Zero-D Cycle Simulation. In Proceedings of the ASME Turbo Expo 2004, Vienna, Austria, 14–17 June 2004; pp. 219–230. [Google Scholar] [CrossRef] [Green Version]
  22. Adamczyk, J.J. Aerodynamic Analysis of Multistage Turbomachinery Flows in Support of Aerodynamic Design. In Proceedings of the ASME Turbo Expo 1999, Indianapolis, IN, USA, 7–10 June 1999; pp. 189–217. [Google Scholar] [CrossRef]
  23. Claus, R.; Townsend, S.; Lavelle, T.; Turner, M. Coupled Component, Full Engine Simulation of a Gas Turbine Engine. In Proceedings of the 45th AIAA/ASME/SAE/ASEE Joint Propulsion Conference, Reston, VA, USA, 2–5 August 2009. [Google Scholar] [CrossRef]
  24. Łukasik, B. Turboelectric Distributed Propulsion System As a Future Replacement for Turbofan Engines. In Proceedings of the ASME Turbo Expo 2017, Charlotte, NC, USA, 26–30 June 2017. [Google Scholar] [CrossRef]
  25. Reitenbach, S.; Schnös, M.; Becker, R.-G.; Otten, T. Optimization of Compressor Variable Geometry Settings Using Multi-Fidelity Simulation. In Proceedings of the ASME Turbo Expo 2015, Montreal, QC, Canada, 15–19 June 2015. [Google Scholar] [CrossRef]
  26. Klein, C.; Reitenbach, S.; Schoenweitz, D.; Wolters, F. A Fully Coupled Approach for the Integration of 3D-CFD Component Simulation in Overall Engine Performance Analysis. In Proceedings of the ASME Turbo Expo 2017, Charlotte, NC, USA, 26–30 June 2017. [Google Scholar] [CrossRef]
  27. Klein, C.; Wolters, F.; Reitenbach, S.; Schönweitz, D. Integration of 3D-CFD Component Simulation Into Overall Engine Performance Analysis for Engine Condition Monitoring Purposes. In Proceedings of the ASME Turbo Expo 2018, Oslo, Norway, 11–15 June 2018. [Google Scholar] [CrossRef]
  28. Petrovic, M.V.; Wiedermann, A. Fully Coupled Through-Flow Method for Industrial Gas Turbine Analysis. In Proceedings of the ASME Turbo Expo 2015, Montreal, QC, Canada, 15–19 June 2015. [Google Scholar] [CrossRef]
  29. Saini, P.; Defoe, J. The effect of blade count on body force model performance for axial fans. J. Turbomach. 2021, 143, 071011. [Google Scholar] [CrossRef]
  30. Hall, D.; Greitzer, E.; Tan, C. Analysis of fan stage conceptual design attributes for boundary layer ingestion. J. Turbomach. 2017, 139, 071012. [Google Scholar] [CrossRef] [Green Version]
  31. Akira Technologies SAS. Available online: https://www.akira.pro/produits-westt/ (accessed on 24 March 2023).
  32. Pakmehr, M.; Wang, T.; Jobredeaux, R.; Vivies, M.; Feron, E. Verifiable control system development for gas turbine engines. arXiv 2013, arXiv:1311.1885. [Google Scholar]
  33. Saravanamuttoo, H.; Rogers, G.; Cohen, H. Gas Turbine Theory; Pearson: London, UK, 2017. [Google Scholar]
  34. Jakubowski, R. Evaluation of performance properties of two combustor turbofan engine. Maint. Durab. 2015, 17, 575–581. [Google Scholar] [CrossRef]
  35. De Vega, L.L.; Dufour, G.; García Rosa, N. A fully coupled body force-engine performance methodology for boundary layer ingestion. In Proceedings of the AIAA Propulsion and Energy Forum and Exposition, Indianapolis, IN, USA, 19–22 August 2019. [Google Scholar] [CrossRef]
  36. Asoliman, I.M.; Ehab, M.; Mahrous, A.M.; El-Sayed, A.F.; Emeara, M.S. Performance Analysis of High Bypass Turbofan Engine Trent 1000-A. In Proceedings of the 3rd IUGRC International Undergraduate Research Conference, Military Technical College, Cairo, Egypt, 30 July–1 August 2018. [Google Scholar]
  37. El-Sayed, A.F. Aircraft Propulsion and Gas Turbine Engines, 2nd ed.; Taylor and Francis CRC Press: Abingdon, UK, 2017. [Google Scholar]
  38. Sob, P.B.; Pita, M. Modelling and Designing of a Turbofan Engine with More Enhanced Overall Engine Efficiency During Operation. Int. J. Mech. Prod. Eng. Res. Dev. (Ijmperd) 2021, 11, 333–350. [Google Scholar]
  39. Kurzke, J.; Halliwell, I. Propulsion and Power: An Exploration of Gas Turbine Performance Modeling, 1st ed.; Springer International Publishing AG: Berlin/Heidelberg, Germany, 2018. [Google Scholar] [CrossRef]
  40. Kurzke, J. Fundamental Differences between Conventional and Geared Turbofans. In Proceedings of the ASME Turbo Expo 2009, Orlando, FL, USA, 8–12 June 2009. [Google Scholar] [CrossRef]
  41. Jakubowski, R. Modeling and analysis of jet engine with cooling turbine. J. Kones Powertrain Transp. 2012, 19, 235–243. [Google Scholar] [CrossRef]
  42. Waesker, M.; Goetz, T.; Buelten, B.; Kienzle, N. Analysis of Slip Factors in CFD Calculations-Assessment of Literature Models. In Proceedings of the 14th European Conference on Turbomachinery Fluid Dynamics & Thermodynamics, Gdańsk, Poland, 12–16 April 2021. [Google Scholar] [CrossRef]
  43. Celik, I.B.; Ghia, U.; Roache, P.J. Procedure for estimation and reporting of uncertainty due to discretization in CFD applications. J. Fluids Eng. 2008, 130, 078001. [Google Scholar]
  44. Galerkin, Y.; Rekstin, A.; Soldatova, K.; Drozdov, A.; Solovyeva, O.; Semenovskiy, V.; Marenina, L. The Current State of the Engineering Method for the Optimal Gas-Dynamic Design and Calculation of Centrifugal Compressor. Energies 2020, 13, 5651. [Google Scholar] [CrossRef]
  45. Galerkin, Y. Turbocompressors; KHT: Moscow, Russia, 2010. (In Russian) [Google Scholar]
Figure 1. View of (a) the engine virtual test stand WESTT CS/BV and (b) core engine with the high-pressure turbo-spool components of DGEN 380 (WESTT SE-HP).
Energies 16 05251 g001
Figure 2. The cutaway illustration of the DGEN 380 [31] engine: (a) engine inlet, (b) fan, (c) gearbox, (d) high-pressure compressor, (e) combustion chamber, (f) high-pressure turbine, (g) low-pressure turbine, (h) fan nozzle, (i) core nozzle, and (j) stator.
Energies 16 05251 g002
Figure 3. Flow-chart scheme of the turbofan engine model prepared in MATLAB.
Energies 16 05251 g003
Figure 4. (a) STL-model of the impeller after 3D scanning, (b) solid CAD model of baseline impeller with z 1 = 11 , and (ce) solid models of alternative impellers with z 1 = 7 , 9 , 13 , respectively.
Energies 16 05251 g004
Figure 5. (a) Fluid flow domain of the baseline HPC impeller and (b) hybrid plot with the distribution of the y + parameter and visualisation of the final finite-volume grid.
Energies 16 05251 g005
Figure 6. (a,b) Distributions of normalised relative flow velocities w / w 1 along the suction and pressure surfaces of the main (a) and splitter (b) blades as functions of the normalised meridional coordinate M / L m e r i d and computational grid resolution. The graphs were obtained from respective static pressure distributions at 80% of the blade span and under the assumption of zero flow viscosity [44]. (c) Integrally averaged blade-loading parameters ( Δ w / w 1 ) a v e computed for the main and splitter blades based on the charts (a,b), respectively.
Energies 16 05251 g006
Figure 7. Influence of impeller’s blade number z 1 on the normalised isentropic compression efficiency η C / η C r e f (a) and normalised average wall shear stress τ w a v e / τ w a v e r e f (b). (a1d1) Contour plots of relative Mach number M w (blue legend) and normalised shear stress τ w / τ w r e f (red legend) from z 1 = 7 to z 1 = 13 , respectively.
Energies 16 05251 g007
Figure 8. Influence of the impeller’s blade number z 1 on the normalised work input factor I / I r e f (a) and normalised slip factor μ / μ r e f (b). (a1d1) Contour plots of circumferential velocity normalised by impeller tip speed c u / u 2 (green legend) and local work input factor I (violet legend) from z 1 = 7 to z 1 = 13 , respectively.
Energies 16 05251 g008
Figure 9. (a,b) Distributions of normalised relative flow velocities w / w 1 along the suction and pressure surfaces of the main (a) and splitter (b) blades as functions of the normalised meridional coordinate M / L m e r i d and impeller blade number z 1 . The graphs were obtained from the respective static pressure distributions at 80% of the blade span and under the assumption of zero flow viscosity [44]. (c) Integrally averaged blade loading parameters ( Δ w / w 1 ) a v e computed for the main and splitter blades based on the charts (a,b), respectively.
Energies 16 05251 g009
Figure 10. Dependences of the normalised total-to-total HPC pressure ratio C P R / C P R r e f (a) and normalised inlet total temperatures T t / T t r e f at HPT(4) and LPT(45) (b) on the HPC impeller blade number z 1 .
Energies 16 05251 g010
Figure 11. Dependences of normalised engine thrust T h / T h r e f (a) and normalised specific fuel consumption S F C / S F C r e f (b) on the HPC impeller blade number z 1 .
Energies 16 05251 g011
Table 1. Influence of the number of blades on the mass and solidity characteristics of the HPC impeller (material: titanium alloy).
Blade Config. z 1 , −Impeller Mass m imp , kgChange in the Mass of Impeller, %Average Solidity l m ave / t ave , −Change in the Outlet Solidity, %
72.62−5.72.05−36.3
92.67−3.82.64−18.0
112.780.03.220.0
132.831.93.8018.0
Table 2. Characteristic parameters of finite-volume meshes subjected to the grid sensitivity procedure.
GridNo. of Nodes, N nd × 10 6 Wall Inflation Data Blade Tip Res-Tion, tan. dir-n y + max
No. of Layers y 1 , mmERNo. of el-ts
Medium3.1100.011.2346
Fine4.5100.011.2546
Very Fine12.3100.011.21045
Table 3. Boundary and operating conditions of HPC impeller used in the numerical simulations.
p t 25 , kPa T t 25 , K I turb , % l turb , mm p 27 , kPan, rpm
11630434.6adjusted to reach m ˙ 25 = 1.75 kg/s51,410
Table 4. Inlet-to-outlet distributions of stagnation pressure p t , temperature T t , and mass flow rate m ˙ in the DGEN 380 obtained at the virtual test-rig WESTT CS/BV for the reference take-off condition.
ParameterSection
1182125344558
m ˙ , kg/s13.7511.791.751.751.751.781.781.781.78
T t , K288.1306.3304.5304.5512.81170.8990.2867.0867.0
p t , kPa101.2120.8118.7116.3534.5510.2227.0122.2120.0
Table 5. Main performance parameters of the DGEN 380 engine obtained at WESTT CS/BV for the reference take-off condition.
Thrust T h , NFuel Mass Flow m ˙ f , kg/sSFC, kg/daN/hBypass Ratio
24910.0310.4546.75
Table 6. Component efficiencies η and total pressure loss coefficients σ used in the analytical model of the DGEN 380 to match the model’s performance with the virtual experiment.
Efficiencies Loss Coefficients
η F 0.82 σ I N 0.99
η C 0.80 σ B 0.95
η B 0.99 σ I N T 0.96
η H P T 0.85 σ E X T 0.98
η L P T 0.87
Table 7. Results of grid convergence indices’ estimation for grids used in CFD simulations (the subscript “2” refers to the grid finally used in the study (“Fine” resolution); the nomenclature is in accordance with [43]).
CPR η C M w 1 I μ
N 3 , N 2 , N 1 , ( × 10 6 ) 34.1, 12.1, 8.3
r 32 , r 21 1.41, 1.13
e a 32 , e a 21 ( × 10 2 ) 1.9, 3.00.8, 1.40.1, 0.20.4, 0.70.6, 1.5
G C I 32 , G C I 21 ( × 10 2 ) 0.20, 2.700.01, 1.000.01, 0.100.04, 0.600.02, 0.70
Disclaimer/Publisher’s Note: The statements, opinions and data contained in all publications are solely those of the individual author(s) and contributor(s) and not of MDPI and/or the editor(s). MDPI and/or the editor(s) disclaim responsibility for any injury to people or property resulting from any ideas, methods, instructions or products referred to in the content.

