Article

Modern Optimization Algorithm for Improved Performance of Maximum Power Point Tracker of Partially Shaded PV Systems

by
Ali M. Eltamaly
1,2,3,*,
Zeyad A. Almutairi
1,4,5 and
Mohamed A. Abdelhamid
6
1
Sustainable Energy Technologies Center, King Saud University, Riyadh 11421, Saudi Arabia
2
Saudi Electricity Company Chair in Power System, Reliability and Security, King Saud University, Riyadh 11421, Saudi Arabia
3
Department of Electrical Engineering, Mansoura University, Mansoura 35516, Egypt
4
Mechanical Engineering Department, King Saud University, Riyadh 11421, Saudi Arabia
5
K.A.CARE Energy Research and Innovation Center at Riyadh, King Saud University, Riyadh 11421, Saudi Arabia
6
Department of Electronic Engineering, Universidad Técnica Federico Santa María, Valparaíso 2390123, Chile
*
Author to whom correspondence should be addressed.
Energies 2023, 16(13), 5228; https://doi.org/10.3390/en16135228
Submission received: 31 May 2023 / Revised: 20 June 2023 / Accepted: 23 June 2023 / Published: 7 July 2023
(This article belongs to the Special Issue Clean and Sustainable Energy with Artificial Intelligence)

Abstract

:
Due to the rapid advancement in the use of photovoltaic (PV) energy systems, it has become critical to look for ways to improve the energy generated by them. The extracted power from the PV modules is proportional to the output voltage. The relationship between output power and array voltage has only one peak under uniform irradiance, whereas it has multiple peaks under partial shade conditions (PSCs). There is only one global peak (GP) and many local peaks (LPs), where the typical maximum power point trackers (MPPTs) may become locked in one of the LPs, significantly reducing the PV system’s generated power and efficiency. The metaheuristic optimization algorithms (MOAs) solved this problem, albeit at the expense of the convergence time, which is one of these algorithms’ key shortcomings. Most MOAs attempt to lower the convergence time at the cost of the failure rate and the accuracy of the findings because these two factors are interdependent. To address these issues, this work introduces the dandelion optimization algorithm (DOA), a novel optimization algorithm. The DOA’s convergence time and failure rate are compared to other modern MOAs in critical scenarios of partial shade PV systems to demonstrate the DOA’s superiority. The results obtained from this study showed substantial performance improvement compared to other MOAs, where the convergence time was reduced to 0.4 s with zero failure rate compared to 0.9 s, 1.25 s, and 0.43 s for other MOAs under study. The optimal number of search agents in the swarm, the best initialization of search agents, and the optimal design of the dc–dc converter are introduced for optimal MPPT performance.

1. Introduction

With the continuous increase in the need for electrical energy, the continuous shortage of fossil fuels, the impact of geopolitical problems on energy supplies, and the environmental impact of excessive use, the need for renewable energies, especially the energy generated from PV cells, has increased. Most of the world’s nations realize this problem and have started ambitious programs to completely rely on renewable energy sources by 2050 [1]. Statistics indicate a significant rise in the use of PV in the production of electric energy, as the worldwide capacity of PV cells increased to 1300 megawatts, exceeding the capacity generated from wind energy by 400 megawatts [2]. With the rapid progress in modern energy storage systems (ESS) and smart grid systems [3,4], the problem of intermittency in the generated power as a result of climate change has been overcome. The ESS can save the extra energy greater than the load needs and serve this stored energy when there is a deficiency in the extracted power from renewable energy sources (RES) compared to the power of the load. Moreover, the smart grid system can control the loads using different smart grid concepts to a level near the available generation from RES.
The PV systems are used to generate electricity directly from sunlight. The extracted power from the PV array is directly proportional to the light intensity, operating temperature, and output voltage of the PV array. Connecting many modules in series and parallel are required to increase the voltage and current of the PV array. The relation between the generated power and the terminal voltage is nonlinear, and it has only one peak at about 0.8 of the open circuit voltage (Voc) of the PV array in cases of uniform irradiance. In the case of non-uniform irradiance falling on the PV modules, different amounts of generated power will be generated from these PV modules. Partial shading occurs due to the shadow of different objects such as buildings, trees, clouds, or dust. For extracting the maximum power from these modules, each module should work with its optimal voltage and current, which is not the case in real PV systems because modules are connected in series and parallel. This means that the current in each series branch is the same in all series modules, while the terminal voltage of each module is different. A negative voltage may be generated at the terminal of some modules in some severe partial shading conditions (PSCs). The negative voltage of shaded modules occurs when these modules act as a load on other modules due to PSCs. The occurrence of negative voltage on some of the shaded modules generates heat inside the module, which may destroy it. This phenomenon is called the hot-spot phenomenon [5]. For this reason, a bypass diode should be added in parallel with each module for hotspot protection. When the shunt diode is activated, the generated power from these modules is wasted, and the PV system loses this quantity of energy. Due to the PSCs and shunt diodes, the P-V characteristics of the PV array will be fewer than or equal to the number of series modules in the PV array that have varying irradiances.
The global peak (GP) has the highest power among these peaks, whereas the other local peaks (LPs) have lower power than the GP. Several ways have been developed to track the maximum power point (MPP) during real-time operation with various PSCs. Several strategies have been introduced to track the MPP during their real-time operation with different PSCs. As a result, a dc–dc converter was utilized to track the MPP of PV systems by manipulating the power electronics switches with logic created by maximum power point tracker (MPPT) approaches. As illustrated in Figure 1, MPPT techniques are utilized to extract the maximum power provided by a PV system by managing the on/off times of power electronic switch/switches. Some typical procedures employ the incremental change in voltage to track the MPP, such as hill climbing (HC), perturb and observe (P&O), and incremental conductance (In.Con.) [6]. Other smart techniques, such as using fuzzy logic controllers [7] and artificial neural networks [8], have been used as MPPTs of PV systems, but all of these strategies fall into the conventional strategies category because they cannot track the GP and they may stick at one of the LPs in the event of PSCs. As a result, typical MPPT techniques are not suggested for use with PSC-equipped PV systems.
The metaheuristic optimization algorithms (MOAs) can follow the GP and prevent the PV system from becoming caught in one of the LPs. Several MOA techniques, including particle swarm optimization (PSO) [9], bat algorithm (BA) [10], grey wolf optimization (GWO) [11], and musical chairs algorithm (MCA) [12], among others, have been employed as MPPTs of PV systems. All of these MOAs have several problems, including extended convergence times, premature convergence, and particle stagnation at one of the LPs. The majority of recent studies on this subject have proposed ways to overcome these challenges [13,14,15,16,17,18]. Still, additional efforts are needed in this sector to lower convergence time while maintaining GP tracking accuracy.
Various strategies have been used in the literature to overcome the long convergence time problem. The majority of these studies are centered on making changes to current MOAs to capture the GP quicker [13,14,15,16,17,18]. To overcome the random aspect of the PSO in tracking the MPP of PV systems, a deterministic approach was used to modify it [13,14]. The fundamental concept behind this approach is to replace the random values with those that should be multiplied by the acceleration factors to estimate particle velocity. The accelerated parameters are replaced by 1.0 in this investigation, and the random numbers are deleted. As a result, just the inertia weight parameter has to be adjusted. This strategy has been compared with conventional PSO and shows better performance [13]. The main shortcoming of this optimization algorithm is the random initialization, which may cause premature convergence to one of the LPs and a long convergence time that can be avoided with better initialization algorithms [19,20]. The strategy used in [14] improved the random initialization of particles by initializing these particles at the predicted position of peaks. Moreover, it reduced the swarm size to reduce the convergence time. This strategy reduces the convergence time, but it should be trained for different operating voltages due to the particles using the terminal voltage, not the duty ratio [14]. The predicted positions of peaks used in this strategy are based on the anticipated peaks placed at 0.8 Voc, which needs to be more accurate, as has been discussed in [20]. Another technique employed a linear drop in inertia weight value from 0.9 to 0.4 to increase global search at the start of optimization and improve local search at the end [21]. This method lowers the convergence time and steady-state oscillations, but it still has to be improved. Another strategy suggested varying the inertia weight from 0.8 to 0.1 [15] for the same purpose.
Some other studies introduced a dynamic inertia weight in which the value of the inertial weight changes based on the convergence performance [16,17,18]. Another approach for linearly adjusting the acceleration parameters and inertia weight is provided [22,23]. All these modifications are implemented based on trial-and-error without an optimal determination of the MOAs’ control parameters. To circumvent the use of trial-and-error procedures in obtaining the control parameters of MOAs, an intriguing strategy for calculating these optimal control parameters for PSO [9] and BA [24] is presented. In this technique, two nested optimization loops are used. The inner one is to track the MPP of the PV system, and the outer one is to optimize the control parameters for the internal one for the shortest time of convergence and zero failure rate. These MOAs have been used with photovoltaic systems with varying numbers of peaks to identify the ideal swarm size, inertia weight, and acceleration parameters. These strategies significantly enhance performance while maintaining a quick time of convergence and great accuracy.
The success of catching the GP and the convergence time will rise as the number of particles increases, and vice versa. This suggests that the time of convergence and failure rate are related to the swarm size. As a result, it is critical to choose the number of particles that provides the quickest time of convergence and a zero failure rate. Some solutions employed three search agents [25,26], five search agents [27], and six search agents [28], among others. Other algorithms calculated the appropriate number of particles based on the number of peaks for the shortest time of convergence and zero failure rate [28].
Another strategy is used to reduce the time of convergence while maintaining a zero failure rate using hybrid MPPT techniques (HMTs) [29,30,31,32,33,34,35]. The idea behind the use of HMTs is to use an effective GP searching strategy to determine its position at the beginning of the optimization, then use the fast local search and low ripple technique to accurately capture the GP. Some hybrid strategies use MOA at the beginning of optimization and conventional MPPT after that [29,30,31,32,33]. There are other HMTs that use two MOAs, such as [34,35]. A detailed discussion of the HMT techniques is introduced in [36].
In terms of the time of convergence and failure rate, the MPPT’s success depends on the initial placements of search agents in all MOAs. For the search agents, the majority of the MOAs employed random position initialization [13]. Random initialization raises the failure rate and increases the time of convergence and should be avoided in MPPT applications. Several strategies are used to replace the random initialization by dividing the search area (voltage or duty ratio) into equal distances and initializing the search agents at these distances [19]. This strategy is better than random initialization, but still, the convergence time can be further reduced using initialization at predicated positions of peaks [20]. This strategy has the fastest time of convergence and the lowest rate of failure compared to random initialization, but the swarm size should be equal to the number of peaks, which may limit the flexibility of the MPPT algorithms. This point can be avoided by selecting a swarm size equal to the peaks, and the rest of the particles can be randomly distributed.
Another strategy using the skipping model algorithm to reduce the time of convergence while maintaining a zero failure rate is introduced [37,38,39,40,41]. The idea of this strategy is to avoid searching within certain values and concentrate on other areas that probably contain the GP. This strategy reduced the convergence time, but it increased the calculation time, which may limit the operating frequency and sampling time, which consequently increases the convergence time. A detailed discussion of these algorithms is shown in [42].
Another issue that all MOAs have when utilized as an MPPT of a PV system is termed search agent stagnation in one of the local peaks. This issue was resolved by initializing the search agents whenever the change in extracted power exceeded the present tolerance, as stated in Equation (1). The high value of the predefined tolerance may cause the system to be insensitive to critical changes in shading patterns and leave the search agents at one of the LPs and lose the GP, especially in gradual changes in shading patterns. Meanwhile, a low value of the specified tolerance may lead the system to reinitialize without necessity, increasing the oscillations of the PV system waveforms. The predefined tolerance is between 5% [43] and 10% [44]. Some strategies avoid the dependency of re-initialization based on Equation (1) by re-initialization of the search agents every certain time [45] or by using scanning search agents re-initialization at certain periods [46,47].
P i P i 1 P i 1 > ε
where Pi and Pi−1 are the extracted power from the photovoltaic system at iterations i and i − 1, respectively, and ε is a predetermined tolerance.

1.1. Motivation

The problem of partial shading can cause a lot of problems for PV systems, such as hot spots [48]. The partial shading also causes the P-V characteristics of the photovoltaic array to have several peaks, which require smart MPPT techniques such as MOAs. Because of the long convergence time associated with the usage of MOAs in MPPT photovoltaic energy system applications, researchers sought to employ novel MOAs or improve current ones. Nonetheless, the long time of convergence and high rate of failure necessitate greater work due to their relevance to PV system functioning. As a result, it is critical to assess and compare some of the most current MOAs in MPPT PV system applications with previous ones. Due to this, the dandelion optimization algorithm (DOA), a recently developed and promising optimization algorithm [49], is introduced in this paper to evaluate its performance compared to superior MOAs used before for this purpose, such as PSO [9], GWO [11], and MCA [12]. Moreover, the best initialization, optimal design of the dc–dc converter, best swarm size, and avoidance of search agent stagnation in LPs are tactics used to optimize the performance of MOAs when employed as an MPPT of PV systems.

1.2. Innovation and Contribution

Several MOAs have been employed in PV system MPPT applications. Several of these MOAs have shown greater performance, but additional efforts should be made to test novel MOAs to further reduce the time of convergence and rate of failure, which may be translated into an improvement in the extracted power and efficiency of photovoltaic systems. As a result, the recently developed dandelion optimization algorithm (DOA) [49] has been employed for the first time in the MPPT of PV systems. This research also provides a unique strategy for significantly reducing convergence time and avoiding search agent stagnation in LPs. The innovation and contribution involved in this paper are listed below.
  • Evaluation of the application of the DOA in a photovoltaic MPPT as a function of conversion time and failure rate.
  • Calculate the best swarm size to achieve the shortest time of convergence while maintaining a zero failure rate.
  • Evaluating the performance of the MPPT with different initialization strategies.
  • Using a novel strategy for avoiding the stagnation of search agents in LPs.

1.3. Paper Outlines

The remainder of this study provides a full discussion of the PV array modeling in Section 2. Section 3 gives a full overview of the DOA and how it may be employed in the MPPT of photovoltaic energy applications. Section 4 introduces the simulation experiments that were performed to compare the proposed DOA MPPT algorithm to alternative MOA techniques. Section 5 introduces the experimental work performed to validate the simulated results. Section 6 introduces the findings of this investigation.

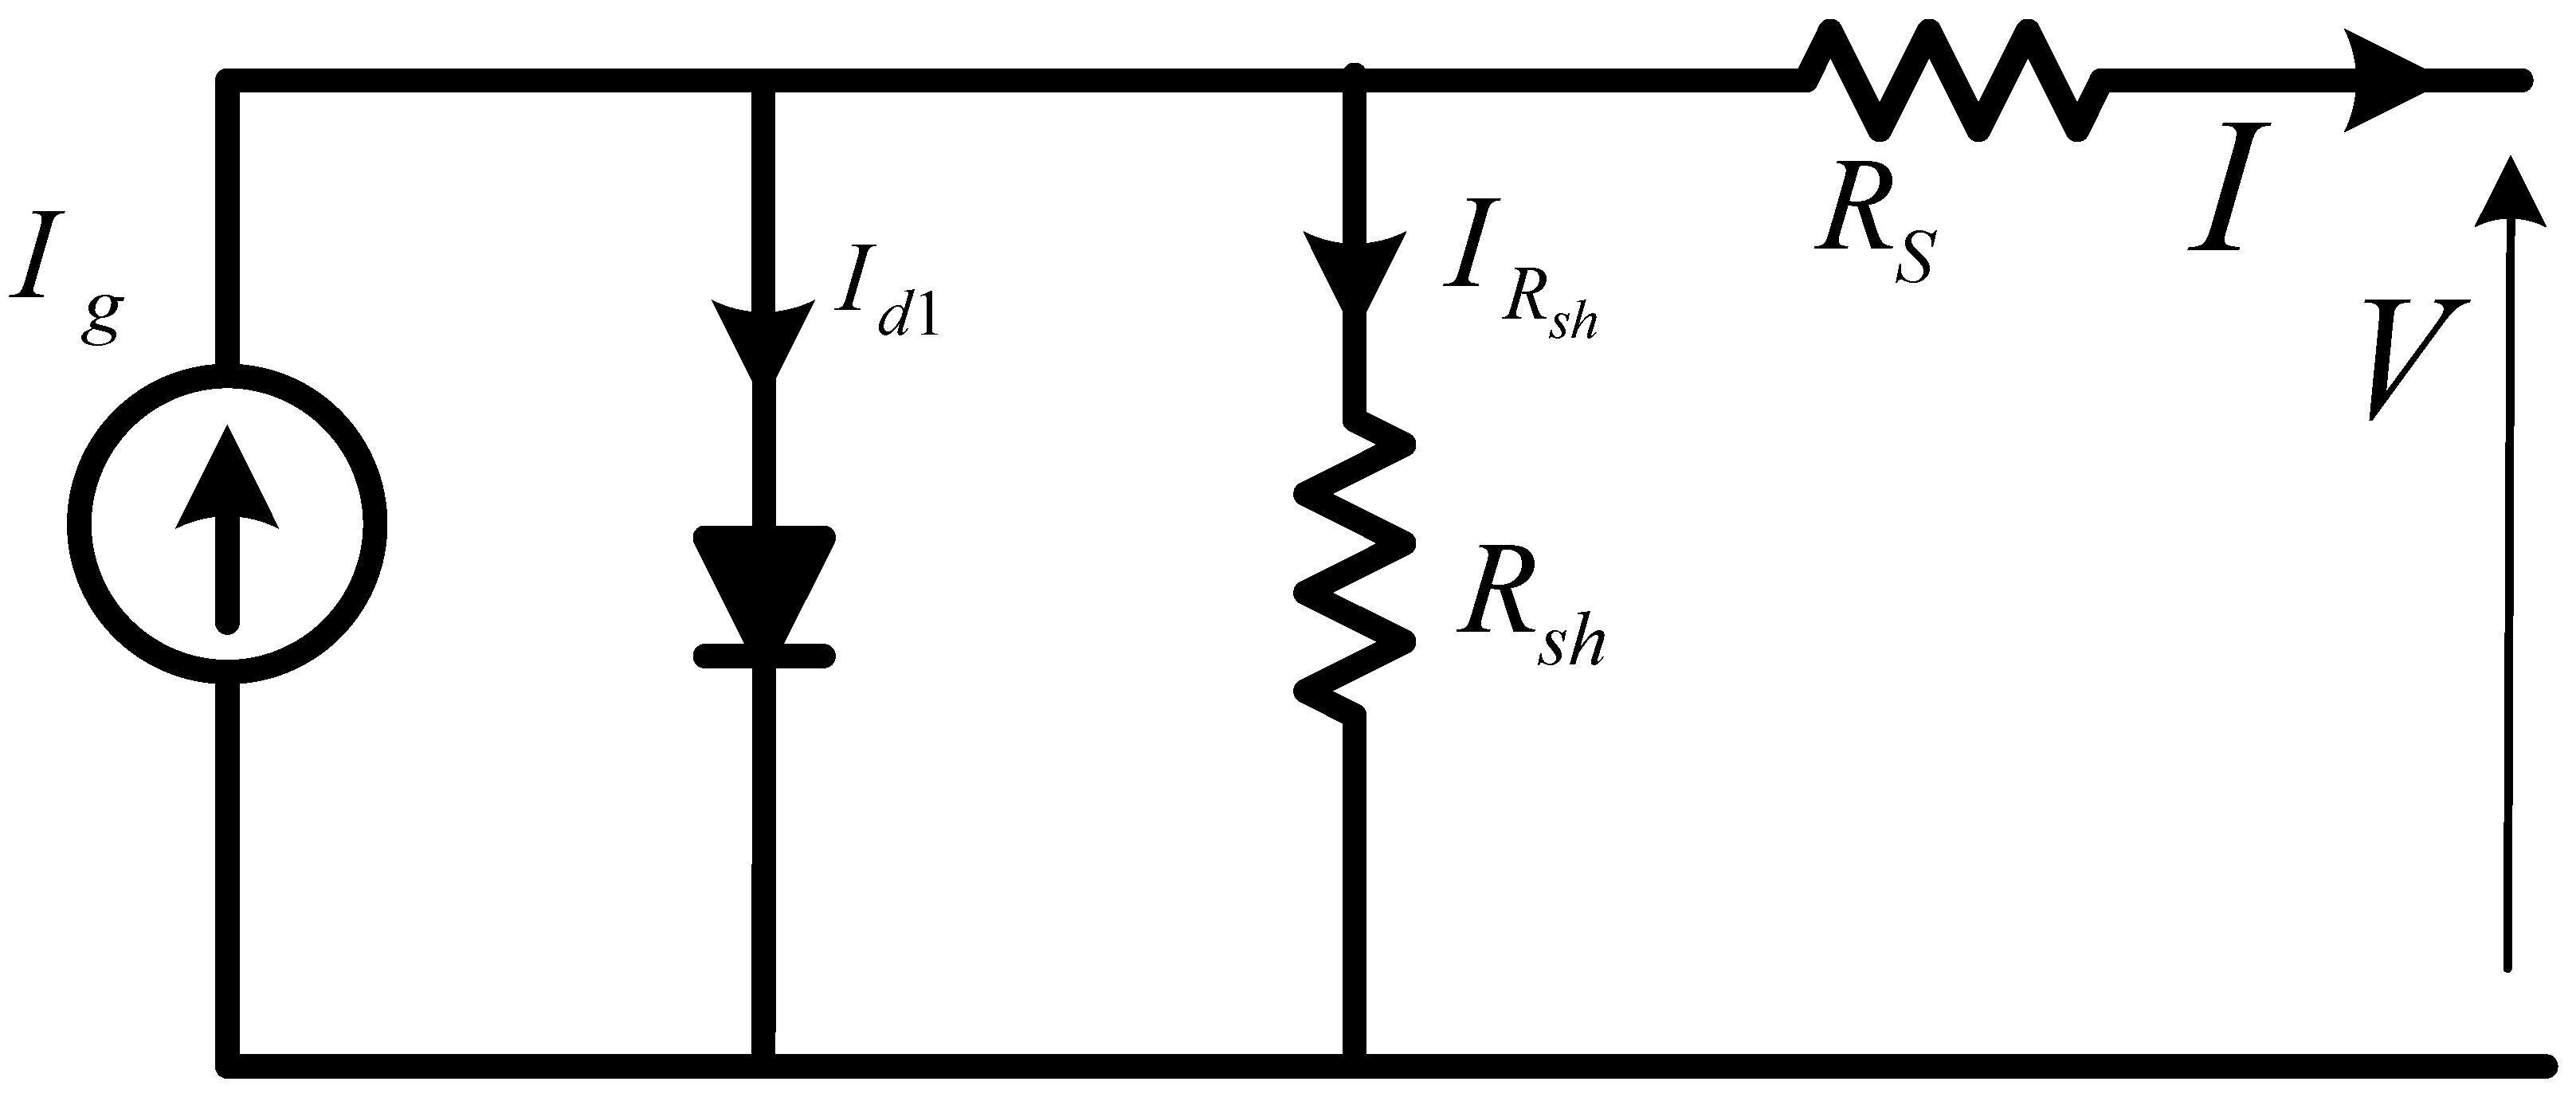
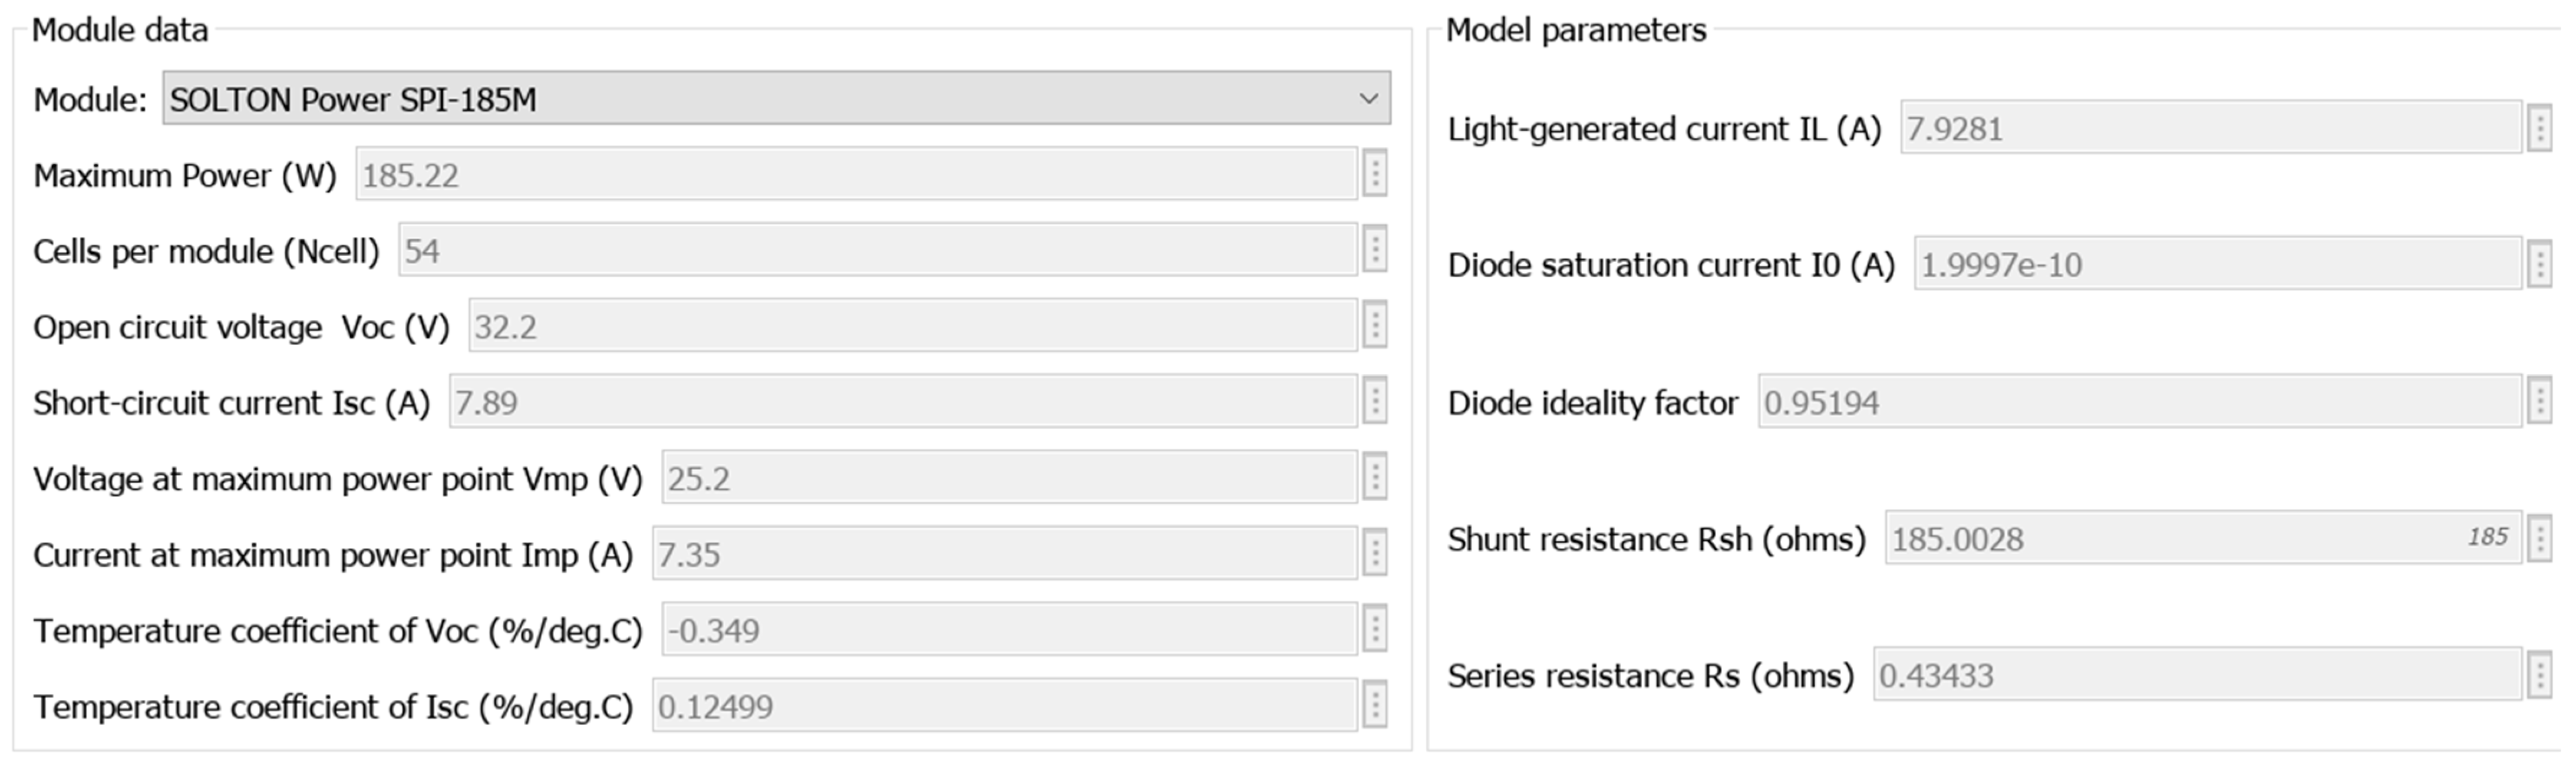
2. PV Array Modelling

The photovoltaic cell, which is composed of two semiconductor layers (P–N layers), is the smallest component of the PV array. The sunlight falls on the N-layer, which has free electrons in its atom’s outer layer that can be easily moved from its atom if it has enough energy to move. The photon energy has adequate energy to give this free electron the energy to move from the N-layer to the P-layer, which has a free hole. The N-layer atoms turn into positive ions as the electron goes from the N-layer to the P-layer, while the P-layer atoms turn into negative ions, which might result in a voltage difference.
The energy produced by the PV cell may be transmitted from the PV cell to the load after the load is linked between the P and N-layers. The PV cells should be arranged in parallel and series to obtain the required current and voltage for the PV modules. For the same objective, the modules should also be linked in parallel and in series. The simplest photovoltaic cell model is called the single diode model (SDM), which is the simplest way to represent the PV cell’s performance. It is depicted in Figure 2 [50], which is used to represent the PV cell used in this study. Another model with higher accuracy is when more than one diode shunts to the first diode to well represent the charge diffusion and recombination components of the PV cell [51]. Some other studies recommend using three diodes in the PV cell model to obtain more accurate results [52].
The main problem is that increasing the number of diodes will increase the calculation burden of the model without a substantial improvement in accuracy compared to the SDM [53]. The SDM provides adequate accuracy with a reasonable calculation burden, and for this reason, it is used in the modeling of this study.
From the above discussion, the PV cell can be modeled as a current generator in a shunt with a diode. The PV cell output current can be obtained from Equation (2) [53].
I = I g I 0 e q V + R s I a K T 1 V + R s I R s h
where Ig is the current source value, K is the Boltzmann constant, a is the diode ideality constant (a = 0.95194), and T is the temperature of PV cells (°K). I and V are the terminal current and voltage of the PV modules, respectively, and Rsh and Rs are the shunt and series resistances of the photovoltaic cell model, respectively.
The current used to represent one PV cell shown in Equation (2) should be modified to model the current in the PV array as expressed in Equation (3).
I = N p I g N p I 0 e q V + R s N s N p I N s a K T 1 V + N s N p R s I N s N p R s h
where Np and Ns are the number of PV cells in each branch and the number of series PV cells in each branch, respectively.
The current of the source current is directly proportional to the solar irradiation and also functions in the operating temperature of the PV cell, as shown in Equation (4).
I g = I g n + K I T T n G G n
where Ign is the light-generated current, Tn and Gn are the standard test temperature (25 °C) and standard solar irradiance (1000 W/m2), respectively, and KI is the current temperature coefficient (0.12499%/°C).
The diode saturation current I0 can be obtained from Equation (5).
I 0 = I 0 n T n T 3 e q E g a K 1 T n 1 T
where Eg is the semiconductor’s band-gap energy and I0n is the rated saturation current at standard test conditions, which can be obtained from Equation (6).
I 0 n = I s c n / e q V o c n a K T 1
where Iscn is the saturation current at standard test conditions, and Vocn is the open circuit voltage.
From Equations (5) and (6), the diode saturation current can be obtained from Equation (7).
I 0 = I s c n + K I . Δ T / e q V o c n + K V Δ T a K T 1
where KV is the voltage temperature coefficient (−0.349%/°C), and ΔT is the difference between the current temperature and the rated temperature of the PV cells.

3. Dandelion Optimization Algorithm

Modern optimization methods must be utilized in conjunction with the PV system and MPPT to precisely predict the GP in a short time. The dandelion optimization algorithm (DOA) has been utilized in several applications, including Extreme Learning Machine (ELM) for many real-world applications [49,54], traffic flow prediction [55], parameter estimation of PEMFCs’ models [56], the speed reducer problem of a mechanical device [57], AVR–LFC architecture for several sections of power systems employing hybrid fractional-order PI and PIDD controllers [58], reactive power dispatch optimization with DG unit uncertainty [59], and credit card fraud detection [60].
Because the DOA performs well in these applications, it has been employed in the MPPT of photovoltaic energy systems in this research. The DOA, which was launched in 2017, was inspired by the life cycles of dandelion plants [49]. The dandelion seeds can be spread over a long distance by the wind. The structure of the seed enables it to travel with the wind that can carry the seeds due to the vortexes above it, which can lift the dandelion seeds (DSs) in the rising stage. Once the rain occurs or the humidity increases, the DSs gain more weight and land in different locations. Some of the landed seeds may be able to be planted again, while others cannot. The plants can be planted again and will be used to generate a new generation. The same concept may be used to track the best solution to many optimization challenges. The DOA is divided into three stages: ascending, mutation, and selection. The objective is to model these three steps and apply them to find optimum solutions to optimization issues, as detailed in the following subsections. As indicated in Equation (8), the optimization technique is utilized to maximize the power supplied by the photovoltaic system by regulating the dc–dc converter’s duty ratio.
d o p t = max ( P ( d ) )
where dopt is the duty ratio corresponding to maximum power, d is the duty ratio, and P is the extracted power from the photovoltaic energy system.
Dandelions are classified into two categories: core dandelions (CDs) and assistant dandelions (ADs). The CD has the greatest amount of power (Pmax), while the ADs are the rest of the dandelions.
The mathematical modeling for the breeding cycle of the DSs is shown in the following subsections.

3.1. Rising Stage

Due to the vortices above the DSs, a lift force is created, which carries the seeds for a distance depending on the wind speed and the humidity. The radius of the sowing of the CD represents the radius of the dandelions, and it can be obtained from Equation (9).
R C D i t = ( U L ) / 2 R C i t 1 . e R C i t 1 . g t = 1 a = 1 a 1
where U and L are the upper and lower duty ratio values, respectively, and e and g are the fade and growth factors, respectively, and a is a factor termed the cross trend that may be calculated from Equation (10) [60].
a = P max t + ε P max t 1 + ε
where P max t 1 and P max t are the maximum power at previous and current iterations, respectively. Meanwhile, ε is a specified tolerance to prevent a denominator value of zero.
The sowing radius of the DAs is given in Equation (11).
R A D i t = ( U L ) / 2 t = 1 ω . R A D i t 1 + d C D t d A D t E l s e w h e r e
where d C D t and d A D t are the positions of CD and AD of search agent i at iteration t, respectively. ω is the weight factor used to enhance the stability of the search agents, and it can be obtained from Equation (12) [60].
ω = 1 P E P E max
where PE is the ratio of the number of calls to the goal function to the total number of calls, and PEmax is the total number of calls to the global function at the end of optimization iterations. The total number of calls to the objective function is not known since the optimization continuously works in real time. For this reason, similar values are used in [49]. The value of the inertia factor is shown in Equation (12), which starts with 1.0 and is gradually reduced to zero when PE = PEmax and stays at zero till the end of the simulation. The re-initialization of search agents in the optimization algorithm involves setting the inertia factor to 1.0 again and reducing it again with the progress of the optimization. The inertia factor enhances the effect of the previous radius of the ADs on the current radius, gradually reduces this effect, and makes it depend on the difference between the positions of the CD and AD, as shown in Equation (11).

3.2. Mutation Sowing

The AD search particles will move toward the CD search agent, which will search for GP during their journey. A mutation approach should be employed with the CD to prevent early convergence or the ability of the search agents to become caught in one of the local peaks. This mutation strategy is performed based on the Levy flight, as shown in Equation (13).
d C D t = d C D t 1 + L e v y ( )
where Levy() is a random duty ratio value derived from the Levy flight distribution with 𝛽 = 1.5 [60].

3.3. Selection Stage

The search agents should be evaluated in terms of their fitness values in comparison to the other search agents’ fitness values. Based on this assessment, a selection strategy is used to select the seeds (search agents) that will be used in the next iteration, and the seeds will be removed from the search agents’ swarm size. The probability of the fitness value of a certain search agent compared to the other search agents is shown in Equation (14), or it can be calculated from the difference between the fitness value and the average value as shown in Equation (15).
p i t = P i t n = 1 S S t P n t
P i t = P i t P a v g t
Reference [49] proposes selecting search agents with low and high probabilities and removing search agents with medium probabilities to improve the DOA’s exploration performance and avoid becoming caught in one of the local peaks. This technique is extremely effective at the beginning of the optimization to improve exploration, but after capturing the position of the GP, it should eliminate the search agent with a low probability to improve the exploitation of the DOA utilized in this study.

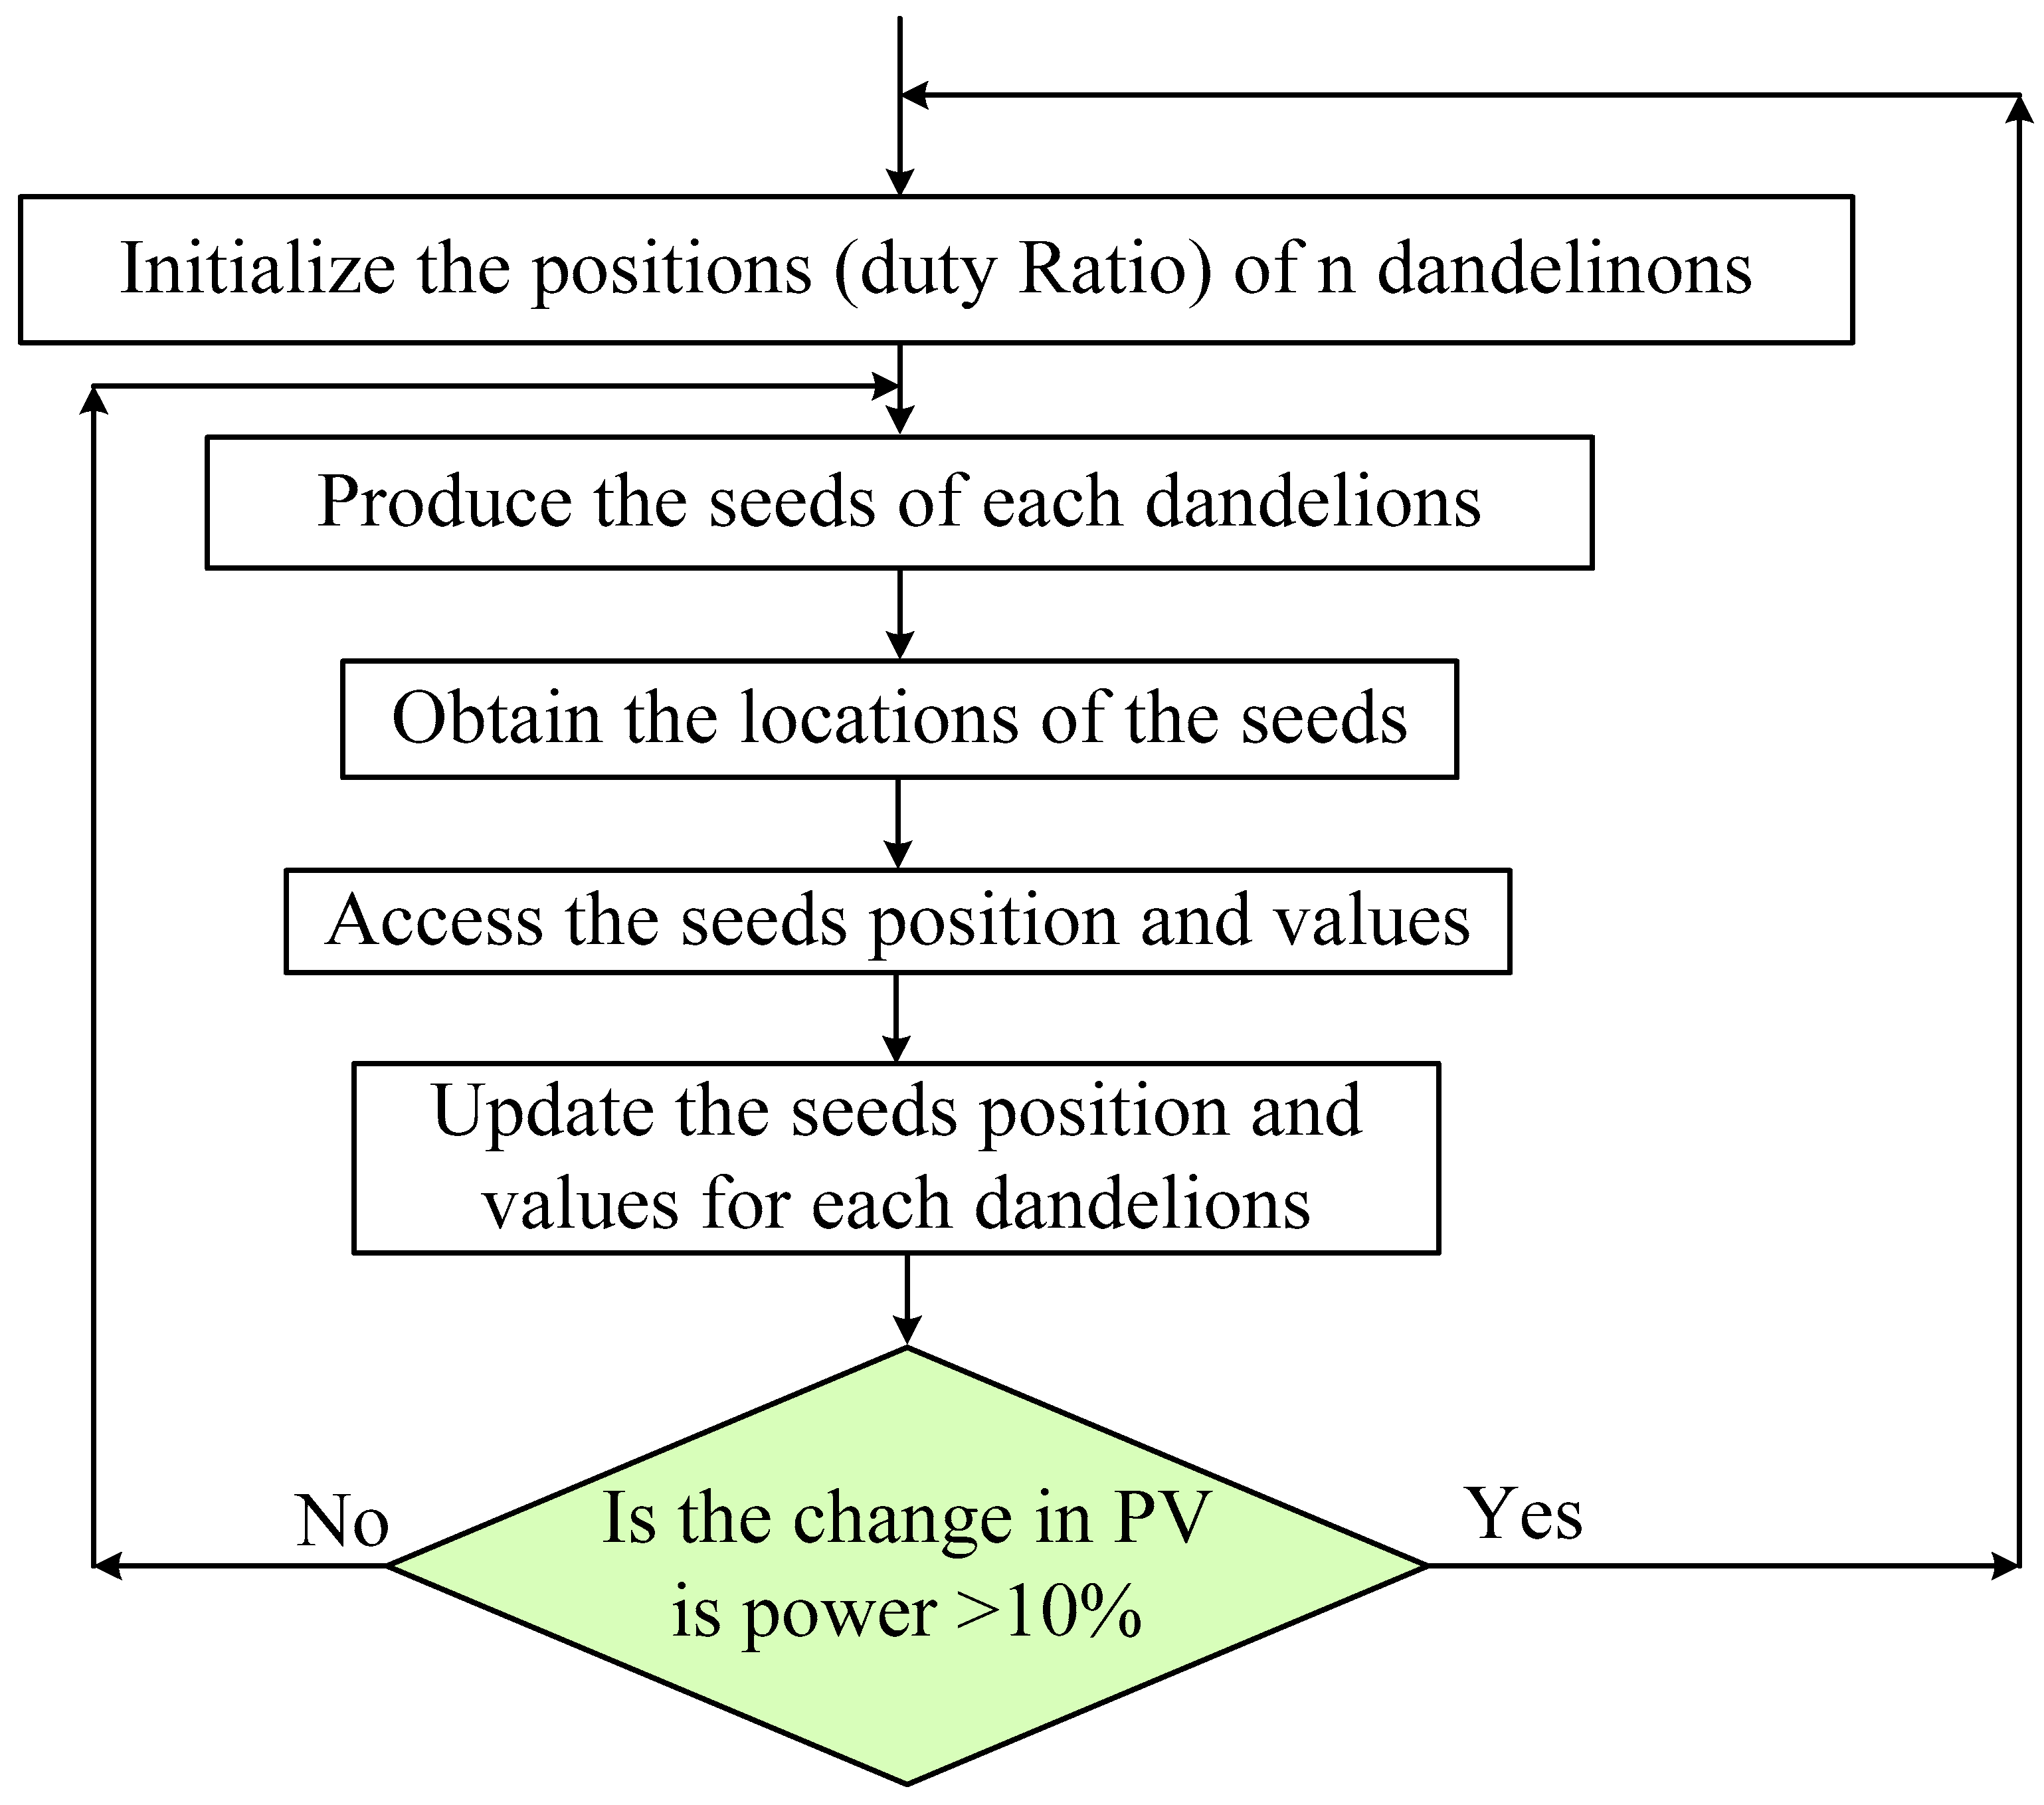
3.4. Improved DOA for MPPT of PV Systems

The suggested approach in this study is designed to improve DOA exploration and exploitation. Several solutions have been proposed in the literature to increase the exploitation performance of MOAs, including the following points.
  • Reducing the swarm size gradually [61,62,63], where the MOA is started with a high number of search agents to increase exploration and gradually reduces the search agents to enhance exploitation.
  • Enhancing local search pressure, in which an adaptive scale factor for local search is introduced to enhance the differential evaluation’s local search [64,65].
  • Hybrid optimization methods utilize MOAs with high exploration at the start of the optimization and MOAs with strong exploitation at the end to improve exploitation performance. This method has been used with differential evolution [55,66,67].
  • Dynamic variation of the control parameter, where the control parameters change during the optimization iterations [9,21,24,68,69,70].
The above improvement strategies were used with a modified strategy called a guided probability-based DOA (GDOA [55]). In this strategy, a learning factor is introduced to learn from the CD based on the fitness value, and the highest fitness value will obtain a higher enhanced learning factor to enhance the exploitation performance of the DOA. Moreover, the middle search agents will be removed at the start of the optimization to improve exploration; however, after each iteration, the worst AD search agent (the one with the lowest generated power) will be removed from the swarm size in each iteration to improve the proposed algorithm’s exploitation performance. The swarm size that started the simulation is called SSmax, and the minimum value of the swarm size is called SSmin. The logic used in the proposed algorithm is shown in Figure 3. The position of each search agent should be selected, and the fitness values of these search agents will be determined. Moreover, the best power generated from the PV system should be compared with the previous one based on Equation (1). In the event that the condition shown in Equation (1) is validated, the DOA should be reinitialized and the optimization started again due to the substantial change (ε > 0.1) in the shading patterns. Meanwhile, if the condition shown in Equation (1) is not verified, the search agents’ positions should be adjusted depending on the fitness values given by the previous iteration.
The swarm size changes throughout optimization, and it can be calculated using Equation (16).
S S t = S S max . P max t P min t + ε P max P min + ε S S t > S S min S S min S S t S S min
where S S t is the swarm size during the current iteration, SSmax, SSmin are the maximum and minimum allowable swarm sizes, respectively; Pmax, Pmin are the maximum and minimum power during the operation of the DOA algorithm, respectively, and P max t a n d P min t are the maximum and minimum power during the current iteration of the DOA algorithm, respectively.

4. Simulation Work

The simulation of this study is performed using Matlab/Simulink software with an array having four modules in series and three branches. The module used in the simulation and experimental study is SOLTON Power SPI-185 M, with performance parameters shown in Figure 4. The available modules in the lab were selected to be similar to the ones in the simulation to ease the comparison between the simulation and experimental results.

4.1. Optimal Design of the Boost Converter

The design of the dc–dc converter is critical to the MPPT’s performance. This converter should handle the MPPT instructions (duty ratios) quickly and accurately. The time it takes the dc–dc converter to achieve the steady-state condition should be used to calculate the sampling time. So, the steady-state time should be shortened as much as we can. The boost converter’s steady-state time is determined by its inductance, capacitance, switching frequency, and processed current. The boost converter is the ideal solution since it increases the dc-link voltage rather than the PV array’s terminal voltage. Many studies have been conducted to design the boost converter for a shorter steady-state time and, consequently, a shorter sampling time [62].
In this work, the optimum design technique utilized to develop the boost converter described in [62] is applied. Equations (17) and (18) may be used to calculate the capacitance and inductance of a boost converter with a switching frequency of 20 kHz. The average duty ratio is chosen to be 0.5, and the Vdc = 220 V. With a 1% ripple factor, Vr, based on Equation (17), the capacitor of the boost converter is calculated (C = 5.5 mF). The maximum dc-current (Idc) is obtained by dividing the rated power of the PV array (185×2 = 2220 W) by the dc-link voltage (220 V) = 10.1 A. The inductance of the boost converter conductor can be obtained from Equation (18), which is equal to 68.1 μH.
C = d f s . V d c V r
L = d 1 d 2 2 f s . V d c I d c
where d is the duty ratio, fs is the switching frequency, Vdc and Idc are the dc-link voltage and current, respectively, and Vr is the voltage ripple factor.
The three-phase inverter is linked to the grid using a space vector control approach [47,71,72] to keep the dc-link voltage constant at 220 V and to decouple active and reactive power regulation. In the computational and experimental investigations indicated in Table 1, three distinct shading patterns were employed, where G1 to G4 are the solar irradiance levels that fall on various modules in W/m2. The simulation technique employs three distinct shading patterns: Sp-1, SP-2, and SP-3. The PV array’s P-V and P-d characteristics for the aforementioned SPs are depicted in Figure 5a,b, respectively.
Three different simulation studies are performed in this article. The first simulation study is to select the best initial position (duty ratio) of search agents among three different strategies. The second simulation study is to estimate the optimal swarm size for DOA. The third simulation study is to compare the simulation performances of the DOA with those of the MCA, PSO, and GWO. The control parameters used with these metaheuristic algorithms are shown in Table 2. These studies are discussed in the following subsections.

4.2. The Best Initialization

In this study, three distinct initialization procedures are explored to determine which one will be used in the final simulation study. The time of convergence and rate of failure are used to assess each initialization approach. To prevent the random character of the MOAs, each approach runs 100 times with random amounts of soalr irradiance to estimate the rate of failure and average time of convergence. The swarm size utilized in this study is six search agents.
The first study is performed using random positions (duty ratios) of the search agents limited between 0.2 and 0.9, as indicated in Figure 5b. Table 3 displays the average time of convergence and rate of failure. The data in Table 3 reveal that this approach has the longest convergence time and is the only method with a failure rate larger than zero. For these reasons, it is not recommended to use this strategy in the initialization of any MOA.
The second strategy is performed by using equal distance for the initial position of search agents between 0.2 and 0.9, where these values are 0.20, 0.34, 0.48, 0.62, 0.76, and 0.90, which can be obtained from Equation (19). The results obtained from this strategy showed that the convergence time is 0.41 s with a zero failure rate, which is substantially better than the random initialization strategy.
The third technique involves starting the search agents at the expected peak location, which may be calculated using Equation (20). This technique produced somewhat shorter convergence times with a 0% failure rate than initialization with equal distance. This technique is the best based on the convergence time and success rate, but it has no flexibility to adjust the swarm size since it must equal the number of peaks; so, the second study will be employed in further simulation and experimental research.
d k 0 = d min + k . ( d max d min ) / ( S S 1 )
d k = 1 S S k + 1 k v S S V o c V d c
where k is the search agent order inside the swarm, and kV is a constant equal to 0.79 [20].

4.3. Optimal Swarm Size

The swarm size has a substantial influence on the MPPT performance of the photovoltaic energy system regarding the time of convergence and the rate of failure. The larger the swarm size, the longer the time of convergence and the lower the rate of failure; conversely, the smaller the swarm size, the faster the time of convergence and the higher the rate of failure. As a result, it is advised to choose the ideal swarm size by setting their values to zero failure rate and the shortest time of convergence. This study is performed by selecting several search agents varying between ten and three with initialization at equal distance strategy, as explained above in Section 4.2. To prevent the random nature of the outcomes of these optimization methods, this initialization technique is performed 1000 times for the DOA, MCA [12], PSO [9], and GWO [11]. Table 4 depicts the relationship between swarm size, time of convergence, and failure rate for several optimization techniques. This table clearly shows that the time of convergence increases with the swarm size in all MOAs under consideration. Meanwhile, as the size of the swarm grows, the rate of failure decreases. The most interesting result from this table is that all the MOAs under study have a zero failure rate when the swarm size is above or equal to six. Moreover, the best time of convergence is associated with the DOA and MCA, with 0.41 s and 0.43 s convergence times, respectively. So, it is recommended to use the DOA with six search agents in the swarm for the shortest conversion time at a zero failure rate.

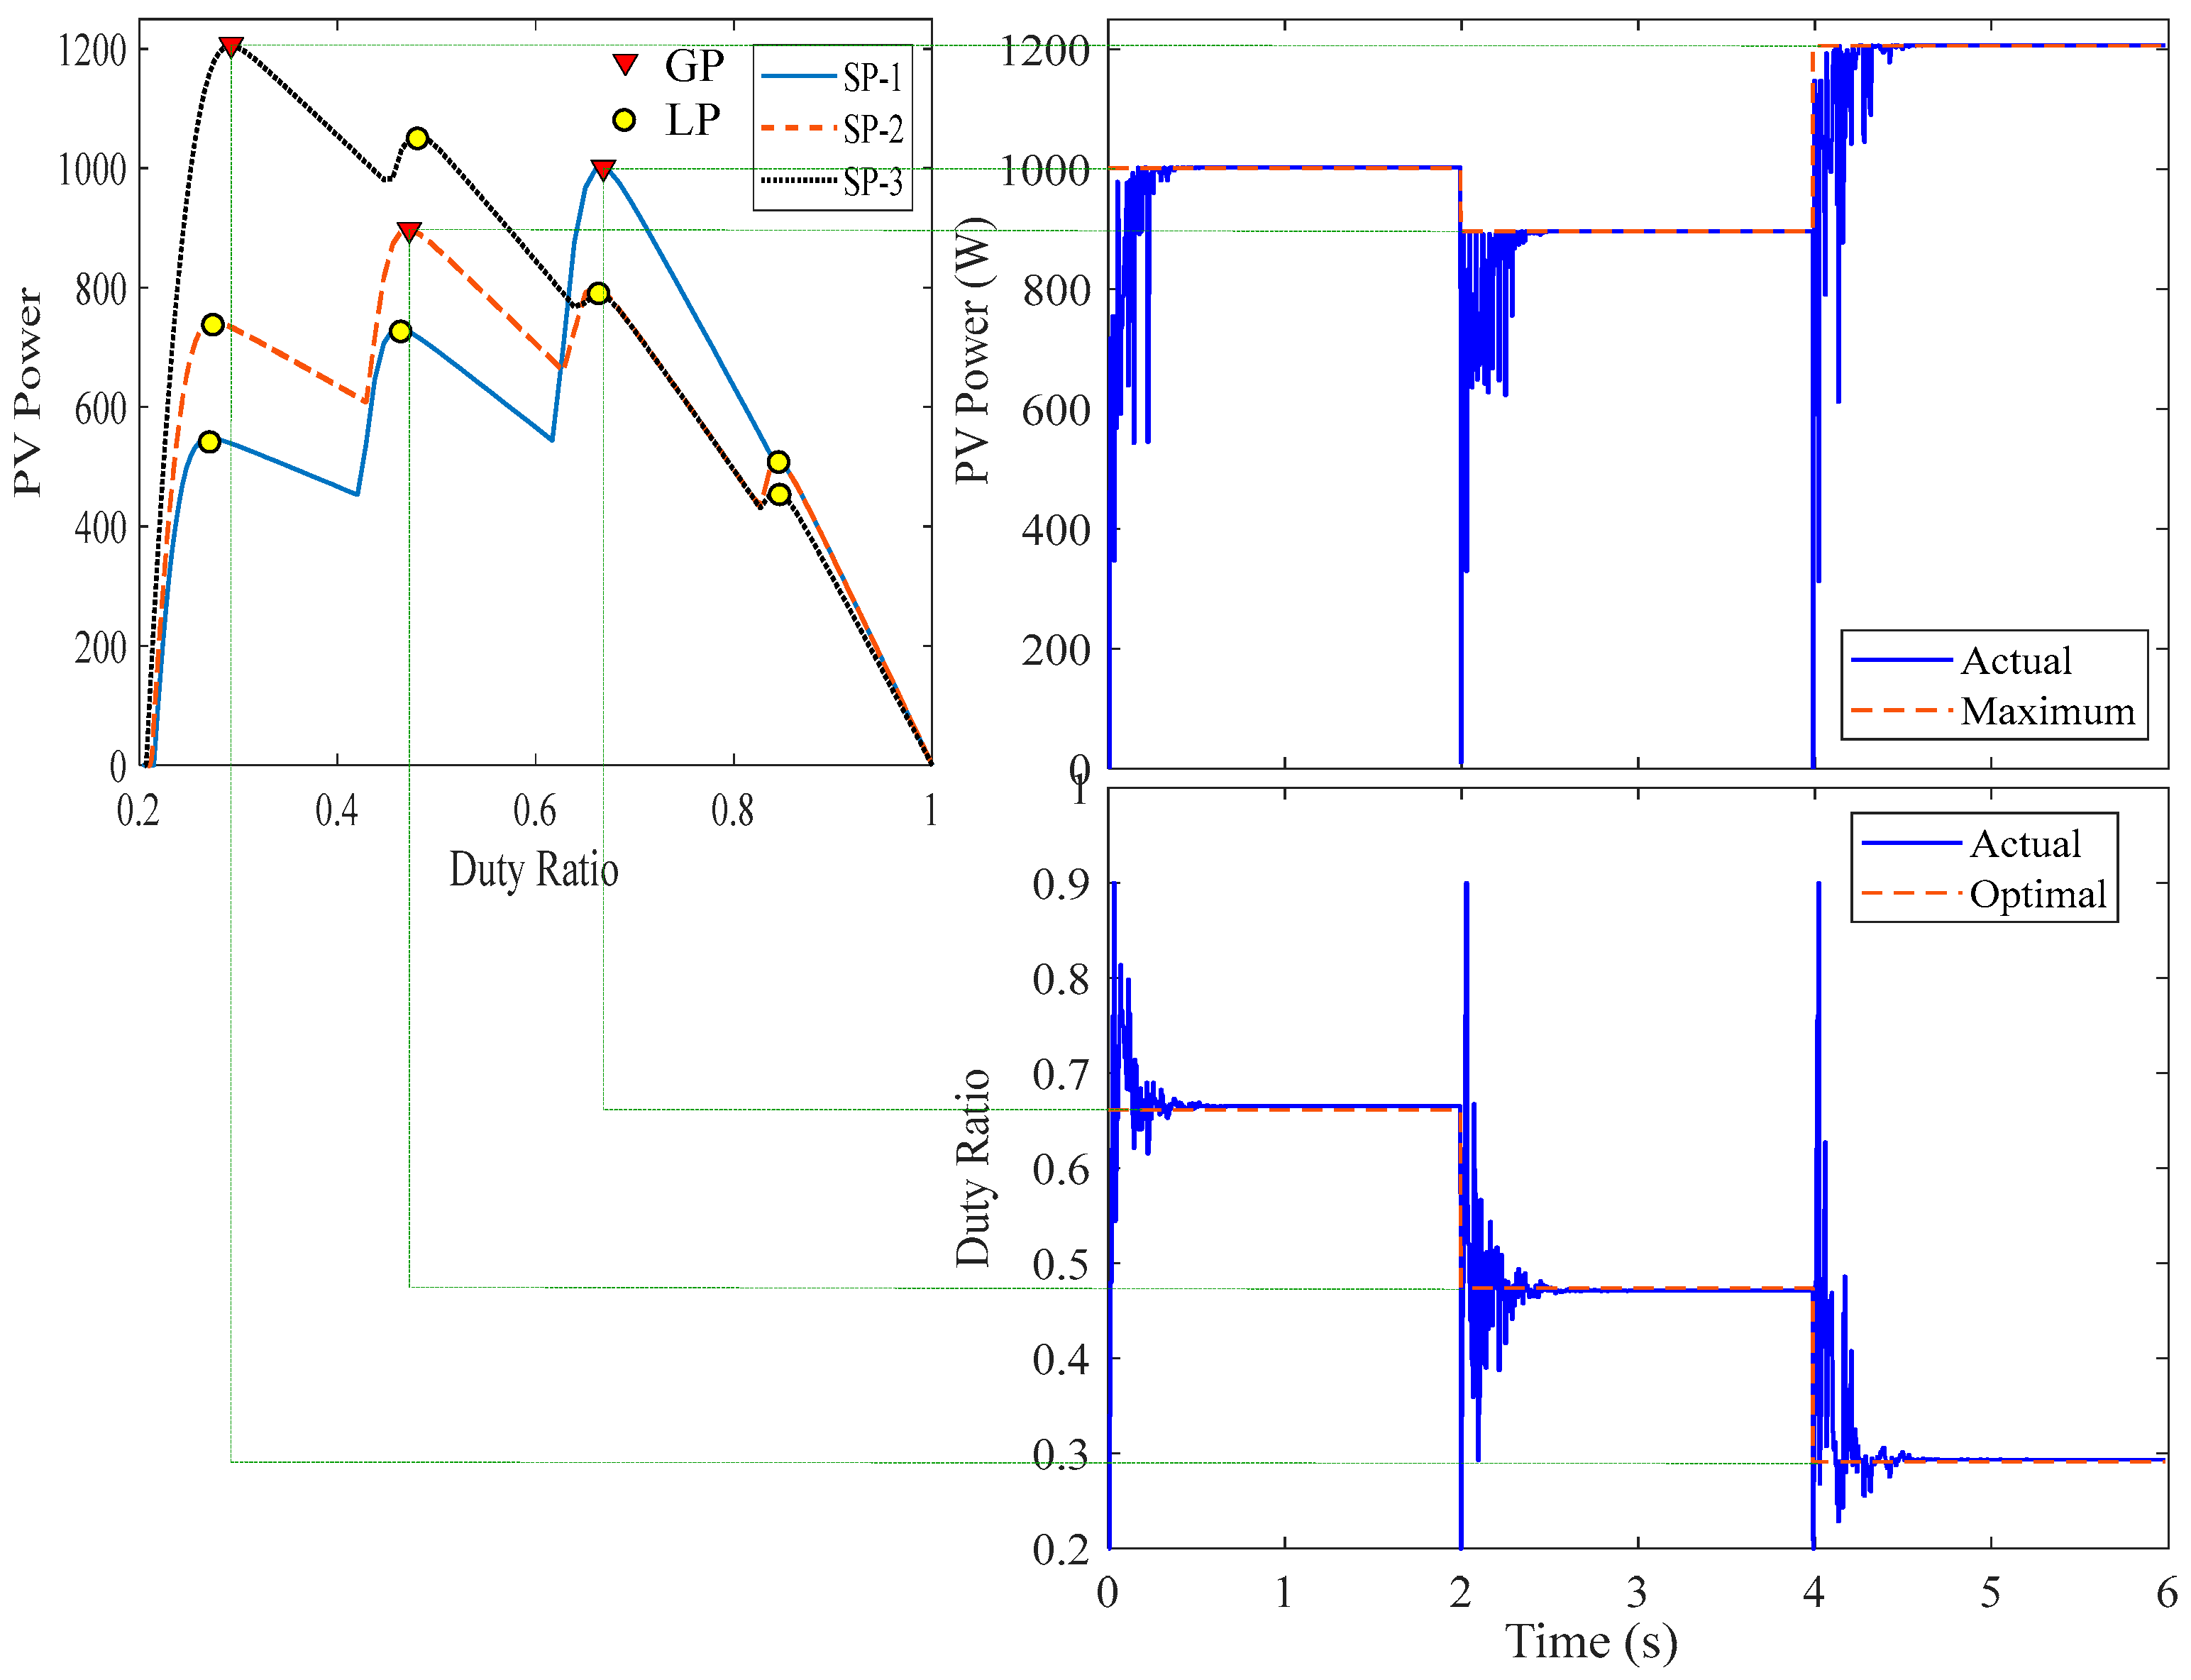
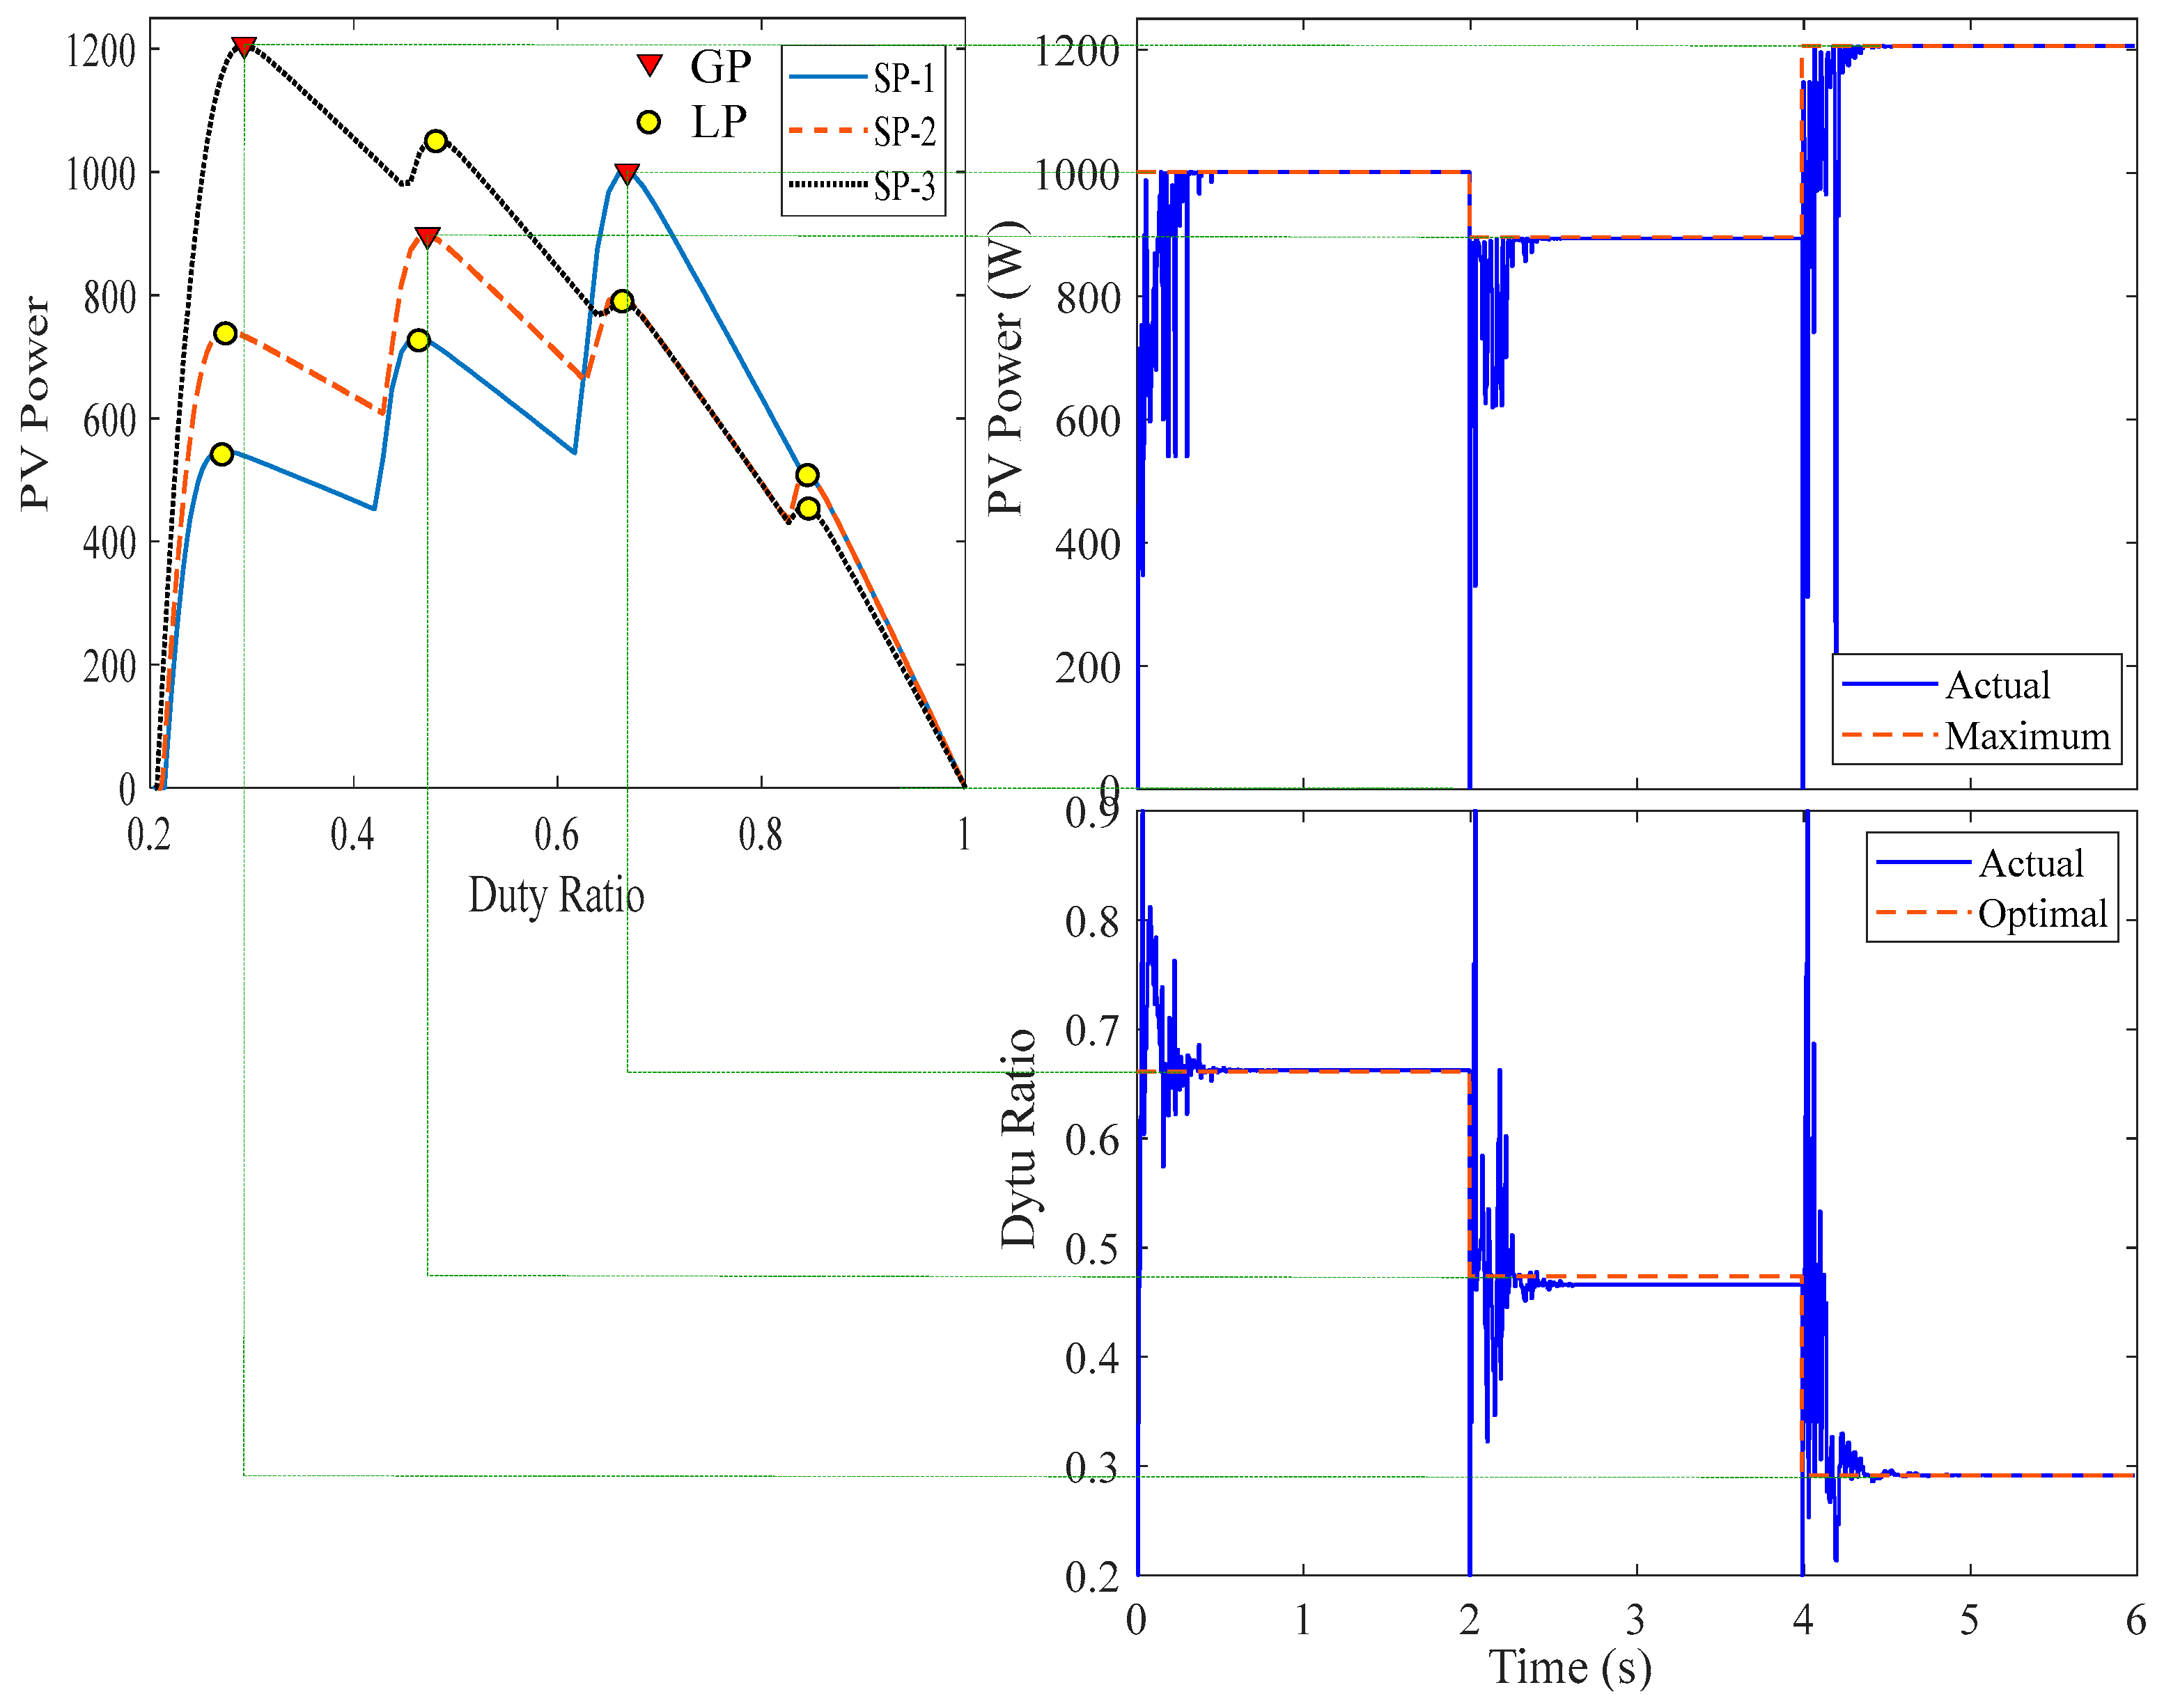
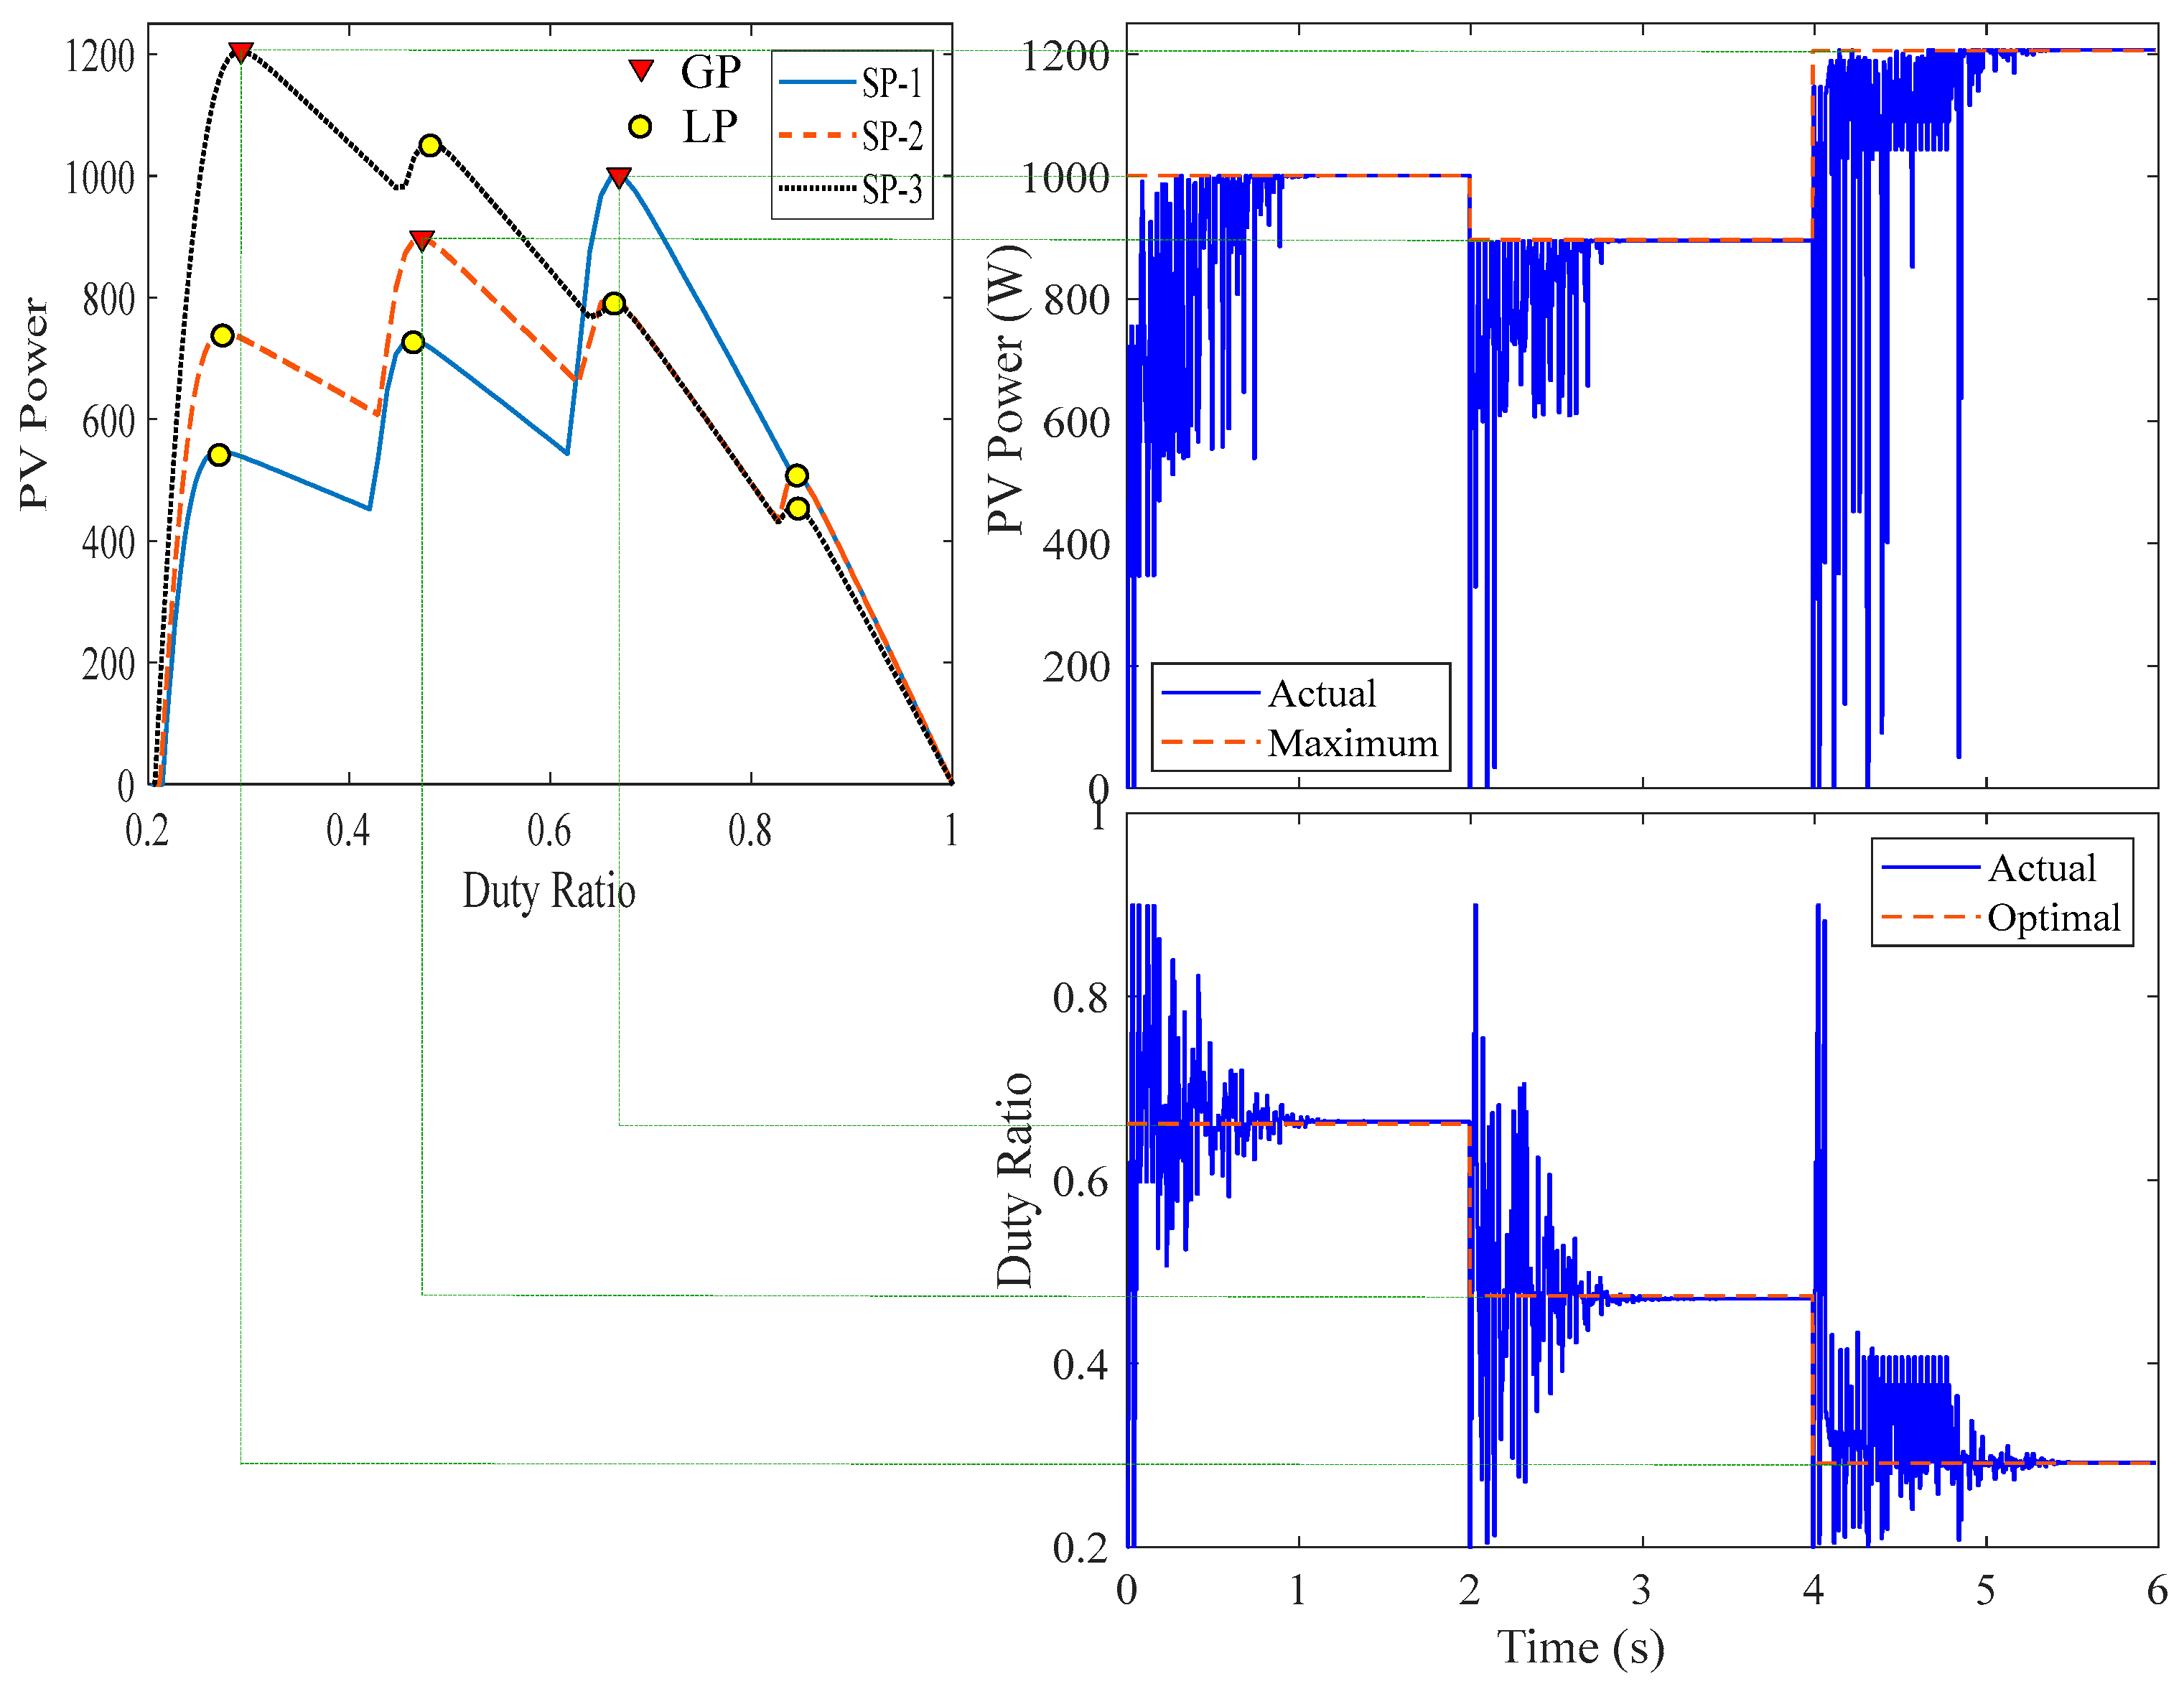
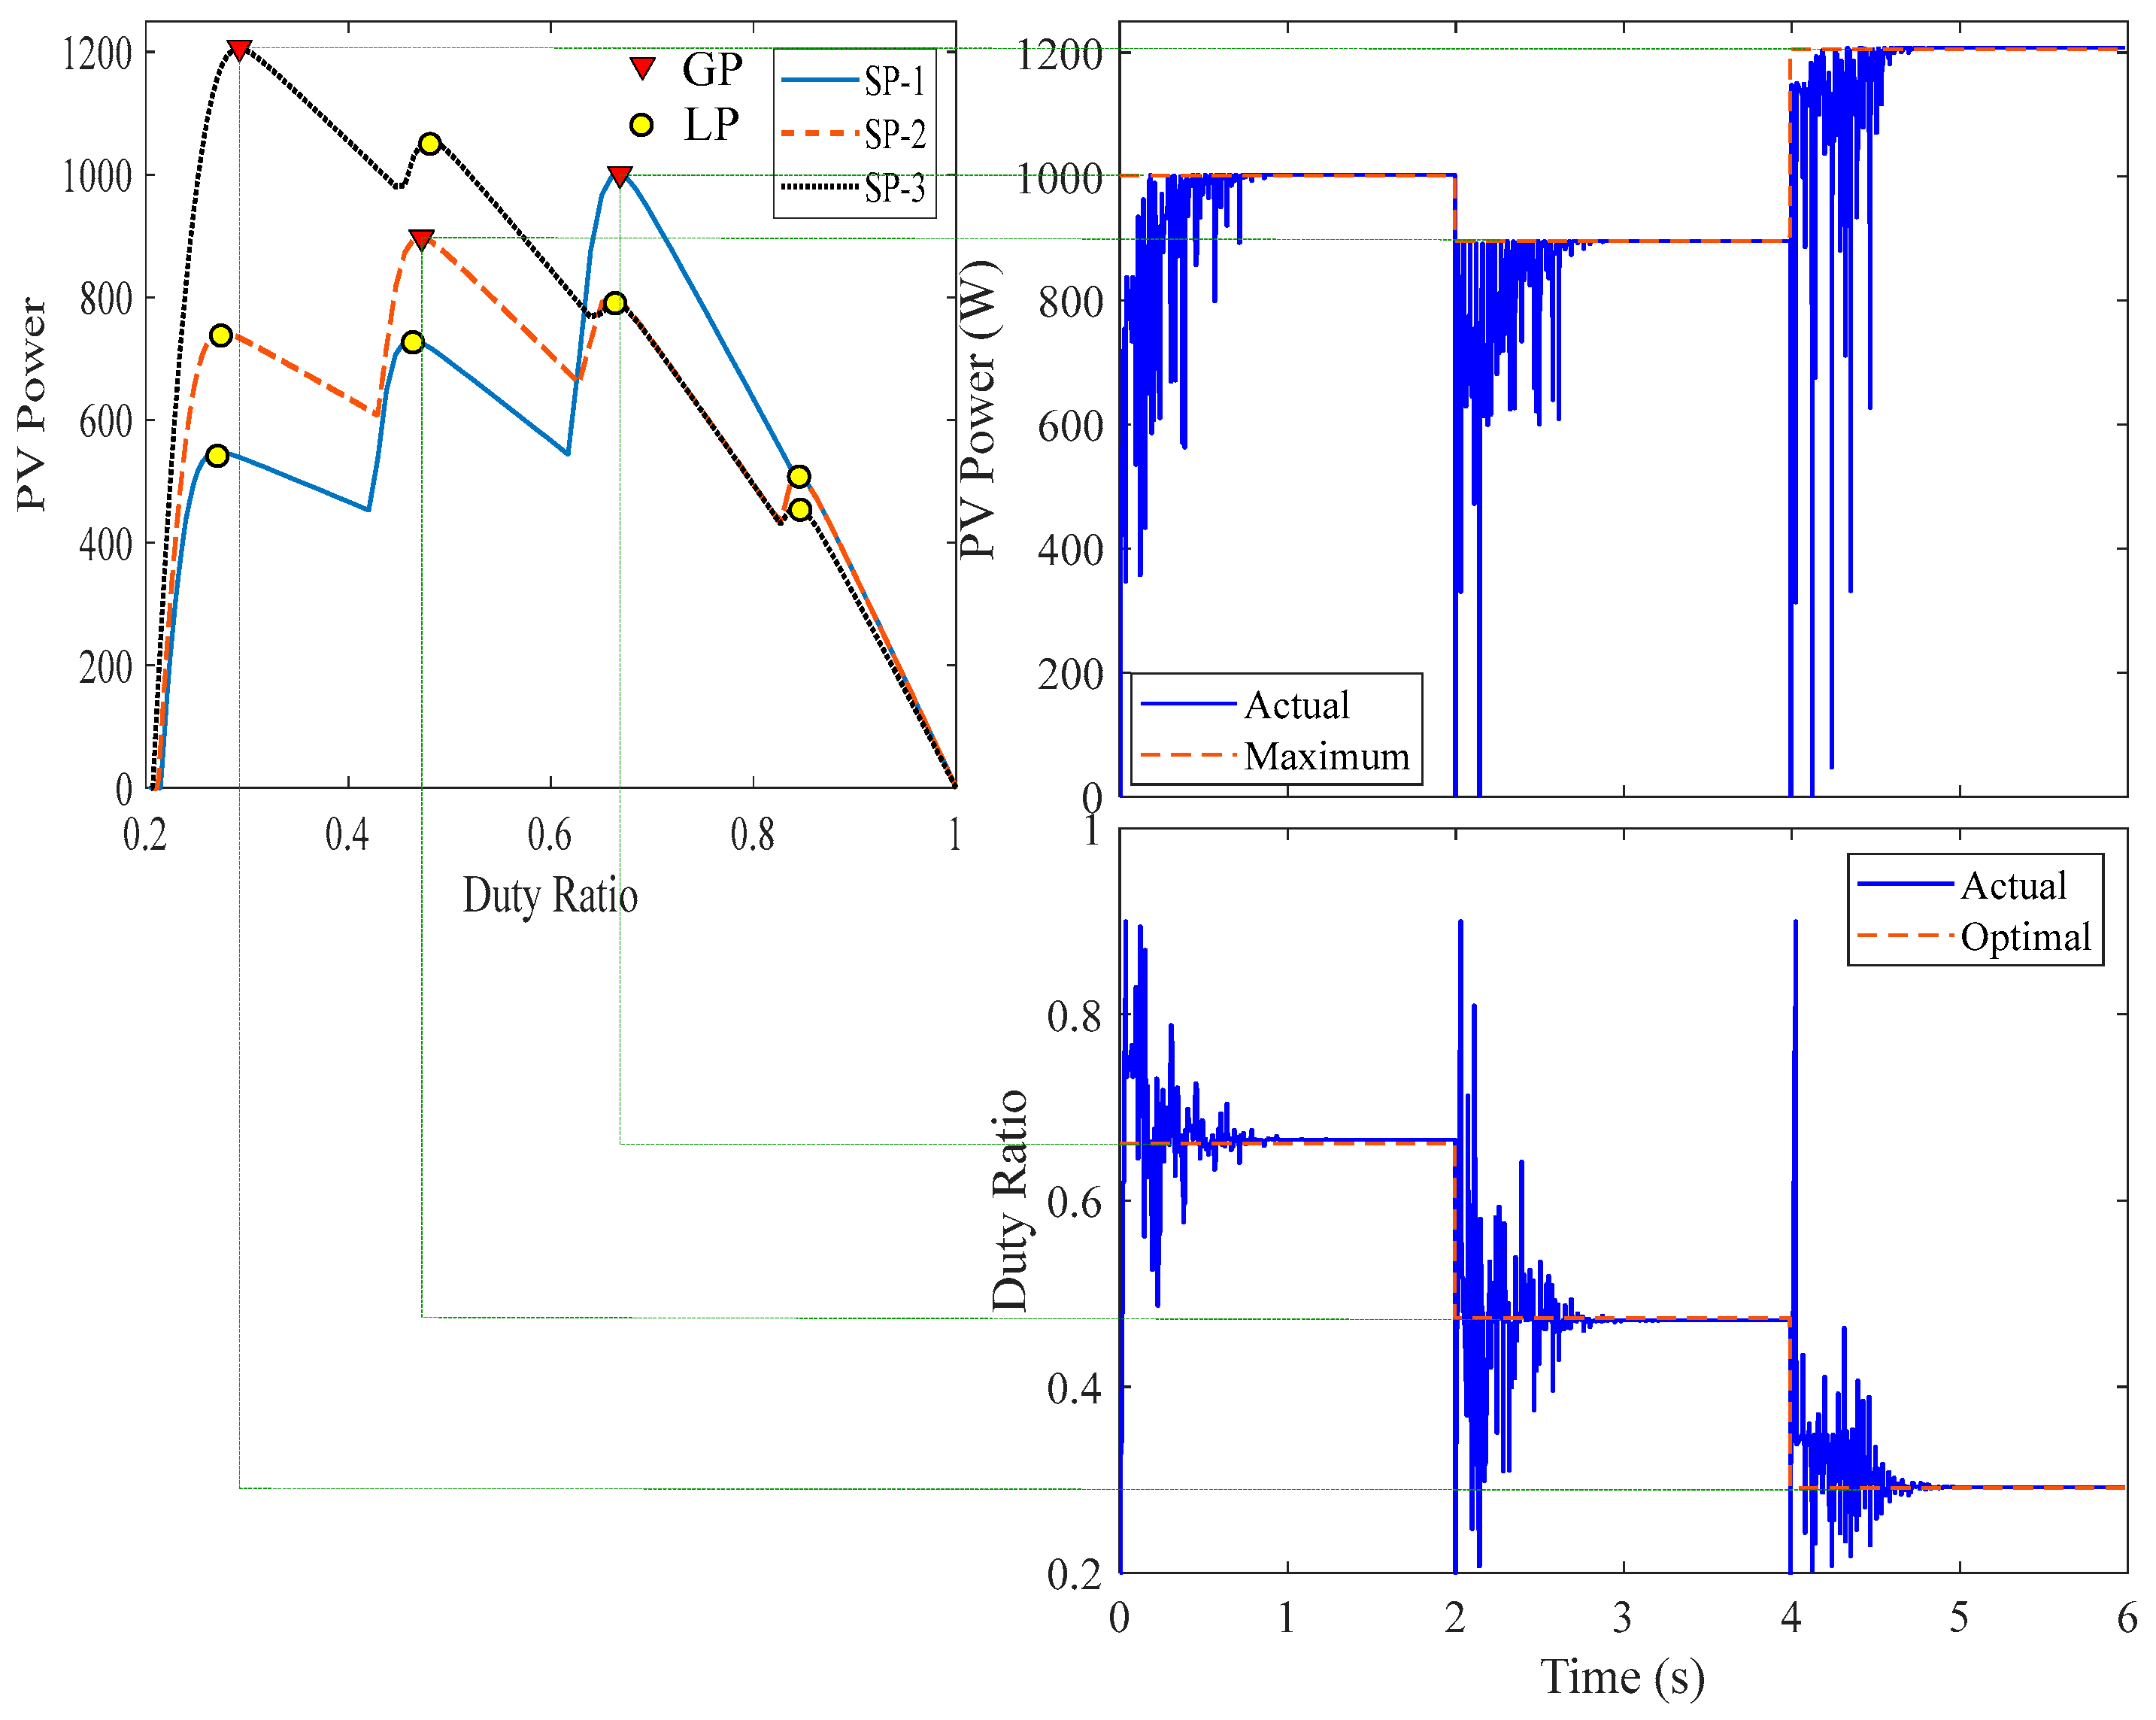
4.4. Real-Time Simulation Results

This study’s simulation is carried out using Matlab/Simulink for the three distinct shading patterns presented in Table 1 and Figure 5 for 6 s, where each shading pattern is used for 2 s. Based on the recommended value from the study shown above in Section 4.3, the swarm size used in this study is six for the shortest time of convergence and zero failure rate. The initial position of search agents for DOA used in this study is based on an equal distance between each search agent from 0.2 to 0.9 duty ratio, with duty ratios equal to 0.20, 0.34, 0.48, 0.62, 0.76, and 0.90 using Equation (19). The simulation is performed with the use of re-initialization based on Equation (1), as shown in Figure 6, Figure 7, Figure 8 and Figure 9 for DOA, MCA, PSO, and GWO, respectively. This image clearly shows that the DOA recorded the GP of the first shading pattern (SP-1) in a short amount of time (0.4 s). Meanwhile, the MCA, PSO, and GWO won the GP in 0.43 s, 1.2 s, and 0.9 s, respectively. This demonstrates the DOA’s and MCA’s advantages over the other MOAs employed in this study.
In the case of shading pattern changes, the search agents will be stagnated around the previous GP and will not have the ability to escape from this position in all the optimization algorithms unless reinitialization occurs based on the condition shown in Equation (1). This critical condition aids in avoiding the stalling of search agents at one of the LPs, which can result in a significant increase in extracted power and system efficiency of the photovoltaic energy systems.

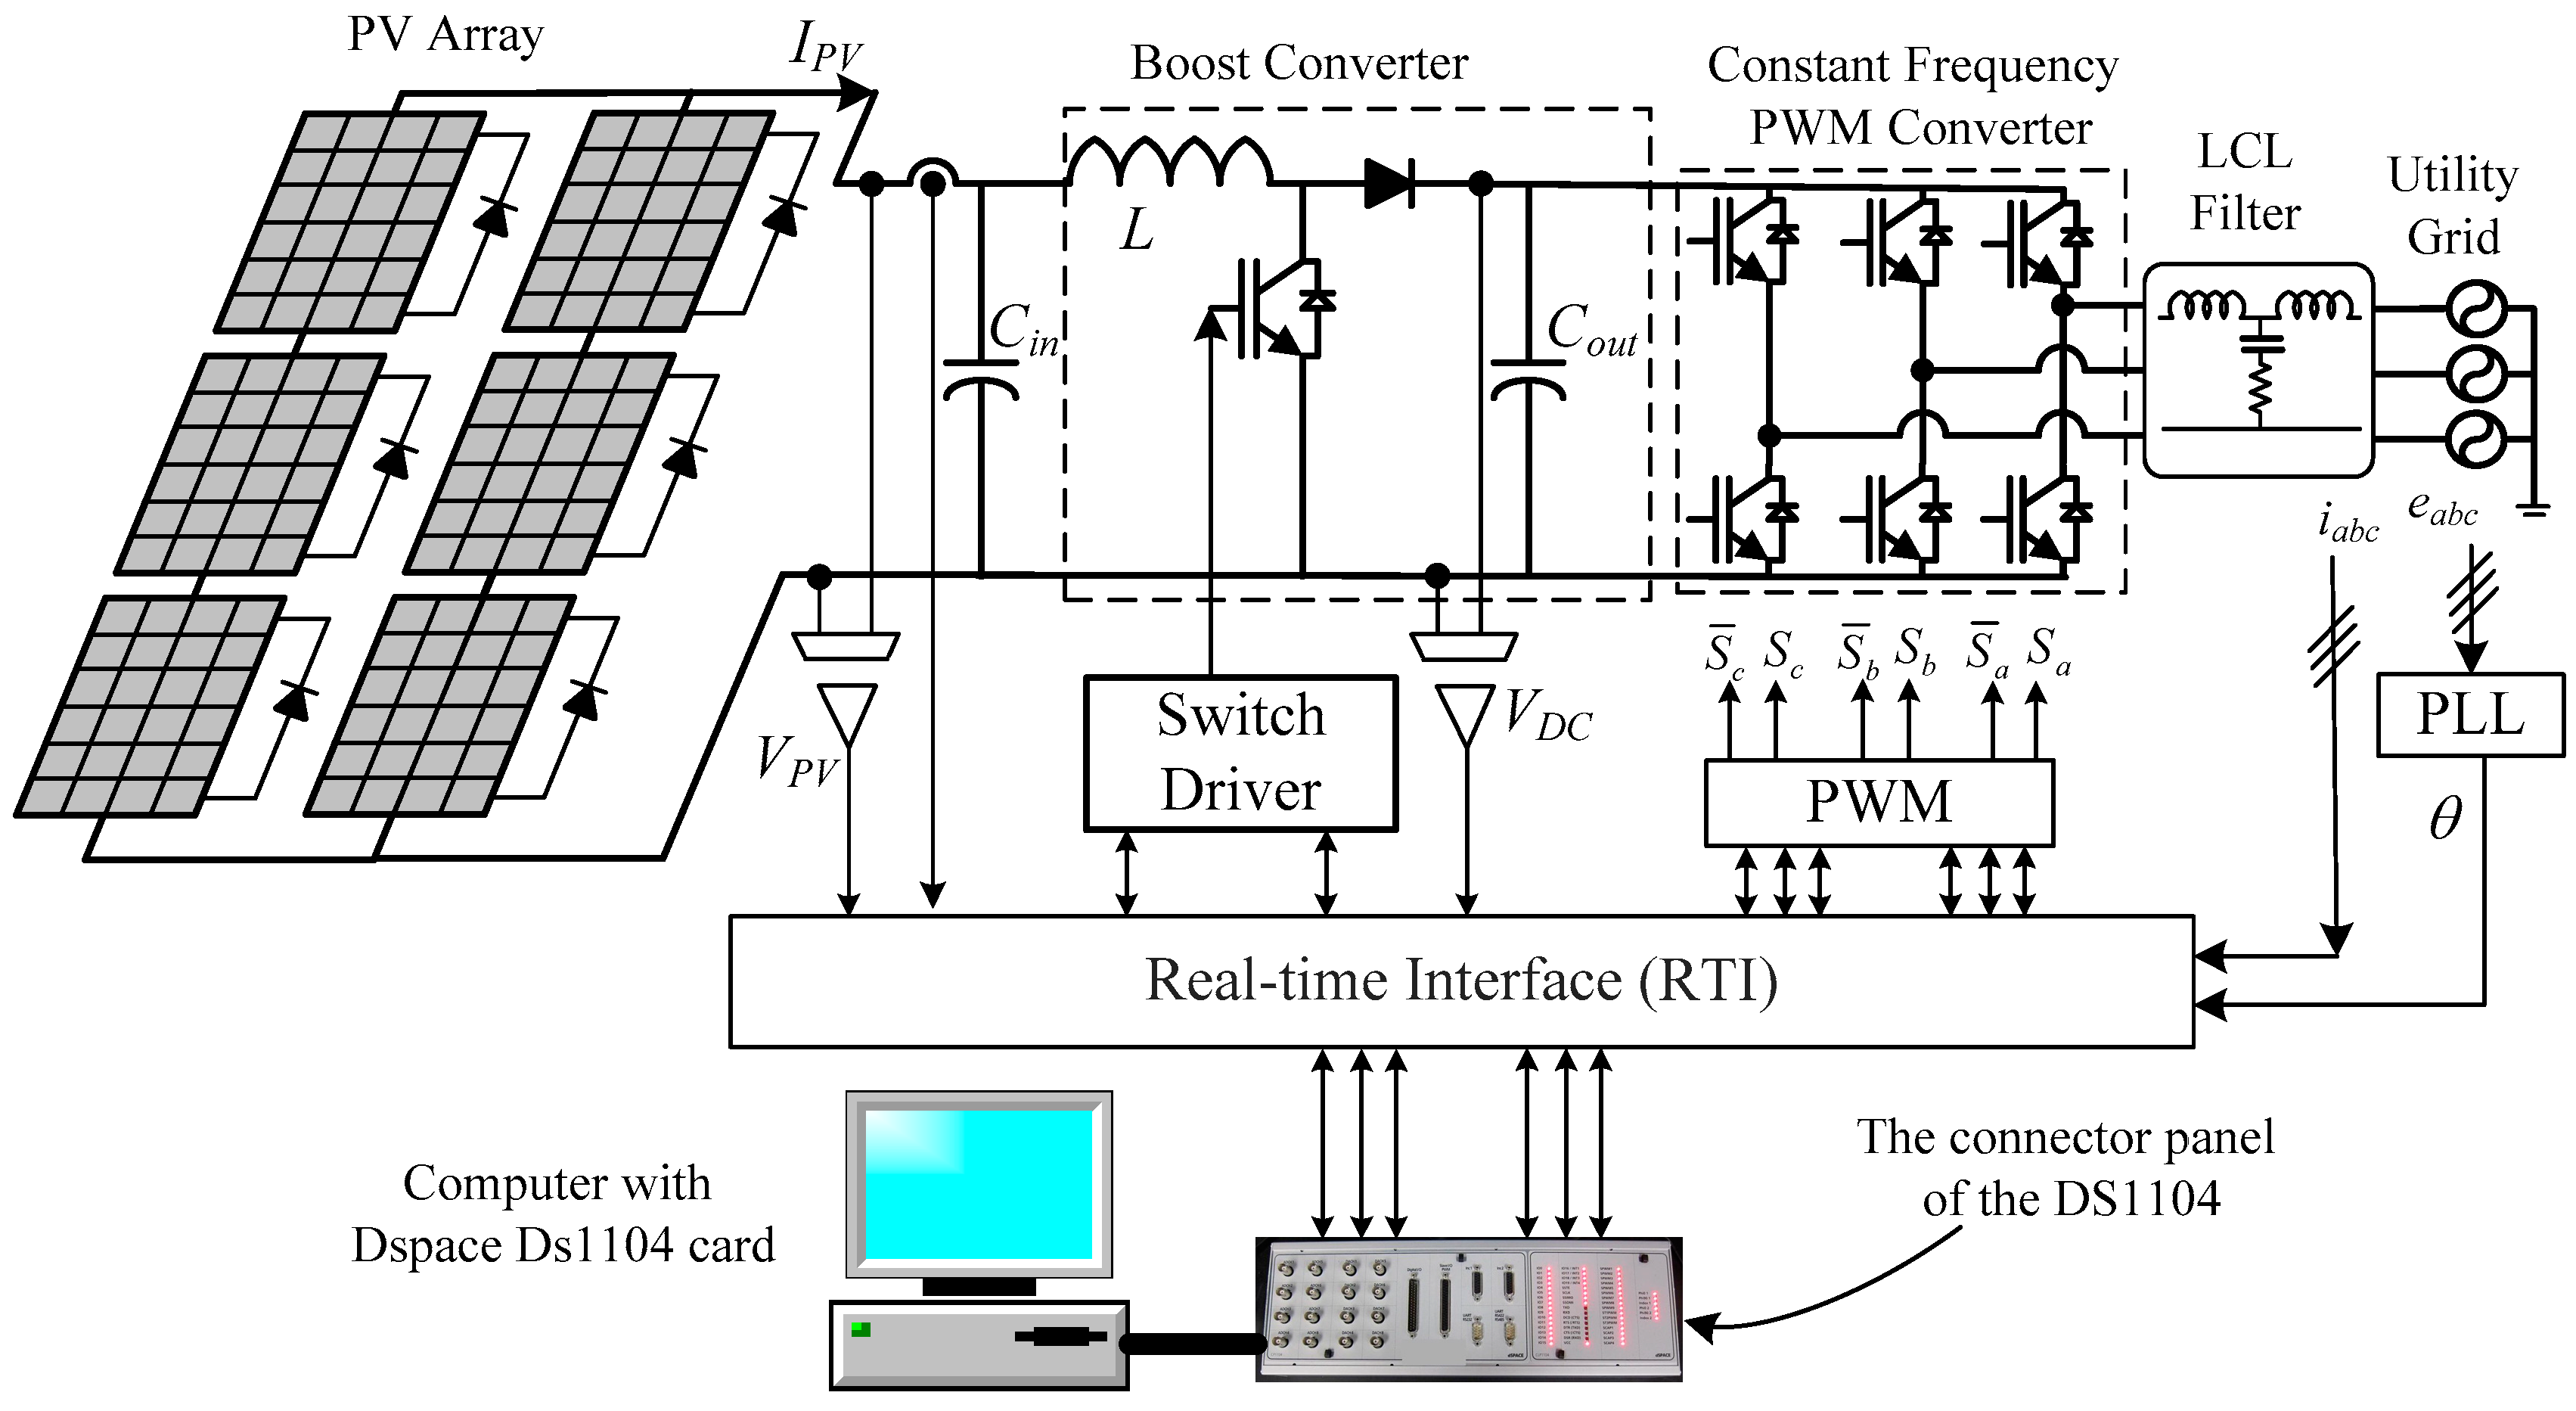
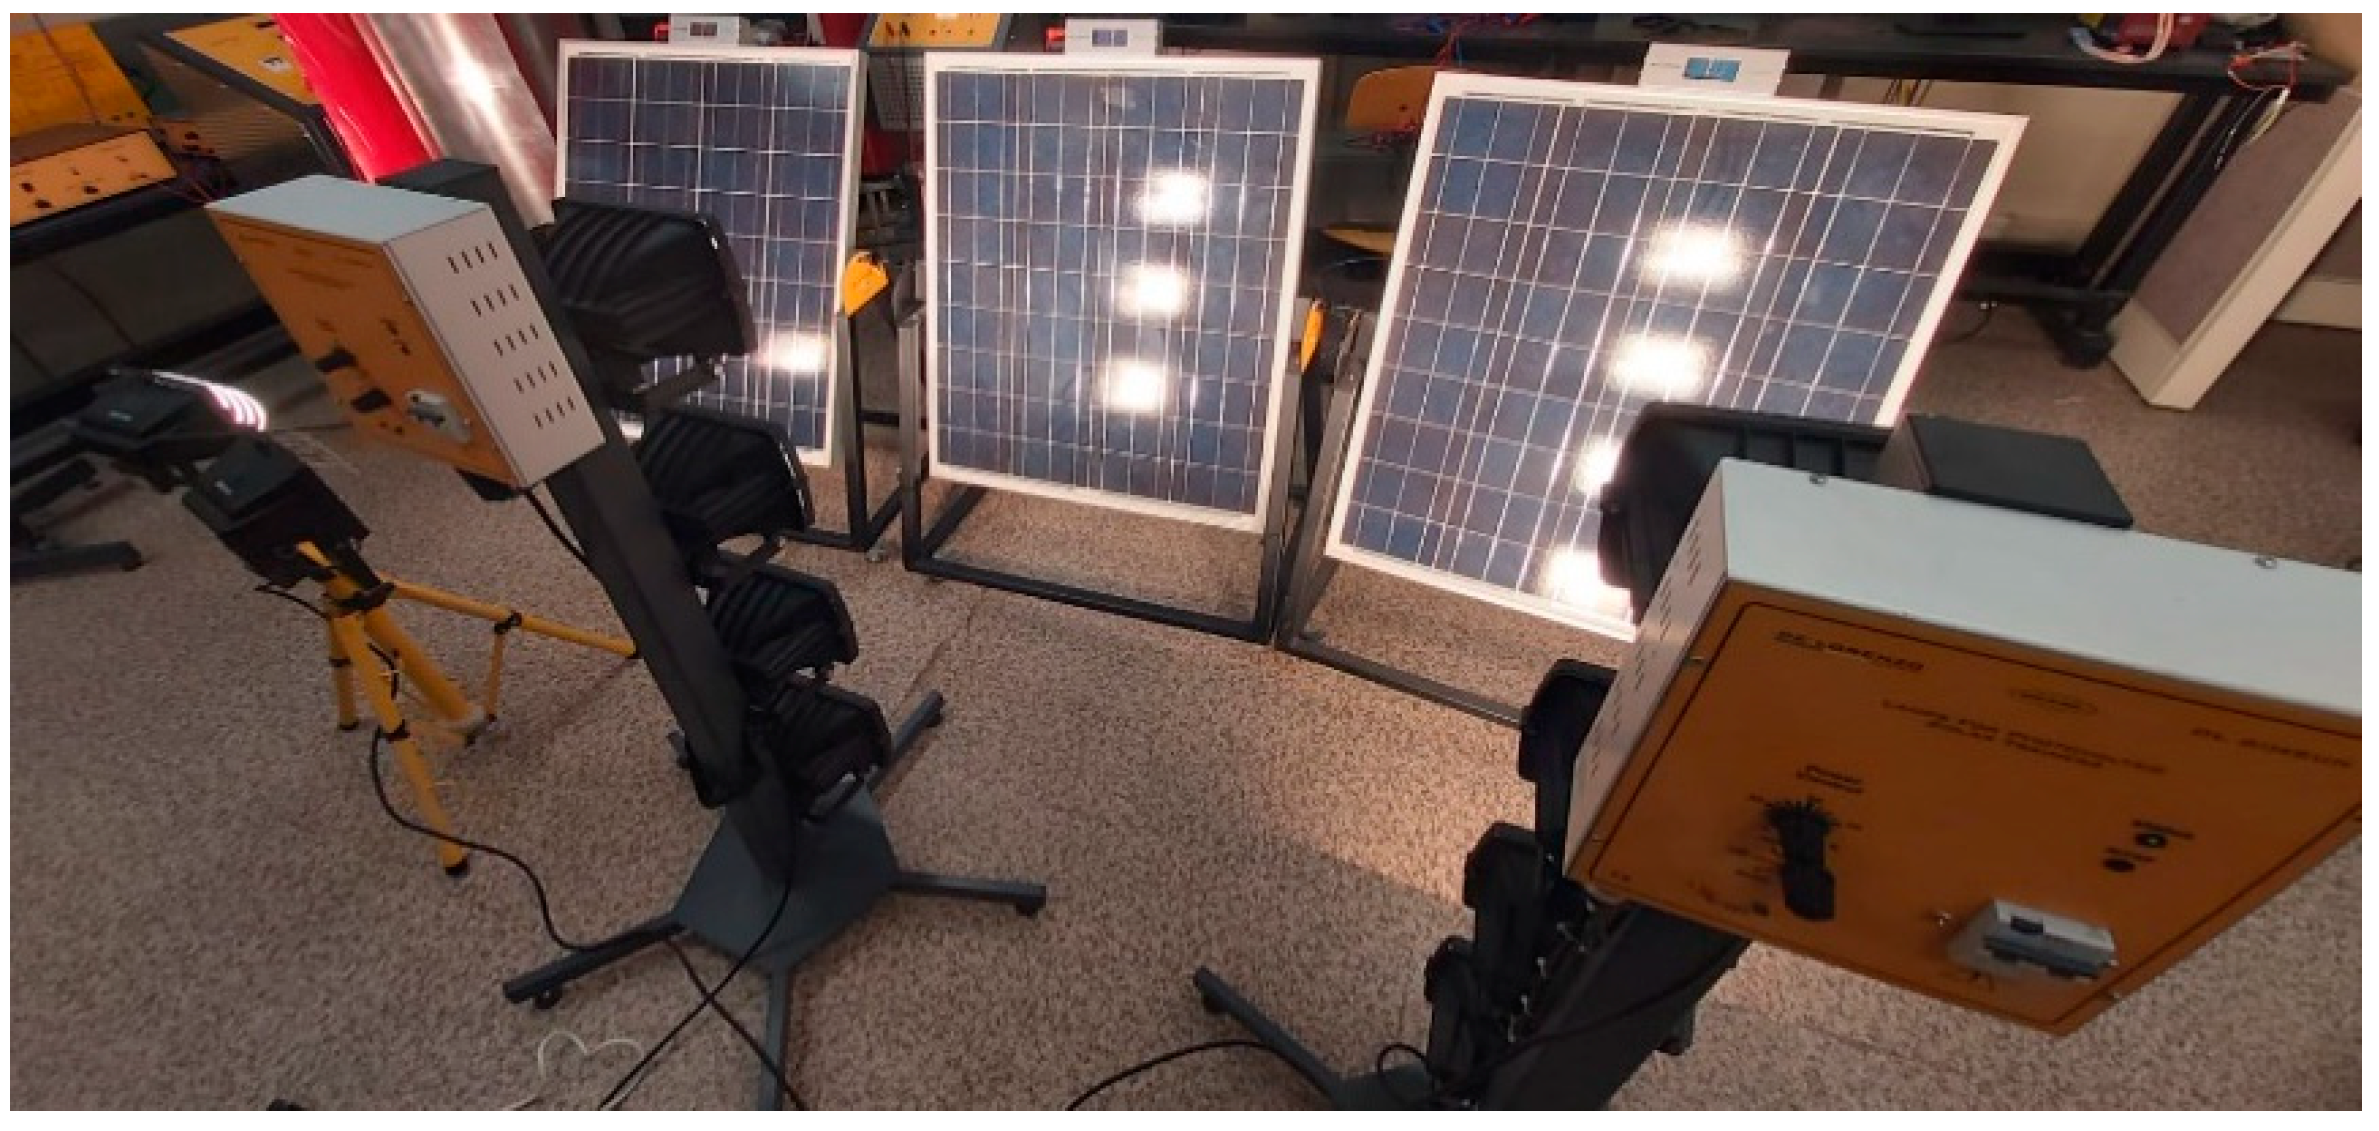
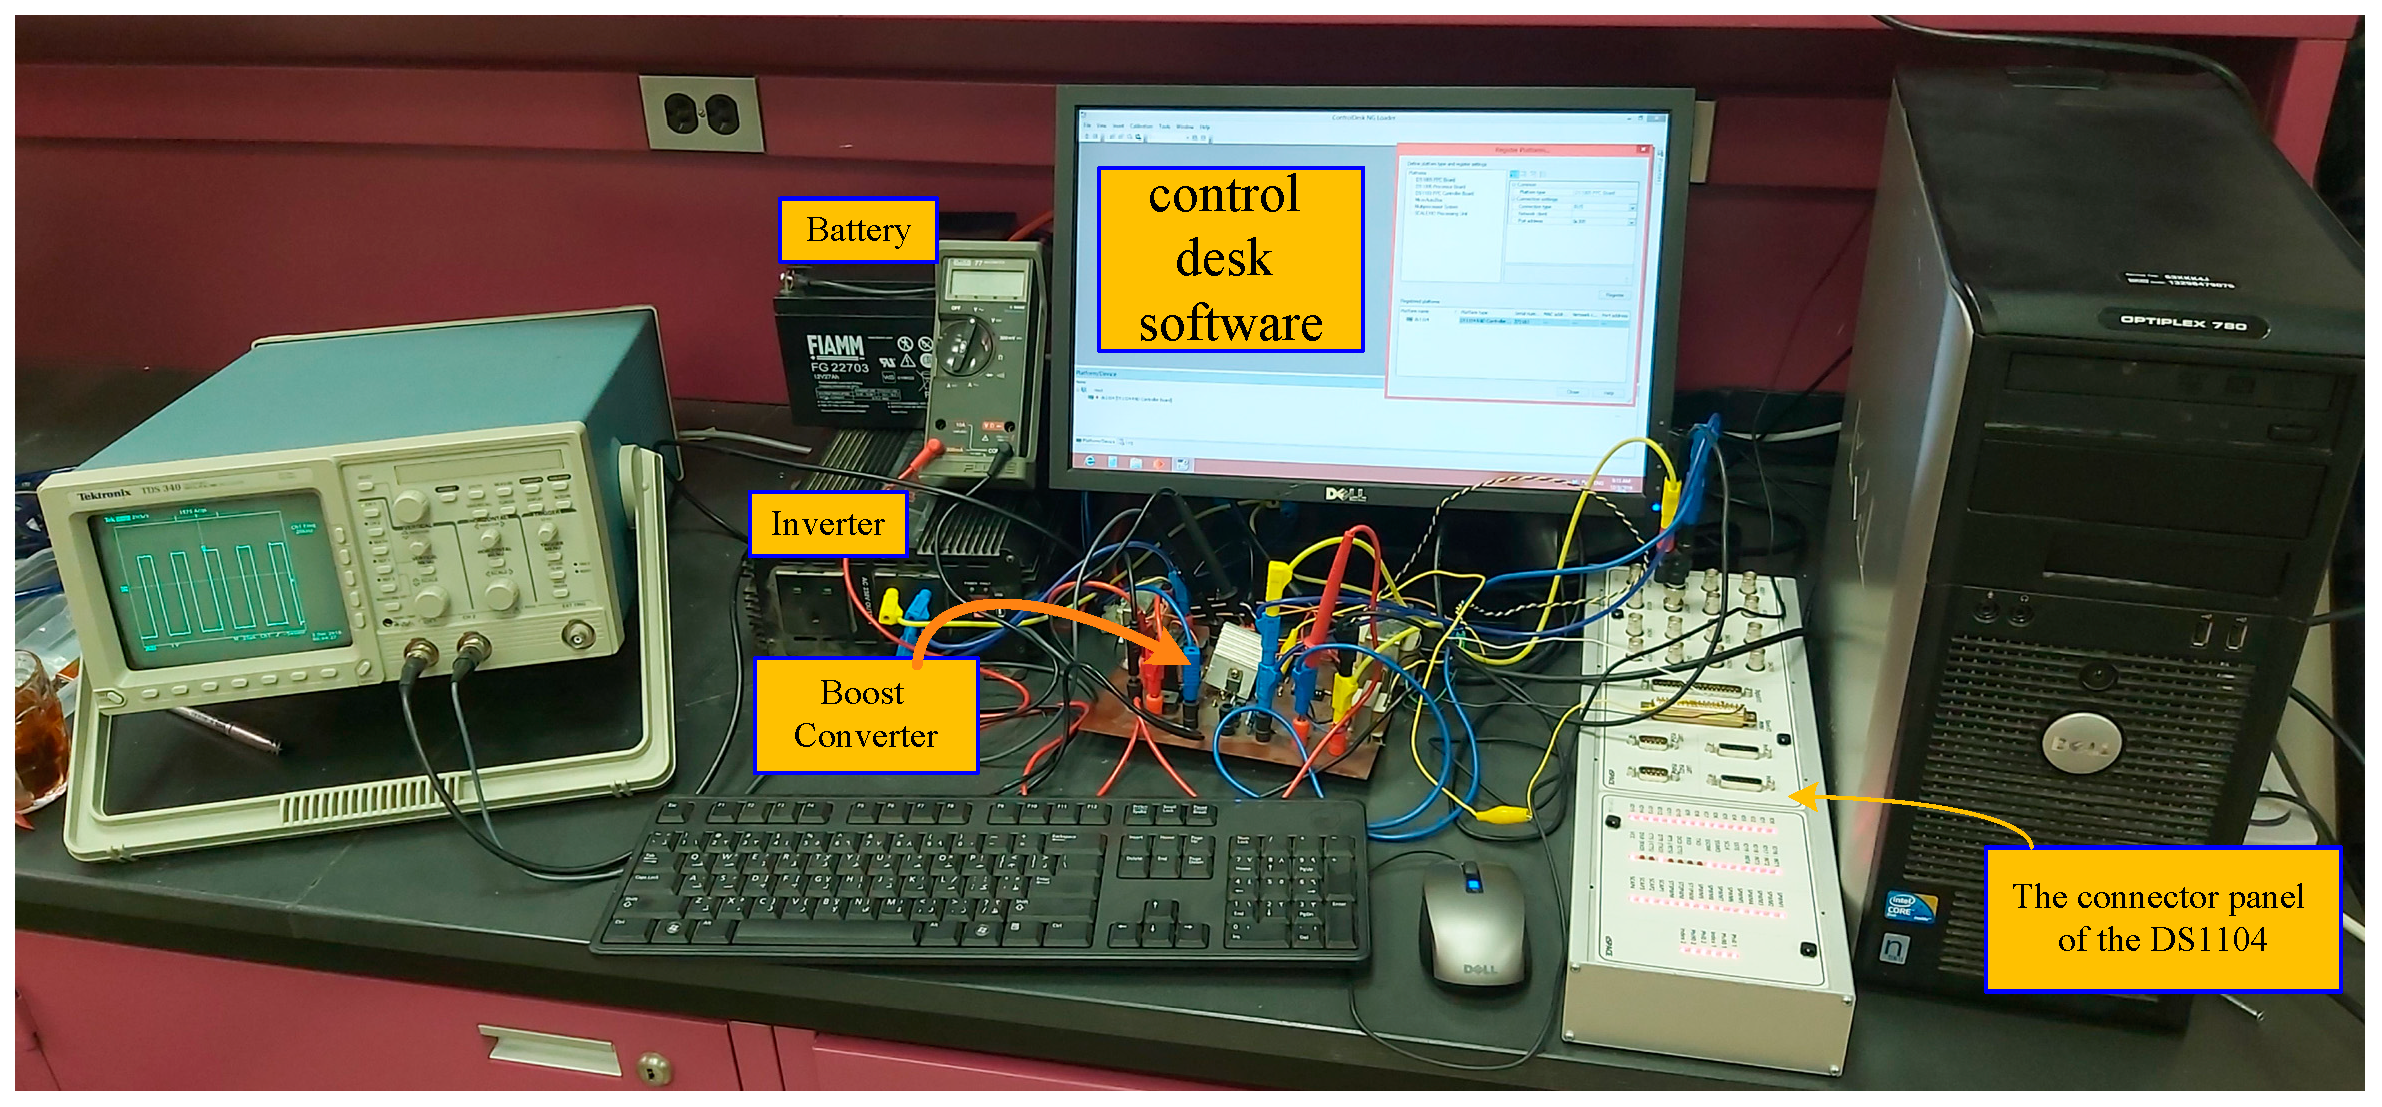
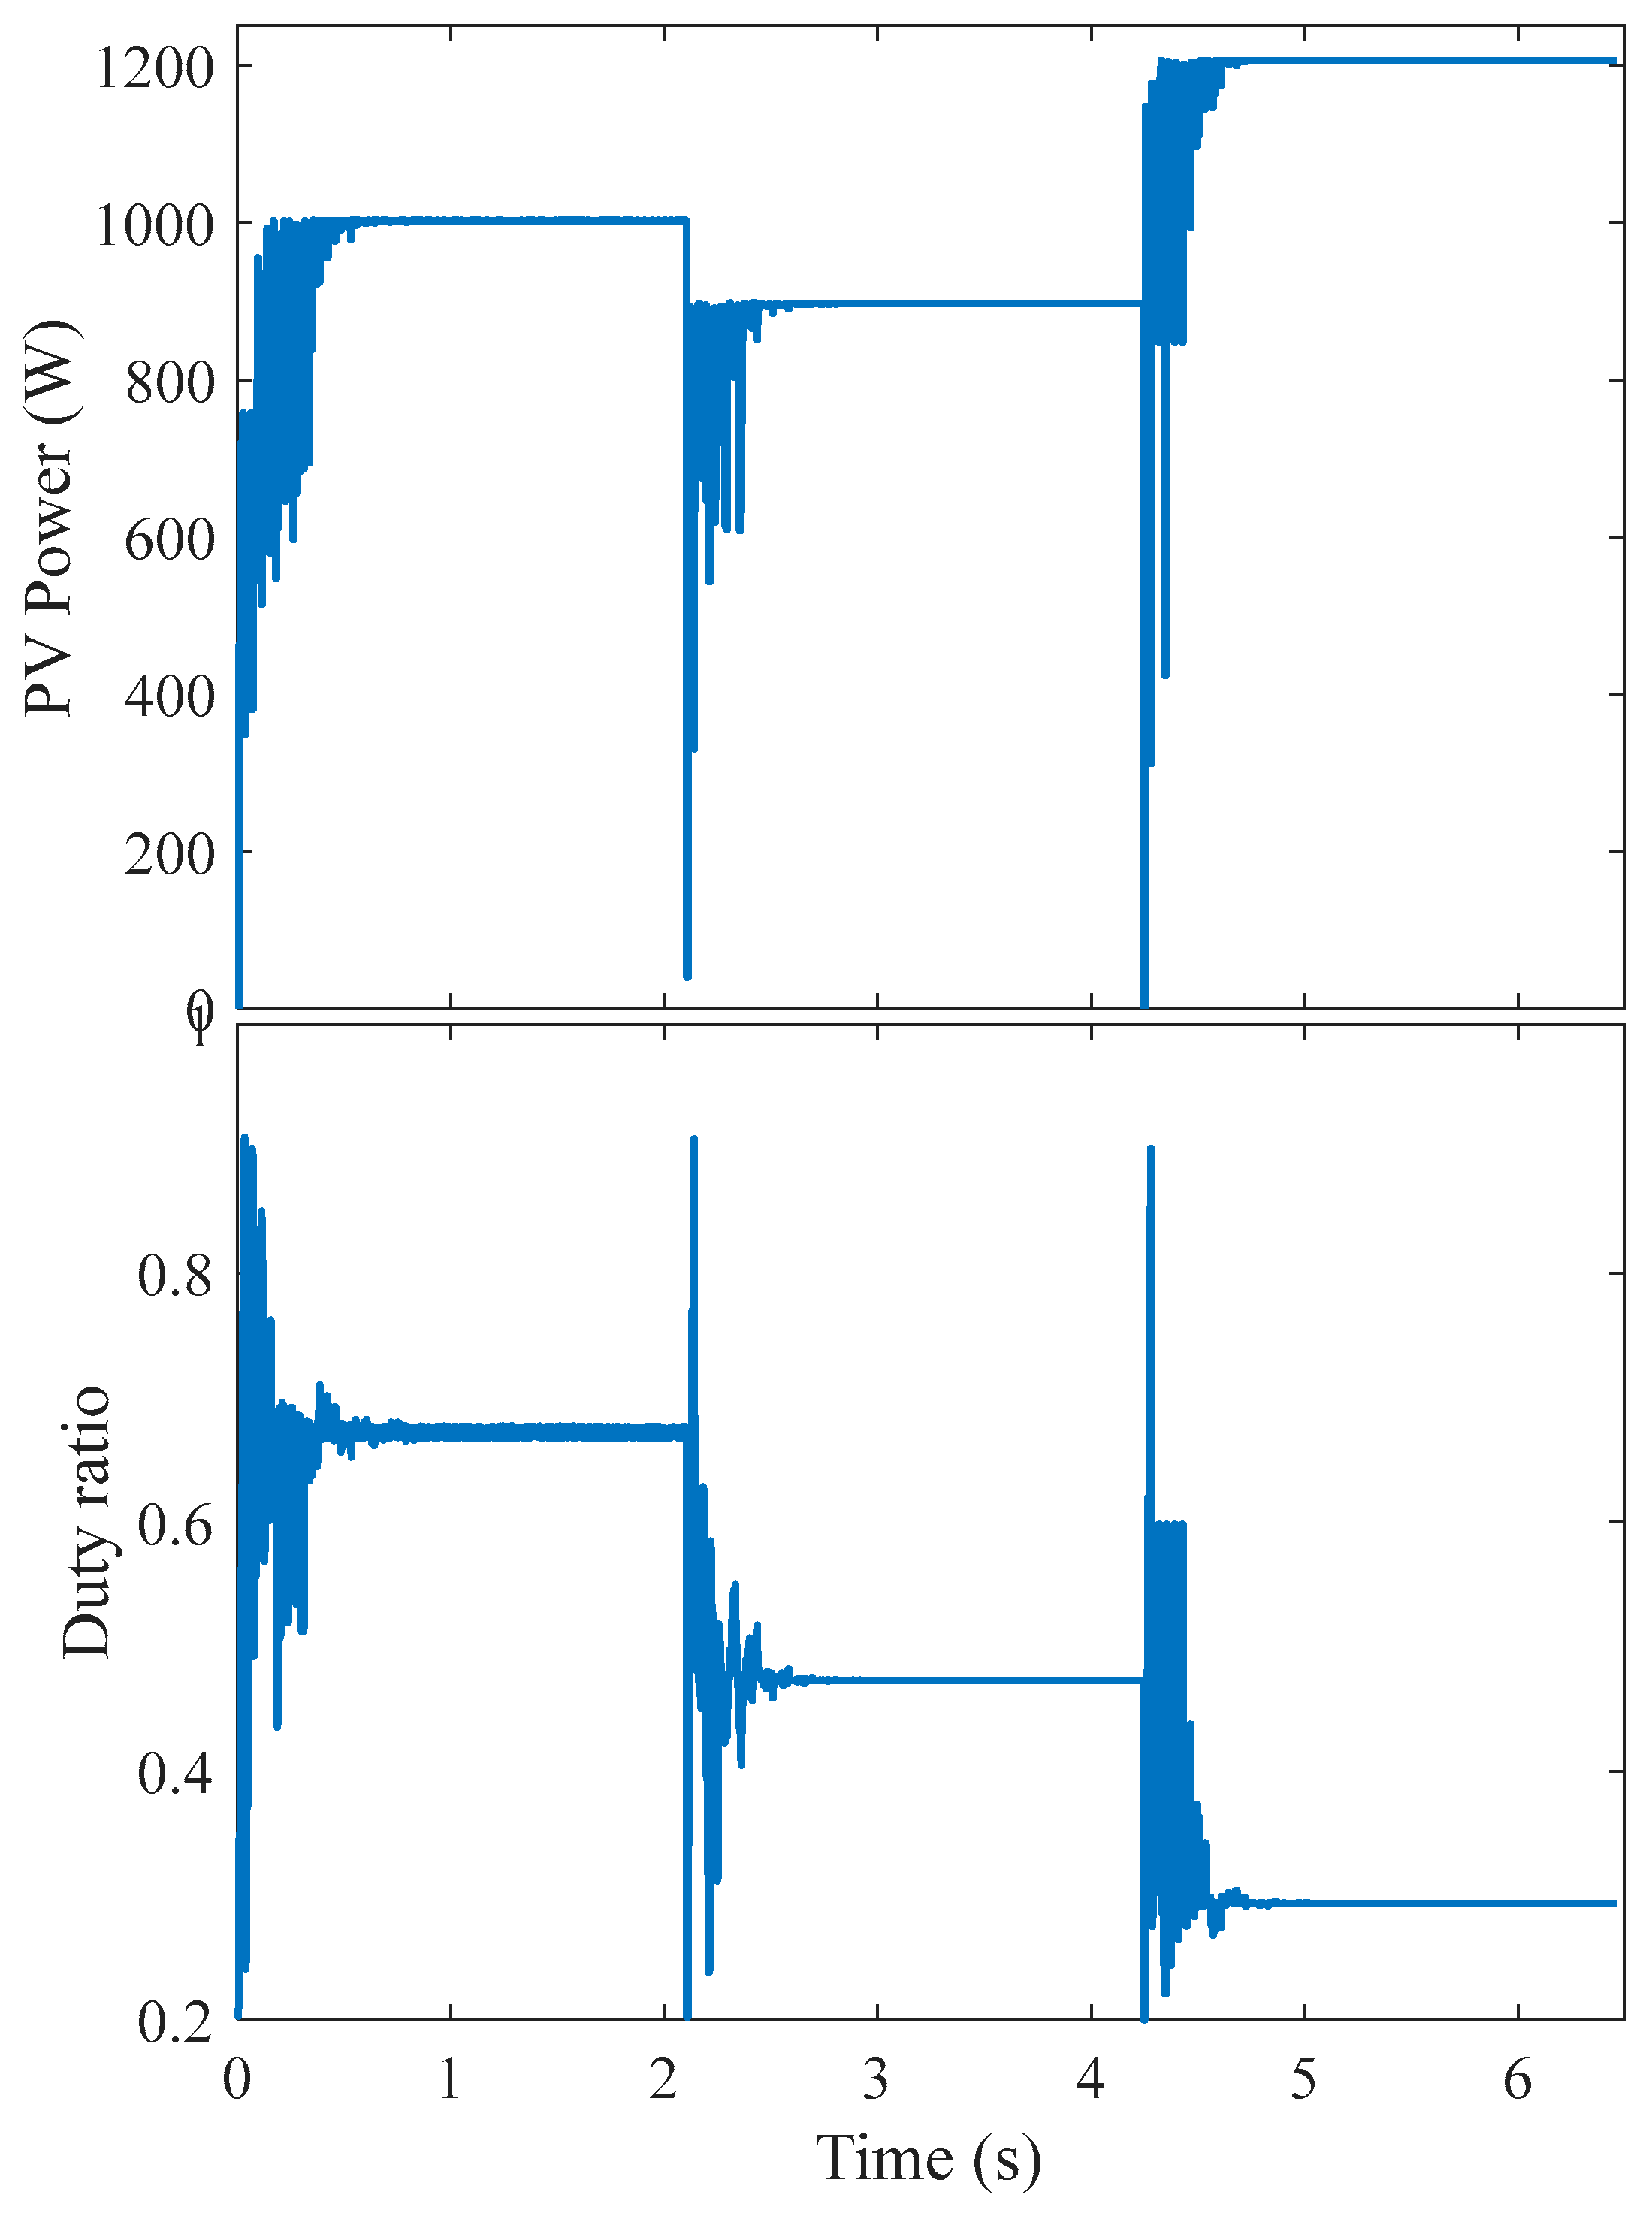
5. Experimental Work

To validate the simulation results, the identical configuration as described in the simulation study is used in the lab. The system is divided into three branches, each with four series modules. As illustrated in Figure 10, the radiation is regulated by an automatic, controllable light source. The PV system includes a boost converter with the same specifications as presented in the simulation study, as well as a three-phase inverter controlled by sliding mode control to keep the dc-link voltage constant at 220 V under various operating situations.
The dc–dc converter (boost converter) is controlled using different MPPT algorithms with a 20 kHz switching frequency and 0.01 s sampling time. The switching signal generated from Matlab/Simulink is interfaced with the boost converter through the dSPACE MicroLabBox. The waveforms are collected through Control Desk Graphical Interface (CDGI) software, as shown in Figure 10. Six search agents are used in all MOAs.
The hardware used for all MOAs used for MPPT of photovoltaic systems implemented in this study is the same for all these optimization algorithms. The only difference is in the code used for the tracking of the GP. The calculation time consumed in each iteration is measured from the time that the code received the corresponding power for all the duty ratios that were sent in the previous iteration until calculating the new duty ratios. This time is different from one study to another, and it should be lower than the sampling time (0.01 s). The calculation time consumed in each iteration is measured in Matlab code, where it was 0.14, 0.07, 0.11, and 0.13 ms for the DOA, MCA, PSO, and GWO algorithms, respectively. These calculation periods for each iteration reflect the complexity of the calculation burden for each optimization algorithm, where DOA is the most complex one and MCA is the simplest one. These calculation periods are substantially lower than the sampling rate (0.01 s), which means that they will not affect the normal operation of the MPPT using these optimization algorithms.
The experimental PV power and duty ratio results are displayed in Figure 11, Figure 12, Figure 13 and Figure 14 for the DOA, MCA, PSO, and GWO algorithms, respectively. These results (shown in Figure 11, Figure 12, Figure 13 and Figure 14) show that all of the MOAs employed in this investigation caught the GP for all shading patterns at varying times of convergence. Meanwhile, the times of convergence for DOA, MCA, PSO, and GWO are 0.4, 0.43, 1.2, and 0.9 s, respectively. The practical findings are quite close to the same values obtained from simulation, validating the improved performance of the DOA when utilized as an MPPT for PV systems compared to alternative optimization techniques used in this study.

6. Conclusions

The P-V properties of the PV array exhibit nonlinear relationships. In the event of uniform irradiance, this connection has just one peak, making traditional maximum power point tracker (MPPT) approaches suitable for tracking their maximum power. In the meantime, in the situation of non-uniform irradiance (partial shade), this relation has extra peaks, which may lead traditional MPPT approaches to become stuck at one of the local peaks. To address this issue, metaheuristic optimization algorithms (MOAs) are a better choice. The primary disadvantages of these algorithms are their long convergence times and sometimes high failure rates. As a result, a recently developed dandelion optimization algorithm (DOA) is employed to lower the time of convergence and failure rate of PV system MPPT. When compared to other MOAs such as MCA, PSO, and GWO, the DOA has the quickest time of convergence of 0.4 s compared to 1.2 s for PSO. Furthermore, using an identical distance between the search agents’ beginning positions significantly lowered the convergence time. Due to the cross-relationship between swarm size and time of convergence and failure rate, an optimal swarm size determination for all MOAs under consideration is provided, in which six search agents in the swarm are chosen. These superior findings demonstrated the DOA’s supremacy in MPPT of PV systems when compared to other optimization techniques.
The cost estimation for the MPPT used with different optimization algorithms is very important to be determined and compared for different algorithms. For this reason, it is recommended to obtain further work in the cost estimation of the MPPT for different sizes of PV systems as a future work of this study.

Author Contributions

Conceptualization, A.M.E.; Methodology, A.M.E.; Validation, A.M.E.; Formal analysis, Z.A.A. and M.A.A.; Investigation, Z.A.A. and M.A.A.; Writing—original draft, A.M.E.; Writing—review & editing, Z.A.A. and M.A.A.; Funding acquisition, Z.A.A. All authors have read and agreed to the published version of the manuscript.

Funding

This work was funded by the Sustainable Energy Technologies Center, King Saud University, Riyadh 11421, Saudi Arabia.

Data Availability Statement

Data available based on requist for corresponding author.

Acknowledgments

This work was supported by the Sustainable Energy Technologies Center, King Saud University, Riyadh 11421, Saudi Arabia.

Conflicts of Interest

The authors declare no conflict of interest.

References

  1. Hansen, K.; Breyer, C.; Lund, H. Status and perspectives on 100% renewable energy systems. Energy 2019, 175, 471–480. [Google Scholar] [CrossRef]
  2. PowerWeb, a Forecast International Inc. Renewable Energy. Available online: http://www.fi-powerweb.com/Renewable-Energy.html (accessed on 10 January 2023).
  3. Lavrik, A.; Zhukovskiy, Y.; Tcvetkov, P. Optimizing the size of autonomous hybrid microgrids with regard to load shifting. Energies 2021, 14, 5059. [Google Scholar] [CrossRef]
  4. Muna, Y.B.; Kuo, C.C. Feasibility and techno-economic analysis of electric vehicle charging of PV/Wind/Diesel/Battery hybrid energy system with different battery technology. Energies 2022, 15, 4364. [Google Scholar] [CrossRef]
  5. Eltamaly, A. Performance of MPPT techniques of photovoltaic systems under normal and partial shading conditions. In Advances in Renewable Energies and Power Technologies; Elsevier: Amsterdam, The Netherlands, 2018; pp. 115–161. [Google Scholar]
  6. Premkumar, M.; Subramaniam, U.; Babu, T.S.; Elavarasan, R.M.; Mihet-Popa, L. Evaluation of mathematical model to characterize the performance of conventional and hybrid PV array topologies under static and dynamic shading patterns. Energies 2020, 13, 3216. [Google Scholar] [CrossRef]
  7. Eltamaly, A. Modeling of fuzzy logic controller for photovoltaic maximum power point tracker. In Solar Future 2010 Conference; Yeditepe University: Istanbul, Turkey, 2010. [Google Scholar]
  8. Solis-Cisneros, H.; Sevilla-Camacho, P.; Robles-Ocampo, J.; Zuñiga-Reyes, M.; Rodríguez-Resendíz, J.; Muñiz-Soria, J.; Hernández-Gutiérrez, C. A dynamic reconfiguration method based on neuro-fuzzy control algorithm for partially shaded PV arrays. Sustain. Energy Technol. Assess. 2022, 52, 102147. [Google Scholar] [CrossRef]
  9. Eltamaly, S. A novel particle swarm optimization optimal control parameter determination strategy for maximum power point trackers of partially shaded photovoltaic systems. Eng. Optim. 2022, 54, 634–650. [Google Scholar] [CrossRef]
  10. Eltamaly, A.M.; Al-Saud, M.S.; Abokhalil, A.G. A Novel Bat Algorithm Strategy for Maximum Power Point Tracker of Photovoltaic Energy Systems Under Dynamic Partial Shading. IEEE Access 2020, 8, 10048–10060. [Google Scholar] [CrossRef]
  11. Mohanty, S.; Subudhi, B.; Ray, P.K. A New MPPT Design Using Grey Wolf Optimization Technique for Photovoltaic System Under Partial Shading Conditions. IEEE Trans. Sustain. Energy 2015, 7, 181–188. [Google Scholar] [CrossRef]
  12. Eltamaly, A.M. A novel musical chairs algorithm applied for MPPT of PV systems. Renew. Sustain. Energy Rev. 2021, 146, 111135. [Google Scholar] [CrossRef]
  13. Ishaque, K.; Salam, Z. A Deterministic Particle Swarm Optimization Maximum Power Point Tracker for Photovoltaic System under Partial Shading Condition. IEEE Trans. Ind. Electron. 2012, 60, 3195–3206. [Google Scholar] [CrossRef]
  14. Imtiaz, T.; Khan, B.H.; Khanam, N. Fast and improved PSO (FIPSO)-based deterministic and adaptive MPPT technique under partial shading conditions. IET Renew. Power Gener. 2020, 14, 3164–3171. [Google Scholar] [CrossRef]
  15. Merchaoui, M.; Sakly, A.; Mimouni, M. Improved fast particle swarm optimization based PV MPPT. In Proceedings of the 2018 9th International Renewable Energy Congress (IREC), Hammamet, Tunisia, 20–22 March 2018; pp. 1–7. [Google Scholar]
  16. Jordehi, A.R. Time varying acceleration coefficients particle swarm optimisation (TVACPSO): A new optimisation algorithm for estimating parameters of PV cells and modules. Energy Convers. Manag. 2016, 129, 262–274. [Google Scholar] [CrossRef]
  17. Shi, Y.; Eberhart, R. A modified particle swarm optimizer. In Proceedings of the 1998 IEEE International Conference on Evolutionary Computation Proceedings, IEEE World Congress on Computational Intelligence (Cat. No. 98TH8360), Anchorage, AK, USA, 4–9 May 1998; pp. 69–73. [Google Scholar]
  18. Jiao, B.; Lian, Z.; Gu, X. A dynamic inertia weight particle swarm optimization algorithm. Chaos Solitons Fractals 2008, 37, 698–705. [Google Scholar] [CrossRef]
  19. Koh, J.S.; Tan, R.H.; Lim, W.H.; Tan, N.M. A Modified Particle Swarm Optimization for Efficient Maximum Power Point Tracking under Partial Shading Condition. IEEE Trans. Sustain. Energy 2023, 14, 1822–1834. [Google Scholar] [CrossRef]
  20. Amoh Mensah, A.; Wei, X.; Otuo-Acheampong, D.; Mbuzi, T. Maximum power point tracking techniques using improved incremental conductance and particle swarm optimizer for solar power generation systems. Energy Harvest. Syst. 2023. [Google Scholar] [CrossRef]
  21. Chatterjee, A.; Siarry, P. Nonlinear inertia weight variation for dynamic adaptation in particle swarm optimization. Comput. Oper. Res. 2006, 33, 859–871. [Google Scholar] [CrossRef]
  22. Abdulkadir, M.; Yatim, A.H.M.; Yusuf, S.T. An Improved PSO-Based MPPT Control Strategy for Photovoltaic Systems. Int. J. Photoenergy 2014, 2014, 818232. [Google Scholar] [CrossRef] [Green Version]
  23. Sundareswaran, K.; Peddapati, S.; Palani, S. MPPT of PV Systems Under Partial Shaded Conditions Through a Colony of Flashing Fireflies. IEEE Trans. Energy Convers. 2014, 29, 463–472. [Google Scholar]
  24. Eltamaly, A.M. Optimal control parameters for bat algorithm in maximum power point tracker of photovoltaic energy systems. Int. Trans. Electr. Energy Syst. 2021, 31, e12839. [Google Scholar] [CrossRef]
  25. Liu, Y.-H.; Huang, S.-C.; Huang, J.-W.; Liang, W.-C. A Particle Swarm Optimization-Based Maximum Power Point Tracking Algorithm for PV Systems Operating Under Partially Shaded Conditions. IEEE Trans. Energy Convers. 2012, 27, 1027–1035. [Google Scholar] [CrossRef]
  26. Chaieb, H.; Sakly, A. Comparison between P&O and PSO methods based MPPT algorithm for photovoltaic systems. In Proceedings of the 2015 16th International Conference on Sciences and Techniques of Automatic Control and Computer Engineering (STA), Monastir, Tunisia, 21–23 December 2015; pp. 694–696. [Google Scholar]
  27. Sundareswaran, K.; Kumar, V.V.; Palani, S. Application of a combined particle swarm optimization and perturb and observe method for MPPT in PV systems under partial shading conditions. Renew. Energy 2015, 75, 308–317. [Google Scholar] [CrossRef]
  28. Eltamaly, A.M. An Improved Cuckoo Search Algorithm for Maximum Power Point Tracking of Photovoltaic Systems under Partial Shading Conditions. Energies 2021, 14, 953. [Google Scholar] [CrossRef]
  29. da Rocha, M.; Sampaio, L.; da Silva, S. Comparative analysis of MPPT algorithms based on Bat algorithm for PV systems under partial shading condition. Sustain. Energy Technol. Assess. 2020, 40, 100761. [Google Scholar] [CrossRef]
  30. Mohanty, S.; Subudhi, B.; Ray, P.K. A Grey Wolf-Assisted Perturb & Observe MPPT Algorithm for a PV System. IEEE Trans. Energy Convers. 2017, 32, 340–347. [Google Scholar]
  31. Ahmed, C.; Mohammed V University in Rabat; Cherkaoui, M.; Mokhlis, M. PSO-SMC Controller Based GMPPT Technique for Photovoltaic Panel Under Partial Shading Effect. Int. J. Intell. Eng. Syst. 2020, 13, 307–316. [Google Scholar] [CrossRef]
  32. Kamal, N.A.; Azar, A.T.; Elbasuony, G.S.; Almustafa, K.M.; Almakhles, D. PSO-based adaptive perturb and observe MPPT technique for photovoltaic systems. In International Conference on Advanced Intelligent Systems and Informatics; Springer: Cham, Switzerland, 2019. [Google Scholar]
  33. Chtita, S.; Motahhir, S.; El Hammoumi, A.; Chouder, A.; Benyoucef, A.S.; El Ghzizal, A.; Derouich, A.; Abouhawwash, M.; Askar, S.S. A novel hybrid GWO–PSO-based maximum power point tracking for photovoltaic systems operating under partial shading conditions. Sci. Rep. 2022, 12, 10637. [Google Scholar] [CrossRef]
  34. Davoodkhani, F.; Nowdeh, S.A.; Abdelaziz, A.Y.; Mansoori, S.; Nasri, S.; Alijani, M. A new hybrid method based on gray wolf optimizer-crow search algorithm for maximum power point tracking of photovoltaic energy system. In Modern Maximum Power Point Tracking Techniques for Photovoltaic Energy Systems; Springer: Berlin/Heidelberg, Germany, 2020. [Google Scholar]
  35. Seyedmahmoudian, M.; Rahmani, R.; Mekhilef, S.; Oo, A.M.T.; Stojcevski, A.; Soon, T.K.; Ghandhari, A.S. Simulation and Hardware Implementation of New Maximum Power Point Tracking Technique for Partially Shaded PV System Using Hybrid DEPSO Method. IEEE Trans. Sustain. Energy 2015, 6, 850–862. [Google Scholar] [CrossRef]
  36. Eltamaly, A.M. Photovoltaic Maximum Power Point Trackers: An Overview. In Advanced Technologies for Solar Photovoltaics Energy Systems. Green Energy and Technology; Motahhir, S., Eltamaly, A.M., Eds.; Springer: Cham, Switzerland, 2021; pp. 117–200. [Google Scholar] [CrossRef]
  37. Furtado, A.M.S.; Bradaschia, F.; Cavalcanti, M.C.; Limongi, L.R. A Reduced Voltage Range Global Maximum Power Point Tracking Algorithm for Photovoltaic Systems Under Partial Shading Conditions. IEEE Trans. Ind. Electron. 2018, 65, 3252–3262. [Google Scholar] [CrossRef]
  38. Xu, S.; Gao, Y.; Zhou, G.; Mao, G. A Global Maximum Power Point Tracking Algorithm for Photovoltaic Systems Under Partially Shaded Conditions Using Modified Maximum Power Trapezium Method. IEEE Trans. Ind. Electron. 2020, 68, 370–380. [Google Scholar] [CrossRef]
  39. Kermadi, M.; Salam, Z.; Ahmed, J.; Berkouk, E.M. A High-Performance Global Maximum Power Point Tracker of PV System for Rapidly Changing Partial Shading Conditions. IEEE Trans. Ind. Electron. 2020, 68, 2236–2245. [Google Scholar] [CrossRef]
  40. Boztepe, M.; Guinjoan, F.; Velasco-Quesada, G.; Silvestre, S.; Chouder, A.; Karatepe, E. Global MPPT Scheme for Photovoltaic String Inverters Based on Restricted Voltage Window Search Algorithm. IEEE Trans. Ind. Electron. 2013, 61, 3302–3312. [Google Scholar] [CrossRef]
  41. Kermadi, M.; Salam, Z.; Ahmed, J.; Berkouk, E.M. An Effective Hybrid Maximum Power Point Tracker of Photovoltaic Arrays for Complex Partial Shading Conditions. IEEE Trans. Ind. Electron. 2019, 66, 6990–7000. [Google Scholar] [CrossRef]
  42. Kermadi, M.; Salam, Z.; Eltamaly, A.M.; Ahmed, J.; Mekhilef, S.; Larbes, C.; Berkouk, E.M. Recent developments of MPPT techniques for PV systems under partial shading conditions: A critical review and performance evaluation. IET Renew. Power Gener. 2020, 14, 3401–3417. [Google Scholar] [CrossRef]
  43. Eltamaly, A.M.; Al-Saud, M.; Abokhalil, A.G. A novel scanning bat algorithm strategy for maximum power point tracker of partially shaded photovoltaic energy systems. Ain Shams Eng. J. 2020, 11, 1093–1103. [Google Scholar] [CrossRef]
  44. Ahmed, J.; Salam, Z. A Maximum Power Point Tracking (MPPT) for PV system using Cuckoo Search with partial shading capability. Appl. Energy 2014, 119, 118–130. [Google Scholar] [CrossRef]
  45. Eltamaly, A.M.; Farh, H.M.H.; Al Saud, M.S. Impact of PSO Reinitialization on the Accuracy of Dynamic Global Maximum Power Detection of Variant Partially Shaded PV Systems. Sustainability 2019, 11, 2091. [Google Scholar] [CrossRef] [Green Version]
  46. Cortés, B.; Tapia, R.; Flores, J.J. System-Independent Irradiance Sensorless ANN-Based MPPT for Photovoltaic Systems in Electric Vehicles. Energies 2021, 14, 4820. [Google Scholar] [CrossRef]
  47. Eltamaly, A.M.; Al-Saud, M.S.; Abo-Khalil, A.G. Performance Improvement of PV Systems’ Maximum Power Point Tracker Based on a Scanning PSO Particle Strategy. Sustainability 2020, 12, 1185. [Google Scholar] [CrossRef] [Green Version]
  48. Sevilla-Camacho, P.-Y.; Zuniga-Reyes, M.-A.; Robles-Ocampo, J.-B.; Castillo-Palomera, R.; Muniz, J.; Rodriguez-Resendiz, J. A Novel Fault Detection and Location Method for PV Arrays Based on Frequency Analysis. IEEE Access 2019, 7, 72050–72061. [Google Scholar] [CrossRef]
  49. Li, X.-G.; Han, S.-F.; Zhao, L.; Gong, C.-Q.; Liu, X.-J. New Dandelion Algorithm Optimizes Extreme Learning Machine for Biomedical Classification Problems. Comput. Intell. Neurosci. 2017, 2017, 4523754. [Google Scholar] [CrossRef] [Green Version]
  50. Eltamaly, A.M. Performance of smart maximum power point tracker under partial shading conditions of photovoltaic systems. J. Renew. Sustain. Energy 2015, 7, 043141. [Google Scholar] [CrossRef]
  51. Cotfas, D.; Cotfas, P.; Kaplanis, S. Methods to determine the dc parameters of solar cells: A critical review. Renew. Sustain. Energy Rev. 2013, 28, 588–596. [Google Scholar] [CrossRef]
  52. Khanna, V.; Das, B.; Bisht, D.; Vandana; Singh, P. A three diode model for industrial solar cells and estimation of solar cell parameters using PSO algorithm. Renew. Energy 2015, 78, 105–113. [Google Scholar] [CrossRef]
  53. Eltamaly, A.M. Musical chairs algorithm for parameters estimation of PV cells. Sol. Energy 2022, 241, 601–620. [Google Scholar] [CrossRef]
  54. Gong, C.; Han, S.; Li, X.; Zhao, L.; Liu, X. A new dandelion algorithm and optimization for extreme learning machine. J. Exp. Theor. Artif. Intell. 2018, 30, 39–52. [Google Scholar] [CrossRef]
  55. Liu, X.; Qin, X. A probability-based core dandelion guided dandelion algorithm and application to traffic flow prediction. Eng. Appl. Artif. Intell. 2020, 96, 103922. [Google Scholar] [CrossRef]
  56. Abbassi, R.; Saidi, S.; Abbassi, A.; Jerbi, H.; Kchaou, M.; Alhasnawi, B.N. Accurate Key Parameters Estimation of PEMFCs’ Models Based on Dandelion Optimization Algorithm. Mathematics 2023, 11, 1298. [Google Scholar] [CrossRef]
  57. Zhao, S.; Zhang, T.; Ma, S.; Chen, M. Dandelion Optimizer: A nature-inspired metaheuristic algorithm for engineering applications. Eng. Appl. Artif. Intell. 2022, 114, 105075. [Google Scholar] [CrossRef]
  58. Alharbi, M.; Ragab, M.; AboRas, K.M.; Kotb, H.; Dashtdar, M.; Shouran, M.; Elgamli, E. Innovative AVR-LFC Design for a Multi-Area Power System Using Hybrid Fractional-Order PI and PIDD2 Controllers Based on Dandelion Optimizer. Mathematics 2023, 11, 1387. [Google Scholar] [CrossRef]
  59. Ali, M.H.; Soliman, A.M.A.; Ahmed, M.F.; Adel, A.H. Optimization of Reactive Power Dispatch Considering DG Units Uncertainty By Dandelion Optimizer Algorithm. Int. J. Renew. Energy Res. IJRER 2022, 12, 1805–1818. [Google Scholar]
  60. Zhu, H.; Liu, G.; Zhou, M.; Xie, Y.; Abusorrah, A.; Kang, Q. Optimizing Weighted Extreme Learning Machines for imbalanced classification and application to credit card fraud detection. Neurocomputing 2020, 407, 50–62. [Google Scholar] [CrossRef]
  61. Zamuda, A.; Brest, J.; Mezura-Montes, E. Structured Population Size Reduction Differential Evolution with Multiple Mutation Strategies on CEC 2013 Real Parameter Optimization. In Proceedings of the IEEE Congress on Evolutionary Computation, Cancun, Mexico, 20–23 June 2013; pp. 1925–1931. [Google Scholar]
  62. Eltamaly, A.M.; Rabie, A.H. A Novel Musical Chairs Optimization Algorithm. Arab. J. Sci. Eng. 2023. [Google Scholar] [CrossRef]
  63. Brest, J.; Maučec, M.S. Population size reduction for the differential evolution algorithm. Appl. Intell. 2008, 29, 228–247. [Google Scholar] [CrossRef]
  64. Noman, N.; Iba, H. Accelerating Differential Evolution Using an Adaptive Local Search. IEEE Trans. Evol. Comput. 2008, 12, 107–125. [Google Scholar] [CrossRef]
  65. Neri, F.; Tirronen, V. Scale factor local search in differential evolution. Memetic Comput. 2009, 1, 153–171. [Google Scholar] [CrossRef]
  66. Neri, F.; Iacca, G.; Mininno, E. Disturbed Exploitation compact Differential Evolution for limited memory optimization problems. Inf. Sci. 2011, 181, 2469–2487. [Google Scholar] [CrossRef]
  67. Caraffini, F.; Iacca, G.; Neri, F.; Picinali, L.; Mininno, E. A CMA-ES super-fit scheme for the re-sampled inheritance search. In Proceedings of the 2013 IEEE Congress on Evolutionary Computation, Cancun, Mexico, 20–23 June 2013; pp. 1123–1130. [Google Scholar]
  68. Das, S.K.; Verma, D.; Nema, S.; Nema, R.K. Shading mitigation techniques: State-of-the-art in photovoltaic applications. Renew. Sustain. Energy Rev. 2017, 78, 369–390. [Google Scholar] [CrossRef]
  69. Amara, K.; Bakir, T.; Malek, A.; Hocine, D.; Bourennane, E.B.; Fekik, A.; Zaouia, M. An optimized steepest gradient based maximum power point tracking for PV control systems. Int. J. Electr. Eng. Inform. 2019, 11, 662–683. [Google Scholar] [CrossRef]
  70. Eltamaly, A.M. A novel strategy for optimal PSO control parameters determination for PV energy systems. Sustainability 2021, 13, 1008. [Google Scholar] [CrossRef]
  71. Estévez-Bén, A.A.; Alvarez-Diazcomas, A.; Rodriguez-Resendiz, J. Transformerless Multilevel Voltage-Source Inverter Topology Comparative Study for PV Systems. Energies 2020, 13, 3261. [Google Scholar] [CrossRef]
  72. Lopez, H.; Resendiz, J.R.; Guo, X.; Vazquez, N.; Carrillo-Serrano, R.V. Transformerless Common-Mode Current-Source Inverter Grid-Connected for PV Applications. IEEE Access 2018, 6, 62944–62953. [Google Scholar] [CrossRef]
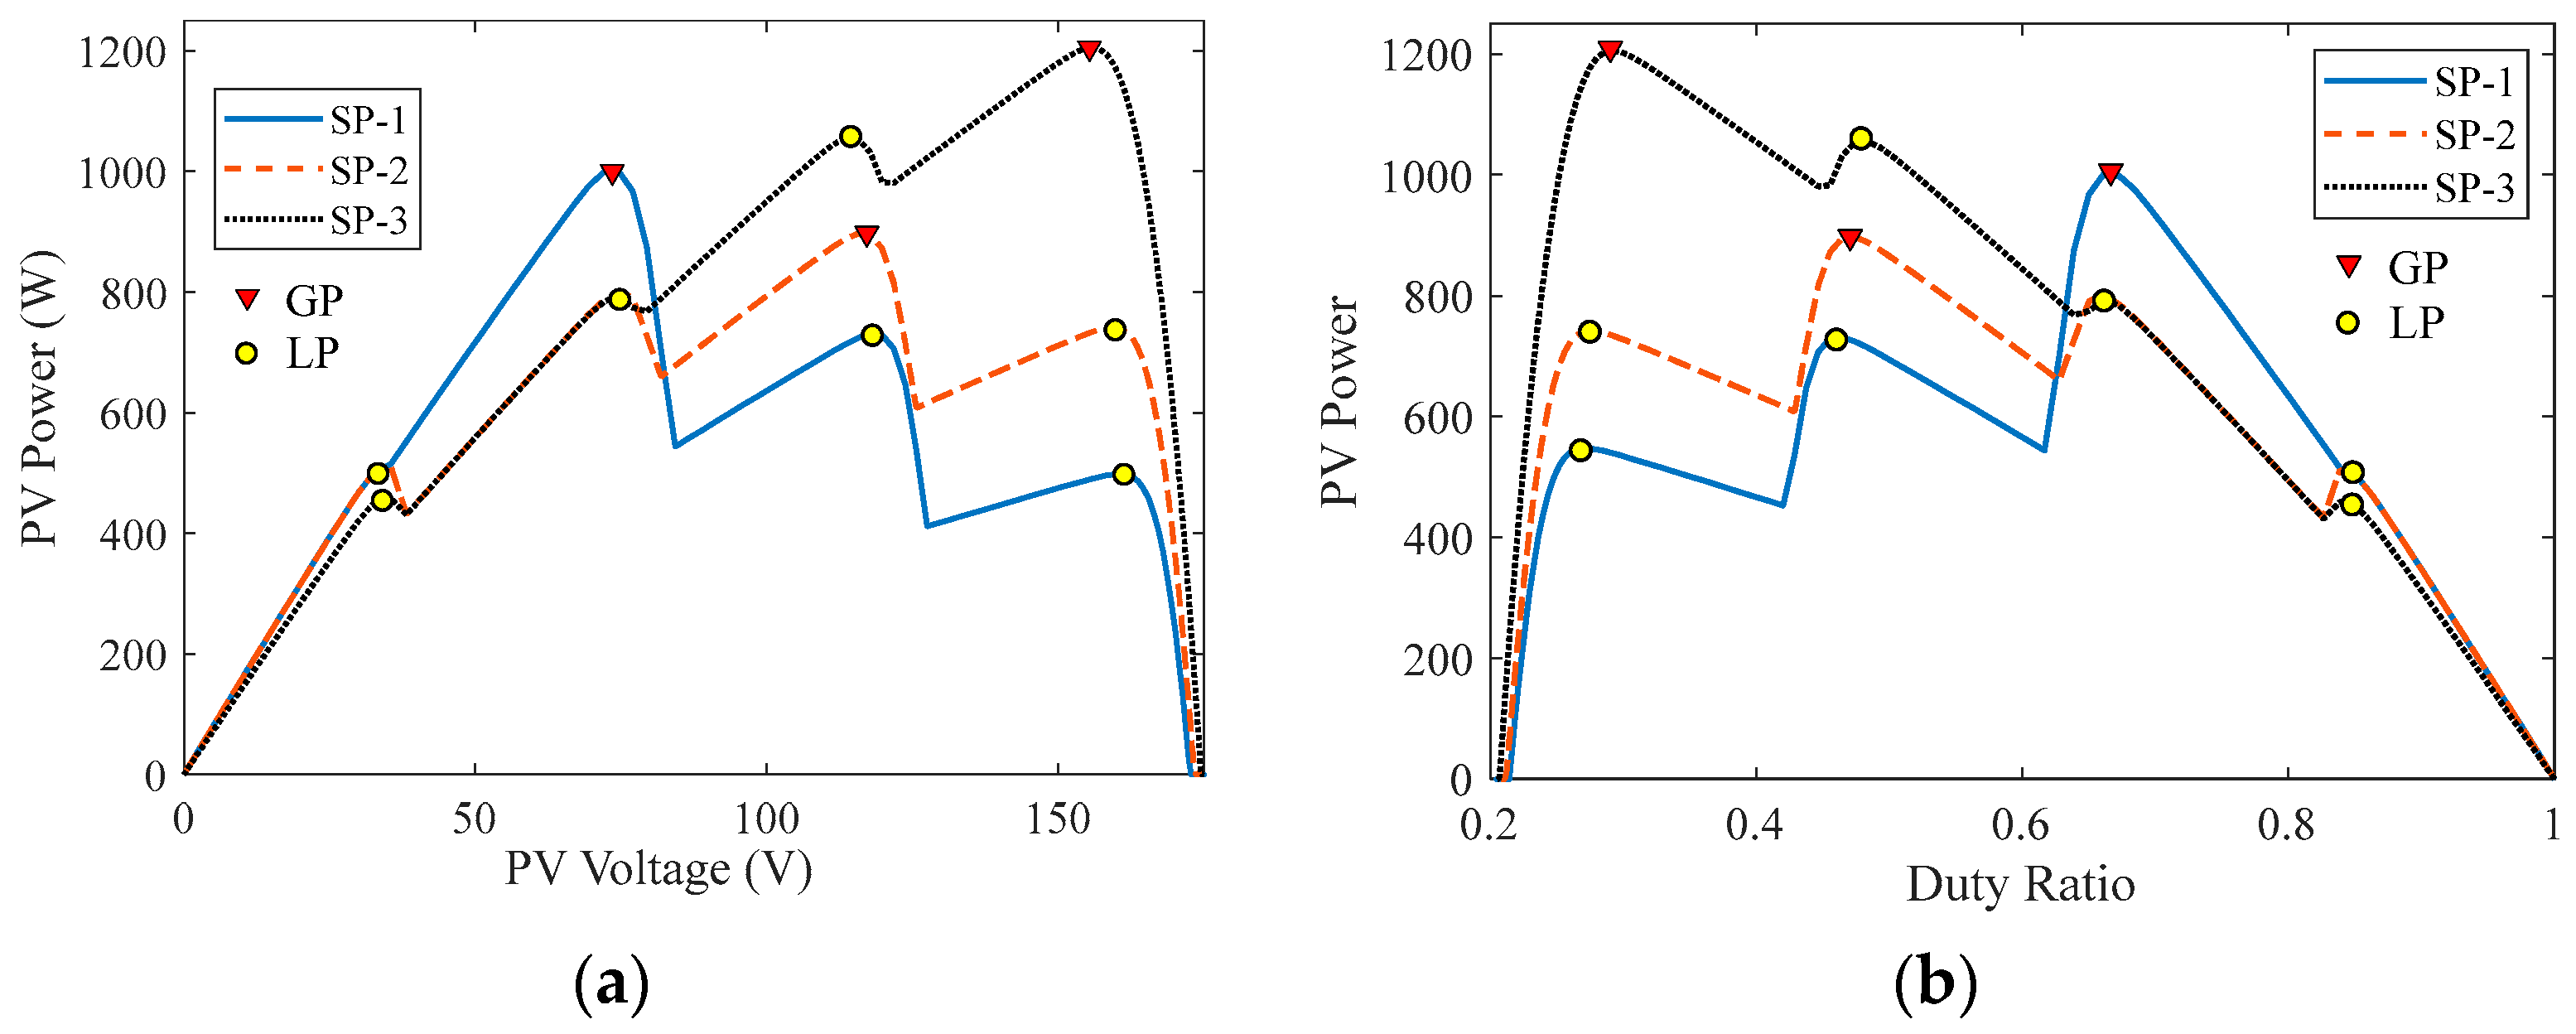
Figure 1. Grid-connected PV energy system with MPPT.
Energies 16 05228 g001
Figure 2. Schematic of the single diode model of the photovoltaic cell.
Energies 16 05228 g002
Figure 3. The framework for the use of the DOA as an MPPT for PV systems.
Energies 16 05228 g003
Figure 4. Specification of the photovoltaic module used in this study.
Energies 16 05228 g004
Figure 5. The operating performance of the photovoltaic system under study. (a) P-V Characteristics; (b) P-d Characteristics.
Energies 16 05228 g005
Figure 6. The simulation results of DOA MPPT for different PSCs.
Energies 16 05228 g006
Figure 7. The simulation results of MCA MPPT for different PSCs.
Energies 16 05228 g007
Figure 8. The simulation results of PSO MPPT for different PSCs.
Energies 16 05228 g008
Figure 9. The simulation results of GWO MPPT for different PSCs.
Energies 16 05228 g009
Figure 10. The experimental prototype.
Energies 16 05228 g010aEnergies 16 05228 g010b
Figure 11. The experimental results of DOA MPPT for various PSCs.
Energies 16 05228 g011
Figure 12. The experimental results of MCA MPPT for various PSCs.
Energies 16 05228 g012
Figure 13. The experimental results of PSO MPPT for various PSCs.
Energies 16 05228 g013
Figure 14. The experimental results of GWO MPPT for various PSCs.
Energies 16 05228 g014
Table 1. The specifications of the shading patterns under study.
NameSolar Irradiances (W/m2)GP Parameters
G1G2G3G4dV (V)P (W)
SP-110009004002000.661374.511401001.4
SP-210007005003000.4740115.7296897.32
SP-39007006005000.2912155.92611205.8
Table 2. The control parameters used with these metaheuristic algorithms are shown.
MPPTControl Paramters
MCA [12]Pa = 0.25, β = 1.5, α = 0.8
PSO [9]ω = 0.7298, cl = 1.4962, cg = 1.49618
GWO [11]A = 2→0, r1 = r2 = random [0, 1]
DOA [60]β = 1.5, ω = 1.0
Table 3. Comparison between each initialization strategy used with the DOA.
Initialization StrategyConvergence Time (s)Failure Rate (%)
Random Duty Ratio0.492
Equal Distance0.410
Anticipated Position of the Peaks0.400
Table 4. The performance of each MOA under study for different swarm sizes.
Swarm SizeConvergence Time (s)Failure Rate (%)
DOAMCAPSOGWODOAMCAPSOGWO
30.350.380.680.496.58.111.78.8
40.390.400.820.613.34.55.84.5
50.400.411.070.781.12.13.52.2
60.410.431.250.920000
70.480.511.361.060000
80.570.571.441.150000
90.620.611.521.210000
100.650.621.581.290000
Disclaimer/Publisher’s Note: The statements, opinions and data contained in all publications are solely those of the individual author(s) and contributor(s) and not of MDPI and/or the editor(s). MDPI and/or the editor(s) disclaim responsibility for any injury to people or property resulting from any ideas, methods, instructions or products referred to in the content.

