Abstract
The increasing penetration of wind energy in electric power systems leads to a great demand for flexible resources to regulate power fluctuations. This paper focuses on investigating the impacts of the operational flexibility of hydropower generation systems on reducing wind curtailment and load shedding in a hybrid hydro–wind power system. Considering timescale variabilities of wind power, the upward and downward regulation capabilities of hydro flexibility under sub-hour and hour dispatch scales are estimated. Based on developed flexible indicators, the ultimate access ratio of wind power penetration into the power system is obtained by using the estimated probability of insufficient regulation reserves. All these analyses are carried out under the wet and dry periods to better understand their differences with the hydro flexibility. The method and obtained results provide important guidance for the stable and high-efficiency operation of hybrid power systems.
1. Introduction
With the increasing amount of variable renewable power systems being installed and more planned around the world, the integration of multiple renewable energy resources becomes an effective way to cope with energy shortage and environmental pollution [1]. The current challenge for these hybrid power systems is the unbalance between power generation and consumption [2]. This challenge can be tackled by the sufficient supply of flexible resources in the hybrid power system [3]. Generally, such flexible resources include hydropower plants and thermal power plants [4]. Regarding the concept of flexibility in power systems, its common definition is a response capability of flexible resources to cope with the unbalance between the generator side and the load side [5]. The flexibility assessment achieves the goal of reducing energy curtailment and improving power reliability.
The flexibility resources of the hybrid power system have the following basic characteristics [6,7]. (a) Flexibility is an inherent characteristic of energy systems, which can keep the fluctuation of the power supply in the grid tolerance. (b) The flexibility has a directional nature, which is represented by the upward and downward regulation flexibilities. Load-shedding events occur if the upregulation flexibility is insufficient, while power curtailments are triggered if the downregulation flexibility is insufficient. (c) Intermittent energy resources are easily affected by atmospheric processes, which results in the varying frequency and amplitude of the active power at multi-time scales. (d) Uncertainties between power supply and demand bring the probabilistic nature of grid flexibility. The flexibility assessment is better to be put into the framework of probability theories.
Hydropower generation is a promising option to become a flexible resource due to the great flexibility in ramping and rapidly responding to power variations in hybrid power systems [8]. In actual operation, hydro flexibility is an indispensable key link in the realization of flexible scheduling of hybrid power systems. Some studies have been presented to achieve the scheduling of hybrid power systems by improving hydro flexibility. For instance, Avila et al. (2021) optimized the medium-term scheduling of the hydro–wind power system by improving hydro flexibility [9]. Han et al. (2022) studied the day-ahead scheduling of the hydro–wind power system by coordinating power regulation and frequency response flexibility [10]. Farahmand et al. (2015) used Nordic hydropower flexibility and transmission expansion to support the scheduling of North European hydro-wind power system [11]. Xu et al. (2021) developed the optimal hourly scheduling of the hydro–wind power system by considering the regulation capability of the reservoir storage capacity [12]. In view of the importance of hydro flexibility in the scheduling of hybrid power systems, some studies have been presented to understand and estimate hydro flexibility. These studies are divided into the following three categories. (a) Presenting the definition of hydro flexibility and summarizing its status and challenges. (b) Establishing some new approaches to estimate hydro flexibility. (c) Assessing the benefits of hydro flexibility in hybrid power systems. Beevers et al. (2015) and Chamberland-Lauzon et al. (2019) examined the impacts of the hydro design and the technology of power prediction on the operational flexibility of hydro resources [13,14]. Hernando et al. (2016) formed a research and development task to emphasize the definitions and challenges of hydro flexibilities [15]. Vasil’ev et al. (2019) investigated the dynamic characteristic of hydro flexibilities in an integrated power system [16]. The above studies successfully developed the direction of hydro flexibilities in future renewable energy industries. However, such various definitions need to be synthesized, and the corresponding challenges also require some detailed technologies to verify their applications. Considering this shortage, Naghdalian et al. (2020) presented a method of stochastic network-constrained unit commitment to determine the flexible ramp reserve to handle the uncertainties between power supply and demand [17]. Kristiansen et al. (2018) established a generic framework for assessing the hydro flexibility of the hybrid power system [18]. Min et al. (2017) applied the method of hydro flexible reserve scheduling to the hybrid power system [19]. To some extent, these approaches fill the gap in flexible technologies; however, the corresponding results lack the descriptions associated with probabilities and timescale variabilities. Based on the statistical or probabilistic method, Karhinen et al. (2019) investigated the private and social benefits of hydro flexibilities with increasing amounts of wind power [20]. Chen et al. (2016) focused on the hydro benefits of the distributed robust power system [21]. Hirth et al. (2016) studied the benefits of hydro flexibility in regulating variable wind energy [22]. All these studies found that hydropower is facilitated with a more flexible fleet of the hybrid power system, but the corresponding methods and findings still lack the impacts of the timescale variability on suppressing the intermittent wind energy.
Based on the above analyses, it is safe to conclude that the studies of hydro flexibilities pertained to the inherent, directional, and probabilistic natures, but the nature of timescale variability is neglected. In fact, the combination of different timescale variabilities provides the adequacy of power systems for reasonable load scheduling, which is defined as the existence of the generating capacity to meet the frequency regulation and peak-load regulation while accounting for the variability between generation and consumption. Identifying this advantage, some famous organizations, such as California’s Integration of Renewable Resources and New England Wind Integration, are studying this field. Several outcomes in the early stage regarding the flexibility of multi-time scales have been obtained. For instance, Mirzaei et al. (2018) studied the stochastic day-ahead scheduling of the hydro–wind power system considering hourly flexible ramp capabilities [23]. Heydarian-Forushani et al. (2018) determined an optimal operation of flexible resources based on sub-hourly flexible ramp capabilities [24]. These studies propose the author’s own preliminary opinions due to the limitations of the simple model and theory, and thus there is still a long way ahead for the energy stakeholders.
Based on the above considerations, The research objective of this paper is to accurately estimate hydro flexibility in the hybrid hydro–wind power system under different seasonal periods and proportions of wind power from the viewpoint of timescale variabilities. To eliminate the decision-making bias from the dispatch of flexible reserves, this study develops flexible indicators, including the insufficient downregulation reserve probability (IDRP), the insufficient upregulation reserve probability (IURP), the insufficient downregulation reserve (IDR), and the insufficient upregulation reserve (IUR), to evaluate the hydro ramp capability at any time in 24 h. The constraints of the generator ramp, flexible reserve capacity, and load characteristics are considered in the establishment of flexible indicators. The insufficient upward and downward regulation reserves of hydro resources under different dispatch time scales are obtained to optimize the output power of the hydro generating unit that participates in regulation. Hydro flexibility is considerably influenced by different proportions of wind power in the hybrid power system. For this reason, the relationship between the hydro flexibility and the proportion of wind power is clearly revealed based on the calculation results of flexible indicators. The ultimate access ratio of wind power penetration into the power system is also optimized to provide a feasible scheme for improving hydro flexibility as much as possible. Considering the influences of the highly stochastic wind speed and rainfall capacity, the above analyses are carried out in wet and dry seasonal periods. The detailed research contributions of this paper are described as follows. (i) In terms of the research idea, the characteristic of timescale variabilities is fully considered when accurately estimating hydro flexibility of the hybrid hydro–wind power system. (ii) In terms of the method, four flexible indicators are presented based on the theories of conditional probability and mathematical expectation, which have rigorous mathematical derivation. (iii) In terms of the results, indirect guidance on the flexible scheduling between hydropower and wind power under different seasonal periods and proportions of wind power is provided based on the calculation results of flexible indicators.
2. Method
The increasing penetration of wind power poses significant challenges to the safe operation of hybrid hydro–wind power systems. Electric power plants, as the decision maker, are responsible for the scheduling of complementary power generation according to the capability of hydro flexibility. The characteristic of timescale variability influences the estimation of hydro flexibility, which causes decision bias in the scheduling. Aiming at this problem, this section presents four flexible indicators to accurately estimate the insufficient upward and downward regulation reserves of hydro resources. To reduce load-shedding events and wind curtailments, the flexible indicators make full use of remaining hydro resources to fast respond to the volatility of wind power. Figure 1 explains three operation scenarios of hydro flexibility.
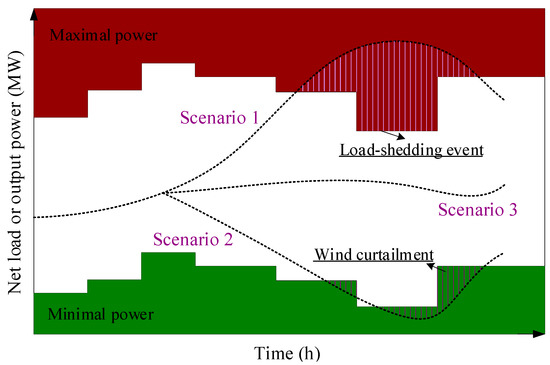
Figure 1.
The schematic diagram of three operation scenarios for hydro flexibility in the hybrid hydro–wind power system.
In operation scenario 1, the net load exceeds the maximal power curve of flexible hydro generating units, which will cause huge economic losses for power plants due to load-shedding events. When the net load is lower than the minimal power curve in operation scenario 2, wind curtailments are inevitably triggered. In operation scenario 3, the hydro resource utilizes efficiently because the net load is limited in maximal and minimal power domains. Aiming at operation scenario 1, the need of increasing the upregulation flexibility of hydro resources is an effective way to cope with ramp-up events of hydro generating units. Conversely, aiming at operation scenario 2, it is necessary to increase the downregulation flexibility to relieve the problem of troughs of the net load.
Considering flexibility problems raised in operation scenarios 1 and 2, four flexible indicators are developed to estimate the amount of load shedding and wind curtailment. These indicators include the insufficient upregulation reserve probability (IURP), the insufficient downregulation reserve probability (IDRP), the insufficient upregulation reserve (IUR), and the insufficient downregulation reserve (IDR). Based on these flexible indicators, a methodology for the estimation of hydro flexibility in multi-time scales is presented in Figure 2.
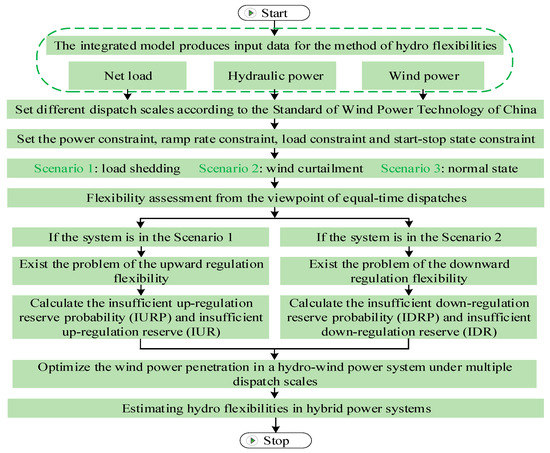
Figure 2.
Methodology of this paper.
To meet reliability requirements of the power grid, the power generation and its consumption meet the following conditions:
and
where i is the label of a hydro generating unit. n is the total number of such units. m is the label of a wind turbine. n1 is the total number of wind turbines. t is the time. PH is the hydraulic power. PW is wind power. LG is the load demand of the power grid. Lnet is the net load. The uncertainty in power supply and demand meets the equation of .
Based on Equations (1) and (2), the insufficient upregulation reserve probability (IURP) that represents the regulation capacity cannot satisfy the need for upregulation flexibility of hydro resources is expressed as:
where RU,t is the available upregulation reserve of hydro generating units. The value of RU,t is related to the constraints of the ramp-up capability and the maximal power of hydro generating units, which meets the following limitation:
where Ru is the available upregulation reserve of a single unit. ui,t is the start-stop state of unit i at time t. is the maximal power of hydro generating units. Ts denotes the dispatch time scale. Equation (4) gives a feasible interval, and thus the maximum of the available upregulation reserve is equivalent to .
Similarly, the insufficient downregulation reserve probability (IDRP) is the regulation capacity that cannot meet the requirement of downregulation flexibility of hydro resources. It is defined as follows:
and
where RD,t is the available downregulation reserve of hydro generating units, which is limited by the ramp-down capability and minimal power of units. Rd is the available downregulation reserve of a single unit, and is the minimal power of units.
Aiming at the indicator IURP, its insufficient upregulation reserve (IUR) is the difference between the available upregulation reserve and actual load demand, which is represented as follows:
and
Regarding the indicator IDRP, the insufficient downregulation reserve (IDR) is defined as the difference between the available downregulation reserve and the actual load demand, which is expressed as follows:
and
The above flexible indicators need meet the following constraint conditions:
- (i)
- The maximal power and minimal power of the hydro generating unit under a certain dispatch time meet:
- (ii)
- The ramp up rate and ramp down rate of the hydro generating unit under a certain dispatch time meet:and
- (iii)
- The load requirement of the power grid under a certain dispatch time meets:andwhere ε is the volatility factor of the grid. and are the quantities of the wind curtailment and load shedding, and these variables meet the following constraint conditions:and
3. Model
In the hybrid hydro–wind power system, the hydropower system regulates fluctuations of wind power. The hydro–turbine, as the main component of the hydropower system, converts kinetic energy of water to mechanical energy. Generator subsequently converts the mechanical energy to electrical energy. A complete hydropower system is composed of the reservoir, the penstock, the hydro–turbine, the synchronous generator, and the governor. The transfer function between the hydro head and flow is expressed as [25]:
where hw is the phase length of the water hammer. Tr is the characteristic coefficient of the pipe. H is the piezometric head of the penstock. Q is the flow in the pipe.
Transforming Equation (18) into the Laplace form, and it is expressed as:
where , and . hf is the friction loss of the penstock. q is the relative value of the hydro flow. Y is the guide vane opening.
Based on the above considerations, the output signals of the hydro flow and head are obtained as:
and
where q0 is the relative value of the initial flow. h, hq, and hfc are the hydro–turbine head, inlet head of hydro–turbine, and head loss coefficient. y and fp are relative values of guide vane opening and friction loss of the penstock.
The hydropower system adopts the proportional–integral–differential (PID) governor [26] to adjust the electrical frequency, and it uses the three-phase synchronous generator [8] to connect with the hydro–turbine. The output power of the hydropower system is depended on the turbine head and turbine flow, which influences the output of wind power. The hydropower model is finally established based on the software of MATLAB/Simulink (2021b), as shown in Figure 3.
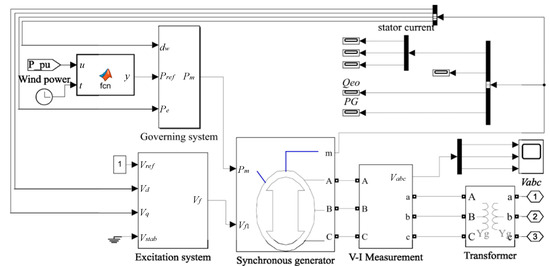
Figure 3.
Block diagram of the hydropower system. The parameters of the excitation system include the voltage in d axis (vd), the voltage in q axis (vq), the reference voltage (vref), and the field voltage (vf). The synchronous generator connects with the governing system, the excitation system, the V–I measurement, and the transformer. The hydro–turbine torque (Pm) is an important correlation variable to connect synchronous generator and governing system. The wind power, as an input variable, connects with the reference power (Pref) of the governing system, which can influence the frequency (dw) and output power (Pe) of the hydropower system. The active power (PG) and reactive power (Qeo) of the generator are finally obtained from this hydropower model. The symbols a–c and A–C represent the three-phase voltage.
The output of wind power is determined by the randomness of wind speeds. The wind power system utilizes the gearbox to transform the wind energy captured by the wind turbine into mechanical energy. The double-fed induction generator (DFIG) converts the mechanical energy to electrical energy. In this paper, a common model of the wind power system [27] is adopted.
The model of the hydro–wind power system is established in Figure 4. The installed capacities of hydro and wind subsystems are 46.9 MW and 33 MW, respectively. The 575 V/25 kV and 380 V/25 kV transformers are used to increase the voltage levels of the hydro and wind subsystems. The power system uses a 25 kV/120 kV transformer to connect with the power grid. Based on the models presented in this section, hydraulic power and wind power, as input variables, are used to participate in the calculation of flexible indicators.
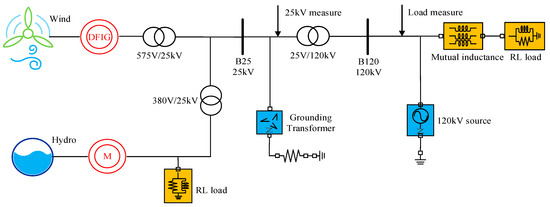
Figure 4.
Model of the hydro–wind power system.
4. Case Description
Hydro flexibility shows significant different characteristics in the wet and dry periods. For this reason, two patterns of daily load curves are adopted to compare different flexible characteristics of the hybrid power system in the wet and dry periods, as shown in Figure 5. The information on the load demand and installed capacity are provided in Table 1.
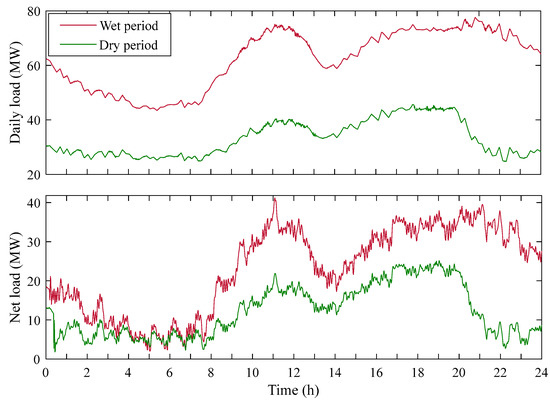
Figure 5.
Daily load curves in the wet and dry periods.

Table 1.
Information of the load demand and installed capacity in the wet and dry periods.
As shown in Figure 5, the large fluctuations of these two daily loads concentrate in the time ranges of [10 h, 13 h] and [18 h, 21 h] due to the peak-load demand. Because of the drastic fluctuations of the net load, wind power leads to a large ramp of hydro generating units. If the ramp-up capacity is less than the net load, the insufficient upregulation reserve will lead to load shedding events. Conversely, the insufficient ramp-down capacity of hydro flexibility will cause wind curtailments. Moreover, the volatility of the net load shows a significant nature of timescale variabilities. Based on the standard of wind power technology, the dispatch time is recommended as 3 min, 10 min, and 1 h.
5. Results
Considering the different fluctuations of wind power under the dry and wet periods, the hydro flexibilities for these two seasonal periods in the three time scales are estimated to achieve the optimal coordinated operation. Section 5.1 clearly shows hydro flexibility of the hybrid power system at any time in 24 h, which helps power plants find the period of time with the high hydropower demands of upregulation ramp power and downregulation ramp power. Section 5.2 shows the total values of insufficient upward and downward regulation reserves of hydro resources with the change of the proportion of wind power, which helps power plants find the optimal complementary capacity between hydropower and wind power.
5.1. Estimating Hydro Flexibilities under the Dry and Wet Periods
This section uses the method of an equal-time dispatch of the net load to analyze the actual demand of the hydro ramp power and its supply capacity. The insufficient upward and downward regulation reserves of hydro resources are also estimated. The results are shown in Figure 6 and Figure 7.
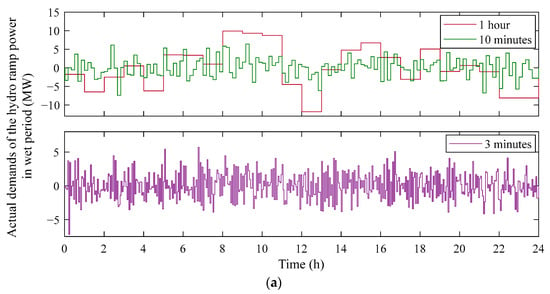
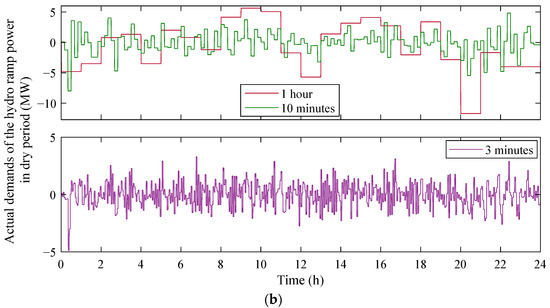
Figure 6.
The actual demands of the hydro ramp power in the time scales of 3 min, 10 min, and 1 h. (a) Wet period, (b) dry period.
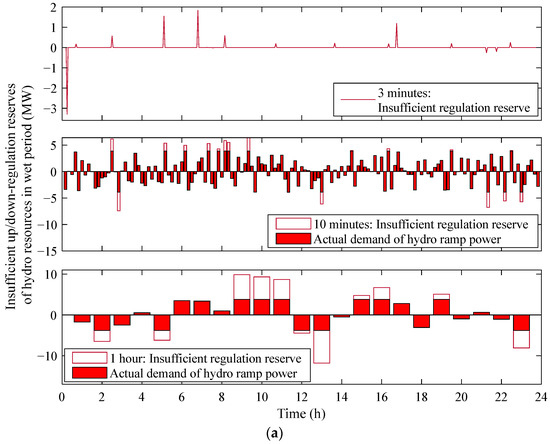
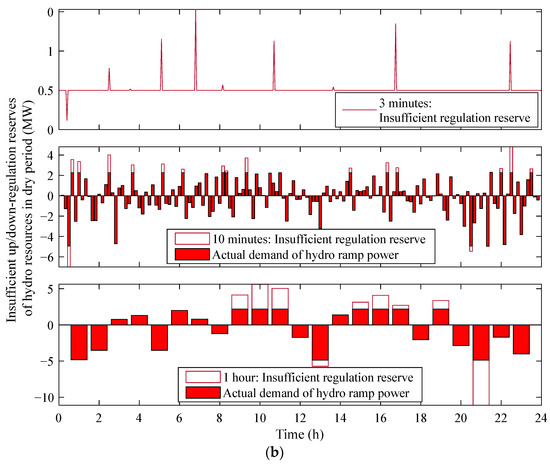
Figure 7.
The insufficient up and downregulation reserves of hydro resources in the time scales of 3 min, 10 min, and 1 h. (a) Wet period, (b) dry period.
For both wet and dry periods in Figure 6, the actual demand of the hydro ramp power in 1 h scale is the highest, while this actual demand in 3 min scale is the lowest. Differently, the demand of the hydro ramp power under the wet period is obviously higher than the level under the dry period, which is attributed to the seasonal fluctuations of the water supply and wind speed. In other words, the abundant rainfall and the strong flow of rivers make the reservoir water obviously increase in the wet period, which provides excellent capability of hydro flexibility. Despite this, the randomness of wind power may bring negative impacts on the dynamic power quality of the power system.
Moreover, the high hydro demands of upregulation ramp power and downregulation ramp power under the wet period mainly concentrate on 3.8 MW and 2.8 MW (in the 3 min scale), 5 MW and 5 MW (in the 10 min scale), as well as 9.5 MW and 1 MW (in the 1 h scale), respectively. Conversely, the high upregulation and downregulation ramp demands under the dry period are roughly 1.8 MW and 2 MW (in the 3 min scale), 3.8 MW and 5 MW (in the 10 min scale), as well as 5.5 MW and 6 MW (in the 1 h scale), respectively.
In Figure 7, the insufficient upregulation reserve of the hydro resource is greater than the insufficient downregulation reserve in different seasonal periods. This means that the hydro flexibility of the ramp up cannot meet the large-scale penetration of wind power. Compared with the wet period, a relatively severe situation exists in the insufficient downregulation reserve under the dry period. For both seasonal periods, the insufficient regulation reserve increases when the time scale changes from 3 min, 10 min, to 1 h. The power system in the time scale of 1 h produces a large amount of insufficient up and downregulation reserves, approximately 10.806 MW and 8.2210 MW in the wet period as compared to 7.4182 MW and 1.3991 MW in the dry period. In contrast, the insufficient up and downregulation reserves are the smallest in the 3 min scale (3.5985 MW and 7.6900 MW in the wet period versus 1.5719 MW and 1.6000 MW in the dry period). The occurrence time of the insufficient reserves is different for the three dispatch scales, which demonstrates the necessity of hydro flexibility from the perspective of timescale variabilities.
5.2. Optimizing the Resource Allocation in Multi-Time Scales
The penetration of wind power in the hybrid system leads to an increased demand of hydro flexibility to improve the power safety. To cope with this challenge, this section investigates the impacts of the increasing proportion of wind power on hydro flexibility. The ultimate access ratio of wind power penetration into the power system is optimized from the calculating results of flexible indicators, which provides a feasible scheme for improving hydro flexibility as much as possible. This flexibility assessment is carried out under three dispatch scales (i.e., 3 min, 10 min, and 1 h) and two seasonal periods (i.e., wet period and dry period). The results are revealed in Table 2, Table 3, Table 4, Table 5, Table 6 and Table 7.

Table 2.
Results of hydro flexibility for the wet period in the 3 min scale.

Table 3.
Results of hydro flexibility for the wet period in the 10 min scale.

Table 4.
Results of hydro flexibility for the wet period in the 1 h scale.

Table 5.
Results of hydro flexibility for the dry period in the 3 min scale.

Table 6.
Results of hydro flexibility for the dry period in the 10 min scale.

Table 7.
Results of hydro flexibility for the dry period in the 1 h scale.
The result in the wet period is shown in Table 2. For the dispatch scale of 3 min, there is an increased trend for the probability of the insufficient up and downregulation reserves and its related shortfall of hydro reserves when the wind proportion changes from zero to 52.58%. This means that the margin of the system tolerance is at the penetration of 50.70% wind power. Correspondingly, the maximums of wind curtailment and load shedding reach 7.6739 MW along the upregulation direction and 3.9140 MW along the downregulation direction, respectively. For the dispatch scale of 10 min, the flexible indicators IDRP, IUR, and IDR increase between zero and 52.58% wind proportion, while the flexible indicator IURP has two outliers at 45.07% wind proportion (IURP = 0.1333) and 52.58% wind proportion (IURP = 0.1549). However, these outliers cannot influence the increased trend of the shortfall of hydro reserves. In this situation, the margin of the system tolerance is at 52.58% wind proportion. For the dispatch scale of 1 h, there are lots of outliers in IURP and IDRP, which can influence the increased trend of the shortfall of hydro reserves. For instance, if the IDRP rises from 18.78% to 22.53% wind proportion, the corresponding wind curtailment declines from 6.0103 MW to 5.7910 MW. In this case, 50.70% wind proportion is its margin of the system tolerance.
Compared with these three dispatch scales, the wind proportion in 1 h scale has a relatively significant impact on wind curtailment and load shedding. The insufficient up and down regulation reserves reach their corresponding maximums, i.e., 19.647 MW and 11.459 MW, respectively. This is because the decreasing hydro flexibility cannot suppress the large wind fluctuations.
The result in the dry period is shown in Table 3. For the three dispatch scales, the margin of the system tolerance is at 37.32% wind proportion. Compared with the insufficient downregulation reserve, the insufficient upregulation reserve is a main safety problem for the hybrid power system. Specifically, for the dispatch scale of 3 min, its outliers of the hydro flexibility occur at 24.88% and 29.86% wind proportions, where IURP continuously declines to 0.0246 and IDRP drops to zero. For the dispatch scale of 10 min, the insufficient upregulation reserve generally keeps an increased trend when the wind proportion changes from zero to 37.32%. In contrast, the outliers for the insufficient downregulation reserve occur at 24.88% and 29.86% wind proportions, where both IDRP and IDR drop to zero. The maximal shortfalls of the up and downregulation reserves are 11.433 MW and 12.5157 MW, respectively. Moreover, the maximal probability of the insufficient regulation reserve for 1 h scale exists at 37.32% wind proportion, i.e., IURP = 0.6154 and IDRP = 0.6000. In this dispatch scale, all four flexible indicators change irregularly, and their values are significantly higher than that for the dispatch scales of 3 min and 10 min. The maximal shortfall of the downregulation reserve occurs at 19.91% wind proportion (i.e., 15.604 MW), which is attributed to a long fluctuation cycle of the net load in 1 h scale.
Compared with the wet period, the variation of these four flexible indicators is more complicated in the dry period. The dry period can face a serious hydro flexibility problem. This is caused by the high uncertainties in the water storage and wind speed during the dry period. Meanwhile, the acceptable wind proportion for the wet period (i.e., 50.70%) is obviously greater than that for the dry period (i.e., 37.32%). This illustrates that the wet period has an excellent flexible capability in treating the large-scale penetration of wind power.
Figure 8 further shows the change rate and flexible reserve gap among different wind proportions. The change rate is defined as the difference in the insufficient regulation reserve probability between two adjacent proportions of wind power (e.g., Di and Di+1), which represents the sensitivity of the insufficient regulation reserve to the proportion of wind power.
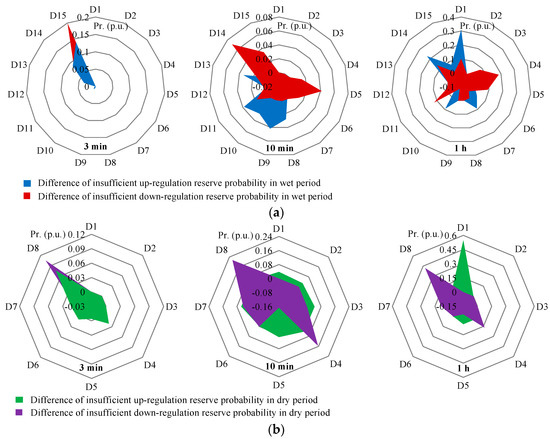
Figure 8.
Change rates of the insufficient regulation reserve for the increased wind proportion in the dispatch scales of 3 min, 10 min, and 1 h. Symbols D1-D15 represent the proportions of wind power, as listed in Table 2, Table 3, Table 4, Table 5, Table 6 and Table 7. (a) Wet period, (b) dry period.
In Figure 8a, the change rate of the insufficient regulation reserve in the 3 min scale is significantly slower than that in the 10 min and 1 h scales. Specifically, for the 3 min scale, the upregulation change rate keeps at zero between the wind proportion of zero and 30.05%, while the variation occurs in the downregulation change rate from the wind proportion of 45.07% to 52.58%. The corresponding maximums of the upward and downward change rates are 0.1382 (D15) and 0.1979 (D15), respectively. For the 10 min scale, the upward and downward change rates start to change at the wind proportions of 26.29% and 11.27%, respectively. Compared with the upward change rate, the downward change rate is relatively faster, and its maximum reaches 0.0704 (D14). Of note, the negative change rate exists in the insufficient upregulation reserve at the penetration points D12 and D15. The negative value represents that the probability of the load shedding reduces between two adjacent wind proportions. For the 1 h scale, the upward and downward change rates start to change from the wind proportion of zero, and their corresponding maximums reach 0.3077 (D1) and 0.1818 (D4), respectively. The upward change rate is obviously faster than the downward level, meaning that the upregulation flexibility easily leads to unexpected operational losses in the 1 h scale.
Comparing the dispatch scales of 3 min and 10 min in Figure 8b, the change rate of the insufficient regulation reserve has an extreme maximum in the 3 min scale, i.e., 0.5455 for the upregulation scenario at the penetration point D1 and 0.4182 for the downregulation scenario at the penetration point D8. Thus, the large-scale penetration of wind power has a certain adverse impact on the efficient generation of hybrid power systems. Compared with the wet period, the negative change rate occurs in these three scales in the dry period. Specifically, the negative change rate for the insufficient upward and downward reserves is at the penetration point D5 in 3 min scale. For the 10 min scale, the negative change rates along the upward and downward directions are at penetration points D6 and D5, respectively. With respect to the 1 h scale, the negative change rates along the upward and downward directions are at penetration points D3 and D5, respectively. In contrast to the wet period, it is difficult to exactly recognize which flexible regulation direction is the dominant volatility factor in the dry period.
6. Conclusions
This study estimated hydro flexibility in regulating the volatility of wind power from the perspective of timescale variabilities. The first contribution of this study is making full use of hydro flexibility to reduce the wind curtailment and load shedding in hydro–wind power systems. The second contribution is estimating the insufficient upward and downward regulation ramp capacities of hydropower resources in sub-hours and hour dispatch scales based on the developed flexible indicators. To improve the safety of power plants, the third contribution is that the ultimate access ratio of the wind power penetration into the power system is optimized. Both dry and wet seasons are extensively considered in the analysis to promote the application of results. Summarizing the results of this study, the following findings can be highlighted:
- (a)
- From the viewpoint of timescale variabilities, the high demand for hydro flexibilities under the wet period mainly concentrates on the upregulation flexibility in the hour dispatch scale, where it lacks approximately 9.5 megawatts of flexible resources. However, the situation during the dry period has obvious differences. The demand for upregulation and downregulation flexibilities decreases gradually with the increase of dispatch scales.
- (b)
- Under the wet period, the ultimate access ratio of the wind power penetration is around 50.70% in both the 3 min scale and 1 h scale, while the ultimate access ratio can reach 52.58% in 10 min scale. Under the dry period, the ultimate access ratio is obviously lower than the wet period, which is around 37.32% for all three dispatch scales. Not all insufficient upward and downward regulation reserve capacities of hydro resources in different dispatch time scales have increased trends with the increase of the proportion of wind power.
Author Contributions
Conceptualization, X.M.; Methodology, X.M.; Software, H.S.; Validation, H.S. and H.L.; Formal analysis, H.S.; Investigation, H.S.; Resources, H.S.; Data curation, X.M.; Writing–original draft, X.M.; Writing–review & editing, H.L.; Visualization, X.M.; Supervision, H.L.; Project administration, H.L.; Funding acquisition, H.L. All authors have read and agreed to the published version of the manuscript.
Funding
This research received no external funding.
Data Availability Statement
No new data were created or analyzed in this study. Data sharing is not applicable to this article.
Conflicts of Interest
The authors declare no conflict of interest.
References
- Chen, C.Y.; Liu, H.L.; Xiao, Y.; Zhu, F.G.; Ding, L.; Yang, F.W. Power generation scheduling for a hydro-wind-solar hybrid system: A systematic survey and prospect. Energies 2022, 15, 8747. [Google Scholar] [CrossRef]
- Andrade, T.; Kelman, R.; Cunha, T.M.; Albuquerque, L.R.; Calili, R.F. An integer programming model for the selection of pumped-hydro storage projects. Water Resour. Res. 2022, 58, e2020WR028625. [Google Scholar] [CrossRef]
- Yu, L.; Wu, X.F.; Zhou, Z.H. Multi-objective optimal operation of cascade hydropower plants considering ecological flow under different ecological conditions. J. Hydrol. 2021, 601, 126599. [Google Scholar] [CrossRef]
- Liu, G.C.; Qiu, X.D.; Ma, J.Y.; Chen, D.Y.; Liang, X. Influence of flexible generation mode on the stability of hydropower generation system: Stability assessment of part-load operation. Energies 2022, 15, 3956. [Google Scholar] [CrossRef]
- Holttinen, H.; Tuohy, A.; Milligan, M.; Lannoye, E.; Silva, V.; Muller, S.; Soder, L. The flexibility workout: Managing variable resources and assessing the need for power system modification. IEEE Power Energy Mag. 2013, 11, 53–62. [Google Scholar] [CrossRef]
- Melamed, M.; Ben-Tal, A.; Golany, B. A multi-period unit commitment problem under a new hybrid uncertainty set for a renewable energy source. Renew. Energy 2018, 118, 909–917. [Google Scholar] [CrossRef]
- Lund, P.D.; Lindgren, J.; Mikkola, J.; Salpakari, J. Review of energy system flexibility measures to enable high levels of variable renewable electricity. Renew. Sustain. Energy Rev. 2015, 45, 785–807. [Google Scholar] [CrossRef]
- Jiang, Z.Q.; Wu, W.J.; Qin, H.; Zhou, J.Z. Credibility theory based panoramic fuzzy risk analysis of hydropower station operation near the boundary. J. Hydrol. 2018, 565, 474–488. [Google Scholar] [CrossRef]
- Avila, L.; Mine, M.R.M.; Kaviski, E.; Detzel, D.H.M. Evaluation of hydro-wind complementarity in the medium-term planning of electrical power systems by joint simulation of periodic stream fl ow and wind speed time series: A Brazilian case study. Renew. Energy 2021, 167, 685–699. [Google Scholar] [CrossRef]
- Han, S.; He, M.J.; Zhao, Z.W.; Chen, D.Y.; Xu, B.B.; Jurasz, J.; Liu, F.S.; Zheng, H.X. Overcoming the uncertainty and volatility of wind power: Day-ahead scheduling of hydro-wind hybrid power generation system by coordinating power regulation and frequency response flexibility. Appl. Energy 2022, 333, 120555. [Google Scholar] [CrossRef]
- Farahmand, H.; Jaehnert, S.; Aigner, T.; Huertas-Hernando, D. Nordic hydropower flexibility and transmission expansion to support integration of North European wind power. Wind Energy 2015, 18, 1075–1103. [Google Scholar] [CrossRef]
- Xu, J.P.; Liu, T.T. Optimal hourly scheduling for wind-hydropower systems with integrated pumped-storage technology. J. Energy Eng. 2021, 147, 04021013. [Google Scholar] [CrossRef]
- Beevers, D.; Branchini, L.; Orlandini, V.; De Pascale, A.; Perez-Blanco, H. Pumped hydro storage plants with improved operational flexibility using constant speed Francis runners. Appl. Energy 2015, 137, 629–637. [Google Scholar] [CrossRef]
- Chamberland-Lauzon, J.; Monette, C.; Nennemann, B.; Melot, M.; Birk, S.; Ruchonnet, N. Francis design and prediction technology for flexible operation. IOP Conf. Ser. Earth Environ. Sci. 2019, 240, 022042. [Google Scholar] [CrossRef]
- Huertas-Hernando, D.; Farahmand, H.; Holttinen, H.; Kiviluoma, J.; Rinne, E.; Soder, L.; Milligan, M.; Ibanez, E.; Martinez, S.M.; Gomez-Lazaro, E.; et al. Hydro power flexibility for power systems with variable renewable energy sources: An IEA Task 25 collaboration. Wiley Interdiscip. Rev. Energy Environ. 2017, 6, e220. [Google Scholar] [CrossRef]
- Vasil’ev, Y.S.; Elistratov, V.V.; Kudryasheva, I.G. Use of the flexibility characteristics of hydroelectric power plants and pumped-storage power plants in a power system with renewable energy sources. Power Technol. Eng. 2019, 53, 294–299. [Google Scholar] [CrossRef]
- Naghdalian, S.; Amraee, T.; Kamali, S.; Capitanescu, F. Stochastic network constrained unit commitment to determine flexible ramp reserve for handling wind power and demand uncertainties. IEEE Trans. Ind. Inform. 2020, 16, 4580–4591. [Google Scholar] [CrossRef]
- Kristiansen, M.; Korpas, M.; Svendsen, H.G. A generic framework for power system flexibility analysis using cooperative game theory. Appl. Energy 2018, 212, 223–232. [Google Scholar] [CrossRef]
- Min, C.G.; Kim, M.K. Flexibility-based reserve scheduling of pumped hydroelectric energy storage in Korea. Energies 2017, 10, 1478. [Google Scholar] [CrossRef]
- Karhinen, S.; Huuki, H. Private and social benefits of a pumped hydro energy storage with increasing amount of wind power. Energy Econ. 2019, 81, 942–959. [Google Scholar] [CrossRef]
- Chen, Y.; Wei, W.; Liu, F.; Mei, S.W. Distributionally robust hydro-thermal-wind economic dispatch. Appl. Energy 2016, 173, 511–519. [Google Scholar] [CrossRef]
- Hirth, L. The benefits of flexibility: The value of wind energy with hydropower. Appl. Energy 2016, 181, 210–223. [Google Scholar] [CrossRef]
- Mirzaei, M.A.; Nazari-Heris, M.; Mohammadi-Ivatloo, B.; Marzband, M. Consideration of hourly flexible ramping products in stochastic day-ahead scheduling of integrated wind and storage systems. In Proceedings of the 2018 Smart Grid Conference (SGC), Sanandaj, Iran, 28–29 November 2018. [Google Scholar]
- Heydarian-Forushani, E.; Golshan, M.E.H.; Shafie-khah, M.; Siano, P. Optimal operation of emerging flexible resources considering sub-hourly flexible ramp product. IEEE Trans. Sustain. Energy 2018, 9, 916–929. [Google Scholar] [CrossRef]
- Li, H.H.; Chen, D.Y.; Wang, F.F.; Zhang, H. Switched model and dynamic analysis of a hydroturbine governing system in the process of load rejection transient. J. Dyn. Syst. Meas. Control 2017, 139, 101002. [Google Scholar] [CrossRef]
- Guo, P.C.; Zhang, H.; Gou, D.M. Dynamic characteristics of a hydro-turbine governing system considering draft tube pressure pulsation. IET Renew. Power Gener. 2020, 14, 1210–1218. [Google Scholar] [CrossRef]
- Soares, M.N.; Mollet, Y.; Kinnaert, M.; Gyselinck, J.; Helsen, J. Multiphysical time- and frequency-domain fault detection and isolation technique for power-electronic converters in DFIG wind turbines. IEEE Trans. Power Electron. 2021, 36, 3793–3802. [Google Scholar]
Disclaimer/Publisher’s Note: The statements, opinions and data contained in all publications are solely those of the individual author(s) and contributor(s) and not of MDPI and/or the editor(s). MDPI and/or the editor(s) disclaim responsibility for any injury to people or property resulting from any ideas, methods, instructions or products referred to in the content. |
© 2023 by the authors. Licensee MDPI, Basel, Switzerland. This article is an open access article distributed under the terms and conditions of the Creative Commons Attribution (CC BY) license (https://creativecommons.org/licenses/by/4.0/).