Article

An Efficient Hybrid Particle Swarm and Gradient Descent Method for the Estimation of the Hosting Capacity of Photovoltaics by Distribution Networks

Faculty of Information Science and Technology, Hokkaido University, Sapporo 060-0808, Japan
*
Author to whom correspondence should be addressed.
Energies 2023, 16(13), 5207; https://doi.org/10.3390/en16135207
Submission received: 2 June 2023 / Revised: 3 July 2023 / Accepted: 5 July 2023 / Published: 6 July 2023
(This article belongs to the Topic Solar Forecasting and Smart Photovoltaic Systems)

Abstract

:
With many distribution networks adopting photovoltaic (PV) generation systems in their networks, there is a significant risk of over-voltages, reverse power flow, line congestion, and increased harmonics. Therefore, there is a need to estimate the amount of PV that can be injected into the distribution network without pushing the network towards these threats. The largest amount of PV a distribution system can accommodate is the PV hosting capacity (PVHC). The paper proposes an efficient method for estimating the PVHC of distribution networks that combines particle swarm optimization (PSO) and the gradient descent algorithm (GD). PSO has a powerful exploration of the solution space but poor exploitation of the local search. On the other hand, GD has great exploitation of local search to obtain local optima but needs better global search capabilities. The proposed method aims to harness the advantages of both PSO and GD while alleviating the ills of each. The numerical case studies show that the proposed method is more efficient, stable, and superior to the other meta-heuristic approaches.

1. Introduction

Distributed generation (DG) integration in distribution networks has been on a sharp rise for the past few decades owing to the enormous benefits of renewable energy resources (including curbing the effects of climate change) [1]. Among these renewable energy sources, photovoltaic generation (PV) has particularly been the most explored renewable power generation resource due to its decreasing construction prices and high scalability [2,3]. At the end of 2020, the cumulative worldwide total solar installed capacity stood at an amazing 627 GW. The International Energy Agency estimates this to increase by more than 125 GW annually between 2021 and 2025 and could reach 1.25 TW by 2023 [4,5].
However, excessive injection of PV would lead to over-voltages, line congestion, and power quality problems [6,7,8,9,10,11,12]. Therefore, there is an urgent need to develop methods for estimating the PV hosting capacity (PVHC), which is the maximum amount of PV the distribution network can accommodate without leading to violations of voltage limits and thermal capabilities of network cables and equipment [5]. PVHC is now an integral metric for long-term planning in distribution networks. Therefore, a clear understanding of the technical requirements placed upon the system operator to ensure reliable and secure operation must be defined through the appropriate selection of performance limits.
There are two distinct methods used for PVHC estimation: the stochastic or probabilistic approach and the deterministic approach [11,13]. The stochastic approach is widely used, especially in the case of many small-scale PVs. In this approach, multiple PV output scenarios are developed and evaluated using probabilistic or statistical means [14]. In the probabilistic approach, the uncertainties in PV output and load are modeled as a probabilistic density function and applied to the probabilistic load flow analysis. In the statistical approach, the time series data for the PV output and the load are applied to the time-sequential power flow analysis. The main setback in stochastic approaches is the loss of generality in the effects and relationships of variables as the number of scenarios increases [15] and the calculation burden associated with the consideration of a vast number of possibilities in the model.
In the deterministic approach, load flow analyses are successively run by increasing the amount of PV output until any of the considered operational constraints are violated [16]. This approach is practical for large-scale concentrated PV installations [5]. In deterministic approaches, the most dominant constraint is the voltage profile [17]. In [18,19], the deterministic method is used to give the pessimistic PV hosting capacity of DN based on a worst-case PV output consideration. The downside of the deterministic approach is its inability to capture uncertainties in the PV hosting capacity estimation process.
To improve the deterministic approach and give a semblance of uncertainty inclusion, a new method for PVHC estimation is fast emerging. For this purpose, some meta-heuristic optimization tools have been developed. The authors of [20] propose the use of improved multi-objective elephant herding optimization (IMOHEA) to calculate the optimal location of pre-sized DGs in the distribution network. In [21,22], the use of modified Teaching–Learning-Based Optimization (TLBO) to achieve a similar objective is proposed. In [23], a combination of genetic algorithms and particle swarm optimization (GA/PSO) is developed to evaluate optimal DG sizes. An improved differential-based evolutionary algorithm (I-DBEA) is explored in [24] to estimate the optimal DG sizes for IEEE 33-bus test DN. Methods used in [20,21,22,23,24] are not sensitive to the nature and structure of the problem and sometimes may not attain a fully optimal solution because they have poor exploitation around the local optimum solution [25].
This paper proposes a new algorithm based on the hybridization of Particle Swarm Optimization (PSO) and Gradient Descent (GD). PSO provides excellent exploration of the entire search space for the global optimum solution, while GD aids in exploiting the local solutions [26]. The advantage of this combination is that while PSO searches for near-optimal global solutions, GD ensures that the solution set is closer to the optimal solution by invoking a great deal of local solution search. GD also ensures that the solution is amenable to the structure and nature of the problem by making the particles of PSO move in line with the differential components of the model problem [27]. The underpinning concept of the hybrid particle swarm optimization and gradient descent (PSO-GD) method is given in this paper and then applied to obtain the optimal locations and sizes of PV installations in distribution networks to ultimately estimate their optimal PVHC.
The rest of this paper is organized as follows: Section 2 introduces the concepts of generic PSO, generic GD, and hybrid PSO-GD. Section 3 gives a formulation for the PVHC estimation problem along with the solution approach. The enhancement of PVHC by the inverter volt-var function can also be considered. The application of the developed PSO-GD is established in Section 4 and endeavors to discuss the stability of the optimizer. Section 5 summarizes the paper.

2. Hybrid PSO-GD Algorithm

2.1. Generic Particle Swarm Optimization

The basic particle swarm optimization was first developed by Eberhart and Kennedy in the 1990s [28]. It was based on the natural behavior of swarms of birds or schools of fish. It mimics the concept of individual learning and the cultural transmission of information among individuals in a population [29,30,31,32,33]. In its application, the individuals are referred to as particles and the swarms as populations. PSO is an iterative solution technique in which the positions of particles (representing the decision variable vector) are updated by the following equations:
x i k + 1 = x i k + v i k + 1
v i k + 1 = w v i k + c 1 r 1 × p b e s t k x i k + c 2 r 2 × g b e s t k x i k
where x i k and v i k are the position and the velocity of the i -th particle at the k -th iteration, respectively; w is the inertia constant to the movement of the particle; c 1 and c 2 are the private and the social acceleration, respectively; r 1 and r 2 are randomly generated numbers; p b e s t k is the individual particle’s best position in the past iterations; and g b e s t k is the overall (global) best position in the past iterations. The concept of iteration is illustrated in Figure 1.
Due to poor exploitation of the local optima and PSO’s lack of sensitivity to the nature and structure of the problem (as no information on the problem’s function partial derivatives is required), PSO may often get trapped in poor local optima [34]. Therefore, PSO would provide a poor-quality solution.

2.2. Generic Gradient Descent Algorithm

Consider a classical optimization problem with the variables x and u below:
min f x , u
s . t : g x , u = 0
h ( x , u ) 0
The optimal solution to this problem is achieved by first obtaining the unconstrained Lagrange function with auxiliary variables λ and penalty parameters μ using (6):
L x , u = f x , u λ T g x , u μ T h ( x , u )
At the optimum point x , u , the partial derivatives of the Lagrange function are equal to zero, i.e.,
L x , u x = f x , u x λ T g x , u x μ T h x , u x = 0
and,
L x , u u = f x , u u λ T g x , u u μ T h x , u u = 0
The solution set is then to assume values for the independent variables and obtain the auxiliary variables using (9).
λ = g x T 1 . f x
The gradient of the objective function is then obtained from (10).
f = f u + g u T λ
If the gradient is sufficiently small, then the minimum of the problem has been reached; otherwise, the variables are updated by adjusting them using the gradient component as given by (11).
u k + 1 = u k c . f
The process proceeds by repeating (9) to (11) until a sufficiently small value of the gradient is obtained. The authors of [26] have proposed a dual-augmented approach for dealing with inequality constraint violations.
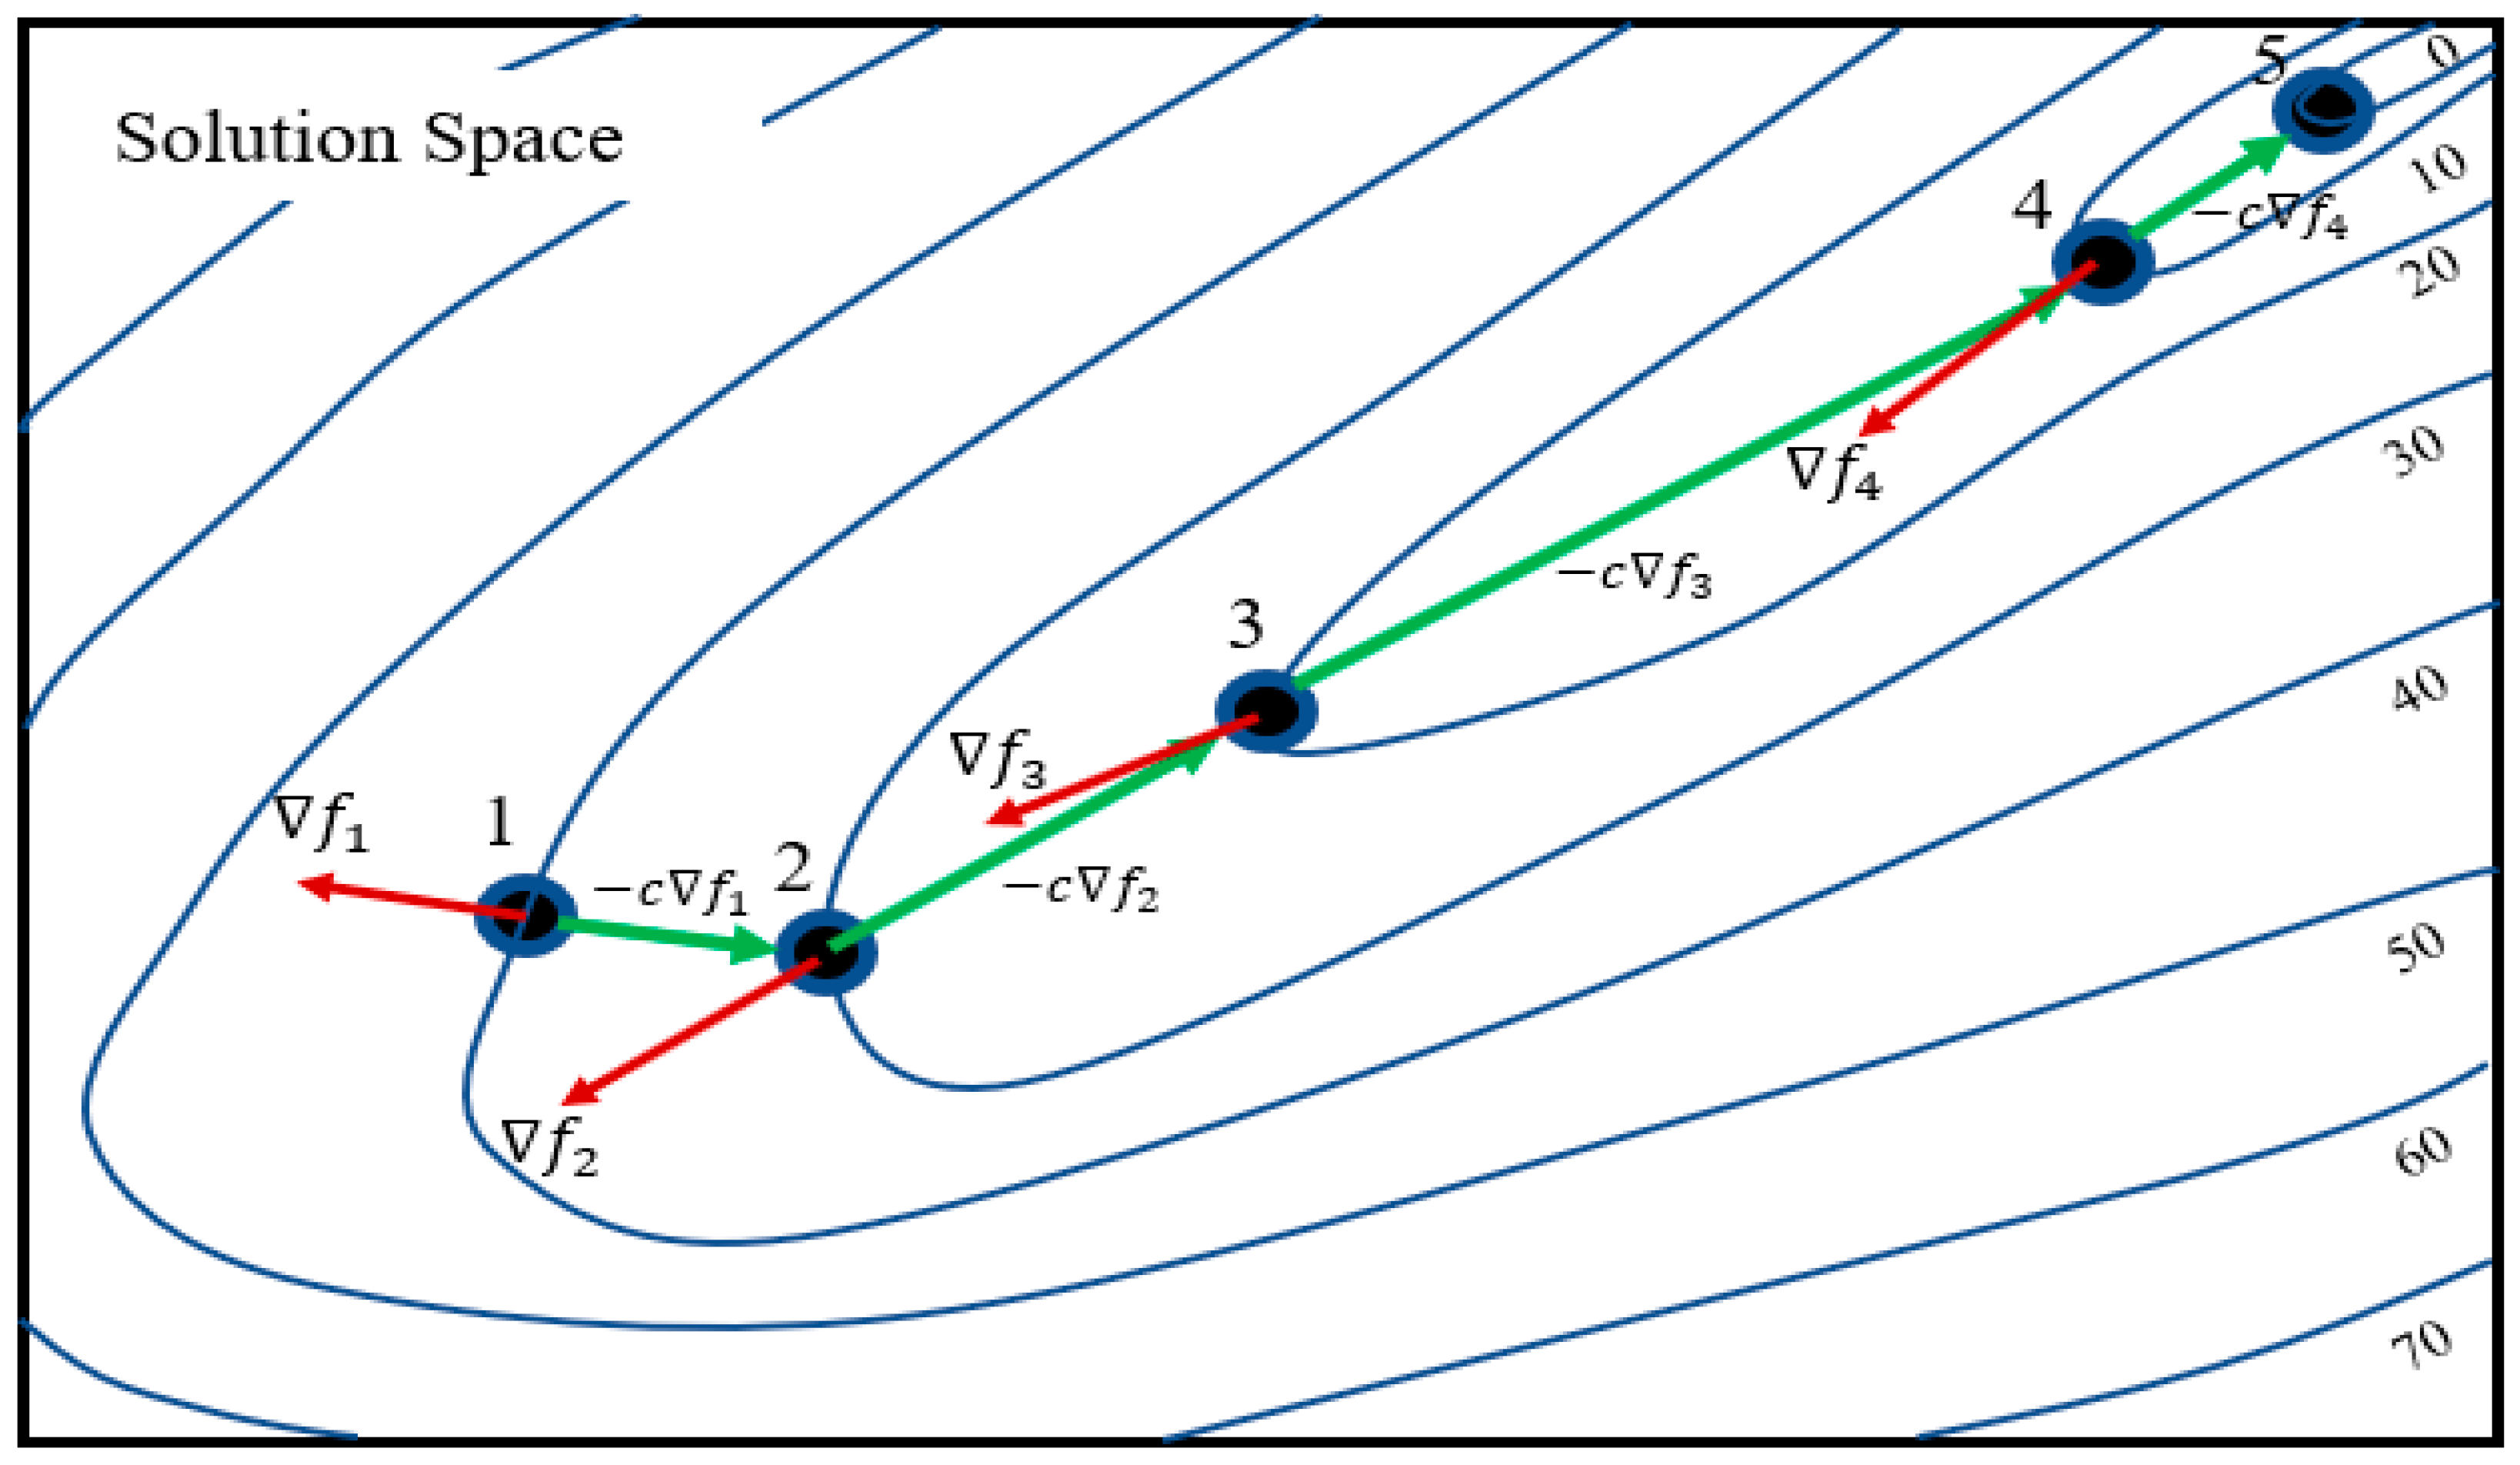
Figure 2 shows the iterative steepest gradient descent process. The solution search is in the opposite direction of the gradient, augmented by an appropriate step size c . When the optimum is reached, the gradient is nearly zero, so the iteration process stops as no more movement is possible in (11).

2.3. Proposed Hybrid PSO-GD Algorithm

This paper proposes the use of a combination of the PSO and the GD algorithm. This approach is motivated by the gradient based PSO algorithm proposed in [35], which was used for calculating optimal values of known mathematical functions. In its modification process, the GD-based PSO algorithm is targeted to enhance the solution search of the algorithm by applying the steepest gradient descent to the current particle position in the particle position update process of (2). Equation (12) shows the search procedure for the local optimum position in the GD-based PSO. PSO is used to get the near-optimal solution, then GD is used, in appropriate steps defined by parameter c , to move a particular particle to converge at its local optimum solution.
x i k + 1 = x i k c f k x i k
The disadvantage of this method is that, in the event of the gradient being zero (i.e., at a local optimum position), the particle would be trapped in the local optimum position as movement is no longer possible going by (12), the same way the GD algorithm (11) is affected. Furthermore, this method does not account for constraints because it only uses the derivative of the objective function. The lack of incorporation of constraints in the algorithm renders it less useful for non-linear, non-convex, constrained problems such as PVHC estimation, which is constrained by power flow requirements and bounding limitations on voltage, reactive power, and line flow limits.
Unlike the gradient-based PSO, the proposed approach only applies the GD component to the particle velocity component given in (2). This modification is shown in Equation (13).
v i k + 1 = c f k v i k + c 1 r 1 × p b e s t i k x i k + c 2 r 2 × g b e s t k x i k
where c is a step size that must be carefully selected to avoid many oscillations around the optimum position. A very small value may lead to slower convergence, while a large value might lead to oscillations around the optimum.
The improvement in this case is that as the search solution gets closer to the local optimal solution, the GD component gets smaller to improve the local optimal exploitation. Furthermore, because the component movements along the personal best position and the global best position are not affected by the GD component, the particle’s global search exploration in the solution space is retained.
Figure 3 shows the interaction of the particles in the search space. Through this hybridization, the exploitation of the local minima is improved while the excellent exploration capabilities of the PSO algorithm are retained.

2.4. Evaluation of Particles for the Solution Search

Considering the earlier optimization problem in Section 2.3 given by Equations (5)–(7), the particle # j is evaluated for its fitness by considering its objective value f ( x j k , u j k ) and the equality and inequality constraints violations [36], g ( x ) and h ( x ) . That is,
F i t j = f x j k j = 1 M C V , j μ j h j x j k , u j k
where F i t j is the fitness evaluation of particle j , M is the total number of constraints, and μ j 0,1 is a binary variable representing the inequality constraint violation. C V , j is the penalty factor for violation of constraint j , that is,
μ j = 0   i f   h ( x , u ) 0 1   i f   h ( x , u ) > 0  
Once the fitness values of all the particles in a population are obtained, they are then compared with each other according to the superiority of the feasibility criterion [37,38]. A candidate solution is deemed feasible if and only if it satisfies the equality and inequality constraints. Table 1 gives the procedure for selecting the personal best particle at the k -th iteration.
After the personal best candidate solution is selected, it is compared to the global best solution according to similar superiority of feasibility rules as outlined in Table 1. The procedure for selecting the global best solution is much like Table 1, but differs slightly. Table 2 highlights the procedure for selecting the global best solution.
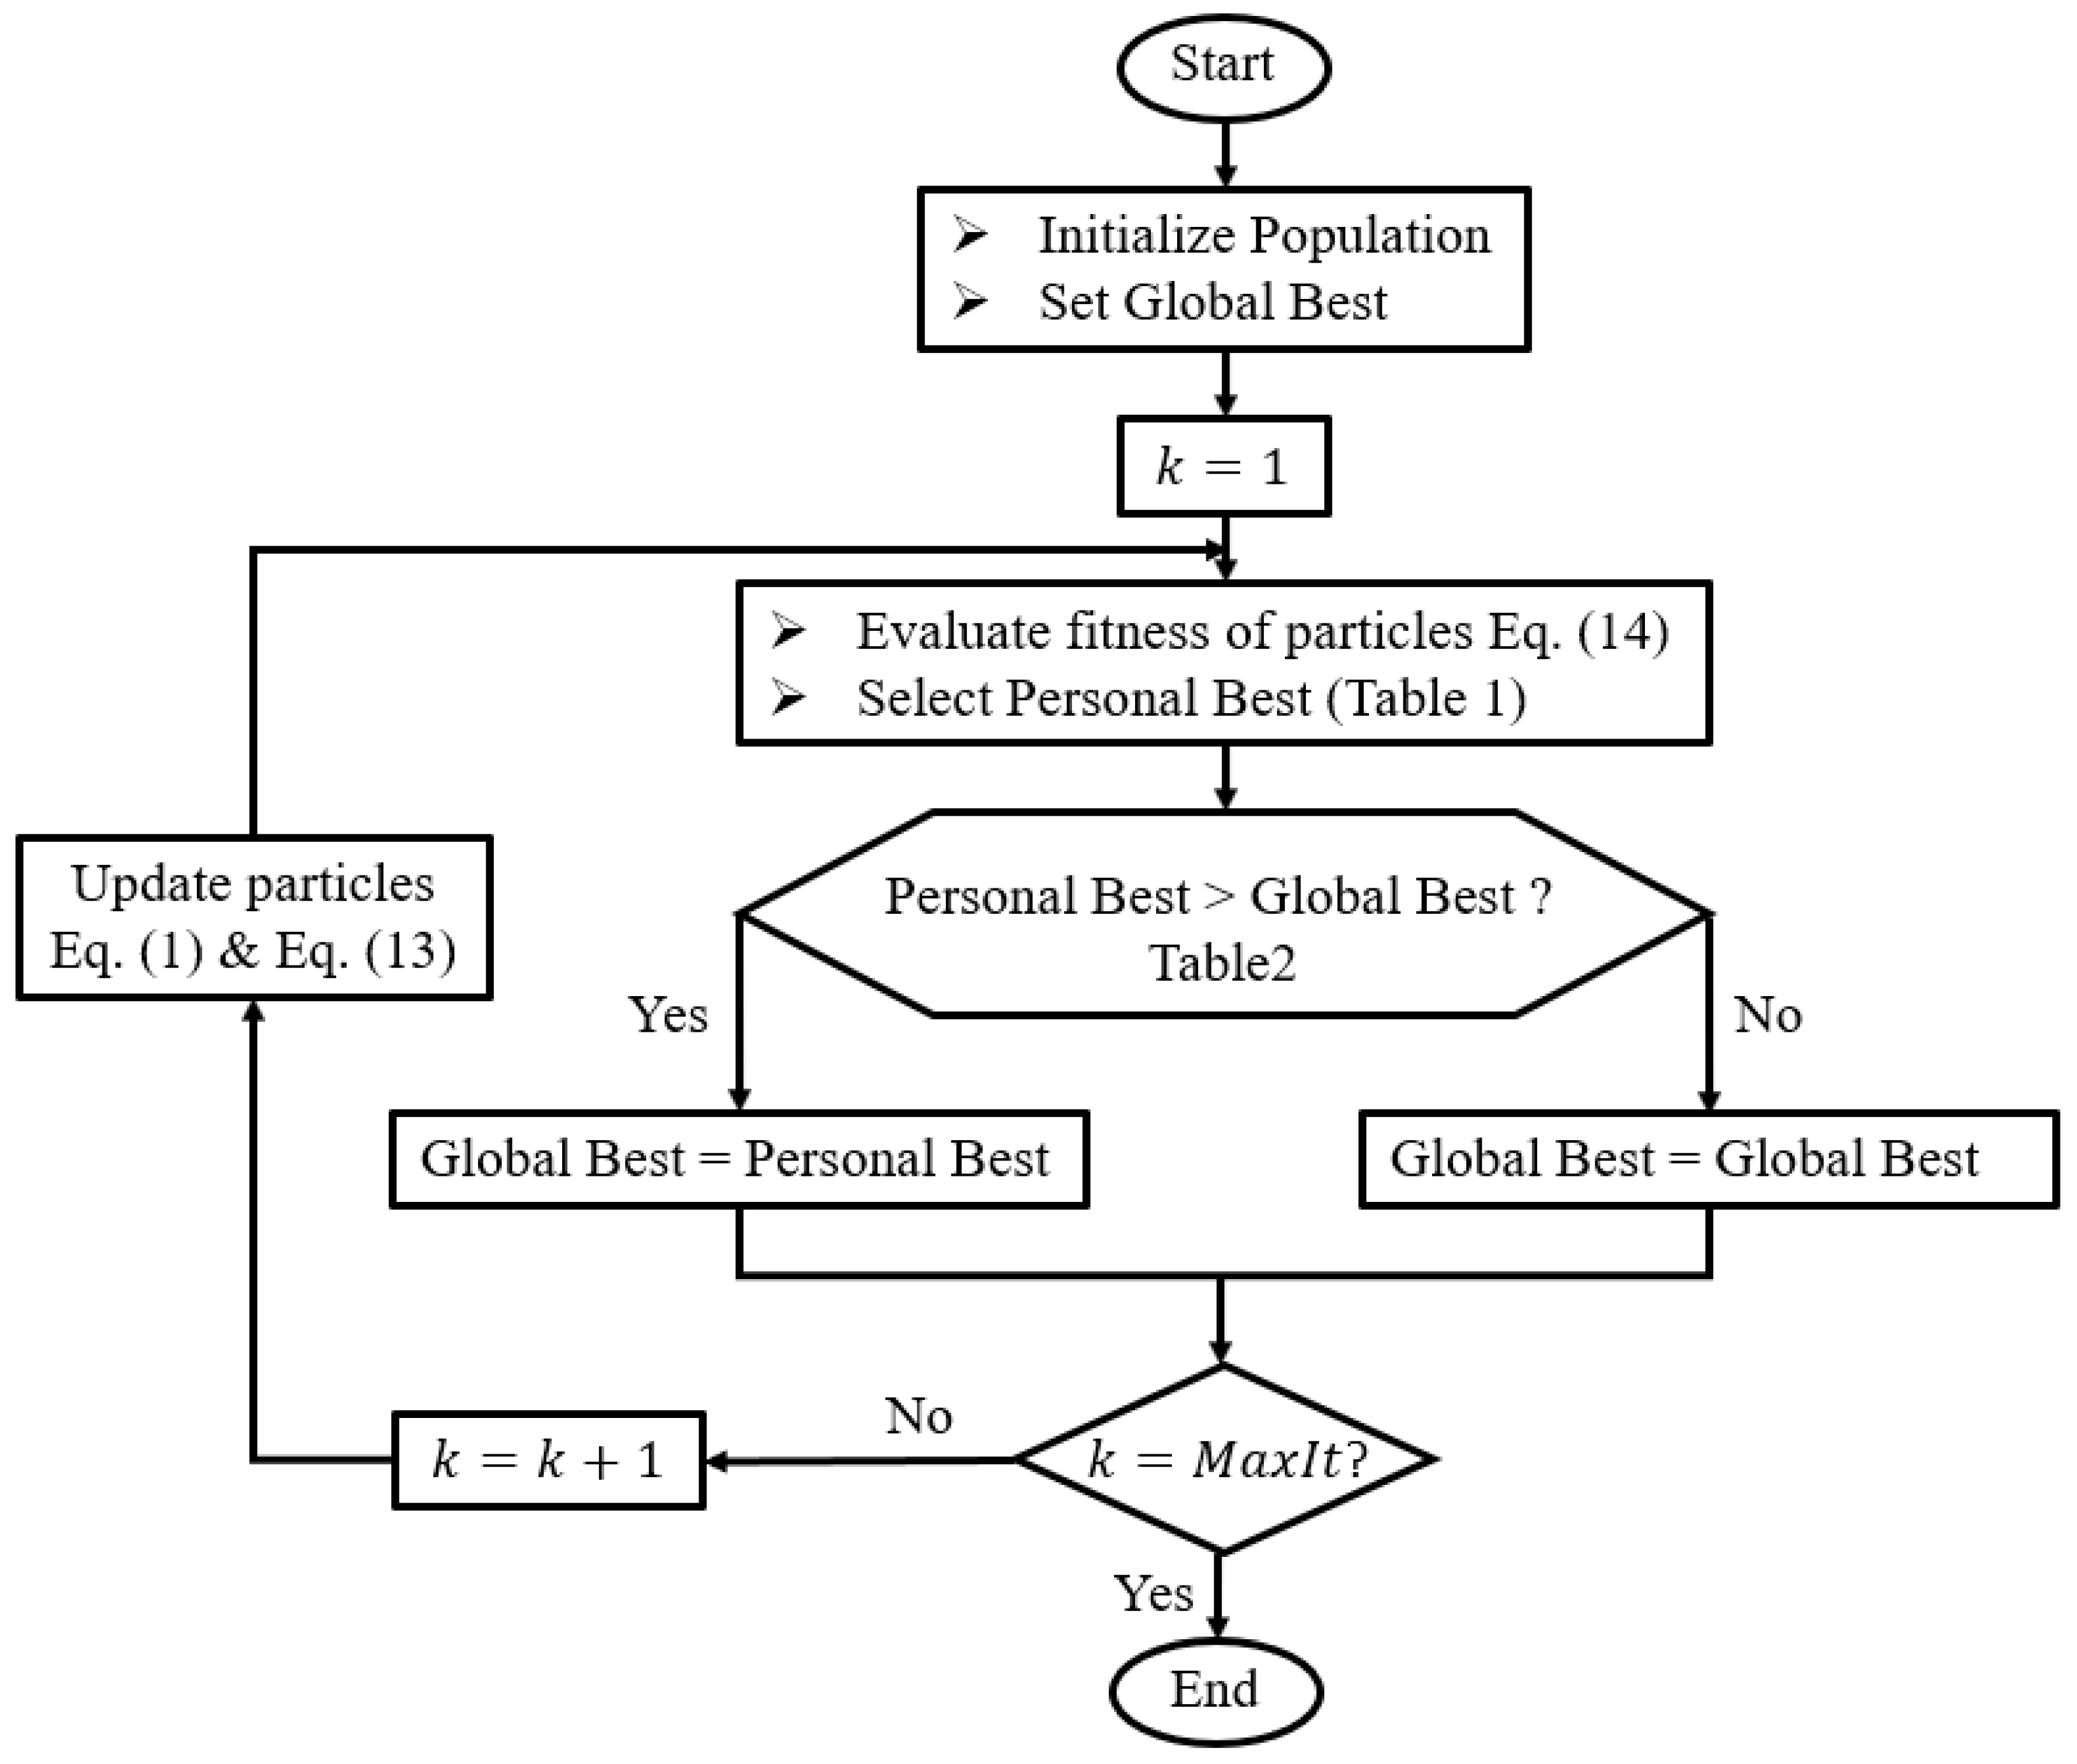
The proposed PSO-GD algorithm is summarized in the flow chart shown in Figure 4. Here, the population is initialized by selecting a population size. The best particle is initialized (assigned the worst possible values). At the first iteration, all particles in the population are evaluated, and the personal best particle in the population at this iteration is selected according to the rules in Table 1. This personal best particle is then compared to the global best solution, after which the global best is updated according to Table 2. The particles are updated using (1) and (13) for subsequent iterations, and the procedure above is repeated until the maximum number of iterations M a x I t are exhausted.

3. PVHC Estimation Problem Formulation and the PSO-GD Solution Approach

3.1. Problem Formulation

The PVHC estimation problem is formulated as a maximization problem in the form of mixed integer, non-linear programming (MINLP), shown in Equations (16)–(22) [13,15,20,21,22,24,39].
P V H C = max i = 1 N p v P p v , i
Subject to:
P n = m = 1 N V n V m G n m c o s δ n δ m + B n m s i n δ n δ m
Q n = m = 1 N V n V m G n m s i n δ n δ m B n m c o s δ n δ m
V m i n V n V m a x
Q m i n , n Q n Q m a x , n
S n m m i n S n m S n m m a x
P p v , i 0
where P p v , i : PV capacity; P n , Q n : nodal active and reactive power injections; V n : node voltage; Q m a x , n , Q m i n , n maximum and minimum PV inverter reactive power; V m a x , V m i n : allowable nodal voltage range; S n m : line apparent power flow in line n m ; G n m , B n m : conductance and susceptance of line n m ; n : index for node; N p v : total number of nodes with installed PV; N: total number of nodes in the network.
The objective function is defined as the sum of individual nodal PV installations, as given in (16). Equations (17) and (18) are the power balance constraints at each bus. Equations (19) and (22) are the bounding constraints. Please note that the proposed formulation considers the volt-var function of PV within the operable ranges defined in equation (20). Details on the var-var function are described in the next section.

3.2. Voltage-Var Control (VVC) by PV Inverter

The volt/var control function of the PV inverter is designed so that the voltage deviation can be compensated by means of the reactive power compensation technique [39]. Considering the negative sensitivity nature of voltage and reactive power, reactive power injection by the inverter is typically defined as Equation (23) and the guidelines of IEEE 1547 Standard for Interconnection and Interoperability of Distributed Energy Resources with Associated Electric Power Systems Interfaces [40].
Q i = Q m a x , i ,   V i < V m i n α i V i V d 1 ,   V m i n V i V d 1 0 ,   V d 1 V i V d 2 α i V i V d 2 ,   V d 2 V i V m a x Q m i n , i ,   V i > V m a x
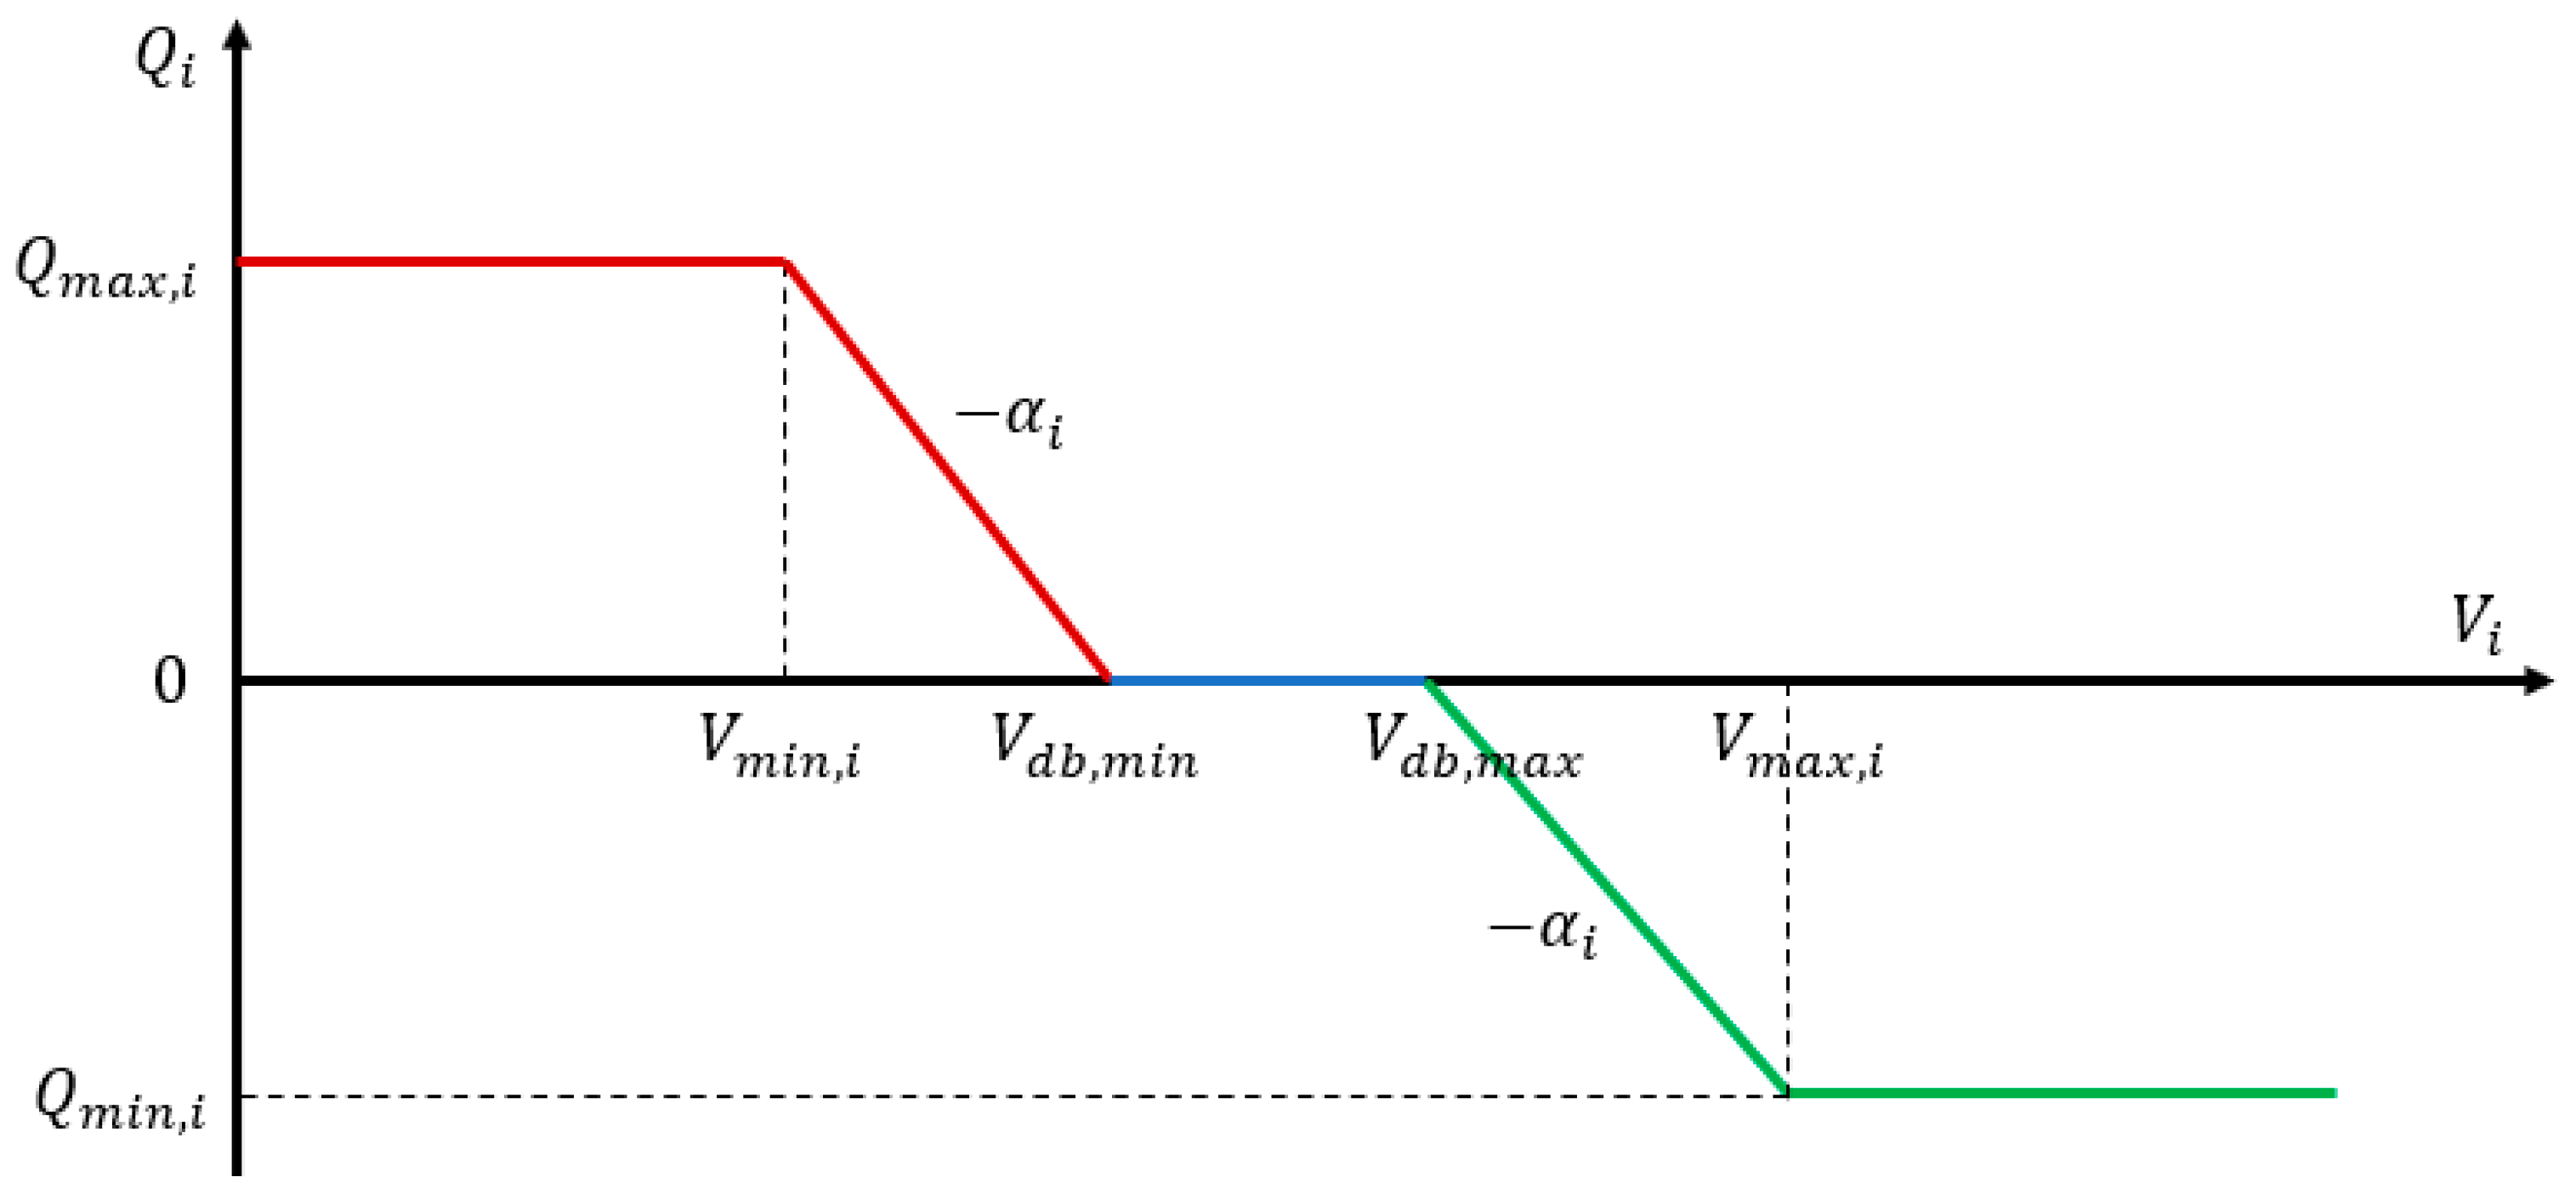
The slope of the PV inverter volt/var characteristic ( α i ) is given by (24). This characteristic is determined by the maximum allowable reactive power (as set by IEEE 1547 stated earlier) and the desired dead-band width.
α i = Q m a x V d 1 V m i n
Increasing the dead band reduces the sensitivity to changes in voltage but increases the response time to the changes. Conversely, reducing the dead band results in reduced response time to changes but increases sensitivity. Figure 5 shows the inverter volt-var characteristic curve. When the voltage is below the minimum requirement, reactive power is injected into the system, while if the voltage overshoots a prescribed limit, reactive power is absorbed by the inverter.
The voltage control horizon is between the minimum voltage V m i n , i and the maximum voltage V m a x , i , with reactive power control being limited between Q m i n , i for high voltages and Q m a x , i for low voltage controls.

3.3. Implementation of PSO-GD for Estimating DN’s PVHC

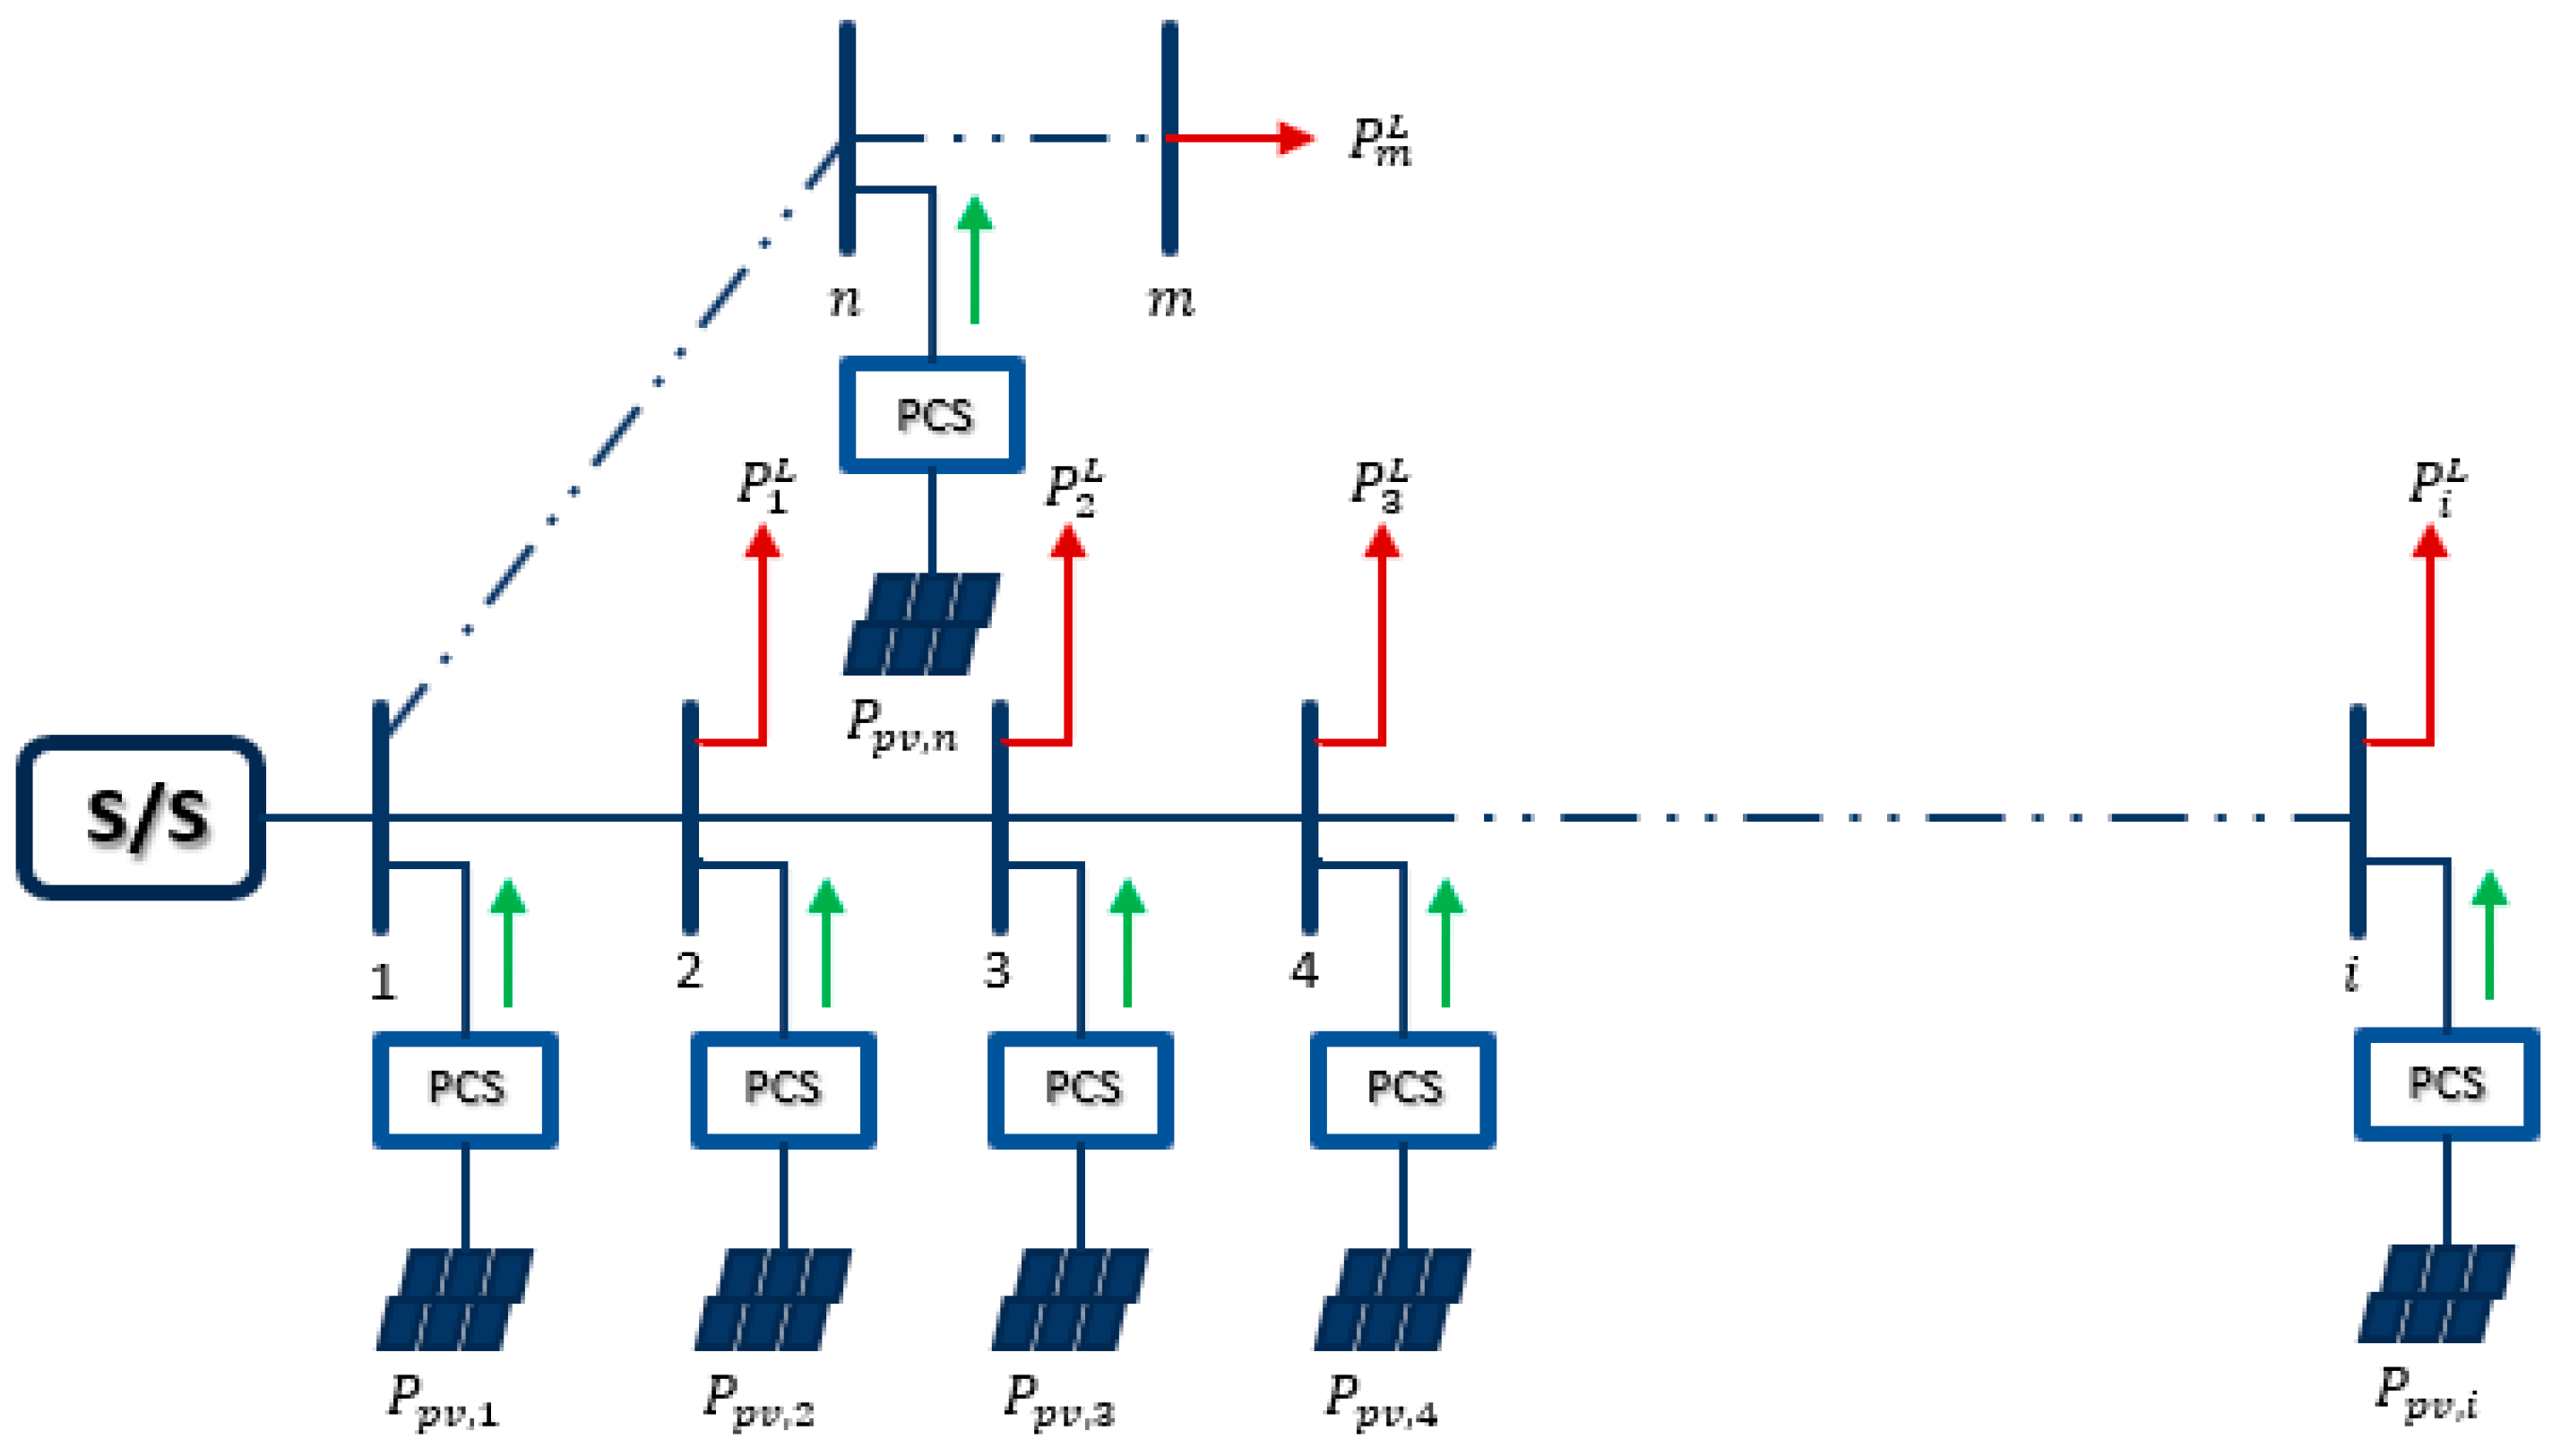
The typical configuration of a DN is shown in Figure 6. It has a distribution substation through which it is connected to the grid and contains several buses (nodes) to which loads and/or generators may be connected.
The implementation of PSO-GD begins with the initialization of a random set of PV output scenarios, as given in (25).
P V 1 , ( 0 ) P V 2 , ( 0 ) P V m , ( 0 ) = P p v , 1 1 , 0 P p v , 2 1 , 0 P p v , i 1 , 0 P p v , 1 2 , 0 P p v , 2 2 , 0 P p v , i 2 , 0 P p v , 1 m , 0 P p v , 2 m , 0 P p v , i m , 0
where P V m , ( 0 ) is the initial particle representing a certain PV installation scenario with P p v , i m , 0 components at i nodes. Except for the slack node, all nodes in the network are regarded as potential PV locations at the start of the PVHC estimation process.
Since the objective of PVHC is to obtain the maximum amount of PV that a DN can accommodate without risking violation of constraints, the objective evaluation of each initial particle F o b m , ( 0 ) is the sum of its constituent elements of (25), as given in (26).
F o b 1 , ( 0 ) F o b 2 , ( 0 ) F o b m , ( 0 ) = f ( P V 1 , ( 0 ) ) f ( P V 2 , ( 0 ) ) f ( P V m , ( 0 ) ) = P p v , 1 1 , 0 + P p v , 2 1 , 0 + P p v , i 1 , 0 P p v , 1 2 , 0 + P p v , 2 2 , 0 + P p v , i 2 , 0 P p v , 1 m , 0 + P p v , 2 m , 0 + P p v , i m , 0
A deterministic load flow (DLF) analysis is run for each particle considering the worst loading condition (lowest load) [20,21,22,23,24] to determine the state variables, constraint violations, etc. From the state variables, the gradient components for each particle are determined using (7)–(10).
Using (14), the fitness of each particle is evaluated, and the rules established in Table 1 and Table 2 are then used for determining the population’s best individual particle and the global best, respectively. After this, the iteration count is incremented, and the particles are updated using (12) and (13). Because locations with PV penetrations having lower gradients will have lower constraint violations, the PSO-GD algorithm, using the superiority of feasibility rules (Table 1 and Table 2), favors such nodes and has more lucrative PV installation areas. High PV sizes are assigned to these locations, while lower sizes will be given to the converse nodes. Hence, some locations will be eliminated on this pretext.
At the k -th iteration, Equations (25) and (26) are updated to (27) and (28), respectively.
P V 1 , ( k ) P V 2 , ( k ) P V m , ( k ) = P p v , 1 1 , k P p v , 2 1 , k P p v , i 1 , k P p v , 1 2 , k P p v , 2 2 , k P p v , i 2 , k P p v , 1 m , k P p v , 2 m , k P p v , i m , k
F o b 1 , ( k ) F o b 2 , ( k ) F o b m , ( k ) = f ( P V 1 , ( k ) ) f ( P V 2 , ( k ) ) f ( P V m , ( k ) ) = P p v , 1 1 , k + P p v , 2 1 , k + P p v , i 1 , k P p v , 1 2 , k + P p v , 2 2 , k + P p v , i 2 , k P p v , 1 m , k + P p v , 2 m , k + P p v , i m , k
At the final iteration, objective evaluation from (28) gives the global best solution, which is the PVHC.

4. Simulation Results and Discussions

The efficacy, validity, and robustness of the PSO-GD algorithm were tested on the IEEE 33-bus [38] and IEEE 69-bus radial distribution networks (RDN) to determine the optimal PV locations and sizes that can be installed into these networks and to validate the stability of the algorithm.
The proposed algorithm was implemented in the MATLAB environment, and simulations were conducted on a PC with a 64-bit dual core™ i9-9900K CPU @ 3.6 GHz and 64.00 GB RAM. For comparison, IMOEHO, QOTLBO, PSO-GA, and CTLBO [20,21,22,23,24] were also applied to the same RDN.

4.1. PVHC of IEEE 33 Bus Test RDN with/without VVC

The IEEE 33-bus RDN has a 5 MVA, 12.66 kV substation with a total active load of 3.715 MW and a lagging reactive power demand of 1.800 MVAr at 33 load points. Figure 7 shows the optimal locations of PV installations estimated using the PSO-GD algorithm.
Table 3 presents the installed PV sizes in the IEEE 33 bus network with and without the engagement of the inverter VVC.
The PVHC without inverter volt-var control is estimated at about 3273.97 kW, while that with inverter volt-var control is about 3460.19 kW. This represents a significant 186.22 kW (or 5.688%) increase in PVHC. The increase is because, with volt-var control, the inverter actively engages in ensuring that the node voltages are kept within the acceptable limits by injecting or absorbing reactive power when the voltages fall below or rise above the set limits, respectively. This, in turn, creates extra space for more PV installations without abrogating the voltage limit requirements.
Figure 8 shows the voltage profiles obtained for three principal cases: case (a) is the base case scenario of the IEEE 33-bus test DN with no PV installation; case (b) represents a scenario with PV installations but no VVC; and case (c) gives a scenario with PV and VVC engaged. As can be observed, in the base-case scenario, some node voltages are below the set voltage minimum boundary. In the two cases with PV installation, there is an improvement in the voltage profile such that in both cases, all the node voltages lie within the set boundaries.
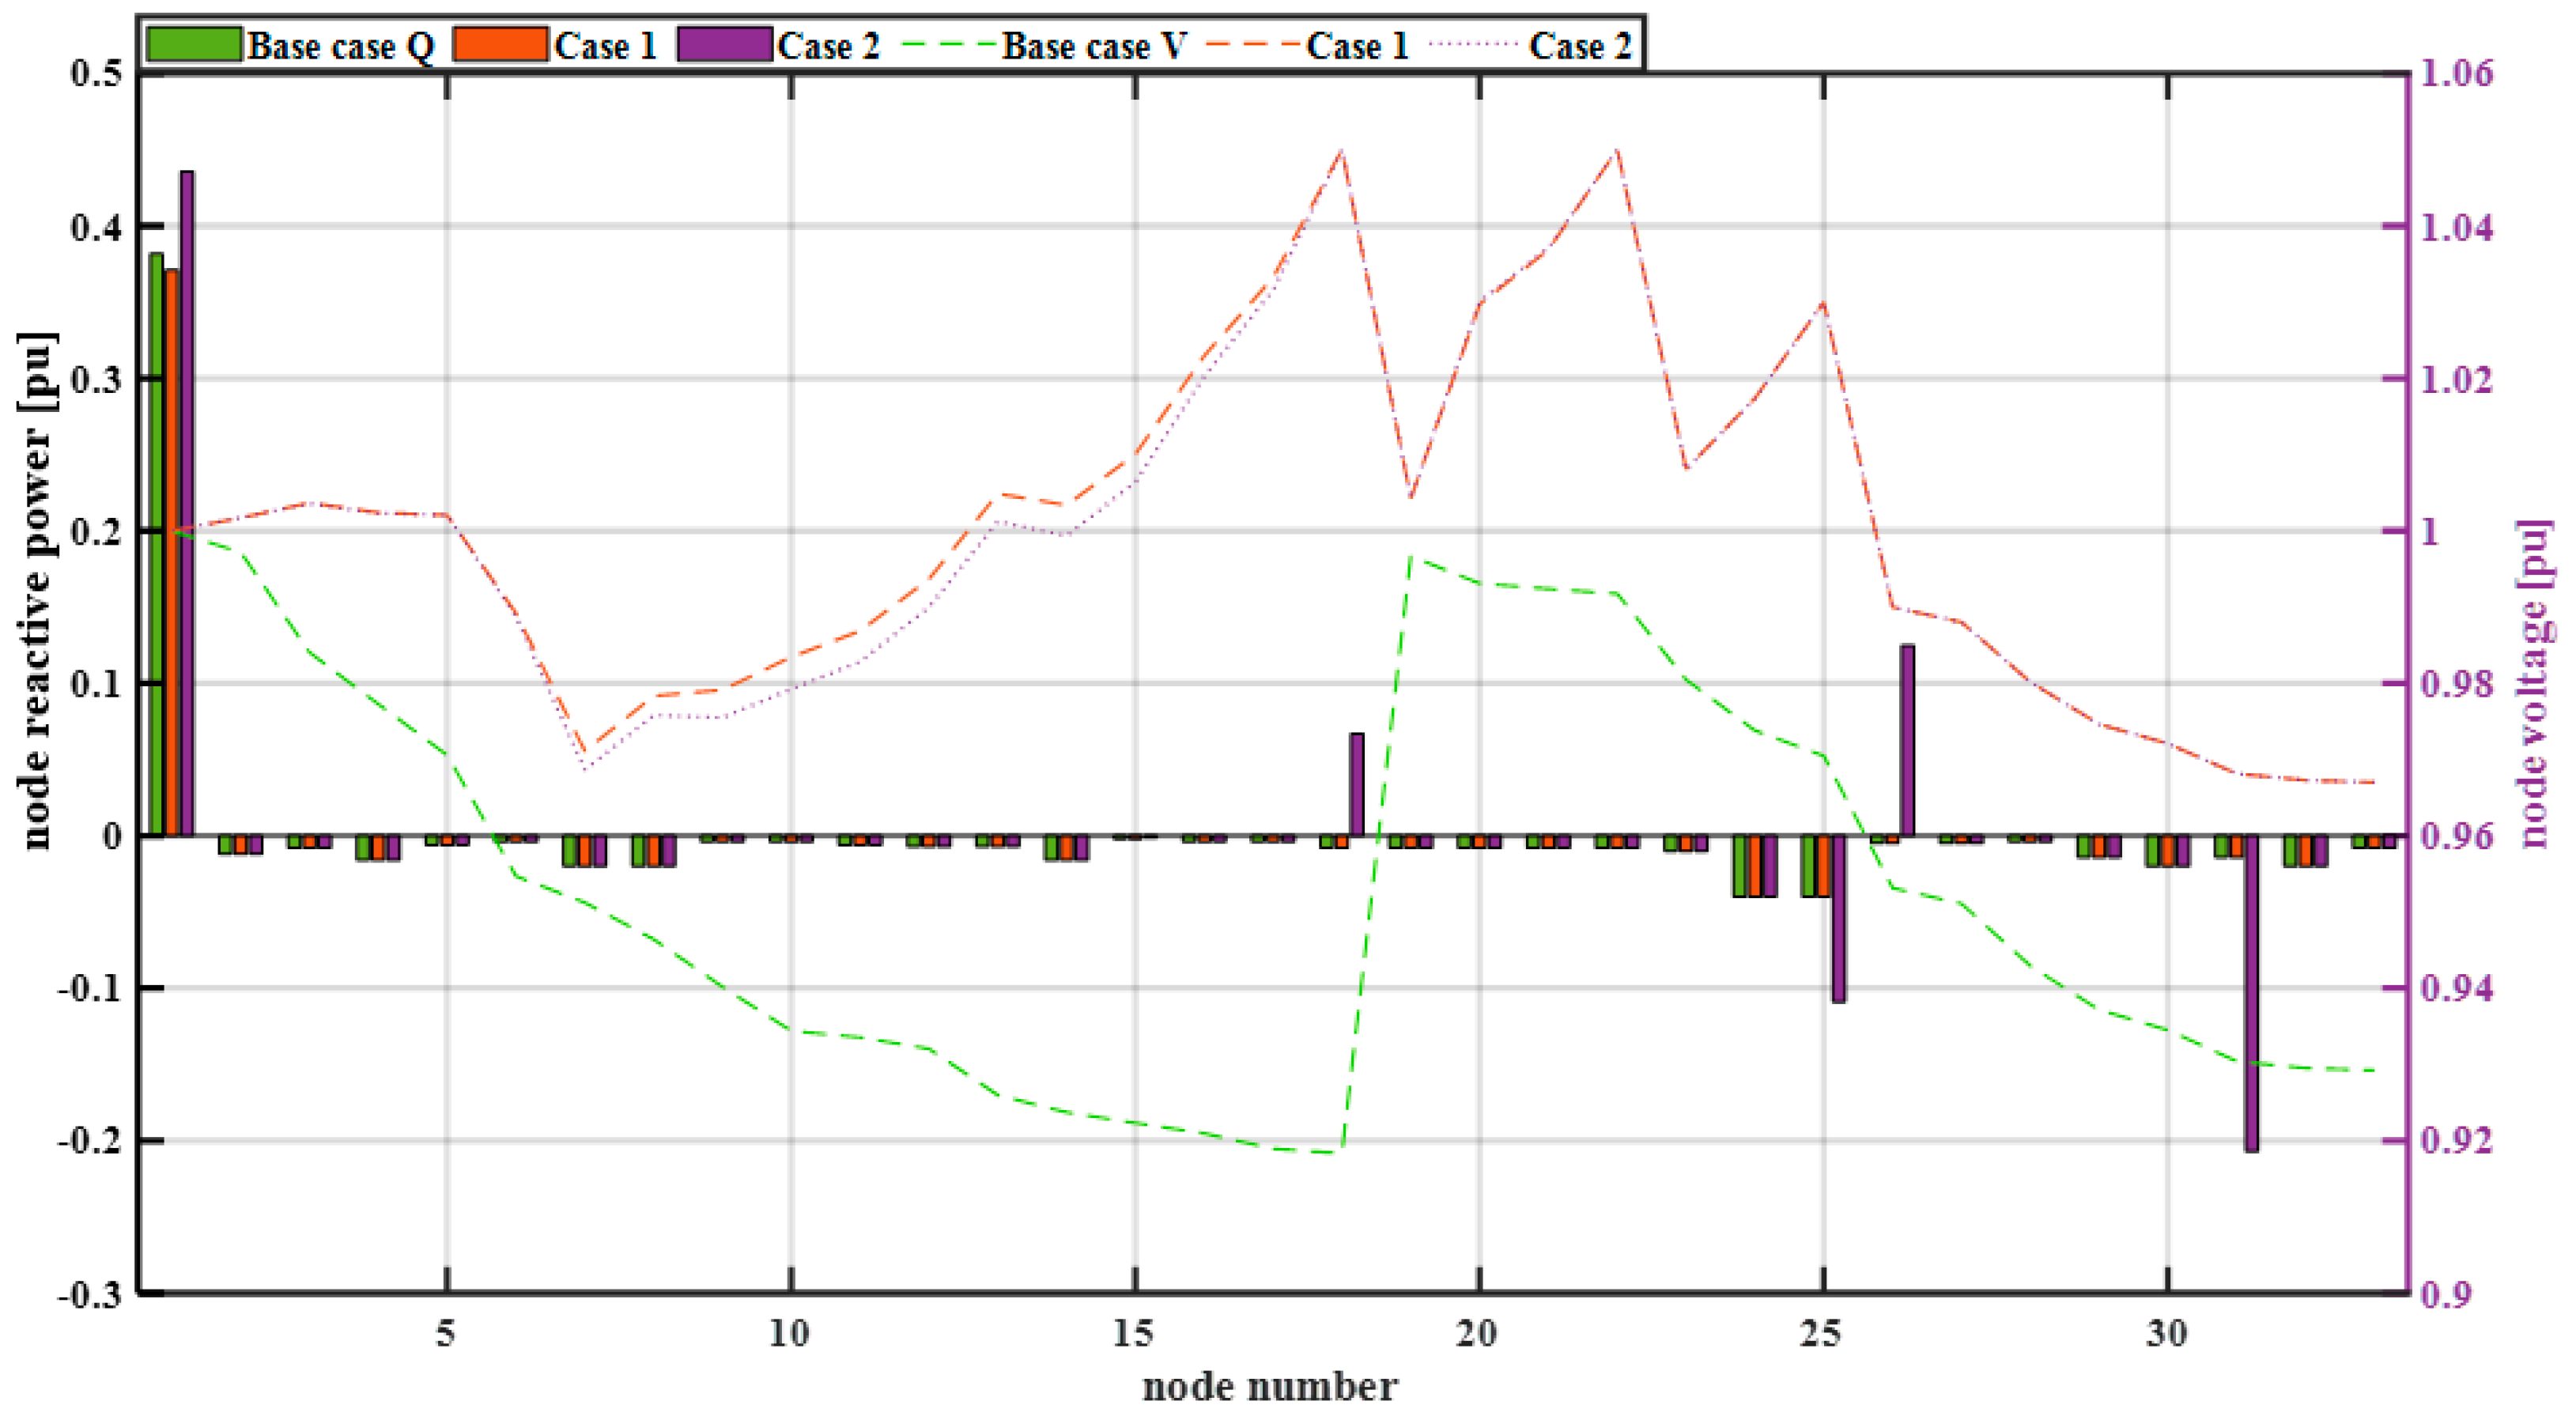
Figure 9 shows the variation of reactive power injections/absorptions at the nodes with PV injections. It also shows how the node voltages from the principal or base case influence the inverter with VVC functionality. On nodes with lower voltage from the base case scenario, reactive power is injected to support the voltage. The converse is done on nodes with higher voltages.
In case 1, the reactive power demand is 0.3711 pu compared to 0.3819 pu for the base case and 0.4375 pu in case 2. Thus, case 2 requires more reactive power from the slack node. This is because of increased reactive power absorption at nodes 26 and 31 to keep the voltages within acceptable limits. In all cases, the reactive power is kept within the acceptable limits of 0.5 Q n 0.5 pu.

4.2. Comparison of PSO-GD with Other Meta-Heuristic Methods

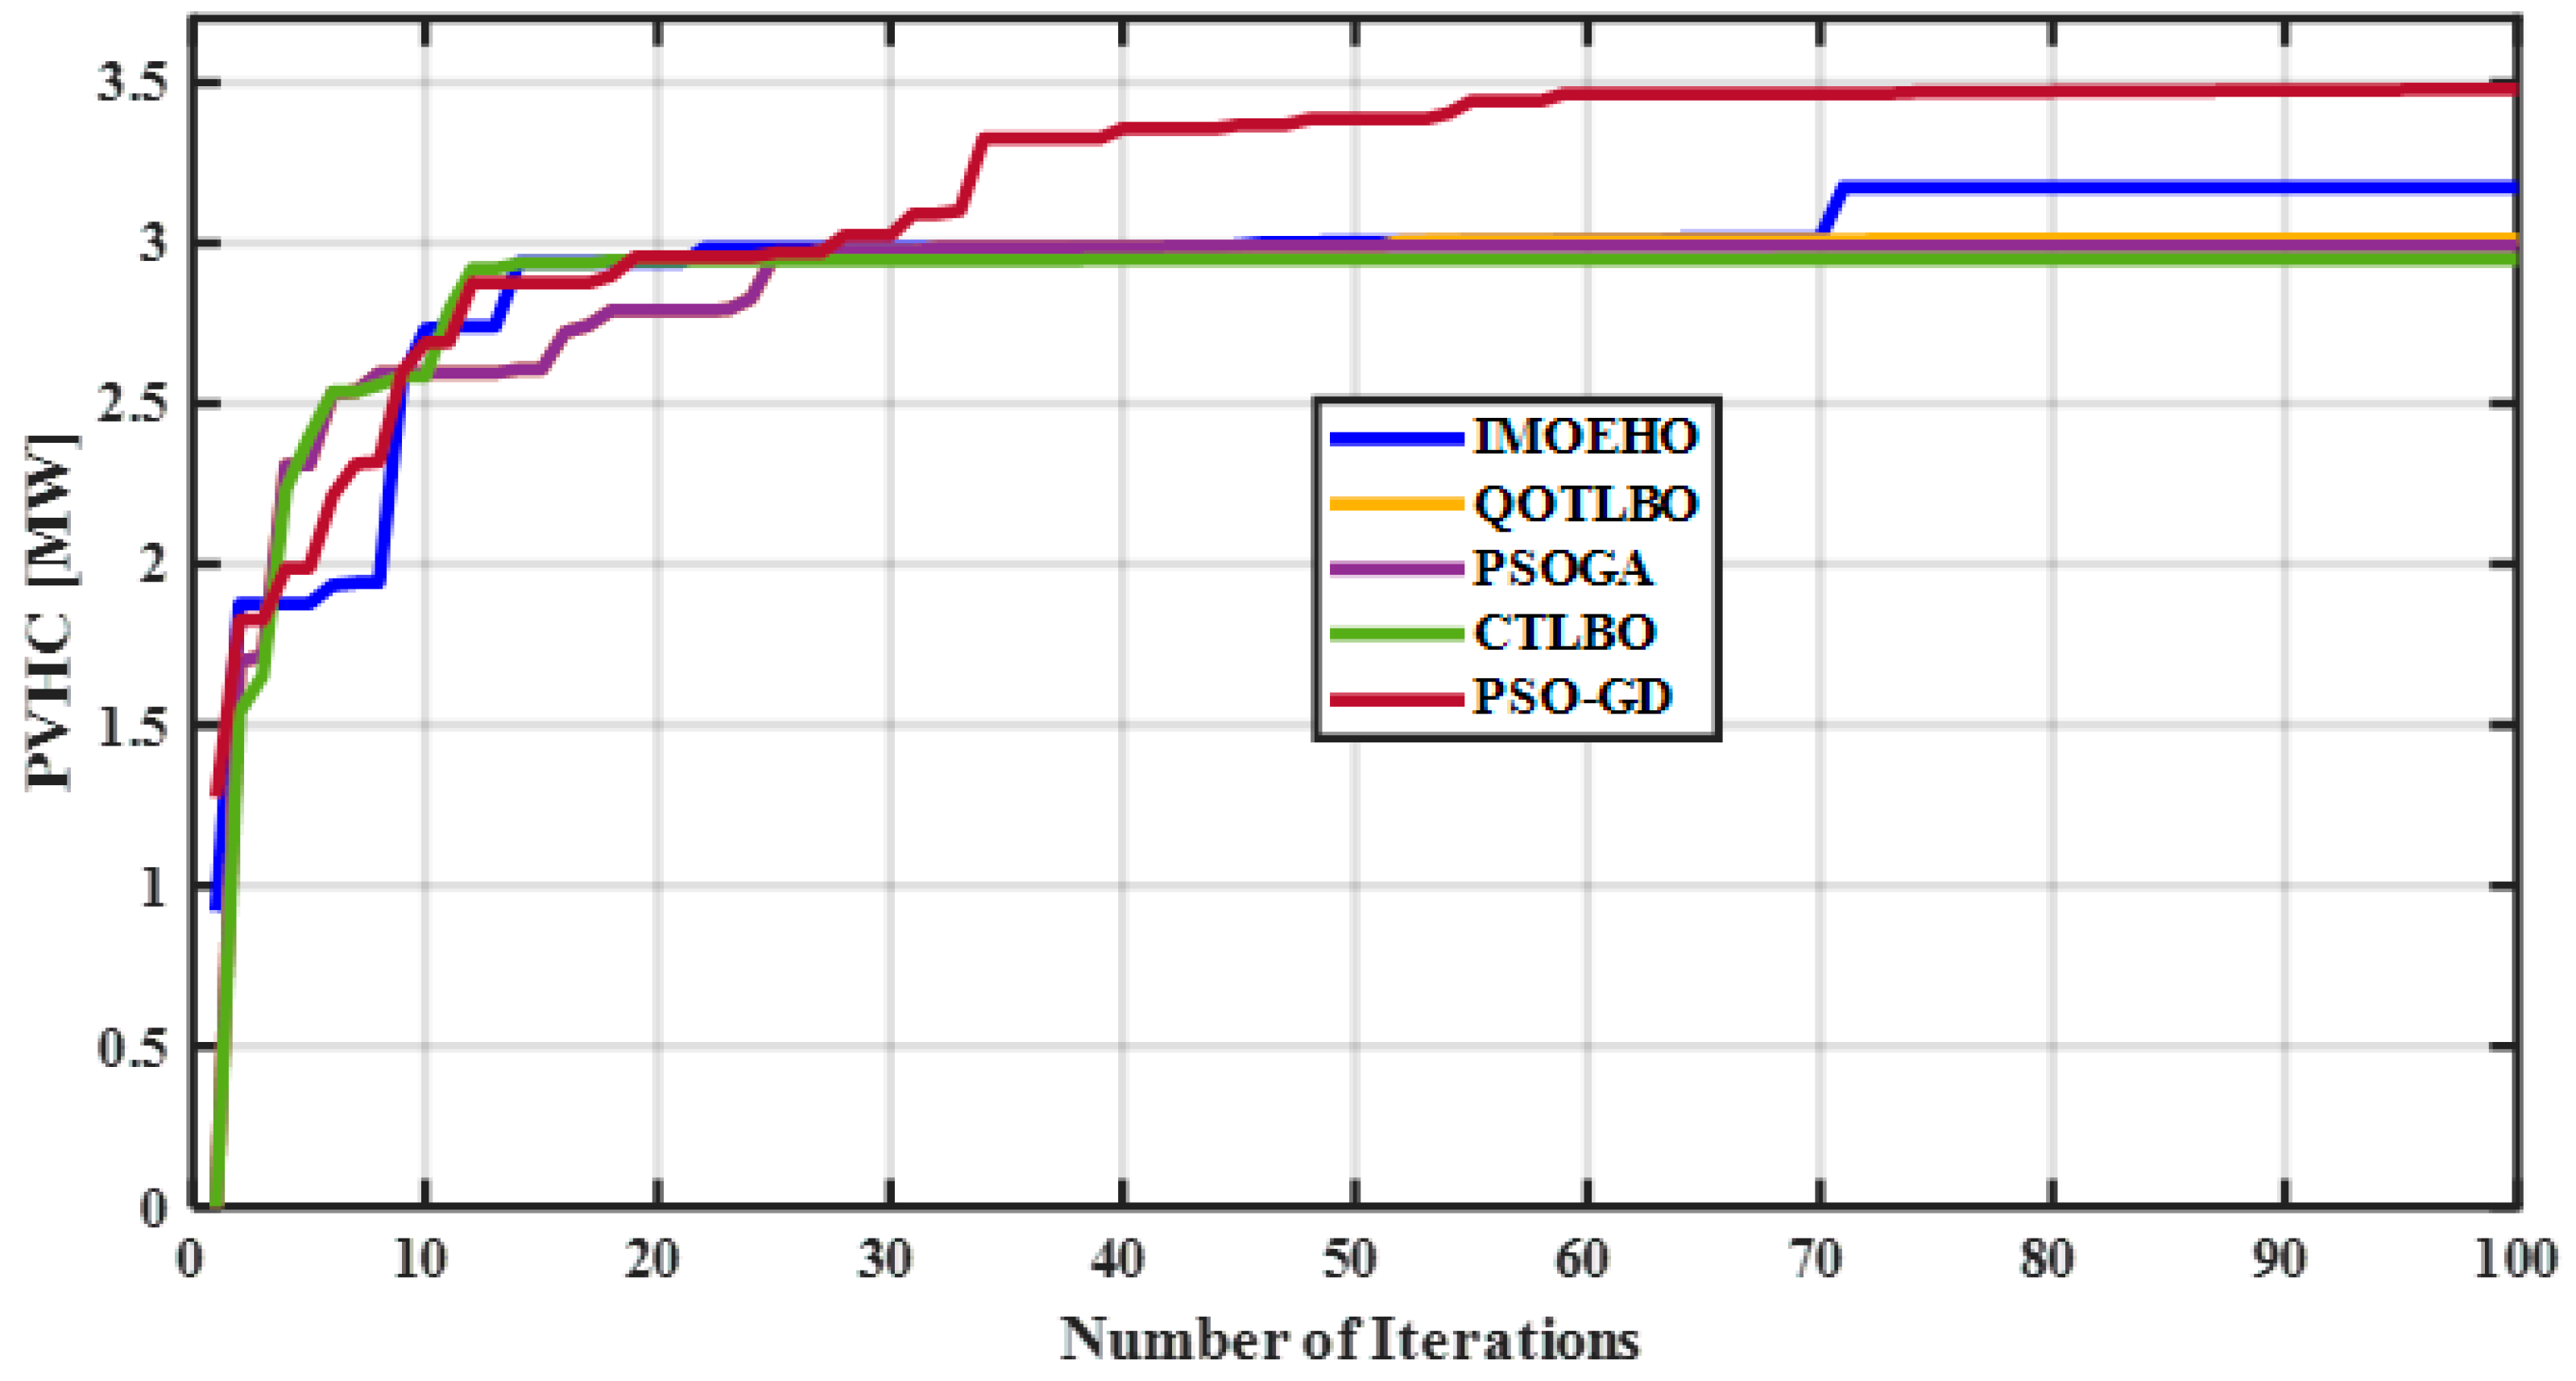
To ascertain the efficiency and depth of calculation of the proposed method, PVHC estimated using PSO-GD was compared against values obtained using IMOHEA [20], QOTLBO [21], CTLBO [22], and PSOGA [23], and Figure 8 shows the convergence plots of estimated PVHC values obtained using different meta-heuristic approaches. Table 4 shows the comparison of optimal PV installation locations and estimated PVHC values.
Because of its superior optima exploitation ability and diverse global search exploration, PSO-GD finds more PV locations suitable for installation and, therefore, results in more locations for PV installation being sought and a much higher PVHC estimate than the other approaches. The PVHC estimated by PSO-GD is 8.26%, 12.93%, 13.60%, and 14.75% better than IMOEHO, QOTLBO, PSO-GA, and CTLBO, respectively.
Figure 10 shows the convergence plots of estimated PVHC values obtained using different meta-heuristic approaches.
It is observed that QOTLBO, PSOGA, and CTLBO converge quickly, but they have lower PVHV values compared with PSO-GD and IMOEHO. This premature convergence is due to their inferior exploration of the solution search space. This is also manifested in the voltage profiles associated with each approach.
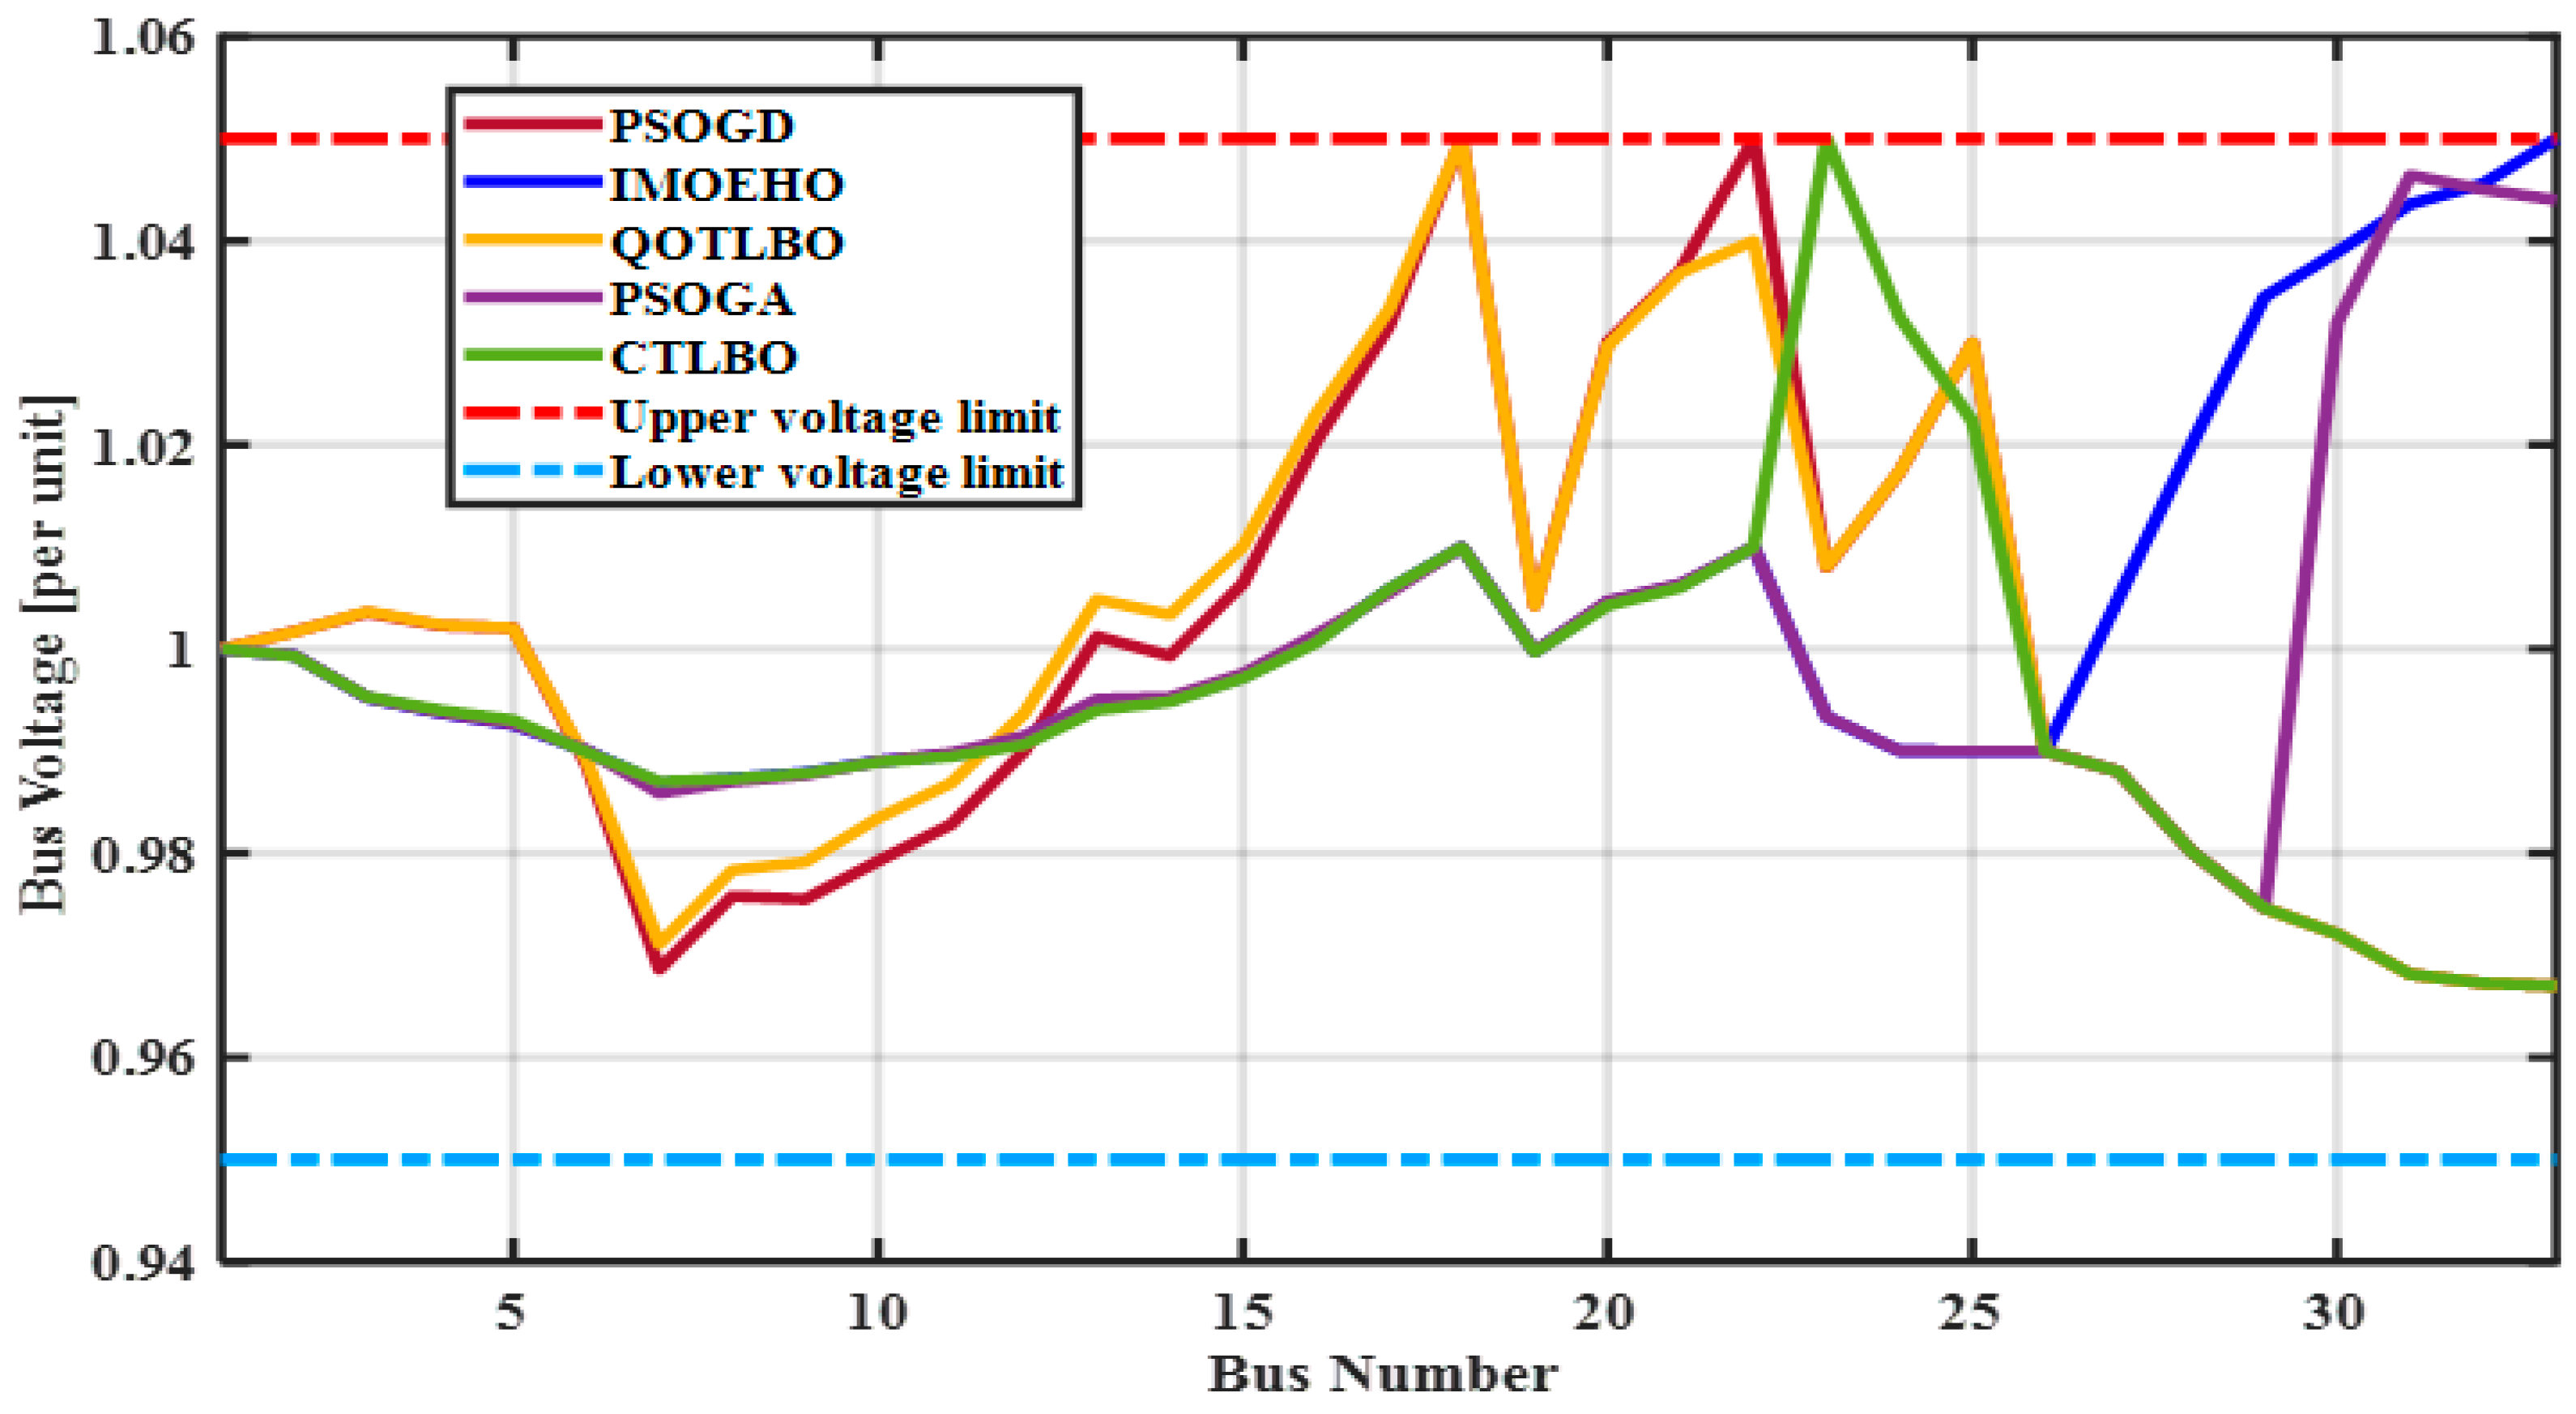
Figure 11 shows the voltage profiles obtained with the PVHC installation. For PSO-GD, IMOEHO, and QOTLBO, it can be observed that voltages at some buses reach the boundary values to ensure that maximum PV is injected into the network. However, PSO-GA and CTLBO converge prematurely, and their voltages do not reach the boundary values. This is the reason why their PVHC is so low compared to the other methods.

4.3. Stability Analysis of PSO-GD

One of the most important aspects of an optimizer is its computational stability. Stability refers to the optimizer’s ability to generate the same solution for the same problem, starting from different initial values [41]. The proposed PSO-GD algorithm was tested for stability on the IEEE 33 and 69 test RDN. Several simulations were run on the network to ascertain the algorithm’s robustness in retaining the same output starting from different initial values.
A 100-iteration simulation was run and repeated 25 times, starting from random positions for each simulation, to ascertain the stability and robustness of the algorithm. Figure 12 shows the fitness plots obtained when PSO-GD is applied to obtain the PVHC of the IEEE 69 bus test DN. It was observed that the final values of the fitness graphs converge to nearly the same PVHC.
A similar study was carried out for the IEEE 33-bus test DN. Figure 13 shows the final values of PVHC at the end of each run of PSO-GD for the two DNs.
The mean μ P V H C and standard deviation σ P V H C of the observed final PVHC for each of the 25 iterations performed on IEEE 33 and 69 DNs are summarized in Table 5.
With the standard deviations being 0.245% and 0.226% of the mean PVHC estimates for IEEE-33 and IEEE-69 bus test DN, respectively, the estimated values for each simulation only vary insignificantly. The larger standard deviation in the estimated PVHC observed in the IEEE-33 bus test network compared to the IEEE-69 bus test DN could be attributed to the higher demand coupled with more PV installation locations in the IEEE-33 bus compared with that of the IEEE-69 bus DN test network.
However, this difference in standard deviation from 0.245% (in the IEEE-33 bus) to 0.226% (in the IEEE-69 bus) of only 0.019% is insignificantly low. This means that the calculated values lie at a high-end precision level and, consequently, the PSO-GD algorithm is stable.

5. Conclusions

In this paper, a hybrid particle swarm optimization and gradient descent method (PSO-GD) for estimating the PV hosting capacity of a distribution network has been proposed. This algorithm combines the excellent exploration ability in the global search space of PSO in its generic form with the exceptional local optima exploitation exhibited by the gradient algorithm. The outcome is an efficient, robust, and stable optimization algorithm.
This algorithm was applied to the IEEE 33 bus test distribution network to estimate the PV hosting capacity of a distribution network. The numerical results obtained are compared with those obtained using four other meta-heuristic methods. The results show that the proposed algorithm gives a PVHC result that is 8.26% superior compared with the closest competitor, IMOEHO, with the furthest competitor, the CTLBO, having a result that is 14.75% inferior. Therefore, it was shown that the proposed algorithm is superior to the others. From the convergence plots for the methods used, it has been demonstrated that the proposed method not only produces a better result but also shows that it does not converge prematurely. In turn, this makes it less susceptible to being trapped in local optima.
Further, it was demonstrated that the proposed algorithm is stable by running it numerous times from different starting positions under different initial conditions. This was undertaken by engaging the IEEE-33 and IEEE-69 bus RDN, on which, for every run of 100 iterations, the result was approximately the same value. With the mean estimation at 3.4310 MW and a standard deviation of 0.0084 MW for the IEEE-33 bus, and 3.3105 MW and a standard deviation of around 0.0075 MW for the IEEE-69 bus test DN, the variance in the estimation is about 0.226–0.245%, which is quite small and could be neglected for most applications.
It has also been established that using smart inverters as voltage-regulating devices (through their volt-var control function) alongside their main functionality improves the network’s PV hosting capacity by a significant margin. As is evident from Table 4, there is a greater number of nodes opened for PV integration when the PV inverter volt-var facilities are engaged compared to the scenario when the facilities are not available. This translates into the PVHC increasing from 3273.97 kW in a case with no VVC to 3460.19 kW in a case where the VVC was used. This gives a remarkable 188.22 kW increase in PVHC or 5.69%.

Author Contributions

Conceptualization, Methodology: E.Z. and R.H., Software simulations: E.Z., Data curation, Validation R.H. and H.K., Writing, Original draft preparation, formal analysis: E.Z., review, and editing: R.H. and H.K., Analysis, Investigation: E.Z., R.H. and H.K., Resources mobilization, Visualization, draft review and editing, supervision: R.H. and H.K. All authors have read and agreed to the published version of the manuscript.

Funding

This research received no external funding.

Data Availability Statement

The data are available on request from the authors.

Conflicts of Interest

The authors declare no conflict of interest. There are no known competing financial interests or personal relationships that could have appeared to influence the work reported in this paper.

References

  1. Jacobson, M.Z.; Delucchi, M.A.; Cameron, M.A.; Manogaran, I.P.; Shu, Y.; Krauland, A.-K.V. Imapcts of Green New Deal Energy Plans on Grid Stability, Costs, Jobs, Health, and Climate in 143 Countries. One Earth 2019, 1, 449–463. [Google Scholar] [CrossRef]
  2. Gielen, D.; Boshell, F.; Saygin, D.; Bazilian, M.D.; Wagner, N.; Gorini, R. The Role of Rennewable Energy in the Global Energy Transformation. Energy Strategy Rev. 2019, 24, 38–50. [Google Scholar] [CrossRef]
  3. Hamidreza Sadeghian, Z.W. A Novel Impact-assessment Framework for Distributed PV installations in low-voltage Secondary Networks. Renew. Energy 2020, 147, 2179–2194. [Google Scholar] [CrossRef]
  4. Schmela, M.; Hermetsberger, W.; Chianetta, G. Global Market Outlook for Solar-Power 2020–2014; SolarPower Europe: Brussels, Belgium, 2020. [Google Scholar]
  5. Mulenga, E.; Bollen, M.H.J.; Etherden, N. Solar PV Stochastic Hosting Capacity in Distribution Networks Considering Aleatroy and Epistemic Uncertainties. Int. J. Electr. Power Energy Syst. 2021, 130, 106928. [Google Scholar] [CrossRef]
  6. Bollen, M.H.J.; Häger, M. Power Quality: Interactions between Distributed Energy Resources, the Grid and Other Customers. In Proceedings of the 1st International Conference on Renewable Energy Sources and Distibuted Energy Resources, Brussels, Belgium, 1–3 December 2004. [Google Scholar]
  7. Bertini, D.; Moneta, D.; Carneiro, J.S.d.A. Hosting Capacity of Italian LV Distribution Networks. In Proceedings of the CIRED: 21st International Conference on Electricity Distribution, Frankfurt, Germany, 6–9 June 2011. [Google Scholar]
  8. Breker, S.; Claudi, A.; Sick, B. Capacity of Low-Voltage Grids for Distributed Generation: Classification by Means of Stochastic Simulations. IEEE Trans. Power Syst. 2015, 30, 689–700. [Google Scholar] [CrossRef]
  9. Prusty, R.; Jena, D. A critical Review on Probabilistic Load Flow Studies in Uncertainty Constrained Power Systems with Photovoltaic Generation and a New Approach. Renew. Sustain. Energy Rev. 2017, 69, 1286–1302. [Google Scholar] [CrossRef]
  10. Behravesh, V.; Keypour, R.; Foroud, A.A. Stochastic Analysis of Solar Rooftop and Wind Hybrid Generation Systems and Their Impact on Voltage behavior in Low Voltage Distribution Systems. Sol. Energy 2018, 166, 317–333. [Google Scholar] [CrossRef]
  11. Mulenga, E.; Bollen, M.H.J.; Etherden, N. A review of Hosting Capacity Quantification Methods for Photovoltaics in Low-Voltgae Distribution Grids. Electr. Power Energy Syst. 2020, 115, 105445. [Google Scholar] [CrossRef]
  12. Munikoti, S.; Abujubbeh, M.; Kumarsinh Jhala, B.N. A Novel Framework for Hosting Capacity Analysis with Spacio-Temporal Probabilistic Voltage Sensistivity Analysis. Int. J. Electr. Power Energy Syst. 2022, 134, 107426. [Google Scholar] [CrossRef]
  13. Zulu, E.; Hara, R.; Kita, H. A Flexible Stochastic PV Hosting Capacity Framework Considering Network over-Voltage Tolerance. Energy Rep. 2023, 9 (Suppl. S1), 529–538. [Google Scholar]
  14. Dubey, A.; Santoso, S. On Estimation and Sensitivity Analysis of Distribution Circuit’s Photovoltaic Hosting Capacity. IEEE Trans. Power Syst. 2017, 32, 2779–2789. [Google Scholar] [CrossRef]
  15. Samet, H.; Khorshidsavar, M. Analytic Time-series Load Flow. Renew. Sustain. Energy Rev. 2018, 82, 3886–3899. [Google Scholar] [CrossRef]
  16. Emmanuel, M.; Rayudu, R. The Impact of Single-phase Grid-connected Distributed Photovoltaic Systems on the Distribution Network using P-Q and P-V Models. Electr. Power Energy Syst. 2017, 91, 20–33. [Google Scholar] [CrossRef]
  17. Ismael, S.M.; Aleem, S.H.A.; Abdelaziz, A.Y.; Zobaa, A.F. Sate-of-the-Art of Hosting Capacity in Modern Power Systems with Distributed Generation. Renew. Energy 2019, 130, 1002–1020. [Google Scholar] [CrossRef]
  18. Heslop Simon, I.M.J.F.S.L. Method for Determining a PV Generation Limit on Low-Voltage Feeders for Evenly Distributed PV and Load. Energy Procedia 2014, 57, 207–216. [Google Scholar] [CrossRef] [Green Version]
  19. Stetz, T.; Kraiczy, M.; Diwold, M.B.K.; Bletterie, B.; Mayr, R.B.C.; Noone, B. High penetration PV in Local Distribution Grids-Outcomes of the IEA PVPS Task 14 Subtask 2. In Proceedings of the 29th European Photovotaic Solar Energy Conference and Exhibition (EU PVSEC 2014), Amsterdam, The Netherlands, 22–26 September 2014. [Google Scholar]
  20. Meena, N.K.; Parashar, S.; Swarnkar, A.; Gupta, N.; Niaz, K.R. Improved Elephant Herding Optimization for Multiobjective DER Accomodation in Distribution Systems. IEEE Trans. Ind. Inform. 2018, 14, 1029–1039. [Google Scholar] [CrossRef]
  21. Sultana, S.; Ror, P.K. Multi-objective Quasi-oppositional Taeching-Learning based Optimization for Optimal Location of Distributed Generator in Radial Distribution Systems. Electr. Power Energy Syst. 2014, 63, 534–545. [Google Scholar] [CrossRef]
  22. Quadri, I.A.; Bhowmick, S.; Joshi, D. A Comprehensive Technique for Optimal Allocation of Distributed Energy in Radial Distribution Systems. Appl. Energy 2018, 211, 1245–1260. [Google Scholar] [CrossRef]
  23. Morad, M.H.; Abedini, M. A Combination of Genetic Algorithm and Particle Swarm Optimization for Optimal DG Location and Sizing in Distribution Systems. Electr. Power Energy Syst. 2012, 34, 66–74. [Google Scholar] [CrossRef]
  24. Ali, M.; Keerio, U.; Laghari, J.A. Optimal Site and Size of Distributed Generation Allocation in Radial Distribution Network Using Multi-Objective Optimi-zation. Mod. Power Syst. Clean Energy 2021, 9, 404–415. [Google Scholar] [CrossRef]
  25. Alanazi, M.; Memon, Z.A.; Mosavi, A. Determining Optimal Power Flow Solutions Using New Adaptive Gaussian TLBO Method. Appl. Sci. 2022, 12, 7959. [Google Scholar] [CrossRef]
  26. Santos, A.; Deckmann, S.; Soares, S. A Dual Augmented Lagrangian Approach for Optimal Power Flow. IEEE Trans. Power Syst. 1988, 3, 1020–1025. [Google Scholar] [CrossRef] [PubMed]
  27. Hermann, D.W.; William, T.F. Optimal Power Flow Solutions. IEEE Trans. Power Appar. Syst. 1968, PAS-87, 1866–1876. [Google Scholar]
  28. Rusell, E.; James, K. Particle Swarm Optimization. In Proceedings of the IEEE Conference on Neural Networks (ICNN’95), Perth, Australia, 27–1 December 1995. [Google Scholar]
  29. Craig, R.W. Flocks, Herds, and Schools: A Distributed Behavioral Model. Comput. Graph. 1987, 21, 25–34. [Google Scholar]
  30. El-Hawary, M.E.; Lee, K.Y.; El-Sharkawi, M. Modern Heuristic Optimization Techniques: Theory and Applications to Power Systems; IEEE Press: Piscataway, NJ, USA, 2008; pp. 71–87. [Google Scholar]
  31. Rusell, E.; James, K. A Discreet Binary Version of the Particle Swarm Optimization Algorithm. In Proceedings of the 1997 Conference on Systems, Manufacturing, and Cybernetics (SMC’97), Gaithersburg, MD, USA, 22–25 September 1997. [Google Scholar]
  32. Yoshida, H.; Kawata, K.; Fukuyama, Y.; Shinichi Takayama, Y.N. A Particle Swarm Optimization for Reactive Power and Voltage Control Considering Voltage Security Assessment. IEEE Trans. Power Syst. 2001, 15, 1232–1239. [Google Scholar] [CrossRef] [Green Version]
  33. Khosla, T.; Verma, O.P. An Adaptive Hybrid Particle Swarm Optimizer for Constrained Optimization Problem. In Proceedings of the International Conference in Advances in Power, Signal and Information Technology, Bhubaneswar, India, 8–10 October 2021. [Google Scholar]
  34. Zaman, H.R.R.; Gharehchopogh, F.S. An Improved Particle Swarm Optimization Algorithm for Solving Continous Optimization Problems. Eng. Comput. 2021, 10, 136. [Google Scholar]
  35. Noel, M.M. A New Gradient-based Particle Swarm Optimization Algorithm for Accurate Computation of Global Minimum. Appl. Soft Comput. 2012, 12, 353–359. [Google Scholar] [CrossRef]
  36. Adam, C.; Rafic, Y.; Jean, P.; Adrian, I. A Constraint-Handling Technique for Genetic Algorithms Using a Violation Factor. J. Comput. Sci. 2016, 12, 350–352. [Google Scholar]
  37. Priem, R.; Bartoli, N.; Diouane, Y.; Sgueglia, A. Upper Trust Bound Feasibility Criterion for Mixed Constrained Bayesian Optimization with Application to Aircraft Design. Aerosp. Sci. Technol. 2020, 105, 105980. [Google Scholar] [CrossRef]
  38. Noureen, A.; Mashwani, W.K.; Rehman, F.; Sagheer, M.; Shah, H.; Asim, M. Constrained Optimization Based on Hybrid Version of Superiority of Feasibility Solution Strategy. Soft Comput. 2022, 26, 8117–8132. [Google Scholar] [CrossRef]
  39. Teke, G.; Kim, C.-H.; Samuel, A.; Kim, J.-S.; Song, J.-S. Optimal Smart Inverter Control for PV and BESS to Improve PV Hosting Capacity for DN using Slime Mould Algorithm. IEEE Accsess 2021, 9, 52164–52176. [Google Scholar]
  40. Narang, J.; Berdner, J.; Boemer, J.C.; Enayati, B.; Fox, B.; Siira, M.; Vartanian, C.K. IEEE 1547 Standard for Interconnection and Interoperability of Distributed Energy Re-Sources with Associated Electric Power Systems Interfaces; IEEE Press: Piscataway, NJ, USA, 2020. [Google Scholar]
  41. Khaire, U.M.; Dhanalakshami, R. Stability Investigation of Improved Whale Optimization Algorithm in Feature Selection. IEEE Trans. 2020, 39, 286–300. [Google Scholar] [CrossRef]
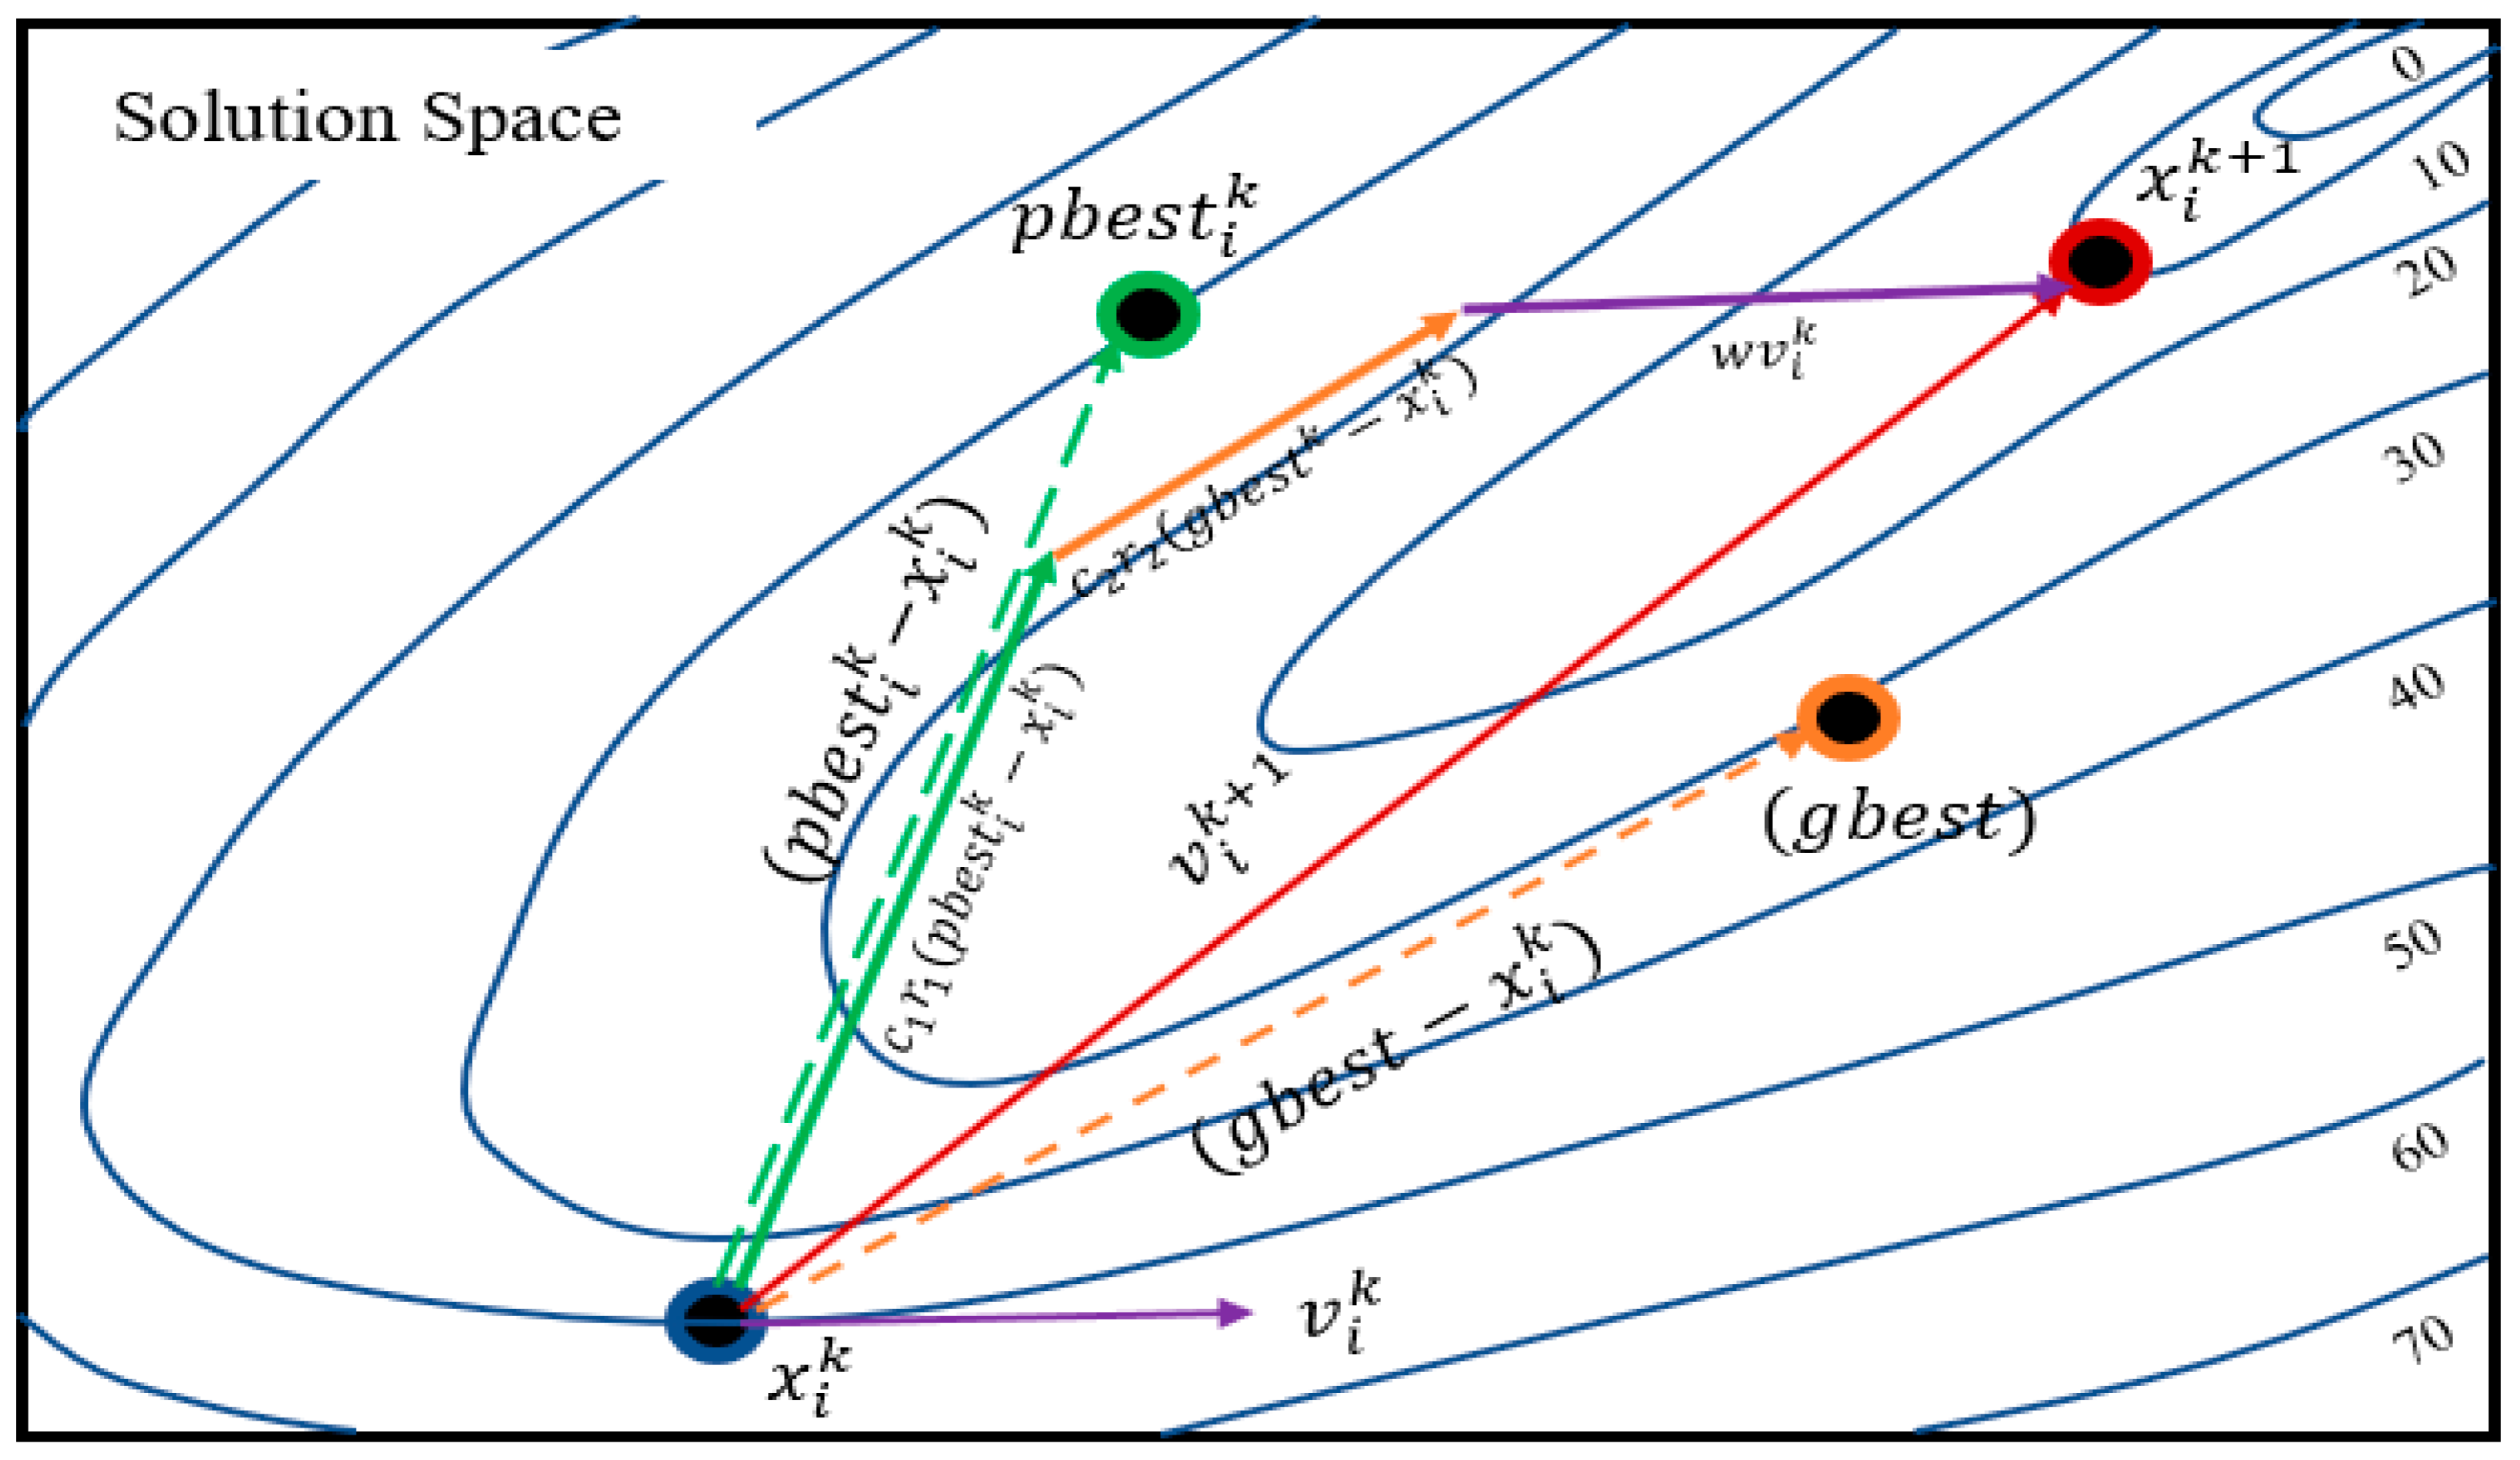
Figure 1. Movement of particles in generic PSO to search for global optima. x i k is the position of particle i at iteration k , which is updated by the velocity v i k + 1 (red) directed to the p b e s t (green) and g b e s t (orange) with random weighting coefficients and the initial particle velocity v i k (purple). The blue lines are contours for optimum positions with their objective evaluations (right).
Energies 16 05207 g001
Figure 2. Solution search mechanism in the gradient descent algorithm. The red arrows indicate the gradient of the objective function. The green arrows are the steepest gradient descent directions orthogonal to the contours (blue) of the solution search space.
Energies 16 05207 g002
Figure 3. Mechanism of particle movement in the hybrid PSO-GD method. The velocity component (beige) is resized and redirected using the gradient (purple) of the objective function. The final velocity vector (red) is a vector sum of the personal best vector (green), the global best vector (orange), and the GD vector (blue).
Energies 16 05207 g003
Figure 4. Flowchart for the PSO-GD algorithm for the selection of personal and global best particles.
Energies 16 05207 g004
Figure 5. PV inverter volt-var characteristic curve. Red lines indicate the reactice power injection phase, blue line indicates the dead-band and green line is the reactive power absorption phase.
Energies 16 05207 g005
Figure 6. Typical configuration of radial power DN with loads (red arrows) and PV generators. Direction of PV/inverter power flow (green arrows). PCS is PV inverter, i ,   n ,   m are notations for the nodes, P p v , 1 P p v , i are installed PV sizes at nodes, P 1 L . P i L are the respective loads at the nodes. S/S is the substation.
Energies 16 05207 g006
Figure 7. Single-line diagram of the IEEE-33 bus network with optimal locations for PV installations (red dots) as obtained by the PSO-GD algorithm.
Energies 16 05207 g007
Figure 8. Voltage profiles of the IEEE 33 bus network. Voltage profile for: (1) base case with no PV (green), (2) case with PV installation without inverter VVC (orange), (3) case with PV and VVC (purple).
Energies 16 05207 g008
Figure 9. Variation of node reactive power for (1) the base case (green) without PV installation, (2) case 1 (orange)—with PV installation but no VVC, and (3) case 2 (purple)—with PV installation and VVC.
Energies 16 05207 g009
Figure 10. PVHC estimates obtained for IEEE 33 test RDN by PSO-GD (red), IMOEHO (blue), QOTLBO (orange), PSO-GA (purple), and CTLBO (green).
Energies 16 05207 g010
Figure 11. Voltage profiles of the IEEE-33 bus test distribution network obtained using PSO-GD (red), IMOEHO (blue), QOTLBO (orange), PSO-GA (purple), and CTLBO (green).
Energies 16 05207 g011
Figure 12. Fitness graphs obtained using PSO-GD for PV hosting capacity estimation of the IEEE 69 bus test distribution network.
Energies 16 05207 g012
Figure 13. PVHC values of IEEE-33 bus (blue) and IEEE-69 bus (red) test DNs for optimizer stability analysis.
Energies 16 05207 g013
Table 1. Superiority of the feasibility procedure for selecting personal best.
Selection of the Personal Best Particle in the Population at Iteration k
A particle is superior to another if:
  • It is feasible while the one being compared with is not.
  • Both particles are feasible, but the particle has a better fitness evaluation than the one it is being compared to.
  • Both particles have the same feasibility and fitness value, but the particle has a lower absolute objective function gradient than the one it is being compared with.
  • Both particles have the same feasibility, fitness value, and absolute objective function gradient, but the particle has less constraint violations than the other particle.
Table 2. Superiority of the feasibility procedure for selecting the global best.
Selection of the Global Best Particle
A personal best particle is superior to global best particle if:
  • It is feasible and the global best is not.
  • Both particles are feasible, but the personal best particle has a better fitness evaluation than the global best.
  • Both particles have the same feasibility and fitness value, but the personal best particle has a lower absolute objective function gradient.
  • Both particles have the same feasibility, fitness value, and absolute objective function gradient, but the personal best particle has less constraint violations than the other.
  • The personal best solution becomes the global best solution if it satisfies 1–4. Otherwise, the global best solution is retained.
Table 3. Installed PV sizes in kW estimated using PSO-GD with/without inverter VVC.
Location
(Node #)
Installed PV [kW]
Without VVCWith VVC
7566.31606.56
15776.16832.62
18645.23672.14
25370.11374.52
26189.38209.72
31726.78764.63
TOTAL3273.973460.19
Table 4. Optimal locations for PV installation and estimated PVHC.
MethodPV LocationsHosting Capacity [MW]
CTLBO13, 25, 302.9511
PSO-GA11, 16, 322.9910
QOTLBO12, 24, 293.0142
IMOEHO7, 14, 25, 313.1760
PSO-GD7, 18, 22, 25, 26, 313.4619
Table 5. Mean and standard deviation in PV hosting capacity estimated by PSO-GD over 25 simulations.
Test Case μ P V H C [MW] σ P V H C [MW]
IEEE-33 bus3.43100.0084
IEEE-69 bus3.31050.0075
Disclaimer/Publisher’s Note: The statements, opinions and data contained in all publications are solely those of the individual author(s) and contributor(s) and not of MDPI and/or the editor(s). MDPI and/or the editor(s) disclaim responsibility for any injury to people or property resulting from any ideas, methods, instructions or products referred to in the content.