Article

Numerical Investigation of the Two-Phase Closed Thermosyphon Operating with Non-Uniform Heat Flux Profiles

1
Department of Mechanical, Aerospace and Civil Engineering, The University of Manchester, Manchester M13 9PL, UK
2
Independent Researcher, Manchester M22 4ES, UK
*
Author to whom correspondence should be addressed.
Energies 2023, 16(13), 5141; https://doi.org/10.3390/en16135141
Submission received: 30 May 2023 / Revised: 26 June 2023 / Accepted: 27 June 2023 / Published: 3 July 2023

Abstract

:
The two-phase closed thermosyphon (TPCT) or wickless heat pipe has been widely considered as an extremely effective and low-cost heat removal device for various applications. A computational fluid dynamics (CFD) investigation of the TPCT can provide detailed information regarding its design and development. In this study, the effect of non-uniform heat-input profiles on a vertical TPCT has been investigated. A CFD model has been built to simulate the evaporation and condensation processes within the TPCT investigated, using a solver based on OpenFOAM which has been modified and validated against experimental data reported in the open literature. Four non-uniform heating profiles of the TPCT have been investigated, and the effects these have on the internal flow field within the pipe are discussed. Simulation results show that the non-uniform heat flux profiles can impact thermal performance depending on the overall heat loading and the heat flux profile.

1. Introduction

Two-phase closed thermosyphons (TPCT) can passively and efficiently transport heat from one place to another utilising gravity to return the condensate. TPCTs primarily transport heat via latent heat, making them highly effective and reliable heat transfer devices. Compared with conventional heat pipes, the removal of the wick layer in thermosyphons significantly reduces its manufacturing cost and enhances its reliability. Hence, TPCTs have been proposed and employed in a variety of practical applications, including waste heat recovery, turbine blade cooling, nuclear reactors, transportation systems, and energy-efficient buildings [1,2,3,4,5].
The thermal performance of TPCTs can be affected by a variety of factors. Among them, the incline angle and filling ratio have been widely investigated, and many studies have been devoted to find optimum values. For a macro-scale water-charged TPCT, the optimum inclination angle is usually found at 90° (vertical) [6,7]. However, the optimum value may vary from 90° to 30° when changing the working fluid properties and filling ratio [8,9,10]. As a design concern, the liquid pooling at the bottom may dash into the condenser as the tube is inclined, leading to heat transfer mechanisms in the condenser comprising not only vapour condensation, but also liquid convection, resulting in improved heat transfer [9]. On the other hand, in an inclined TPCT where bubbles tend to accumulate near the upper evaporator wall, partial dry-out phenomenon may appear, thereby increasing the evaporator temperature and degrading the thermal performance of the TPCT. Another factor that can influence the performance is the filling ratio, commonly defined as the ratio of the liquid volume to the evaporator volume. An optimally charged TPCT has the shortest response time and lowest thermal resistance. For an underfilled thermosyphon, the liquid pool is fully vaporised before the condensate film returns, while an overfilled thermosyphon has a thicker condensate film that can lead to a higher thermal resistance [11]. The proper range of filling ratio is determined as a function of a series of design factors, including working fluid properties, heat input, pipe dimensions [12], and operating pressure [13,14]. For the macro-scale TPCT charged with water, the optimum filling ratio may vary from 0.20 to 0.65 [6,9,10,15].
From the above studies, it is seen that the heat transfer mechanism and flow patterns inside the thermosyphon are affected by various design parameters, determining the thermal performance. In practical operation circumstances, instead of ideal uniformly distributed heat load, profiles of non-uniform heat input are frequently encountered such that the thermal performance of a TPCT may substantially deviate from that assumed under uniform constant heat input. For example, in a solar heater, the solar flux is highly concentrated [16]. On the other hand, it has been reported that a non-uniform heat input can lead to significant impact on the void fraction distribution and the critical heat flux in boiling flows [17,18]. Some of the past investigations on pulsating heat pipes (PHPs) show that a non-uniform heating distribution will increase the temperature gradient along the evaporator, thereby reducing the operational reliability [19,20]. On the other hand, there is also a possibility that a non-uniform heat input could help flow circulation to result in improved thermal performance [21,22]. There is also experimental evidence demonstrating that a non-uniform heat flux profile applied to a water-charged heat pipe can lead to a major enhancement in its thermal conductivity [23]. However, the effect of non-uniform heat load on a TPCT appears not to have received much consideration in the literature, despite the comparatively large length of such units. The influence of non-uniform profiles of heat input on TPCT performance therefore requires further insight and study to optimise performance.
The main object of this study is to investigate the heat transfer mechanism of the evaporator of a vertical TPCT operating with non-uniform profiles of heat input. For this purpose, an original solver based on OpenFOAM v2012, interCondensatingEvaporatingFoam, has been extended for the simulation of TPCTs. The following section will introduce the CFD model employed for the simulation. Subsequently, a discussion will be provided for cases where a vertical gravity-assisted TPCT has been numerically simulated subject to profiles of constant and non-uniform heat fluxes. The computed temperature data have been recorded and compared with the experimental data available in the open literature for validation. From the computed results, the mechanisms by which the non-uniform heating profile affect the thermal performance of a TPCT are studied.

2. Model Description

The Eulerian framework is used in this work to describe the vapour–liquid system, while the volume of fluid (VOF) approach is applied here to capture the interfaces between the vapour and liquid phases. This approach assumes that each control volume is filled with a mixture of fluids, with the volume fraction α employed to represent the volumetric ratio of each phase within the control volume, and the sum of the fraction for both phases being uniform. A phase transport equation is solved for the distribution of liquid volume fraction α l , and the fraction of the vapour phase is obtained simply as α v = 1 α l . Both phases are assumed to be incompressible fluids as flow velocities are low. The physical properties of the mixture are then computed as volume fraction-weighted values. Furthermore, the fluid motion within the thermosyphon is governed by conservation of continuity, momentum, and energy.
The liquid phase volume fraction equation can be expressed as
α l t + U α l α l U = α l α c o e f f m ˙ v l m ˙ l v + α c o e f f m ˙ v l
α c o e f f = 1 ρ l α l ( 1 ρ l 1 ρ v )
where α l represents the volume fraction of liquid, ρ l and ρ v respectively denote the densities of the liquid phase and vapour phase, m ˙ v l and m ˙ l v are the mass transfer rates arising from condensation and evaporation, respectively. In this study, these two terms are calculated using the expressions given by [24]
m ˙ v l = C c α v ρ v T s a t T T s a t   ,     w h e n   T s a t > T                     0 ,                               w h e n   T s a t T
m ˙ l v = C e α l ρ l T T s a t T s a t   ,     w h e n   T s a t < T                     0 ,                             w h e n   T s a t T
C denotes the relaxation parameter while subscripts s a t , c and e denote saturation, condensation, and evaporation, respectively. According to previous studies [25,26,27], a value of 0.1 is recommended for the evaporation relaxation parameter C e for water pool boiling.
Within a wickless heat pipe or closed thermosyphon that is operating at a steady state, the overall evaporation rate should be symmetric to the overall condensation rate due to the conservation of mass. Therefore, to maintain this overall balance, the coefficient C c in Equation (3) is dynamically updated each time step, using the following formulation:
C c = [ m ˙ l v α v ρ v T s a t T T s a t 1 ]
where C c represents the new condensation relaxation parameter. The summation is over all the cells in the flow domain. This calculation is performed at each time step during the pressure–velocity correction to maintain the mass transfer balance within the TPCT.
The mixture momentum equation is
ρ U t + ρ U U U ρ t + ρ U μ e f f U T 2 3 U I μ e f f U = σ κ α l g h ρ p r g h
In the equation above, ρ denotes the density of the mixture, I is the identity tensor, h is the position vector, σ κ α l gives surface tension force, p r g h is the non-hydrostatic pressure. The surface tension coefficient σ is modelled as a function of the local temperature, as given in [28] and κ represents the curvature of interfaces. μ e f f represents the sum of the mixture dynamic viscosity and turbulent dynamic viscosity. The k ω SST turbulence model is employed in this study to account for turbulent effects.
The mixture energy equation is
ρ C p T t + ρ C p T U k e f f T = T s
T s = m ˙ l v m ˙ v l L
k e f f = k + ρ C p μ t P r t
where L , k , μ t , and P r t are the latent heat, thermal conductivity of the mixture, turbulent dynamic viscosity, and the turbulent Prandtl number, respectively. T s denotes the source term contributed by the interfacial mass transfer. k e f f is effective thermal conductivity, defined as the sum of mixture molecular thermal conductivity and turbulent thermal conductivity.

3. Simulation Method

3.1. Geometry Information

The TPCT modelled here is based on the TPCT built in [29], and the dimensions of the geometry are shown in Figure 1. In the experiment [29], a water-charged TPCP was built and tested. The evaporator was wrapped with electric wires, while a water jacket was used to cool the condenser section. Due to the limitations of temporal cost and computational resources, the grid used in simulations was built based on a planar two-dimensional geometry. The pipe wall can be considered as thin (0.9 mm), and so conduction effects within the solid wall of the tube were ignored.

3.2. Boundary Conditions

In the experimental work reported by [29], the external wall temperatures were measured by five thermocouples installed at heights of 0.02 m, 0.07 m, 0.12 m, 0.25 m, and 0.35 m. The average uncertainties of the thermocouples used and the power applied are quoted ±0.38 K and ±1.65 W, respectively.
The present work selects two heat inputs, 39.52 W and 60.18 W for the simulation of uniformly heated cases, subsequently employing these heat inputs to investigate the effects of non-uniform heating profiles. The condenser wall temperature is simulated using a mixed Robin-type boundary condition, which requires the convective heat transfer coefficient and the ambient temperature. The convective heat transfer coefficients are calculated according to the expression
h c o n v = Q o u t A c T c T a
where Q o u t is the heat removed by the coolant flow, A c is the surface area of the condenser wall, T c and T a represent the condenser wall temperature and the cooling water inlet temperature, respectively. The parameters appearing on the right-hand side of Equation (10) are obtained from [29], and the heat fluxes are computed via the heat power associated with the inner-wall surface area, as listed for the two cases considered here in Table 1. The walls at the top and the bottom are considered adiabatic. The fill ratio is fixed at 65%, implying that 65% of the evaporator was initially filled with water, while the rest of the region is vapour. The fluids are saturated initially at a temperature of 373 K and the pressure at 1 × 10 5 Pa. There is no significant change in the average pressure within the TPCT during the subsequent flow development.
To explore the effects of non-uniform heating, four non-uniform heating profiles that may be encountered in practical circumstances were applied to the evaporator while keeping the overall heat load constant, as illustrated in Figure 2. For each heating pattern, two cases were considered: one in which the maximum heat flux deviation, defined as the ratio of the maximum local heat flux increment or decrement vis-a-vis the uniform constant flux was 10%, and one in which it was 20%.

3.3. Solution Method and Data Post-Processing

The governing equations were solved in a transient manner using a second-order Crank–Nicolson scheme. The time step was initially specified as 1 × 10 5 s and was subsequently dynamically adjusted by the software to maintain the maximum cell volume-based Courant number up to 1.0 [30]. The convection terms in the equations were discretised using the second-order upwind scheme, while the second-order central differential scheme was used to discretise the diffusion terms. The PIMPLE algorithm was employed here to complete the pressure–velocity coupling, utilising the best attributes of both the PISO (Pressure Implicit with Splitting of Operator) and SIMPLE (Semi-Implicit Method for Pressure-Linked Equations) algorithms [30]. During each PIMPLE loop, 3 outer loop and 10 inner loop iterations were performed for convergence. The under-relaxation factors for the quantities solved for were set at 0.4.
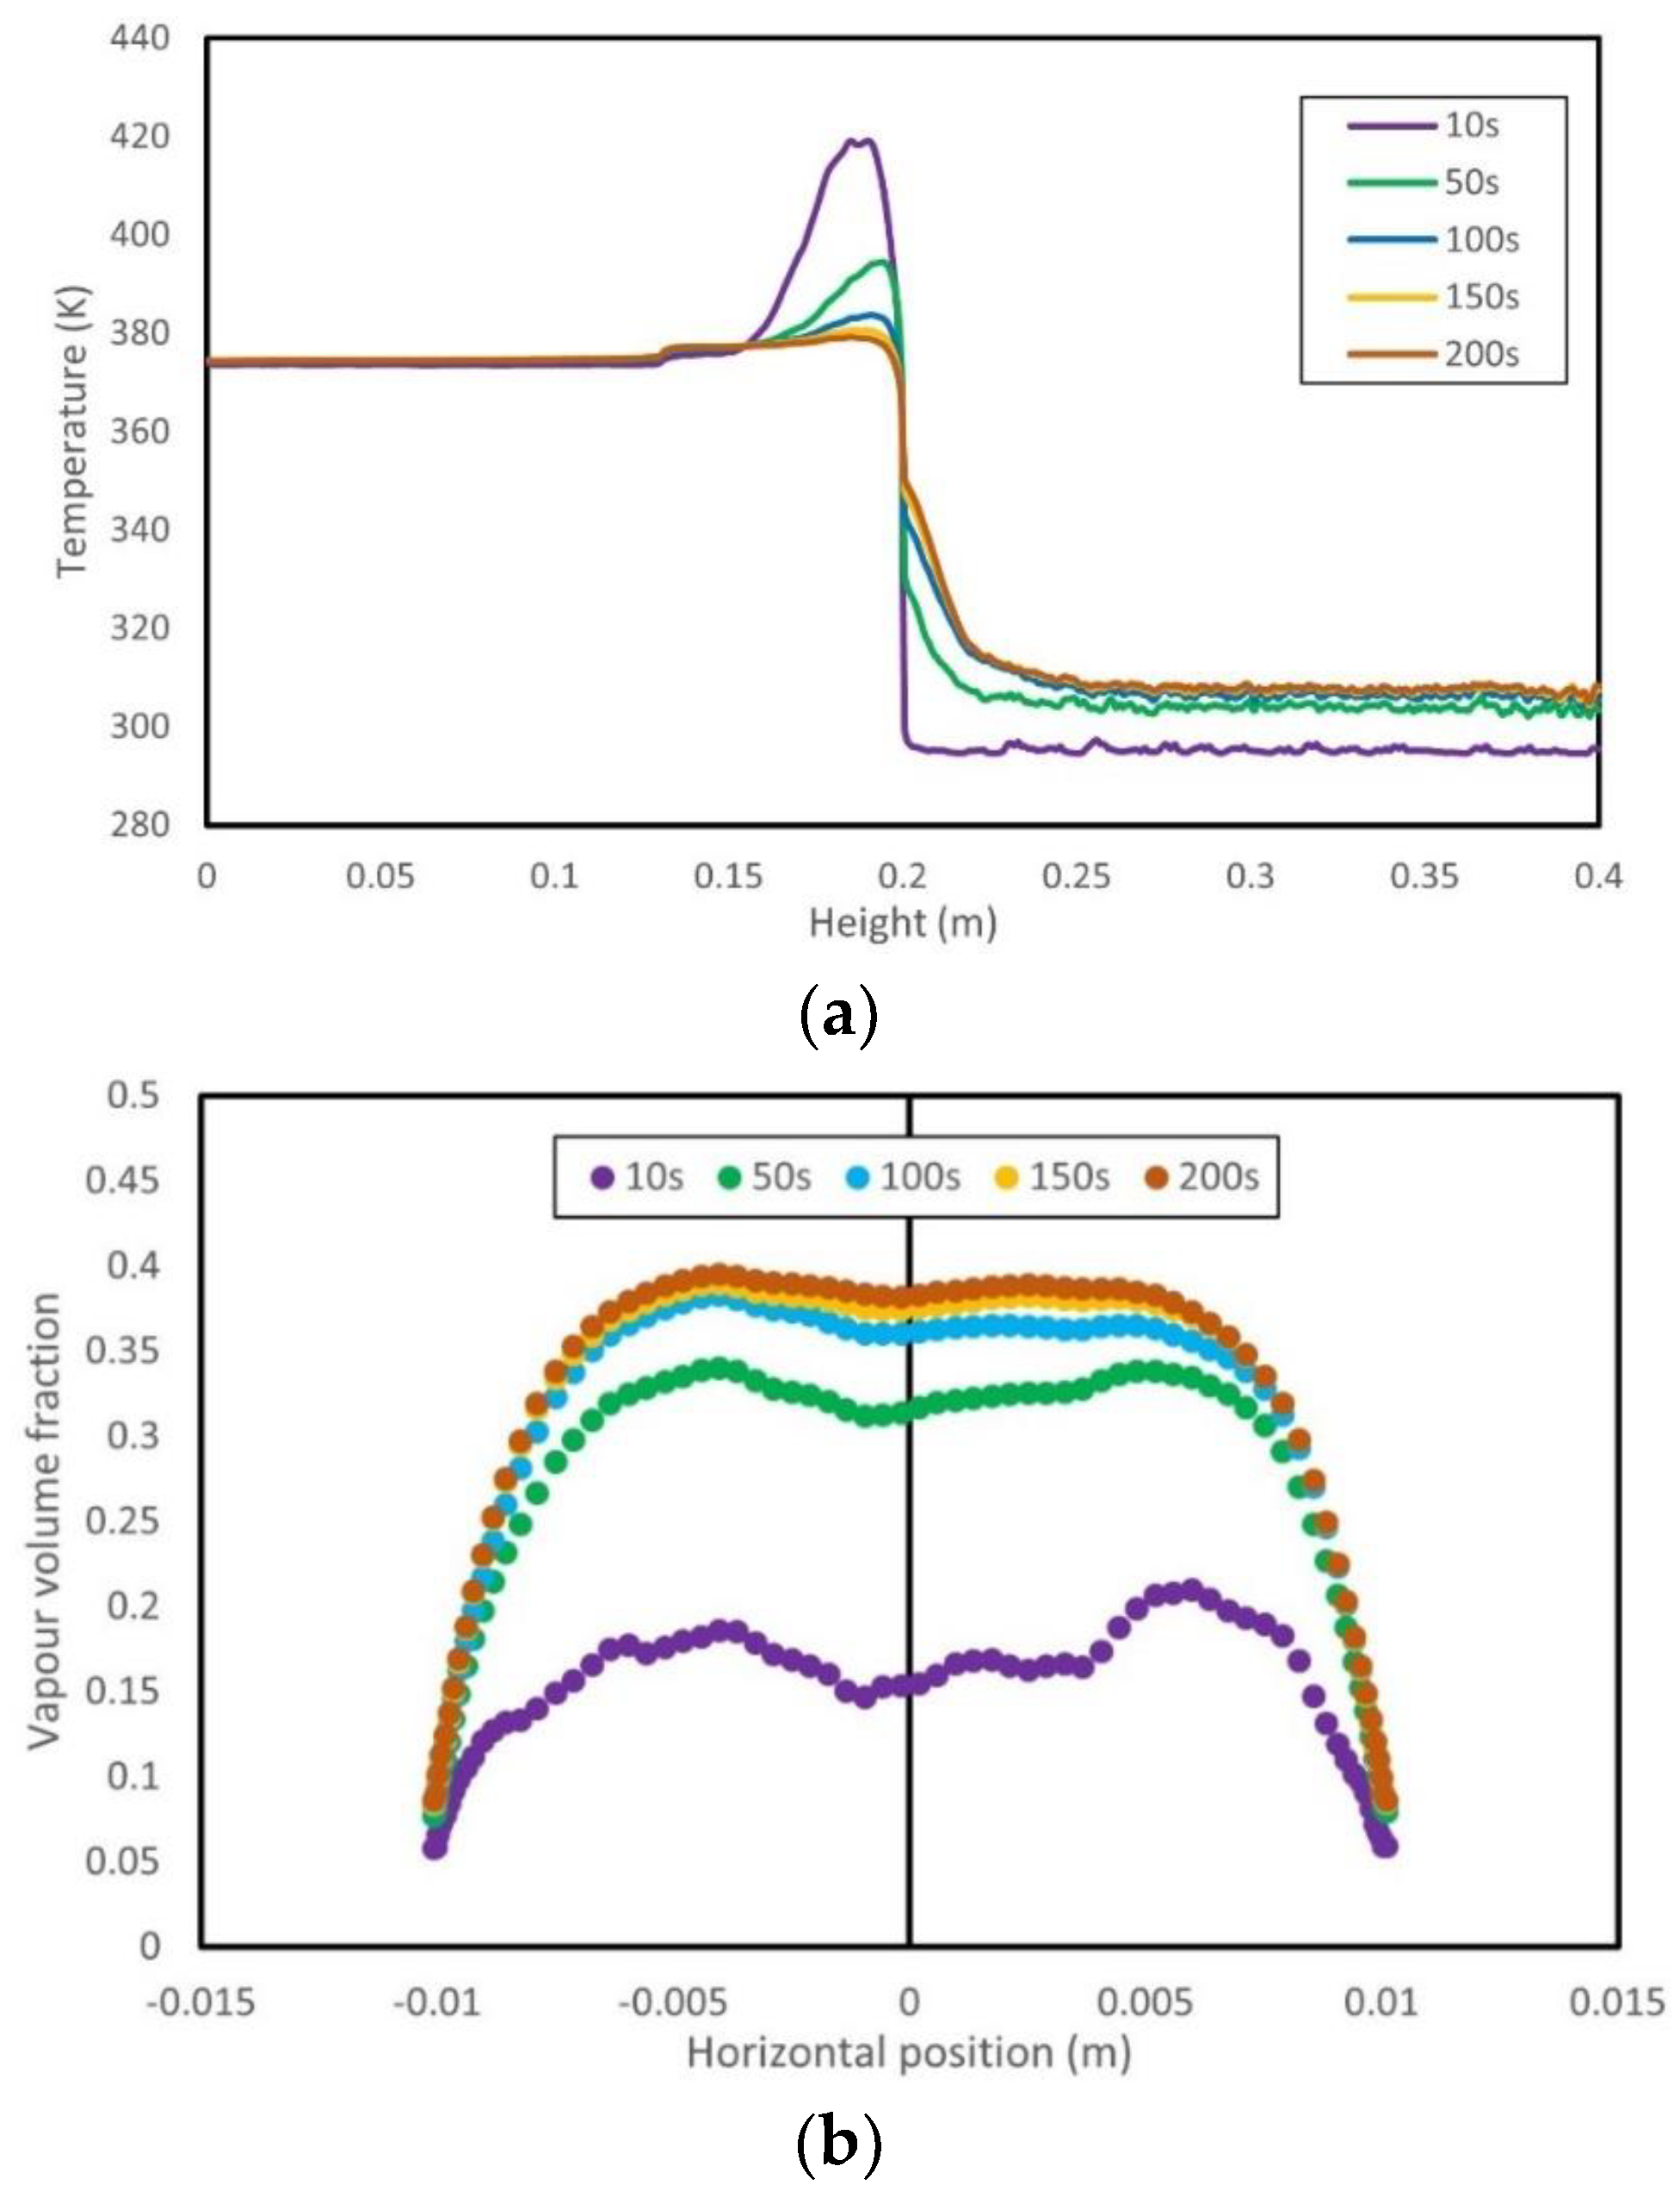
For the uniformly heated cases, time-averaged wall temperatures were obtained for comparison with those measured in the experiment [29]. Other flow-field quantities, including void fraction and vapour axial velocity, are also presented as time-averaged values calculated since the start of the simulations. It is found that these quantities remain almost constant after 150 s, as indicated by Figure 3, implying that a statistically steady state has been achieved after that.

4. Results and Discussion

4.1. Grid Sensitivity

To evaluate the influence of the grid on the prediction of the temperature field, three grids with cell numbers of 30 × 260 (coarse), 50 × 400 (medium), and 70 × 560 (fine) were tested. The boundary conditions used for the tests were the same as the case with a 60.18 W heat input listed in Table 1. Table 2 shows the predicted wall temperature at five different height locations in the thermosyphon. As can be seen, the accuracy of the predicted wall temperature was not significantly influenced when the cell number was higher than 50 × 400. Hence, the grid with 70 × 560 cells is selected for all simulation cases considering the accuracy and computational time.

4.2. Uniform Heating Cases

In this section, the internal flow fields within the uniform heating cases are visualised at the beginning to illustrate the phase distribution varying with time. Subsequently, the results from the uniform heat flux cases are examined, and comparisons drawn with the experimental data reported, comprising the external wall temperature at five heights, 0.02 m, 0.07 m, 0.12 m, 0.25 m, and 0.35 m, are given.
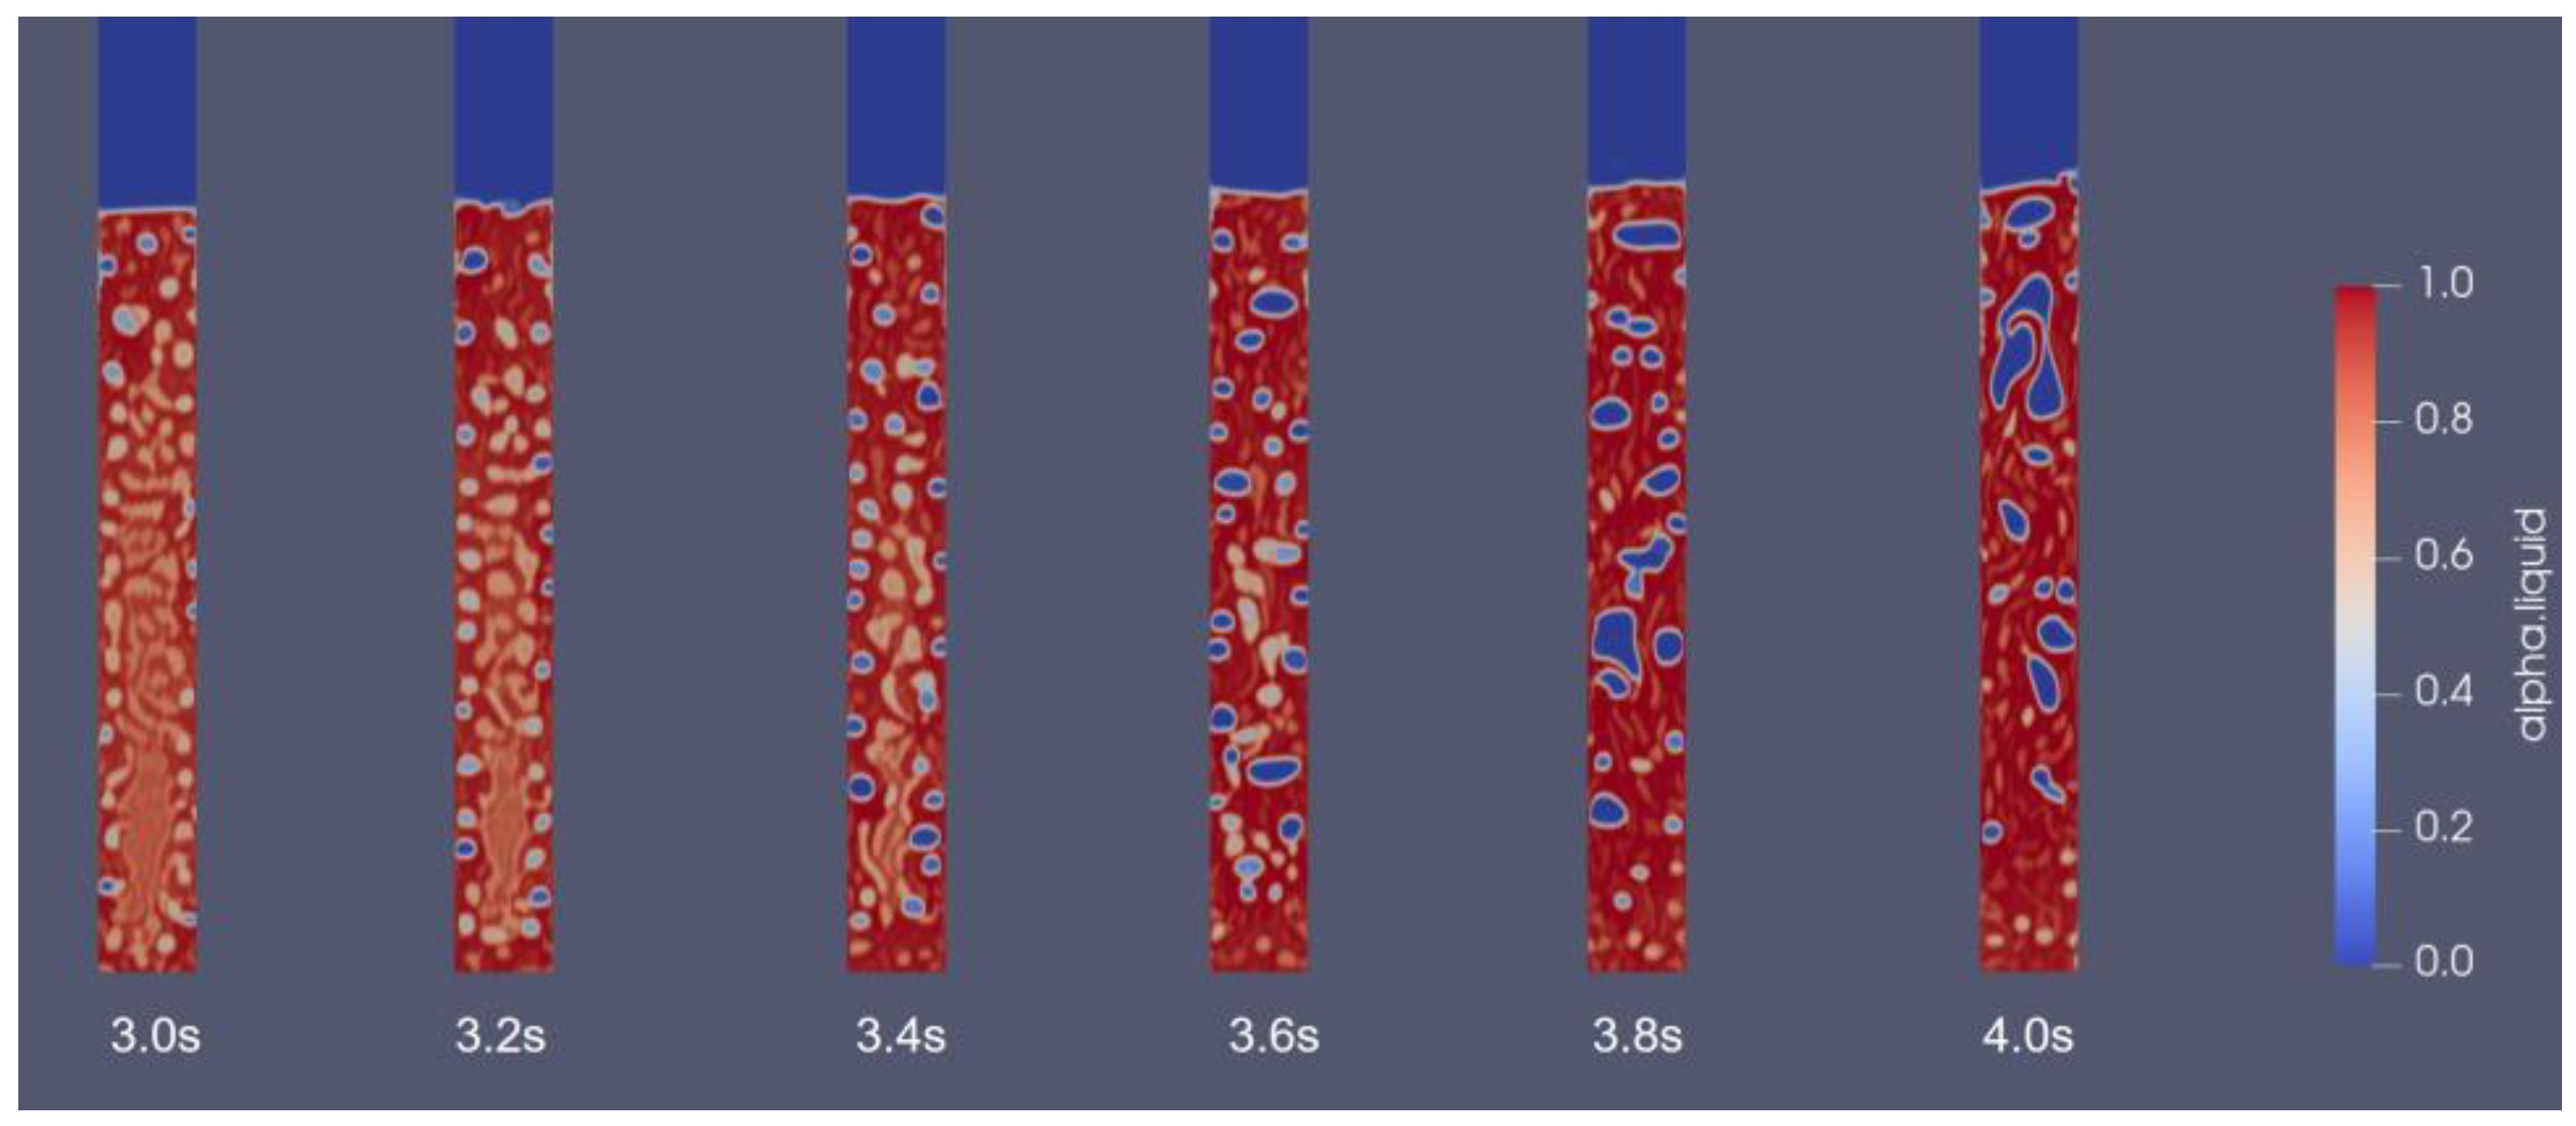
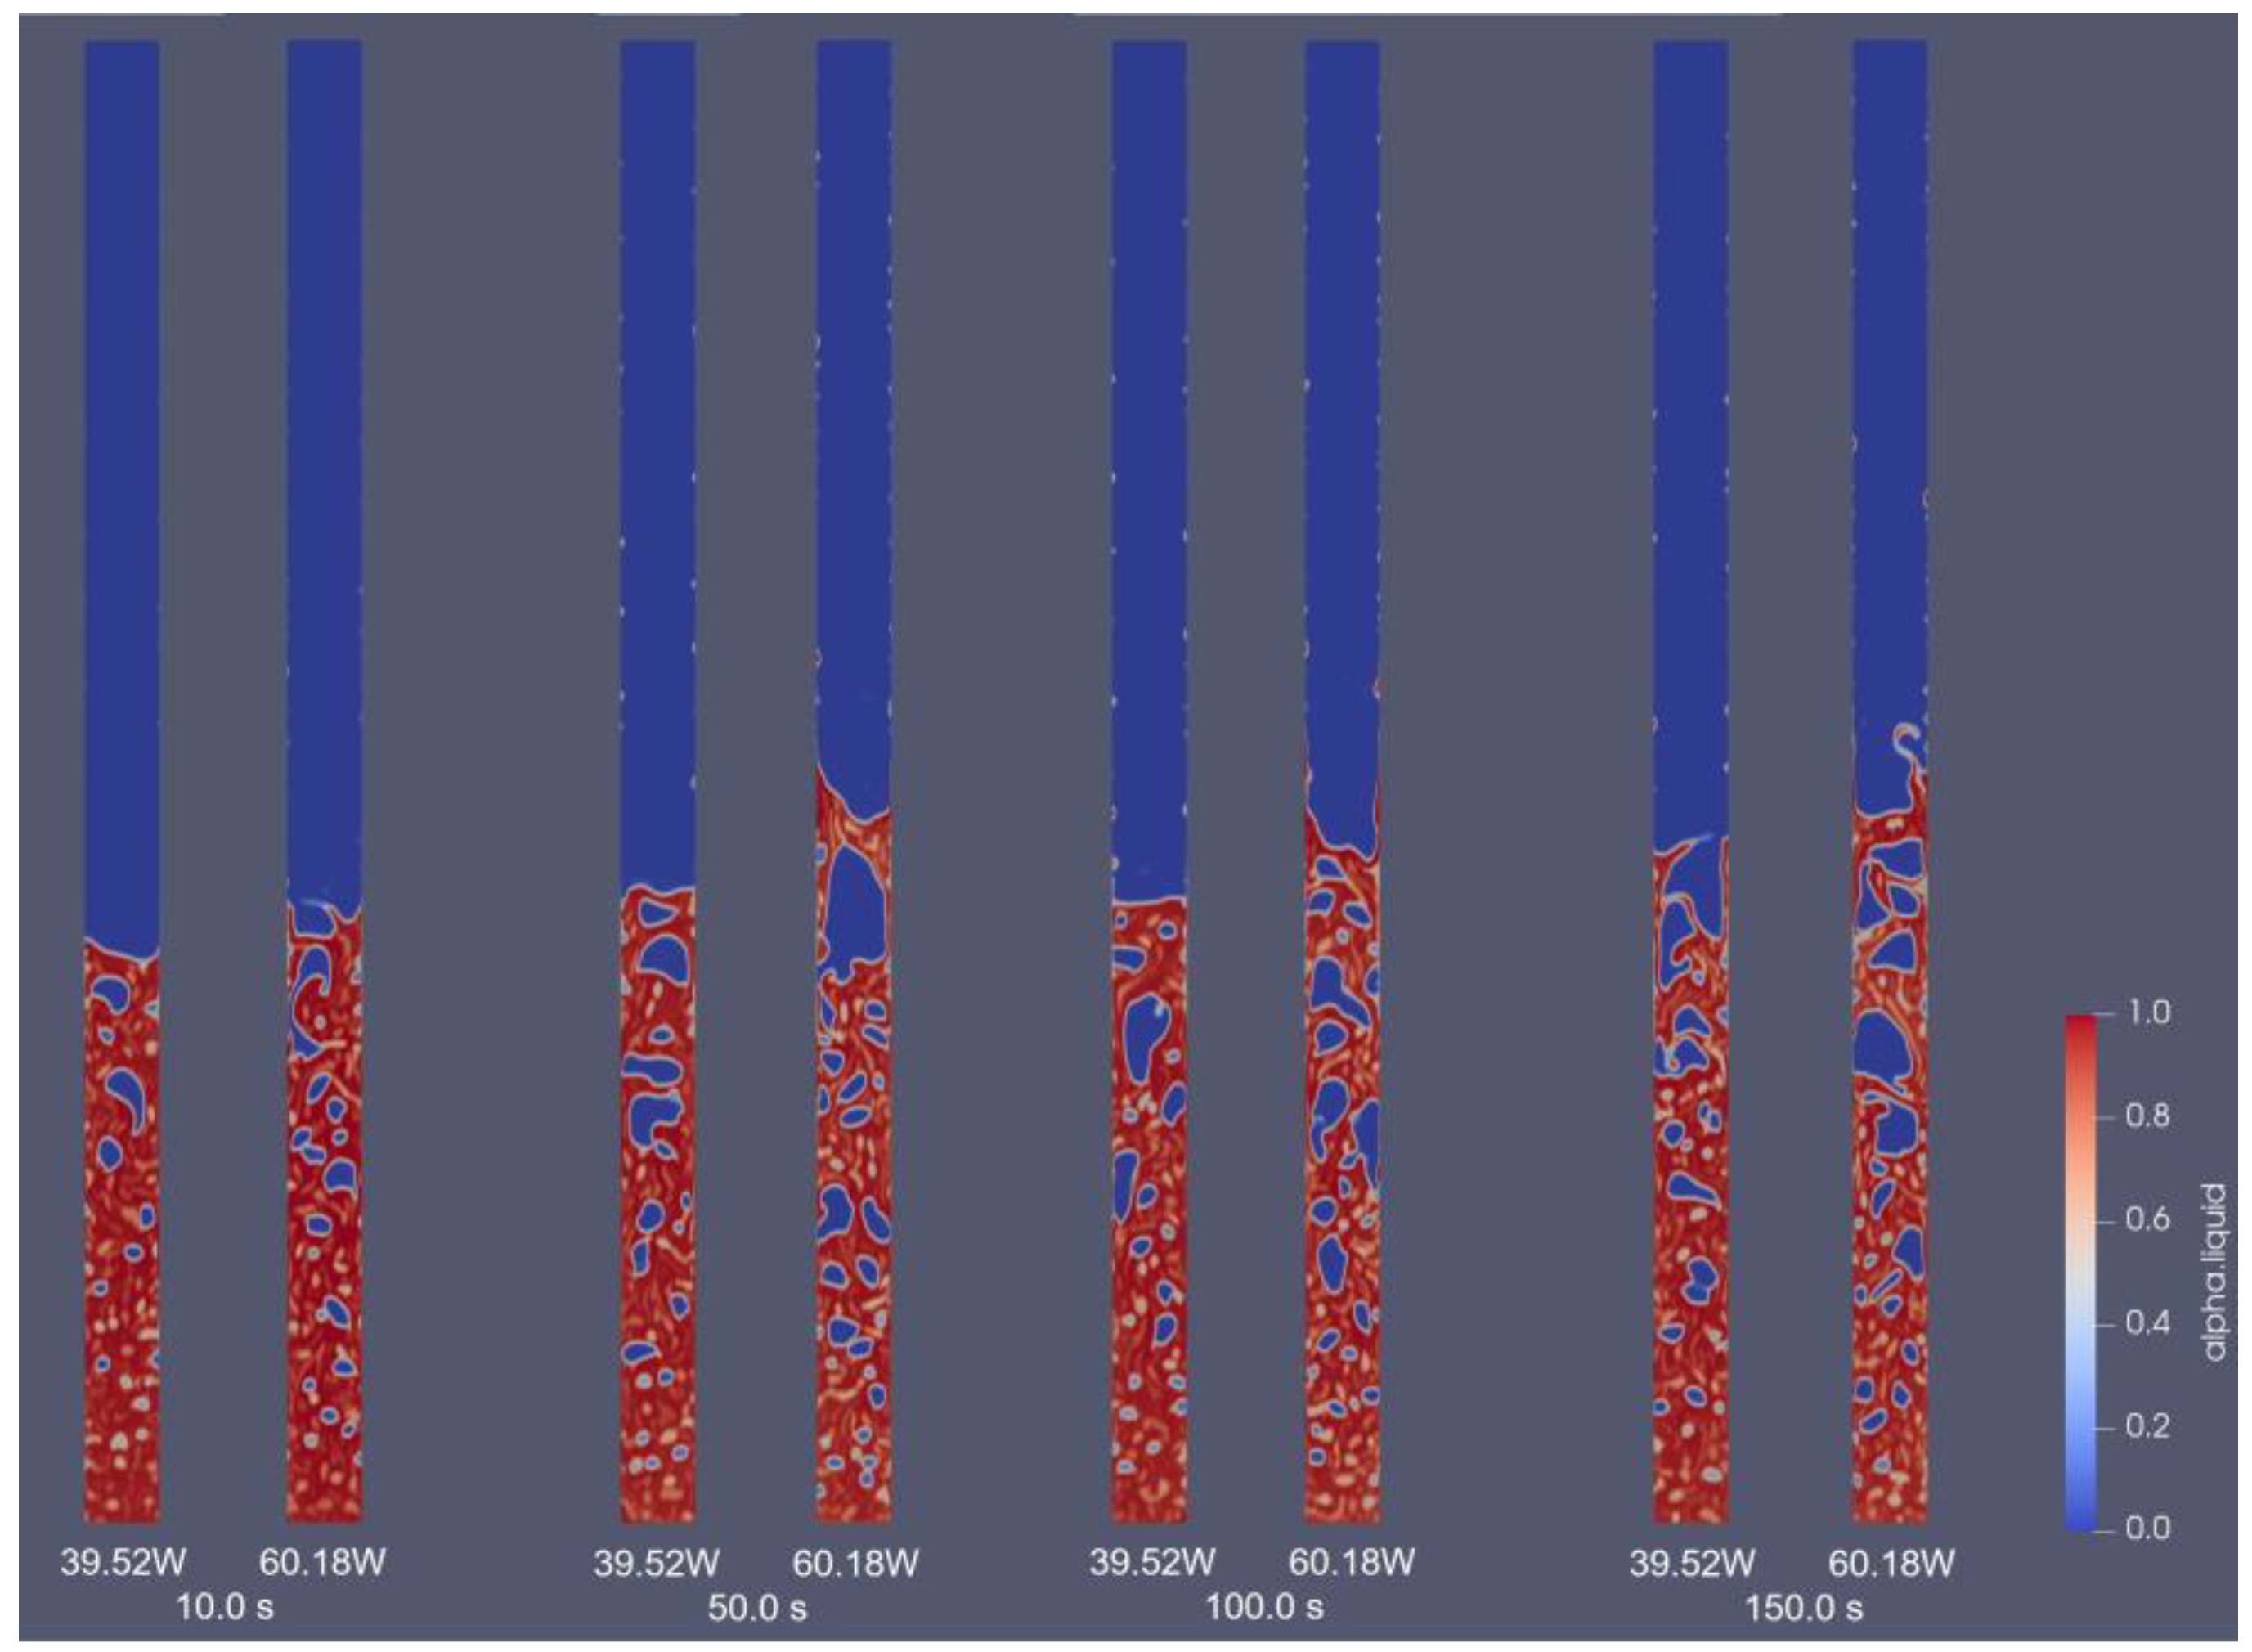
Figure 4 illustrates the bubble generation process in the evaporator section at startup. Under the uniform heat input, small bubbles appear along the heated walls, move upward from the bottom driven by the buoyancy effect, and coalesce with each other to form larger bubbles. As a result, the void fraction is relatively tiny at the lower end of the evaporator as the small bubbles move up quickly, and coalesce with other bubbles to form larger bubbles, as well as a higher void fraction in the upper region. This trend is maintained as time proceeds. As shown in Figure 5, at the bottom of the evaporator, the bubble size is smaller and the liquid volume fraction is relatively high. Most of the energy imported into this region is stored as latent heat to promote phase change. In the upper part of the evaporator, as a result of reduced pressure and bubble coalescence, the bubble size becomes larger, by means of which more energy is absorbed in the form of sensible heat to increase temperature. Figure 5 also indicates that the bubble size becomes larger with the higher heat input and leads to a higher mixture column, implying that the vapour generation is enhanced by the higher heat flux. With the higher heat input, the condensation rate is increased, as calculated in Equation (5), leading to increased condensate within the condenser section that returns to the evaporator assisted by gravity, as shown in Figure 5.
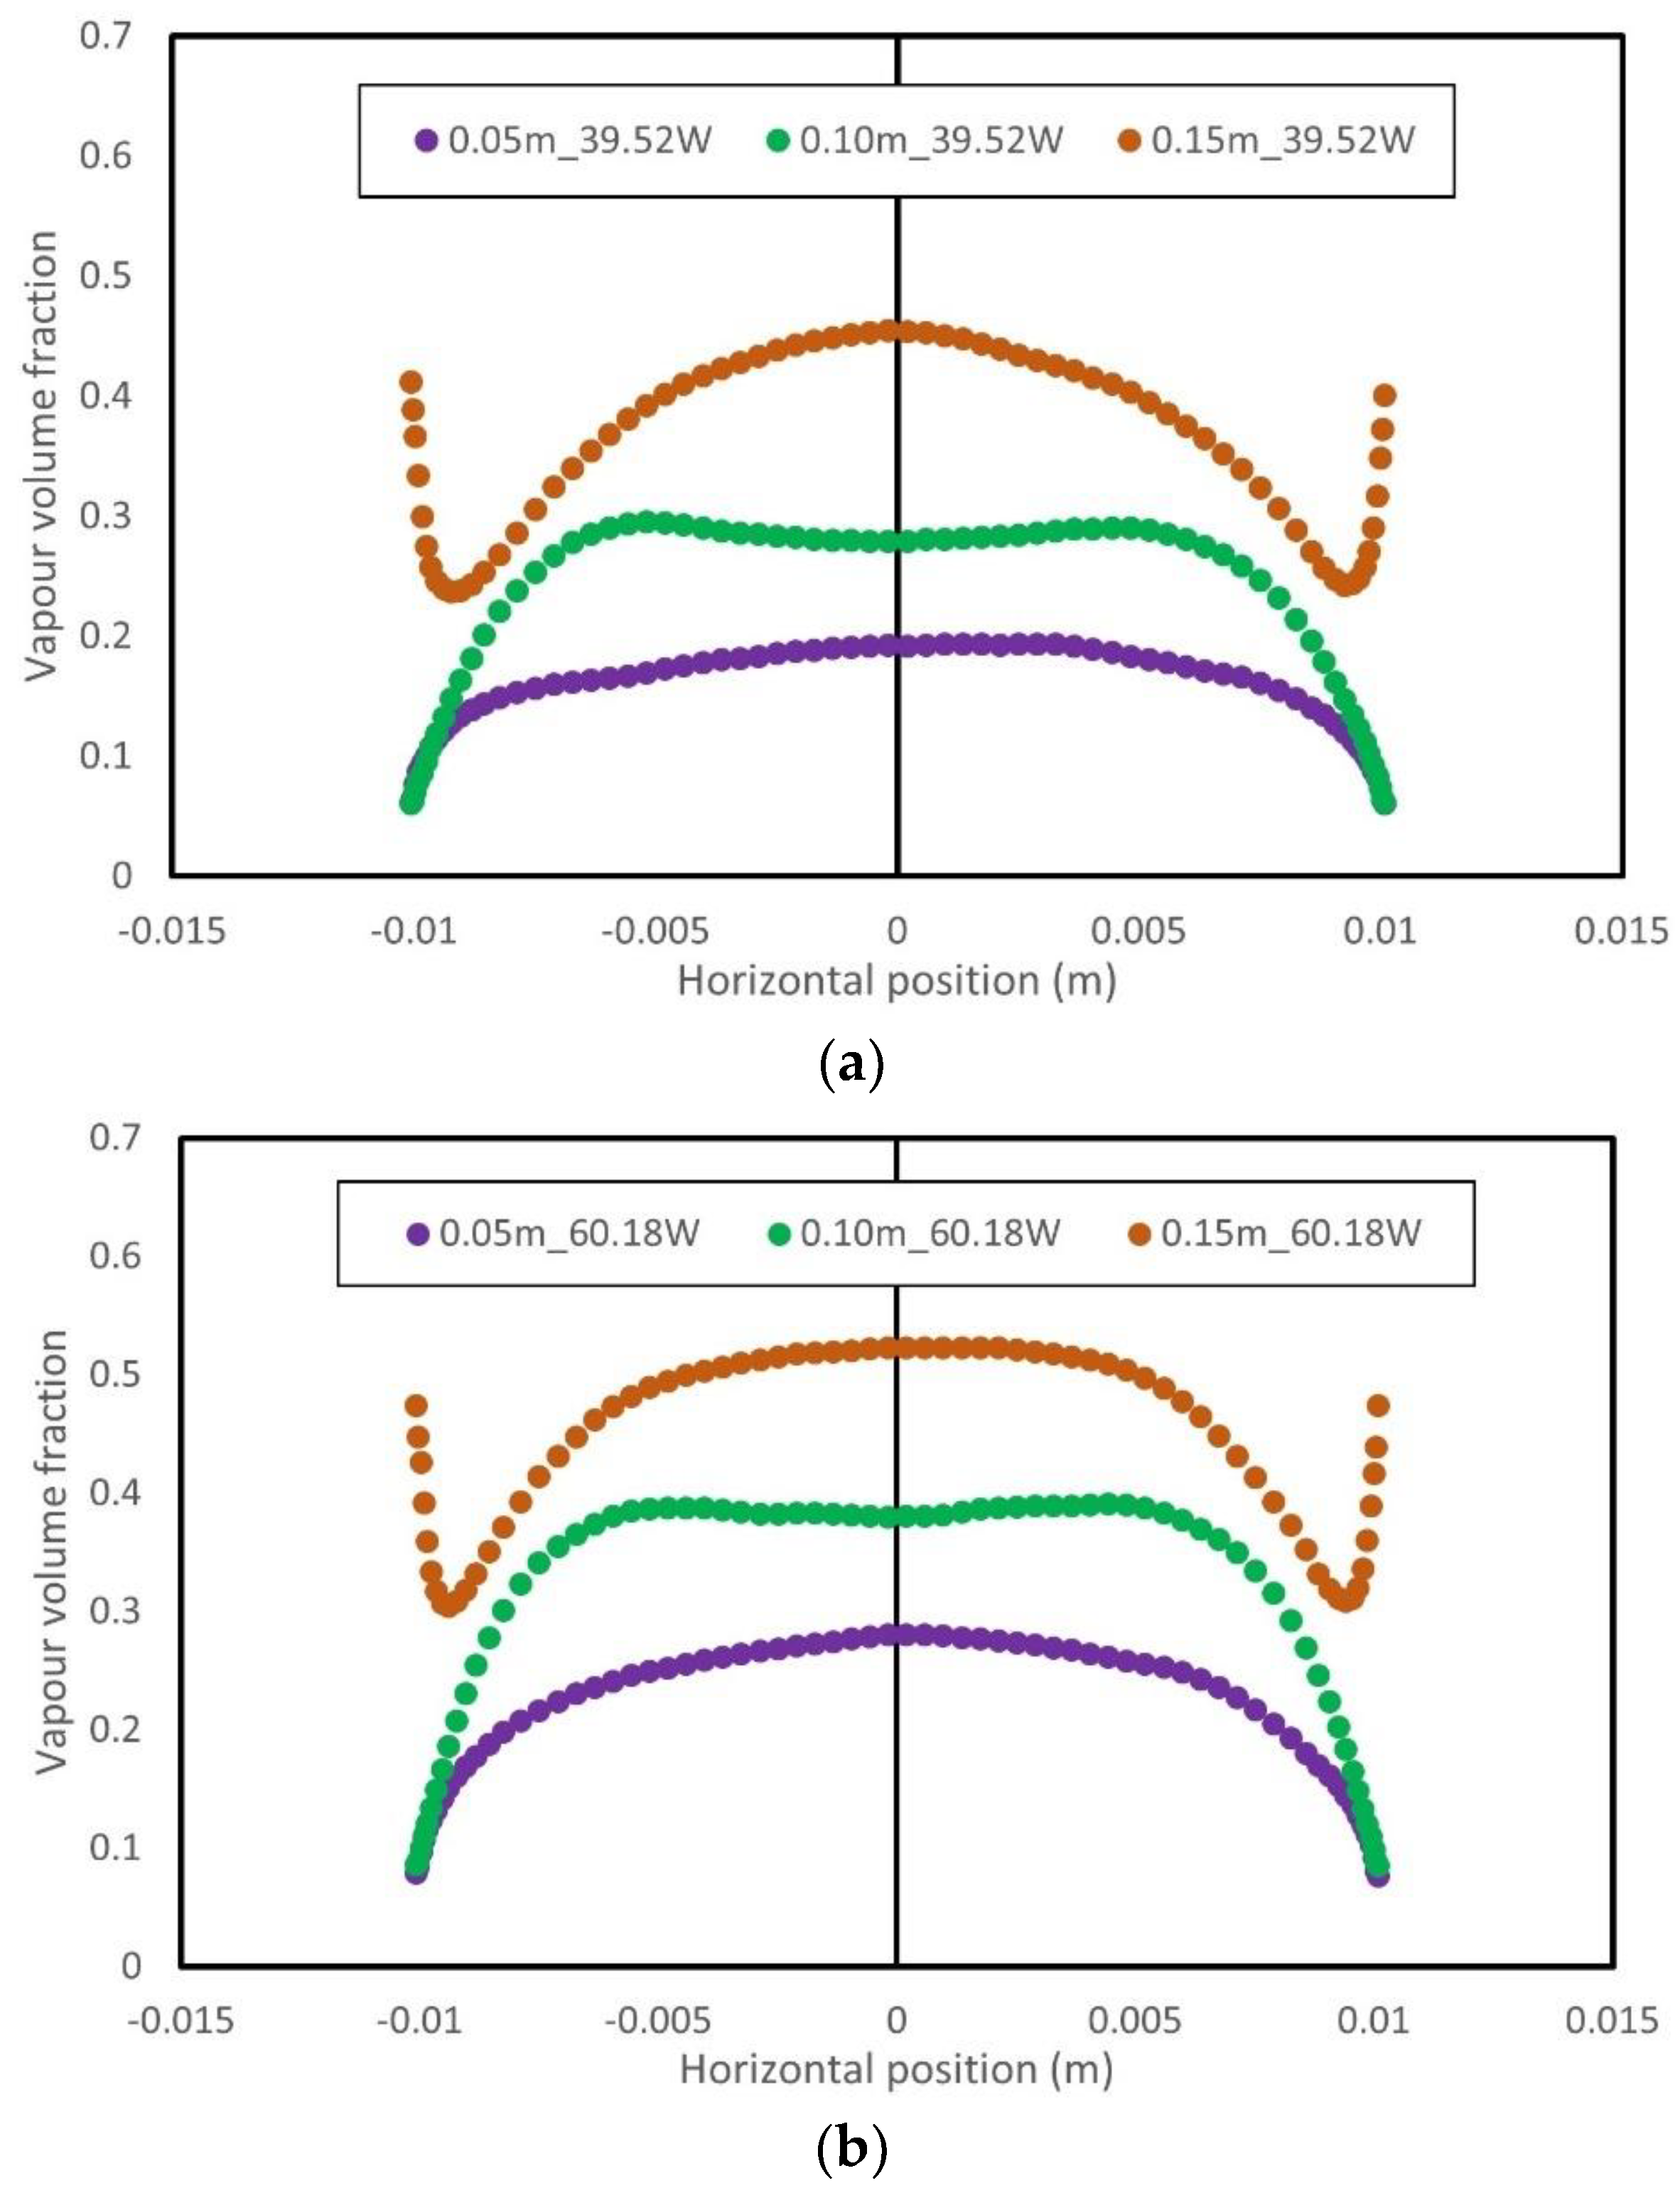
According to Tomiyama’s theory [31], the bubble lift force coefficient tends to change its sign for larger bubbles to push them to the pipe centre, forming a core-peaked radial void fraction distribution. This can be seen in Figure 6a,b along the lower evaporator cross-section. However, at the upper evaporator cross-section (0.15 m), the radial void fraction profiles show not only core peaking but also peaks near the walls. This may be due to the fact that most of the liquid phase pools at the bottom of the evaporator, while the upper evaporator section is primarily affected by the returning condensate flow film and the liquid flow that dash from the bottom region. Therefore, the local thermal resistance in the upper section becomes larger than that of the lower section, leading to higher wall temperatures, as well as evaporation rates. As a result, the vapour distribution in this region is different from that observed in the lower sections.
The temperature distributions along the inner wall are obtained from the CFD simulations in the present work and compared with the experimental external wall temperature data, as illustrated in Table 3. As the heat input varies from 39.52 W to 60.18 W, the overall wall temperature increases correspondingly. At the lower end of the evaporator, the predicted increment of the evaporator temperature is lower than that measured in the experiment, and a maximum temperature deviation between prediction and measurement of 3.02% is found here. Apart from the error introduced by the two-dimensional simplification, the discrepancy could be partially due to the neglect of conjugate heat transfer, leading to a reduced thermal resistance and subsequently lower evaporator temperature and higher condenser temperature. Another factor is that Lee’s model, as expressed in Equations (3) and (4), neglects the wall superheat on vapour generation, considering only the contribution of the local temperature deviation from the saturation temperature. Therefore, the liquid phase in the vicinity of the wall is maintained close to saturation temperature and the temperature of the liquid–vapour mixture only slightly exceeds the saturation temperature at the lower evaporator end, where the void fraction was small. This can also explain why the wall temperature in this region was insensitive to the change in heat input. At the higher end of the evaporator (approximately 0.15 m), where the void fraction near the walls is higher, the inner-wall temperatures are more sensitive to heat inputs.
Overall, the simulation results show that the CFD model has adequate capability to correctly predict the thermophysical features of the internal flow fields within a vertical TPCT with acceptable engineering discrepancy, and therefore is appropriate for investigation as described in the following section.

4.3. Effects of Non-Uniform Heat Input

In this section, the simulation model built in the previous section is used to investigate the effect of non-uniform heat profiles on the temperature field of a TPCT. The thermosyphon was heated with two total heat inputs as described above, each with four heat flux profiles (Figure 3) and two maximum heat flux deviations (10% or 20%). It was found that the cases with 10% non-uniformity show similar trends to those seen in the 20% cases but with smaller increment or decrement. Therefore, the following analysis mainly adopts the cases with 20% non-uniformity for illustration. For all the cases, no significant change in vapour axial velocity in the condenser was observed.
As shown in Figure 7a,b, the non-uniformity of the heating profile significantly influences the vapour volume fraction over the wall of the evaporator, which can be divided into three regimes according to the local distribution of void fraction. At the low-evaporator region (0~0.13 m), where the liquid pools and nucleation boiling dominates, the void fraction over the wall remains at approximately 0.05 for the lower heat input and 0.1 for the higher heat input. At each heat input, it is seen that the void fraction in this region is insensitive to different heating profiles, implying that non-uniform heating profiles have a negligible impact on the vapour generation in this region. This is due to the fairly flat wall temperature distributions as discussed before. In the transition region (0.13~0.16 m), the distribution of void fraction appears not to be affected by heating profiles but by the heat input, with slightly higher levels returned in the higher heat-input case.
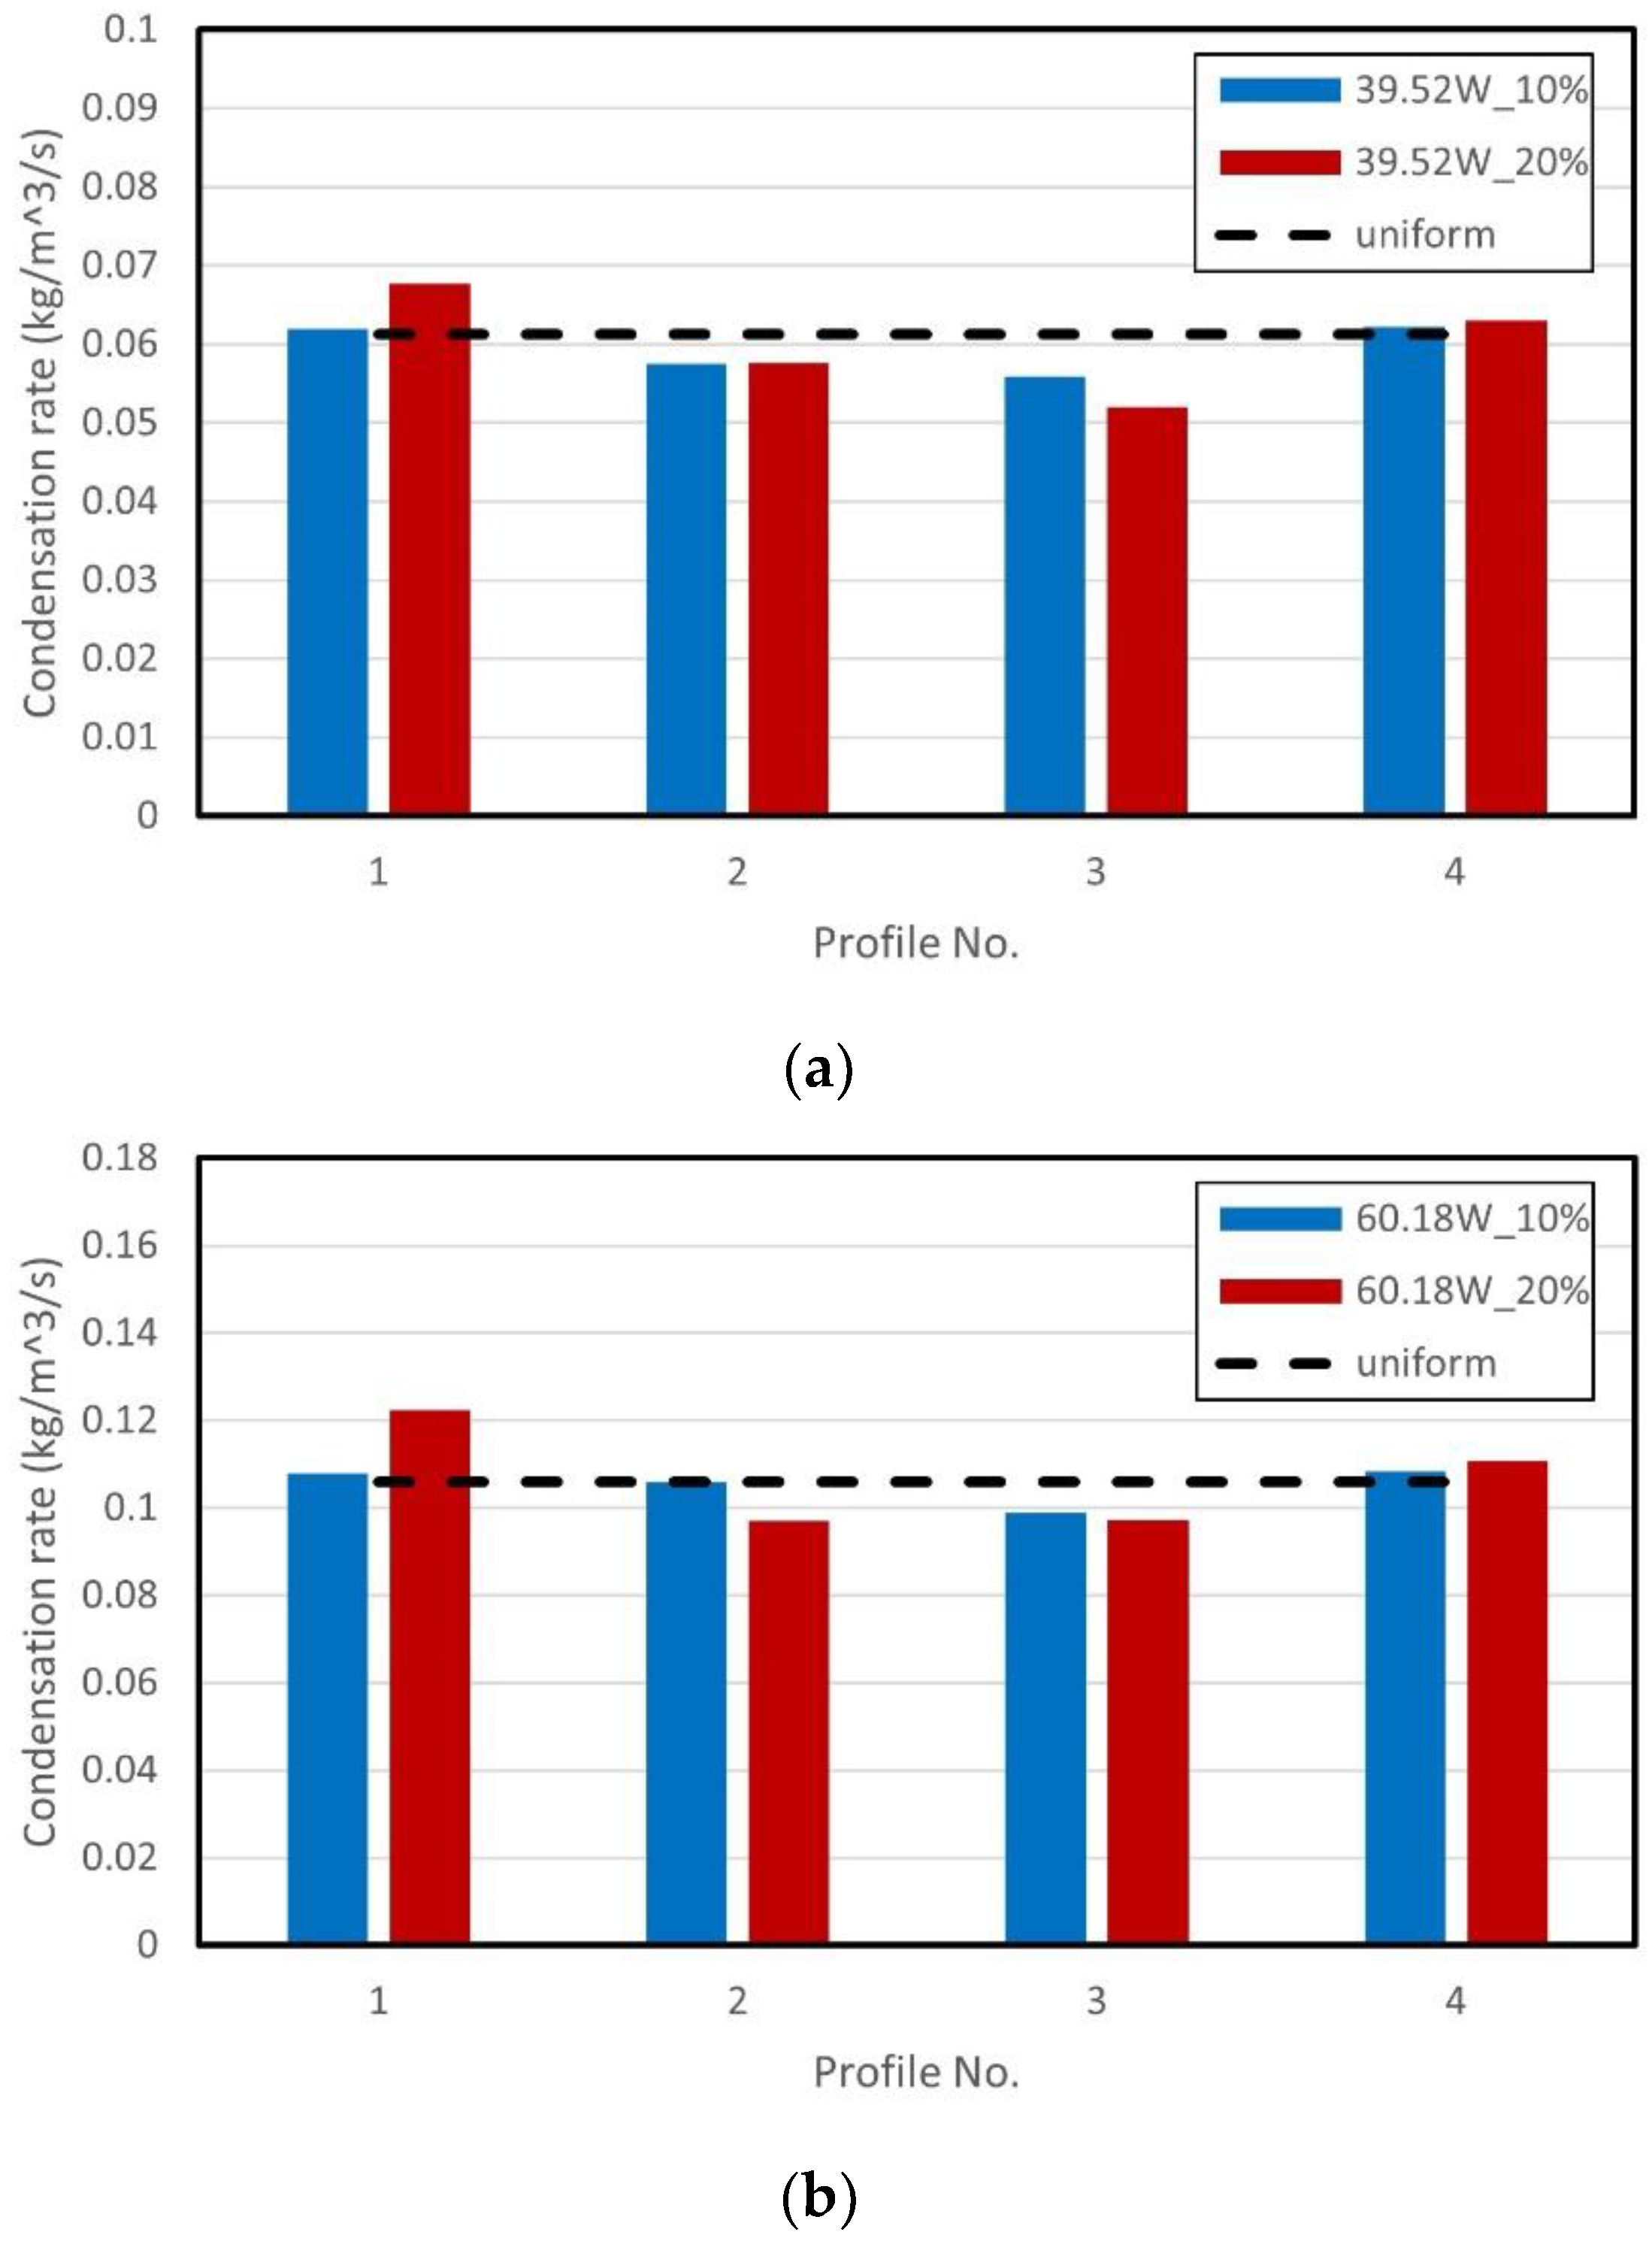
In the upper part of the evaporator (0.16~0.2 m), that receives the liquid film returning from the condenser, the void fraction distribution varies with different heating profiles and shows different trends with the two heat inputs. In Figure 7a, profile 3 leads to the highest void fraction in the upper part of the evaporator, as the heat flux continuously rises from the bottom and reaches the maximum at the exit of the evaporator (0.2 m), implying that the liquid film here is the thinnest among the four heating profiles. On the other hand, profile 1 suppresses the phase change and results in the lowest void fraction in this region. Profiles 2 and 4 slightly promote and suppress the vapour generation, respectively. When the heat input is raised from 39.52 W to 60.18 W, as in Figure 7b, the relative change in void fraction levels as the heating pattern is changed follows a similar qualitative behaviour to that seen at the lower heat input, but with substantially reduced void fraction near the exit of the evaporator. These lower levels illustrate how the higher heat input enhances the condensation within the condenser, as well as the amount of the returning condensate flow, reducing the void fraction in this region. Profile 1 results in a large drop in void fraction between 0.17 m and 0.19 m, implying that the relatively low-heat flux applied in that region meant that the flow there was significantly influenced by the returning condensate flow. Profile 3 also shows results influenced by the increased condensate flow, returning generally lower void fraction levels than those seen in the lower heating rate case. However, apart from a small dip at 0.18 m, it does show levels that generally increase with height right up to the top of the evaporator region, as a result of the applied heat flux increasing with height along that section. For profiles 2 and 4, one might expect them to behave qualitatively similar to that observed in profiles 1 and 3, as they impose reduced and enhanced heat flux in the upper part of the evaporator, respectively. However, the results in Figure 7 indicate that profile 2 generates more vapour than that by profile 4 at both heat inputs in the upper part of the evaporator wall. It should be noted that profile 4 also results in an increased condensate flow compared with profile 2, as shown in Figure 8. Therefore, the vapour generation in profile 4 was further suppressed by the increased condensate flow, even though the imposed heat flux was higher than that by profile 2, which implies that the vapour generation within a TPCT is not only dependent on the heat flux but also affected by the condensate flow.
Intuitively, one might expect the phase-change rate within a TPCT would remain constant for a given total heat input. However, that is not always the case as shown in the present results. Figure 8 indicates the predicted overall condensation rates for the different cases considered here. Generally, as might be expected, the overall condensation rate (also the evaporation rate) increased at a higher heat input. The cases with 10% non-uniformity did not show a significant deviation from the uniformly heated cases’ levels, with just a slight reduction in the overall condensation rate for profiles 2 and 3. However, for the cases with 20% non-uniformity, profile 1 increased the phase-change rate, relative to the uniformly heated case, at both heat inputs, while profiles 2 and 3 decreased the phase-change rate. Profile 4 shows negligible influence on the phase-change rate for all heat inputs and non-uniformities. It can be seen that profile 1 produces the most condensate, followed by profile 4, implying that these two profiles transferred more energy through latent heat, and thereby improved the overall thermal performance. Profiles 2 and 3 show reduced phase-change rates, compared to the uniform heating, in Figure 8, illustrating that for a given heat input, a larger proportion of that energy is transferred in the form of sensible heat, resulting in reduced phase change, and subsequently, a reduction in the generation of condensate. Additionally, by increasing the overall heat input from 39.52 W to 60.18 W, the condensate generation is drastically increased, leading to a thicker liquid layer over the upper evaporator wall and the condenser wall. This can lead to a higher condenser thermal resistance, and subsequently, a higher condenser temperature, as illustrated in Table 3.
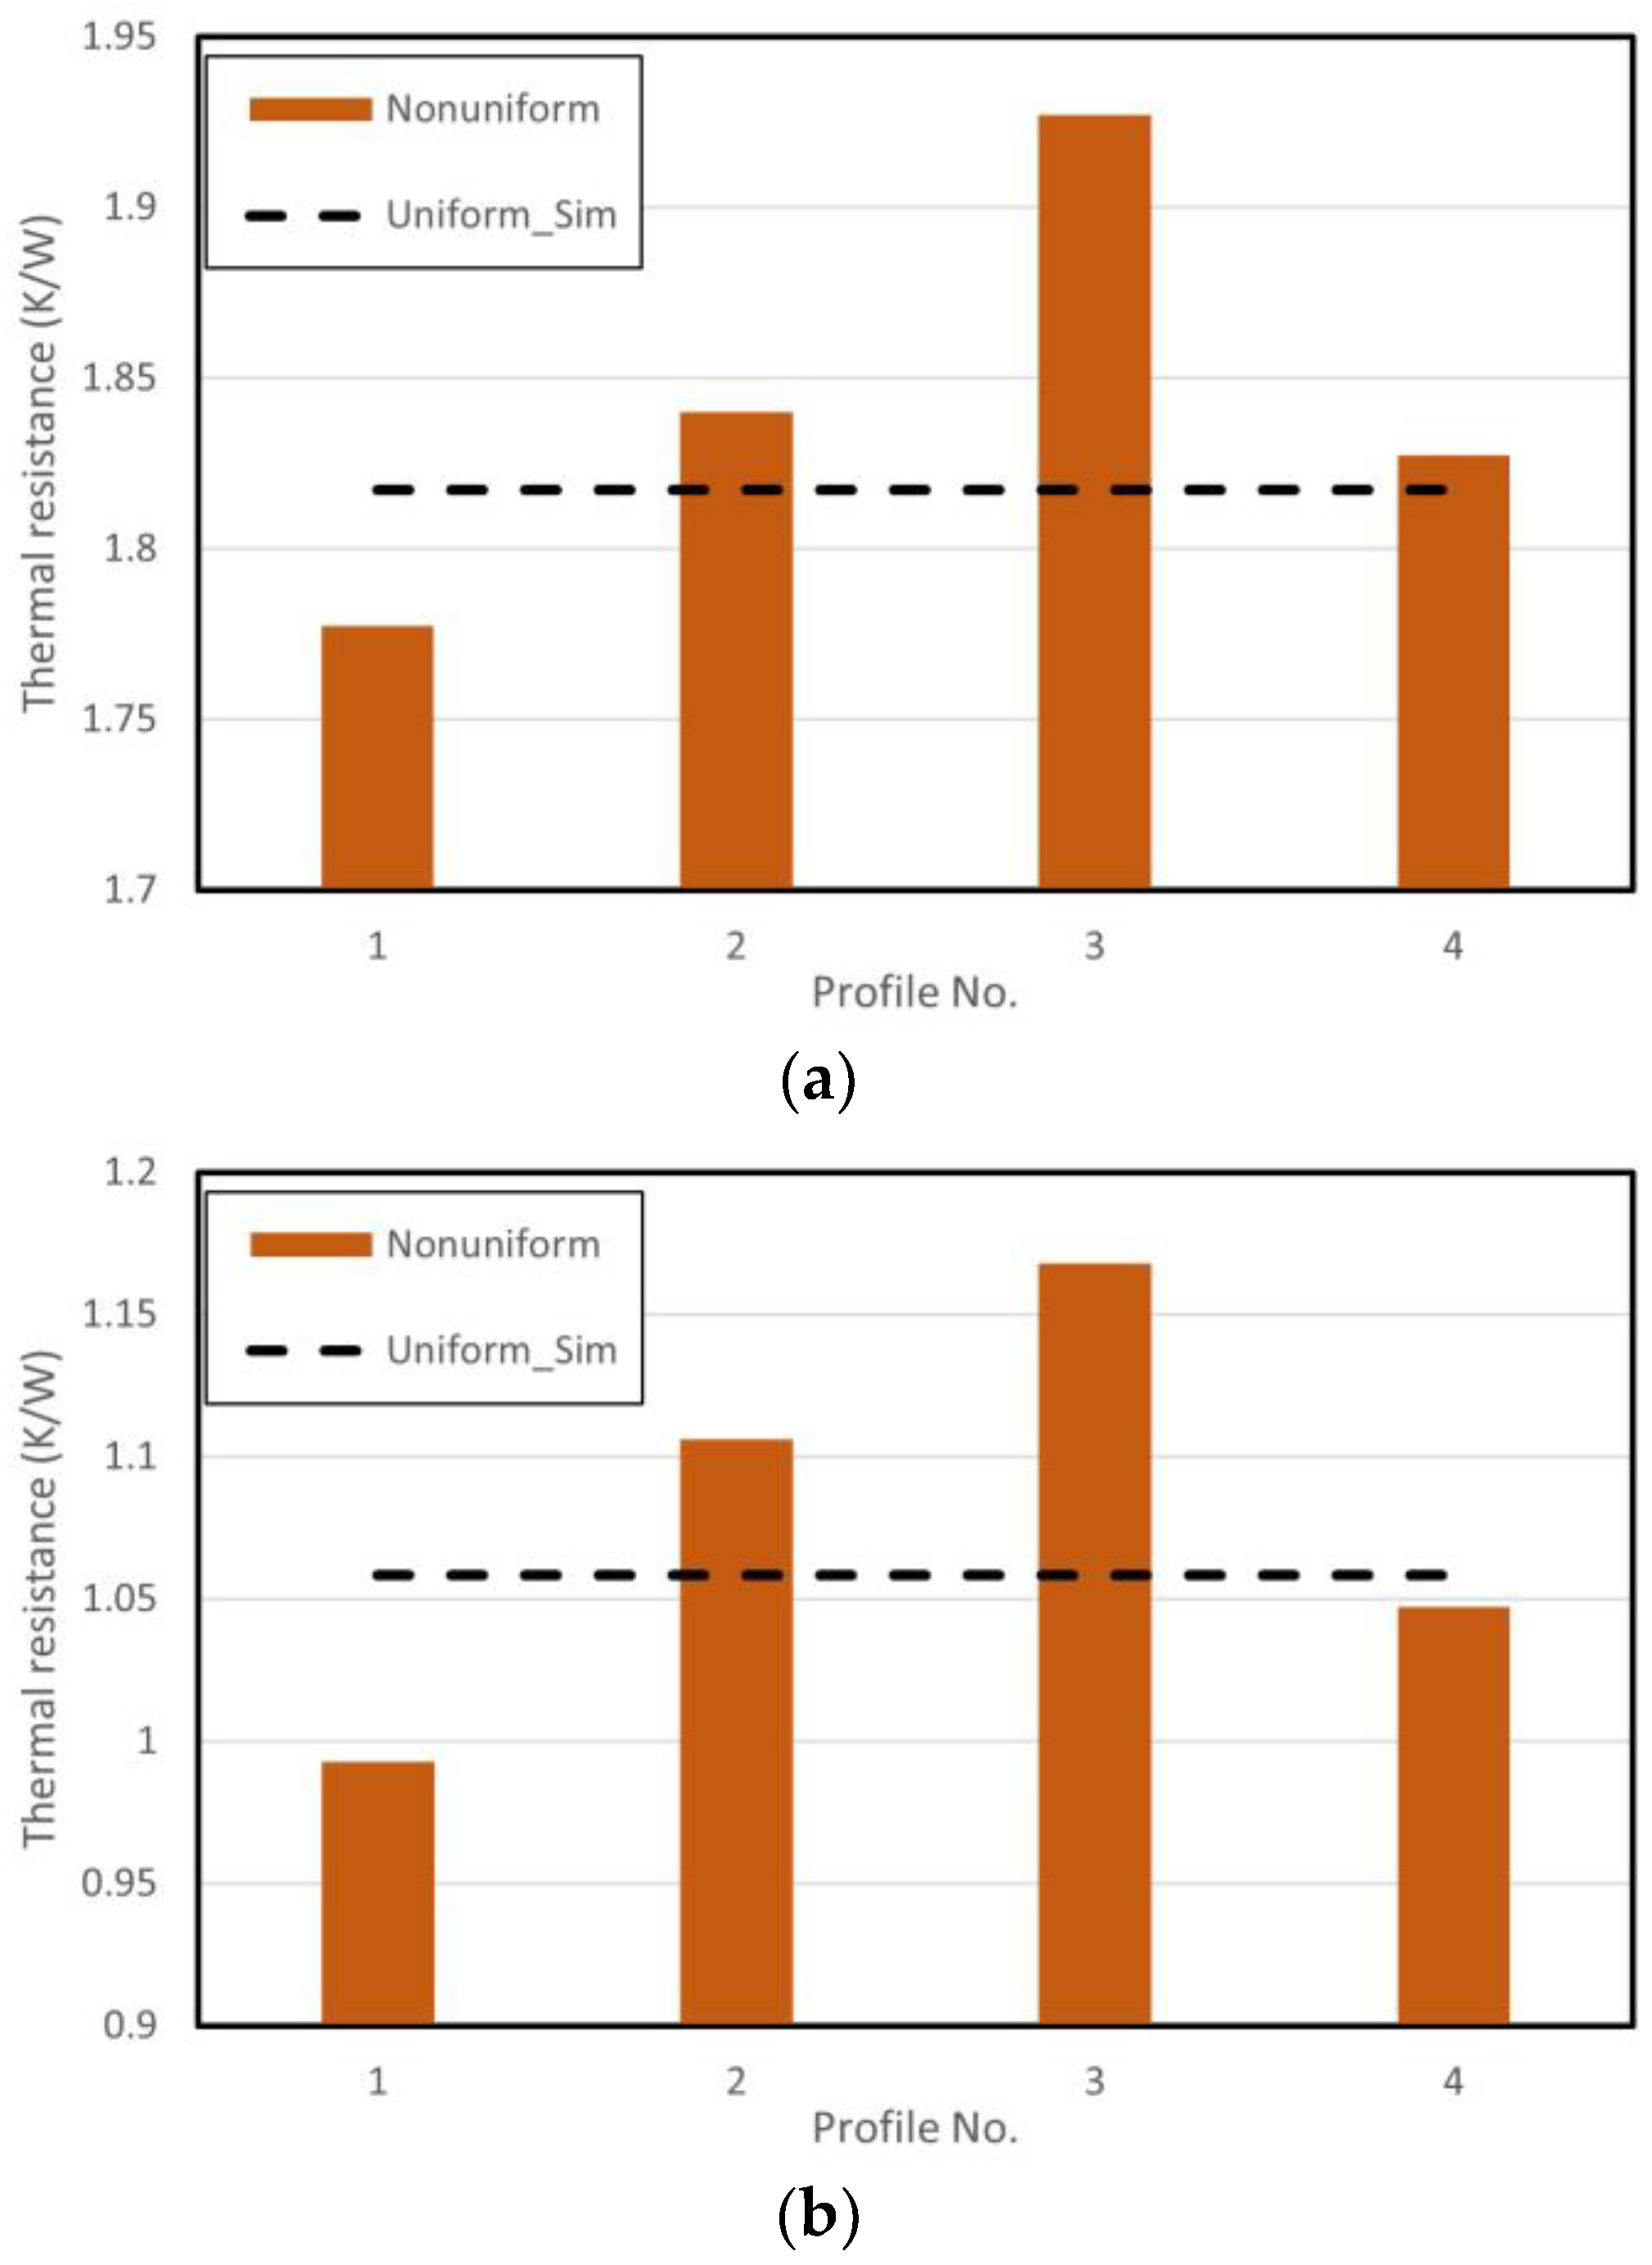
Since the effects of non-uniform heating on the internal flow fields within a TPCT have been discussed above, it is worthwhile to see how these effects reflect on the overall performance of the TPCT. One parameter commonly adopted to evaluate the performance of TPCTs is the overall thermal resistance, which can be defined as the temperature difference between the evaporator and condenser over the transported heat flow. Figure 9 indicates the overall thermal resistances of the different heating profiles (with 20% non-uniformity) at the two heat inputs. As mentioned before, profile 1 increases the condensation rate, as well as the returning condensate flow. As a result, the proportion of the energy that is transported via latent heat is increased, reducing the temperature difference between the evaporator and condenser, and resulting in a smaller overall thermal resistance, as shown in Figure 9. On the other hand, profiles 2 and 3 increase the overall thermal resistance, quite significantly in the case of profile 3. With the arrangements employed, profile 4 shows minor influences on vapour generation and overall phase-change rate, and therefore does not significantly affect the overall thermal resistance.

5. Conclusions

A CFD model has been built based on OpenFOAM to study and delineate the thermal hydraulic patterns governing the performance and design of the two-phase thermosyphon. The uniformly heated case results show good agreement with experimental data, indicating that the modified solver displays adequate capability to capture the thermophysical features of a TPCT. Subsequently, the internal flow field within the TPCT was visualised during the startup process and steady state. Following that, various heat flux profiles were applied to the same TPCT to delineate the effects of non-uniform heat input on the thermophysical characteristics of the TPCT. The main findings are the following:
(1)
With uniform heating profiles, small bubbles nucleated at the lower evaporator move inward and coalesce with other bubbles in the core region; in the upper evaporator section, radial void fraction profiles with both core peak and wall peak are observed.
(2)
The vapour generation over the evaporator wall can be split into three regimes in the current case studied. Vapour generation maintains an almost constant minimum value for heights below 0.13 m, and then increases abruptly in the transitional region between 0.13 m and 0.14 m. At the heights above 0.14 m, it is influenced by the heating profiles, as well as the returning condensate flow. In this upper region, the vapour generation reduces at higher heat input as the condensation increases accordingly.
(3)
The overall thermal resistance of the TPCT depends on the heating load power and can be influenced by heating profiles. When the heat loading is concentrated at the bottom of the evaporator, the role of phase change in heat transport becomes more important, improving the overall thermal performance. Conversely, the thermal resistance increases if the heat loading is concentrated in the upper part of the evaporator.
Given the paucity of detailed experimental data regarding the engineering performance of TPCTs, it is absolutely crucial that a complementary experimental development programme be designed to critically assess the validity, credentials, and shortcomings of the above computational results. Therefore, the study reported in this effort is expected to provide significant guidelines for the engineering design and development of the widely employed heat transport devices, TPCTs.

Author Contributions

Conceptualization, Z.W. and A.T.; methodology, Z.W.; software, Z.W.; validation, Z.W.; writing—original draft preparation, Z.W.; writing—review and editing, T.C. and A.T.; supervision, T.C. and A.T. All authors have read and agreed to the published version of the manuscript.

Funding

This research received no external funding.

Data Availability Statement

The data presented in this study is available on request from the corresponding author.

Conflicts of Interest

The authors declare no conflict of interest.

References

  1. Sun, Z.; Zhang, Z.; Duan, C. The applicability of the wall implanted with heat pipes in winter of China. Energy Build. 2015, 104, 36–46. [Google Scholar] [CrossRef]
  2. Barzi, Y.M.; Assadi, M. Evaluation of a Thermosyphon Heat Pipe Operation and Application in a Waste Heat Recovery System. Exp. Heat Transf. 2014, 28, 493–510. [Google Scholar] [CrossRef]
  3. Kusuma, M.H.; Putra, N.; Antariksawan, A.R.; Susyadi; Imawan, F.A. Investigation of the Thermal Performance of a Vertical Two-Phase Closed Thermosyphon as a Passive Cooling System for a Nuclear Reactor Spent Fuel Storage Pool. Nucl. Eng. Technol. 2017, 49, 476–483. [Google Scholar] [CrossRef] [Green Version]
  4. Zhang, M.; Lai, Y.; Zhang, J.; Sun, Z. Numerical study on cooling characteristics of two-phase closed thermosyphon embankment in permafrost regions. Cold Reg. Sci. Technol. 2011, 65, 203–210. [Google Scholar] [CrossRef]
  5. Wang, Z.; Turan, A.; Craft, T. Review of the State of the Art for Radial Rotating Heat Pipe Technology Potentially Applicable to Gas Turbine Cooling. Thermo 2023, 3, 127–147. [Google Scholar] [CrossRef]
  6. Alammar, A.A.; Al-Dadah, R.K.; Mahmoud, S.M. Numerical investigation of effect of fill ratio and inclination angle on a thermosiphon heat pipe thermal performance. Appl. Therm. Eng. 2016, 108, 1055–1065. [Google Scholar] [CrossRef]
  7. Xu, Z.; Zhang, Y.; Li, B.; Wang, C.-C.; Li, Y. The influences of the inclination angle and evaporator wettability on the heat performance of a thermosyphon by simulation and experiment. Int. J. Heat Mass Transf. 2018, 116, 675–684. [Google Scholar] [CrossRef]
  8. Gou, X.; Li, G.; Zhang, R.; Jian, C.; Zhang, Q.; Li, B.; Dong, Q. Critical and optimal inclination angles of two-phase closed thermosyphon under different operating conditions. Int. J. Heat Mass Transf. 2021, 177, 121540. [Google Scholar] [CrossRef]
  9. Negishi, K.; Sawada, T. Heat transfer performance of an inclined two-phase closed thermosyphon. Int. J. Heat Mass Transf. 1983, 26, 1207–1213. [Google Scholar] [CrossRef]
  10. Kim, Y.; Shin, D.H.; Kim, J.S.; You, S.M.; Lee, J. Boiling and condensation heat transfer of inclined two-phase closed thermosyphon with various filling ratios. Appl. Therm. Eng. 2018, 145, 328–342. [Google Scholar] [CrossRef]
  11. Shabgard, H.; Xiao, B.; Faghri, A.; Gupta, R.; Weissman, W. Thermal characteristics of a closed thermosyphon under various filling conditions. Int. J. Heat Mass Transf. 2014, 70, 91–102. [Google Scholar] [CrossRef]
  12. Zhang, T.; Yan, Z.; Wang, L.; Zheng, W.; Su, Y.; Zheng, R. Droplet entrainment within the evaporator to the suitable volume-filling ratio of a vertical two-phase closed thermosyphon. Int. J. Therm. Sci. 2021, 159, 106576. [Google Scholar] [CrossRef]
  13. Jiao, B.; Qiu, L.; Zhang, X.; Zhang, Y. Investigation on the effect of filling ratio on the steady-state heat transfer performance of a vertical two-phase closed thermosyphon. Appl. Therm. Eng. 2008, 28, 1417–1426. [Google Scholar] [CrossRef]
  14. Noie, S. Heat transfer characteristics of a two-phase closed thermosyphon. Appl. Therm. Eng. 2005, 25, 495–506. [Google Scholar] [CrossRef]
  15. Lataoui, Z.; Jemni, A. Experimental investigation of a stainless steel two-phase closed thermosyphon. Appl. Therm. Eng. 2017, 121, 721–727. [Google Scholar] [CrossRef]
  16. He, Y.-L.; Wang, K.; Qiu, Y.; Du, B.-C.; Liang, Q.; Du, S. Review of the solar flux distribution in concentrated solar power: Non-uniform features, challenges, and solutions. Appl. Therm. Eng. 2019, 149, 448–474. [Google Scholar] [CrossRef]
  17. Nemitallah, M.; Habib, M.; Ben Mansour, R.; El Nakla, M. Numerical predictions of flow boiling characteristics: Current status, model setup and CFD modeling for different non-uniform heating profiles. Appl. Therm. Eng. 2015, 75, 451–460. [Google Scholar] [CrossRef]
  18. Wang, Z.; Turan, A. Influence of non-uniform wall heat flux on critical heat flux prediction in upward flowing round pipe two-phase flow. Int. J. Heat Mass Transf. 2021, 164, 120619. [Google Scholar] [CrossRef]
  19. Jang, D.S.; Chung, H.J.; Jeon, Y.; Kim, Y. Thermal performance characteristics of a pulsating heat pipe at various nonuniform heating conditions. Int. J. Heat Mass Transf. 2018, 126, 855–863. [Google Scholar] [CrossRef]
  20. Hager, B.; Chang, W. Operating Characteristics of a Grooved Flat-Piate Heat Pipe under Uniform and Non-Uniform Heat Fluxes. In Proceedings of the 5th Joint Thermophysics and Heat Transfer Conference, Seattle, WA, USA, 18–20 June 1990. [Google Scholar] [CrossRef]
  21. Mangini, D.; Mameli, M.; Fioriti, D.; Filippeschi, S.; Araneo, L.; Marengo, M. Hybrid Pulsating Heat Pipe for space applications with non-uniform heating patterns: Ground and microgravity experiments. Appl. Therm. Eng. 2017, 126, 1029–1043. [Google Scholar] [CrossRef]
  22. Cho, W.; Jang, D.S.; Lim, J.; Song, K.; Kim, Y. Performance Characteristics of Pulsating Heat Pipe with Various Non-Uniform Heating Conditions. In Proceedings of the International Heat Transfer Conference 16, Beijing, China, 10–15 August 2018; pp. 4789–4794. [Google Scholar] [CrossRef]
  23. Boo, J.H.; Kim, H.G. Experimental study on the performance characteristics of a cylindrical heat pipe having a screen wick subject to multiple heat sources. Appl. Therm. Eng. 2017, 126, 1209–1215. [Google Scholar] [CrossRef]
  24. Chen, S.; Yang, Z.; Duan, Y.; Chen, Y.; Wu, D. Simulation of condensation flow in a rectangular microchannel. Chem. Eng. Process. Process. Intensif. 2014, 76, 60–69. [Google Scholar] [CrossRef]
  25. Lee, W.H. Pressure iteration scheme for two-phase flow modeling. In Multiphase Transport: Fundamentals, Reactor Safety, Applications; Los Alamos Scientific Laboratory: Los Alamos, NM, USA, 1980; pp. 407–432. [Google Scholar]
  26. De Schepper, S.C.; Heynderickx, G.J.; Marin, G.B. Modeling the evaporation of a hydrocarbon feedstock in the convection section of a steam cracker. Comput. Chem. Eng. 2009, 33, 122–132. [Google Scholar] [CrossRef]
  27. Kafeel, K.; Turan, A. Axi-symmetric simulation of a two phase vertical thermosyphon using Eulerian two-fluid methodology. Heat Mass Transf. 2013, 49, 1089–1099. [Google Scholar] [CrossRef]
  28. Fadhl, B.; Wrobel, L.C.; Jouhara, H. Numerical modeling of the temperature distribution in a two-phase closed ther-mosyphon. Appl. Therm. Eng. 2013, 60, 122–131. [Google Scholar] [CrossRef] [Green Version]
  29. Abdullahi, B. Development and Optimization of Heat Pipe Based Compound Parabolic Collector. Ph.D. Thesis, University of Birmingham, Birmingham, UK, 2015. [Google Scholar]
  30. Greenshields, C.; Weller, H. Notes on Computational Fluid Dynamics: General Principles; CFD Direct Ltd.: Reading, UK, 2022. [Google Scholar]
  31. Tomiyama, A.; Tamai, H.; Zun, I.; Hosokawa, S. Transverse migration of single bubbles in simple shear flows. Chem. Eng. Sci. 2002, 57, 1849–1858. [Google Scholar] [CrossRef]
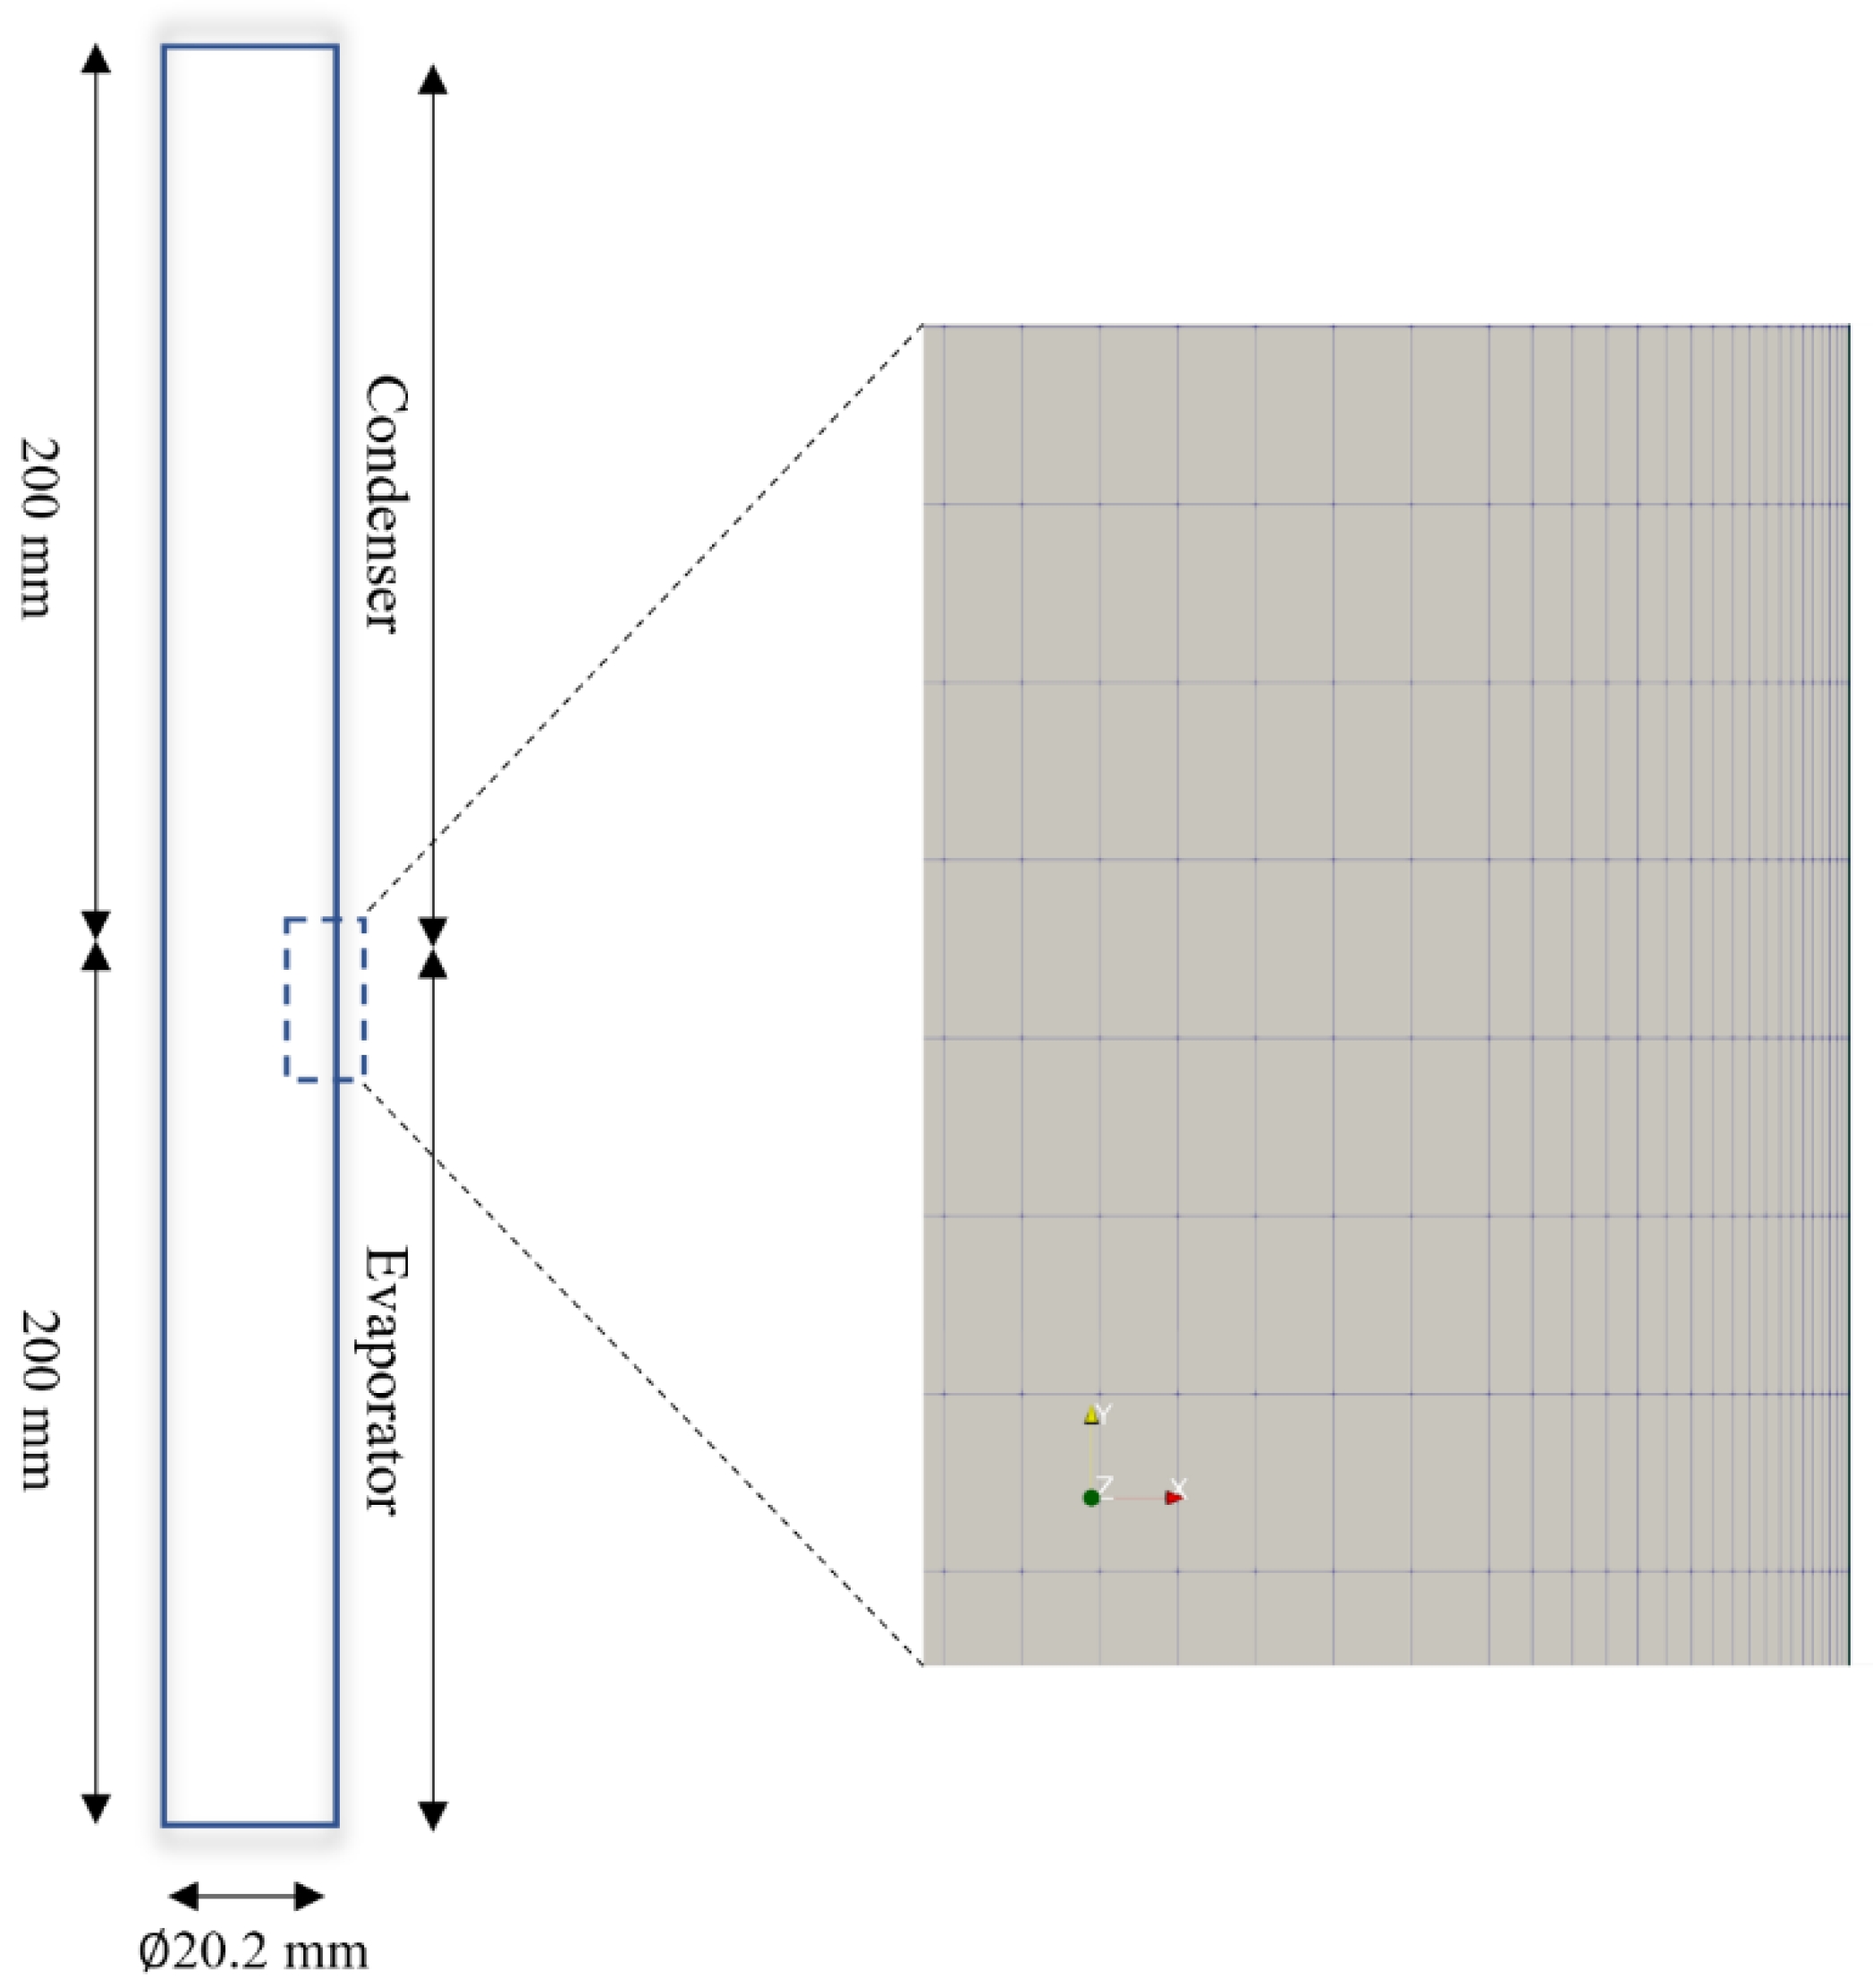
Figure 1. The dimensions of the computational domain.
Energies 16 05141 g001
Figure 2. Heat flux profiles (arrows show the direction and magnitude of the local heating).
Energies 16 05141 g002
Figure 3. Test of time-averaging intervals on (a) inner-wall temperature, and (b) void fraction distribution at a height of 0.1 m (60.18 W).
Energies 16 05141 g003
Figure 4. Contours of liquid phase volume fraction, showing the liquid (red) between 3.0 and 4.0 s (60.18 W).
Energies 16 05141 g004
Figure 5. Contours of liquid phase volume fraction, showing the liquid (red) at different times.
Energies 16 05141 g005
Figure 6. Radial distribution of void fraction at different heights with heat input of (a) 39.52 W and (b) 60.18 W.
Energies 16 05141 g006
Figure 7. The void fraction over the wall of the evaporator section with heat inputs of (a) 39.52 W and (b) 60.18 W.
Energies 16 05141 g007
Figure 8. Overall condensation rate for different profile non-uniformities at heat input of (a) 39.52 W and (b) 60.18 W.
Energies 16 05141 g008
Figure 9. Overall thermal resistance with different heat flux profiles at (a) 39.52 W and (b) 60.18 W (20% non-uniformity).
Energies 16 05141 g009
Table 1. Constant thermal boundary conditions.
Power (W)Evaporator Heat Flux (W·m−2)Ta (K)Condenser Heat Transfer Coefficient
(W·m−2·K)
39.523114291.4310.2
60.184742291.4421.8
Table 2. Grid sensitivity analysis.
Coarse (30 × 260)Medium (50 × 400)Fine (70 × 560)
Height (m)Averaged Mixture Temperature
(K)
Averaged Mixture Temperature
(K)
Percentage Change from Coarse (%)Averaged Mixture Temperature
(K)
Percentage Change from Medium (%)
0.02374.74374.670.02374.530.04
0.07374.62374.610.003374.580.01
0.12374.66374.800.04374.910.03
0.25326.72312.744.28308.821.25
0.35312.70310.380.74307.960.78
Table 3. Comparison between the experimental and predicted wall temperature.
Power_39.52 WPower_60.18 W
Height (m)Exp (K)Sim (K)Error (%)Exp (K)Sim (K)Error (%)
0.02380.53373.951.73386.22374.533.02
0.07380373.951.59384.26374.542.53
0.12377.01374.050.79382.31374.861.95
0.25297.73304.192.17300.4309.122.90
0.35300.45303.420.99301.3307.612.09
Disclaimer/Publisher’s Note: The statements, opinions and data contained in all publications are solely those of the individual author(s) and contributor(s) and not of MDPI and/or the editor(s). MDPI and/or the editor(s) disclaim responsibility for any injury to people or property resulting from any ideas, methods, instructions or products referred to in the content.