1. Introduction
The use of micro and mini channels in microfluidics has become prevalent in various applications ranging from electronic thermal management to the lab on a chip [
1,
2,
3,
4]. In particular, the miniaturization of electronics has resulted in an accelerated usage of micro and mini channels for high heat flux extraction in microelectronics cooling [
5,
6,
7]. Heat exchangers with microchannels provide a distinct advantage over conventional counterparts due to their high surface-area-to-volume ratios, which enable significantly higher heat transfer rates [
8]. Researchers have extensively investigated the flow boiling and thin-film evaporation in these channels, with experimental, empirical, and computational studies conducted to understand the heat transfer and fluid flow characteristics [
9,
10,
11,
12,
13]. Despite the numerous advantages of these models, they have a relatively narrow range of applicability that depends on operating conditions, such as flow parameters and heat transfer conditions, channel geometries and dimensions, and working fluid properties. The shortcomings of these correlations become more prominent when applied to predict the heat transfer and pressure drops within an operating thermal management device such as the novel Closed-Loop Two-Phase Wicked Thermosyphon (CLTPWT) [
14]. Owing to these challenges, the authors present a simple single-channel model for predicting the two-phase pressure drops within the rectangular mini channels of the novel CLTPWT. This paper begins with a brief introduction to the CLTPWT before describing the objectives of this current work.
Significance of the Current Work
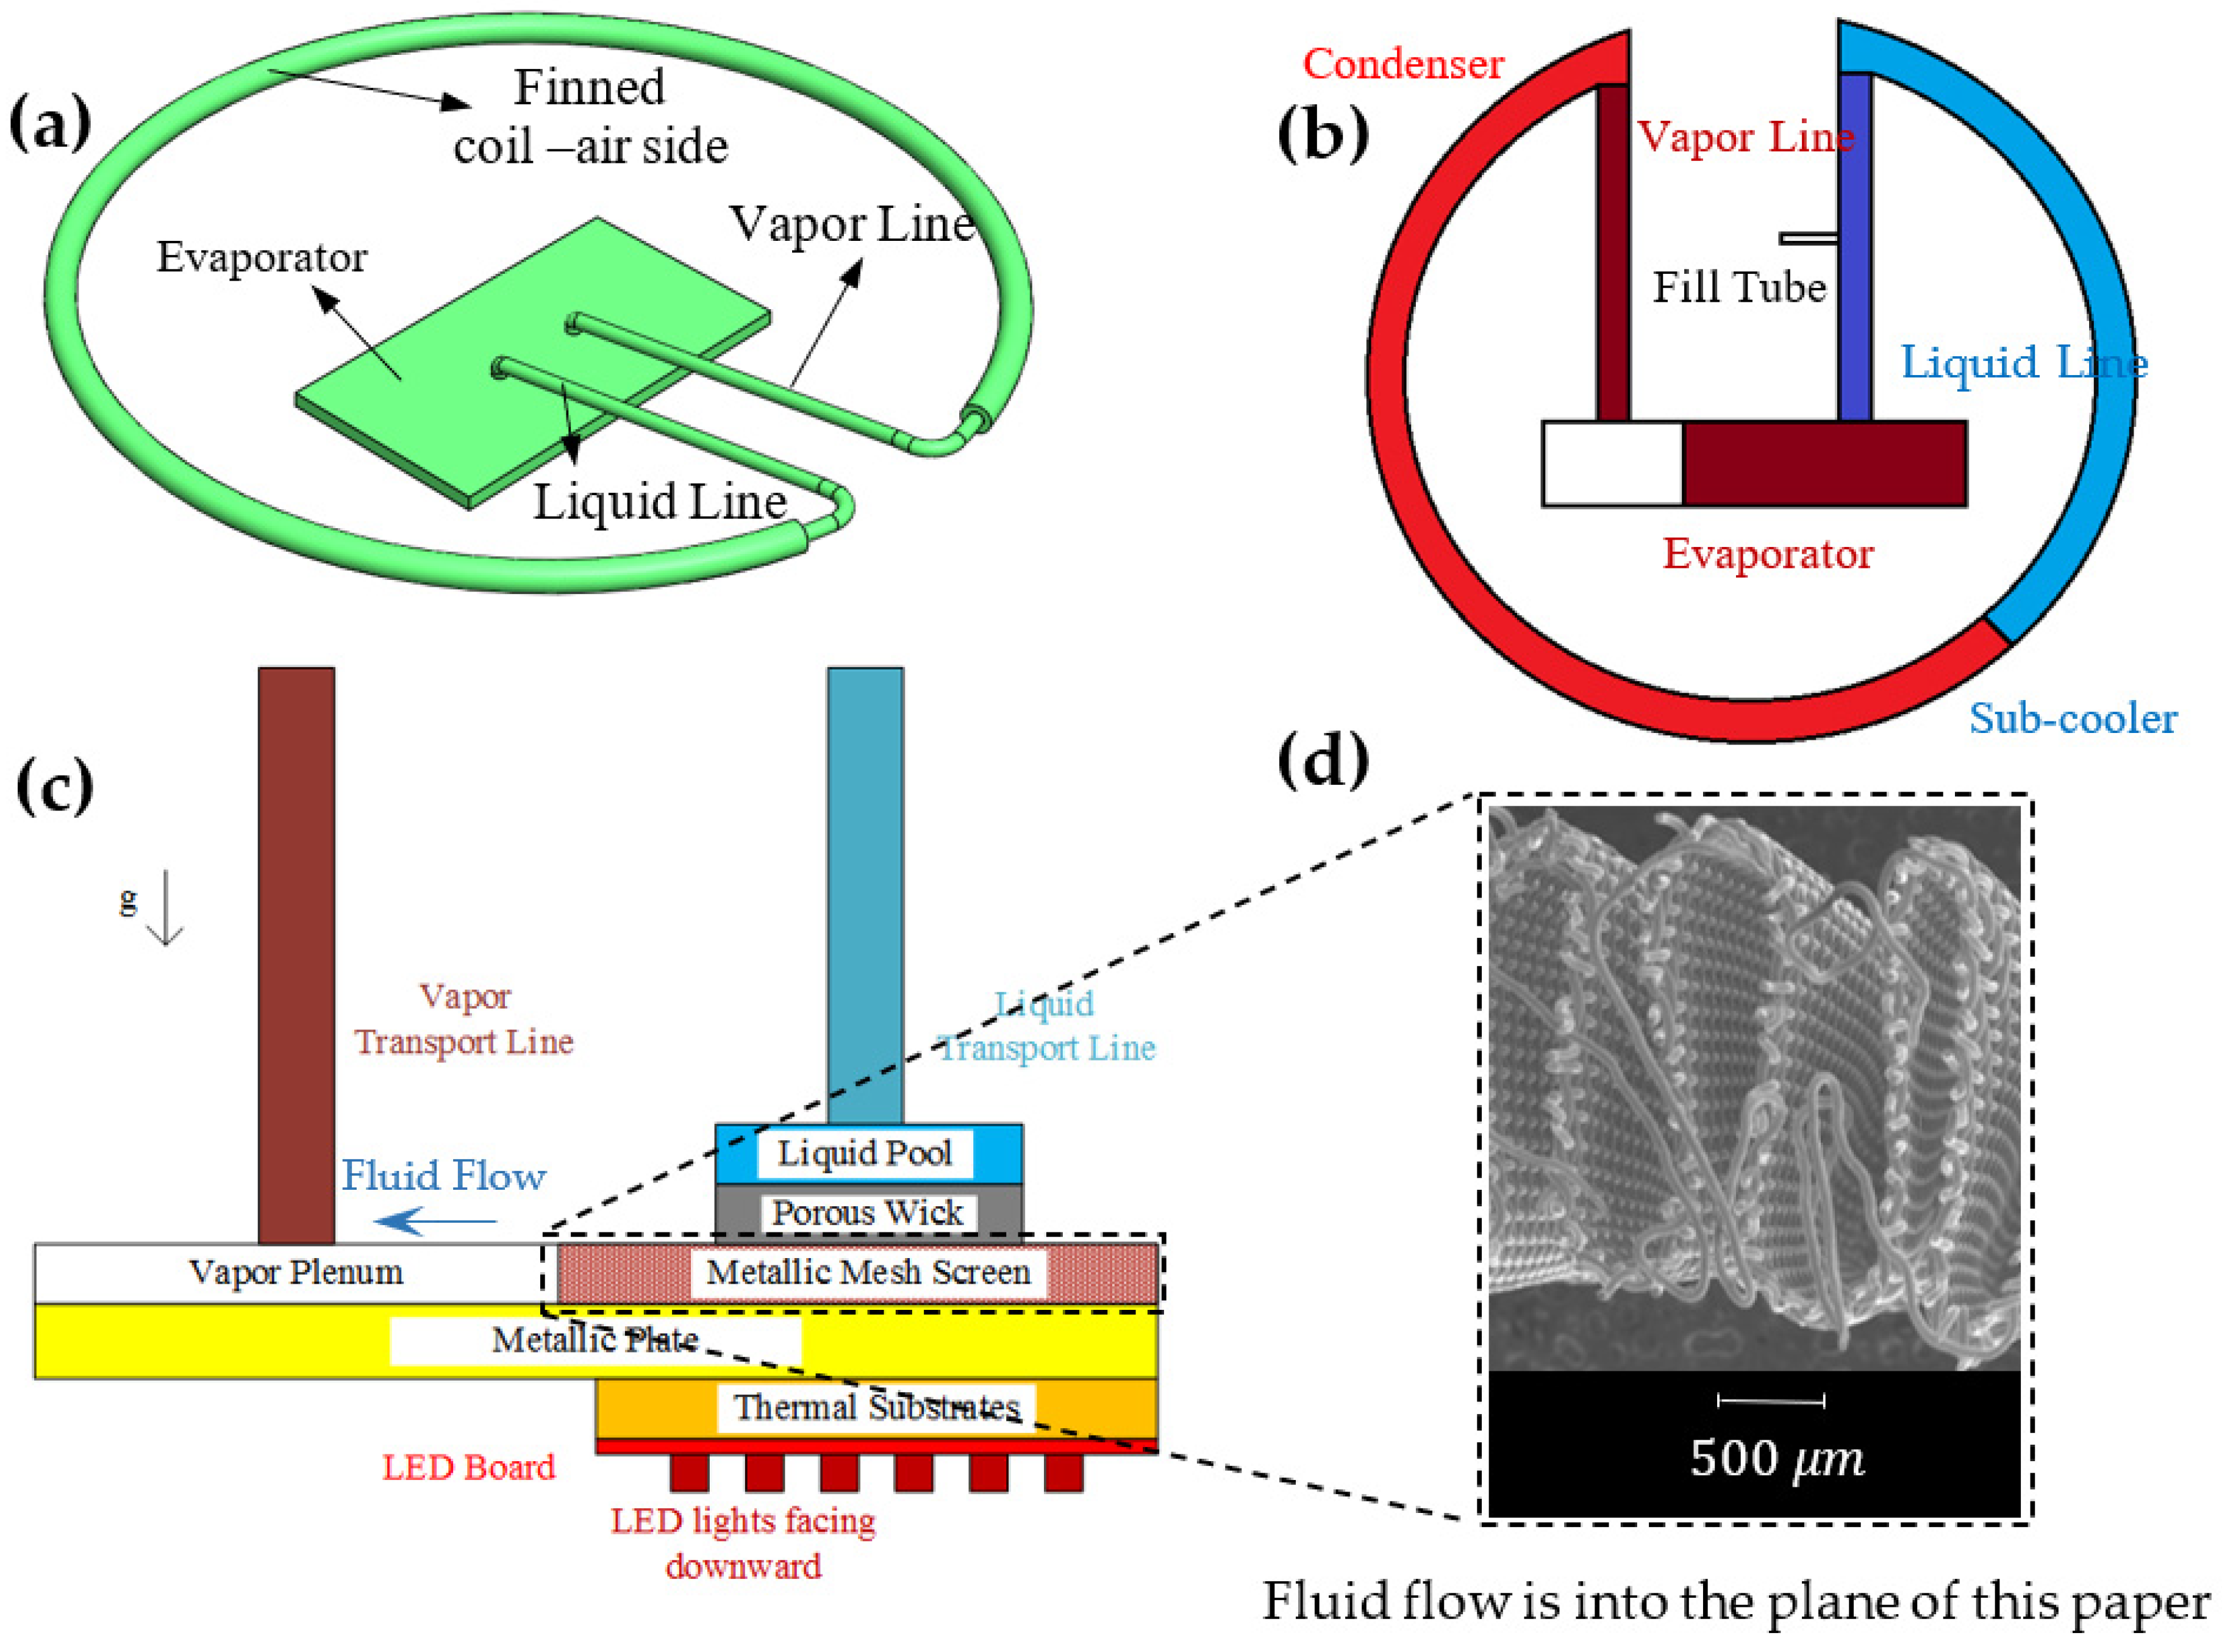
A novel thermal management device, the Closed-Loop Two-Phase Wicked Thermosyphon (CLTPWT), is employed for cooling high-power overhead light-emitting diodes (LEDs) [
14]. It comprises a central rectangular evaporator package, with LEDs integrated into it and a closed circular loop connecting the evaporator to the liquid and vapor lines (
Figure 1a). The LEDs generate thermal power, which causes the evaporation of the working fluid inside the evaporator. The evaporated vapor, along with some liquid, leaves the evaporator via the vapor transport line, and the two-phase quality of the exiting vapor is between 0.1 and 0.3 (depending on the thermal power dissipated) [
14,
15]. There are circular fins all along the loop that help dissipate the heat from the working fluid to the ambient air surrounding the CLTPWT, thereby facilitating condensation in the loop (
Figure 1b). A small portion of this loop also allows the condensed liquid to sub-cool (
Figure 1b), and this sub-cooled liquid returns to the evaporator package via the liquid transport line.
Like a conventional loop heat pipe (LHP), the evaporator package contains two porous wick structures: a wire metallic mesh screen that is folded into accordion channels and a sintered porous wick located directly above the screen (relative positions of these wick structures are highlighted in
Figure 1c). The wire diameter of the mesh screen is approximately 50 μm, and the pore diameter of the sintered wick structure is on the order of 10 μm. The height of the accordion-shaped channels of the screen is approximately 2 mm (
Figure 1d). These mesh-screen channels open into a pressure plenum (
Figure 1c). The incoming liquid enters the evaporator and travels across the porous wick into the mesh screen channels.
Even though the CLTPWT is structurally similar to conventional loop heat pipes (LHPs), i.e., it has two wicks: primary and secondary, its operation is very similar to a traditional thermosyphon. Unlike a loop heat pipe (LHP), the mass flow rate of the working fluid is determined using a favorable tilt in the liquid and vapor transport lines [
14]. This tilt provides the necessary positive hydrostatic head to overcome the viscous pressure losses experienced by the working fluid in the device [
14,
15], which includes the loss due to the liquid–vapor flow through the mesh screen channels.
This paper models the liquid–vapor flow through a single mesh screen rectangular channel to estimate the pressure drop. The single-channel model requires solving both flow and thermal fields simultaneously, like any conjugate heat transfer problem. However, in this current work, the temperature field is first solved, and the obtained thermal solution is later used to estimate the flow fields, i.e., the models are solved separately but in a coupled manner. A separated liquid–vapor flow is considered in this work, and the pressure difference across the interface is also estimated along the channel.
2. Physical Model
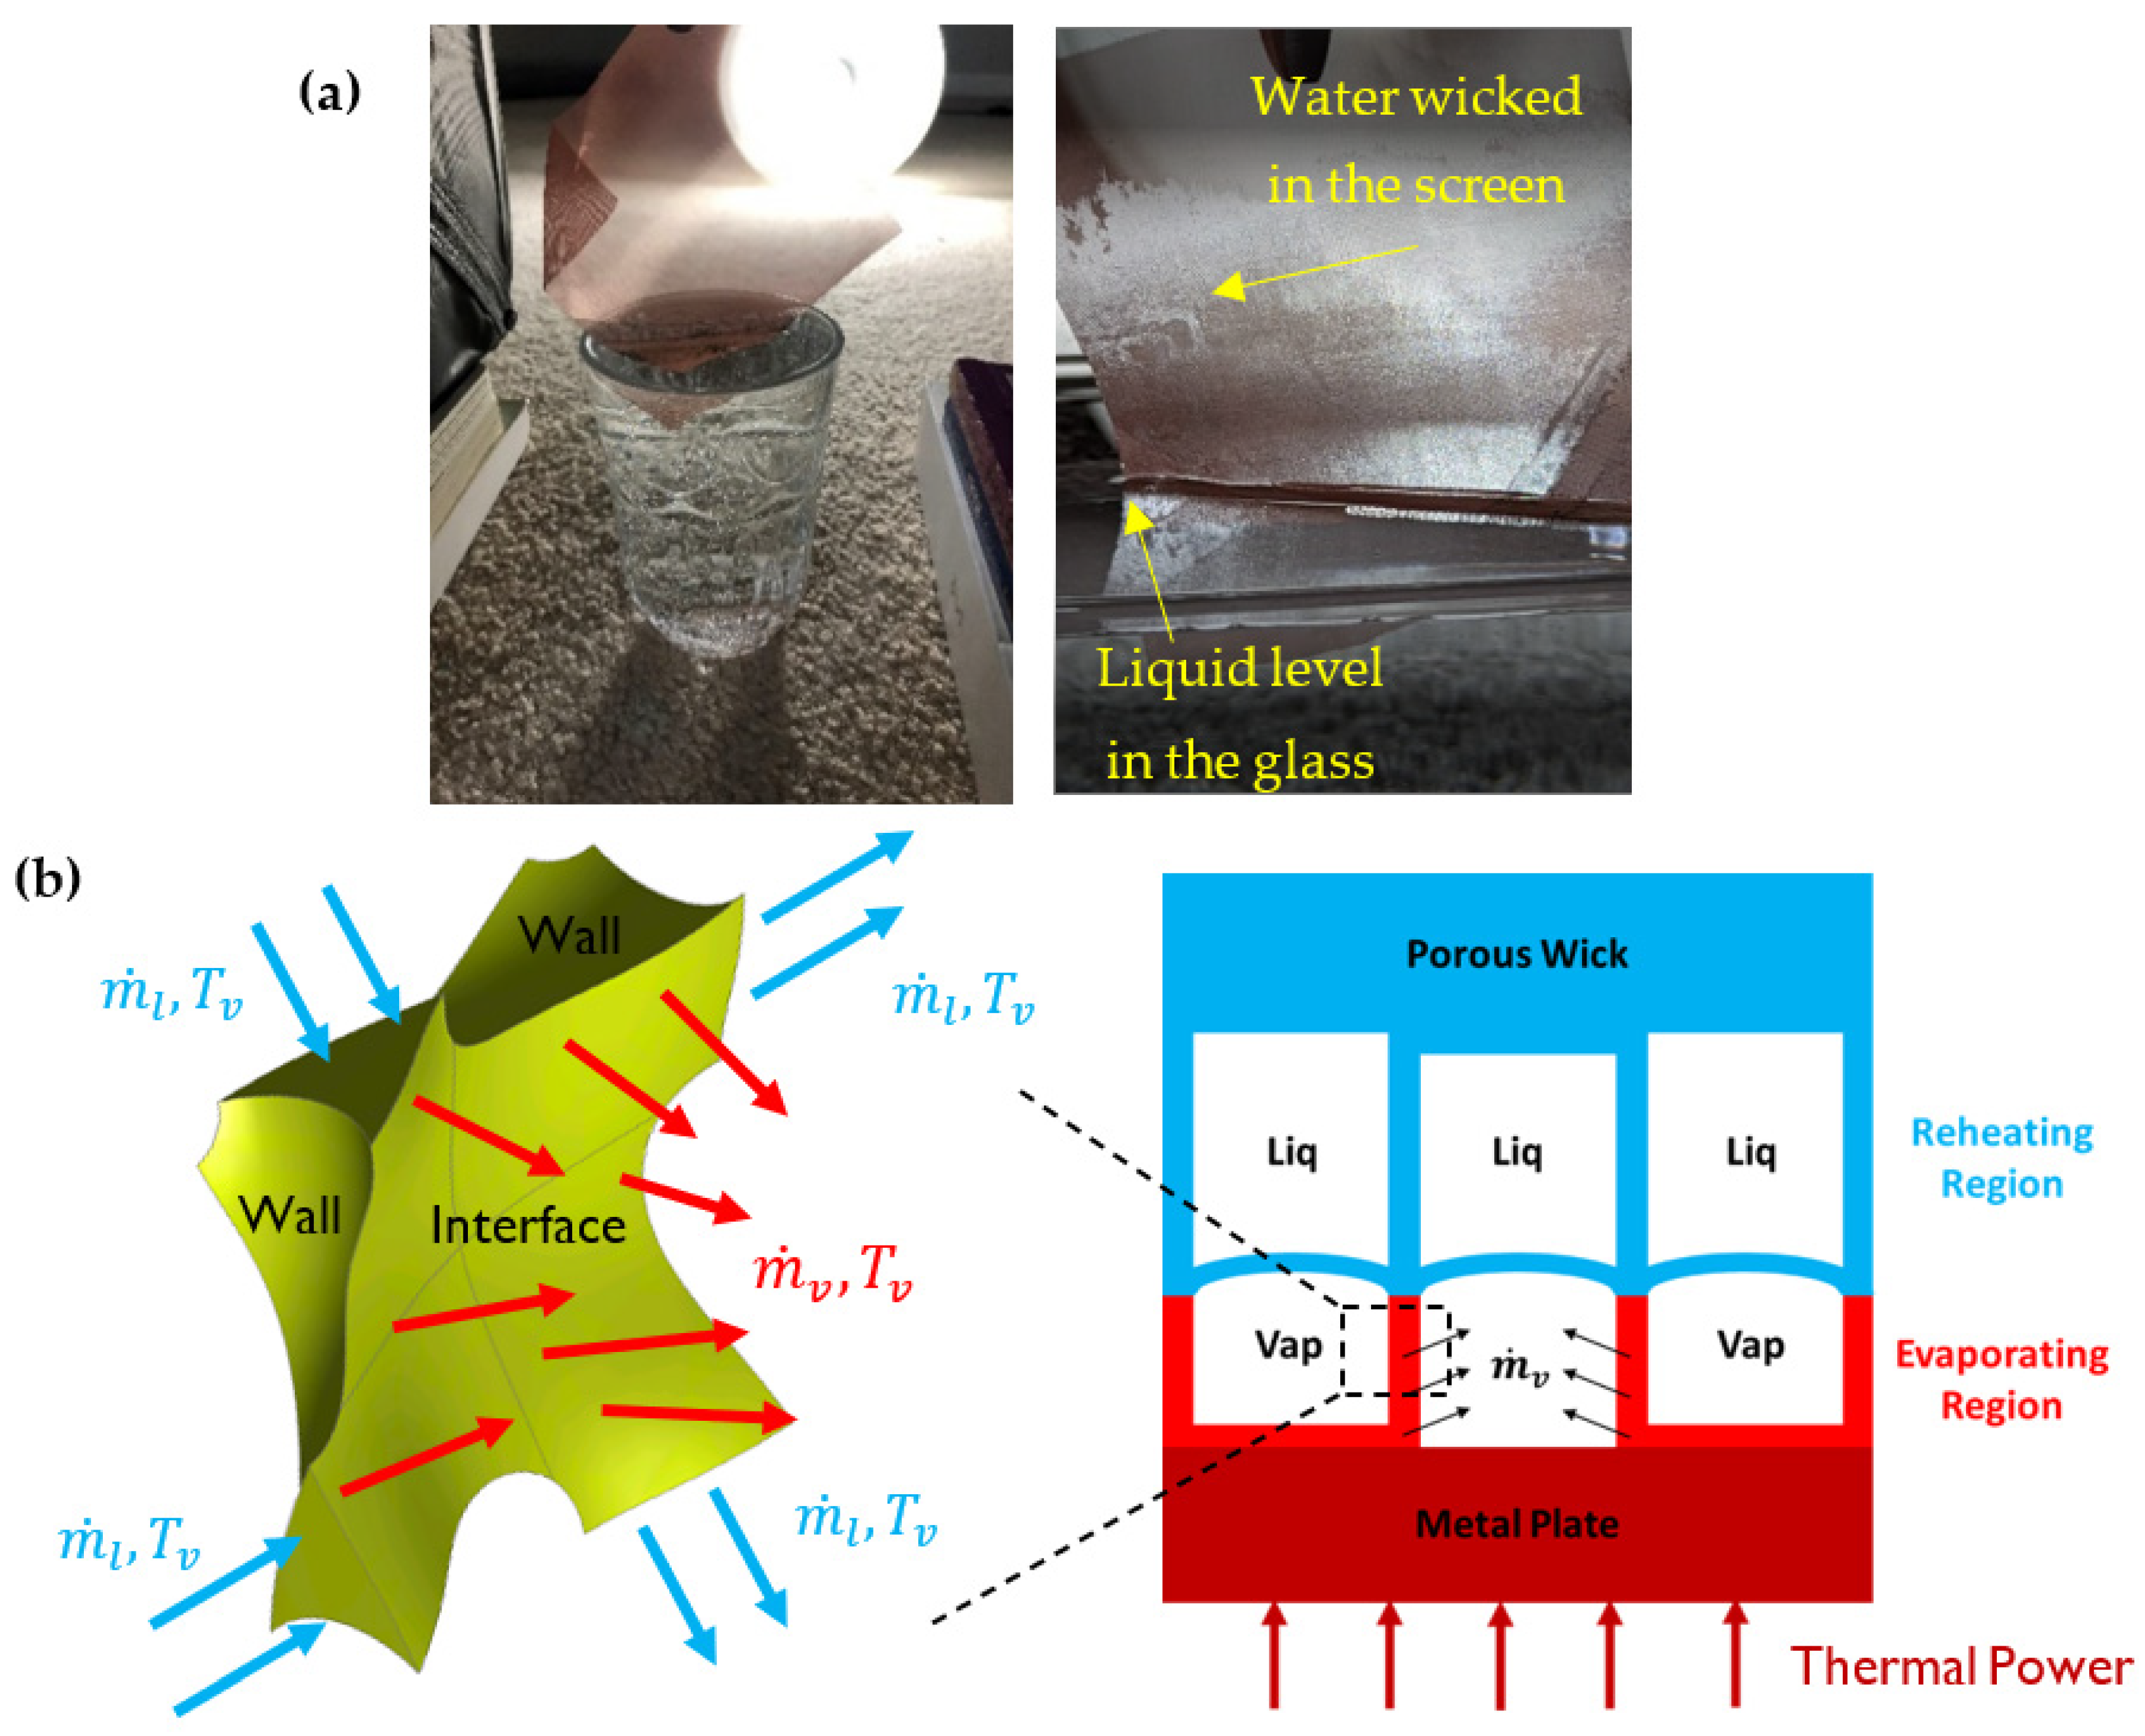
The working fluid (water) enters the mesh screen channels through the porous wick. Tests conducted on the wire mesh screen established that the screen wicks liquid and remains wet if it is in contact with the liquid (
Figure 2a) [
16].
The thermal power from the source (LEDs) is conducted up the metal plate and then along the mesh screen walls (
Figure 2b). A significant portion of this power is utilized in the evaporation of the working fluid in these channels ((
Figure 2b), evaporating region). The rest of the thermal power is conducted up the screen walls into the porous wick, where it causes reheating of the working fluid ((
Figure 2b), reheating region). The liquid evaporates to form saturated vapor at the liquid–vapor interface (
Figure 2b), which is continuously added to the bulk region of these channels. A two-phase liquid–vapor mixture flows through the wire mesh screen channel, liquid at the top and vapor at the bottom (
Figure 2b), and both phases are separated by an interface. It is important to understand that this occurs only during the steady-state operation of the CLTPWT. The wire screen as well as the accordion-shaped channels are fully saturated with liquid during the initial startup and transience. As the liquid evaporates to form vapor at the interface, the fresh liquid takes its place from the top along the screen.
3. Computational Geometry
As the temperature and flow models are solved separately (but in a coupled manner), different geometries are required for the flow and thermal analysis (unlike in conjugate heat transfer problems). Although each channel cross-section is irregular (E-SEM image,
Figure 1d), a rectangular channel cross-section is assumed for obtaining the single channel predictions. This assumption simplifies the model and allows the analysis of a single mesh screen channel.
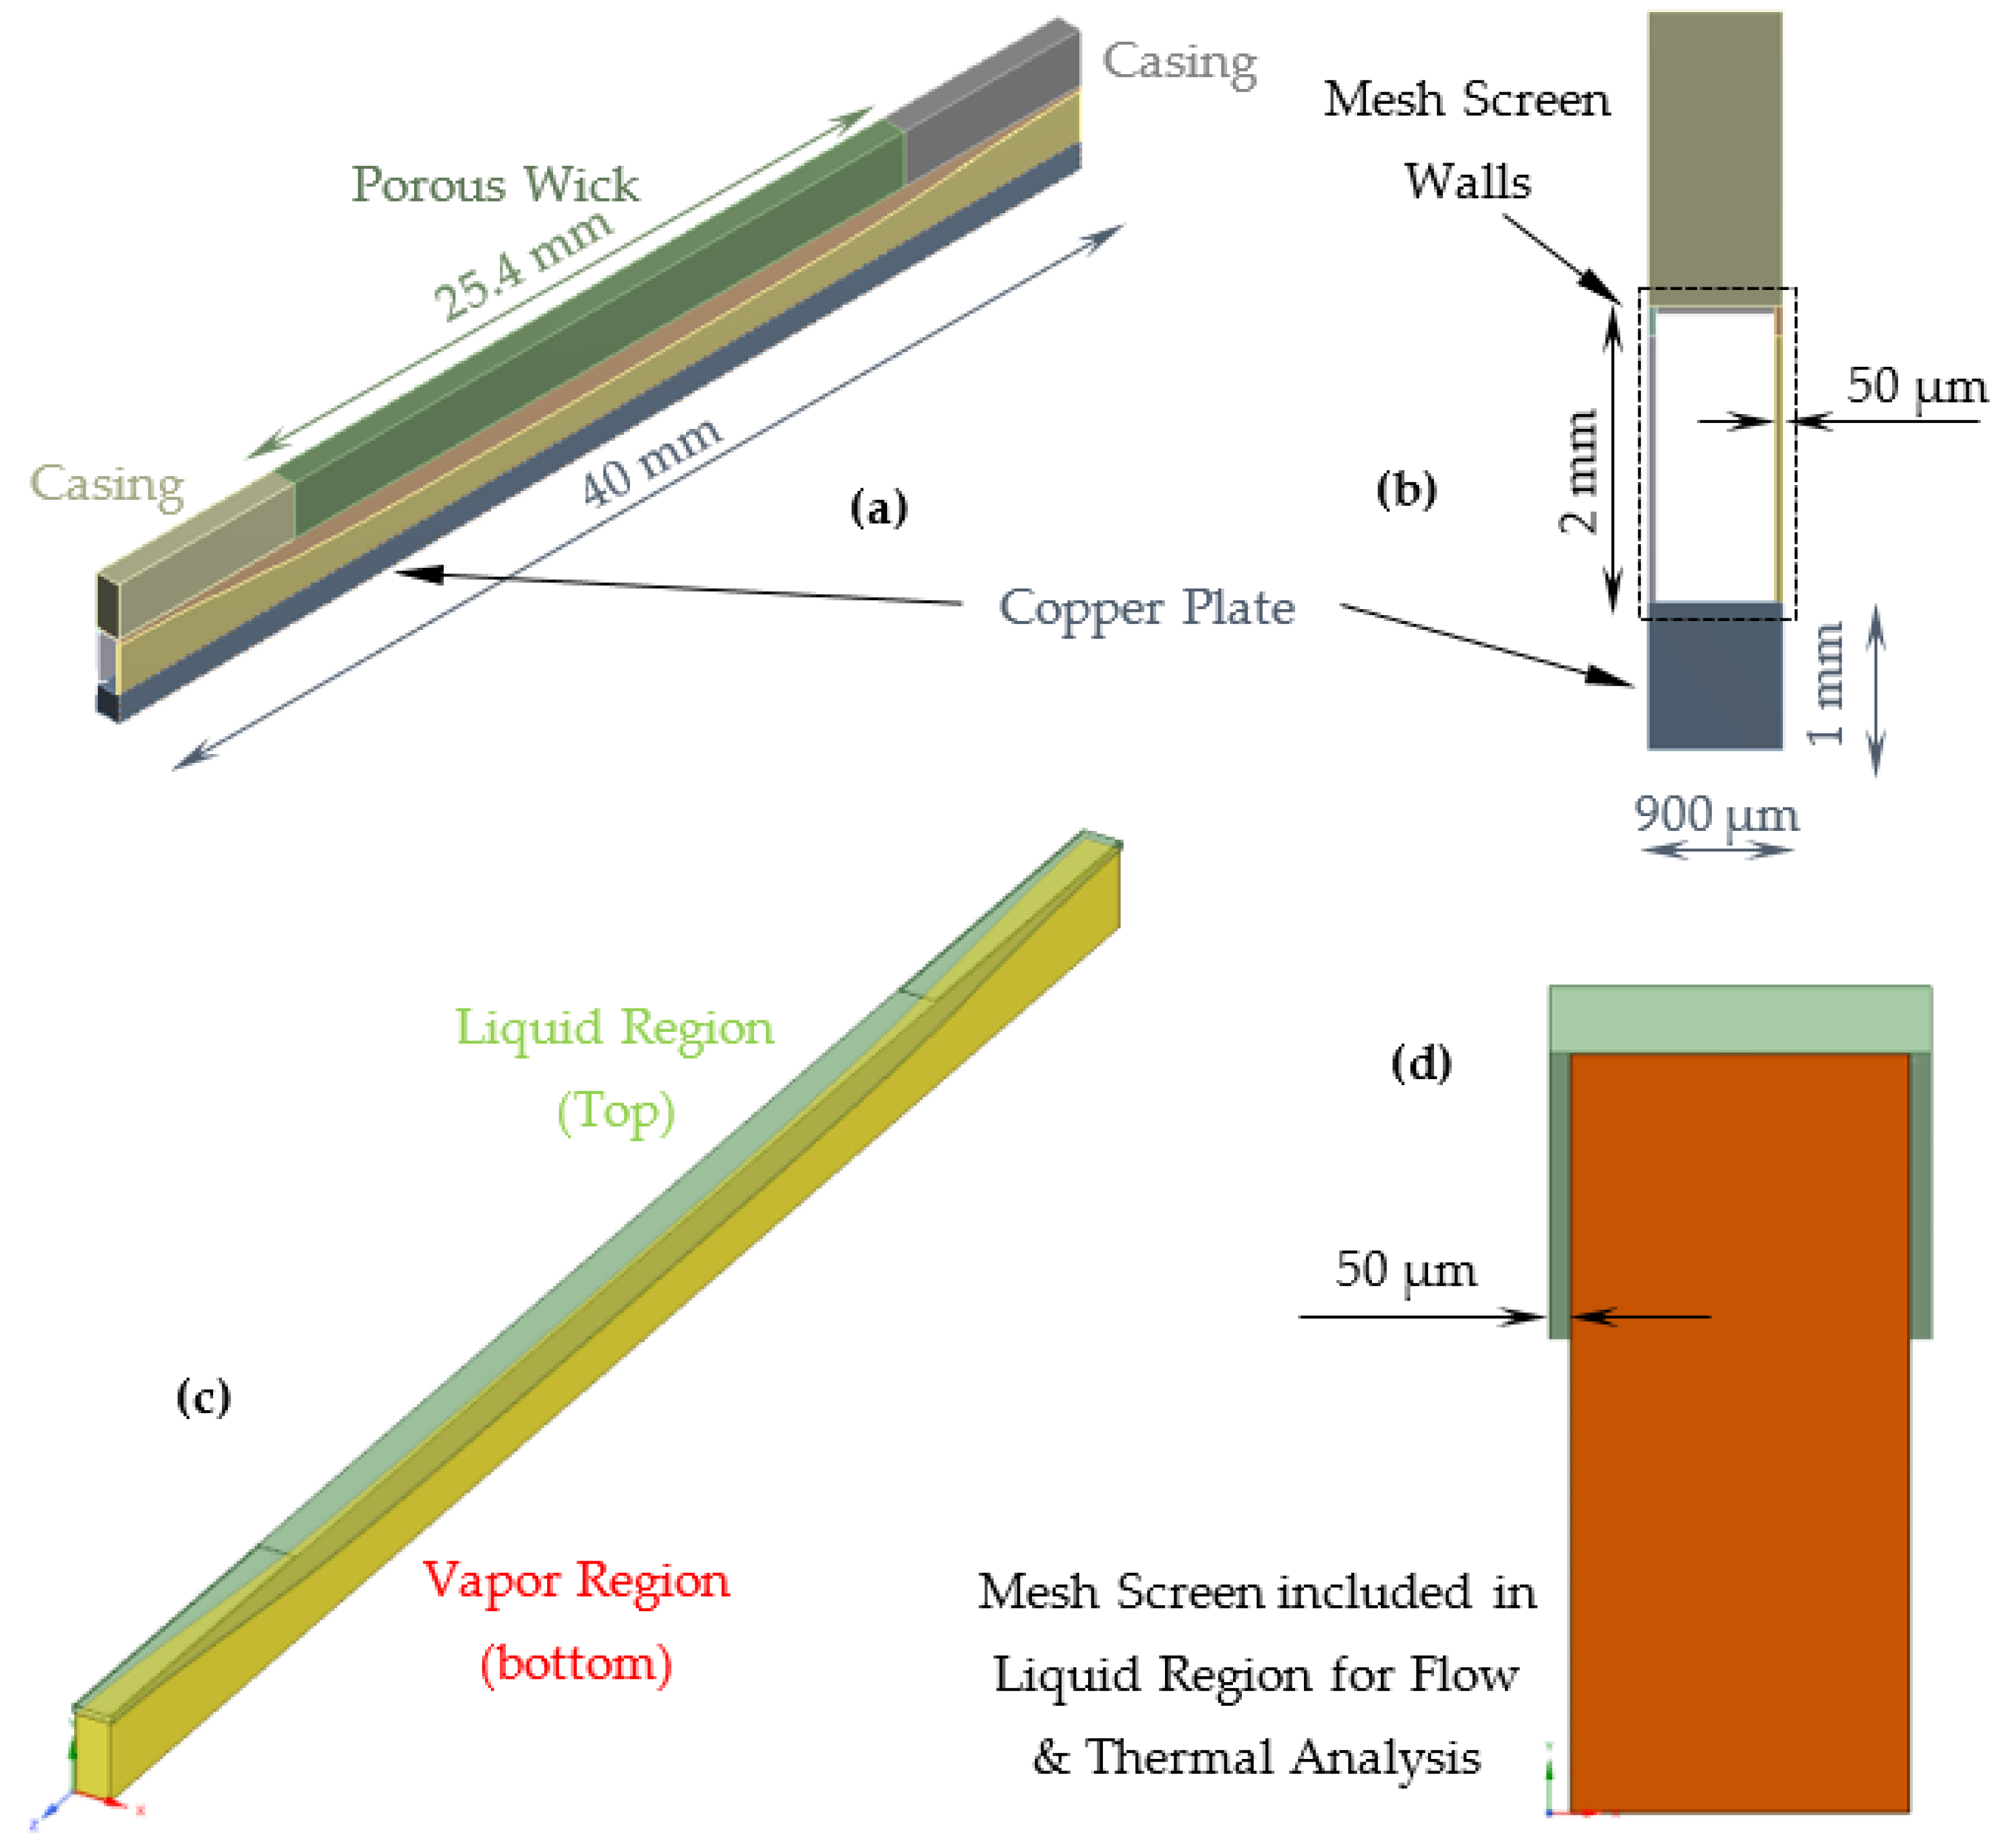
Four components of the evaporator package are included in this analysis: the metal plate, the wire mesh screen channels, the porous wick, and the external casing (
Figure 3a). The porous wick is centrally located above the mesh screen channel (
Figure 3a), and the mesh screen is treated as an equivalent rectangular slab with a known effective conductivity [
17]. Because of the symmetry of the screen, only half of its thickness is considered in the analysis. The height, width, and length of the channel are 2 mm, 800 µm, and 40 mm, respectively (
Figure 3a,b). It is important to highlight that the channel geometry in
Figure 3a,b) shows only the outer walls (not the internal flow regions) and is employed in the ‘2-h’ thermal modeling (discussed in
Section 4 titled Mathematical Model). The line running along the mesh screen walls in the streamwise direction (
Figure 3a) represents the liquid–vapor interface and is obtained from the ‘2-h’ thermal model. The internal flow regions of the channel (
Figure 3c,d) are highlighted as the liquid (top) and vapor (bottom) regions, separated by an interface. The fluid flow is solved in these regions separately to obtain the pressure drops. A detailed discussion of the thermal and flow models is covered in the next section (titled Mathematical Model).
The mesh screen offers negligible flow resistance for the liquid in both streamwise and cross-stream directions. In other words, the screen is invisible as far as the liquid flow is concerned. The screen, however, is instrumental from a thermal modeling standpoint as it conducts thermal power between the metal plate and the porous wick. For this reason, the mesh-screen walls in the liquid region are included in both the flow and thermal models. The screen portion is not included in the vapor region flow analysis as the screen is always assumed to be saturated with liquid, and the vapor generation occurs via thin-film evaporation in the wire spacing. The strong capillary forces at the liquid–vapor interface in the screen hold the liquid, thereby preventing the fluid from flowing (in the evaporating region).
4. Mathematical Model
Although the thermal and flow models are solved separately in this work, the boundary information from each model is transferred back and forth to ensure physical and mathematical coupling between the temperature and velocity fields. A detailed discussion of these models as well as the coupling between them is presented in this section.
4.1. Assumptions
The total thermal power is equally distributed among all the ~80 channels of the CLTPWT.
The total mass flow rate in the device is uniformly distributed among all the ~80 channels.
The interfacial radius of curvature is constant at every cross-section of the channel, i.e., the radius of curvature varies only along the streamwise direction of the channel.
The channel cross-section is assumed rectangular.
4.2. Channel ‘2-h’ Thermal Model
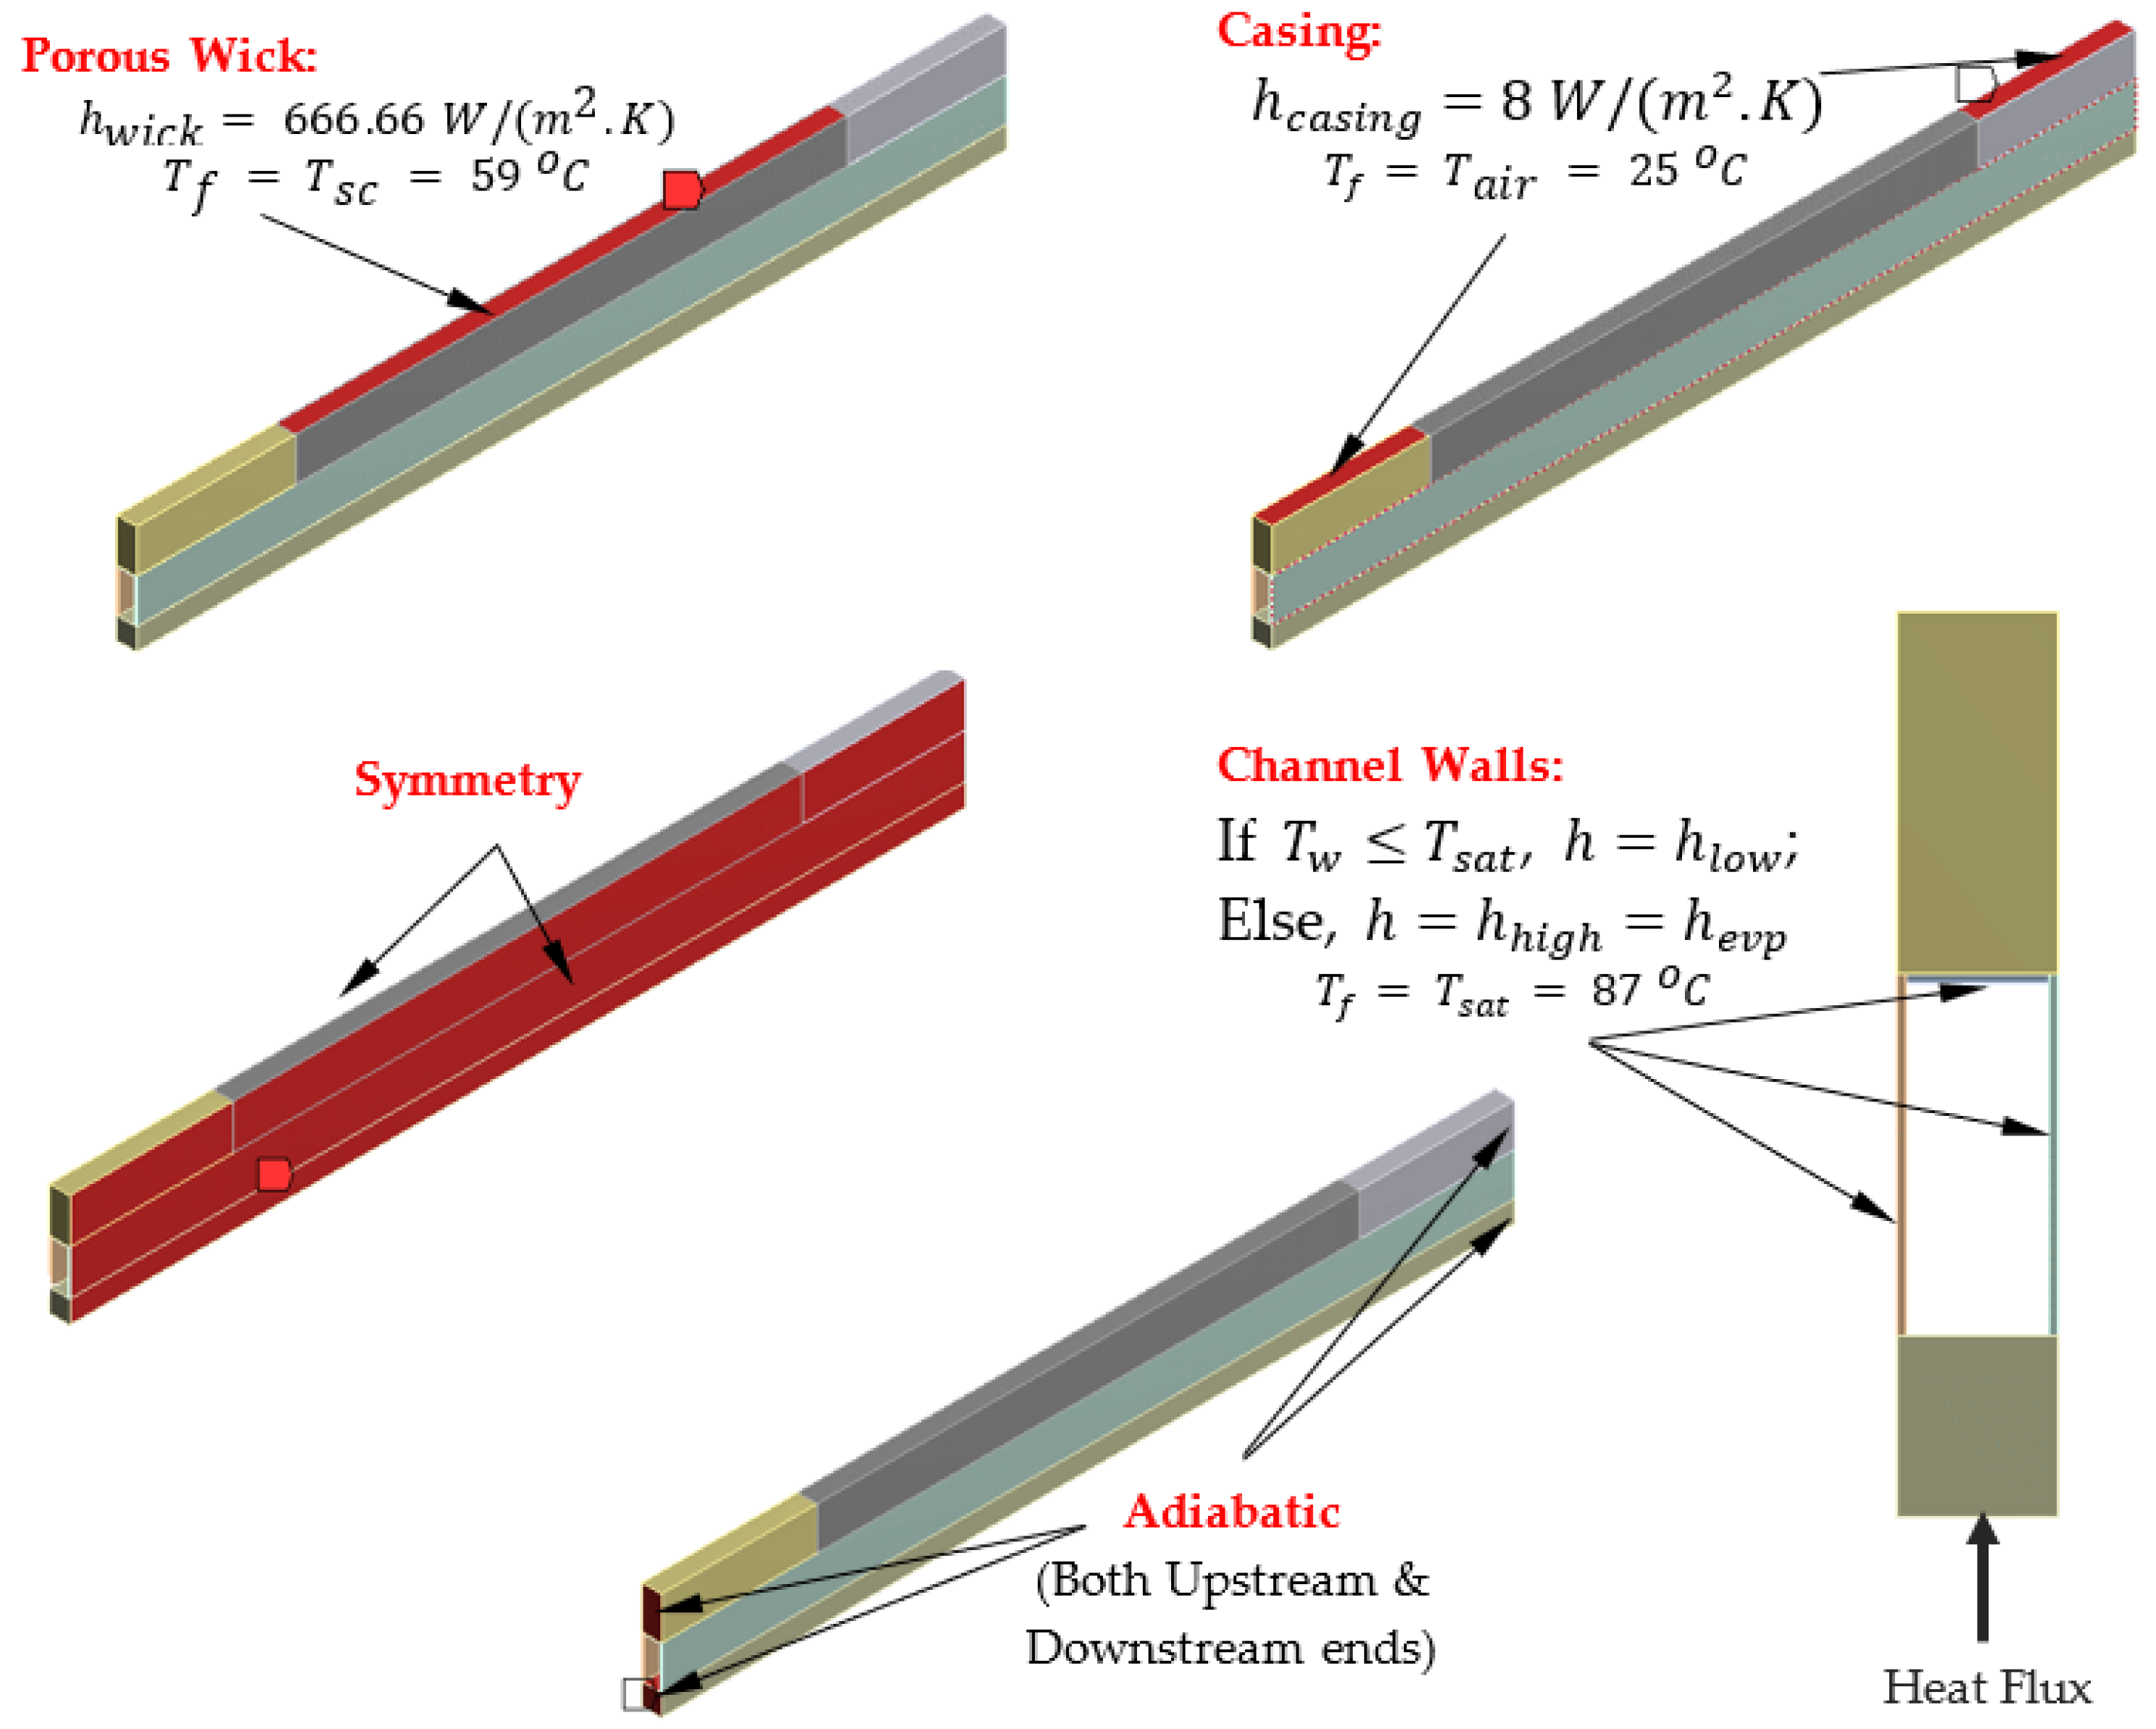
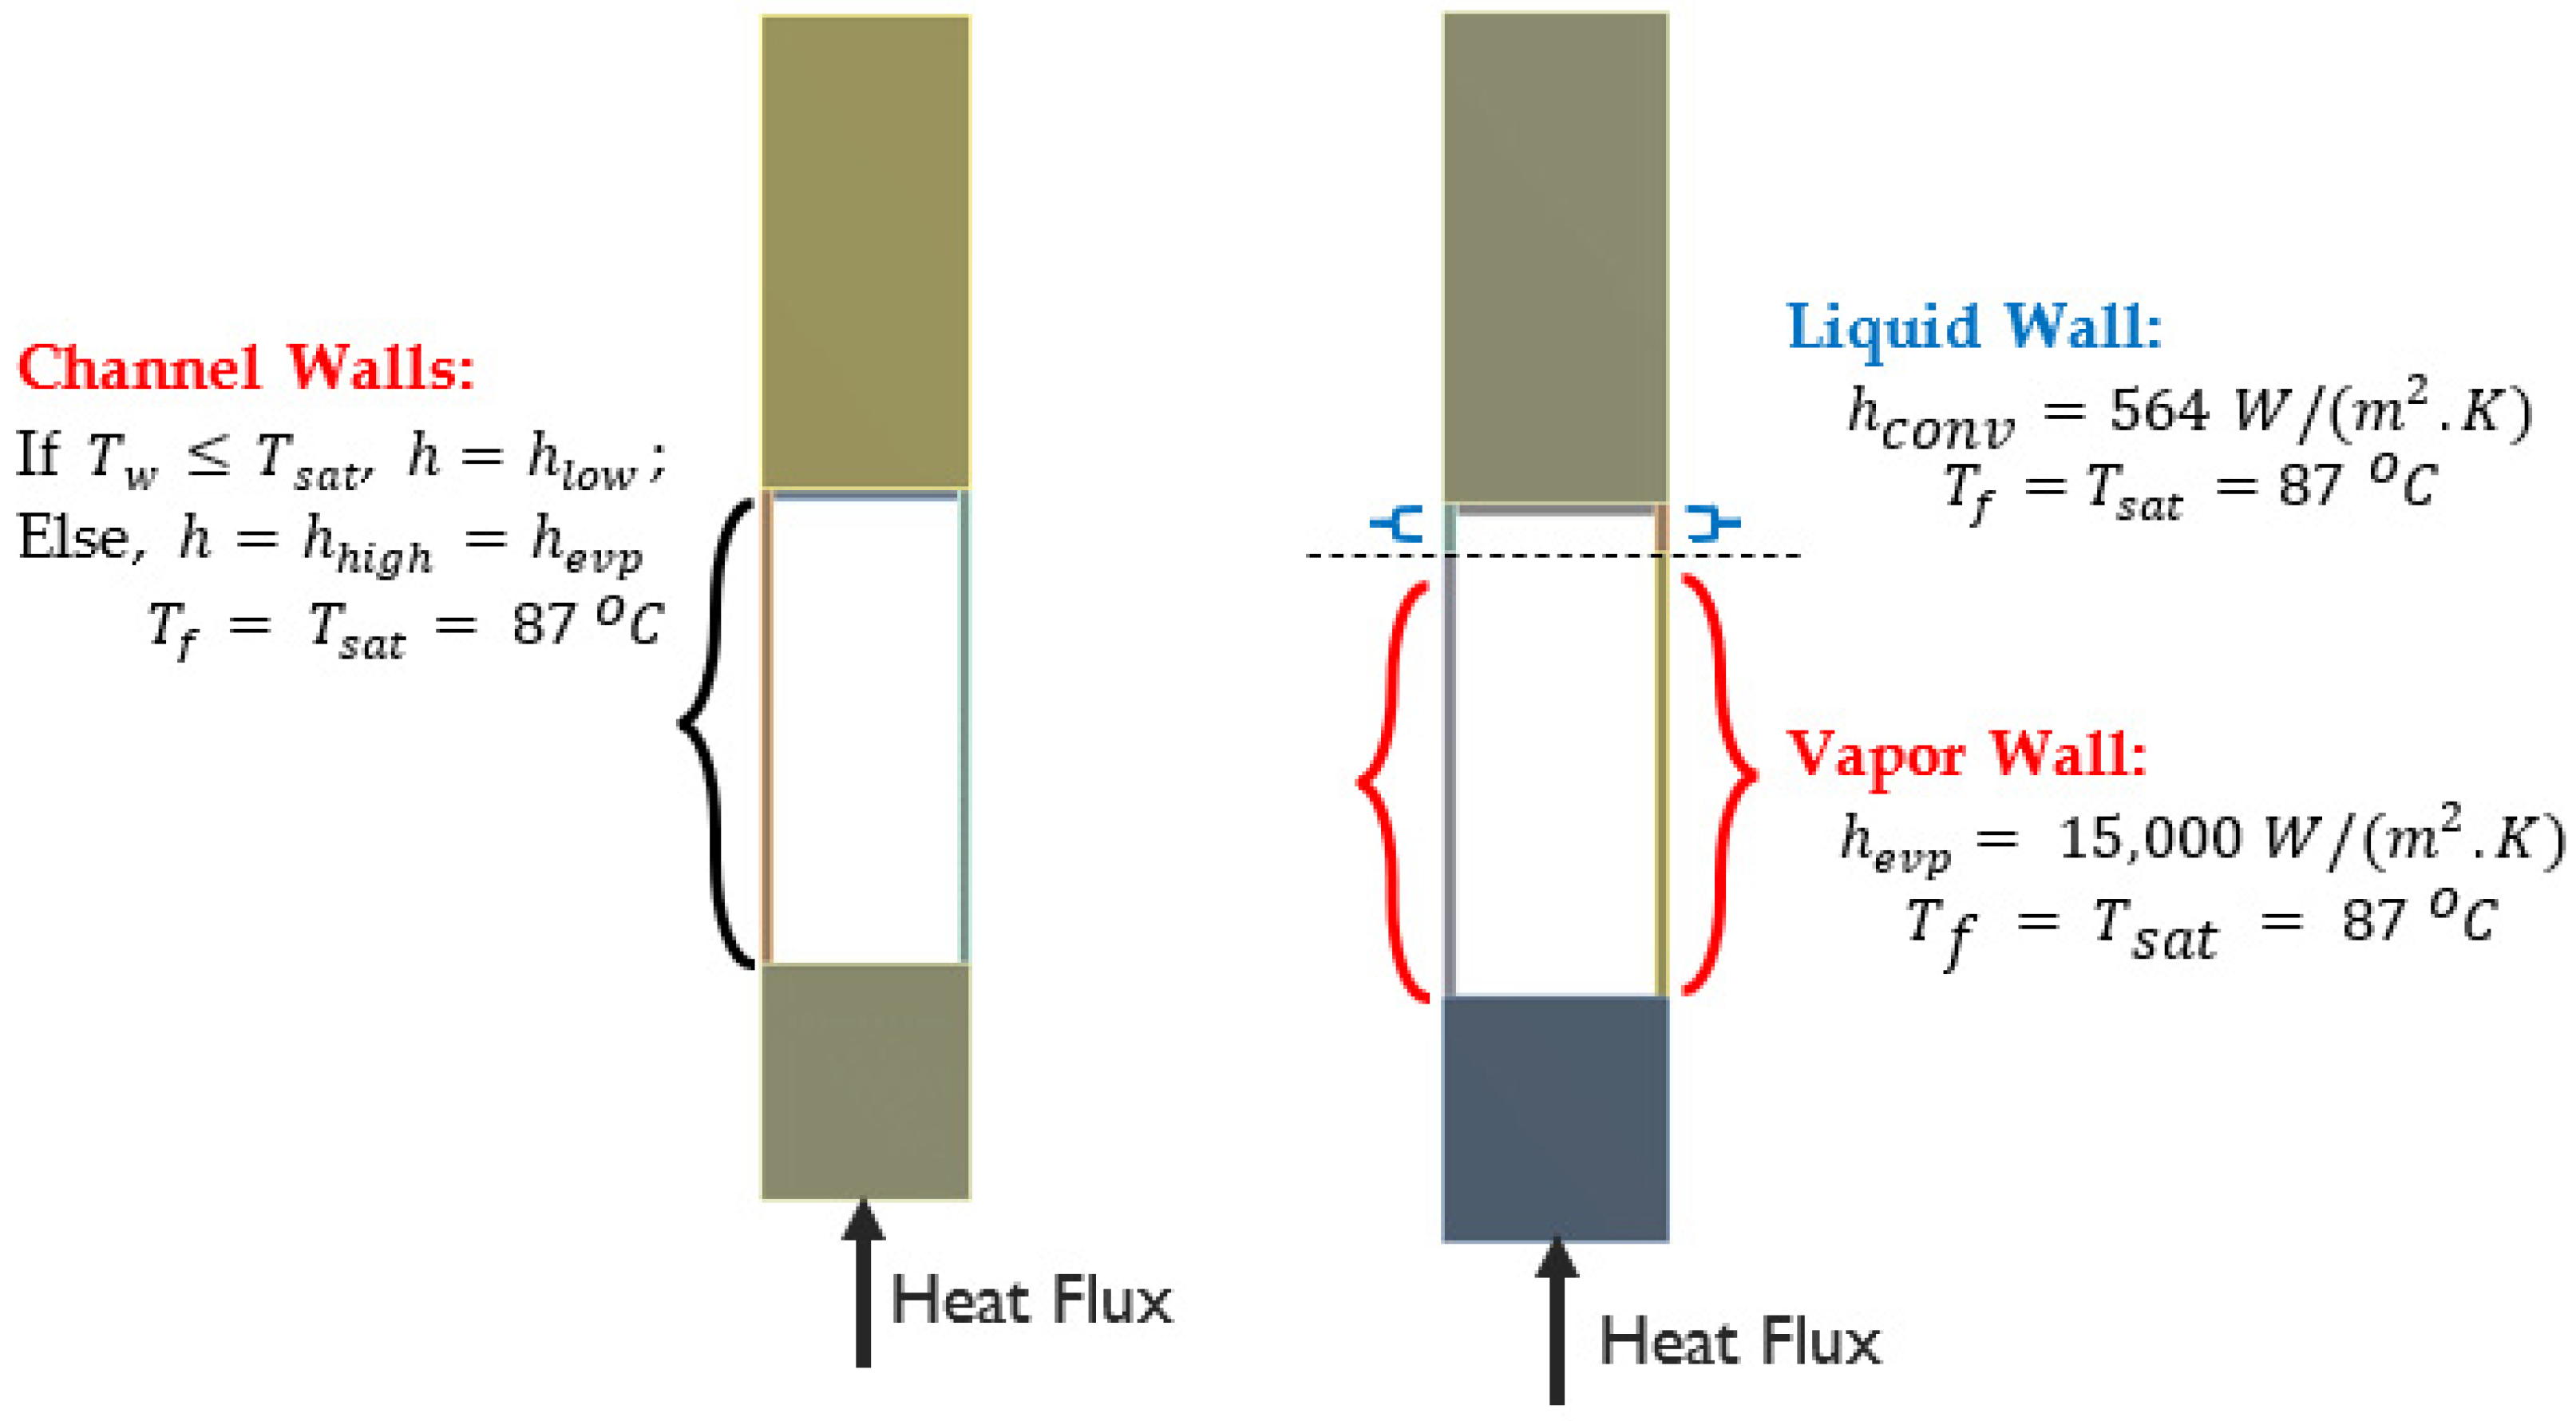
The first task in modeling the single channel is obtaining the initial location of the liquid–vapor interface in the channel. The initial location of the interface is obtained by solving a thermal ‘2-h’ model. The name ‘2-h’ stems from the usage of two heat transfer coefficients to model the convection at the mesh screen walls. The geometry employed for the ‘2-h’ model is shown in
Figure 4. Note that the screen wall is one entity in this model, which is later split into vapor and liquid walls based on the obtained steady-state temperatures from this model. The 3D steady-state thermal diffusion equation is solved to obtain the temperature fields for the geometry. The thermal properties employed to solve the model are tabulated in
Table 1. The boundary conditions employed in the model are highlighted in
Figure 4. Convective boundary conditions are specified on the inner walls of the mesh screen, the top wall of the porous wick, and the top walls of the casing. Parameters such as the saturation (
Tsat) and sub-cooler (
Tsc) temperatures and total mass flow rate
of the working fluid are independent variables for this model (obtained from experiments on the CLTPWT [
15]). An ‘if’ condition based on the screen wall temperature models the evaporation of the working fluid.
The reheating of the subcooled liquid commences in the porous wick, and Equation (4) is a simple energy balance to capture this reheating inside the porous wick. The convection heat transfer coefficient (Equation (7)) employed on the porous wick (top) surface is estimated by substituting Equation (6) into (5). The total thermal power is uniformly distributed among all the channels in the device, and a known uniform heat flux is applied to the bottom surface of the metal plate. This model is solved on a commercial finite element tool: Ansys Steady-State Thermal [
18]. The temperature solution of the mesh screen walls is exported.
The location of the liquid–vapor interface along the mesh screen walls is obtained from the temperature solution. The interface is located where the wall temperature of the screen equals the saturation temperature (
Tsat) of the vapor. The exported wall temperature solution is read via Ansys Fluent [
19], a commercial finite volume tool. Temperature isolines for
Tw =
Tsat are generated on both walls of the screen. A CAD surface is generated using these thermal isolines, and this surface acts as the liquid–vapor interface. The generated interface is initially flat and has no radius of curvature (iteration 1). Boolean operations are performed between the original channel geometry and this new interface to obtain the single channel geometry with distinct vapor and liquid regions (
Figure 3c,d). The interfacial line divides the mesh screen wall into vapor and liquid walls (
Figure 5).
The same thermal model is again solved on this obtained geometry (with split liquid and vapor walls). But this time, instead of using an ‘if’ conditional clause, separate heat transfer coefficients are defined on the vapor and liquid sidewalls of the mesh screen channel. The difference in boundary conditions between the two thermal models is highlighted in
Figure 5. The 3D steady-state conduction equation is solved for the temperature field. The other boundary conditions are the same as in the 2-h thermal model (discussed in
Figure 4). This model is also solved using Ansys Steady-State Thermal [
18], a commercial finite element solver.
The two thermal solutions, the first one using a 2-h model and the second one using separate heat transfer coefficients in liquid and vapor regions, are the same. However, the latter allows the export of temperature solution on both the liquid and vapor walls of the mesh screen channel. Knowledge of wall temperatures on the vapor side of the channel is required to estimate the vapor velocity, and the second model, which employs separate heat transfer coefficients on the vapor and liquid sides, allows this. Vapor is continuously generated via thin-film evaporation in the mesh screen and is added to the bulk region in the channel. These velocities are employed to solve the flow in the vapor region of the mesh screen channel, and these details are discussed in the sub-section on ‘Vapor Flow Model’.
4.3. Vapor Flow Model
The 3D steady-state continuity and momentum equations are solved in the vapor region of the single channel. The viscous pressure drop incurred by the vapor is small, and the Clausius–Clapeyron equation [
20] predicts very little change to the saturation temperature of the vapor for such pressure drops. As the vapor is relatively isothermal, the fluid flow is considered incompressible. The vapor side wall temperature solution obtained from the thermal model is imported to Ansys Fluent [
21] using Ansys System Coupling [
22]. The user-defined functions (UDFs) in Ansys Fluent [
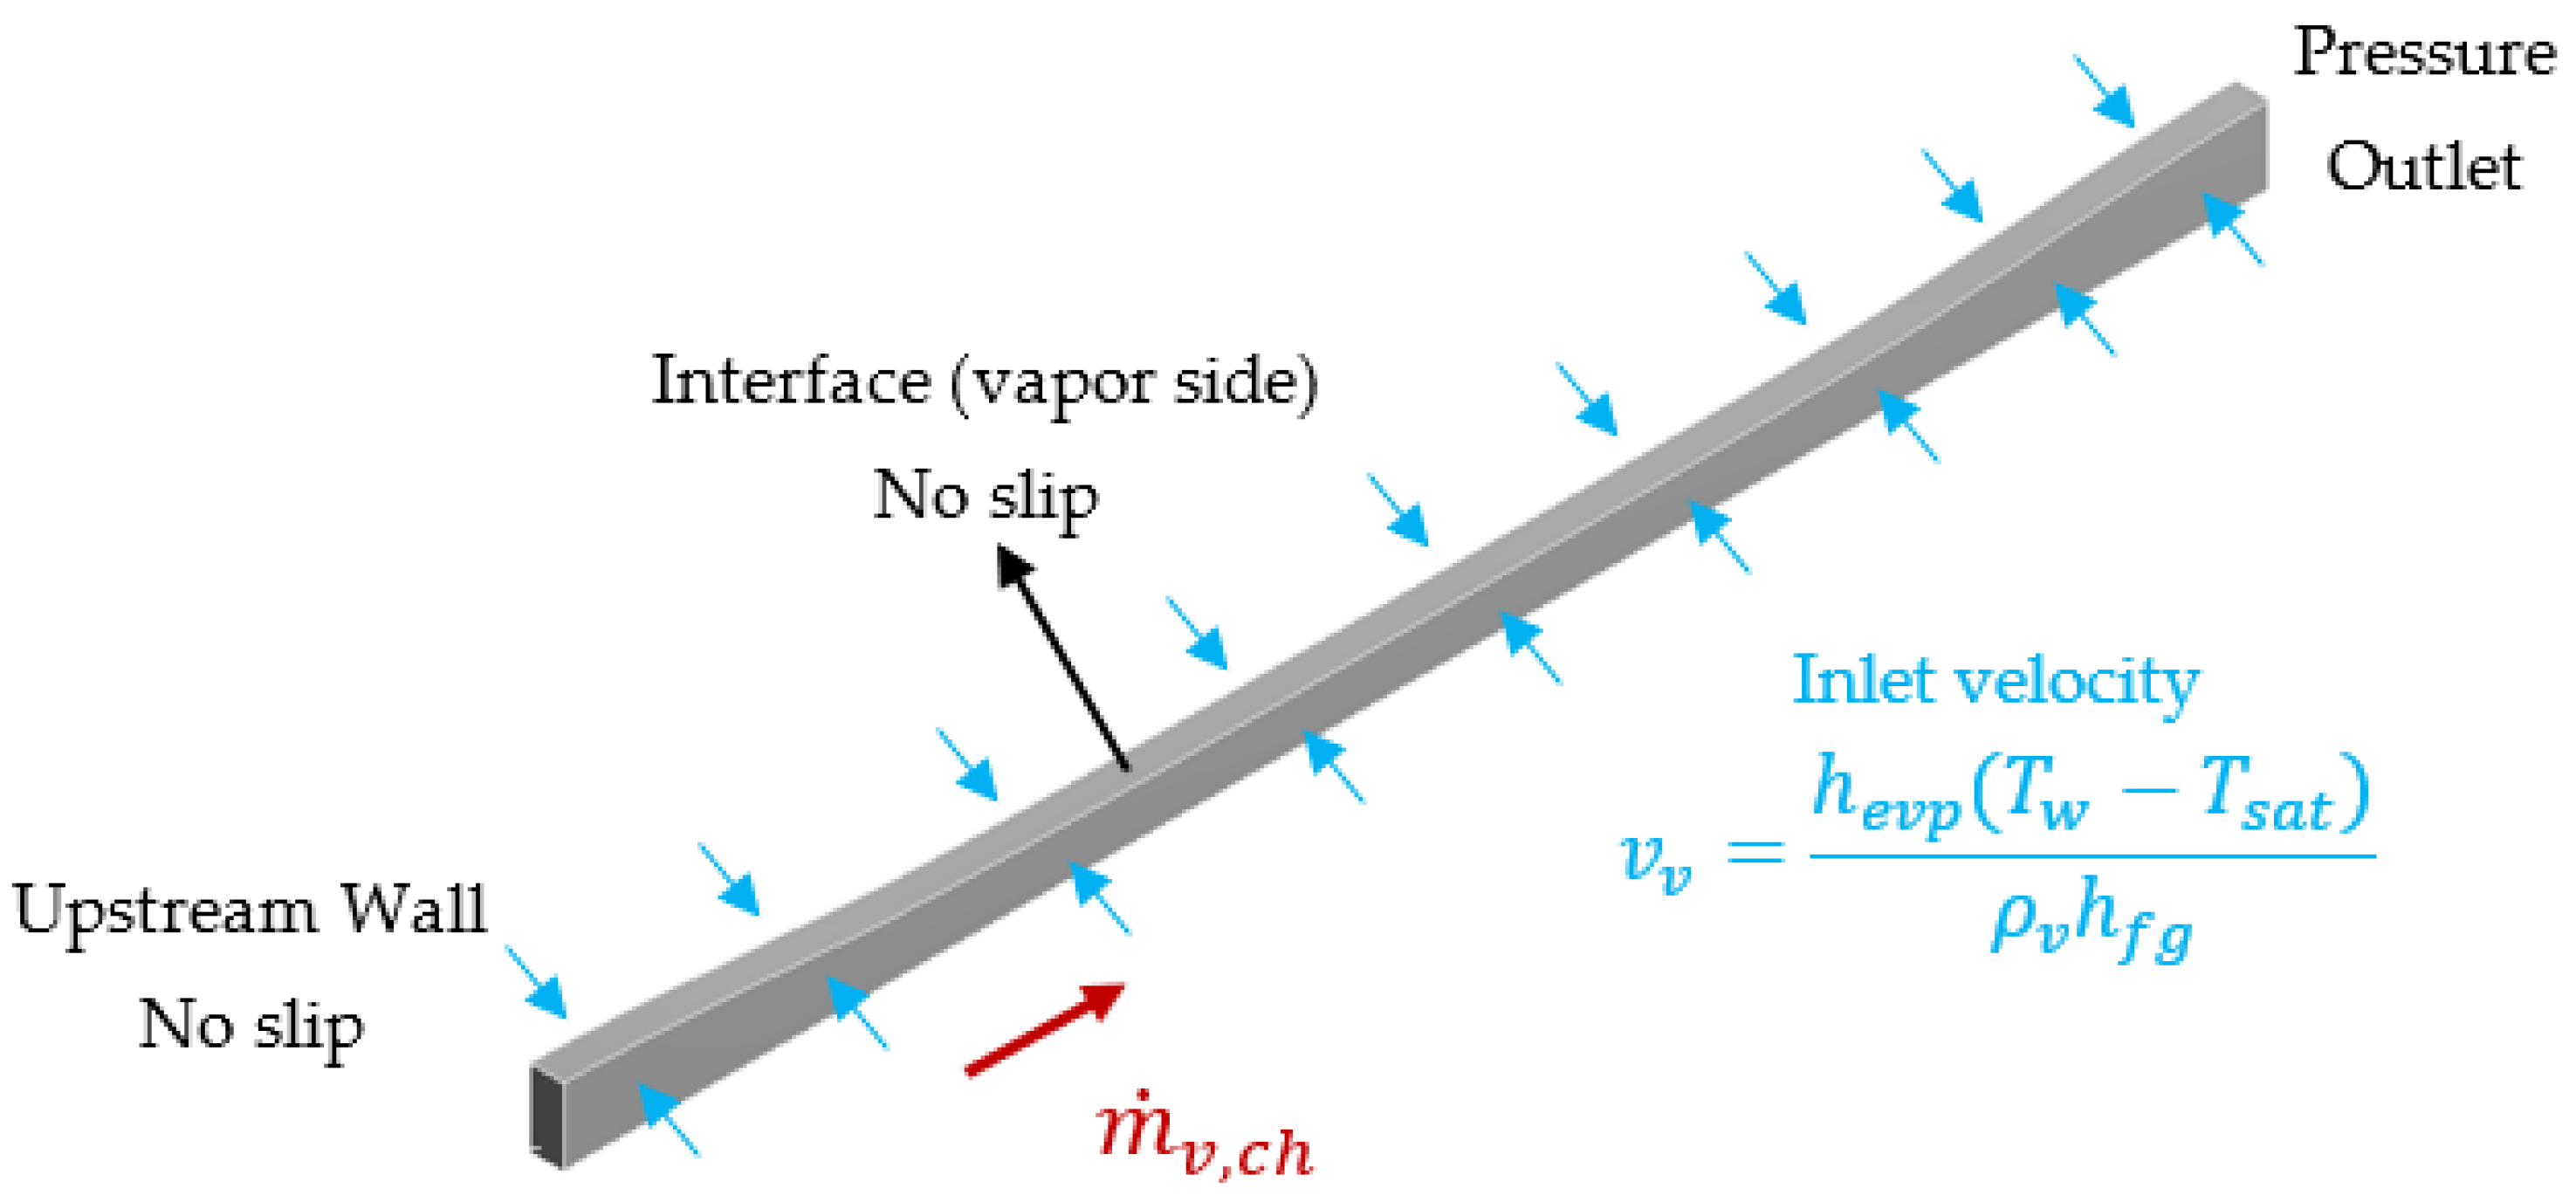
23] are used to calculate the vapor velocities (based on a simple energy balance), which are used as a velocity inlet boundary condition on the side walls of the vapor geometry (
Figure 6). The liquid–vapor interface on the vapor side is treated as a wall with no-slip boundary conditions. From the vapor side, owing to the significantly high-density ratio between liquid and vapor, the liquid velocity is small and is relatively stationary, hence the no-slip condition. A pressure outlet condition is applied at the channel exit.
The viscous pressure drop is estimated using the vapor flow solution. Additionally, the interfacial shear stress is also exported from this simulation, which is reapplied to solve the liquid flow in the single-channel model.
4.4. Liquid Flow Model
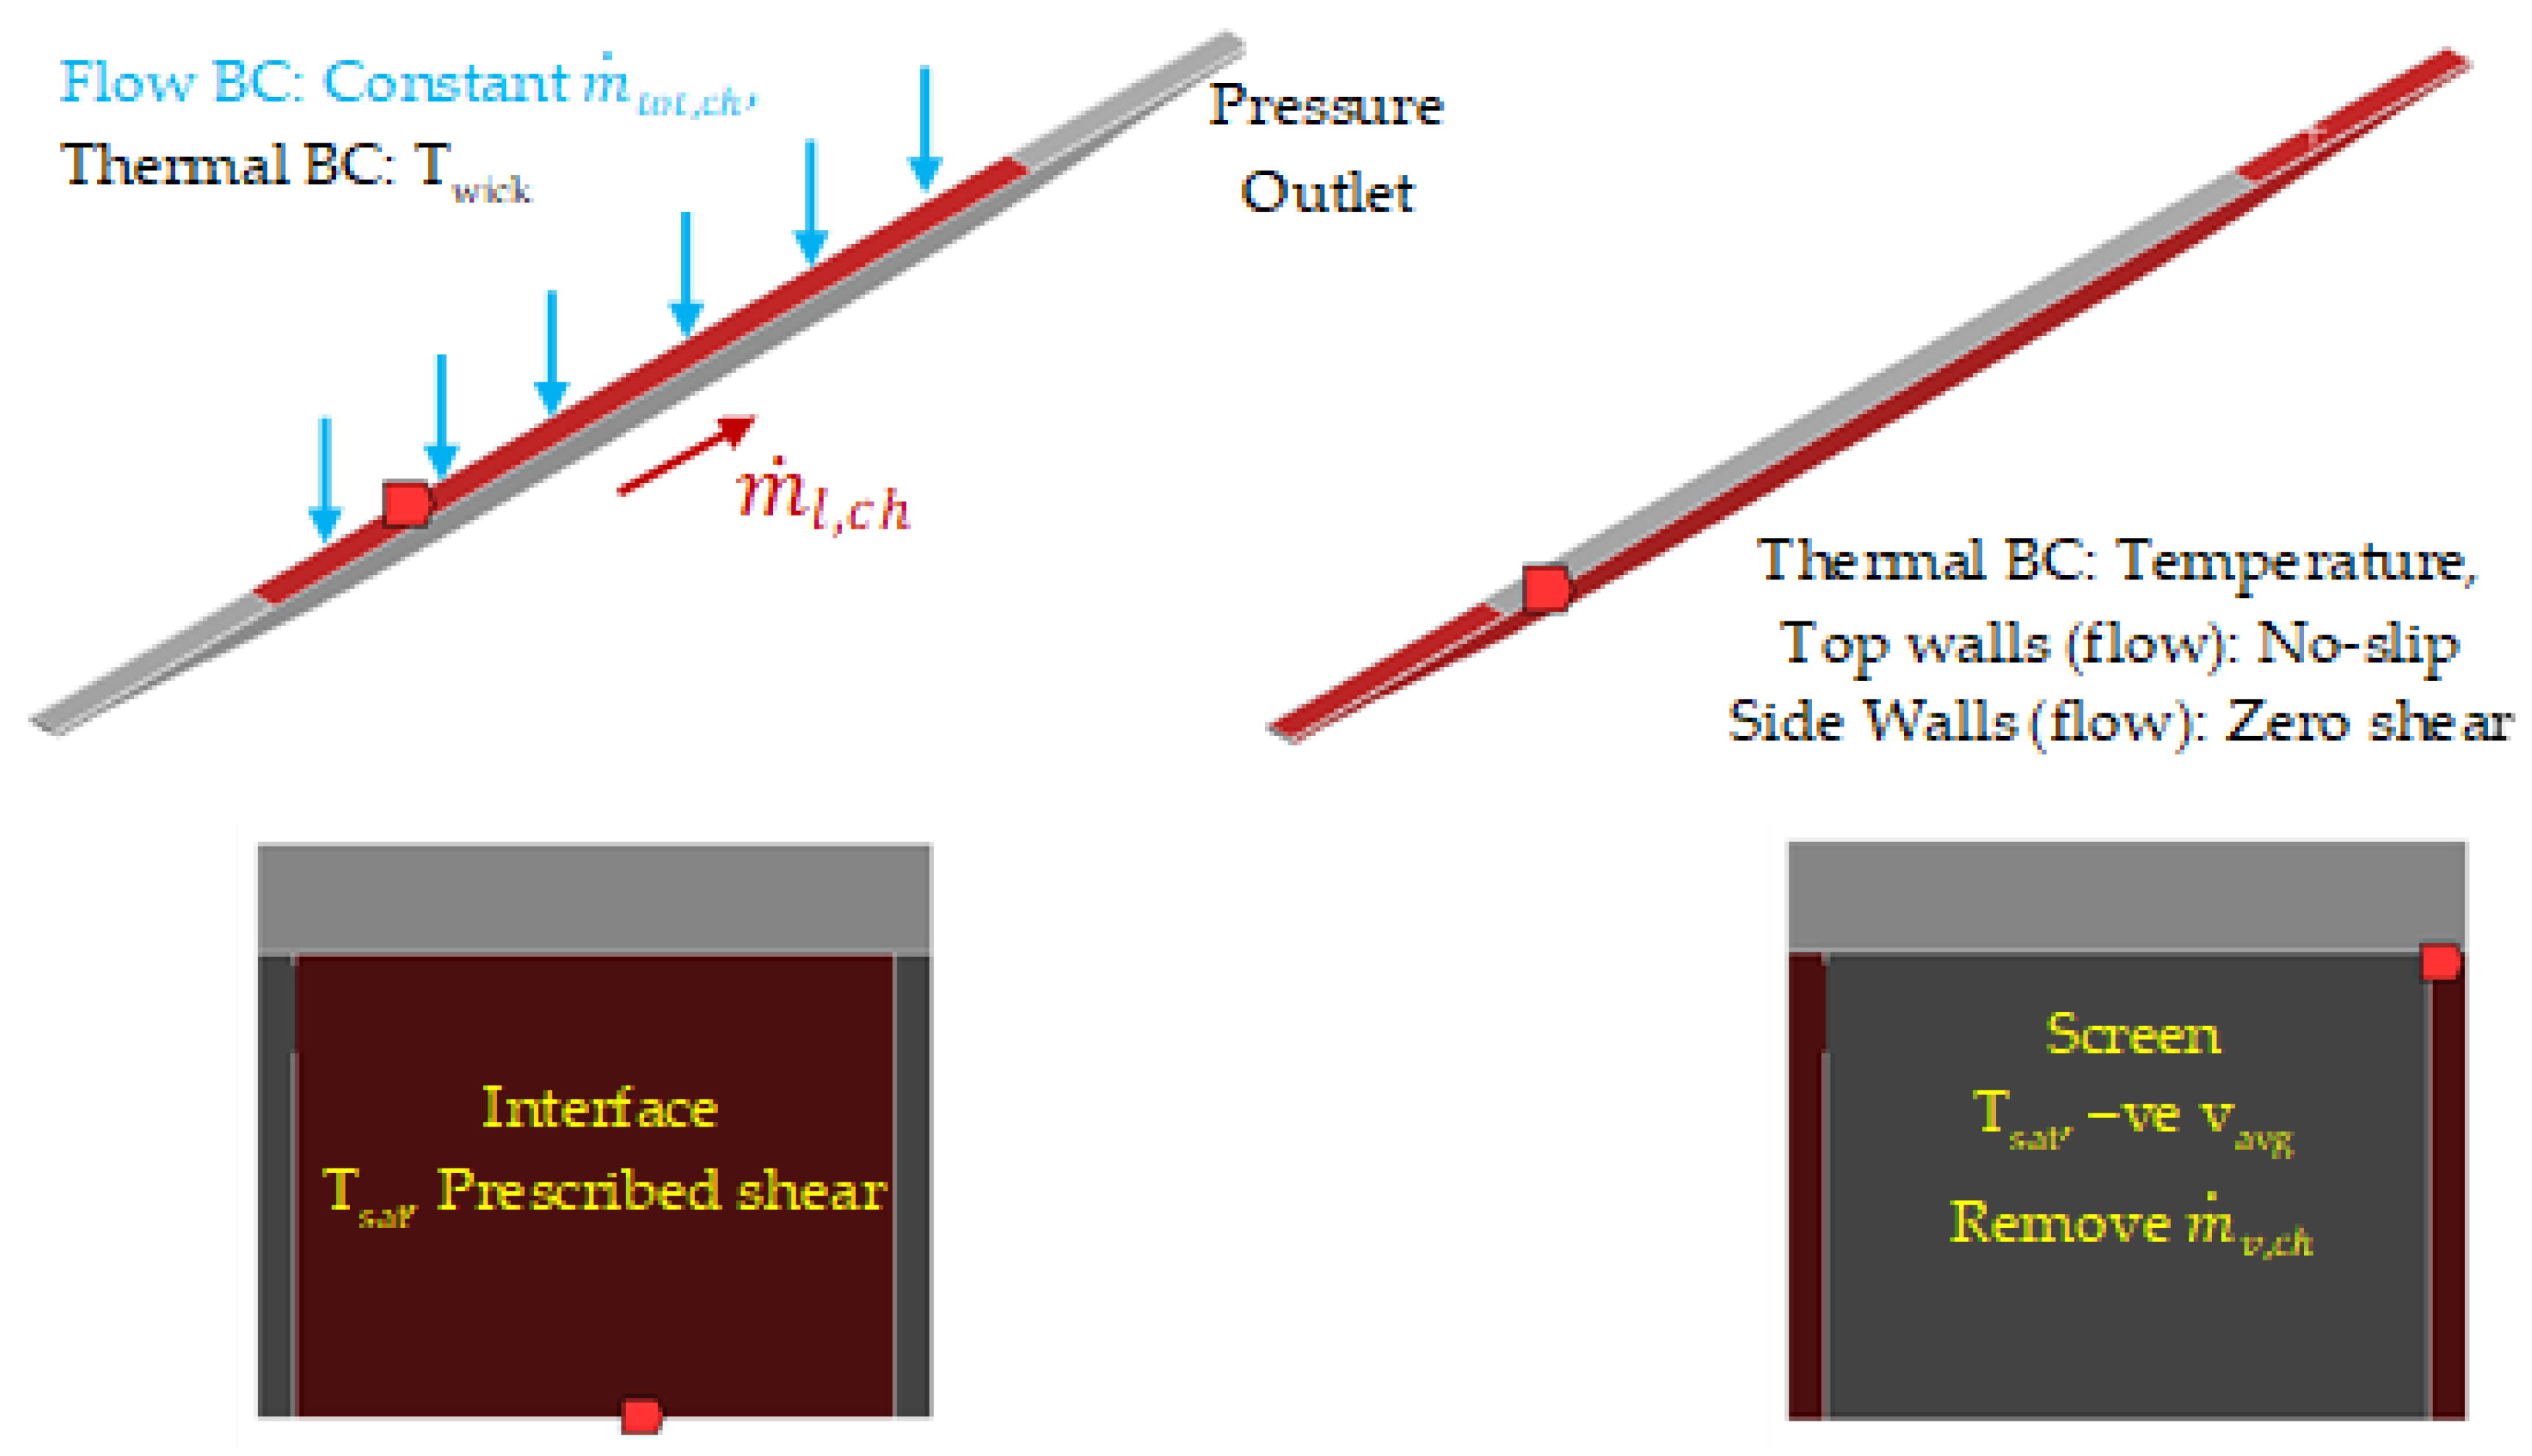
On the liquid side of the single channel, in contrast to the vapor side, the mass, momentum, and energy conservation equations are solved simultaneously to obtain viscous pressure drops on the liquid side of the mesh screen channels. The boundary conditions employed to solve the liquid side are highlighted in
Figure 7. Liquid enters the domain via the centrally located porous wick. This inlet condition is modeled as a constant inlet mass flow rate. A significant portion flows to the vapor side via the mesh screen walls and finally leaves the channel as evaporated vapor in the vapor region, which is reported using the vapor flow model. This solution from the vapor flow model is applied on the liquid side as a velocity inlet condition on the screen walls (
Figure 7), but with a negative value (implying fluid leaving the system). The vapor mass flow rate is assumed to be uniform along the channel length. The interfacial shear stress profile estimated from the vapor side is applied on the interface as a boundary condition. A specified shear condition accurately describes the interface on the liquid side than a no-slip condition because the vapor velocity is larger than that of liquid (owing to the high-density ratio between liquid and vapor). On the thermal side, the interface is at the saturation temperature (
Tsat), and a constant temperature boundary condition is employed to model the heat transfer.
The side walls on the liquid side include the screen regions (as displayed in
Figure 3c). As discussed earlier, the screen region is invisible to the flow, and the side walls on the liquid side are planes of symmetry. Because of this, a zero-shear boundary condition is applied on these side walls. The exported temperature solution from the channel thermal model is applied as a constant temperature boundary condition to model the heat transfer on these side walls. This is conducted by reading temperature data as an external file to Ansys Fluent [
21] using Ansys System Coupling [
22]. Similarly, the temperature data from the channel thermal model is used at the top walls on the liquid side that are in contact with the casing boundaries. A no-slip boundary condition is applied to these top walls to model the flow.
5. Results and Discussion
The single-channel model is solved, and this section discusses the obtained results. These results are subdivided into two parts: the first part, titled ‘Flow and Heat Transfer Results’, highlights the workflow to model the heat transfer and hydrodynamics in the channel, and the second part discusses the viscous pressure drops in the vapor and liquid regions of the channel as a function of input thermal powers (Qtherm).
This study uses structured meshes for all three models: the ‘2-h’ thermal model, vapor, and liquid flow models. A mesh independence study was performed for the 130 W thermal power () case. The saturation and sub-cooler temperatures used for this study are 76.7 °C and 54.2 °C, respectively. Three different element sizes were used: 75 μm, 60 μm, and 45 μm. The maximum temperature on the copper plate was used as the criteria in the ‘2-h’ thermal model, and the liquid and vapor pressure drops were used to understand the degree of mesh independence for the liquid and vapor flow models, respectively. The simulation results between meshes with sizes 60 μm and 45 μm showed a less than 3% change in the results. For this reason, all results presented in this paper use the 60 μm element size (approximate number of cells: ‘2-h’ model—601,000; vapor flow model—217,000; liquid flow model—54,000).
5.1. Flow and Heat Transfer Results
The results presented here are based on
Qtherm = 171 W. The saturation and sub-cooler temperatures employed in these simulations are 87 °C and 59 °C, respectively [
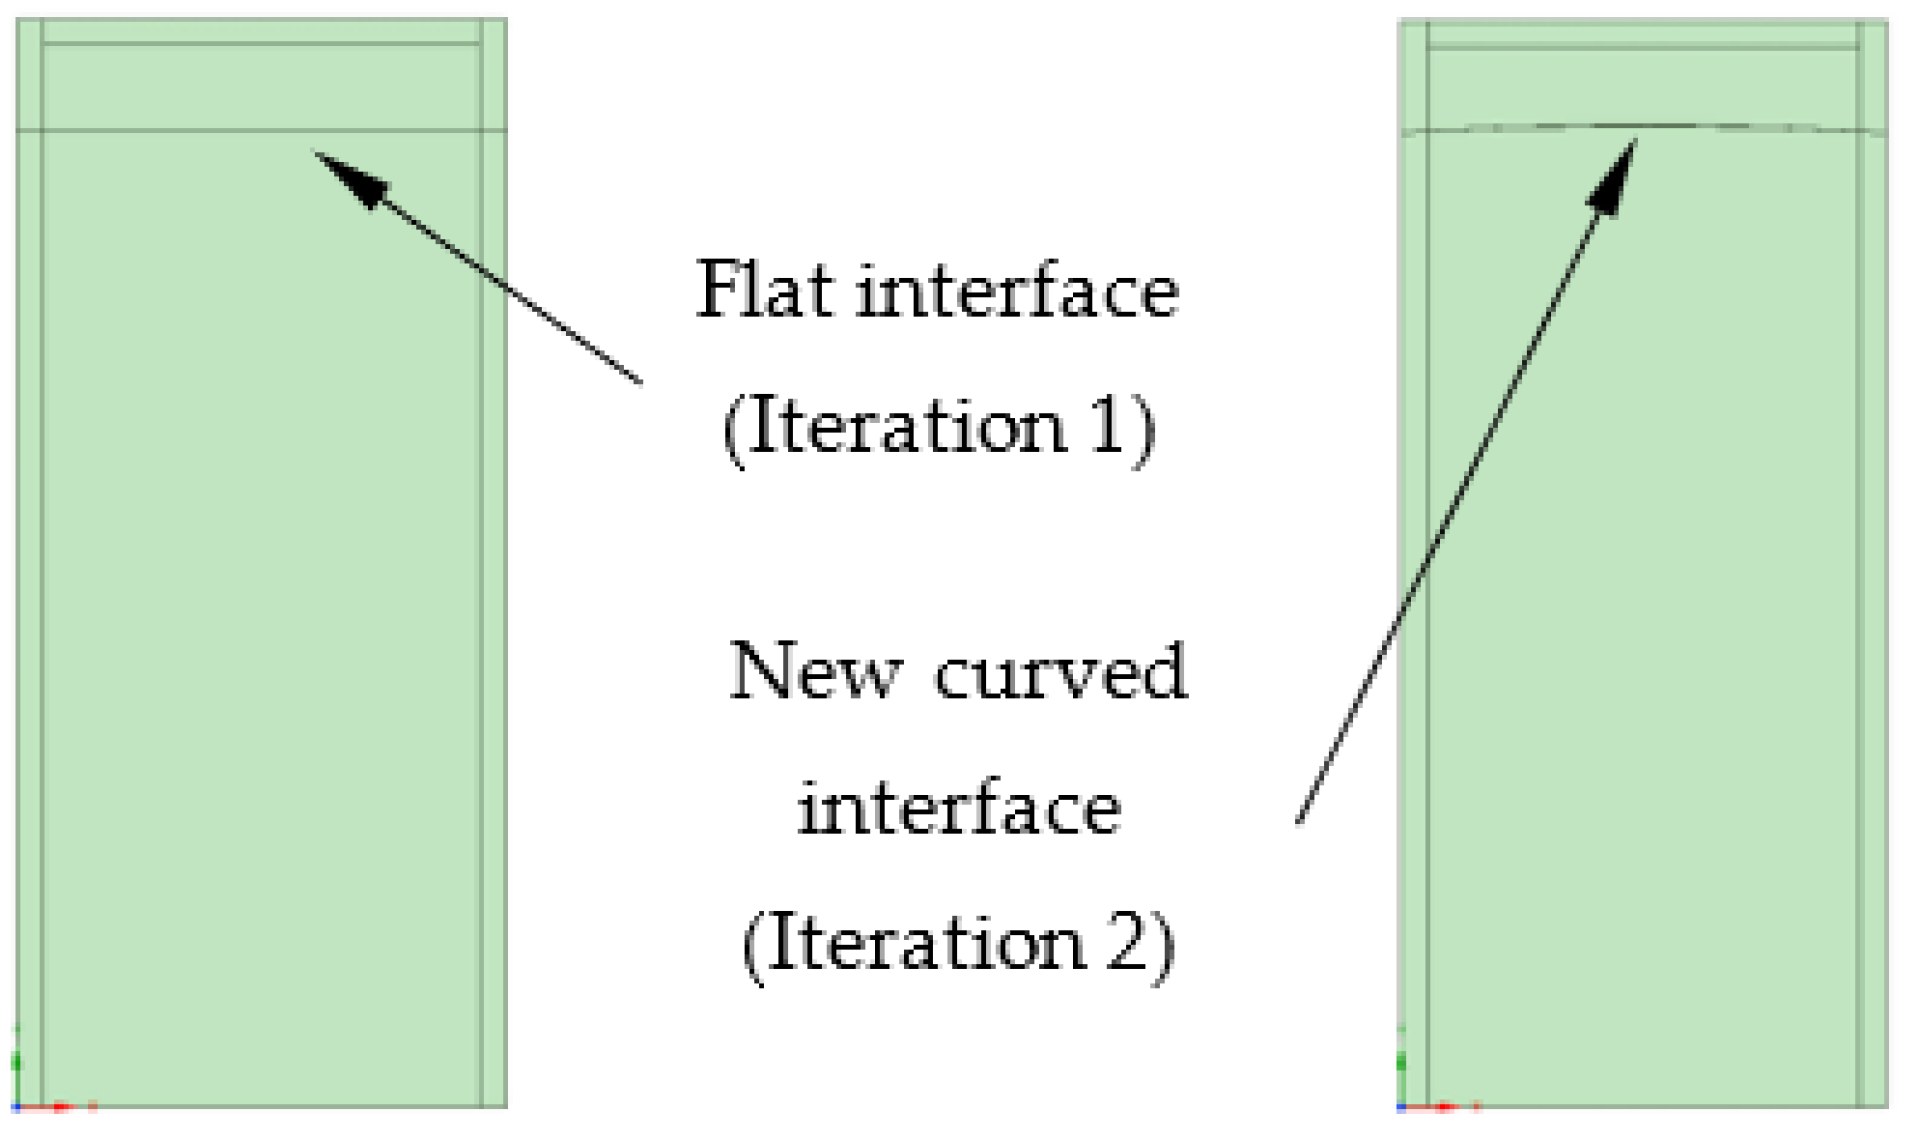
15]. The ‘2-h’ thermal model is initially solved for the location of the liquid–vapor interface. These results are presented under sections ‘iteration 1′ and ‘iteration 2′. This interface is initially assumed flat (for iteration 1), and the obtained flat CAD surface is used to split the channel geometry to obtain the vapor and liquid flow regions. Separate flow and thermal analyses are conducted on each of these regions. The curvature of the interface is corrected using the obtained pressure drop data (in iteration 1), and a new CAD surface is generated. Similar flow and thermal analyses are conducted with new liquid and vapor geometries (in iteration 2).
5.1.1. Iteration 1
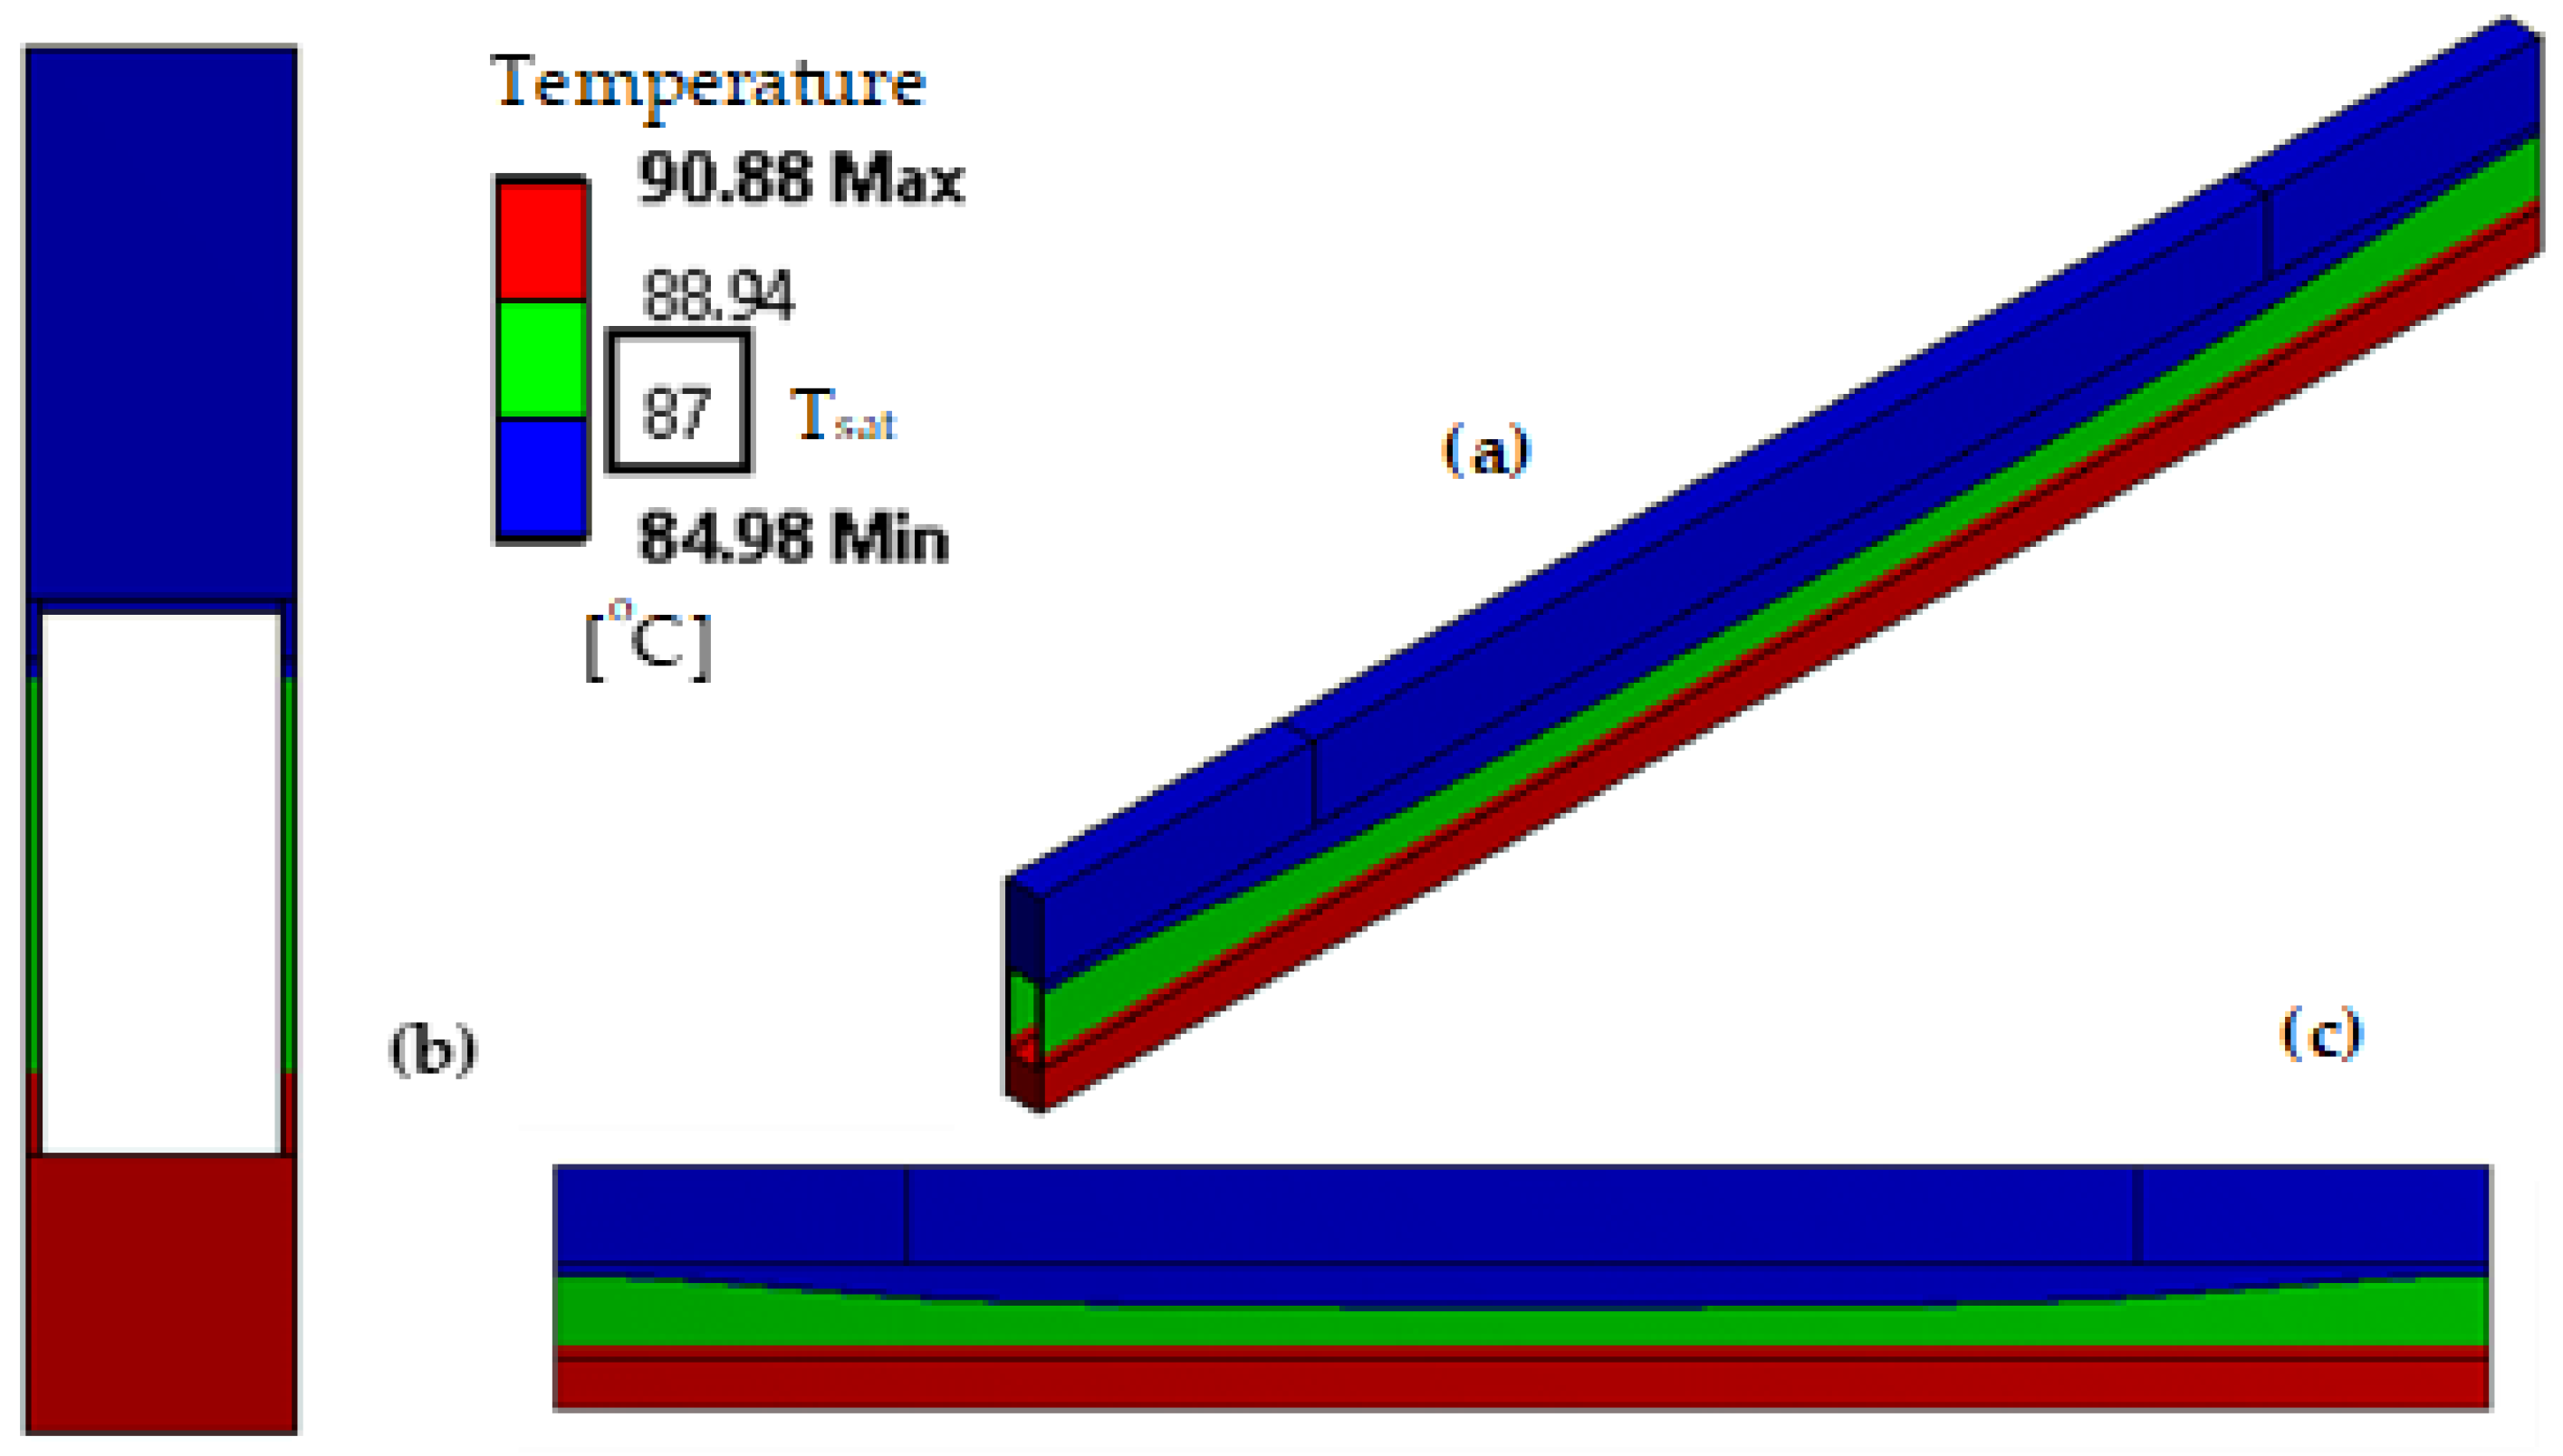
The steady-state temperature fields (
Figure 8) are obtained by solving the 2-h thermal model. The blue regions represent the reheating, whereas those in green and red indicate the evaporation of working fluid in the mesh screen. The interface location on the wall is where
. The liquid (reheating) region in the mesh screen is very thin both upstream and downstream in the channel, and this is attributed to the presence of a central porous wick. The presence of this wick structure ensures that evaporation of the working fluid occurs farther away from it (closer to the metal plate at the bottom),
Figure 8c. The steady-state thermal powers at various locations of the single channel are tabulated in
Figure 8.
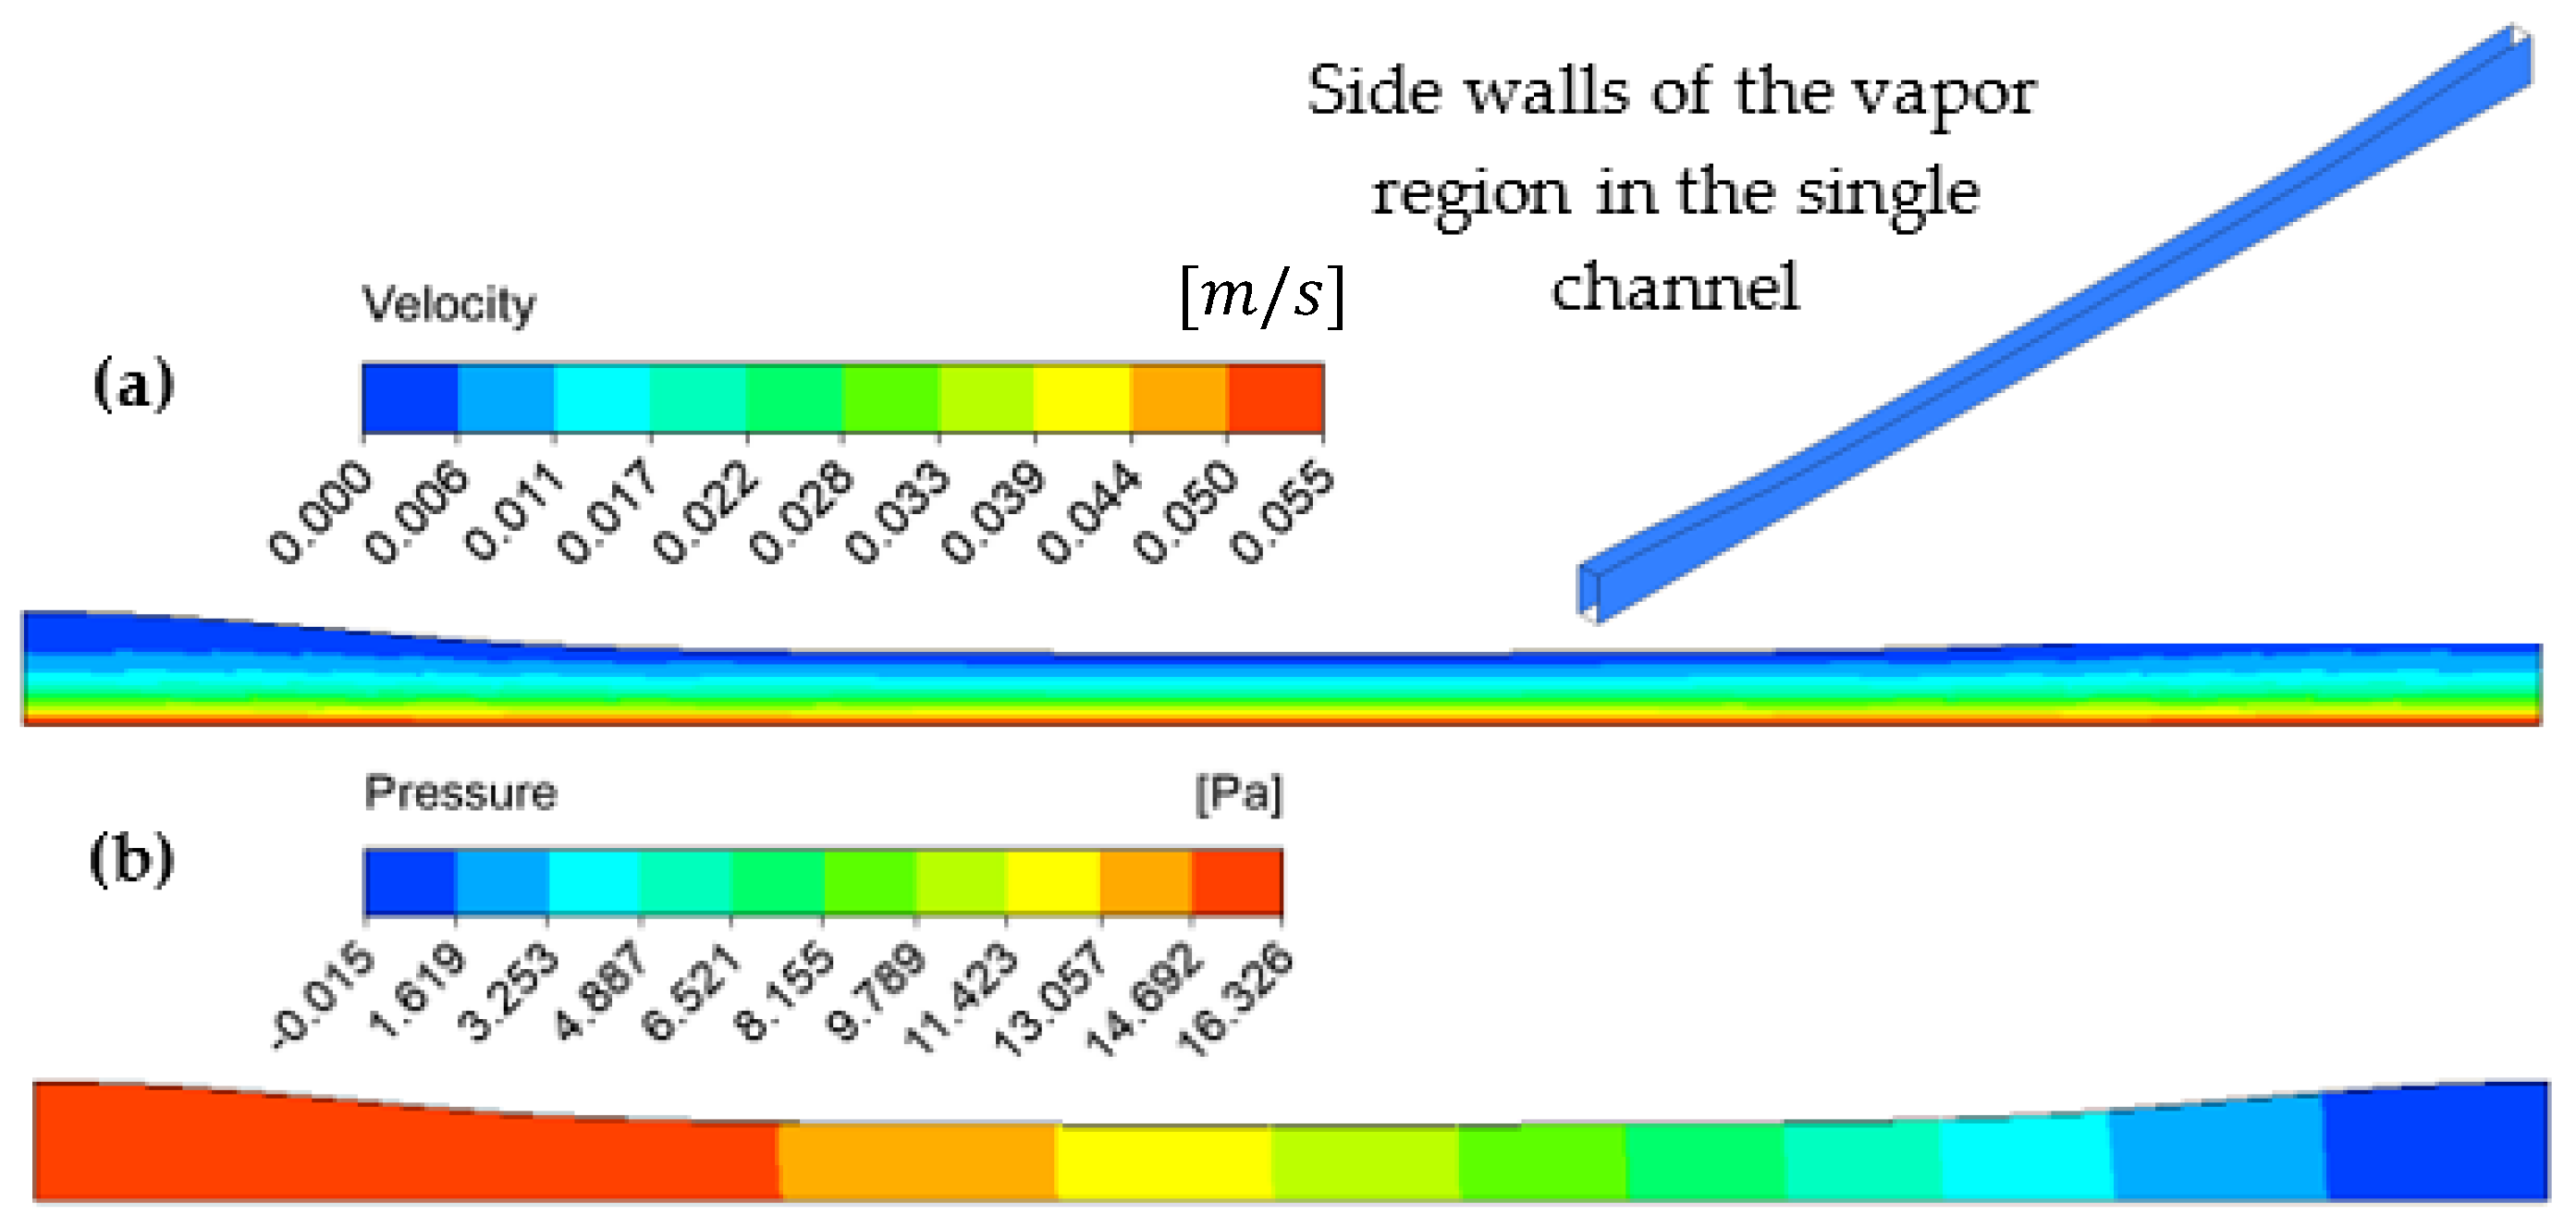
The screen wall temperature solution on the vapor side of the interface is utilized to estimate the vapor velocities at each computational grid location on the wall. These velocities are employed as the boundary condition in the vapor flow model to solve the streamwise pressure drop in the vapor region. The steady-state velocity and pressure contours are plotted in
Figure 9. The total vapor flow rate increases in the streamwise direction along the channel. The total evaporated vapor mass flow rate flowing through this channel is
kg/s, and the total pressure drop incurred by this vapor flowing through this channel is approximately 16.3 Pa. It is critical to highlight that the small viscous pressure drop in the vapor region ensures very little change in the saturation temperature, less than 0.02 °C (based on the Clausius–Clapeyron equation [
20]). The model, therefore, does not require a heat transfer solution in the vapor region. It is also important to note that the pressure is uniform in the cross-sectional plane along each axial location of the channel.
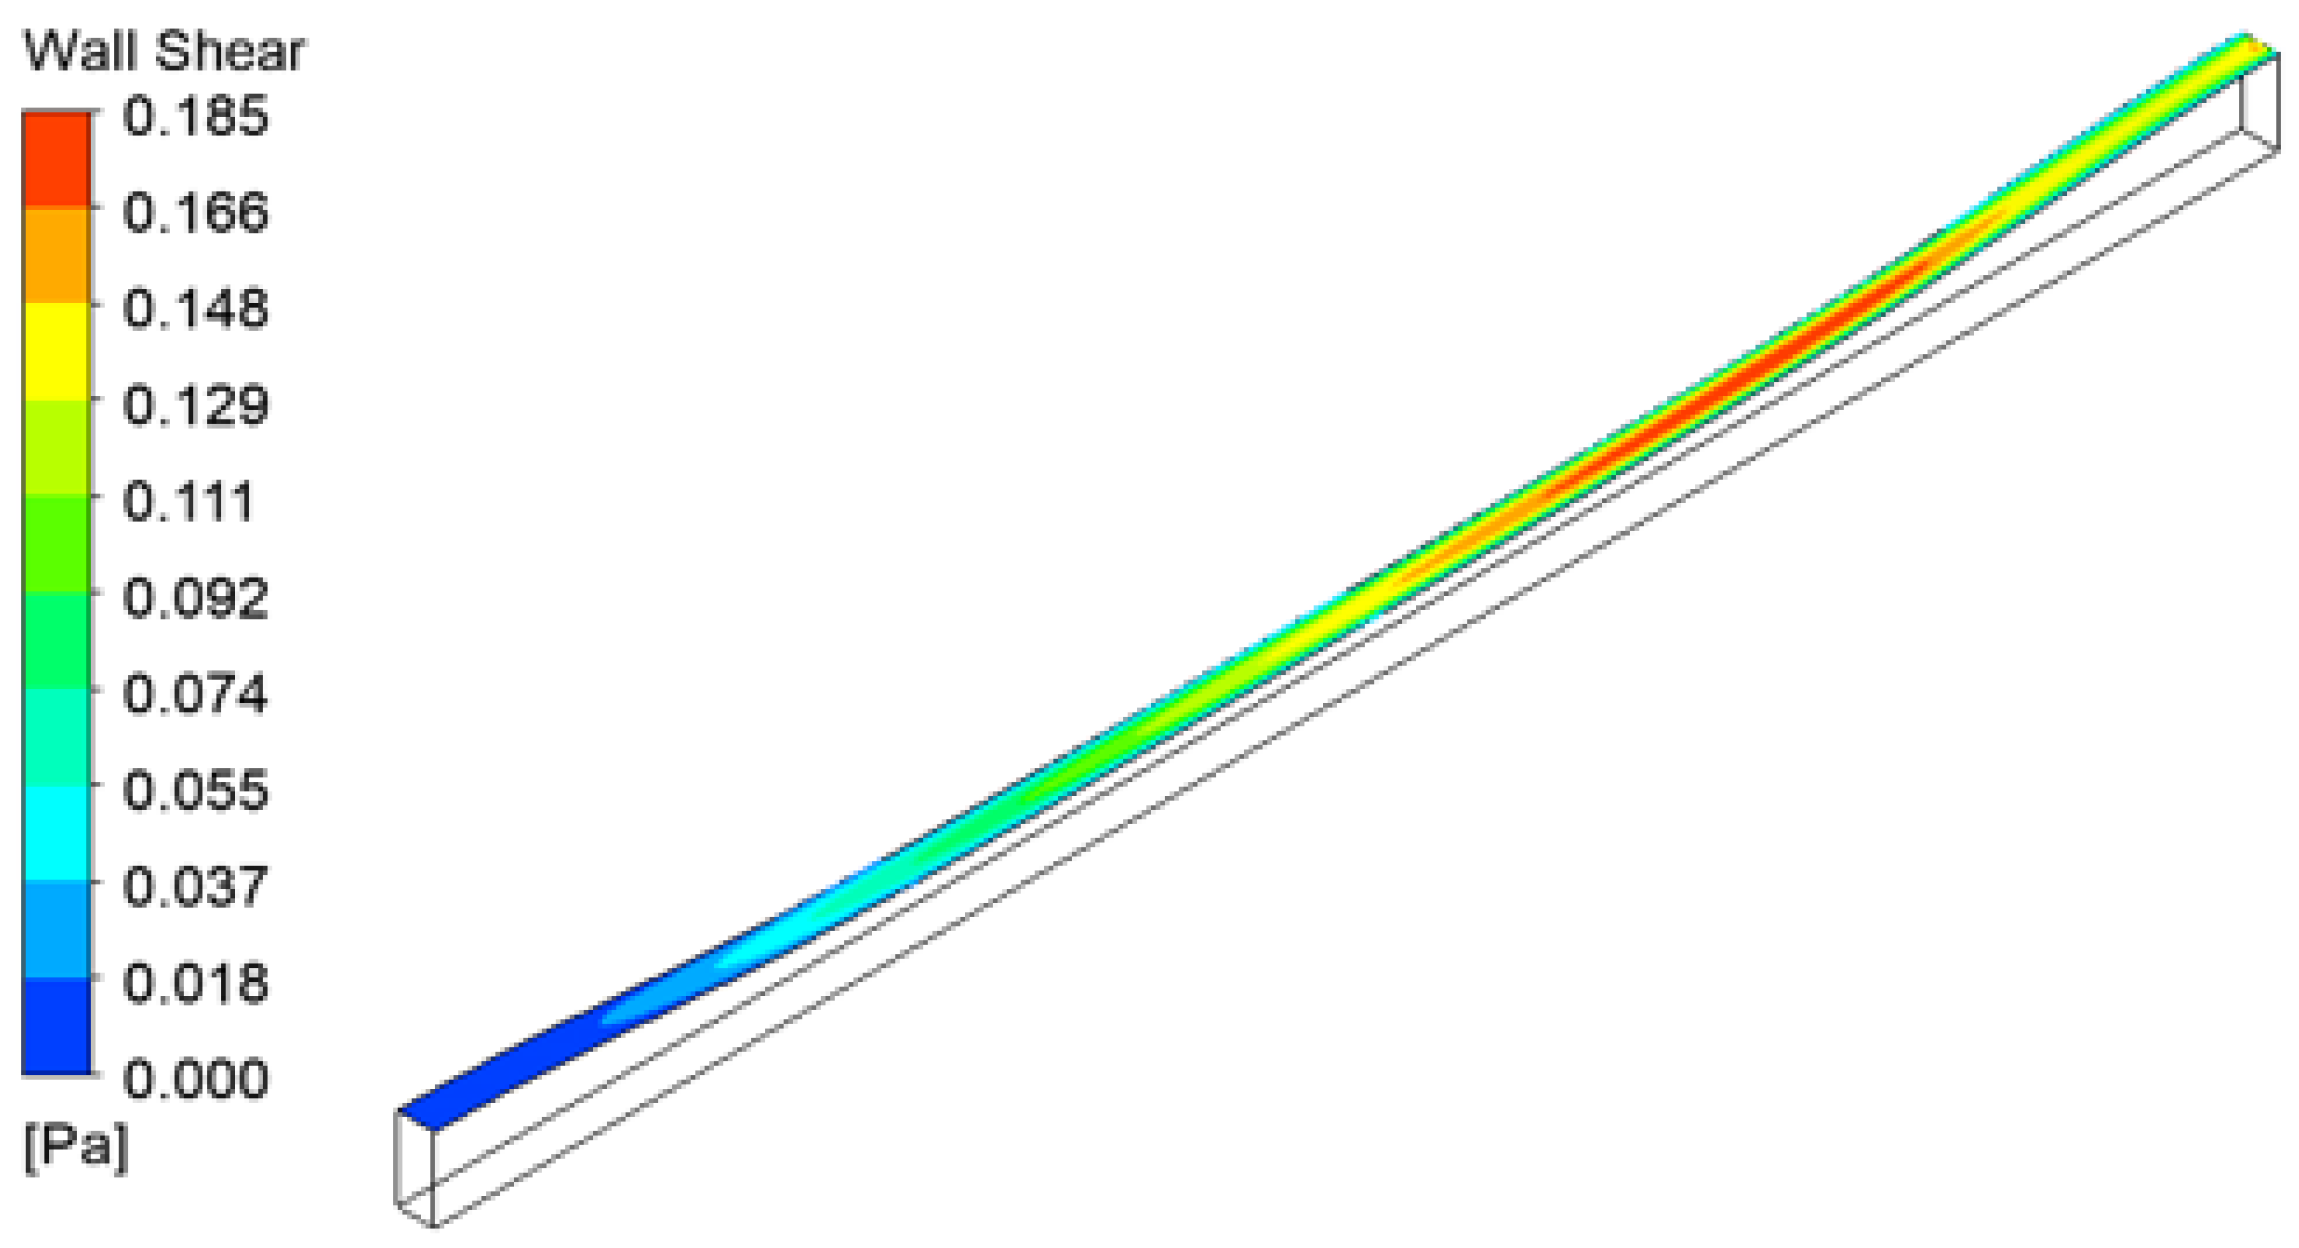
In addition to the total viscous pressure drop, the interfacial shear stress is another variable of interest obtained from this model. The interfacial shear contour shows that the highest shear value is in the middle of the channel (
Figure 10). This is because of two reasons: (1) increasing mass flow rate along the channel length and (2) decreasing interfacial height (estimated from mesh screen–metal plate interface) in the channel center compared to both its upstream and downstream ends.
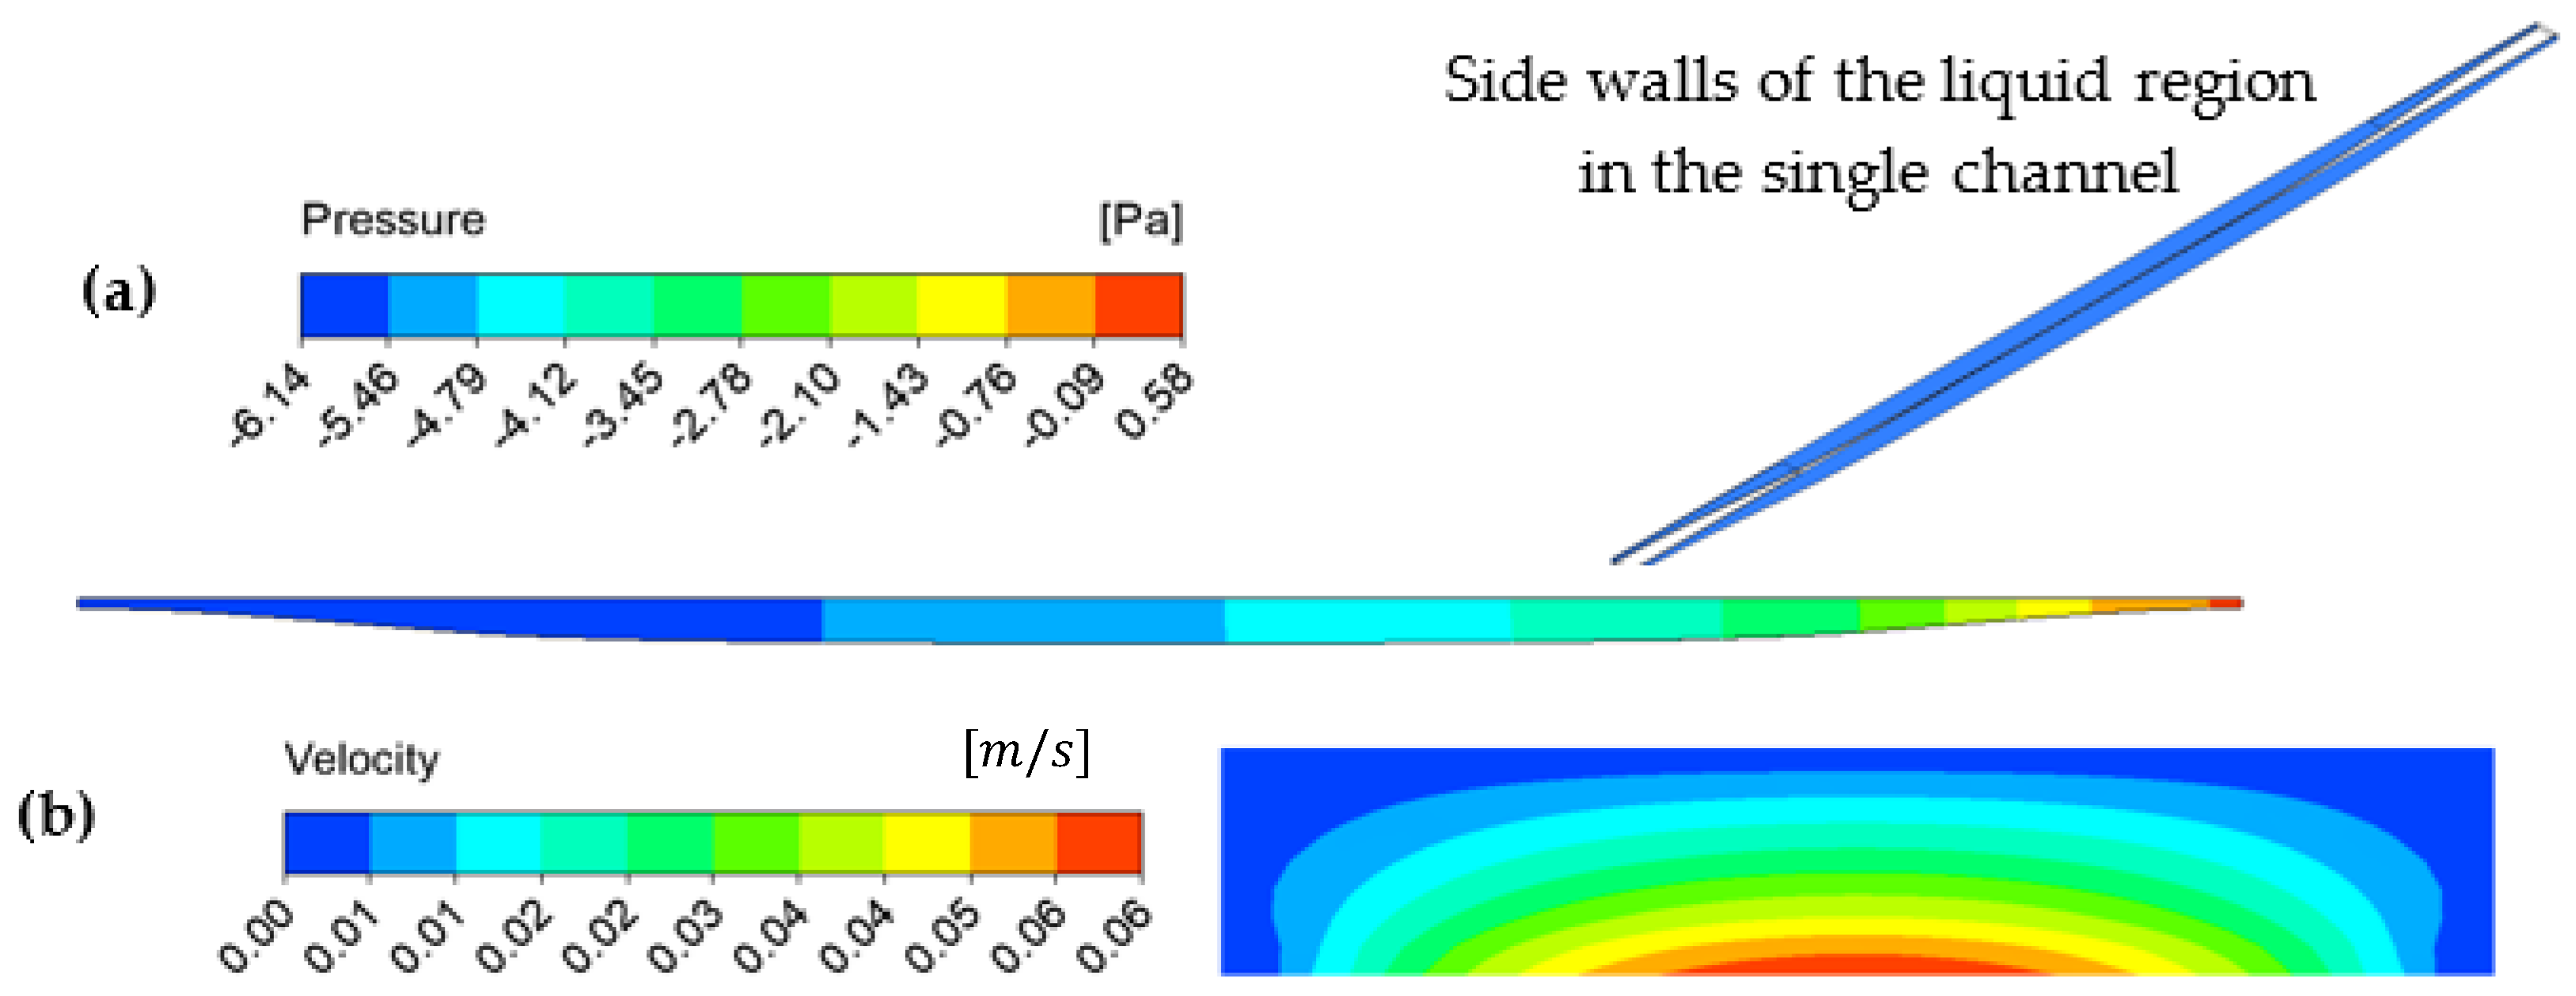
Both flow and thermal models are solved in the liquid region. The temperature solutions, obtained from the 2-h thermal model, are imposed on the liquid side walls, and the final outlet flow rate is estimated. The obtained shear stress is also imposed on the interface (at the bottom) of the liquid region. A specific mass flow rate of liquid enters the liquid region at the center (representing the porous wick). The mass flow rate required for evaporation on the vapor side is removed from the liquid region via the screen surfaces at the bottom. The remaining liquid leaves the channel axially through the exit. As the channel inlet is centrally located, there is a significant reverse flow towards the upstream wall of the channel. The pressure at the upstream end of the channel is lower than the downstream end, signifying a reversed flow (
Figure 11a). The viscous pressure difference between the upstream and downstream ends of this channel is approximately 6.72 Pa. The flow reversal in the channel is exacerbated by the imposed interfacial shear stress condition and leads to higher liquid velocities near the interface (observed in the exit velocity contour:
Figure 11b). Like the pressure distribution in the vapor region, the liquid static pressures are uniform at each cross-sectional plane along the channel length.
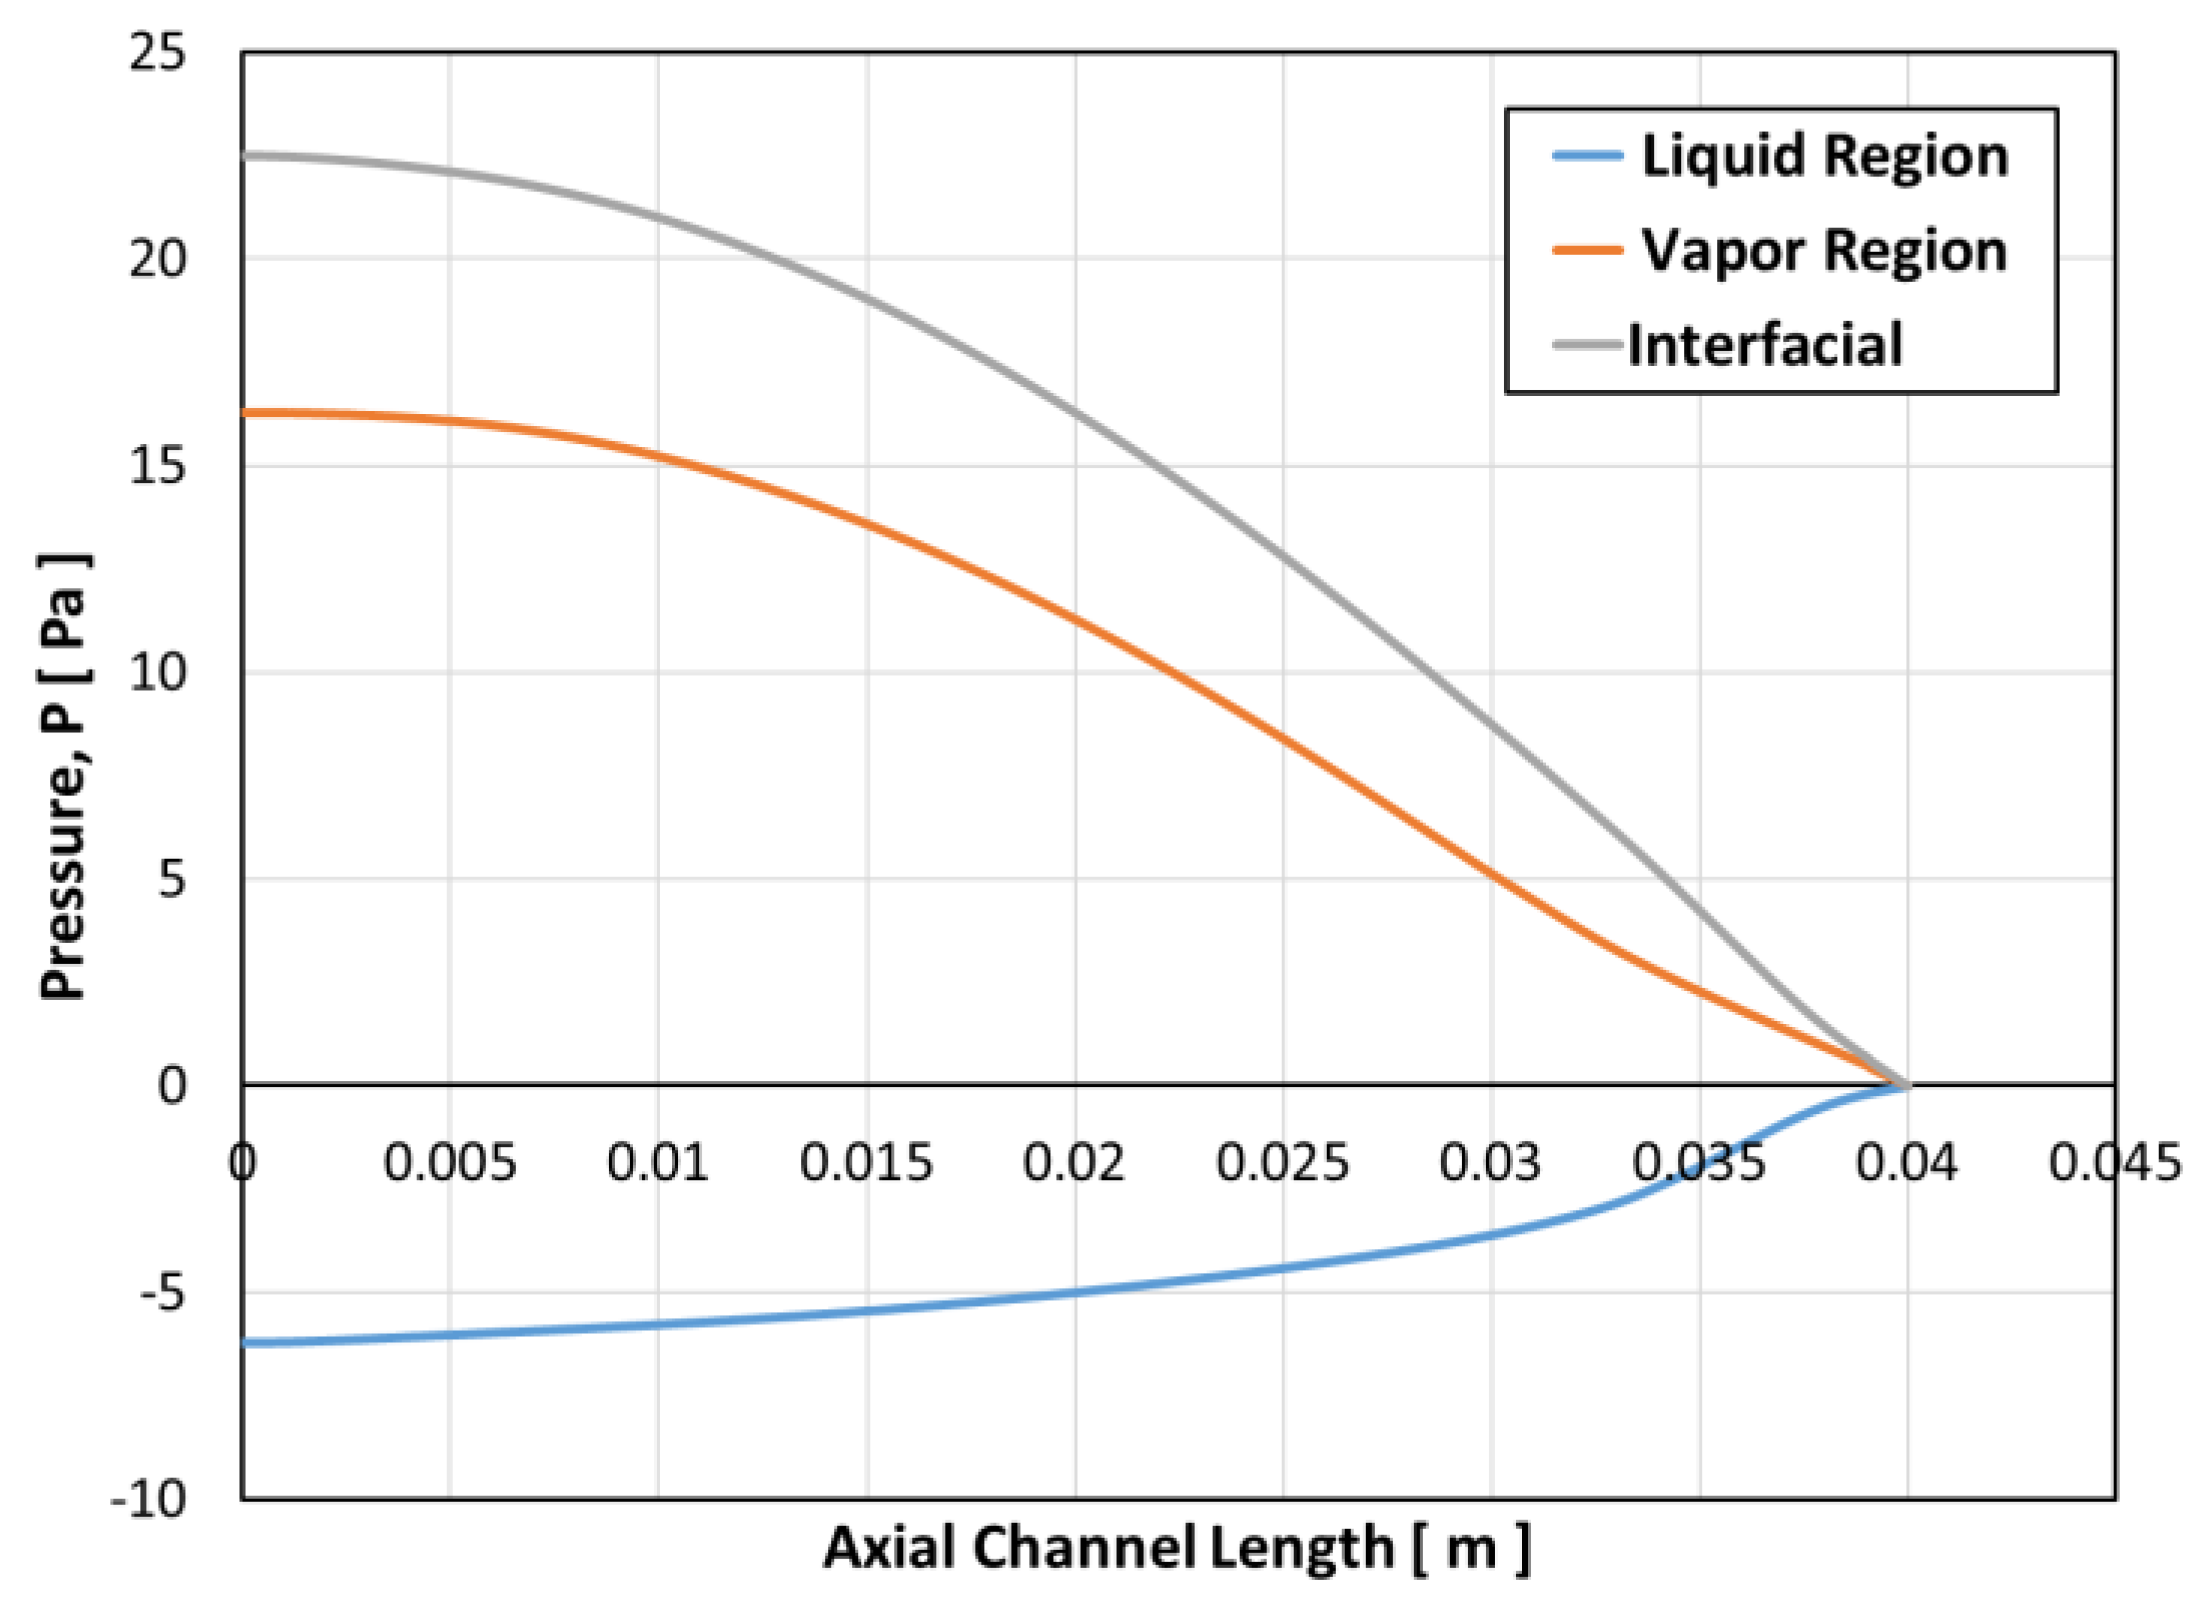
The pressure values at the interface on both the vapor and liquid regions are used to estimate the pressure difference across the interface. The radius of curvature at each axial location along the channel is estimated based on this interfacial pressure difference using the using the Young-Laplace equation [
20]. These radii of curvature are employed to generate an updated liquid–vapor interface, which is subsequently employed in similar analyses in iteration 2. The pressure difference across the interface is the highest (approximately 23 Pa) at the upstream end (
Figure 12). Since the channel opens into a plenum (
Figure 1c), the pressures on the liquid and vapor sides of the interface are equal; the radius of curvature is infinite, and the interface is, therefore, flat.
An integral of the interfacial heat flux in the liquid region is estimated to evaluate the total condensation rate of vapor at the interface. This integral of the total surface heat flux is small (approximately 1.3%) compared to the total thermal power lost at the mesh screen walls on the vapor side (
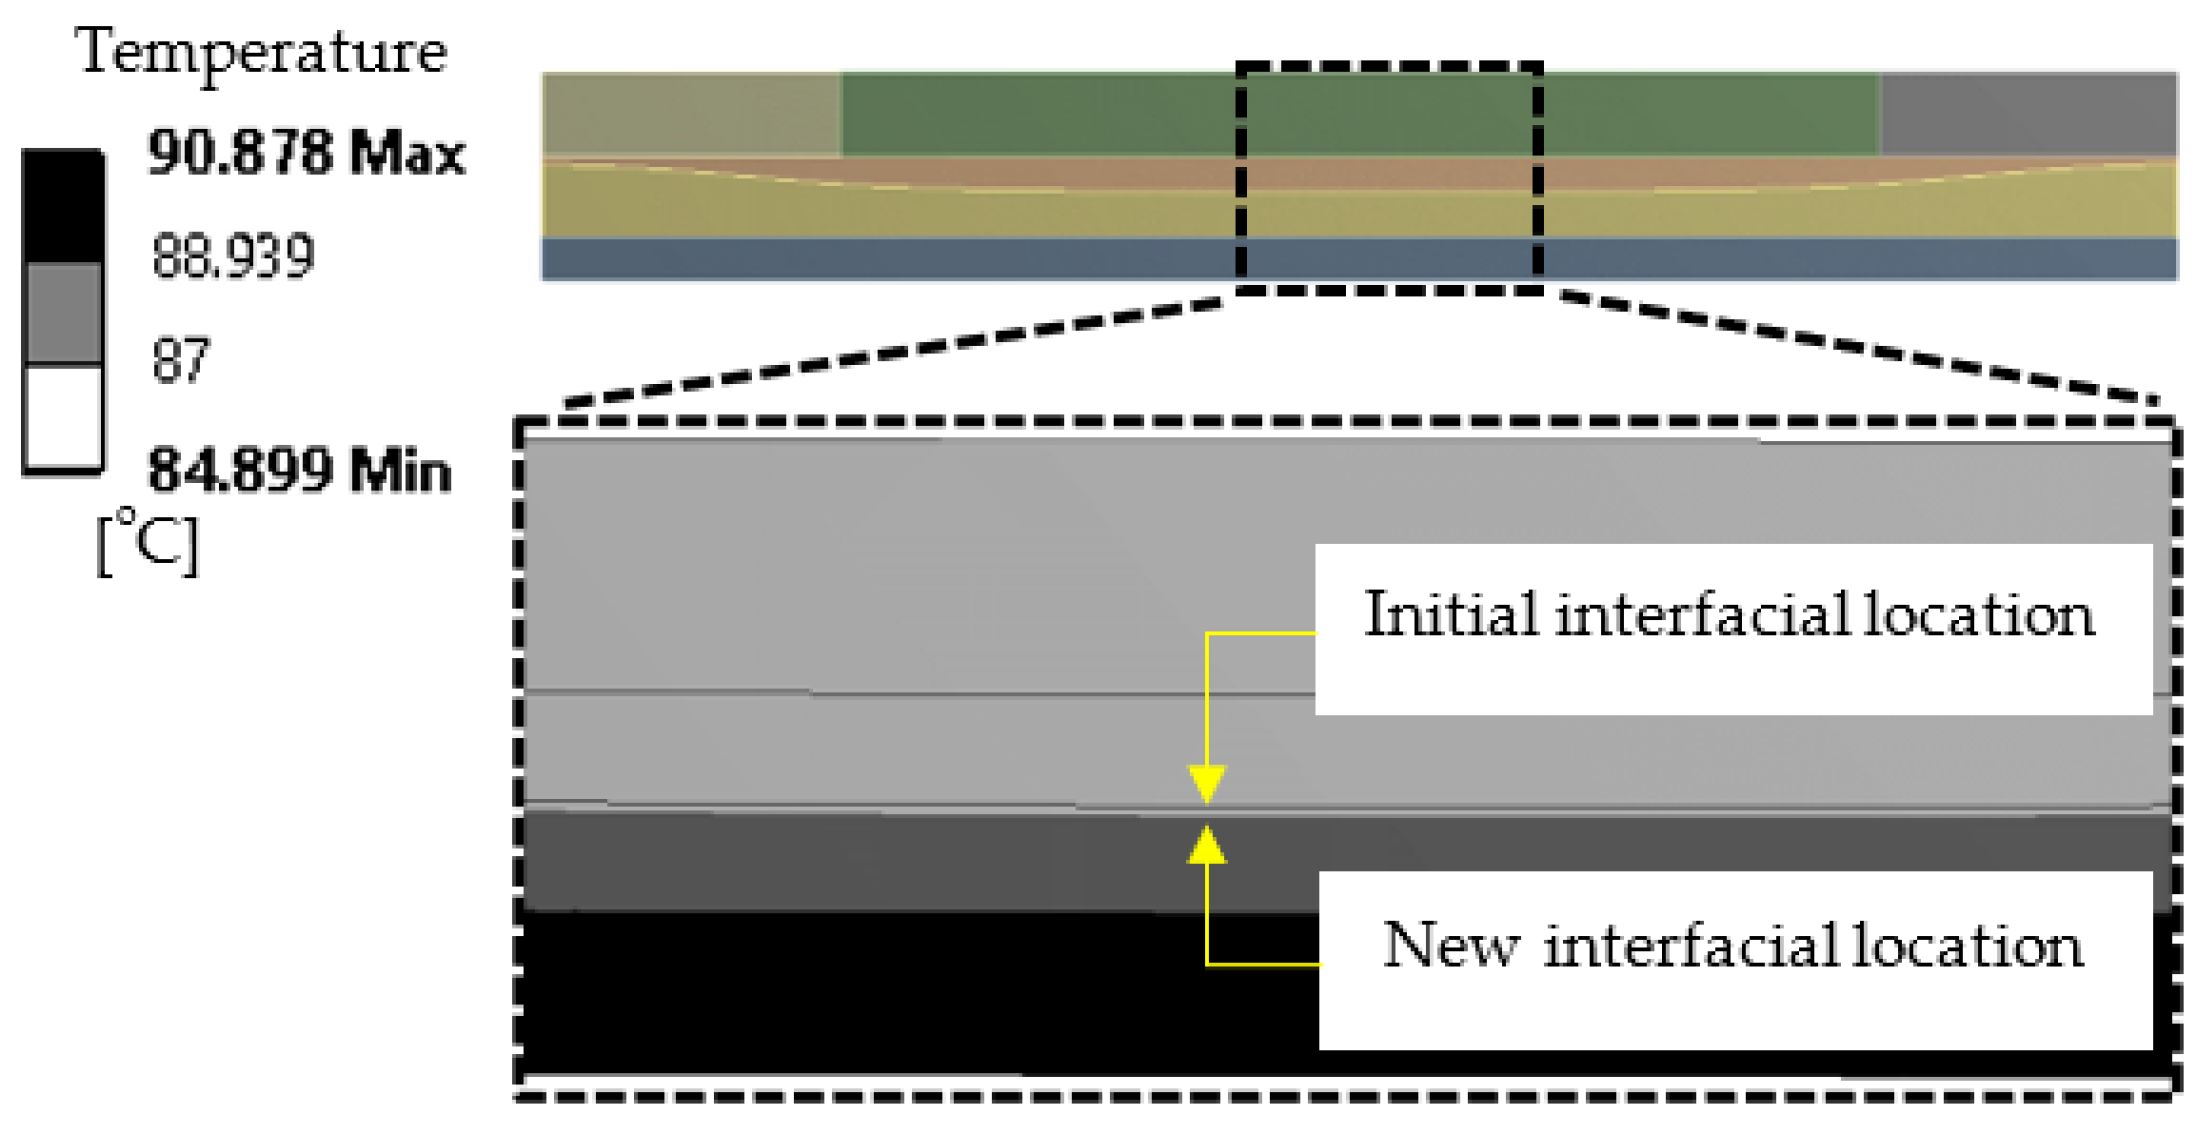
Table 2). Since the flow and temperature fields are being solved simultaneously in this model, the natural convection heat transfer coefficient, employed on the liquid wall in the initial ‘2-h’ thermal model (in iteration 1), is corrected using the obtained thermal solution. This is performed by exporting both the surface heat transfer coefficient and wall adjacent temperature. These parameters are re-employed in the thermal model in iteration 2. It is important to examine the impact of this new heat transfer coefficient on the location (height) of the interface (as measured from the bottom wall). The new distribution of heat transfer coefficients and wall adjacent temperatures are imposed on the walls of the single channel, and the steady-state temperature fields are recalculated (
Figure 13). Both initial and new interfacial locations are highlighted in this temperature contour plot. It is concluded that there is very little change in the location of the interface after correcting for the initial heat transfer coefficient on the liquid side. The vapor velocities are again computed from the wall temperature solution on the vapor side of the mesh screen channel. This new velocity file is employed in iteration 2 to solve the pressure drop.
5.1.2. Iteration 2
Having obtained the new location (height along the mesh screen wall as measured from the metal plate) and shape (radii of curvature along the channel length) of the interface, a CAD surface of this new interface is generated. This new interface is employed to generate new vapor and liquid regions in the channel (
Figure 14). These thermal and flow models are solved in these new liquid and vapor regions to obtain the new pressure drops.
Vapor velocities, estimated from the steady-state thermal solution, are imposed on the side walls of the vapor region as velocity inlet conditions, and the viscous pressure drop in the channel on the vapor side is estimated for the second time. Similarly, pressure drop on the liquid side is also estimated by solving for both flow and heat transfer on this new liquid region. The interfacial pressure difference along the channel is estimated based on these viscous pressure drops. It is observed that there is very little change (22.69 Pa in iteration 2, approximately 1.3%) in the maximum interfacial pressure difference (at the upstream end of the channel) between iteration 1 and 2, which confirms the single-channel solution is converged (no further iterations are required). In addition to the pressure drops, it is also observed that the new heat transfer coefficients and wall adjacent temperatures, obtained from the flow and thermal solution of the liquid region in iteration 2, do not impact the location of the interface any longer.
5.2. Interfacial Pressure Difference
Having understood the single channel approach based on
Qtherm = 171 W, this section will illustrate the impact of various total thermal powers (
Qtherm) on the interfacial pressure drops. The saturation and sub-cooler temperatures are independent variables for the single-channel model and vary with input thermal powers (
Table 3).
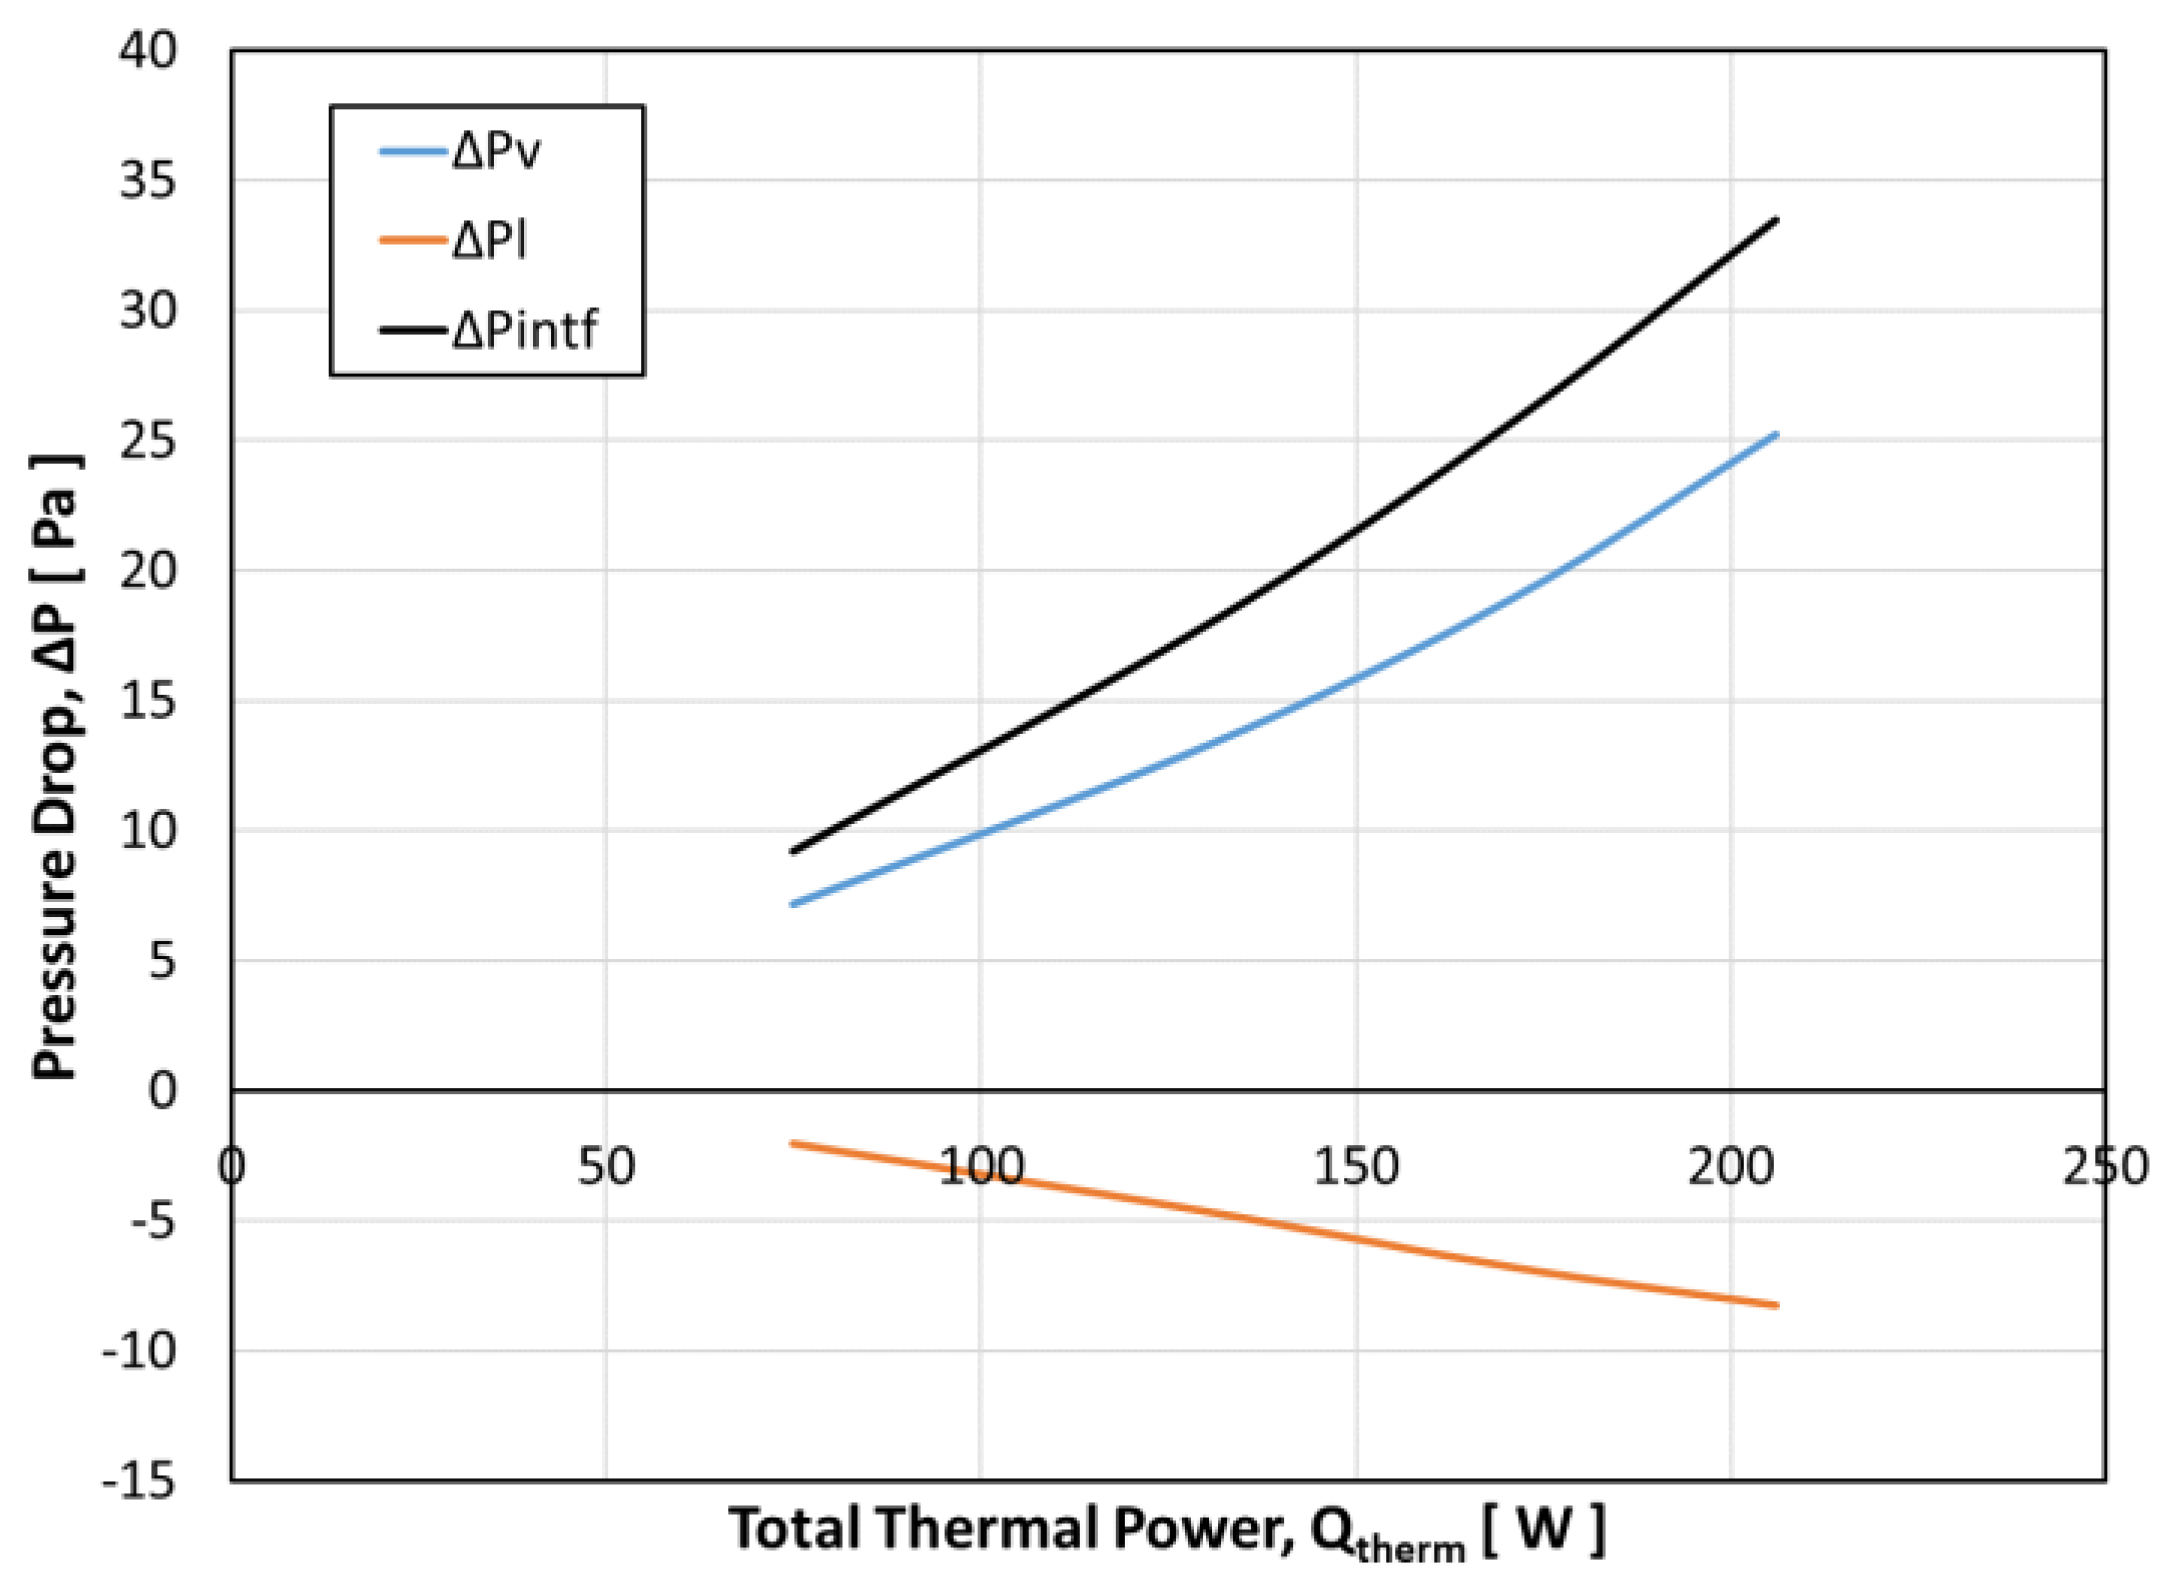
Figure 15 plots the steady-state viscous pressure drops in both the liquid and vapor regions of the single channel at various
Qtherm. These pressure drops are mathematically defined as the pressure difference between the upstream and downstream ends of the channel. The maximum interfacial pressure difference is estimated based on these vapor and liquid pressure drops, and these values are also plotted in
Figure 15. The evaporation of the working fluid increases with increasing input thermal power (
Qtherm), which causes a corresponding increase in the total mass flow rate of vapor. This leads to an increase in the total viscous pressure drop in the vapor region of the mesh screen channel. An increase in the vapor flow rate increases the interfacial shear stress. This shear when imposed on the liquid side of the interface leads to an increased liquid velocity near the interface. An increase in the velocity is illustrated with a higher pressure drop on the liquid side of the channel (a higher negative pressure drop implies larger reversed flow velocities). As both the vapor and liquid pressure drop increase with increasing thermal power, the steady state maximum interfacial pressure difference also increases.
5.3. Flow Reversal
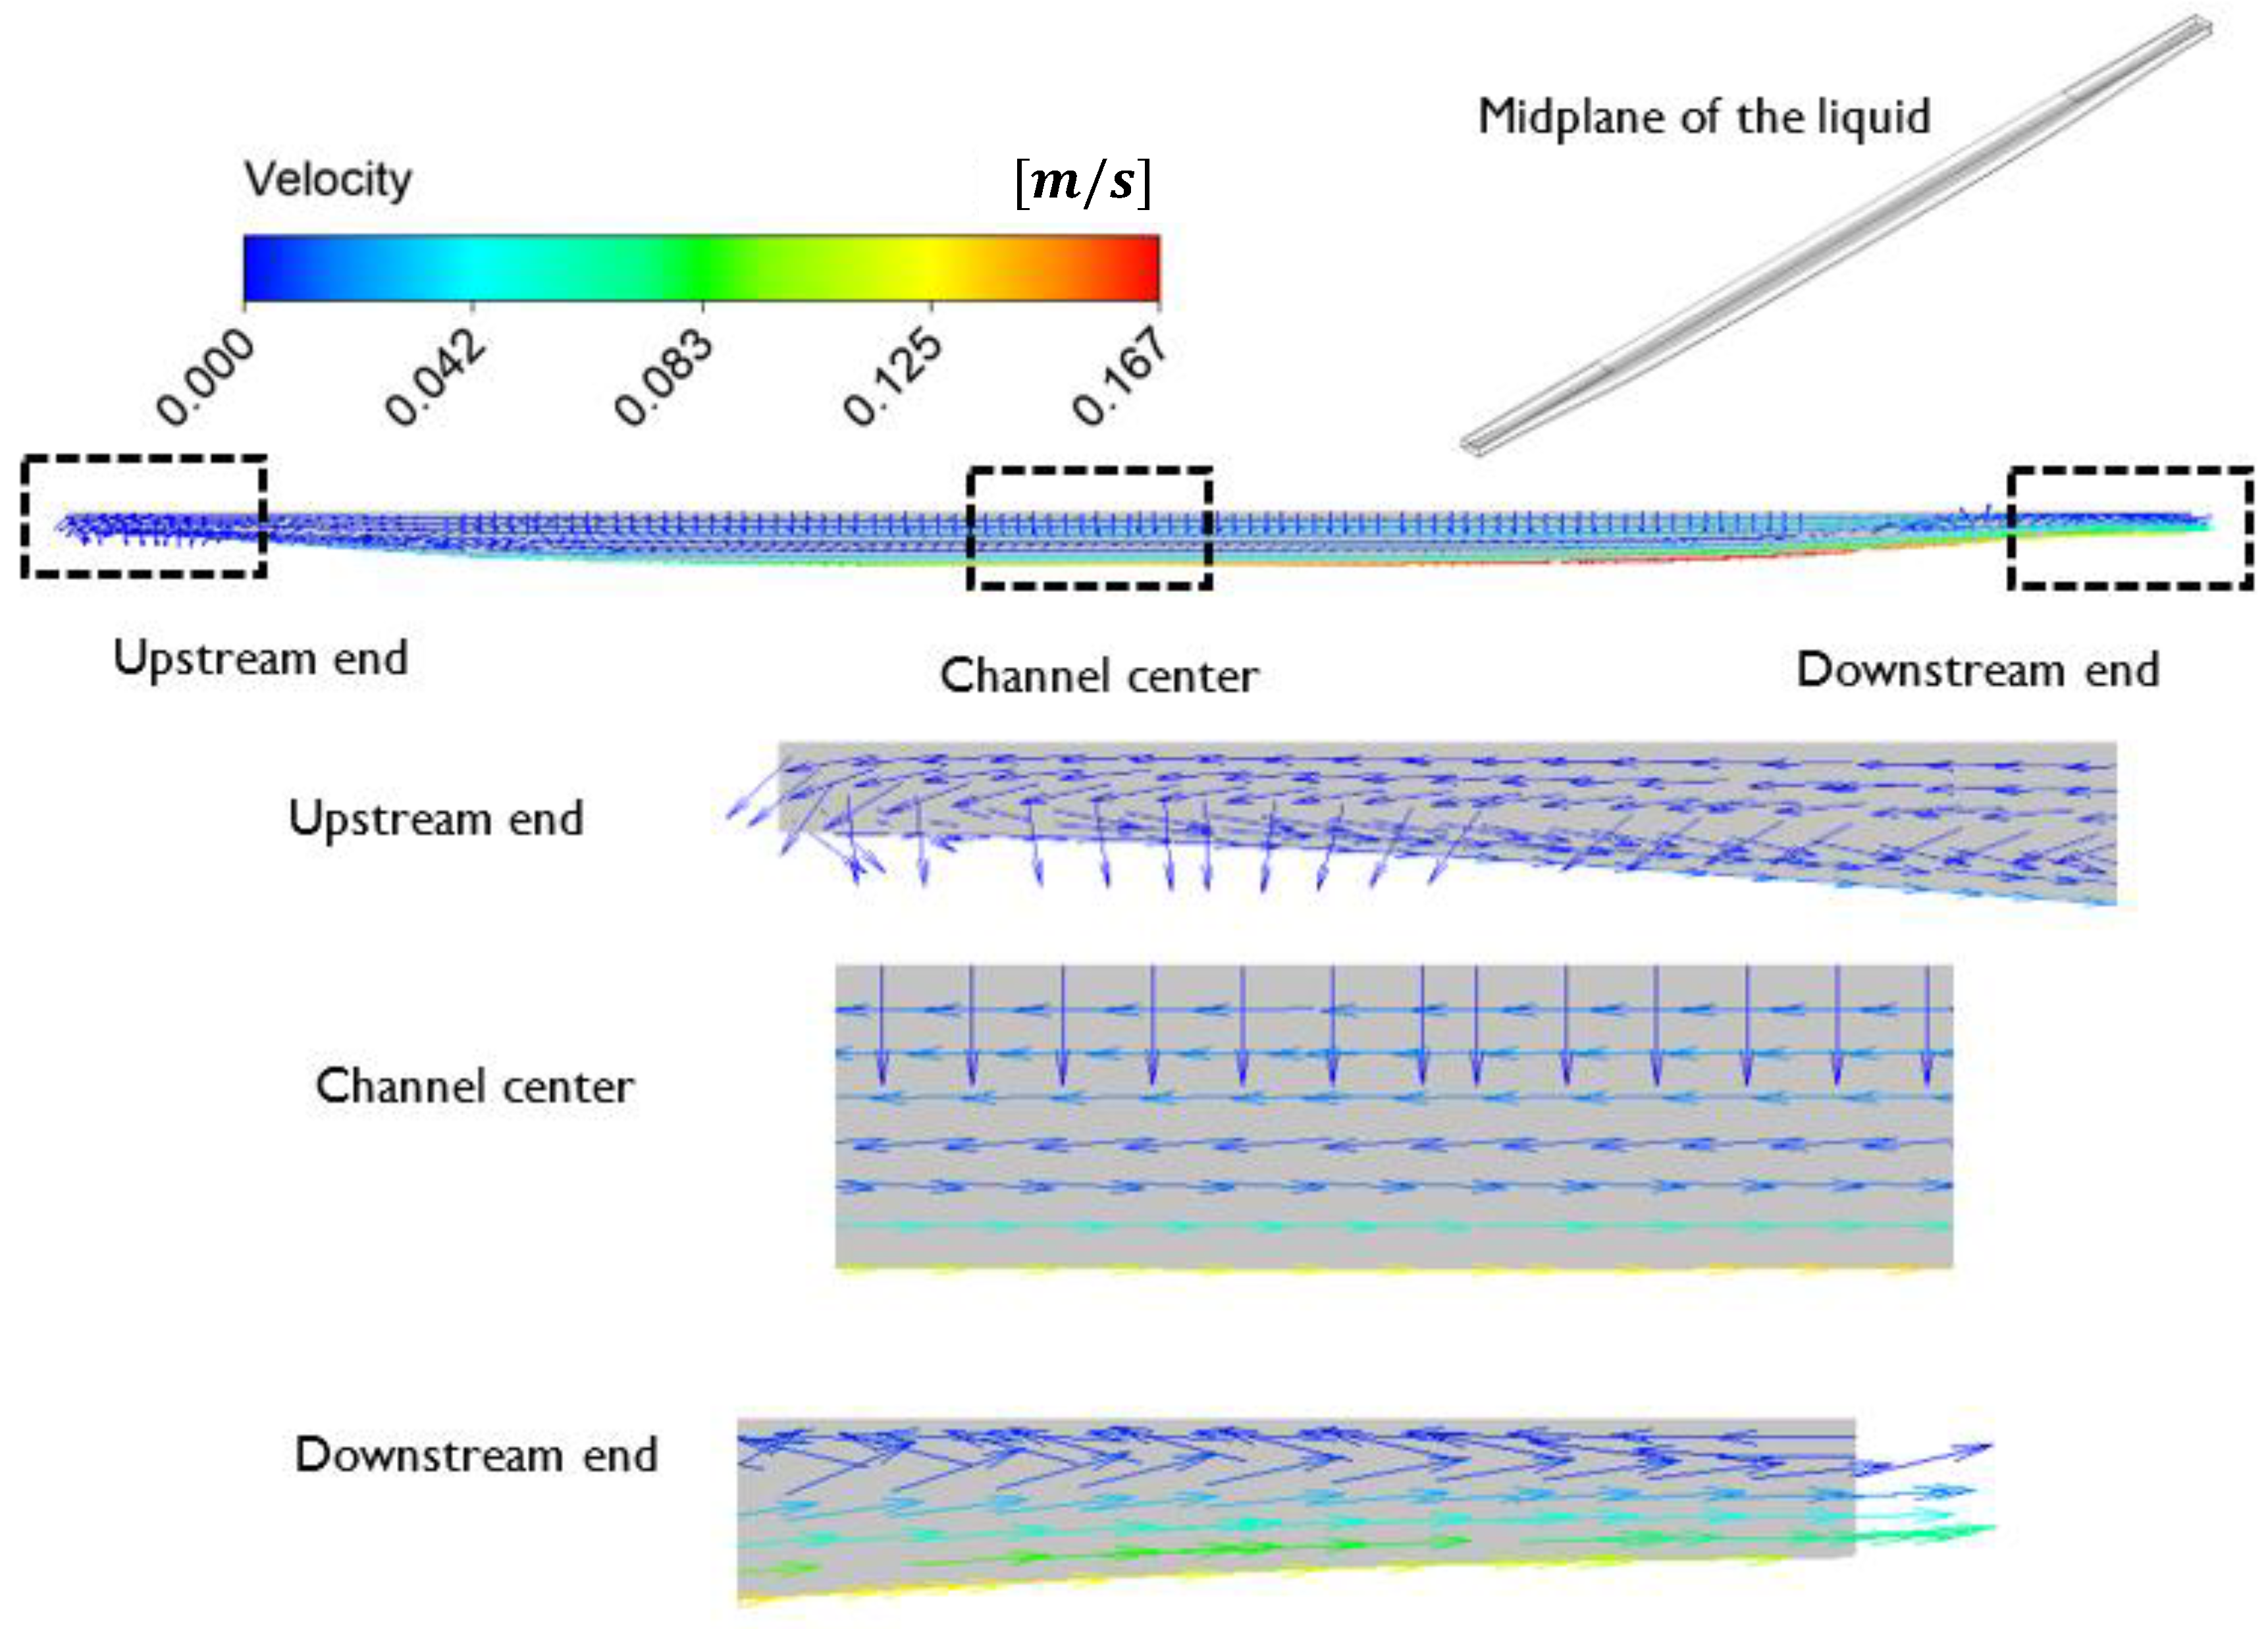
This flow reversal limit is based on the single-channel model. As discussed earlier, the liquid inlet is centrally positioned about the mesh screen. The liquid, therefore, flows into the channel from the top and exits via the outlet boundary. Additionally, the shear stress estimated from the vapor flow is imposed on the liquid side of the interface. This increases the velocity of the liquid near the interface and results in a reversed flow in the channel. The incoming liquid flows towards the upstream end of the channel before flowing downstream (
Figure 16). As discussed earlier, the imposed shear stress increases with increasing thermal power (
Qtherm), which subsequently increases the liquid velocity near the interface. This increase in the liquid velocity leads to a large liquid flow rate leaving the channel. Beyond certain values of thermal powers (
Qtherm), the increase in the shear stress is so large that it can remove all the incoming liquid (from the porous wick) into the channel. In such situations, the model predicts a flow reversal at the outlet boundary (velocity vectors–downstream end,
Figure 16) to satisfy mass conservation. The flow reversal at the channel outlet occurs when the input thermal power increases from 171 W to 206 W. As the current model solves the liquid flow separately, the model merely predicts a reversed liquid flow. The presence of a vapor plenum at the downstream end of the mesh screen channels, however, poses a more complex flow situation. Having said this, a reversed flow at the channel exit in the liquid region is detrimental to the steady operation of the CLTPWT and, therefore, is considered a flow-limiting condition. For the current channel dimensions, the model predicts that the operation of the device will be limited by this flow reversal condition before reaching the capillary limit based on channel dimensions.
It is important to note that the critical power at which the flow at the channel outlet changes direction is a strong function of the channel dimensions and the evaporation heat transfer coefficient. Further investigation is required into the flow reversal conditions based on the channel dimensions and the evaporation heat transfer coefficients. In this current work, the evaporation heat transfer coefficient is treated as a known independent parameter, and its value depends on the wire dimensions of the mesh screen. Experimental studies are required to both confirm this as well as accurately predict its value for different aspect ratios of the mesh screen channels. Moreover, additional simulations are required to assess the relationship between the critical power and the channel aspect ratio.
6. Conclusions
The single-channel model is solved using an iterative approach; the thermal model is employed to obtain the liquid and vapor flow regions, and the flow models are subsequently solved in these regions to estimate the pressure drop. Although the flow and thermal models are solved separately, the boundary conditions are passed from one model to another to ensure that the solution is obtained in a coupled manner. The shape of the liquid–vapor interface is also iteratively obtained. Based on the obtained interfacial curvature (along the channel), for any input thermal power (Qtherm), the pressure decreases in the streamwise direction of the channel in the vapor region, whereas, in the liquid region, the pressure increases in the streamwise direction. This is primarily because of a reversed flow in the liquid region owing to high interfacial shear. With increasing input thermal power (Qtherm), the minimum radius of curvature decreases, signifying a larger pressure drop incurred by the fluid (predominately in the vapor flow). Increasing the thermal power to 206 W predicts a flow reversal on the liquid side at the channel exit because of the high liquid–vapor interfacial shear. This flow reversal is detrimental to the operation of CLTPWT.
Author Contributions
Conceptualization, K.S.R. and F.M.G.; methodology, K.S.R. and F.M.G.; formal analysis, K.S.R.; investigation, K.S.R. and F.M.G.; writing—original draft preparation, K.S.R.; writing—review and editing, F.M.G.; supervision, F.M.G. All authors have read and agreed to the published version of the manuscript.
Funding
This research received no external funding.
Data Availability Statement
The data presented in this study are available on request from the corresponding author after consultation with BritePoint Inc. (the start-up that designed, developed, and manufactured the CLTPWT for thermal management of LEDs).
Conflicts of Interest
The authors declare no conflict of interest.
Nomenclature
| g | Acceleration due to gravity, m/s2 |
| h | Heat transfer coefficient, W/(m2·K) |
| k | Thermal conductivity, W/(m·K) |
| Mass flow rate, kg/s |
| A | Area, m2 |
| Cp | Specific heat, kJ/(kg·K) |
| L | Length, m |
| Nusselt number, dimensionless |
| Prandtl number, dimensionless |
| Q | Thermal power, W |
| Rayleigh number, dimensionless |
| T | Temperature, °C |
| Sub-Scripts |
| ch | Channel |
| eff | Effective |
| evp | Evaporation |
| expt | Experimental |
| f | Fluid |
| high | High |
| low | Low |
| pore | Pore |
| sat | Saturation |
| sc | Sub-cooled |
| screen | Screen |
| subs | Substrate |
| therm | Thermal |
| tot | Total |
| w | Wall |
| wick | Wick |
| Greek symbols |
| ε | Porosity |
| ρ | Density |
References
- Kandlikar, S.G. History, Advances, and Challenges in Liquid Flow and Flow Boiling Heat Transfer in Microchannels: A Critical Review. J. Heat Transf. 2012, 134, 034001. [Google Scholar] [CrossRef]
- Kim, S.-M.; Mudawar, I. Review of Databases and Predictive Methods for Pressure Drop in Adiabatic, Condensing and Boiling Mini/Micro-Channel Flows. Int. J. Heat Mass Transf. 2014, 77, 74–97. [Google Scholar] [CrossRef]
- Kim, S.-M.; Mudawar, I. Review of Databases and Predictive Methods for Heat Transfer in Condensing and Boiling Mini/Micro-Channel Flows. Int. J. Heat Mass Transf. 2014, 77, 627–652. [Google Scholar] [CrossRef]
- Chinnov, E.A.; Ron’shin, F.V.; Kabov, O.A. Regimes of Two-Phase Flow in Micro- and Minichannels (Review). Thermophys. Aeromech. 2015, 22, 265–284. [Google Scholar] [CrossRef]
- Zhang, X.-D.; Yang, X.-H.; Zhou, Y.-X.; Rao, W.; Gao, J.-Y.; Ding, Y.-J.; Shu, Q.-Q.; Liu, J. Experimental Investigation of Galinstan Based Minichannel Cooling for High Heat Flux and Large Heat Power Thermal Management. Energy Convers. Manag. 2019, 185, 248–258. [Google Scholar] [CrossRef]
- Garimella, S.V. Advances in Mesoscale Thermal Management Technologies for Microelectronics. Microelectron. J. 2006, 37, 1165–1185. [Google Scholar] [CrossRef]
- Khoshvaght-Aliabadi, M.; Hosseinirad, E.; Farsi, M.; Hormozi, F. Heat Transfer and Flow Characteristics of Novel Patterns of Chevron Minichannel Heat Sink: An Insight into Thermal Management of Microelectronic Devices. Int. Commun. Heat Mass Transf. 2021, 122, 105044. [Google Scholar] [CrossRef]
- Karayiannis, T.G.; Mahmoud, M.M. Flow Boiling in Microchannels: Fundamentals and Applications. Appl. Therm. Eng. 2017, 115, 1372–1397. [Google Scholar] [CrossRef]
- Harms, T.M.; Kazmierczak, M.J.; Gerner, F.M. Developing Convective Heat Transfer in Deep Rectangular Microchannels. Int. J. Heat Fluid Flow 1999, 20, 149–157. [Google Scholar] [CrossRef]
- Devahdhanush, V.S.; Lei, Y.; Chen, Z.; Mudawar, I. Assessing Advantages and Disadvantages of Macro- and Micro-Channel Flow Boiling for High-Heat-Flux Thermal Management Using Computational and Theoretical/Empirical Methods. Int. J. Heat Mass Transf. 2021, 169, 120787. [Google Scholar] [CrossRef]
- Kim, S.-M.; Mudawar, I. Universal Approach to Predicting Two-Phase Frictional Pressure Drop for Adiabatic and Condensing Mini/Micro-Channel Flows. Int. J. Heat Mass Transf. 2012, 55, 3246–3261. [Google Scholar] [CrossRef]
- Abo-Zahhad, E.M.; Ghenai, C.; Radwan, A.; Abdelrehim, O.; Salem, M.S.; Elmarghany, M.R.; Khater, A.; Shouman, M.A. A Micro-Metal Inserts Based Microchannel Heat Sink for Thermal Management of Densely Packed Semiconductor Systems. Sustainability 2022, 14, 14182. [Google Scholar] [CrossRef]
- Huang, Y.; Mei, P.; Lu, Y.; Huang, R.; Yu, X.; Chen, Z.; Roskilly, A.P. A Novel Approach for Lithium-Ion Battery Thermal Management with Streamline Shape Mini Channel Cooling Plates. Appl. Therm. Eng. 2019, 157, 113623. [Google Scholar] [CrossRef]
- Remella, K.S.; Gerner, F.M. Simplified Mathematical Model of a Novel ‘Closed Loop Two-Phase Wicked Thermosyphon (CLTPWT)’. Int. J. Therm. Sci. 2017, 114, 281–295. [Google Scholar] [CrossRef]
- Remella, K.S.; Gerner, F.; Shuja, A. Mathematical Modeling of Novel ‘Two-Phase Heat Transfer Device (TPHTD)’ for Thermal Management of Light Emitting Diodes (LEDs). ASME J. Heat Transf. 2017, 139, 062901. [Google Scholar] [CrossRef]
- Remella, K.S.; Gerner, F.M. Thin-Film Evaporation in a Mesh Screen Wick. ASME J. Heat Transf. 2022, 144, 111601. [Google Scholar] [CrossRef]
- Remella, K.S.; Gerner, F.M. In-Plane Effective Thermal Conductivity of a Single Layered Metallic Wire-Mesh Screen. In Proceedings of the 32nd Thermal Measurement, Modeling & Management Symposium (SEMI-THERM), San Jose, CA, USA, 14–17 March 2016; pp. 57–65. [Google Scholar]
- Ansys Inc. Ansys Mechanical User’s Guide. 2020. Available online: https://ansyshelp.ansys.com/account/secured?returnurl=/Views/Secured/corp/v202/en/wb_sim/ds_Home.html (accessed on 15 April 2023).
- Ansys Inc. Ansys Fluent Theory Guide. 2020. Available online: https://ansyshelp.ansys.com/account/secured?returnurl=/Views/Secured/corp/v202/en/flu_th/flu_th.html (accessed on 15 April 2023).
- Carey, V.P. Liquid-Vapor Phase-Change Phenomena: An Introduction to the Thermophysics of Vaporization and Condensation Processes in Heat Transfer Equipment; CRC Press: Boca Raton, FL, USA, 2020. [Google Scholar]
- Ansys Inc. Ansys Fluent User’s Guide. 2020. Available online: https://ansyshelp.ansys.com/account/secured?returnurl=/Views/Secured/corp/v202/en/flu_ug/flu_ug.html (accessed on 15 April 2023).
- Ansys Inc. Ansys System Coupling User’s Guide. 2020. Available online: https://ansyshelp.ansys.com/account/secured?returnurl=/Views/Secured/corp/v202/en/sysc_ug/sysc_ug.html (accessed on 15 April 2023).
- Ansys Inc. Ansys Fluent Customization Manual. 2020. Available online: https://ansyshelp.ansys.com/account/secured?returnurl=/Views/Secured/corp/v202/en/flu_udf/flu_udf.html (accessed on 15 April 2023).
Figure 1.
(a) The Closed-Loop Two-Phase Wicked Thermosyphon (CLTPWT), (b) various sections of the CLTPWT, (c) 2D sectional view of the evaporator package, and (d) E-SEM image of mesh screen channels.
Figure 1.
(a) The Closed-Loop Two-Phase Wicked Thermosyphon (CLTPWT), (b) various sections of the CLTPWT, (c) 2D sectional view of the evaporator package, and (d) E-SEM image of mesh screen channels.
Figure 2.
(
a) Experiments conducted on the wire mesh screen to study the screen wettability [
16]; (
b) View of the evaporator highlighting two-phase flow in mesh screen channels and a unit cell of the wire mesh screen with liquid–vapor interface [
16].
Figure 2.
(
a) Experiments conducted on the wire mesh screen to study the screen wettability [
16]; (
b) View of the evaporator highlighting two-phase flow in mesh screen channels and a unit cell of the wire mesh screen with liquid–vapor interface [
16].
Figure 3.
Channel geometry highlighting regions for thermal analysis: (a) an isometric view and (b) a front view. Fluid flow analysis: (c) an isometric view (d) a front view.
Figure 3.
Channel geometry highlighting regions for thermal analysis: (a) an isometric view and (b) a front view. Fluid flow analysis: (c) an isometric view (d) a front view.
Figure 4.
Single-channel geometry and boundary conditions employed in the thermal ‘2-h’ model.
Figure 4.
Single-channel geometry and boundary conditions employed in the thermal ‘2-h’ model.
Figure 5.
(Left) The ‘2-h’ thermal model to obtain liquid and vapor regions and (Right) thermal model with separate heat transfer coefficients in liquid and vapor regions.
Figure 5.
(Left) The ‘2-h’ thermal model to obtain liquid and vapor regions and (Right) thermal model with separate heat transfer coefficients in liquid and vapor regions.
Figure 6.
The boundary condition for solving vapor flow in the single channel model.
Figure 6.
The boundary condition for solving vapor flow in the single channel model.
Figure 7.
The boundary conditions for solving the liquid side in the single channel model.
Figure 7.
The boundary conditions for solving the liquid side in the single channel model.
Figure 8.
Steady-state temperature contours of the single channel; (a) isometric view, (b) view from left, and (c) view from right.
Figure 8.
Steady-state temperature contours of the single channel; (a) isometric view, (b) view from left, and (c) view from right.
Figure 9.
(a) Velocity and (b) pressure contour plots of the side walls in the vapor region of the mesh screen channel.
Figure 9.
(a) Velocity and (b) pressure contour plots of the side walls in the vapor region of the mesh screen channel.
Figure 10.
Contour plot showing steady state interfacial shear stress.
Figure 10.
Contour plot showing steady state interfacial shear stress.
Figure 11.
(a) Pressure contour plot along the side walls of the liquid region and (b) velocity contour plot at channel outlet of the liquid region.
Figure 11.
(a) Pressure contour plot along the side walls of the liquid region and (b) velocity contour plot at channel outlet of the liquid region.
Figure 12.
Pressure distribution in the liquid region, vapor region, and across the interface as a function along the channel length.
Figure 12.
Pressure distribution in the liquid region, vapor region, and across the interface as a function along the channel length.
Figure 13.
Magnified view of the temperature contour at the channel center to highlight both initial and final interfacial locations [only the magnified image has the contour plot].
Figure 13.
Magnified view of the temperature contour at the channel center to highlight both initial and final interfacial locations [only the magnified image has the contour plot].
Figure 14.
Side view of liquid and vapor regions in the mesh screen of the single channel highlighting the initial and new interfacial shapes.
Figure 14.
Side view of liquid and vapor regions in the mesh screen of the single channel highlighting the initial and new interfacial shapes.
Figure 15.
Variation of interfacial pressure drop as a function of total thermal power .
Figure 15.
Variation of interfacial pressure drop as a function of total thermal power .
Figure 16.
Steady-state velocity vectors at the midplane on the liquid side of the single channel model (Qtherm = 206 W, Tsat = 101.46 °C, Tsc = 61.84 °C).
Figure 16.
Steady-state velocity vectors at the midplane on the liquid side of the single channel model (Qtherm = 206 W, Tsat = 101.46 °C, Tsc = 61.84 °C).
Table 1.
Component-wise material properties employed in the thermal model.
Table 1.
Component-wise material properties employed in the thermal model.
| Component |
| Specific Heat, Cp
| Conductivity, keff
|
|---|
| Substrate, Metal plate | 8933 | 385 | 400 |
| Mesh screen | 6134.2 | 1739.3 | 69.68 |
| Casing | 7850 | 434 | 60.5 |
| Porous wick | 1825 | 2018.8 | 78.78 |
Table 2.
Steady-state distribution of thermal powers at various locations based on the single channel model.
Table 2.
Steady-state distribution of thermal powers at various locations based on the single channel model.
| Location | Thermal Power, [W] | |
|---|
| Total input power | 2.126 | - |
| Mesh screen: Vapor side | 1.79 | 84.20% |
| Mesh screen: Liquid side | 0.035 | 1.65% |
| Porous wick | 0.363 | 17.07% |
| Casing | 0.008 | 0.38% |
Table 3.
Saturation and sub-cooler temperatures for various input thermal powers employed in the single channel model.
Table 3.
Saturation and sub-cooler temperatures for various input thermal powers employed in the single channel model.
Thermal Power
| Saturation Temperature
[°C] | Sub-Cooler Temperature
[°C] |
|---|
| 75 | 59.2 | 43.9 |
| 130 | 76.7 | 54.2 |
| 171 | 87 | 59 |
| 206 | 101.46 | 62.84 |
| Disclaimer/Publisher’s Note: The statements, opinions and data contained in all publications are solely those of the individual author(s) and contributor(s) and not of MDPI and/or the editor(s). MDPI and/or the editor(s) disclaim responsibility for any injury to people or property resulting from any ideas, methods, instructions or products referred to in the content. |
© 2023 by the authors. Licensee MDPI, Basel, Switzerland. This article is an open access article distributed under the terms and conditions of the Creative Commons Attribution (CC BY) license (https://creativecommons.org/licenses/by/4.0/).
