Abstract
The energy sector is essential to a country’s economy and social life. In recent years, the energy market in Romania has experienced a certain dynamism, influenced by multiple factors such as regional conflicts, national and EU energy legislation, liberalization of the energy market, and increasing demand for energy products. These factors determined a sharp increase in electricity, gas, and oil prices in Romania in recent years. Based on the above, the present study aims to analyze Romanian energy companies’ financial performances and determine whether there is any correlation between their governance and their performance. In order to fulfill the research objectives, financial performance data were extracted and analyzed for a number of 43 energy companies in Romania, considering the financial statements prepared up to 31 December 2021. Using the scoring method, governance indices were determined for each company. Finally, using a linear regression model, we analyzed the correlation between governance and performance of the 43 companies. The results of the study indicate that there is a direct correlation of moderate intensity between the two variables, with the performance of energy companies being higher if they have implemented a governance system.
1. Introduction
Corporate governance is defined as the system by which companies are governed and controlled [1]. The professional body IFAC gives several definitions of corporate governance concepts. Thus, corporate governance involves a set of relationships between a company’s executive management, board of directors, shareholders, and other associated parties. Corporate governance provides the structure through which the objectives of the firm are set, as well as the means of achieving those objectives and monitoring performance. Good corporate governance should provide the motivation for achieving objectives that are in the best interests of the firm and its shareholders and should facilitate effective monitoring, thereby encouraging firms to use resources efficiently [2].
According to the IFAC recommendations, corporate governance is a conceptual framework for organizations, with two dimensions: compliance and performance. Compliance covers the role and structure of management as well as its remuneration. The performance focuses on strategy and value creation. This dimension helps management to make strategic decisions, identify risks, find the key to performance, and identify key decision points. Therefore, there is a need to develop best practices and techniques to be used effectively in different economic entities [3].
Internationally, the concept was pioneered by the UK private sector, i.e., by shareholders who wanted better control over the management of companies while maximizing financial results. Subsequently, the concept was taken up and implemented in several countries, thanks to the role played by the Organization for Economic Co-operation and Development (OECD) in publishing generally applicable principles of a recommendatory nature. The first set of principles was developed in 1999, and an improved version was published in 2004 [1].
The O.E.C.D. has also published a series of guidelines on the implementation of these principles by country states at a national level. These principles cover: shareholders’ rights (guarantee of ownership, right to dividends, right to be informed of important decisions affecting the company’s business, right to participate and vote in general meetings), fair treatment of all shareholders (minority shareholders enjoying the same rights as majority shareholders), the role of the different parties involved in the management and control of the company (employees, creditors, suppliers, customers, financial institutions), transparency and disclosure of information (the corporate governance system ensures timely and accurate information to all stakeholders on the financial statements, results, shareholding and governance of the company), the responsibilities of the board of directors and executive management for their activities.
These principles have been incorporated in several scientific papers, with most studies showing that implementing corporate governance principles at company levels has beneficial effects for shareholders, leading to the maximization of their profits. In recent years, however, the world economy has faced and is still facing financial problems caused by several factors, and, for this reason, it has been questioned whether better corporate governance can lead to greater global economic and financial stability.
The corporate governance system is primarily designed to protect the interests of investors. The losses caused to shareholders by the management of multinational companies because of financial scandals have led some of them to develop a mechanism to protect their interests.
Adrian Cadbury (1992) is one of the promoters of the corporate governance concept. The concept has also been adopted to a certain extent at the international level, with the management of multinational companies being responsible for implementing the principles of corporate governance at the level of the entities’ activities [4].
Internationally, there are several corporate governance models, including the shareholder model and the stakeholder model. The shareholder model is the model found in Anglo-Saxon countries. It is characterized by the fact that its implementation in companies is aimed at maximizing the economic benefits of shareholders, profits and share prices being among them. The stakeholder model is present in most European countries except the Anglo-Saxon and Nordic countries. It is characterized by the fact that its implementation in companies is not necessarily aimed at maximizing the economic advantages of shareholders but at protecting the interests of all parties involved in the corporate governance mechanism (customers, suppliers, employees, shareholders, managers, and state institutions) [5].
Inadequate governance and control of public interest enterprises can affect global economic and financial stability, in some cases leading to global financial crises. Based on these considerations, the most developed countries issued the “OECD Principles of Corporate Governance” in 1999.
These principles are one of the basic pillars of global economic and financial stability. Developed countries have implemented these corporate governance principles in their legislation. The US, for example, in 2002, hit by financial scandals, passed the Sarbanes-Oxley Act, which introduced certain governance obligations for US companies. European Union countries have also introduced corporate governance principles into their legislation. The United Kingdom has put shareholders at the forefront, and countries such as France, Germany, and Italy have paid more attention to the role of employees and financial institutions as participants in corporate governance.
In view of the above-mentioned role of governance in maximizing the financial performance of companies and the fact that electricity, gas, and oil are indispensable in economic and social life, this study aims to analyze the degree of implementation of governance principles in Romanian energy companies.
Additionally, given that energy entities can be considered of public interest, contributing to ensuring macroeconomic balance, we consider it necessary that they present financial stability. Starting from the premise that the implementation of corporate governance or its improvement can influence the efficiency of the activity of energy companies and increase their financial performance, this study aims to analyze the correlation between governance and performance in Romanian energy companies. The present study is important because it answers the question of whether better corporate governance can prevent the decline in the financial results of energy companies, their default, and possible national and even international energy and economic crises. The results of the study can then be used by companies to improve their corporate governance and risk management strategies. Good corporate governance is particularly important in financial reporting, as it is a key factor in ensuring confidence in the capital markets by providing quality information. Good corporate governance emphasizes the importance of non-executive directors, the audit committee, and their structures and relationships with management. It also focuses on internal controls, internal audits, external audits, and corporate governance disclosures.
The energy sector is essential to a country’s economy and social life. In recent years, the energy market in Romania has experienced a certain dynamism, influenced by factors such as regional conflicts, national and EU energy legislation, liberalization of the energy market, and increasing demand for energy products. These factors determined a sharp increase in electricity, gas, and oil prices in Romania in recent years. Below we have presented the evolution of annual inflation of the prices of energy goods in Romania according to the forecasts of the National Bank of Romania (Figure 1).
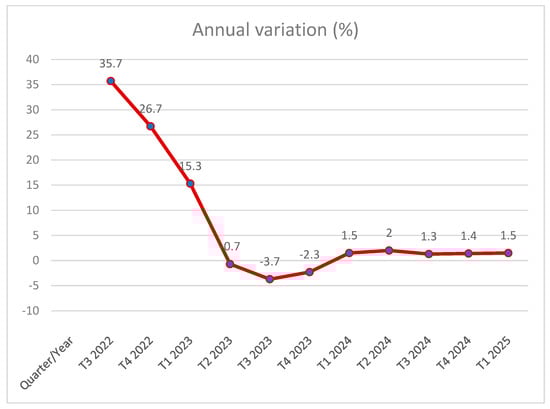
Figure 1.
Annual inflation of energy goods prices. Source: processing data from the graph mentioned in: https://www.bnr.ro/Proiectii-BNR-22694-mobile.aspx, accessed on 26 April 2023 [6].
Annual inflation of the prices of energy goods of over 35% is observed in the second quarter of 2022, and, according to the National Bank of Romania’s forecasts, the prices of these goods should stabilize in the period of 2023–2024, but we believe that some factors are likely to continue to influence the dynamics of these prices. Additionally, considering the dependence of the companies’ activities on these energy products, there was a chain increase in prices in Romania, with inflation being 16.4% in December 2022 compared to December 2021.
The increase in inflation overlapped with the increase in the monetary policy interest rate in December 2022, which was 6.75%. These factors influenced the purchasing power of the population, and, from there, it resulted in a series of chain effects on the demand for goods and services. For example, one of the strongest effects was related to the increase in prices for metallurgical products such as concrete steel used in construction works whose price even exceeded 7 lei per kilogram at the beginning of 2022, the metallurgical market being dependent on the price of electricity used in this industry.
Electricity and gas prices have significantly risen, seeing the highest values in Eurostat records in the second half of the year 2022. Policies and interventions in EU countries have been aimed at mitigating the effects of higher energy sales prices to final customers because of the unprecedented rise in payment costs on the local and European markets. The measures adopted in Romania in this respect were price capping, compensation of energy bills, and temporary tax exemption for consumers [7]. In the European Union countries, the highest increase in electricity prices for household consumers in 2022 compared to 2021 was recorded by Romania (+112%), followed by the Czech Republic (+97%) and Denmark (70%). In terms of gas prices, Romania is the second country with the highest increases (+165%), with the Czech Republic (+231%) in the first place.
Given the importance of energy goods in the economic and social life of a country, we proposed study to analyze the trend in terms of the financial performance of energy companies in this case in Romania in the period 2012–2021 and whether there is any correlation between the governance of these companies and their financial performance.
The paper is organized as follows: next, the literature on the role of corporate governance and performance relationship testing is reviewed and described in Section 2. The research methodology is described in Section 3, followed by a presentation of results (Section 4) and a discussion on the results (Section 5). Research findings, implications, and limitations are discussed in Section 6.
2. Literature Review
2.1. Importance of Corporate Governance
The COVID-19 crisis has had a significant economic impact worldwide and generated different reactions from different business segments. The crisis has introduced exceptional uncertainty in running a business [8]. Can the adoption of corporate governance diminish the impact of such a crisis?
In times of crisis, several governance mechanisms can help, namely, risk management committees, board diversity, independent directors, foreign investors, institutional ownership, ownership concentration, CEO’s dual roles, family ownership [9,10]. The presence of independent commissioners (with monitoring role) can protect the decline of ROA in times of crisis [11].
Additionally, appropriate internal corporate governance can prevent stock price crash risk [12].
The COVID-19 crisis reduced performance and increased risks for private businesses in many sectors. The quality of the country’s governance system can prevent the effect of an economic shock (such as the COVID-19 crisis) on firms’ operations [13].
Corporate governance mechanisms have an impact on SME perceptions of COVID-19’s influence, alerting companies to adjust their business strategy and organizational structure to better cope with the effects of the current crisis [14]. Various studies have examined the characteristics of corporate governance: the difference made by diversity on corporate board [15,16,17], independence and financial knowledge for the board and the audit committee [18,19,20,21], role of auditors [22,23,24], owner structure [25,26,27,28].
Other studies have tested the relationship between the existence of corporate governance and firm performance, demonstrating that corporate governance adds value to firm performance [29,30,31].
Using the principles of corporate governance positively influences the performance of state-owned enterprises [32,33,34].
2.2. The Energy Sector
Several international research studies have been developed on the concepts of performance and governance in the field of energy companies, and most of them have demonstrated that better corporate governance causes an increase in the economic and financial performance of companies.
Corporate governance practices influence sustainability as part of an organization’s corporate social responsibility performance. Boards of directors need to focus on innovation and organizational change to increase sustainability in the social and environmental dimensions and adapt to the new turbulent times [35].
Governance mechanisms, such as environmental management system certification, environmental organization, publication of sustainability reports, strategic environmental planning, and quality of governance, can help combat climate change influenced by carbon emissions from the electricity industry [36].
Financial auditing of energy companies should integrate sustainable development and social responsibility, as currently these companies only follow financial performance that is not significantly affected by social responsibility [37].
The existence of a significant number of independent board members could have a positive impact on environmental performance [38].
Companies’ adoption of renewable energy is influenced by both internal governance (indicated by the characteristics of the board of directors) and external governance (indicated by the institutional environment). Adoption increases in the case of a strong external governing body and decreases in the case of the duality of the board of directors and the greater weight of the executive. Firms in common law systems tend to use fewer renewable sources [39].
ESG (environmental, social, and governance) sustainability reporting significantly influences operational performance, especially in emerging economies. The influence is insignificant on financial performance and market performance, according to a study on sectoral energy performance in economies in 50 countries in the period 2008–2017 [40].
Different combinations of ESG pillars (environmental, social, and governance aspects) can influence the financial performances of companies differently. The social pillar improves financial performance [41,42].
Total assets, the amount of proactive environmental costs, the proportion of technicians, and the number of patents contribute most to companies’ environmental performances [43,44].
In the communication of companies with stakeholders, an important role is played by the disclosure of non-financial information, especially those related to corporate governance. Disclosure should be mandatory, even for information that is not considered to be in the best interest of companies (such as executive remuneration and employment policy) [45]. Earnings per share, return on equity, type of company, size of company, age of company, and auditing firm positively influence the company environmental disclosure [46].
For companies in the energy sector, performance is influenced by various factors:
- -
- number of board members (a positive influence) [47];
- -
- the presence of women on the board (a negative influence) [47];
- -
- the higher number of directorships of directors (high tenure affects the fulfilment of duties and independence and weakens corporate governance) [48];
- -
- gender diversity of executives [49]: innovation is negatively affected by the proportion of female executives. Economic innovation is promoted by women in high tax burden areas. Women’s caution in eco-innovation decisions stems from high investment risk. The results of a study performed for listed companies in China’s energy industry demonstrate the importance of CEO–CFO pairing indicators on corporate decision-making and crash risk. It was found that the assignment of a CEO (chief executive officer) and CFO (chief finance officer) of the same gender had a beneficial impact on the long-term share price stability of energy companies [49].
The positive relationship between corporate governance and company valuation has been demonstrated: the higher the governance standards, the higher their ROA, ROE, or Tobin’s Q [50,51].
Corporate governance has a significant impact on the capital structure of companies in the energy industry. The level of leverage is negatively affected by board size and state ownership, two indicators of the quality of corporate governance. The financial expertise of larger boards allows energy companies to finance themselves predominantly through their own capital. Debt financing is negatively influenced by the state as the dominant investor [52].
Governance positively affects operational efficiency. ESG compliance is more pronounced in European companies. Asian companies are more disciplined in the energy sector. Accounting performance (ROA and ROE) differs significantly between GRI (Global Reporting Initiatives) and non-GRI companies [53].
A survey of 55 European companies in different categories in the energy industry indicated a positive association between ESG disclosure and firm value measured using market value [54]. The profitability of electricity companies was positively influenced by vertical integration and was lower for state-owned companies [55].
In Romania, the sustainability of renewable energy companies is questionable. Their investments have been based on state subsidies. Innovation and improvement of business processes allows for improved financial performance [56].
The financial performance of Romanian companies is positively affected by corporate social responsibility actions [57].
The relation between governance and performance was also studied for entities in the banking and insurance sectors in Romania [58,59].
Literature in the field shows that the purpose of corporate governance is to increase the value of a company, and this value is itself influenced by the increase in economic and financial performance (such as turnover). Starting from this, the present study aims to investigate whether the implementation of a governance system in Romanian energy companies has shown to improve their financial performance. This could be performed by demonstrating whether there is a direct correlation between the degree of implementation of corporate governance and the increase in financial performance of the companies through research study. If the conclusion shows that there is a direct correlation between the degree of implementation of corporate governance (Ig) and the performance of companies (CA turnover), then recommendations can be made to improve corporate governance so that the performance of companies can increase even more, taking into account not only the interests of shareholders but also the interests of other participants in a company’s business.
3. Materials and Methods
3.1. Research Materials and Methods according to the Literature
Several research studies have been developed internationally to demonstrate the correlation between governance and performance, using specific research methods.
We identified several studies that constructed an index of corporate governance and tested its relationship with firm performance, presented in Table 1. Many studies constructed an index from the components of corporate governance and measured performance based on ROE, ROA, or Tobin’s Q indicators.

Table 1.
Studies with index of corporate governance.
3.2. Sample Selection and Data Collection
In order to fulfill the research objectives of the present study, several steps were taken. Thus, the data of 43 energy companies in Romania were extracted, out of a total of 85, operating in the fields of electricity generation, transmission and distribution, natural gas, and oil. The sample is representative, and the data were extracted based on reports published annually in the period 2012–2021. We note that data were not yet available for all selected companies at the time the case study was developed for the financial year 2022. The data extracted for the companies that were the subject of the study related to turnover (CA), net profit (Pn), and number of employees (Ns) recorded at the end of the financial year.
3.3. Presentation of the Validation Model
We proposed the following hypotheses:
H1.
There is a significant direct correlation between the governance of energy companies and their performance.
H2.
The governance of energy companies has a significant influence on the variation in energy company performance.
The data obtained were centralized for each company, and then the correlation between performance and governance was analyzed using a simple linear regression model presented below:
where
y = x α + ε,
- y is the dependent variable (explained, endogenous, resultant), in the case study represented by the performance (Ca) of the companies analyzed;
- x is the vector of independent variables (explanatory, exogenous), of dimension 1 × p, in the case study represented by the governance index (Ig) obtained using the scoring method;
- α is the vector of coefficients, of dimension p × 1, the parameters of the model;
- ε is a variable, interpreted as an error (disturbance, measurement error).
For these companies, data on the corporate governance system were also extracted, and a governance index (Ig) was determined using the scoring method. Thus, the maximum number of points for each company was 10, and the minimum number was 0 points (for companies that did not implement a corporate governance system).
In determining the scoring score, information such as general principles, risk management system, and internal control, fair rewards, motivation, and adding value through investor relations were considered. Each system of questions received a maximum of 2.5 points.
Information on general principles refers to the implementation of a corporate governance code, the existence of transparency regarding the members of the governing bodies, and the existence of specialized committees such as audit, nomination, and remuneration committees.
Information on the internal management and control system refers to the organization by companies of internal audit activity for the purpose of independently assessing, on a regular basis, the safety and effectiveness of the risk management and internal control system and corporate governance practices.
Information on fair reward and motivation refers to the existence of transparency regarding the remuneration policies of members of management bodies.
Information on adding value through investor relations refers to the existence of transparency regarding the organization of general meetings of shareholders/members and the respect of their voting rights.
In order to measure the degree of implementation of corporate governance in the companies covered by the research study, we used the scoring method, calculating a score for each company based on a set of questions presented in Table 2.
Table 2.
Estimating the Governance Index (Ig) of Romanian energy companies.
4. Results
To estimate the coefficients of a linear model by the least squares method and to calculate the necessary statistics for the associated statistical tests, the Regression procedure, one of the most complex in the Excel statistical processing package, was used.
Before using this model, we centralized the companies’ data, i.e., their governance index (Ig) and their performance, represented by their turnover as of 31 December 2021, as shown below in Table 3.
Table 3.
Governance and performance situation of Romanian energy companies.
Next, we processed the data obtained using the Regression procedure from the Excel statistical processing package and using EViews software. After processing the data, we obtained the following results (Table 4).
Table 4.
Summary output.
The correlation ratio (Multiple R) has a value of 0.51, indicating the existence of a correlation of moderate intensity between the two variables. At the same time, the regression model explains 26% of the variation in company performance (i.e., turnover)—in other words, 26% of the total variation in turnover is explained by changes in corporate governance.
The regression model is valid at a 5% significance level (Significance F < 0.05) (Table 5).
Table 5.
ANOVA.
The slope parameter of the regression model (the coefficient of the explanatory variable Ig) is statistically significant for a significance level of 5%, showing that we can expect the company’s performance (turnover) to increase on average by EUR 111.13 million when improving the Governance Index by one scoring point (Table 6). Residual analysis with prediction error values and standardized error values is presented in Table 7. The probabilities are presented in Table 8. The residual diagram (Figure 2) and Line Fit Plots (Figure 3) allow analysis of the quality of the chosen model.
Table 6.
Determining the Slope Parameter of the Regression Model.
Table 7.
Residual Output.
Table 8.
Probability output.
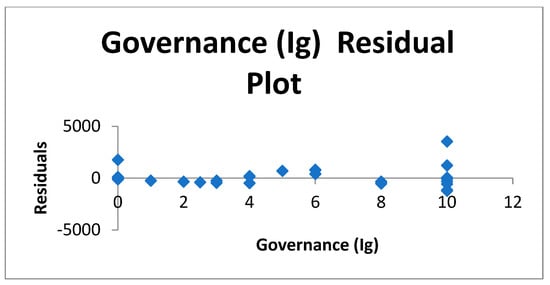
Figure 2.
Residual Plot.
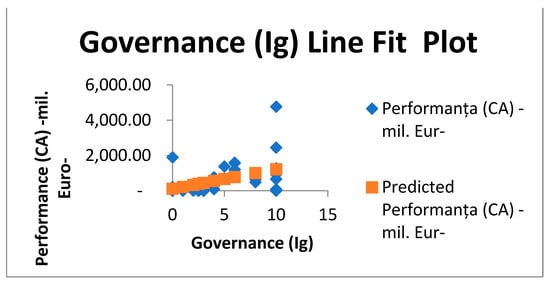
Figure 3.
Line Fit Plot.
The linear regression equation is:
y = 115.77 + 111.14∙x
(167.22) (29.28)
(167.22) (29.28)
The correlation matrix (Table 9) indicates that there is a direct correlation of moderate strength between the two variables, and the Pearson correlation coefficient (of 0.51) is statistically significant at a 5% significance level. Hypothesis H1 (There is a significant direct correlation between the governance of energy companies and their performance) is validated by identifying a Pearson correlation coefficient with a positive, statistically significant value.
Table 9.
Correlation Matrix.
The correlogram (Figure 4) indicates the existence of a direct link between the variables, and the linear regression equation modelling the trend in this link is presented, expressing the dependence of company performance on corporate governance.
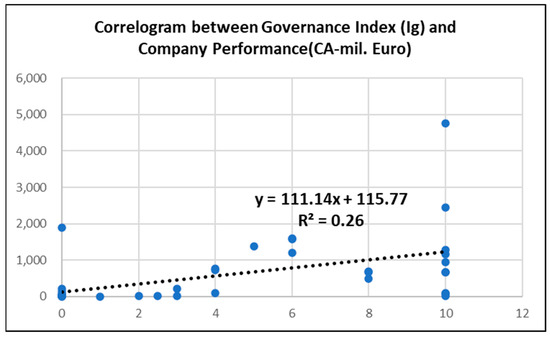
Figure 4.
Correlogram between Governance Index and Performance.
In order to refine the model presented above to ensure the validation of all assumptions of the linear regression model and to improve its ability to explain the variation in the response variable, this variable was log transformed and included in a shape model:
where
- β_0, β_1 are the model parameters (Intercept and Slope parameters);
- i = energy company;
- CAi = performance quantified by the turnover of energy company i;
- Igi = Governance index of energy company i;
- N = population volume.
The application of the natural logarithm function to the values of the response variable can be beneficial for model optimization if outliers are observed between the values of this variable.
Applying the log–linear regression method, the following model resulted in:
The model is statistically valid at 5% significance level (Sig = 0.0000015 < 0.05) (Table 10), both parameters (Intercept and Slope) are statistically significant at the same significance level (Sig(β_0) = 0.0000003 < 0.05; Sig(β_1) = 0.0000015 < 0. 05) (Table 11), with the sign of the slope parameter indicating a direct correlation between the governance of energy companies and their performance, with an increase in the governance index leading to a relative increase in turnover.
Table 10.
ANOVA a.
Table 11.
Coefficients a.
In addition, the model has a higher explanatory power than the previous one, explaining 43.6% of the relative variation in company performance (Table 12).
Table 12.
Model Summary b.
The quality of the model was also assessed through the analysis of the distribution of residuals (testing the hypothesis of normality of errors, the hypothesis of homoscedasticity of errors and the hypothesis of non-homoscedasticity of errors). Verification of the normality of the distribution of the residuals was checked both by graphical procedures (Error Histogram and Normal P-P Plot) and by numerical procedures: Kolmogorov–Smirnov and Shapiro–Wilk tests. (Figure 5 and Figure 6).
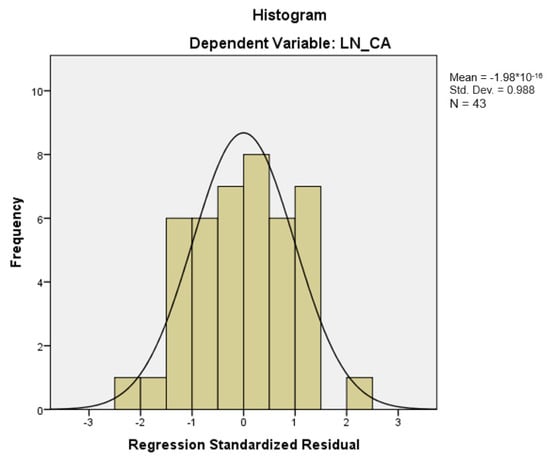
Figure 5.
Histogram.
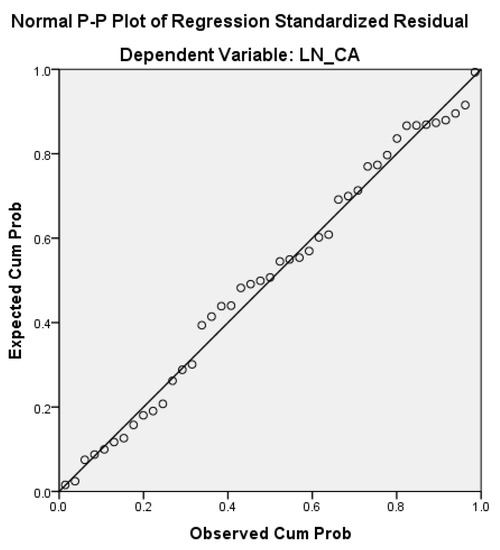
Figure 6.
Normal P-P Plot.
The results demonstrated the validation of the hypothesis of normality of the errors, at a significance level of 5% (Sig.(Shapiro–Wilk) = 0.792 > 0.05, accepting the null hypothesis of the test, according to which there is no significant difference between the distribution of errors and the normal distribution) (Table 13).
Table 13.
Tests of Normality.
The hypothesis of homoscedasticity of errors was tested using the White Test, yielding the following auxiliary regression model:
The calculated value of the White (Lagrange Multiplier) test (0.39) is lower than the critical value (Hi_patrat_crit = 5.99), leading to acceptance of the null hypothesis of the test, which supports homoscedasticity of errors (5% significance level, p value = 0.82 > 0.05) (Table 14).
Table 14.
Auxiliary model results.
The hypothesis of non-autocorrelation of errors was tested using the Durbin Watson test, whose calculated value obtained is 1.417 (see Table 12) (critical values at 5% significance level: 1.246 and 1.344). The conclusion following the application of the test is to accept the null hypothesis that the errors are not autocorrelated.
Following the validation of the regression model and its quality assessment, Working Hypothesis 2 is verified, i.e., the governance of energy companies has a significant influence on the variation in energy company performance.
5. Discussion
The results of the study show that the working hypotheses are verified following the validation of the regression model and the assessment of its quality; thus, the governance of energy companies has a significant influence on the variation in the performance of energy companies in Romania. Thus, it is shown that the higher the corporate governance (Ig) system the higher the performance of energy companies. More specifically, energy companies that have implemented governance rules have a higher turnover than companies that have not implemented a governance system or where the corporate governance index is low.
From the analysis of the results of the study, it can be noted that, in general, companies listed on a regulated market (Bucharest Stock Exchange) obtained a maximum score of the governance index (Ig), i.e., 10 points. It is worth noting that their turnover is also among the highest of the 43 companies surveyed. Thus, two companies in the oil sector that are listed on the stock exchange stand out, with a turnover of EUR 4766 million and EUR 2455 million, respectively, in the 2021 financial year, a listed company in the field of electricity production by hydropower plants, which achieved a turnover of EUR 1280 million in the 2021 financial year, and a listed company in the field of natural gas extraction, which achieved a turnover of EUR 1157 million, and a company producing coal-based electricity, which achieved a turnover of EUR 662 million in the 2021 financial year. From the analysis of the survey results, we found that those companies for which we estimated a low governance index also have poor financial performances. Thus, the lowest turnovers were obtained by some companies that buy and sell electricity, where the governance index (Ig) is zero, and the turnover is 263,000 euros, i.e., 1.8 million euros.
The results of the study show the importance of the energy sector in a country’s economy, by contributing to the formation of gross domestic product, the formation of budget revenues, and the provision of jobs.
According to the study, the cumulative turnover of the 43 companies surveyed for the period 2012–2021 is approximately EUR 154.68 billion, of which EUR 23.9 billion is the turnover achieved in 2021. Analyzing the turnover dynamics, in the financial year 2021, there was an increase in turnover compared to the financial year 2020 for most of the energy companies surveyed, especially among the large electricity producers that recorded turnover increases of even more than 60%. This increase in turnover was due to an increase in sales prices to distributors and consumers as well as an increase in the quantity of electricity sold. In terms of natural gas production and sales, seven companies had an increase in turnover in 2021 compared to 2020 between 18% and 84%. In the period 2012–2021, the surveyed companies achieved a cumulative profit of about EUR 7.95 billion, of which EUR 1.54 billion was the cumulative profit for the surveyed companies achieved in the financial year 2021. The average cumulative turnover profitability for the 43 companies for the period 2012–2021 was 5.14%. In the financial year 2021, the average return on aggregate turnover for the 43 companies was 6.45%, and it is worth noting the return of even 47.66% obtained by one of the largest electricity producers in Romania, which has a majority state capital, which is quite attractive in the capital market.
The energy companies under study play a very important role in the macroeconomic stability of the country, providing jobs for 52,919 employees, according to the financial reports as of 31 December 2021.
After analyzing the results of the study, we found that there is a direct correlation between the governance and financial performance of energy companies. Thus, the higher the governance index the higher the financial performance of the companies. This conclusion is justified by the following aspects:
- -
- greater transparency in the appointment of board members leads to the selection of the best professionally trained people so that their decisions will also lead to increased financial performance and shareholder value of companies;
- -
- implementation of corporate governance principles regarding the separation of the control function from the executive function leads to a streamlining of the work of the members of the Management Board, the Supervisory Board, the Executive Board, and the Executive Management;
- -
- the functioning of the Nomination Committee and the Remuneration Committee contributes to increasing transparency regarding the appointment and remuneration of the members of the governing bodies, the basic principle being that the payment of directors’ fees should be in line with the financial performance of the companies;
- -
- the establishment of specialized committees, such as the audit committee, helps to streamline corporate decision-making by facilitating communication between those responsible for corporate governance and the external auditor;
- -
- implementing a risk management system makes companies more efficient when control is strengthened by appointing internal auditors;
- -
- the appointment of statutory auditors, together with increased transparency on financial reporting, increases the confidence of current and potential investors in the financial results reported by companies, helping to attract new capital;
- -
- greater transparency of company decisions leads to greater respect for shareholders’ rights, such as the right to be informed, the right to vote, the right to be elected, the right to receive dividends.
All the corporate governance principles mentioned above contribute to making companies more efficient, maximizing profits, and maximizing dividends for shareholders.
We believe that the results of the study may be important for the following reasons: firstly, the national, European, and even international energy market is in a difficult period due to the regional geopolitical situation in Ukraine. Thus, even before the beginning of the conflict, the price of gas and electricity rose, which subsequently increased in Romania, leading to a sharp rise in inflation. Another reason why this study may be important is that the sample selected includes the most important energy companies. Thus, at the political level, there are discussions on the sale of shares in the most important hydropower producer, in which the Romanian state holds most shares. The most important companies in the fields of oil extraction and processing, gas extraction, transmission and distribution, and electricity distribution were also included in the study.
6. Conclusions
The implementation of corporate governance is optional in Romania. Our results could have positive implications for the business environment, as increased performance through the application of corporate governance is an incentive for the implementation of corporate governance. Corporate governance is a key element in improving economic efficiency and growth as well as increasing investor confidence. It provides the framework/context through which the company’s objectives are set and the means to achieve these objectives.
The limitation of the study undertaken is the unavailability of the necessary data for some companies.
The estimated governance index of these companies (Ig) can be used in future studies to determine strengths and weaknesses and to improve the governance systems of the companies covered in this study.
Further research may consider other factors in the construction of the corporate governance index, such as the presence of women on the board of directors, age of directors, directors’ education, etc.
Author Contributions
Conceptualization, A.D.B. and C.E.B.; methodology, A.D.B. and C.E.B.; software, A.D.B. and C.E.B.; validation, A.D.B. and C.E.B.; data analysis, A.D.B. and C.E.B.; writing—original draft preparation, A.D.B.; writing—review and editing, C.E.B.; funding acquisition, C.E.B. All authors have read and agreed to the published version of the manuscript.
Funding
The A.P.C was funded by the University Politehnica of Bucharest through its PubArt program.
Data Availability Statement
The data presented in this study are available on request from the corresponding author.
Conflicts of Interest
The authors declare no conflict of interest. The funders had no role in the design of the study; in the collection, analyses, or interpretation of data; in the writing of the manuscript; or in the decision to publish the results.
References
- OECD Principles of Corporate Governance. 1999. Available online: www.oecd.org (accessed on 15 March 2023).
- International Standards on Auditing and Code of Ethics. International Federation of Accountants. 2009. Available online: www.ifac.org (accessed on 15 March 2023).
- Bigioi, A.D. Teoria Generala a Guvernantei Corporative; Editura ASE: Bucharest, Romania, 2015. [Google Scholar]
- Bigioi, A.D. Transparenta Raportarii Financiare, Normele si Profesia Contabila—In Sprijinul Guvernantei Corporative. Ph.D. Thesis, The Bucharest University of Economic Studies, Bucharest, Romania, 2012. [Google Scholar]
- Feleaga, L.; Feleaga, N. Contabilitate Financiara: O Abordare Europeana si Internationala; Editura Economica: Bucharest, Romania, 200; Volume 1, pp. 149–168.
- BNR Forcasts. Available online: https://www.bnr.ro/Proiectii-BNR-4351-Mobile.aspx (accessed on 27 April 2023).
- Electricity & Gas Hit Record Prices in 2022. Available online: https://ec.europa.eu/eurostat/web/products-eurostat-news/w/DDN-20230426-2 (accessed on 27 April 2023).
- Kubiczek, J.; Derej, W. Financial performance of businesses in the COVID-19 pandemic conditions—Comparative study. Polish J. Manag. Stud. 2021, 24, 183–201. [Google Scholar] [CrossRef]
- Jebran, K.; Chen, S.H. Can we learn lessons from the past? COVID-19 crisis and corporate governance responses. Int. J. Financ. Econ. 2023, 28, 421–429. [Google Scholar] [CrossRef]
- Khatib, S.F.A.; Nour, A. The impact of Corporate Governance on firm performance during the COVID-19 pandemic: Evidence from Malaysia. J. Asian Financ. Econ. Bus. 2021, 8, 943–952. [Google Scholar]
- Hindasah, L.; Akmalia, A. Can Corporate Governance protect firm performance during the COVID-19 pandemic? Qual. Access Success 2023, 24, 174–182. [Google Scholar]
- Dang, V.C.; Nguyen, Q.K. Internal corporate governance and stock price cash risk: Evidence from Vietnam. J. Sustain. Financ. Investig. 2021, 1–18. [Google Scholar] [CrossRef]
- Almustafa, H.; Nguyen, Q.K. The impact of COVID-19 on firm risk and performance in MENA countries: Does national governance quality matter? PLoS ONE 2023, 18, e0281148. [Google Scholar] [CrossRef]
- Wieczorek-Kosmala, M.; Henschel, T. The role of ERM and corporate governance in managing COVID-19 impacts: SMEs perspective. J. Risk Financ. Manag. 2022, 15, 587. [Google Scholar] [CrossRef]
- Rhode, D.; Packel, A.K. Diversity on corporate boards: How much difference does difference make? Del. J. Corp. Law 2014, 39, 377–426. [Google Scholar] [CrossRef]
- Sarhan, A.A.; Ntim, C.G.; Al-Najjar, B. Board diversity, corporate governance, corporate performance, and executive pay. Int. J. Financ. Econ. 2019, 24, 761–786. [Google Scholar] [CrossRef]
- Al-rahahleh, A.S. Corporate governance quality, board gender diversity and corporate dividend policy: Evidence from Jordan. Australas. Account. Bus. Financ. J. 2017, 11, 86–104. [Google Scholar] [CrossRef]
- Dionne, G.; Triki, T. Risk management and corporate governance: The importance of independence and financial knowledge for the Board and the Audit Committee. Risk Manag. Insur. Rev. 2019, 22, 247–277. [Google Scholar] [CrossRef]
- Melon-Izco, A.; Ruiz-Cabestre, F.J.; Ruiz-olalla, C. Determinants of good governance practices: The role of board independence. Span. J. Financ. Account.-Rev. Esp. Financ. Contab. 2020, 49, 370–393. [Google Scholar] [CrossRef]
- Karim, S.; Manab, N.A. Assessing the Governance Mechanism, Corporate Social Responsibility and Performance: The moderating effect of Board Independence. Glob. Bus. Rev. 2020, 0972150920917773. [Google Scholar] [CrossRef]
- Dos Santos, J.M.P. Financial knowledge for corporate boards: What should board members know? Indep. J. Manag. Prod. 2021, 12, 265–281. [Google Scholar] [CrossRef]
- Filipovic, M. Research on the relationship between governance structures and external audit in Corporate Governance. Ekon. Pregl. 2021, 72, 522–549. [Google Scholar]
- Serra, S.; Lemos, K. The influence of corporate governance and audit in risk discosure. Rev. Evid. Contab. Financ. 2020, 8, 106–124. [Google Scholar] [CrossRef]
- Cho, C.C.; Wu, C.H. Role of auditor in agency conflict and corporate governance. Empirical analyses of Taiwanese firms. Chin. Manag. Stud. 2014, 8, 333–353. [Google Scholar] [CrossRef]
- Chen, G.; Firth, M.; Gao, N.D.; Rui, O.M. Do ownership Structure and Governance Mechanism Have an Effect on Corporate Fraud in China’s Listed Firms? 2005. Available online: https://papers.ssrn.com/sol3/papers.cfm?abstract_id=728945 (accessed on 10 April 2023).
- Lappalainen, J.; Niskanen, M. Financial Performance of SMEs-Evidence on the Impact of Ownership Structure and Board Composition. 2009. Available online: https://papers.ssrn.com/sol3/papers.cfm?abstract_id=1500853 (accessed on 10 April 2023).
- Castaner, X.; Goranova, M.; Hermes, N. Ownership and corporate governance across institutional contexts. Corp. Gov. Int. Rev. 2022, 30, 638–655. [Google Scholar] [CrossRef]
- Batra, S.; Saini, M.; Yadav, M. Mapping the intellectual structure of corporate governance and ownership structure: A bibliometric analysis. Int. J. Law Manag. 2023, 65, 333–353. [Google Scholar] [CrossRef]
- Lu, L.W. The moderating effect of corporate governance on the relationship between corporate sustainability performance and corporate financial performance. Int. J. Discl. Gov. 2021, 18, 193–206. [Google Scholar] [CrossRef]
- Nguyen, N.P.A.; Dao, T.T.B. Liquidity, corporate governance performance: A meta-analysis. Cogent Bus. Manag. 2022, 9, 2137960. [Google Scholar] [CrossRef]
- Neralla, N.G. Can corporate governance structure effect on corporate performance: An empirical investigation from Indian companies. Int. J. Discl. Gov. 2022, 19, 282–300. [Google Scholar] [CrossRef]
- Hapsari, D.W.; Yadiati, W.; Suharman, H.; Rosdini, D. The mediating impact of value chain in the link between corporate governance and SOEs performance. Australas. Account. Bus. Financ. J. 2023, 17, 75–85. [Google Scholar] [CrossRef]
- Hermanto, Y.B.; Lusy, L.; Widyastuti, M. How financial performance and state-owned enterprise (SOE) values are affected by Good Corporate Governance and intellectual capital perspective. Economies 2021, 9, 134. [Google Scholar] [CrossRef]
- Abang’a, A.O.; Tauringana, V.; Wang’ombe, D.; Achiro, L.O. Corporate governance and financial performance of state-owned enterprises in Kenya. Corp. Gov. Int. J. Bus. Soc. 2022, 22, 798–820. [Google Scholar] [CrossRef]
- Csedo, Z.; Magyari, J.; Zavarko, M. Dynamic Corporate Governance, Innovation, and Sustainability: Post-COVID Period. Sustainability 2022, 14, 3189. [Google Scholar] [CrossRef]
- Alrazi, B.; Husin, N.M. Institutional Governance Framework for Determining Carbon-related Accounting Practices: An Exploratory Study of Electricity Generating Companies in Malaysia. In Proceedings of the IOP Conference Series: Earth and Environmental Science, Kuala Lumpur, Malaysia, 23–25 February 2016. [Google Scholar]
- Milojevic, M.; Urbanski, M.; Terzic, I.; Prasolov, V. Impact of Non-Financial Factors on the Effectiveness of Audits in Energy Companies. Energies 2020, 13, 6212. [Google Scholar] [CrossRef]
- Fakoya, M.B.; Nakeng, M.V. Board characteristics and sustainable energy performance of selected companies in South Africa. Sustain. Prod. Consum. 2019, 18, 190–199. [Google Scholar] [CrossRef]
- Zhang, D.Y.; Zhang, Z.W.; Ji, Q.; Lucey, B.; Liu, J. Board characteristics, external governance and the use of renewable energy: International evidence. J. Int. Financ. Mark. Inst. Money 2021, 7, 101317. [Google Scholar] [CrossRef]
- Alhawaj, A.; Buallay, A.; Abdallah, W. Sustainability reporting and energy sectorial performance: Developed and emerging economies. Int. J. Energy Sect. Manag. 2022, 17, 739–760. [Google Scholar] [CrossRef]
- Liu, P.D.; Zhu, B.Y.; Yang, M.Y.; Chu, X. ESG and financial performance: A qualitative comparative analysis in China’s new energy companies. J. Clean. Prod. 2022, 379, 134721. [Google Scholar] [CrossRef]
- Hurduzeu, G.; Noja, G.G.; Cristea, M.; Dracea, R.M.; Filip, R.I. Revisiting the impact of ESG practices on firm financial performance in the energy sector: New empirical evidence. Econ. Comput. Econ. Cybern. Stud. Res. 2022, 56, 37–53. [Google Scholar]
- Zheng, S.N.; He, C.H.; Hsu, S.C.; Sarkis, J.; Chen, J.H. Corporate environmental performance prediction in China: An empirical study of energy service companies. J. Clean. Prod. 2020, 266, 121395. [Google Scholar] [CrossRef]
- Robaina, M.; Madaleno, M. The relationship between emissions reduction and financial performance: Are Portuguese companies in a sustainable development path? Corp. Soc. Responsib. Environ. Manag. 2020, 27, 1876. [Google Scholar] [CrossRef]
- Szczepankiewicz, E.I.; Blazynska, J.; Zaleska, B.; Ullah, F.; Loopesko, W.E. Compliance with Corporate Governance Principles by Energy Companies Compared with All Companies Listed on the Warsaw Stock Exchange. Energies 2022, 15, 6481. [Google Scholar] [CrossRef]
- Wahyuningrum, I.F.S.; Budihardjo, M.A. Relationship between Company Financial Performance, Characteristic and Environmental Disclosure of ASX Listed Companies. In Proceedings of the 3rd International Conference on Energy, Environmental and Information System (ICENIS 2018), Semarang, Indonesia, 14–15 August 2018; Volume 73, p. 10024. [Google Scholar]
- Georgakopoulos, G.; Toudas, K.; Poutos, E.I.; Kounadeas, T.; Tsavalias, S. Capital Structure, Corporate Governance, Equity Ownership and Their Impact on Firms’ -Profitability and Effectiveness in the Energy Sector. Energies 2022, 15, 3625. [Google Scholar] [CrossRef]
- Aljaaidi, K.S. Economic value of energy and petrochemical companies and multiple directorships: Evidence from Saudi Arabia. AD-Minist. 2022, 41, 149–166. [Google Scholar] [CrossRef]
- Gong, X.; Lin, A.L.; Chen, X.Q. CEO-CFO gender congruence and stock price crash risk in energy companies. Econ. Anal. Policy 2022, 75, 591–609. [Google Scholar] [CrossRef]
- Ma, Z.; Shu, G.; Wang, Q.; Wang, L.F. Sustainable Governance and Green Innovation: A Perspective from Gender Diversity in China’s Listed Companies. Sustainability 2022, 14, 6403. [Google Scholar] [CrossRef]
- Bashindzhagyan, A.; Kharchilava, K.; Belyayeva, I. Influence of Corporate Governance on Financial Performance Of Russian State-Owned Companies. In Proceedings of the Global Challenges and Prospects of the Modern Economic Development, Samara, Russia, 6–8 December 2018. [Google Scholar]
- Grabinska, B.; Kedzior, M.; Kedzior, D.; Grabinski, K. The Impact of Corporate Governance on the Capital Structure of Companies from the Energy Industry. The Case of Poland. Energies 2021, 14, 7412. [Google Scholar] [CrossRef]
- Shaikh, I. Environmental, social and governance (ESG) practice and firm performance: An international evidence. J. Bus. Econ. Manag. 2022, 23, 218–237. [Google Scholar] [CrossRef]
- Constantinescu, D.; Mititean, P. Association of ESG factors’ disclosure with the value of European companies from energy industry. In Proceedings of the 8th International Scientific Conference IFRS: Global rules and local use-beyond the numbers, Prague, Czech Republic, 8–9 October 2020. [Google Scholar]
- Malanski, L.K. Vertical integration and corporate governance over electricity sector companies’profitability. Rev. Gest. E Secr. GESEC 2022, 13, 1711–1729. [Google Scholar] [CrossRef]
- Paun, D. Sustainability and Financial Performance of Companies in the Energy Sector in Romania. Sustainability 2017, 9, 1722. [Google Scholar] [CrossRef]
- Matei, F.B.; Boboc, C.; Ghita, S. The relationship between corporate social responsibility and financial performance in Romanian companies. Econ. Comput. Econ. Cybern. Stud. Res. 2021, 55, 297–314. [Google Scholar]
- Bigioi, A.D.; Bigioi, C.E. Study on corporate governance at Romanian banking institutions. Manag. Strateg. J. 2018, 41, 90–97. [Google Scholar]
- Bigioi, A.D.; Bigioi, C.E. Harmonization of national rules with the new international recommendations on corporate governance. Case study from insurance company in Romania. Manag. Strateg. J. 2017, 34, 105–113. [Google Scholar]
- Arora, A.; Bodhanwala, S. Relationship between corporate governance index and firm performance: Indian evidence. Glob. Bus. Rev. 2017, 19, 675–689. [Google Scholar] [CrossRef]
- Korent, D.; Dundek, I.; Calopa, M.K. Corporate governance practices and firm performance measured by Croatian Corporate Governance Index (CCGI®). Econ. Res. Ekon. Istraz. 2014, 27, 221–231. [Google Scholar] [CrossRef]
- Ling, L.; Jong, L.; Law, W.; Chieng, F. Family director board governance index: An analysis of family directors and firm performance in Malaysia. J. Gen. Manag. 2023. [Google Scholar] [CrossRef]
- Shaukat, A.; Trojanowski, G. Board governance and corporate performance. J. Bus. Financ. Account. 2018, 45, 184–208. [Google Scholar] [CrossRef]
- Al-ahdal, W.M.; Alsamhi, M.H.; Tabash, M.I.; Farhan, N.H. The impact of corporate governcane on financial performance of Indian and GCC listed firms: An empirical investigation. Res. Int. Bus. Financ. 2020, 51, 101083. [Google Scholar] [CrossRef]
- Dos Santos Sant’Ana, N.L.; Pires Sant’Ana, P.C. Corporate governance index and its relationship to market value. Rev. Gest. Tecnol. 2021, 21, 49–75. [Google Scholar]
- Dos Santos, T.A.; de Souza, A.A.; Pessanha, G.R.G. Corporate governance index for companies in the Brasilian stock market. Rev. Gest. Financ. Contab. 2019, 9, 72–92. [Google Scholar]
- Mansour, M.; Hashim, H.A.; Salleh, Z.; Al-ahdal, W.M.; Almaqtari, F.A.; Qamhan, M.A. Governance practices and corporate performance: Assessing the competence of principal-based guidelines. Cogent Bus. Manag. 2022, 9, 2105570. [Google Scholar] [CrossRef]
- Information about Legal Persons. Romanian Ministry of Finance. Available online: www.mfinante.gov.ro (accessed on 10 April 2023).
Disclaimer/Publisher’s Note: The statements, opinions and data contained in all publications are solely those of the individual author(s) and contributor(s) and not of MDPI and/or the editor(s). MDPI and/or the editor(s) disclaim responsibility for any injury to people or property resulting from any ideas, methods, instructions or products referred to in the content. |
© 2023 by the authors. Licensee MDPI, Basel, Switzerland. This article is an open access article distributed under the terms and conditions of the Creative Commons Attribution (CC BY) license (https://creativecommons.org/licenses/by/4.0/).