Article

Numerical Study of Flow and Heat Transfer Characteristics in a Simplified Dual Fluid Reactor

1
Narodowe Centrum Badań Jądrowych, ul. Andrzeja Sołtana 7, 05-400 Otwock, Poland
2
Institut fur Festkörper-Kernphysik gGmbH, Leistikowstr. 2, 14050 Berlin, Germany
3
Instytut Fizyki, Uniwersytet Szczecinski, ul. Wielkopolska 15, 70-451 Szczecin, Poland
*
Author to whom correspondence should be addressed.
Energies 2023, 16(13), 4989; https://doi.org/10.3390/en16134989
Submission received: 26 May 2023 / Revised: 21 June 2023 / Accepted: 25 June 2023 / Published: 27 June 2023
(This article belongs to the Topic Computational Fluid Dynamics (CFD) and Its Applications)

Abstract

:
This study presents the design and computational fluid dynamics (CFD) analysis of a mini demonstrator for a dual fluid reactor (DFR). The DFR is a novel concept currently under investigation. The DFR is characterized by the implementation of two distinct liquid loops dedicated to fuel and coolant. It integrates the principles of molten salt reactors and liquid metal cooled reactors; thus, it operates in a high temperature and fast neutron spectrum, presenting a distinct approach in the field of advanced nuclear reactor design. The mini demonstrator serves as a scaled-down version of the actual reactor, primarily aimed at gaining insights into the CFD analysis intricacies of the reactor while minimizing computational costs. The CFD modeling of the MD intends to add valuable data for the purpose of modeling validation against experiments to be conducted on the MD. These experiments can be used for DFR licensing and design optimization. The coolant and fuel utilized in the mini demonstrator are of low Prandtl number (Pr = 0.01) liquid lead, operating at two distinct inlet temperatures, namely 873 K and 1473 K. The study showed a rapid increase in turbulence due to intense mixing and abrupt changes in flow areas and directions, despite the relatively low inlet velocities. Hot spots characterized by elevated temperatures were identified, analyzed, and justified based on their spatial distribution and flow conditions. Flow swirling within pipes was identified and a remedy approach was suggested. Inconsistent mass flow rates were observed among the fuel pipes, with higher rates observed in the lateral pipes. Although lower fuel temperatures were observed in the lateral pipes, they consistently exhibited higher heat exchange characteristics. The study concludes by giving physical insights into the heat transfer and flow behavior, and proposing design considerations for the dual fluid reactor to enhance structural safety and durability, based on the preliminary analysis conducted.

1. Introduction

The future power grid is anticipated to incorporate a new generation of nuclear power plants that possess inherent safety features, environmentally sustainable operations, and cost-effective production of electricity, processing heat, and hydrogen. Recently, there has been a notable surge in the interest surrounding the development of nuclear reactors utilizing liquid fuels.
Several concept designs within the realm of GenIV reactors draw upon various forms of molten salt reactors (MSR) technology [1,2]. This utilization offers notable advantages, such as circumventing issues related to fuel poisoning and damage typically encountered in solid-state fuel systems during power plant operations.
Incorporating a fast neutron spectrum offers several advantageous outcomes, including the elimination of long-lived waste, improved safety characteristics, and enhanced utilization of nuclear fuel resources. The presence of strongly negative temperature coefficients, primarily driven by fuel thermal expansion, enables the reactor to self-regulate in response to external power demands [3]. This capability allows for an appropriate reduction (or increase) in energy production to align with sudden surges (or declines) in power generated from renewable energy sources [4].
The dual fluid reactor (DFR) [5,6,7] possesses distinct advantages over traditional molten salt reactors (MSRs). Unlike a conventional MSR, where the molten salt serves as both the fuel and coolant, the DFR enables independent adjustment of the flow velocities for the fuel and coolant. This capability provides notable enhancements in terms of reactor economics and safety features to be added to its high energy returned over investment EROI [8]. In addition, the utilization of DFR technology enables the implementation of online recycling and the establishment of a closed fuel cycle through the integration of a pyrochemical processing unit (PPU) [9]. Moreover, DFR operating at temperatures exceeding 1200 K presents the opportunity for hydrogen production as an additional benefit to the electric power generation [10].
On the other hand, the use of a liquid fuel also leads to additional challenges in reactor design resulting from thermal hydraulics (i.e., modeling of heat transfer and flow characteristics [11]) and neutronics of circulating liquid fuel resulting in moving precursors [3]. These analyses require taking different operational scenarios into consideration, for example starting up, shutting down, and accidents scenarios [12]. Thus, a coupling of both effects in transient calculations of reactors are necessary [13], and a precise simulation of the fuel flow plays a crucial role. Additionally, for DFR construction as a new concept, experiments and modeling validation are essential for both the design and licensing procedures as recommended by the IAEA [14].
In a small modular DFR operating at an average temperature of 1000 °C, the heat exchange between the fuel and coolant transpires within the reactor core. The reactor core comprises numerous SiC ceramic pipes with small diameters, through which liquid uranium eutectics (U + Cr) flow. These pipes are enveloped by liquid lead, maintained at a lower temperature, thereby facilitating the heat transfer process [15,16].
This kind of design leads to complex thermal and hydraulic phenomena that determine the safety of the reactor both in normal operation and transition scenarios. Utilizing liquid metals results in very low Prandtl numbers of the flow. Thus, they should be tested experimentally and described numerically using validated computer codes. The first step in this way would be the construction of a non-critical mini demonstrator possessing all the main features of the real reactor. The uniqueness of this design lies in the exceptionally high operating temperature and the ability to study heat transfer between two separated liquids.
In this article, we present a comprehensive framework based on the principles of the dual fluid reactor, which incorporates distinct fuel and coolant loops. Our study focuses on investigating heat transfer phenomena between these loops at varying temperatures and flow velocities. Utilizing computational fluid dynamics, we aim to identify critical design aspects and determine temperature and velocity distributions within the flows. These findings are crucial as they will inform the ongoing design phase of the DFR, including safety analyses. Moreover, the results will be compared against experimental measurements from an upcoming experimental facility, enabling validation of the model employed in this study and exploration of potential refinements to enhance the accuracy of modeling the DFR, taking into account its geometric and operational parameters.
This study focuses on the CFD analysis of the MD core with the given DFR pipes dimensions and main thermal hydraulic parameters. The detailed mechanical workshop and design drawings for elements, connections, measuring devices, and components of the MD loops are beyond this study and shall be introduced in future work. The CFD modeling of the low Prandtl number fluids might require different models and techniques as the current models were not designed for this type of fluid with a smaller thermal boundary layer compared to the velocity boundary layer. This is because liquid metals typically have higher thermal conductivity and lower viscosity, which allows for efficient heat transfer and reduced resistance to fluid motion. Different attempts for establishing such a model are still developing [17]. Two widely employed turbulence models in the field are the various versions of the k-ω SST model and the k-ε model. These models are commonly utilized to simulate flows of this nature, particularly in the context of the dual fluid reactor (DFR). Some other more complicated models adopted an additional transport equation, but these models are more suited to flow cases where a high Richardson number (Ri) is found; thus, the buoyancy forces and natural convection have a large role in the flow behavior [18]. Notably, both models have demonstrated comparable results when applied to the DFR case [16].
In this preliminary analysis study, the k-ω SST model was selected for two primary reasons. Firstly, this model has exhibited the highest possible accuracy comparable to the widely used k-ε model, thereby ensuring reliable results. Secondly, the k-ω SST model holds potential for future enhancements, warranting a comparison between the outcomes of the two modeling approaches. The standard form of the k-ω SST model incorporates a constant turbulent Prandtl number (Prt), typically set below unity (e.g., 0.85). In forthcoming research, investigating the utilization of a variable Prandtl number governed by an appropriate correlation is of interest. The present paper will serve as a valuable reference for facilitating this comparison and its potential implications [19]. The enhancement of the heat transfer is crucial to the safety of the facility; this includes DFR and MD. This enhancement basically takes place in nuclear facilities using optimization of heat exchangers. In different applications, this type of optimization may be modeled using different techniques as genetic algorithm [20]. In the case of carbon nanotubes, other methods were developed for this reason [21].
Various numerical schemes have been developed to tackle the challenges associated with solving problems involving low Prandtl number fluids. Recent advancements have introduced new schemes that exhibit faster convergence rates and reduced computation times during simulations. These innovative schemes offer promising solutions for effectively and efficiently handling low Prandtl number fluid simulations [22,23]. Given that the current study focuses on modeling rather than simulation, the computation time did not pose a significant challenge. Therefore, the default code method for numerical discretization was employed in this analysis.

2. Materials and Methods

2.1. Description of Test Case

The mini demonstrator (MD) analyzed in this work consists of two pipe loops and a vessel (core) with several measuring and control devices, arranged in a specific order to acquire a required role Figure 1. The MD has been developed as a simplified demonstrator to explore the thermal hydraulics of the dual fluid reactor (DFR) [5]. Its primary purpose is to investigate the behavior of flows and the heat transfer process from the fuel to the coolant regions. The metallic variant of the DFR comprises two distinct loops: the fuel loop, which involves the uranium–chromium eutectic, and the coolant loop, which utilizes molten lead.
In present work, the MD is designed using two molten lead loops, without using the U–Cr eutectic, due to the ease of molten lead providence compared to the radioactive U–Cr in the research facility. The MD is equipped with various measuring and control devices. These components are meticulously arranged to fulfill specific functions within the system. Two magneto-hydraulic pumps (MHD) [24,25] are employed to facilitate the circulation of flows within the two loops. This type of pump is a commonly used type in lead and sodium cooled fast reactors [26,27] and molten salt reactors [28,29]. Each loop features a dedicated storage tank, which is equipped with internal heaters, as illustrated in the schematic diagram Figure 1. Both tanks serve as sources of lead and can also function as storage units during shutdown or emergency situations.
Several valves, melting fuses, and a bypass passage are also implemented within the two loops to cope with different operation scenarios, for instance, in the event of fuel overheating, a melting fuse mechanism is incorporated. These fuses ensure that, if overheated, the entire quantity of fuel within the core is allowed to exit and descend into the storage tank under the influence of gravity. While the MD offers a diverse range of research possibilities, such as magneto-hydraulic pumps, corrosion, and material studies, the current research work is specifically dedicated to conducting preliminary thermal hydraulic analysis solely on the MD core. The investigation deliberately omits the study of other components within the cycle to maintain a focused approach.
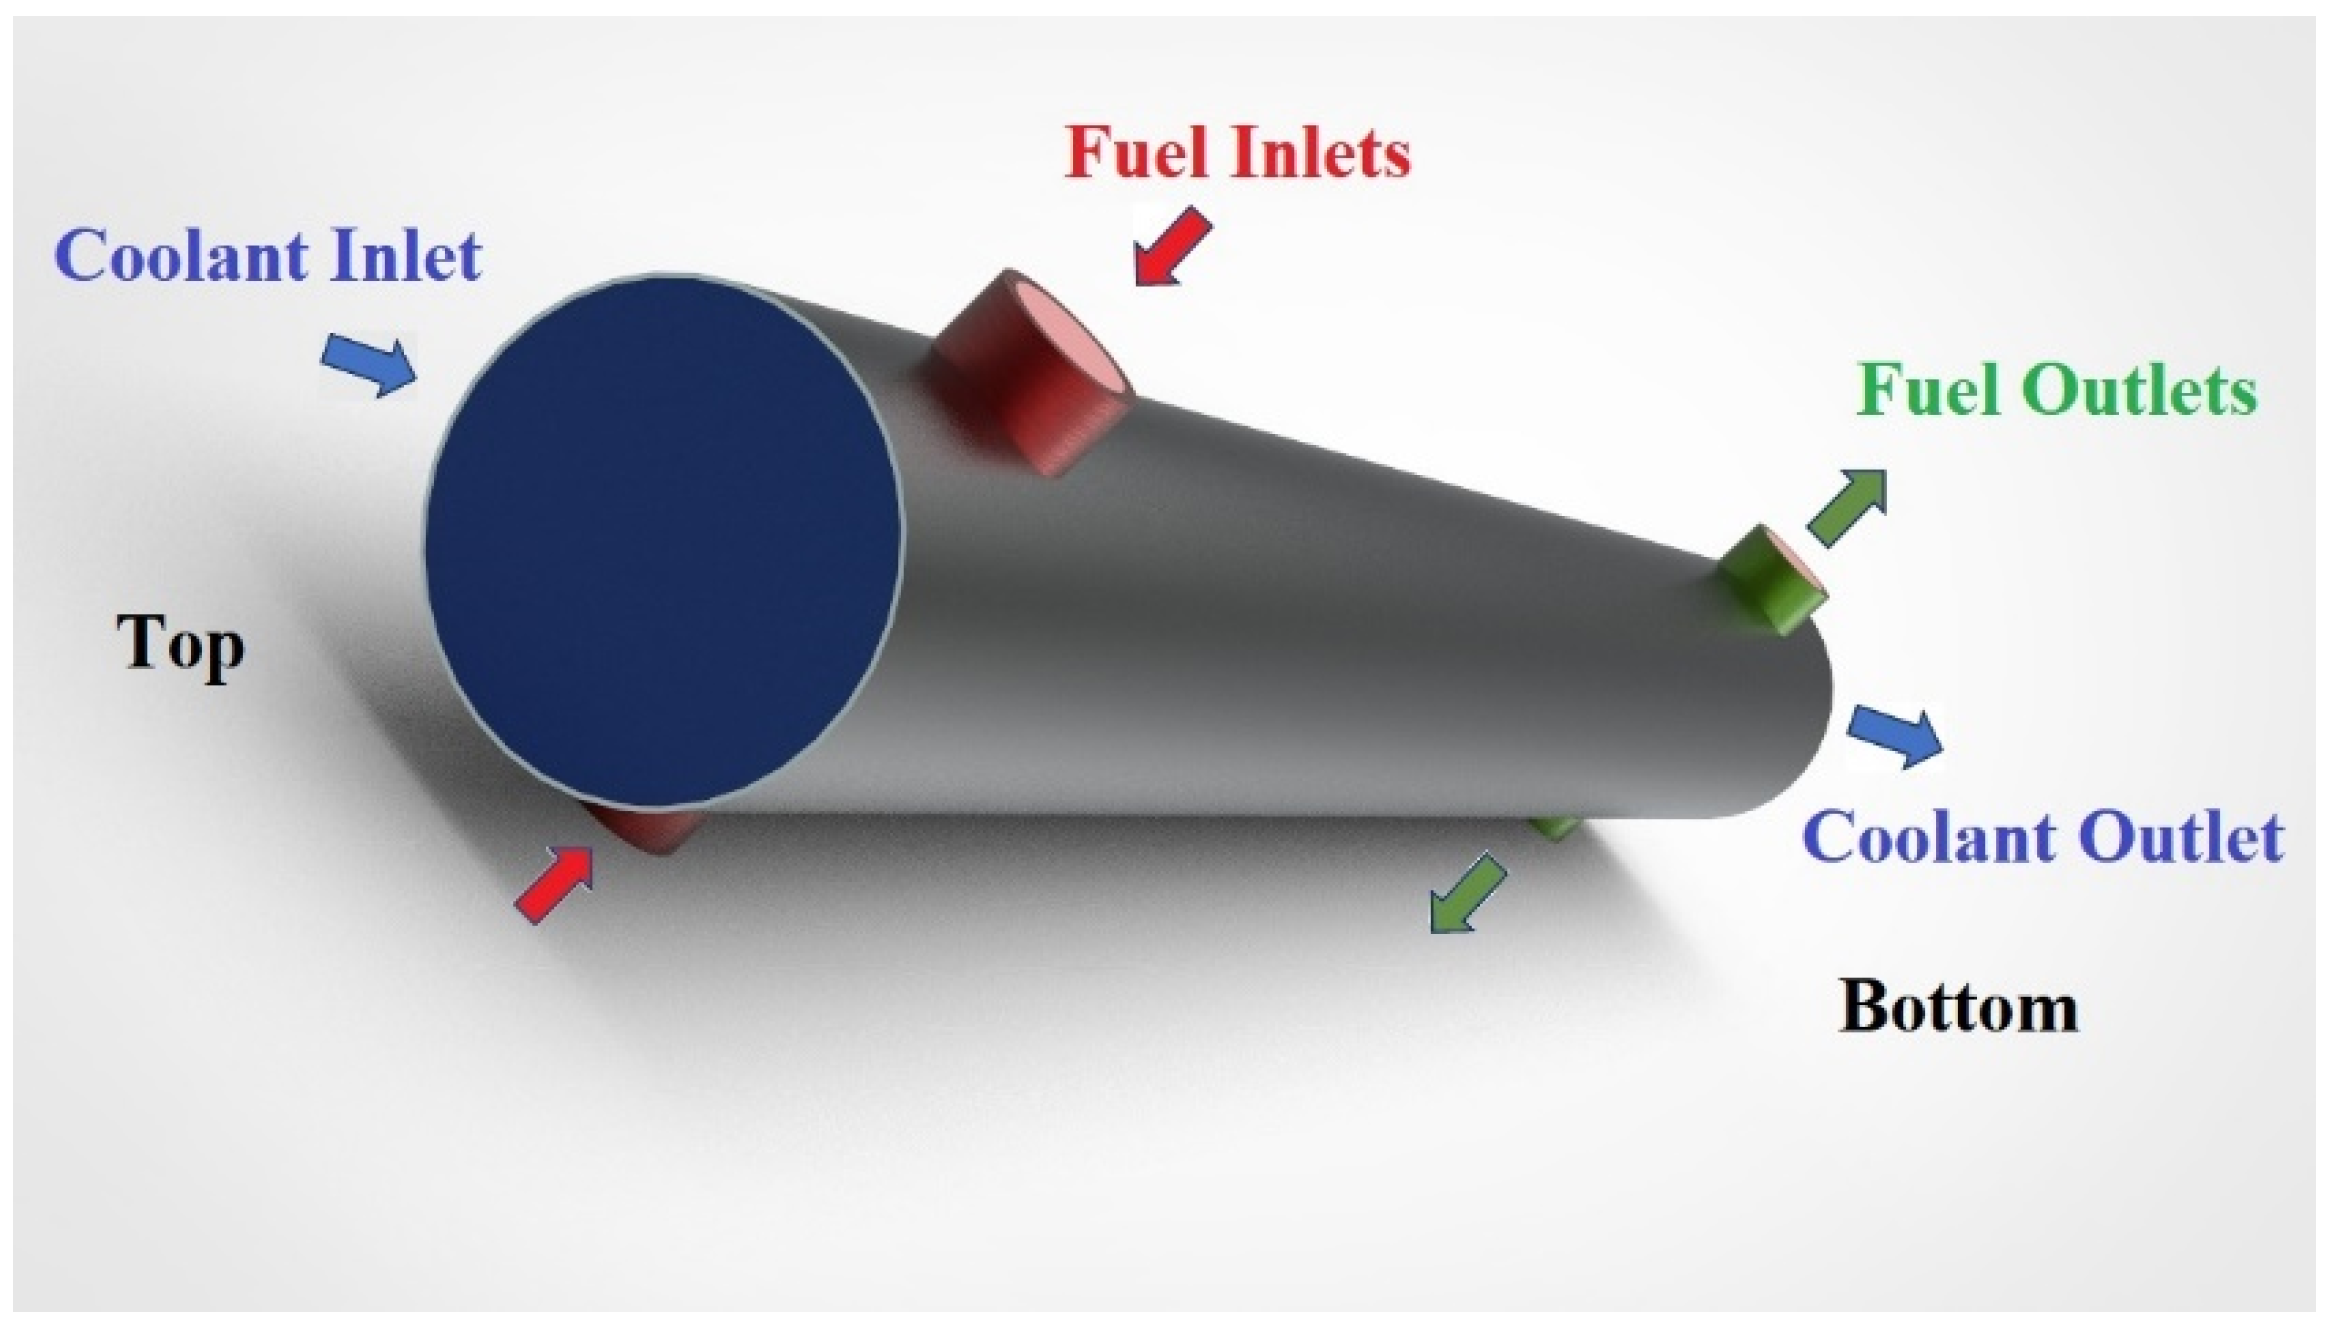
The two loops in the MD are separated without mixing at any point in the two cycles, similarly, in the actual DFR. The MD configuration includes two fuel inlets, two fuel outlets, one coolant inlet, and one coolant outlet (Figure 2).
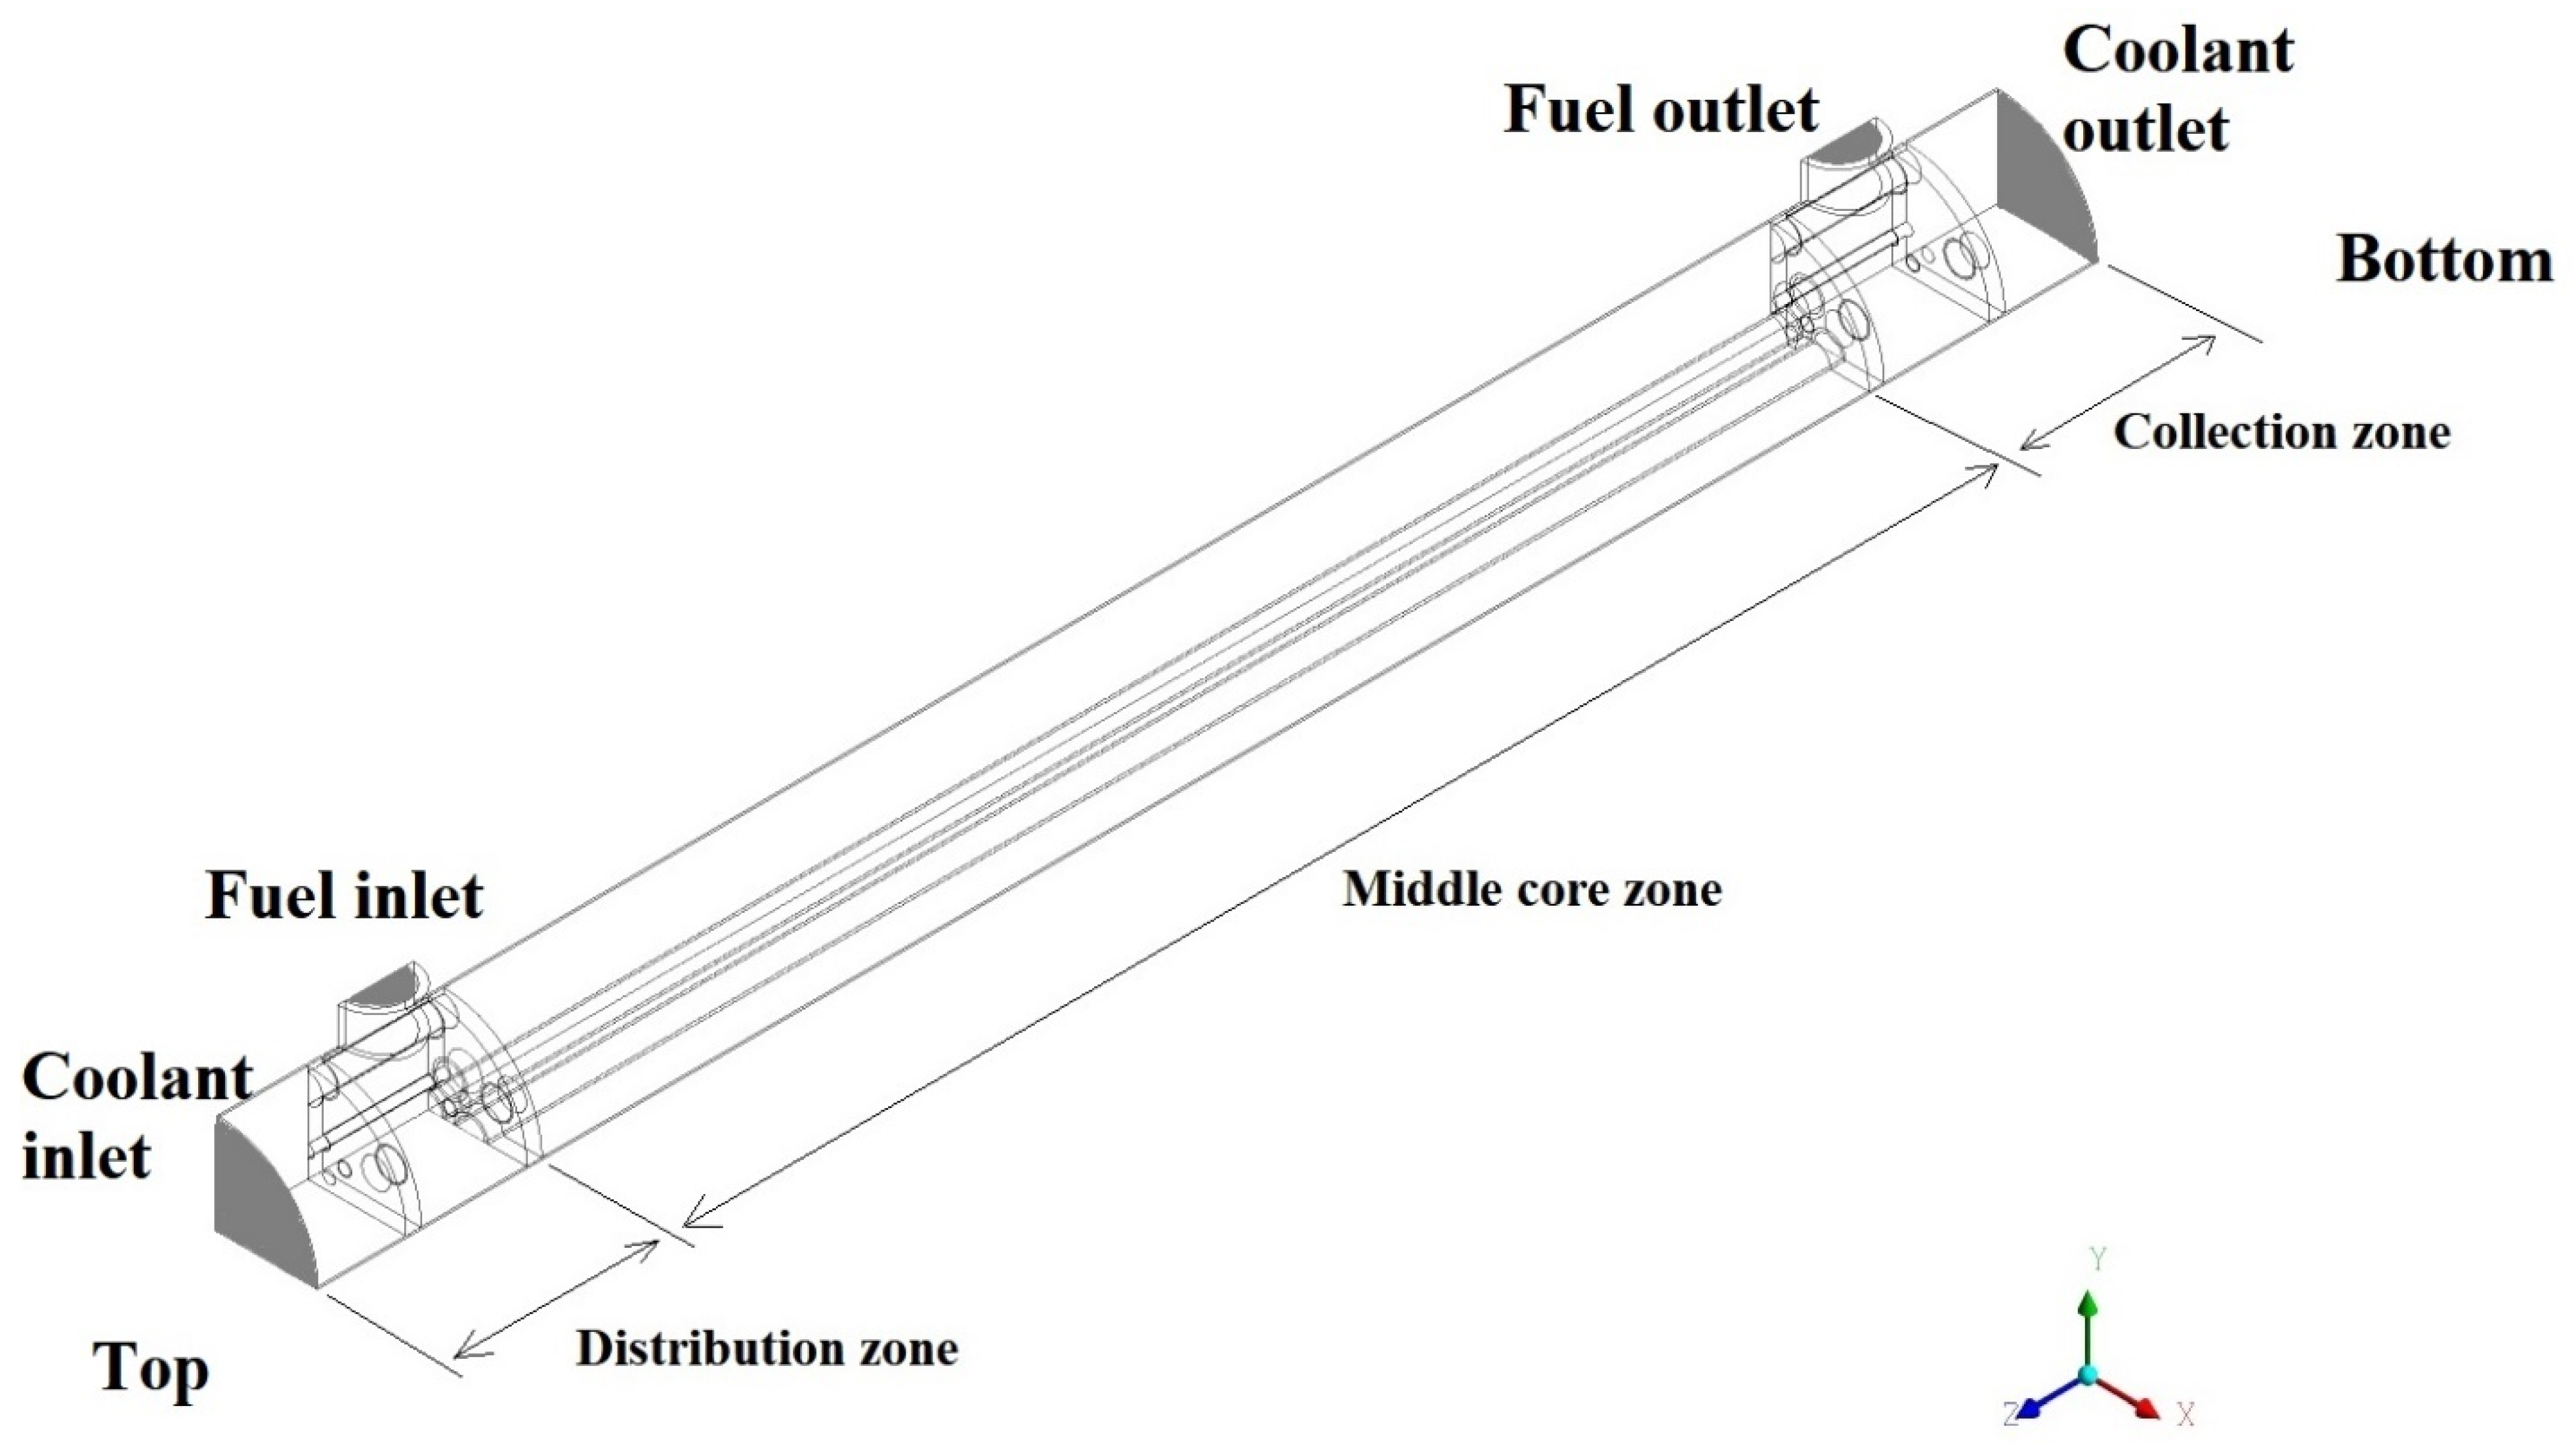
The MD core has three main zones:
  • Distribution zone: This is the zone between the fuel/coolant inlets and the middle core inlets. In this zone, the fuel and coolant enter the MD (from the top), where fuel surrounds the coolant pipes.
  • The middle core zone: In this zone, the fuel pipes are surrounded by coolant. The middle core zone is the largest section in the MD, and this is the zone where the major amount of heat transfer is expected to take place.
  • The collection zone: This zone lies between the middle core zone outlets and the outlets of the MD in an identical structure to that of distribution zone (bottom).
In Figure 3, the three zones of the MD core are illustrated.
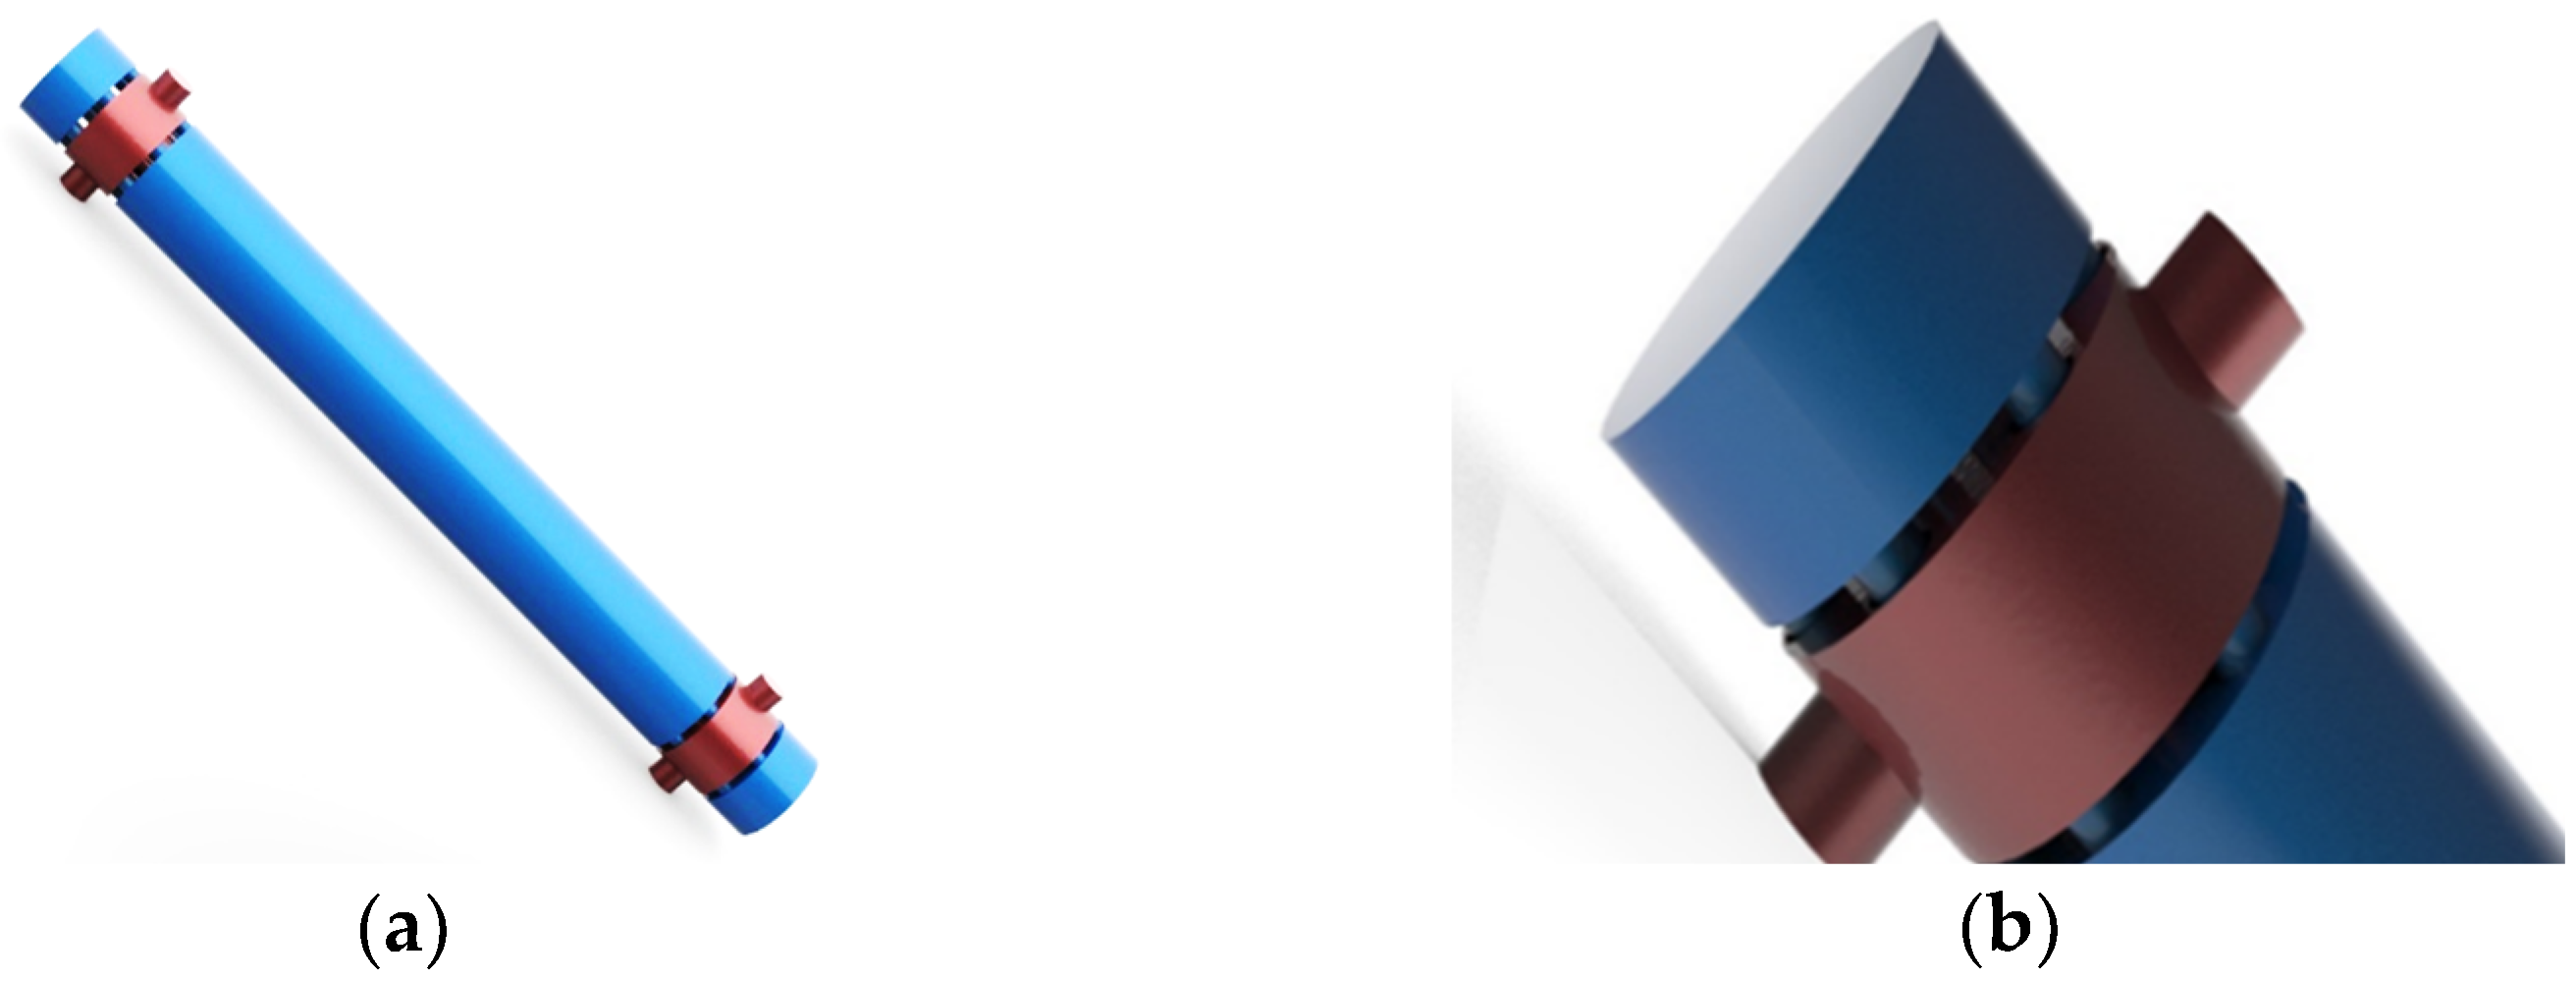
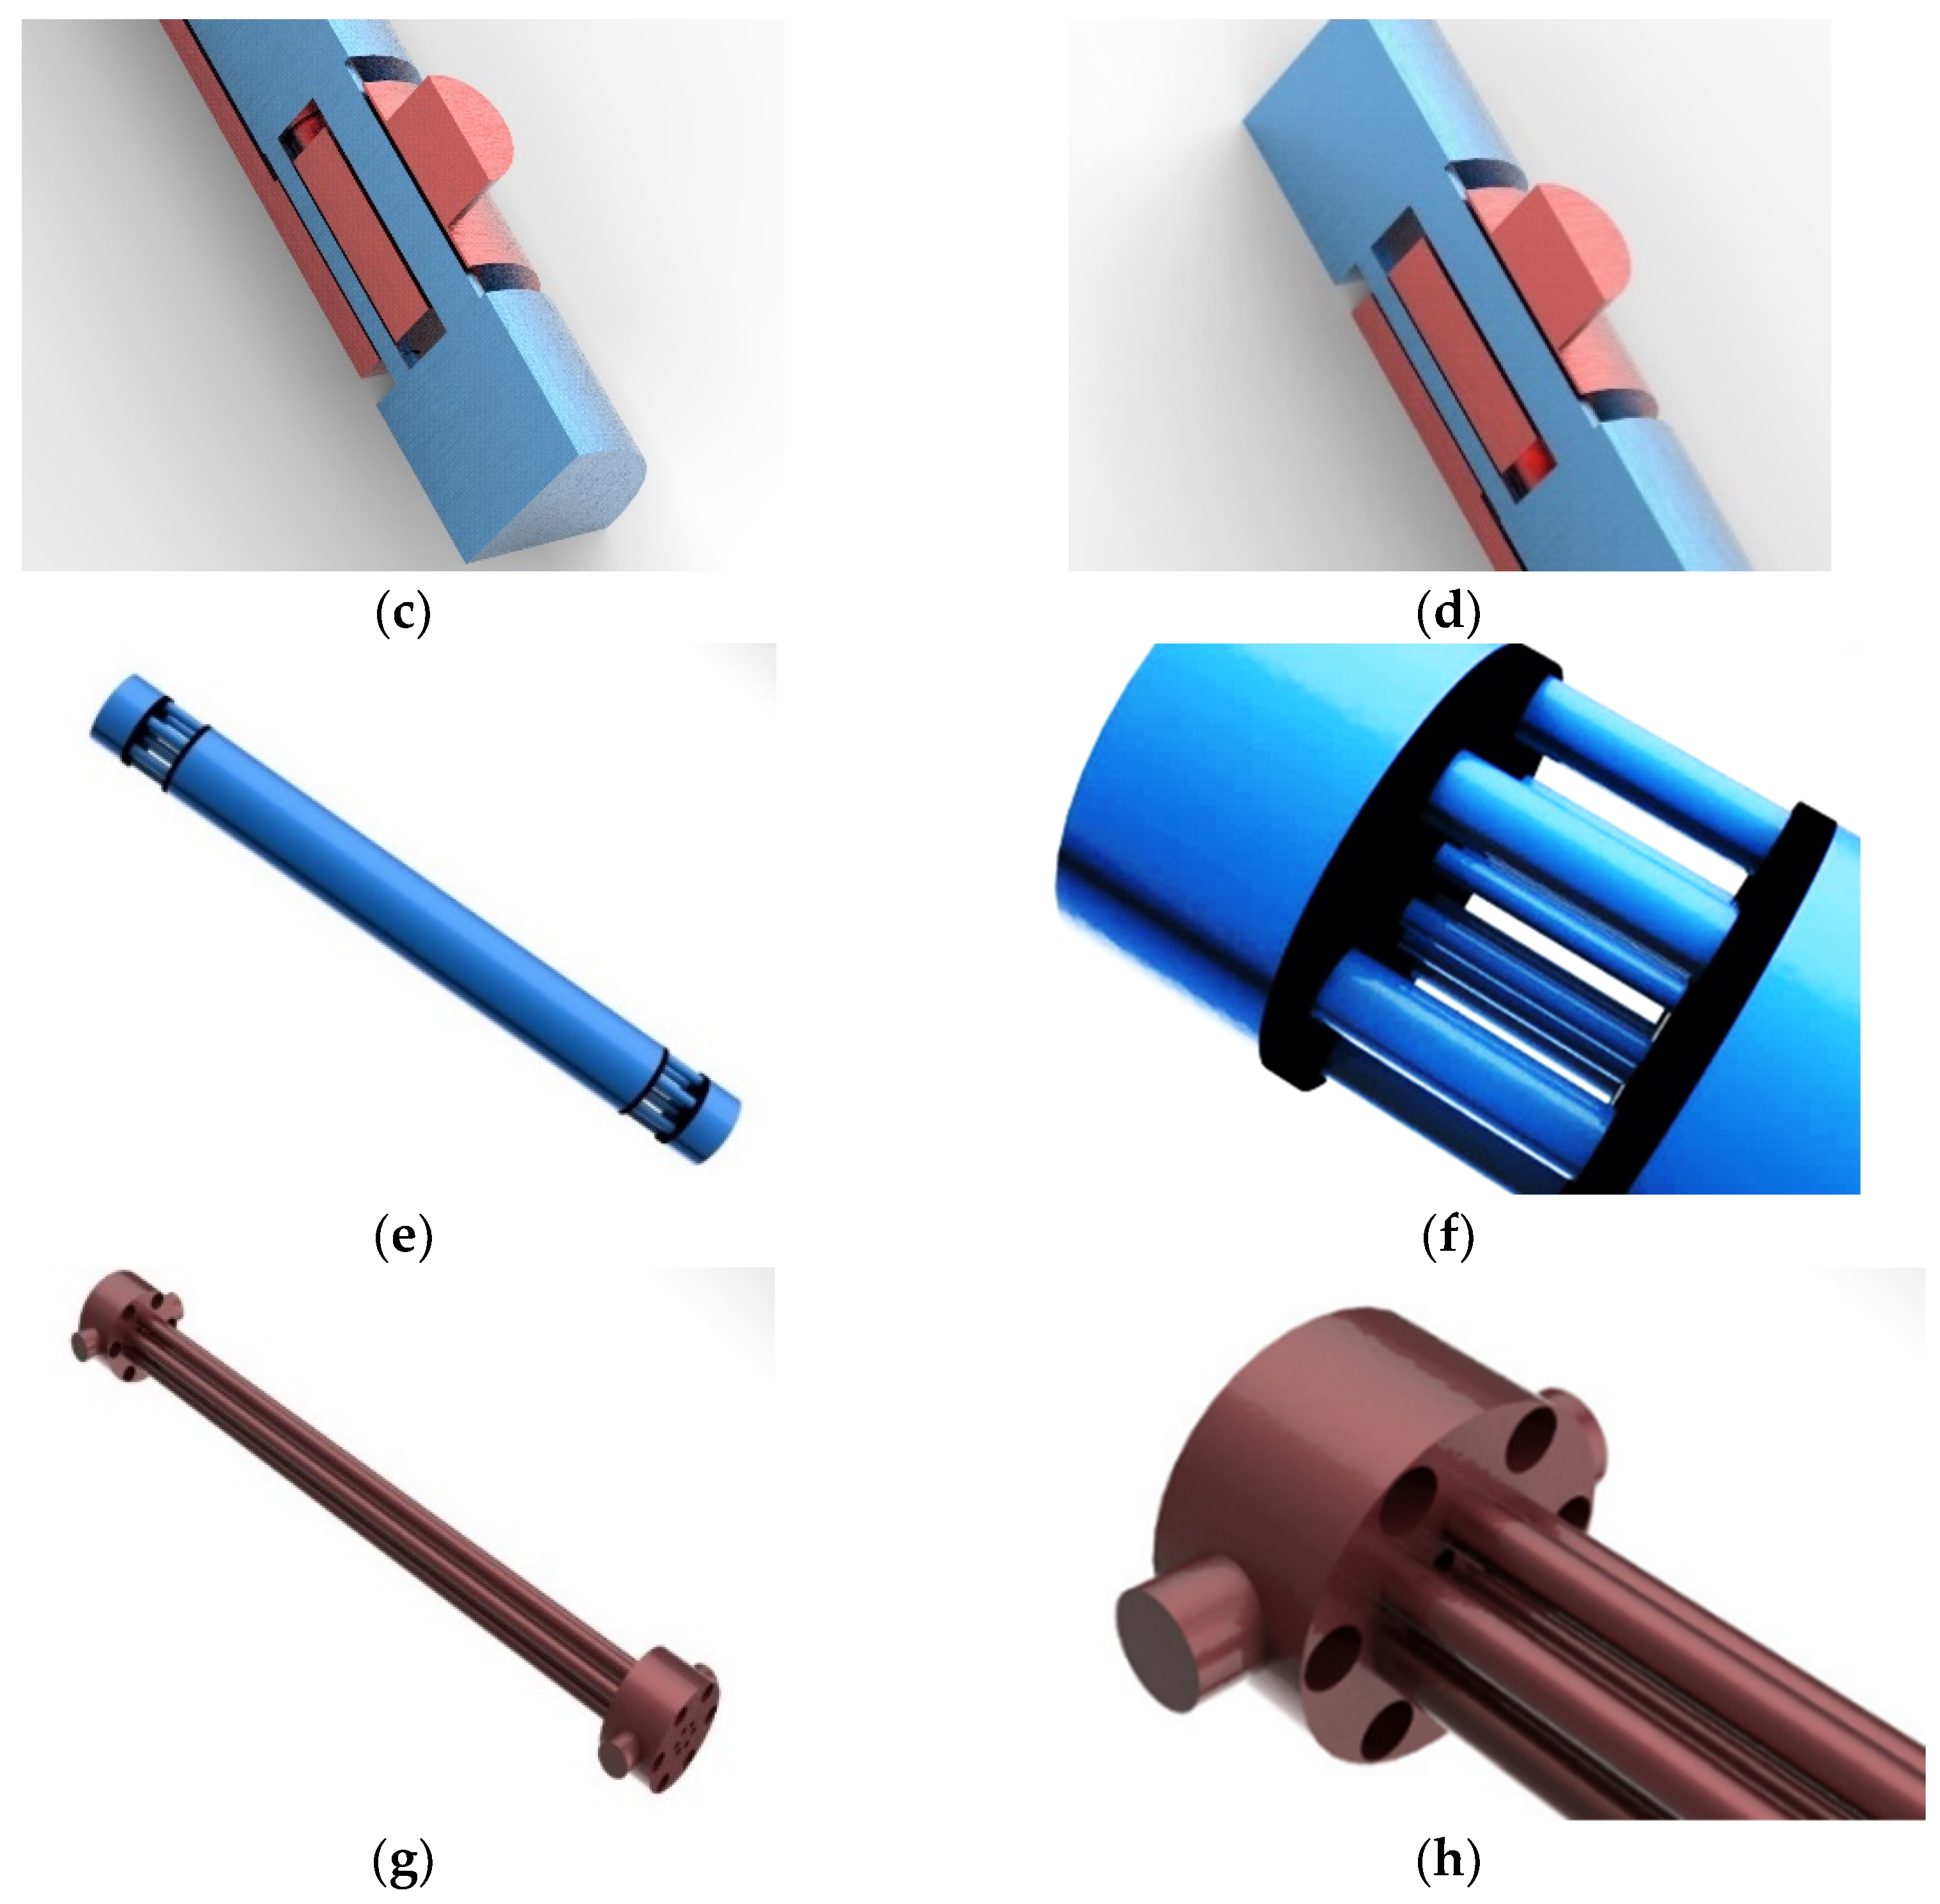
To optimize computational efficiency and reduce calculation time, the core of the MD was divided into four identical quarters with symmetrical walls in the relative directions (X and Y directions). This segmentation allows for a more manageable computational workload. Additionally, the same approach was used in structural figures to show the insights configuration of the MD core and pipes. For the same reason, the outer casing was hidden as well as the separation discs between zones (Figure 4a,b).
The fuel is introduced into the MD through two inlets located at the top of the MD. Subsequently, it traverses a network of seven interconnected pipes (Figure 4g,h). Within the middle core region, the fuel undergoes a progressive heat dissipation process as it exchanges heat with the coolant until reaching the exit. Subsequently, the fuel is transported to the collection zone, where it exits the MD through two outlets. From there, the fuel is returned to the heater for further processing (Figure 1) after being pumped by the MHD pump. Similarly, the coolant flow is driven by another pump from the same type.
The coolant, as illustrated in Figure 4e,f, enters the system through a single inlet and is distributed among six large diameter pipes and six small diameter pipes within the distribution zone. From there, the coolant proceeds towards the core, passing through these 12 pipes. It enters the core to occupy the space surrounding the fuel pipes. The primary heat absorption by the coolant takes place within the core region. Subsequently, the coolant exits through the same 12 pipes present in the distribution zone, ultimately leaving the mini-demonstrator collection zone via a single outlet.

2.2. Mathematical Background

The flow studied in this work is characterized by high Reynolds number. The Reynolds number based on average mean velocity and pipe diameters in different sections vary between 15,000 and 250,000 for the fuel and coolant, respectively. The k-ω turbulence model was employed in the present work to address the turbulent flow physics.
The standard k-ω model was originally proposed by Wilcox [30] as an empirical model based on K and ω, where k is the turbulence kinetic energy and ω is specific dissipation rate, to describe the free stream outside the shear boundary layer. One of the remarkable improvements of this model was implementing the SST version of the k-ω model [30].
For the standard k-ω model, k and ω can be obtained from the following equations, respectively:
t ( ρ k ) + x i ρ k u i = x j Γ k k x j + G k Y k + G b
t ( ρ ω ) + x i ρ ω u i = x j Γ ω ω x j + G ω Y ω + G ω b
where the turbulence kinetic energy generation is the generation of ω, Γ ω and Γ k are the diffusivity of k and ω, respectively. Gb and Gwb are buoyancy terms.
The SST model improvement is based on the Bradshaw’s assumption illustrating the proportionality between the main shear stress and the turbulent kinetic energy. The SST model is independent of the freestream values and shows better agreement with the experimental data.
τ = ρ a 1 k
The sheer stress can also be computed from the two-equation model from the form:
τ = μ t Ω
where Ω = u y . Within the framework of the eddy viscosity model, redefining the eddy viscosity is then possible in the following form:
v t = a 1 k Ω
In adverse pressure gradient flows, the production of sheer stress is larger than the dissipation in the majority of the boundary layer; for this reason, the following expression is able to apply the shear stress equation for most of the adverse pressure gradient,
v t = a 1 k m a x ( a 1 ω ; Ω )
while for the rest of the boundary layer, the original expression is being used, which is
v t = μ ρ = k ω
To keep the eddy viscosity model valid for the free shear layers, the modifications are only within the boundary layers; the following blending function is used:
v t = a 1 k m a x ( a 1 ω ; Ω F 2 )
where F 2 is defined as below:
a r g 2 = m a x ( 2 k 0.09 ω y ; 500 v y 2 ω )
F 2 = t a n h ( a r g 2 2 )
The F 2 specifies its value based on the location as per its previously mentioned definition. For correcting the behavior of the flow over a flat plat boundary layer, the constants for SST model are expressed as below:
σ k 1 = 0.85 ,   σ ω 1 = 0.5 ,           β 1 = 0.0750 , α 1 = 0.31
β * = 0.09 ,           k = 0.41 ,           γ 1 = β 1 β * σ ω 1 k 2 / β *
More information about the model can be found in [31].

2.3. Computational Details

The model of the DFR core contains 7 fuel pipes (see Figure 4g,h) and 12 coolant pipes (6 have larger diameter and 6 with a smaller one) (see Figure 4e,f). Due to the geometric symmetry, only a quarter of the domain was considered in simulation. Detailed core parameters of the studied geometry can be found in Table 1). The core parameters and dimensions were chosen to be within their corresponding ones in the DFR for best modeling experimental outcome benefits [5,32].

2.4. Boundary Conditions and Numerical Scheme

As mentioned, the k-ω model has been used in simulations of mini-demonstrator cases, taking into consideration the Y+ not exceeding 5 in the areas where significant heat transfer and velocity gradients are located (e.g., inside and outside surfaces of all fuel and coolant pipes). The energy equation was activated for the purpose of predicting heat transfer. The material properties of molten lead bismuth were manually added with proper correlations valid within the suitable temperature ranges as shown in Table 2.
The inlet velocities of both fuel and coolant were set to be 0.1 m/s and 0.5 m/s, respectively, constant and perpendicular to the inlet’s surfaces. The atmospheric pressure was prescribed at outlets for fuel and coolant were set to be atmospheric as in the real reactor case. Detailed data of the boundary conditions can be found in Table 3.
Second order upwind was used for discretization of convective terms in governing and transport equations. The normalized residuals for the governing and transport equations were driven to the level 10−5.

2.5. Meshing

Using sweep method wherever possible to mesh all sweepable bodies of the model, and different methods for the unsweepable bodies, the mesh was constructed carefully paying more attention to the boundary layers near the walls of the highest interest of investigation by adding the proper number of cells in the wall-normal direction (5–10 elements) with growth rate of 1.2 to fuel and coolant domains in the inner and outer sides of both fuel and coolant pipes).
Given the intricacy of the model, a small mesh size is essential to accurately capture the various phenomena and behaviors exhibited by the fluids during the simulation. This finer mesh resolution ensures that all relevant features and intricacies are reliably captured in the computational model.
A sensitivity analysis was conducted to evaluate the impact of different factors on the system. The analysis was conducted using one fuel pipe. Although the results of the analysis showed close values among the tested mesh sizes and number of elements, the intricate geometry and varying element sizes in different locations made the analysis challenging and difficult to implement a consistent mesh size change across the entire model. As a result, the sensitivity analysis was not conclusive and could not be universally applied. However, to be within the best possible y+ range required by the specific model, the finest mesh size 24 million elements was chosen for further calculations, relying on the statistical values of the mesh quality parameters that were found to be within the recommended values.

2.6. Validation of RANS Model

One of few facilities in the world used to test liquid lead systems to observe the behavior of the flow in various operational conditions is the TALL-3D facility in the Royal Institute of Technology, Stockholm, Sweden. An experiment has been performed in the facility that can be used here for the purpose of validation. The facility has two loops with a heat exchanger between them. Liquid lead–bismuth eutectic (LBE) was used as a coolant to the primary loop while the secondary loop has glycerol oil coolant. Further description can be found in [33].
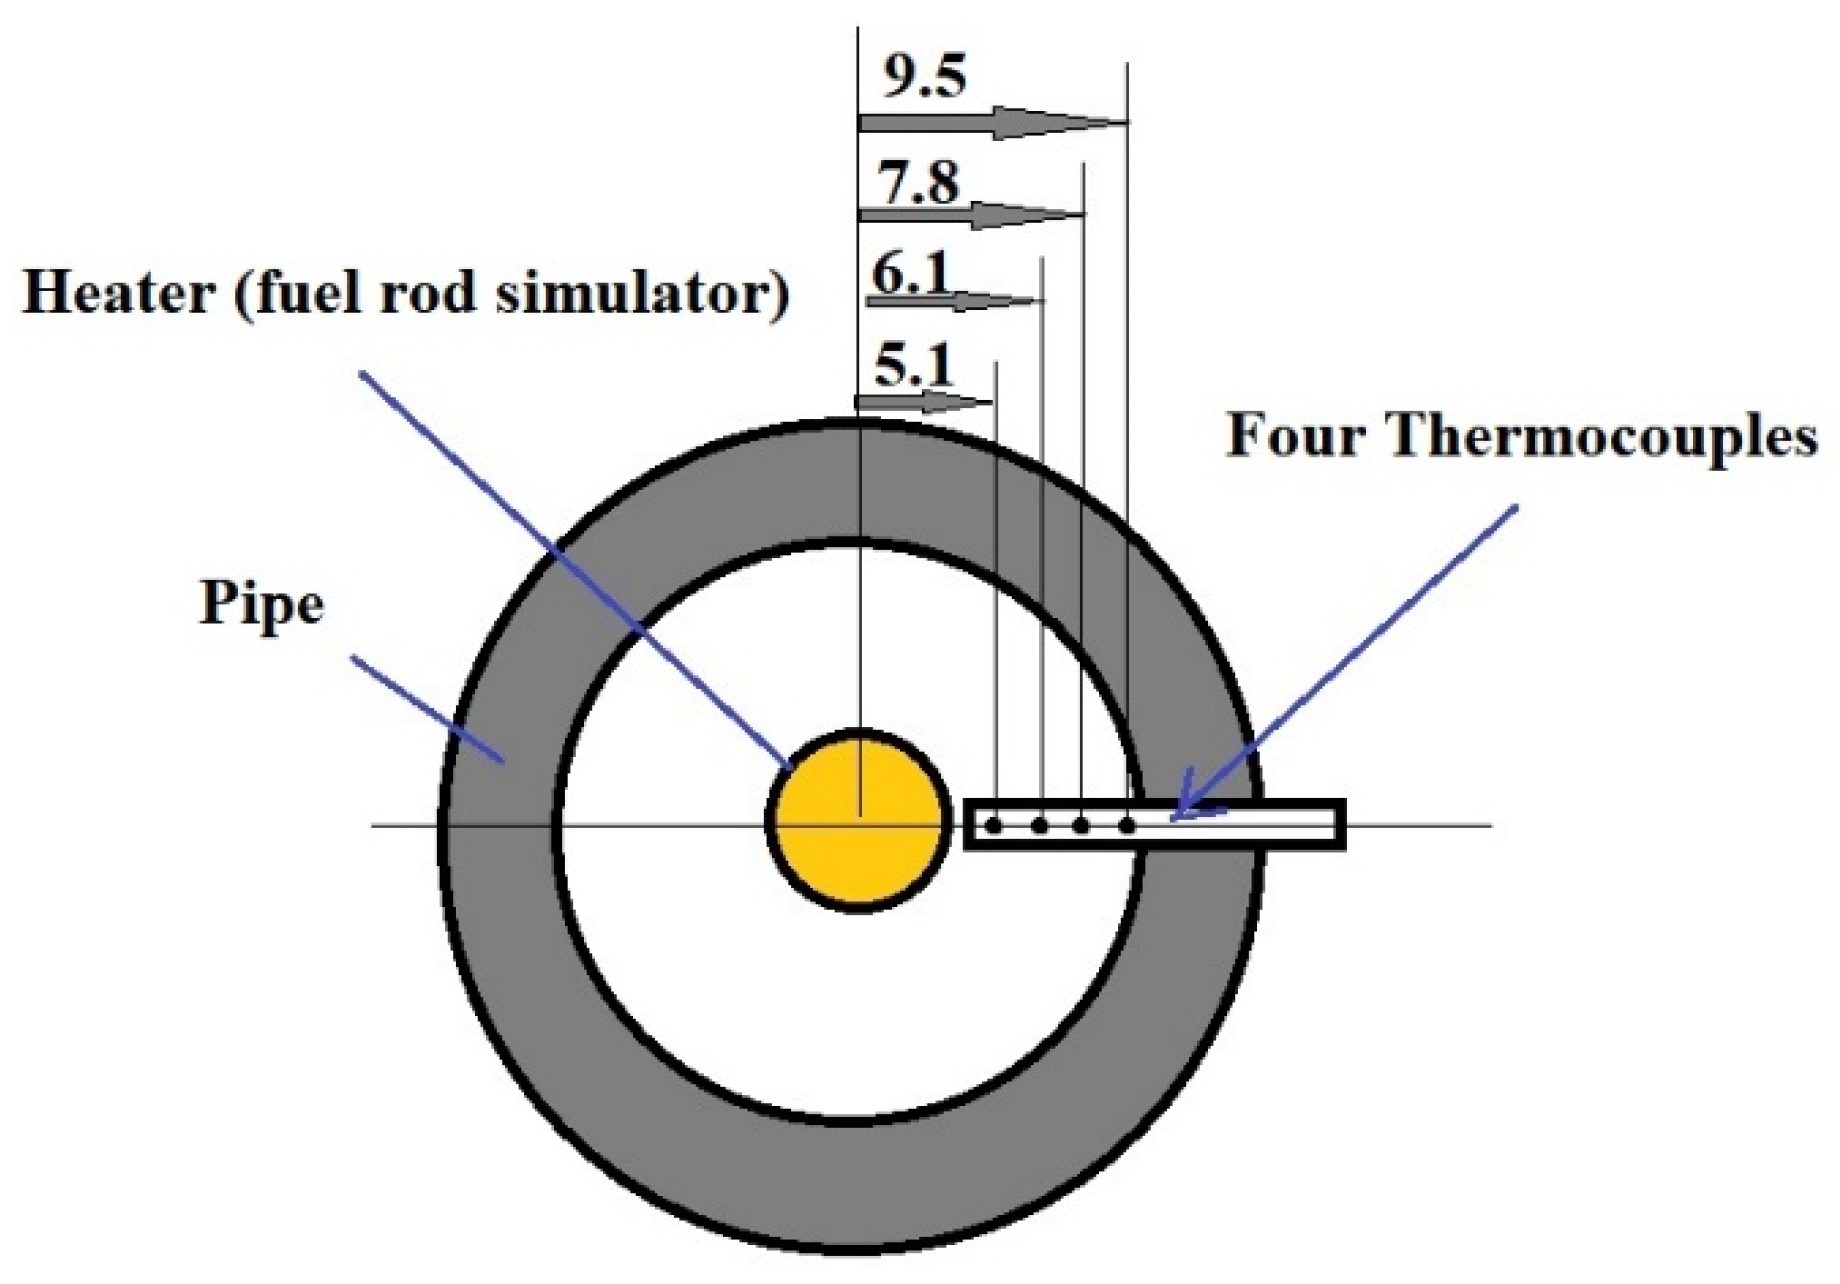
The loop has a testing section which consists of a pipe with a heater rod in the center along the whole testing section of 150 cm total length. The heater itself has a heating section only in 87 cm of its length located after a 60 cm length used for flow development, the heater is then followed by a 3 cm section for device constructional reasons. Four different elevations in the testing section, equally spaced, had four thermocouples each. The temperature of the LBE was calculated in the four elevations based on the average temperature detected by the four thermocouples (Figure 5).
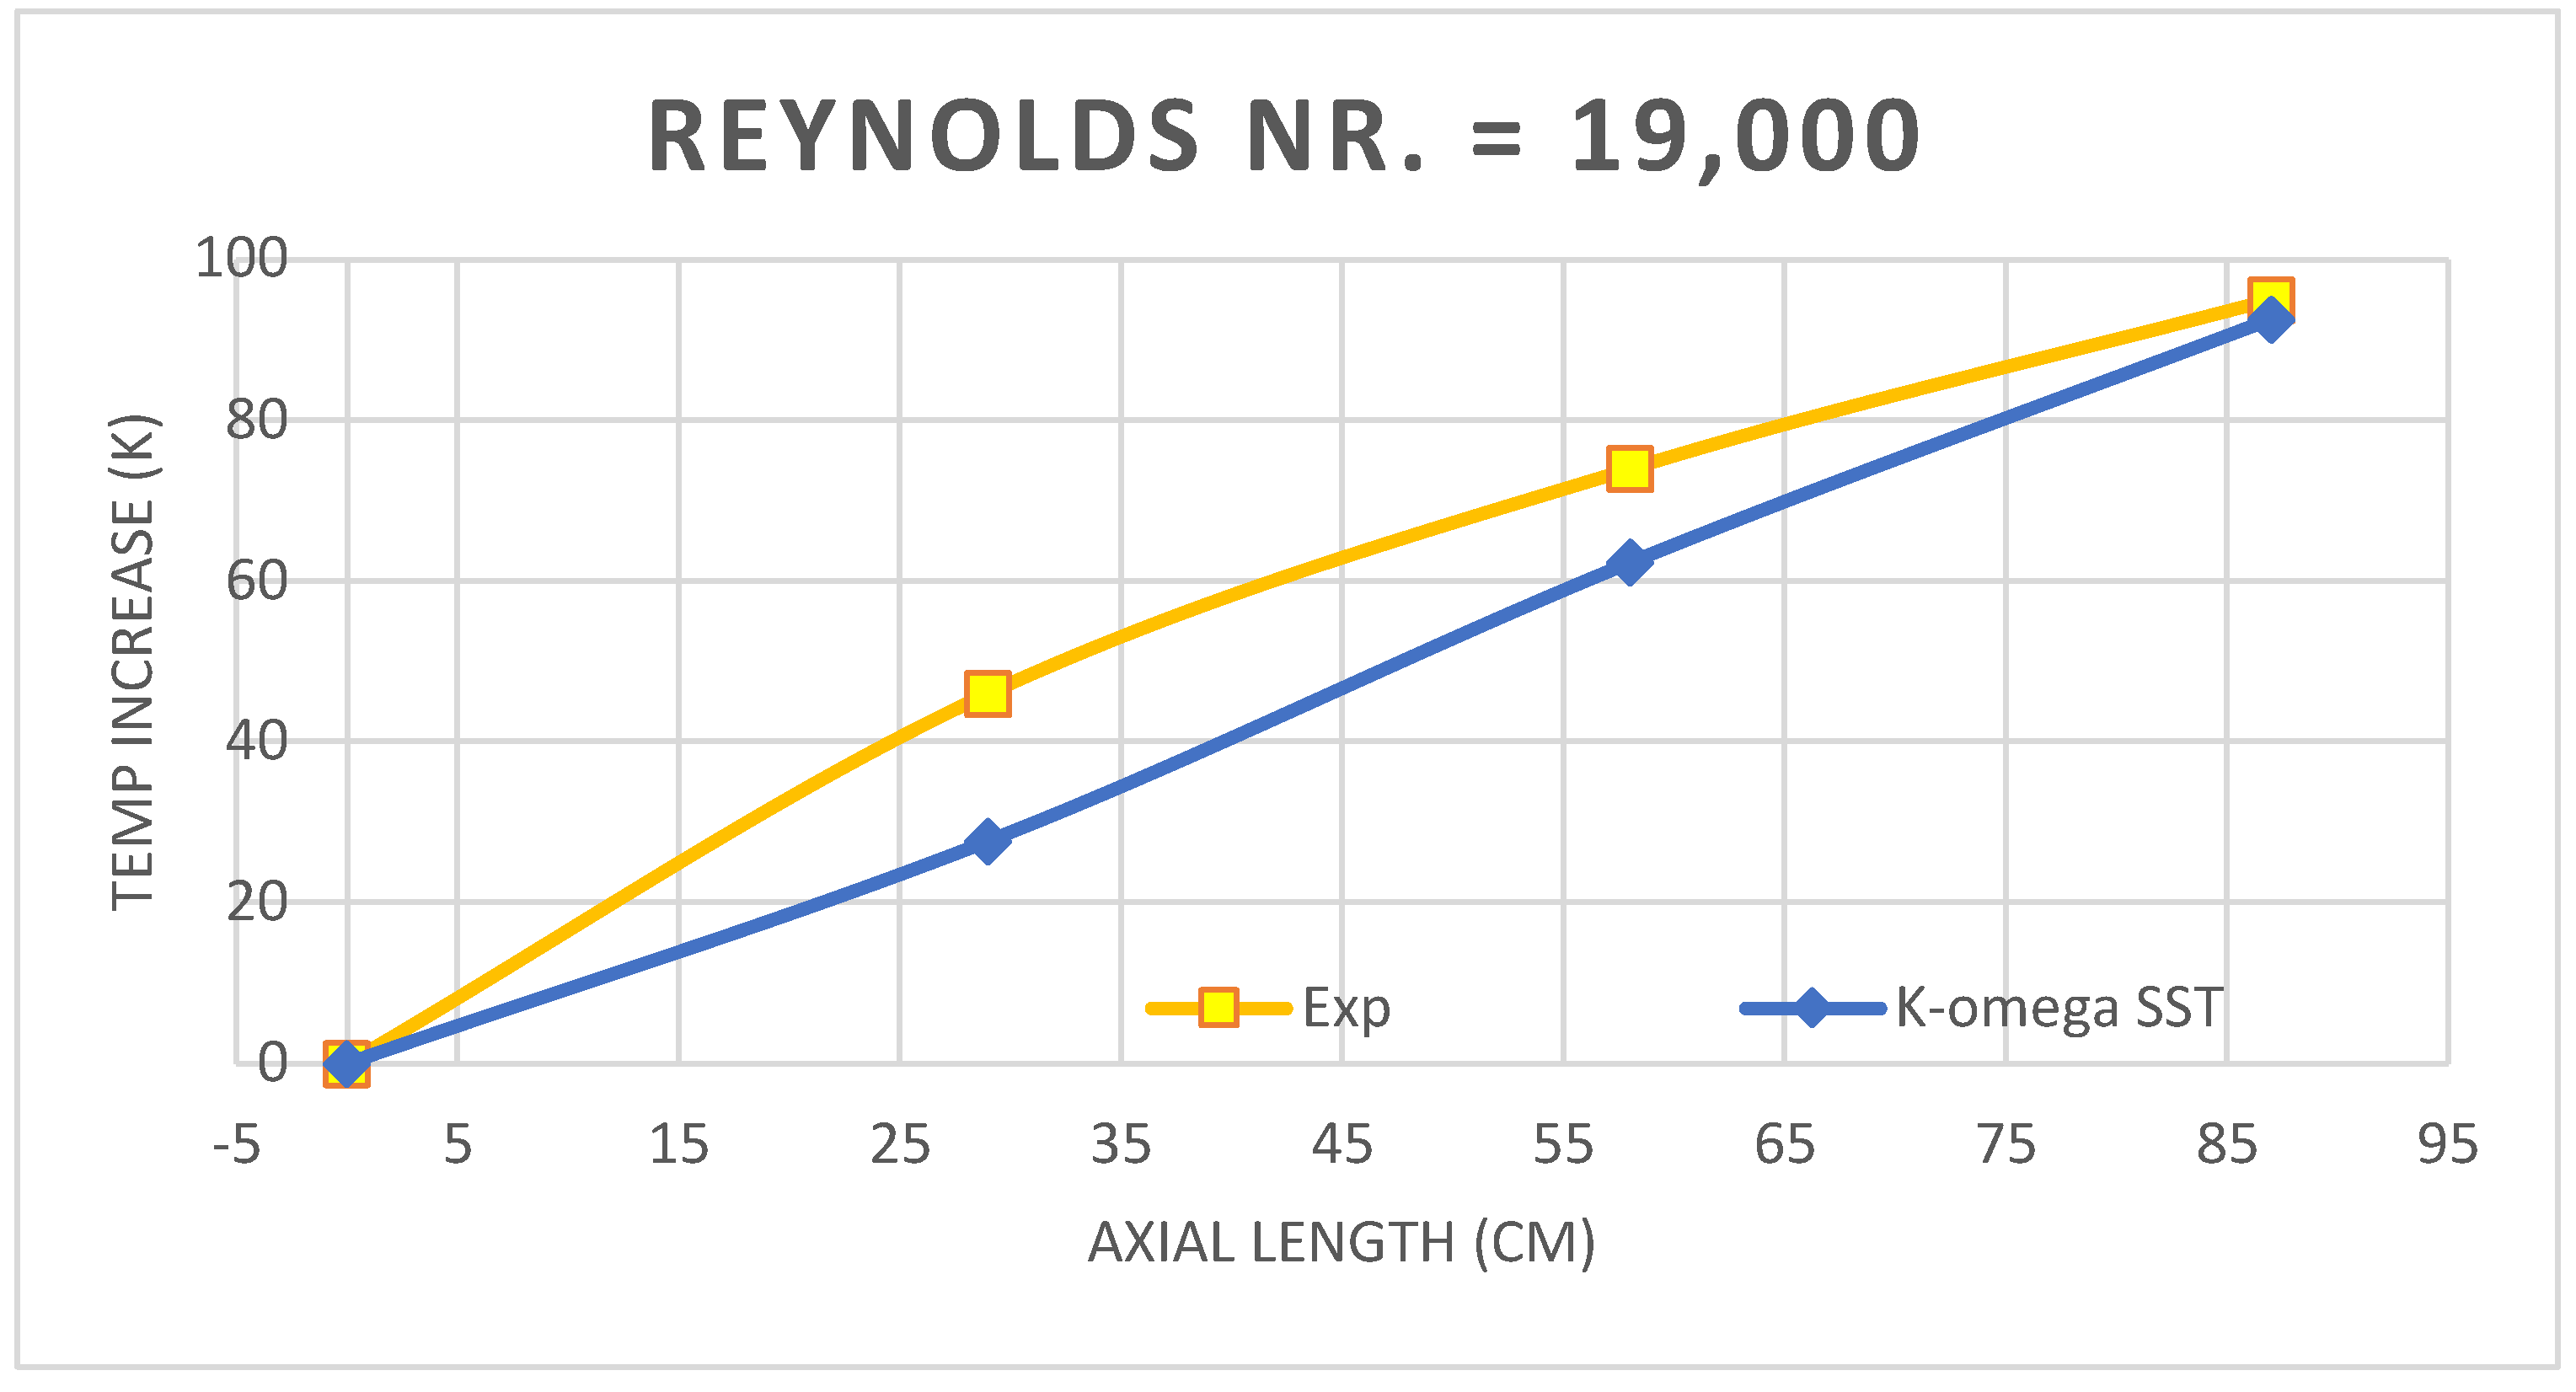
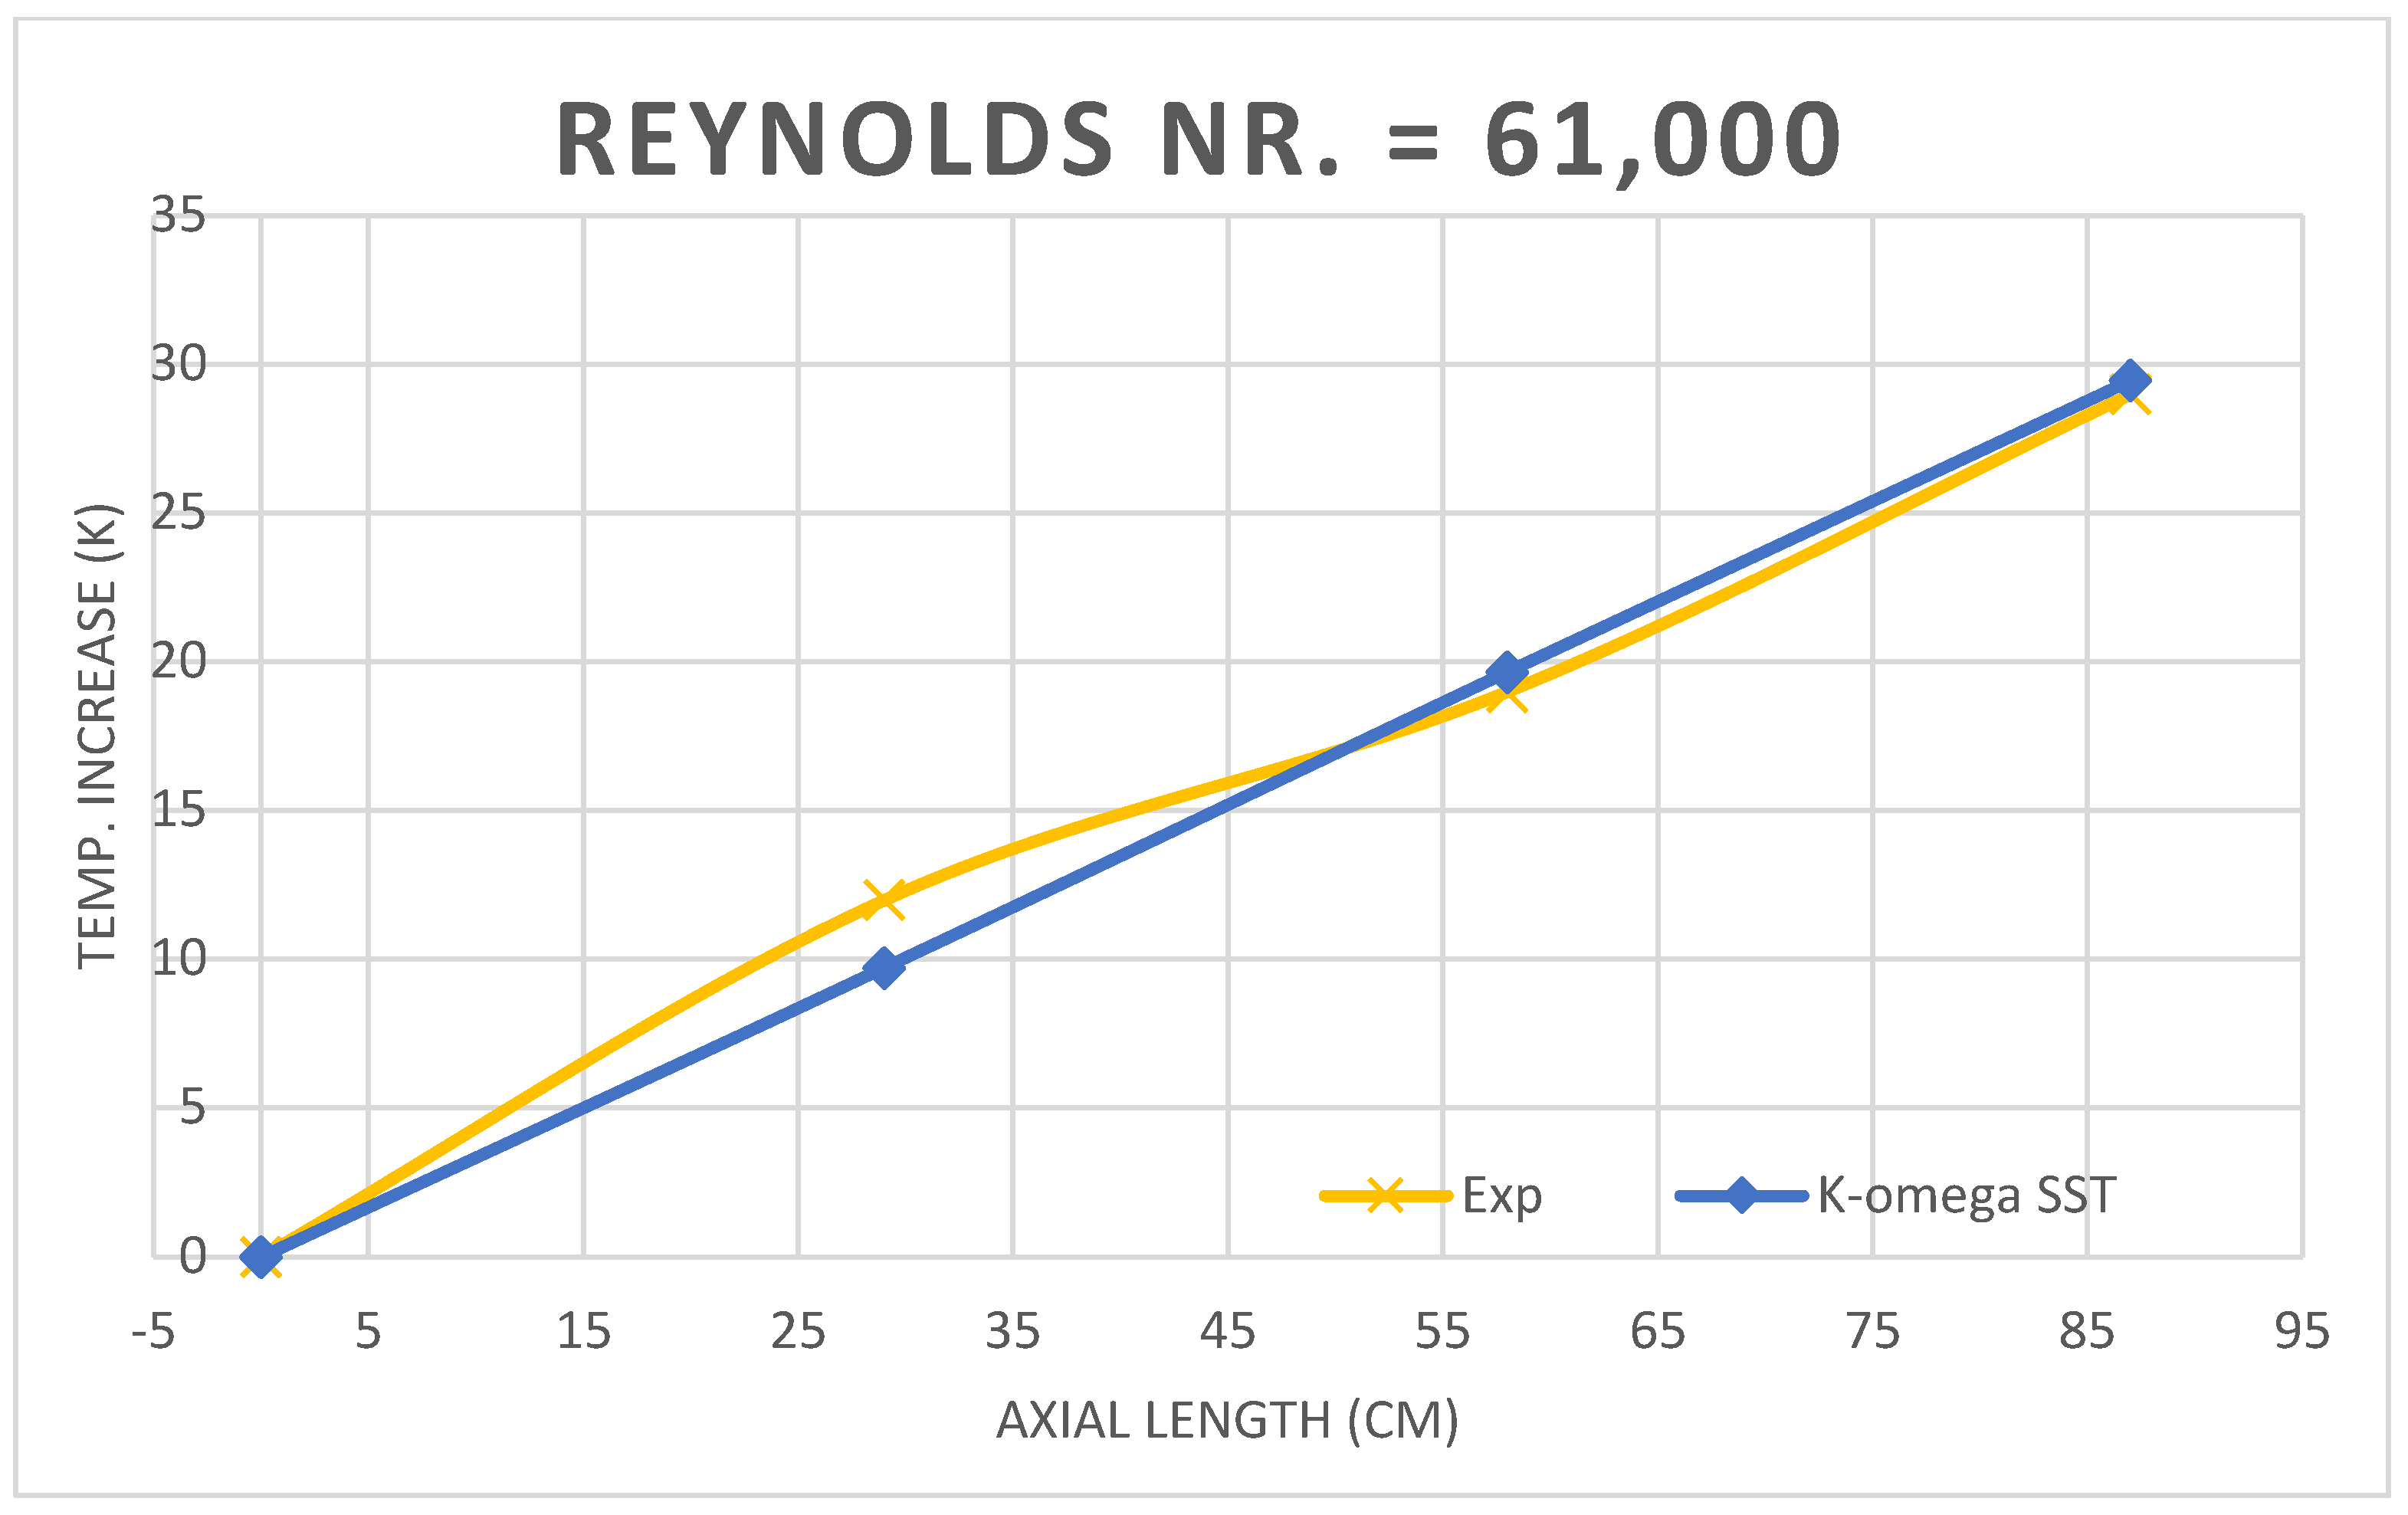
The steady state experiment was set based on the nominal power of the heater, which is 21 kW as a constant value, while different inlet velocities were tested (0.65, 0.93, 1.36, 1.57, and 2 m/s) and temperature increase of the LBE was measured and presented. The lowest and highest Re numbers were selected for modeling for the purpose of validating the k-ω SST model (Re = 19,000 and Re = 61,000). The same elevations as well as thermocouple detection points were modeled with the same dimensions and distances. For this modeling, Ansys fluent was employed and results are presented in Figure 6 and Figure 7.
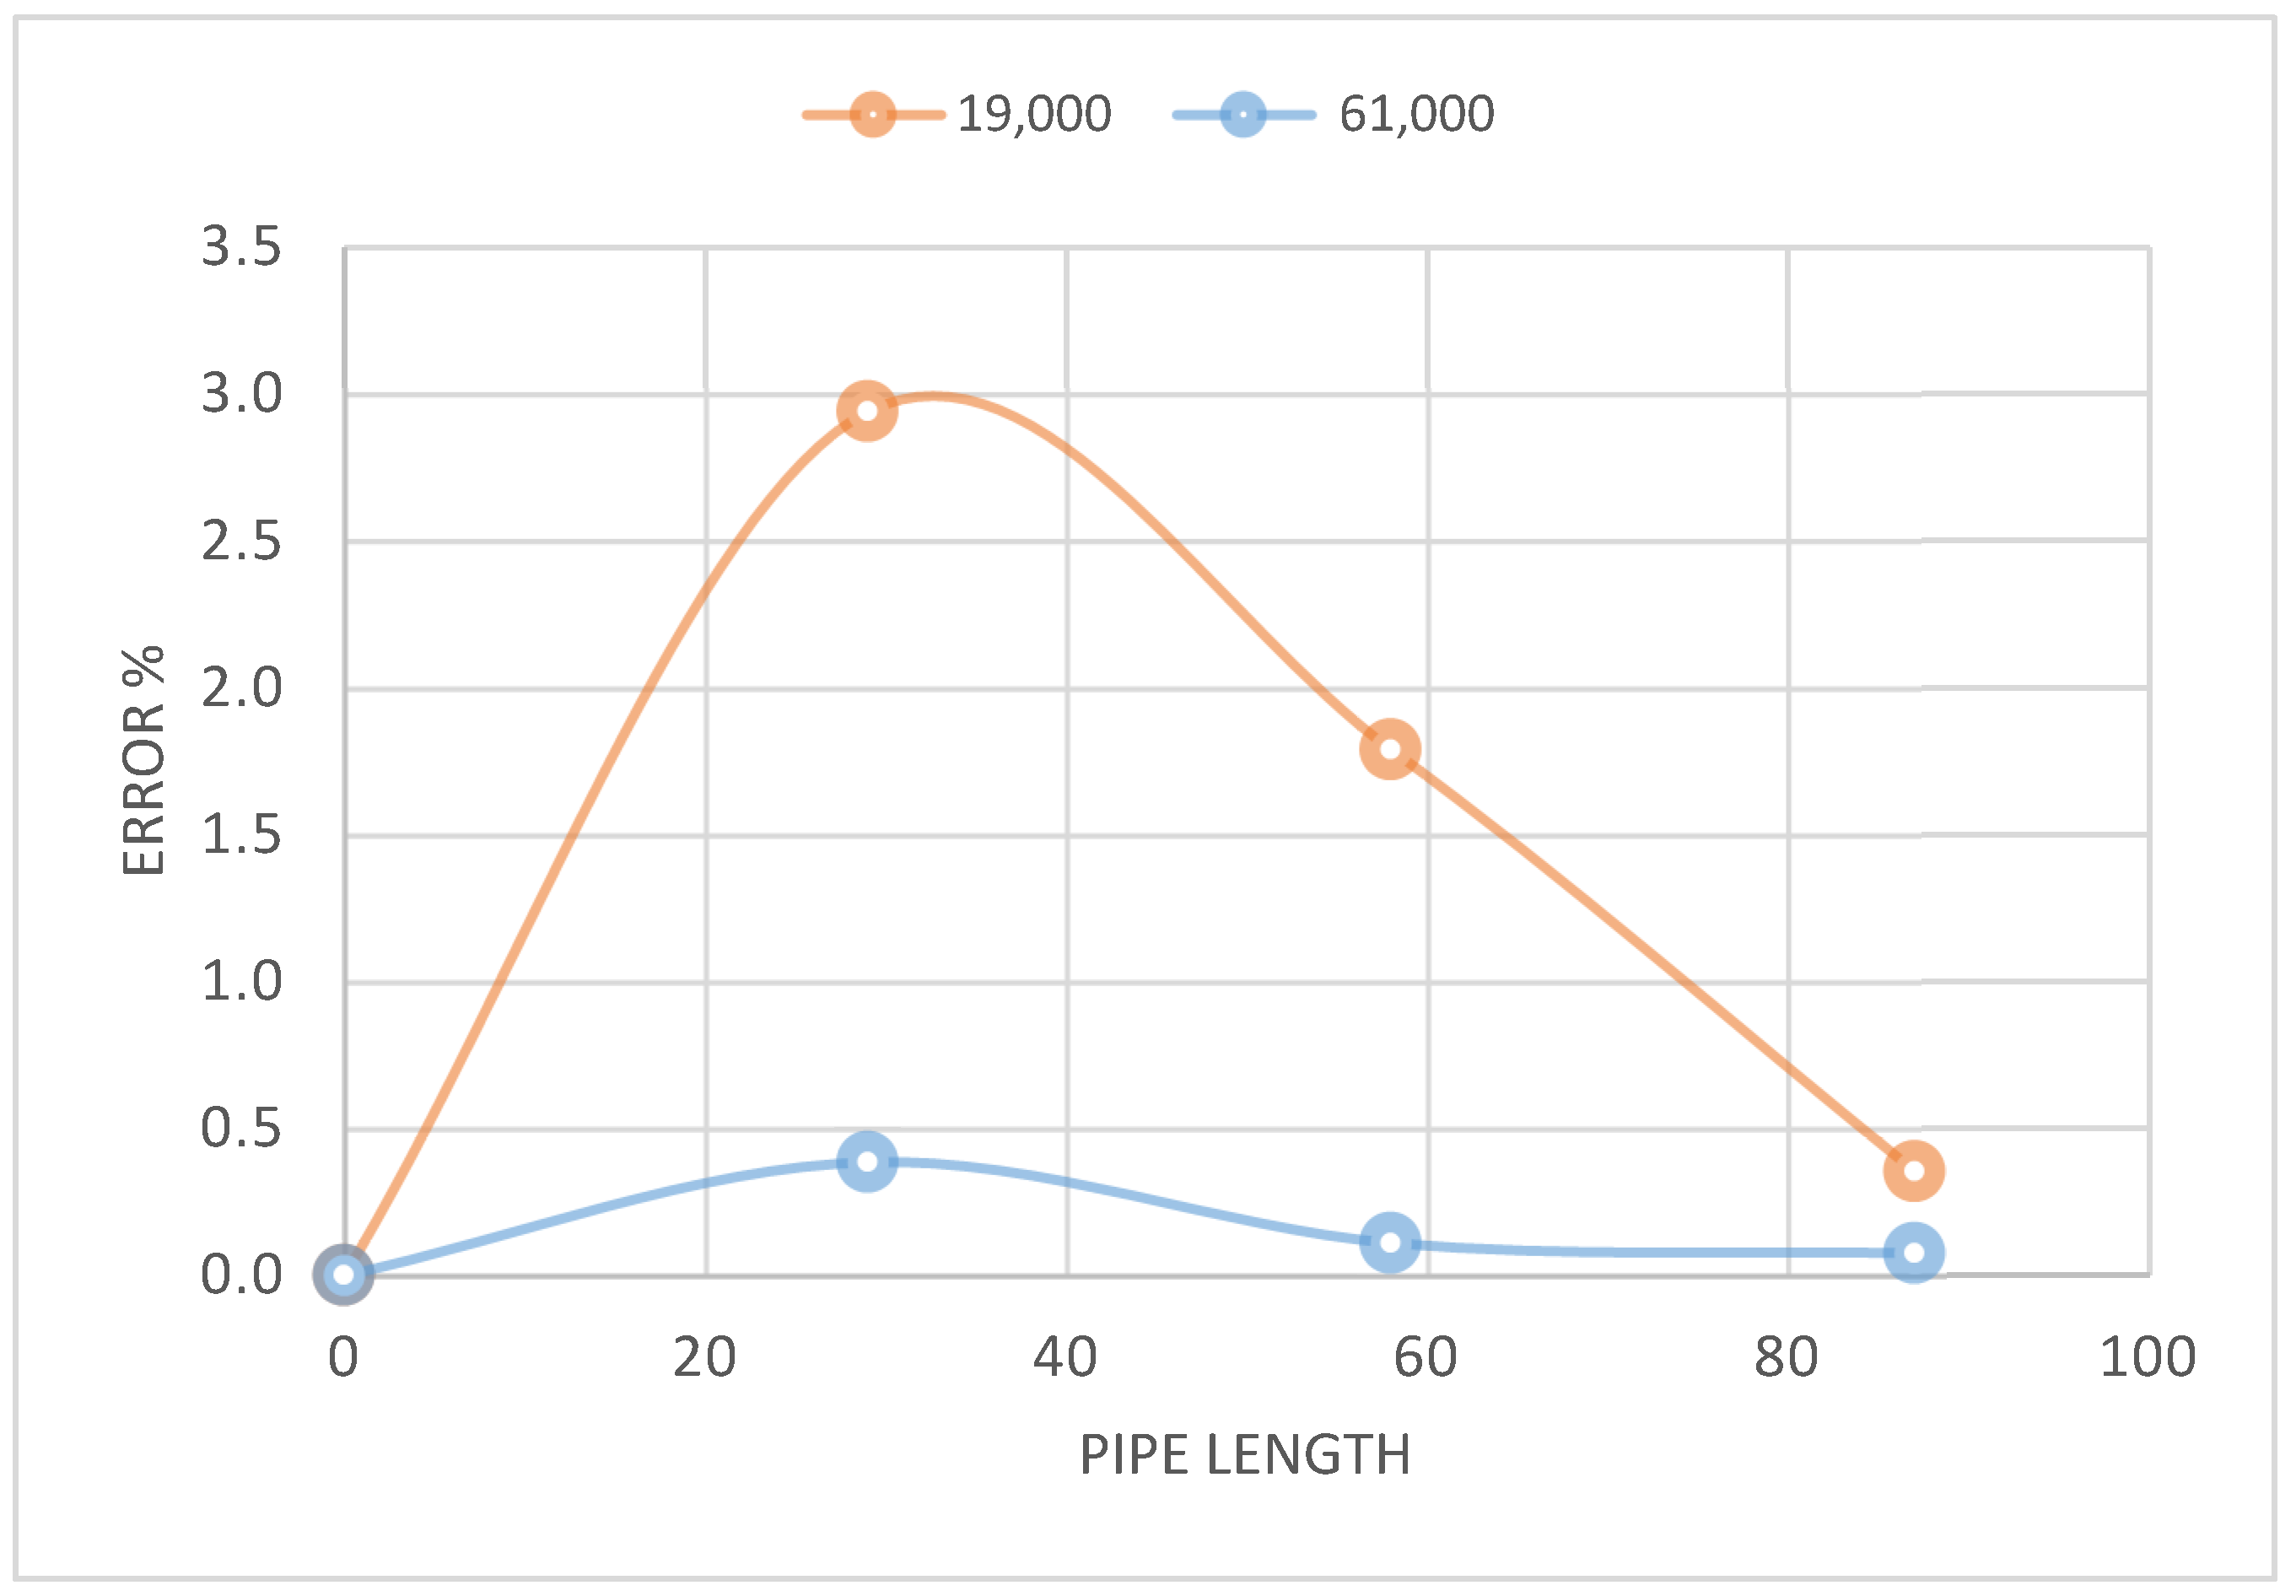
The differences between the used SST k-ω model and the experimental data varied from 0% by the inlet to 3% in the second section in the tested length with highest error value corresponding to the lowest Re number. The error percentage variation within the same sections as well as with Re number variation are presented in Figure 8.
The results showed that using the SST k-ω model to solve this type of flow with the same or close conditions can be reasonable and leads to robust results. Additionally, the k-ω SST model used a constant turbulent Prandtl number (typically 0.85). An interesting research point is to test using the same model but adding different correlations for the turbulent Prandtl number estimation, hence comparing the results to achieve the highest calculations accuracy. For the forementioned reasons, the SST k-ω model was adopted for further calculations for the MD case studied in this article.

3. Results and Discussion

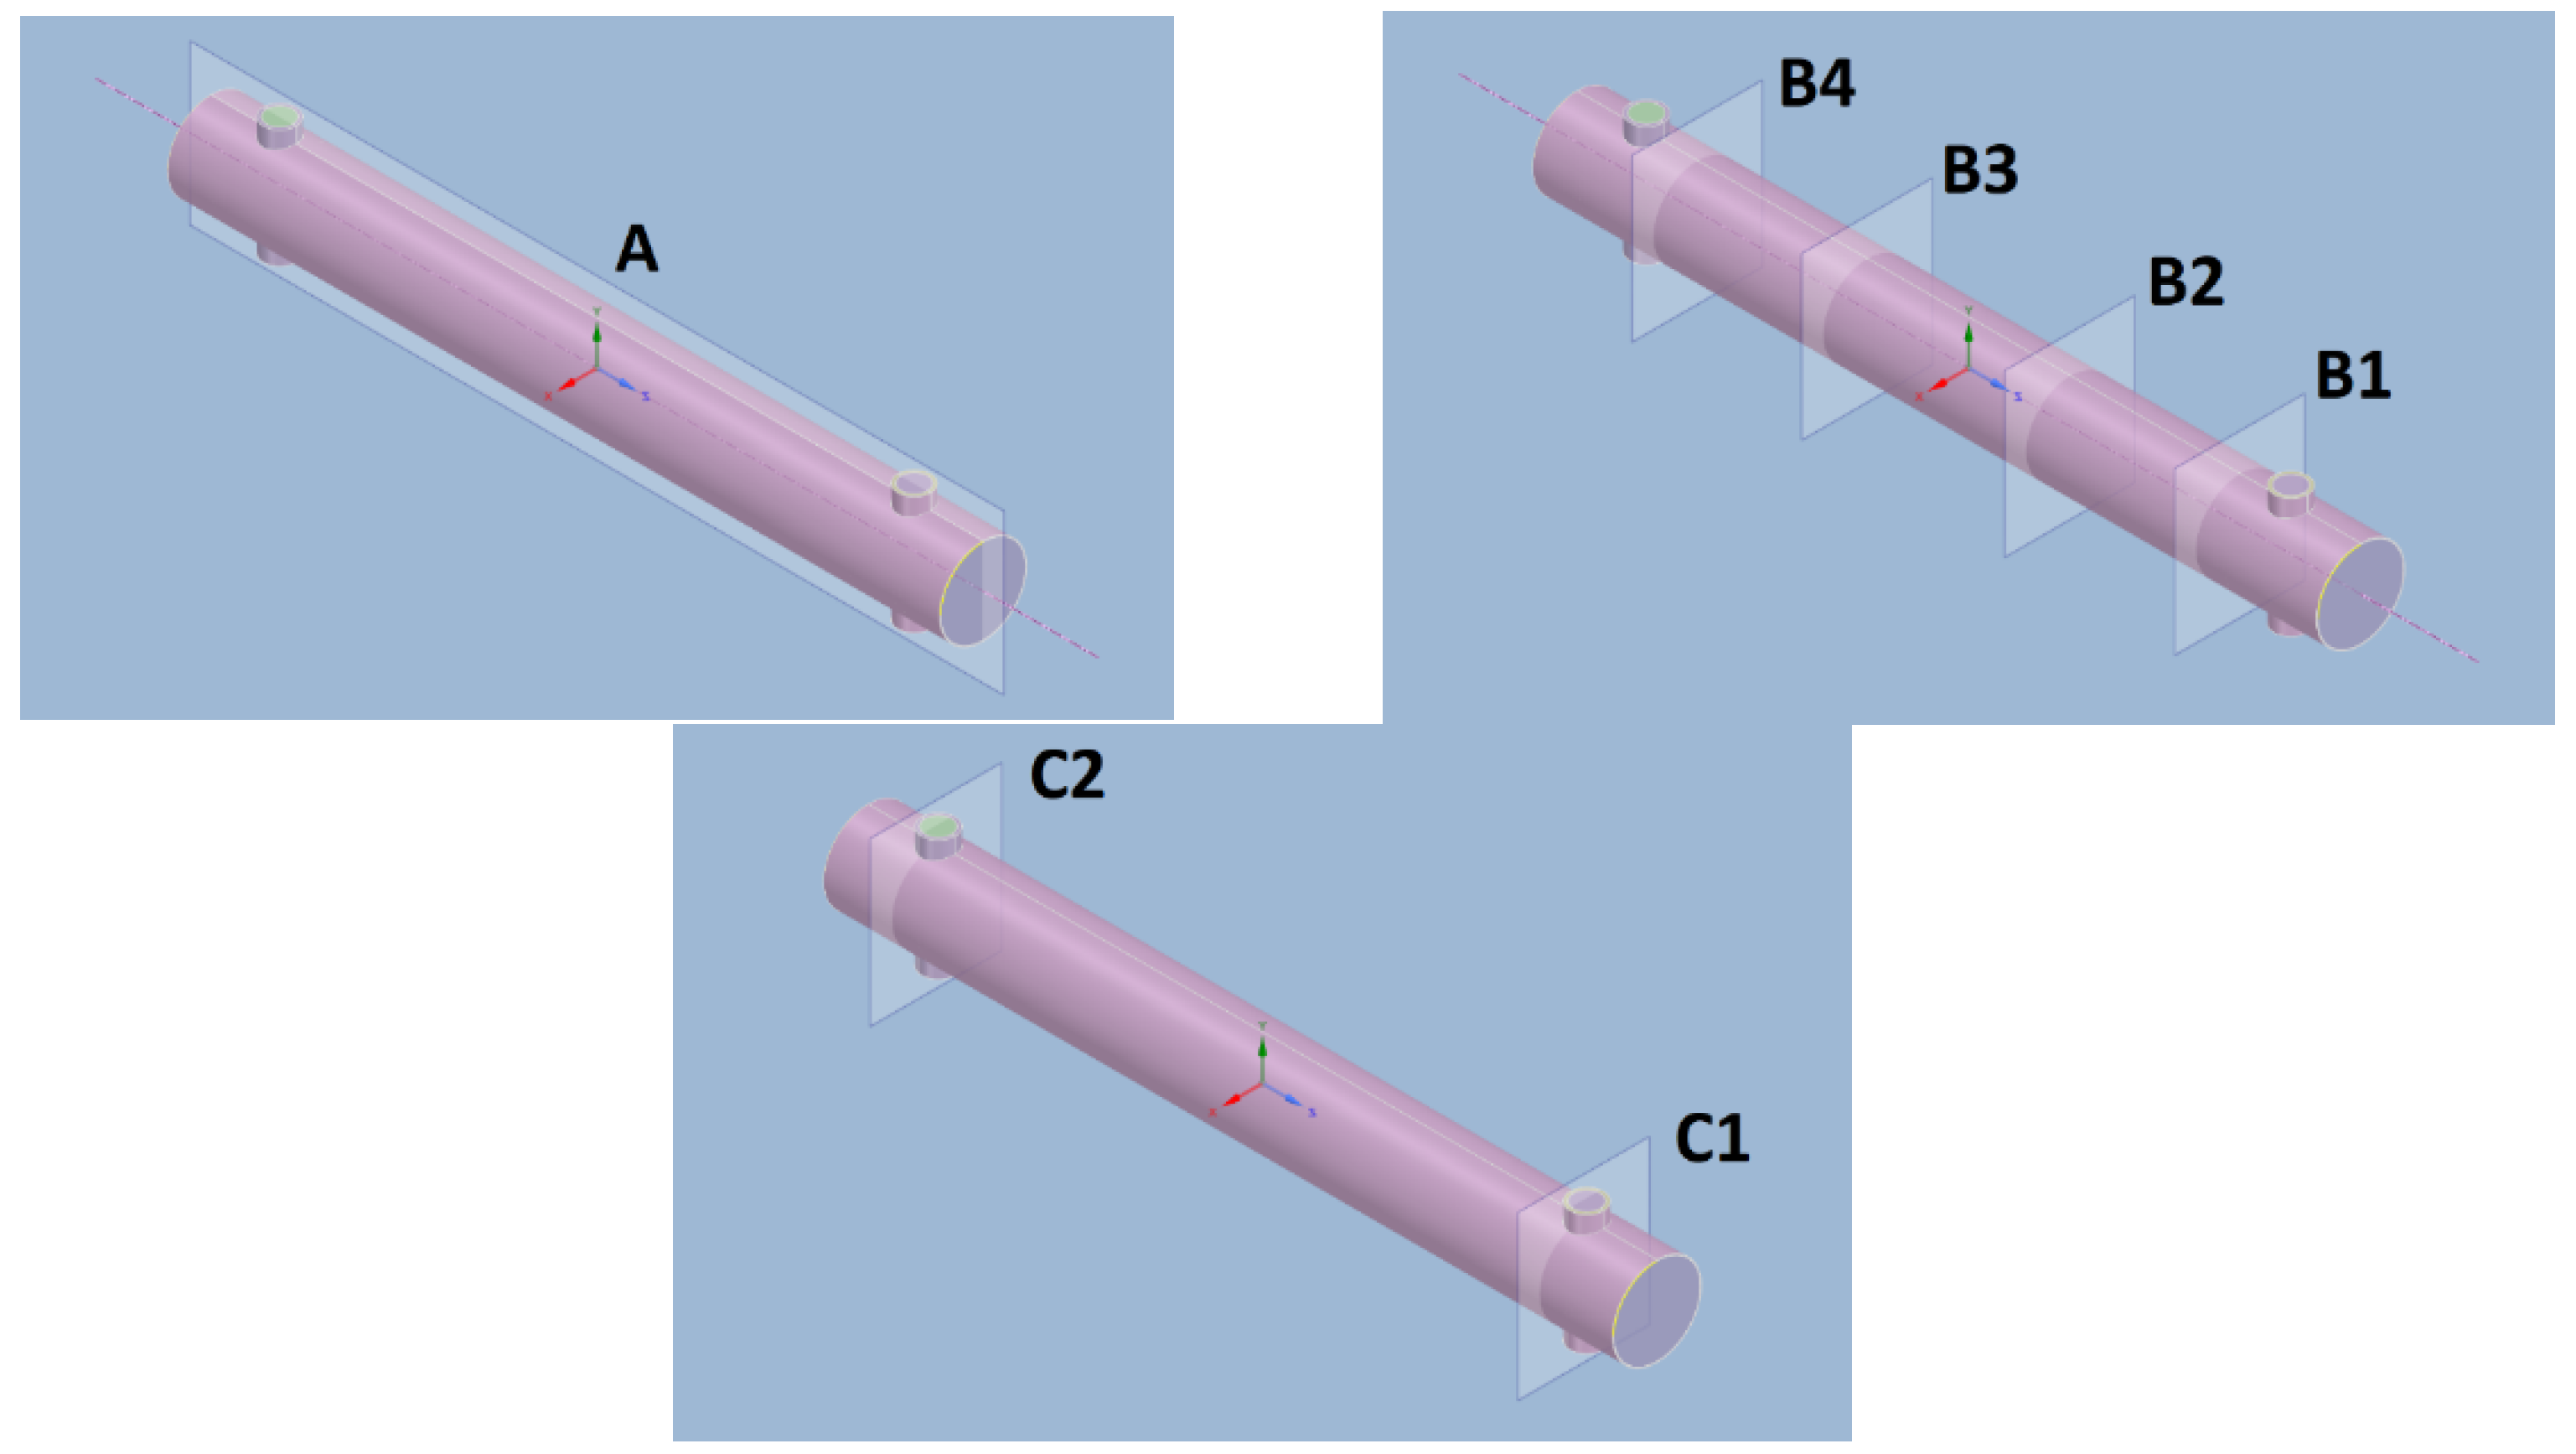
The results are presented in two sections, global and local sections. The global section describes the mass and heat flux through different sections in the model. However, the local section shows temperature, velocity, and other variables describing the two domains in the model (fuel and coolant). The temperature and velocity contours of the fuel domain that will be shown later in the local section were captured in two different groups, each in a different location, namely A and C. The first location (A) is a longitudinal plan along the whole height of the MD, the inlet and outlet part only will be shown, as the flow inside the pipes does not have significant variations. The second location consists of two plans, one plan is at the exact mid-entrance of the fuel inlet pipe placed perpendicular to the MD height (namely C1) and the other is in a similar orientation at the fuel exit pipe (namely C2). These locations are visible in the following diagrams (Figure 9). The third location group consists of four planes B1–B4 equally spaced in the middle core zone.

3.1. Global Characteristics

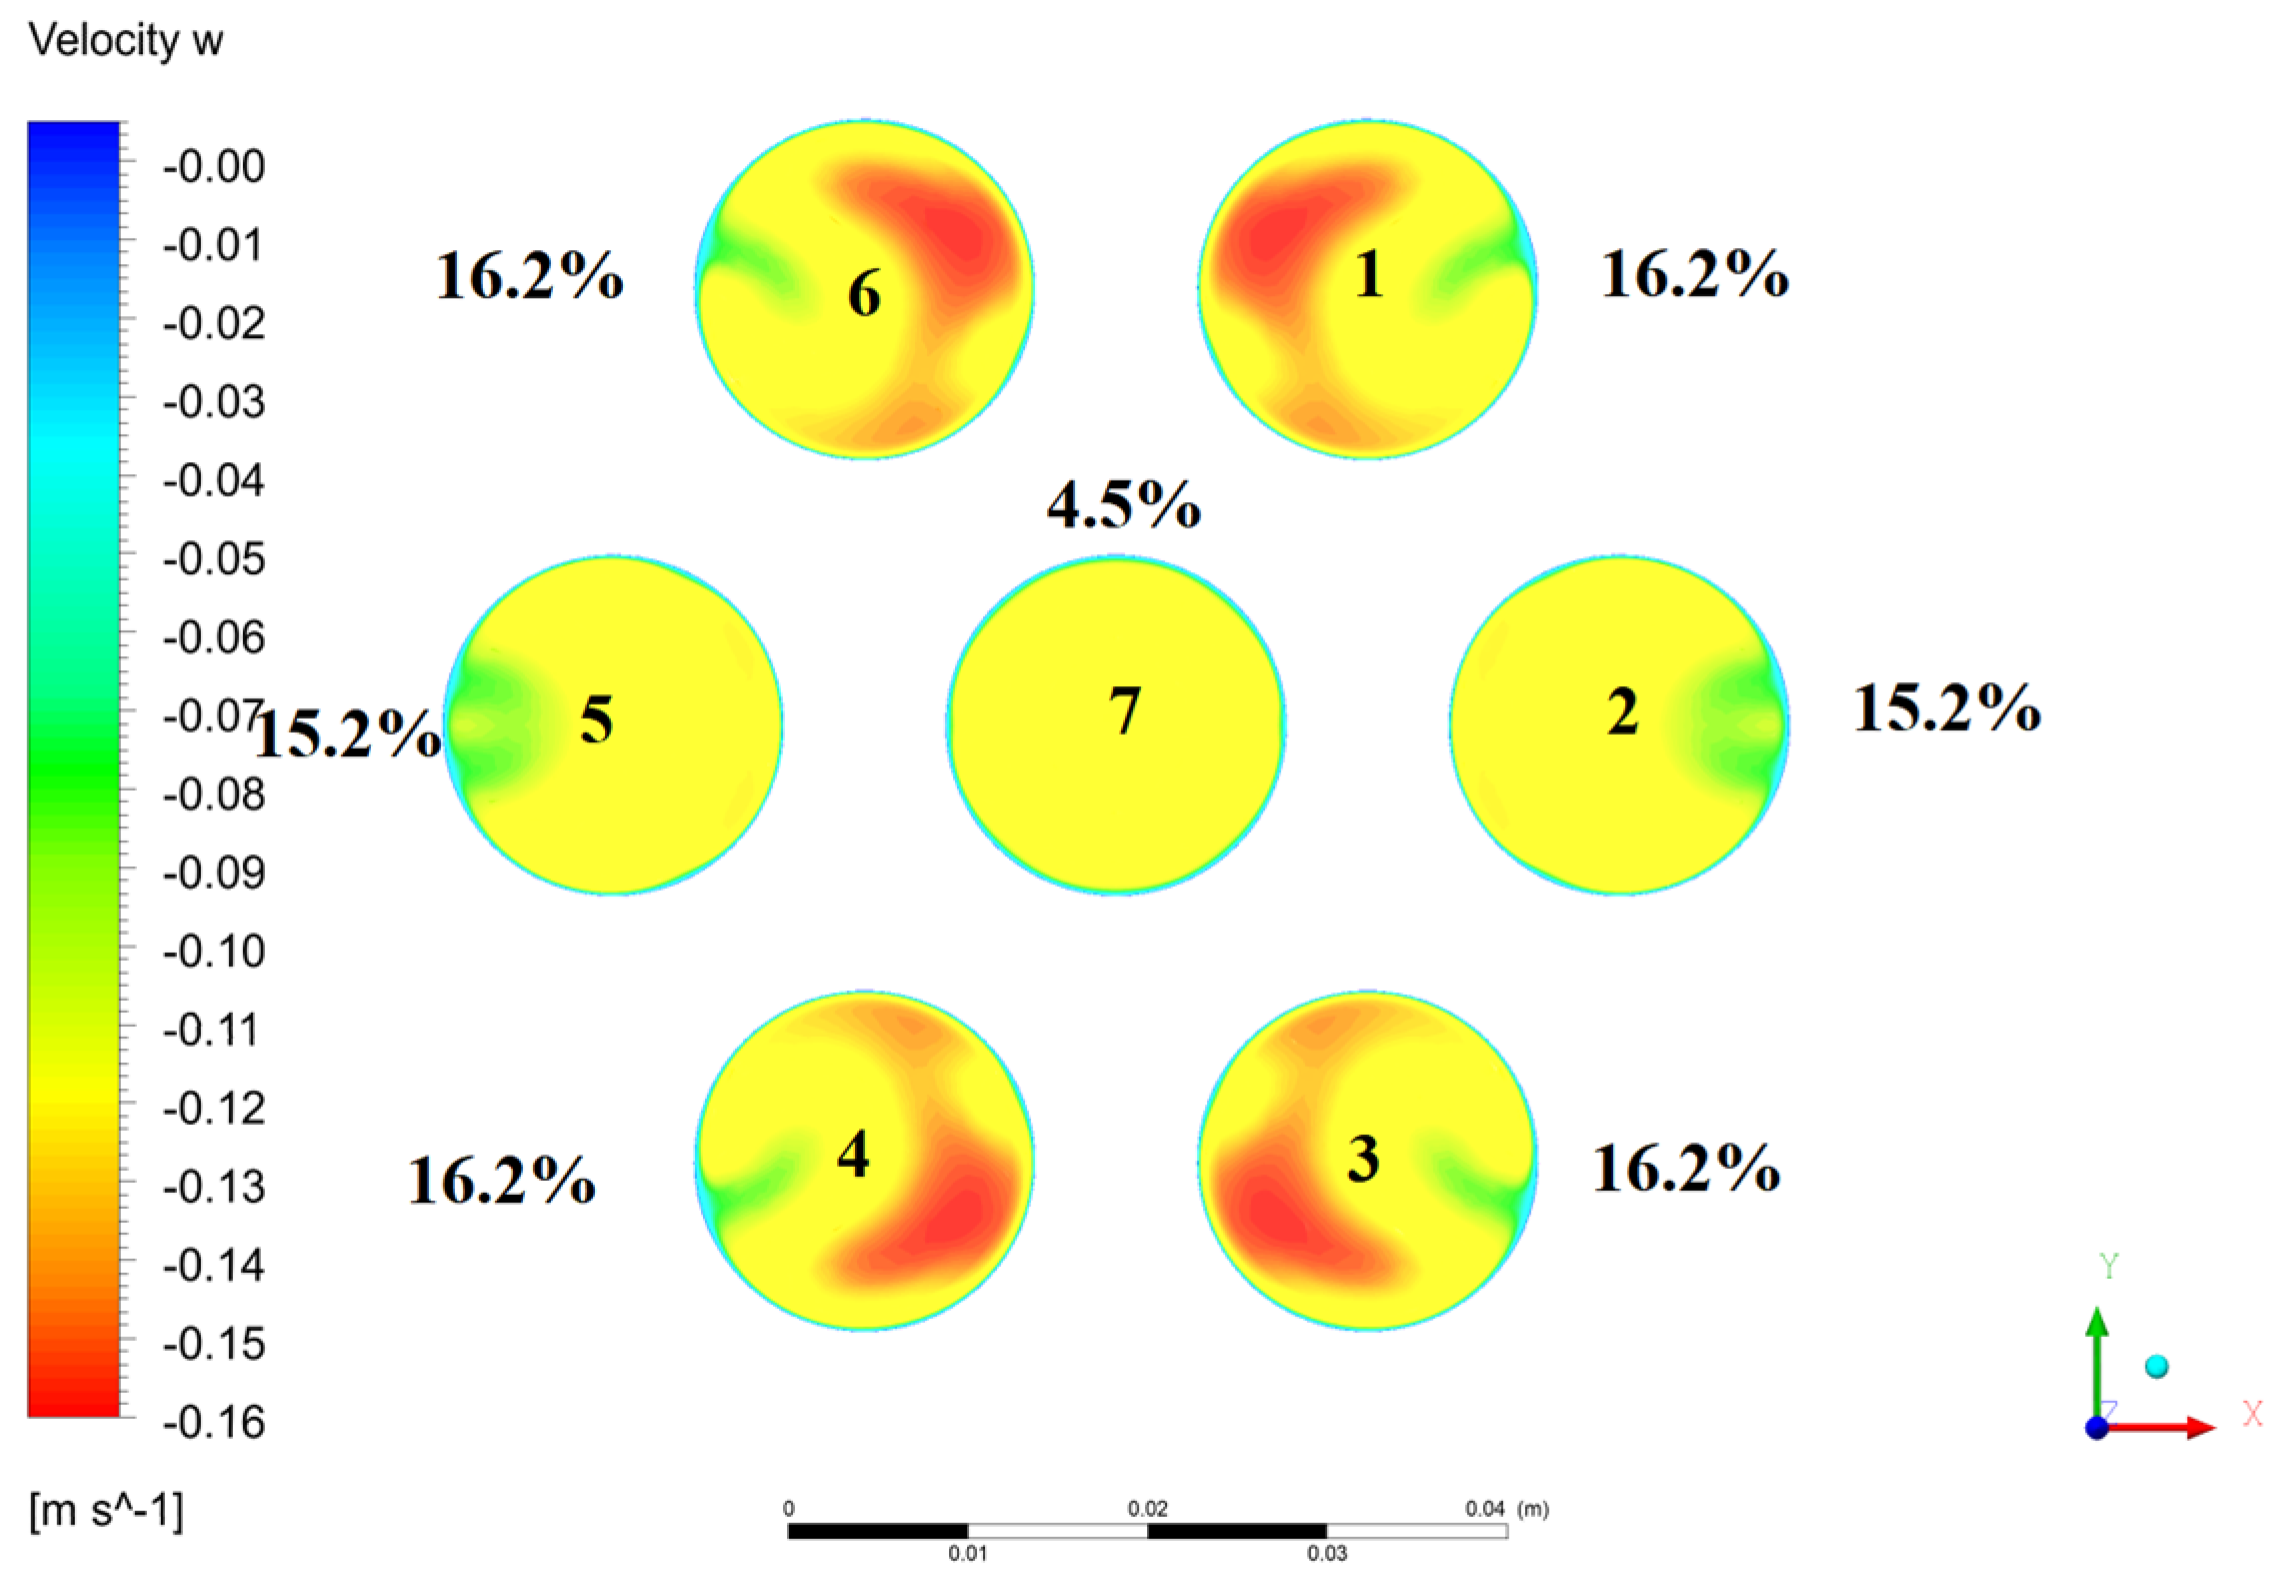
It is expected that reactor cooling systems (e.g., pressurized water reactor, small modular reactor) have unidentical mass flow rate in the similar sections within the core [34,35]. It is also expected to find the same hydraulic behavior in the case of the dual fluid reactor due to the same reasons. Hence, it is important to investigate the mass flow characteristics in the MD. The total mass flow rate of fuel entering the core is around 0.305 kg/s in each of the two fuel inlets, making up to 0.61 kg/s total inlet mass flow rate. Ideally, the mass flow rate is distributed equally in all pipes; however, due to the turbulence caused by the strong mixing in the distribution and collection zones, the pressure and velocities at the pipes entrances and exits are different depending on the location of the pipe. In Figure 10, the velocity contours (in z-direction) of the fuel in the middle core zone are illustrated together with the percentages of the mass flow rate in each pipe. Simultaneously, Table 4 shows the values of the mass flow rate value in each pipe.
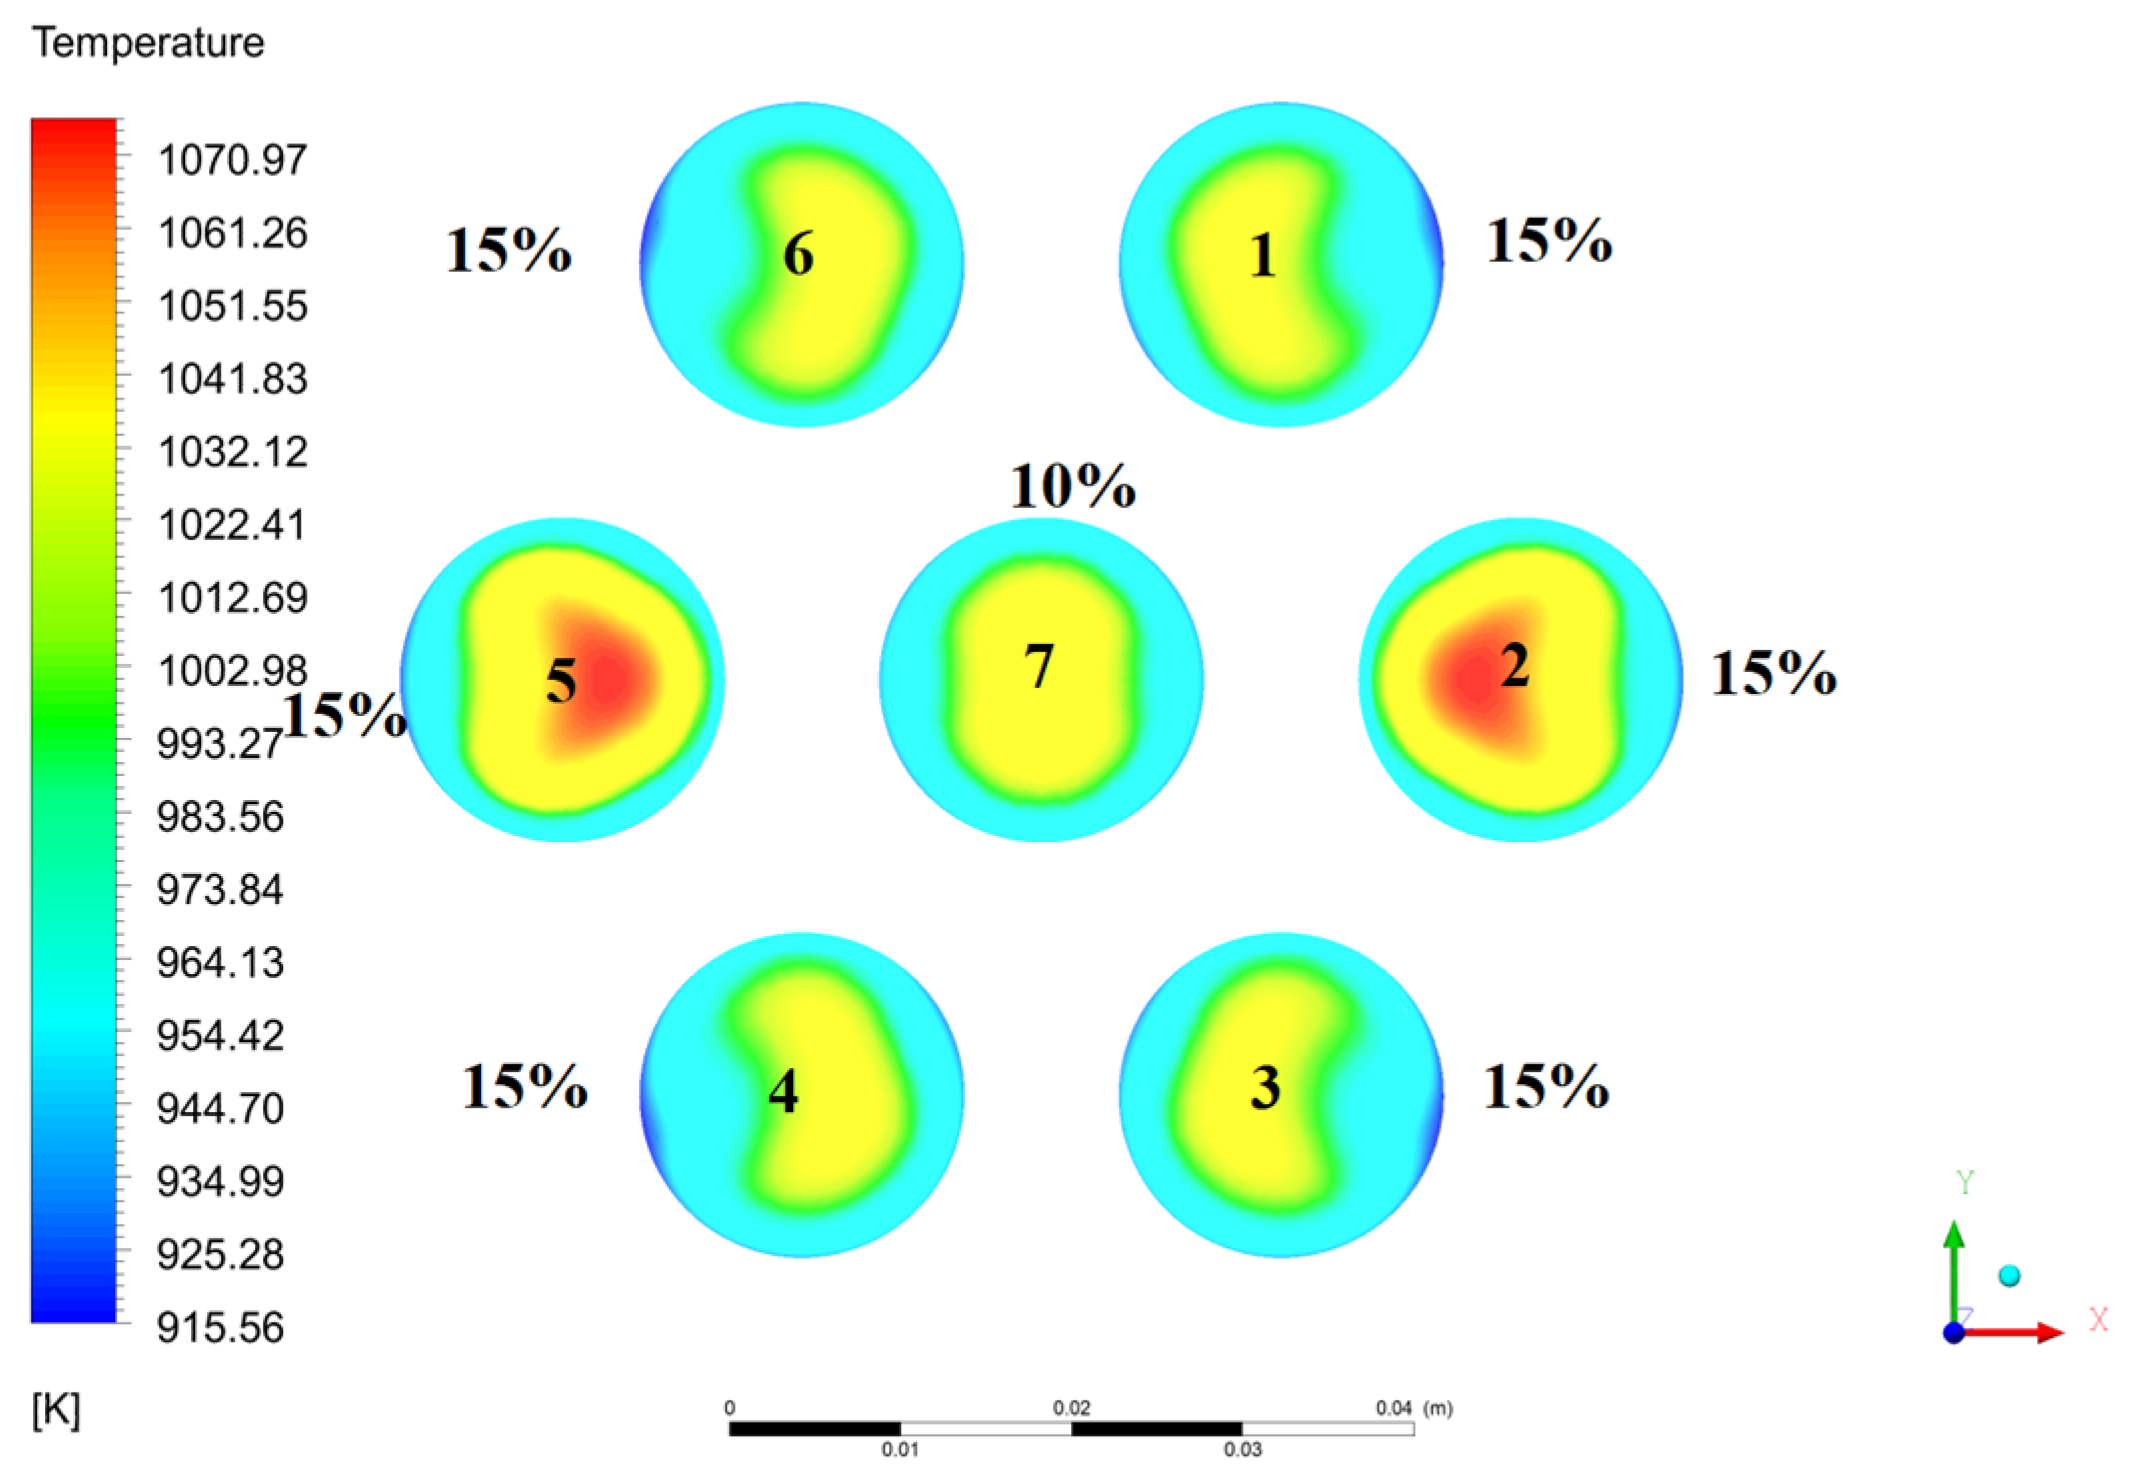
The global heat transfer from the fuel to the coolant inside the core is affected by the mass flow rate in each pipe during operation (see Figure 11). For these nominated conditions, the heat transfer rates in both X and Y pipe groups have close values. As expected, the heat transfer in group Z (pipe 7) has a lower heat transfer rate compared to the other lateral pipes. Knowing that the mass flow rate in this pipe is the lowest among other pipes, this results in the decreases of the convective heat transfer leading to a low heat transfer rate. However, due to the high inlet temperature of this pipe, the heat transfer is higher than expected taking the mass flow rate percentage in the same pipe (Table 5).

3.2. Local Characteristics

3.2.1. Velocity and Contours Plots

Fuel Contour Plots

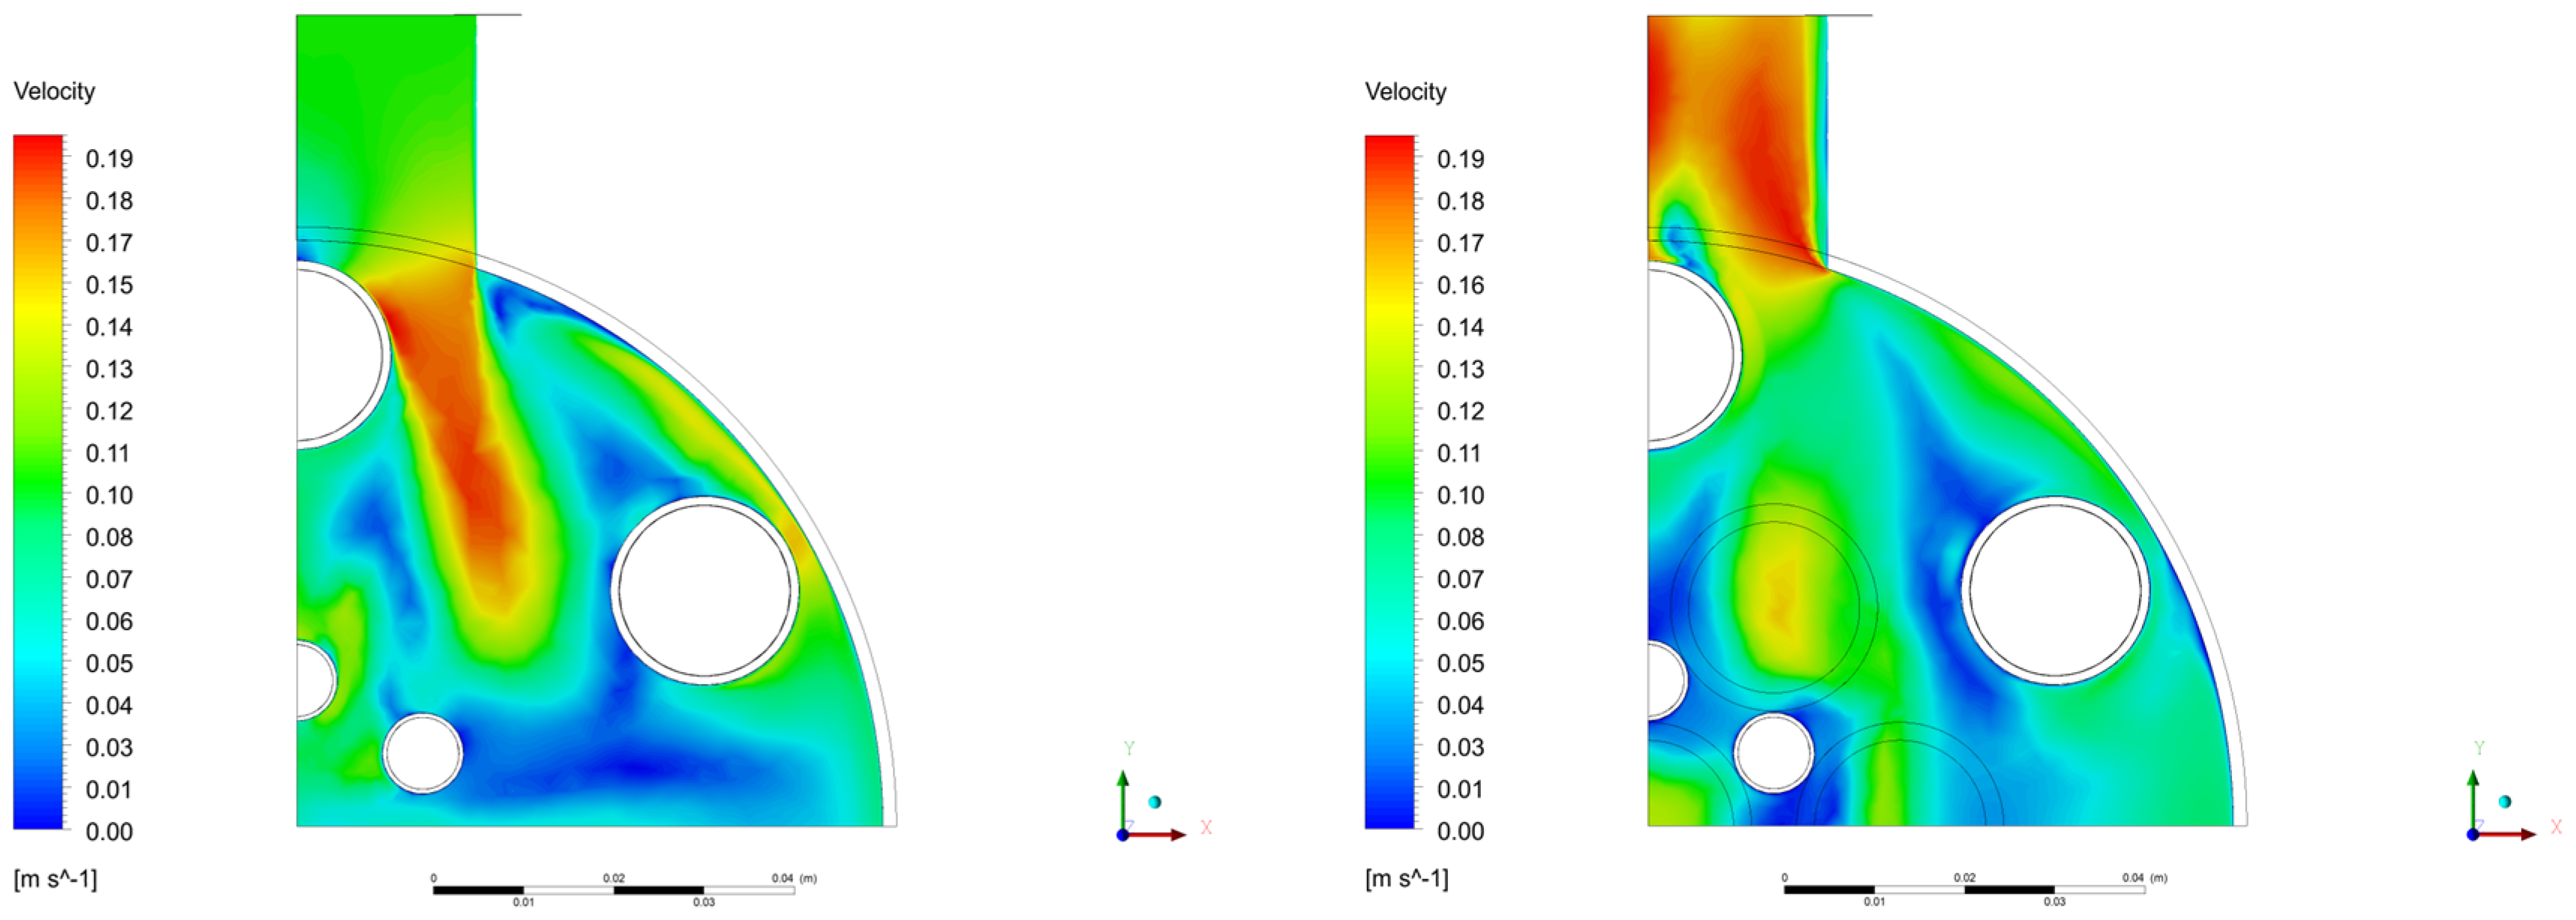
Existence of turbulence in the core of any reactor has an important role for the heat transfer analysis as well as the structure requirements [36], especially when it comes to heavy liquid metals. Below the velocity contour plots of fuel by the inlets and outlets, there is also the eddy viscosity ratio (turbulent viscosity/molecular viscosity) which indicates mostly turbulent flow above the value of 100 [37]. Figure 12 shows the velocities range in the inlet sections in both vertical (plan A) and horizontal (plan C1) sections. It has been observed that by the inlets, the flow area rapidly decreases due to the location of a coolant pipe by the flow frontal area, which increases the velocity causing it to reach up to 0.14 m/s compared to the maximum inlet velocity which was 0.1 m/s; however, it loses the high velocity later once the flow passes the pipe. As the value of the turbulent viscosity ratio is connected to the turbulent viscosity value, which is mainly dominated by momentum transfer due to mixing, a high value of eddy viscosity ratio was found to be in different locations in the distribution zone due to the high mixing caused by the existence of several coolant pipes perpendicular to the fuel inlet flow direction.
The existence of turbulence in the core of any reactor plays a crucial role in heat transfer analysis and structural requirements [36], particularly when heavy liquid metals are involved. The velocity contour plots of fuel at the inlets and outlets, as well as the eddy viscosity ratio (turbulent viscosity/molecular viscosity), which primarily indicates turbulent flow above a value of 100 [37], are shown below.
It was observed that near the inlets, the flow area rapidly decreases due to the presence of a coolant pipe within the frontal area, leading to an increase in velocity reaching up to 0.14 m/s compared to the maximum inlet velocity of 0.1 m/s. However, the velocity decreases after the flow passes the pipe. The turbulent viscosity ratio is closely related to the turbulent viscosity, which is predominantly influenced by momentum transfer resulting from mixing. Therefore, high values of the eddy viscosity ratio were observed at various locations within the distribution zone due to the intense mixing caused by the presence of several coolant pipes perpendicular to the fuel inlet flow direction.
The velocity in the inlet pipes were found to have a reversed flow from the distribution zone. This is due to the high resistance of the flow caused by the 12 coolant pipes, as well as the short inlet pipe inlet in the simulation. This observation might be minimized if the inlet pipes were to be longer as in the real case; however, this would add a significant cost to the computational load.
Contrarily to the inlet, the outlet flow velocity tends to increase in the outlet pipe driven by the high momentum gained during the flow path from inlet to the outlet through the core. This makes sense, given that the maximum velocity of the outlet is around 0.1 m/s, which does not exceed the inlet velocity value (Figure 13).

Coolant Contours Plots

Similar to the fuel inlet, a parabolic velocity profile at the coolant inlet boundary condition was set. Through 12 pipes, the coolant is transferred from the inlet to the core (see Figure 14) entering in higher velocities (Figure 14). The velocity starts to gradually decrease along the core length, keeping the area facing the pipes entrances at relatively higher velocities than the other areas within the coolant, which gradually blend up with the whole coolant flow velocity in the core.
By the coolant exiting the core through a similar 12 pipes, the velocity regains a part of its speed once more just before entering the smaller cross section areas of the exit pipes (Figure 14), where in the pipe, the velocity continues to increase to leave the core passing the collection zone in the coolant pipes. Finally, it exits with higher speed concentrated in front of the coolant pipes to the end of the model.
As shown in Figure 14, the coolant flow area suffers a sudden area decrease in the distribution zone before entering the core, And similarly in the collection zone before exiting. In both cases, the sudden area reduction leads to higher velocity in the center of the pipes, surrounded by turbulence which can be observed in the form of high eddy viscosity while in the center, the values are much lower. Due to the no-slip condition, the flow has low eddy viscosity values in the thin layers near the inner pipe circumference.

3.2.2. Temperature Contour Plots

Fuel Temperature Contour Plots

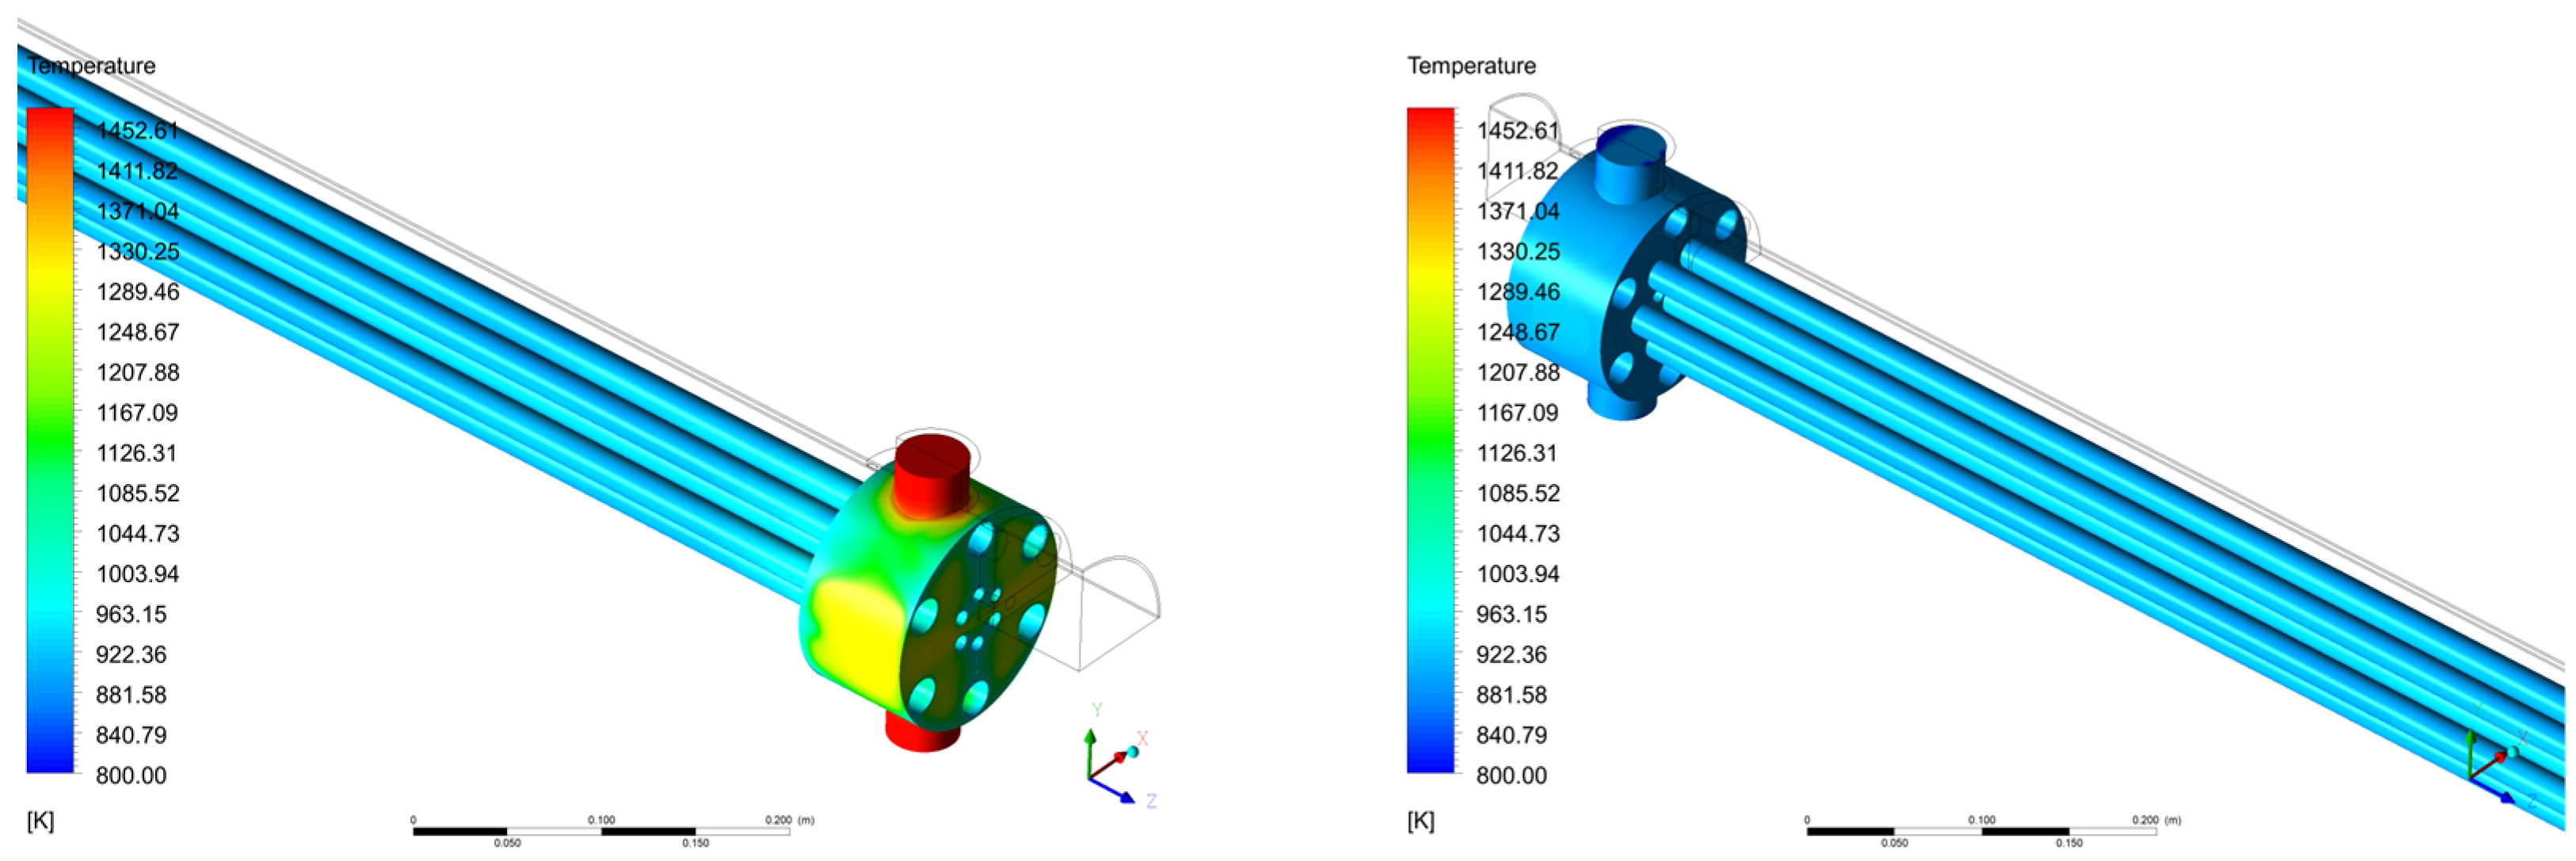
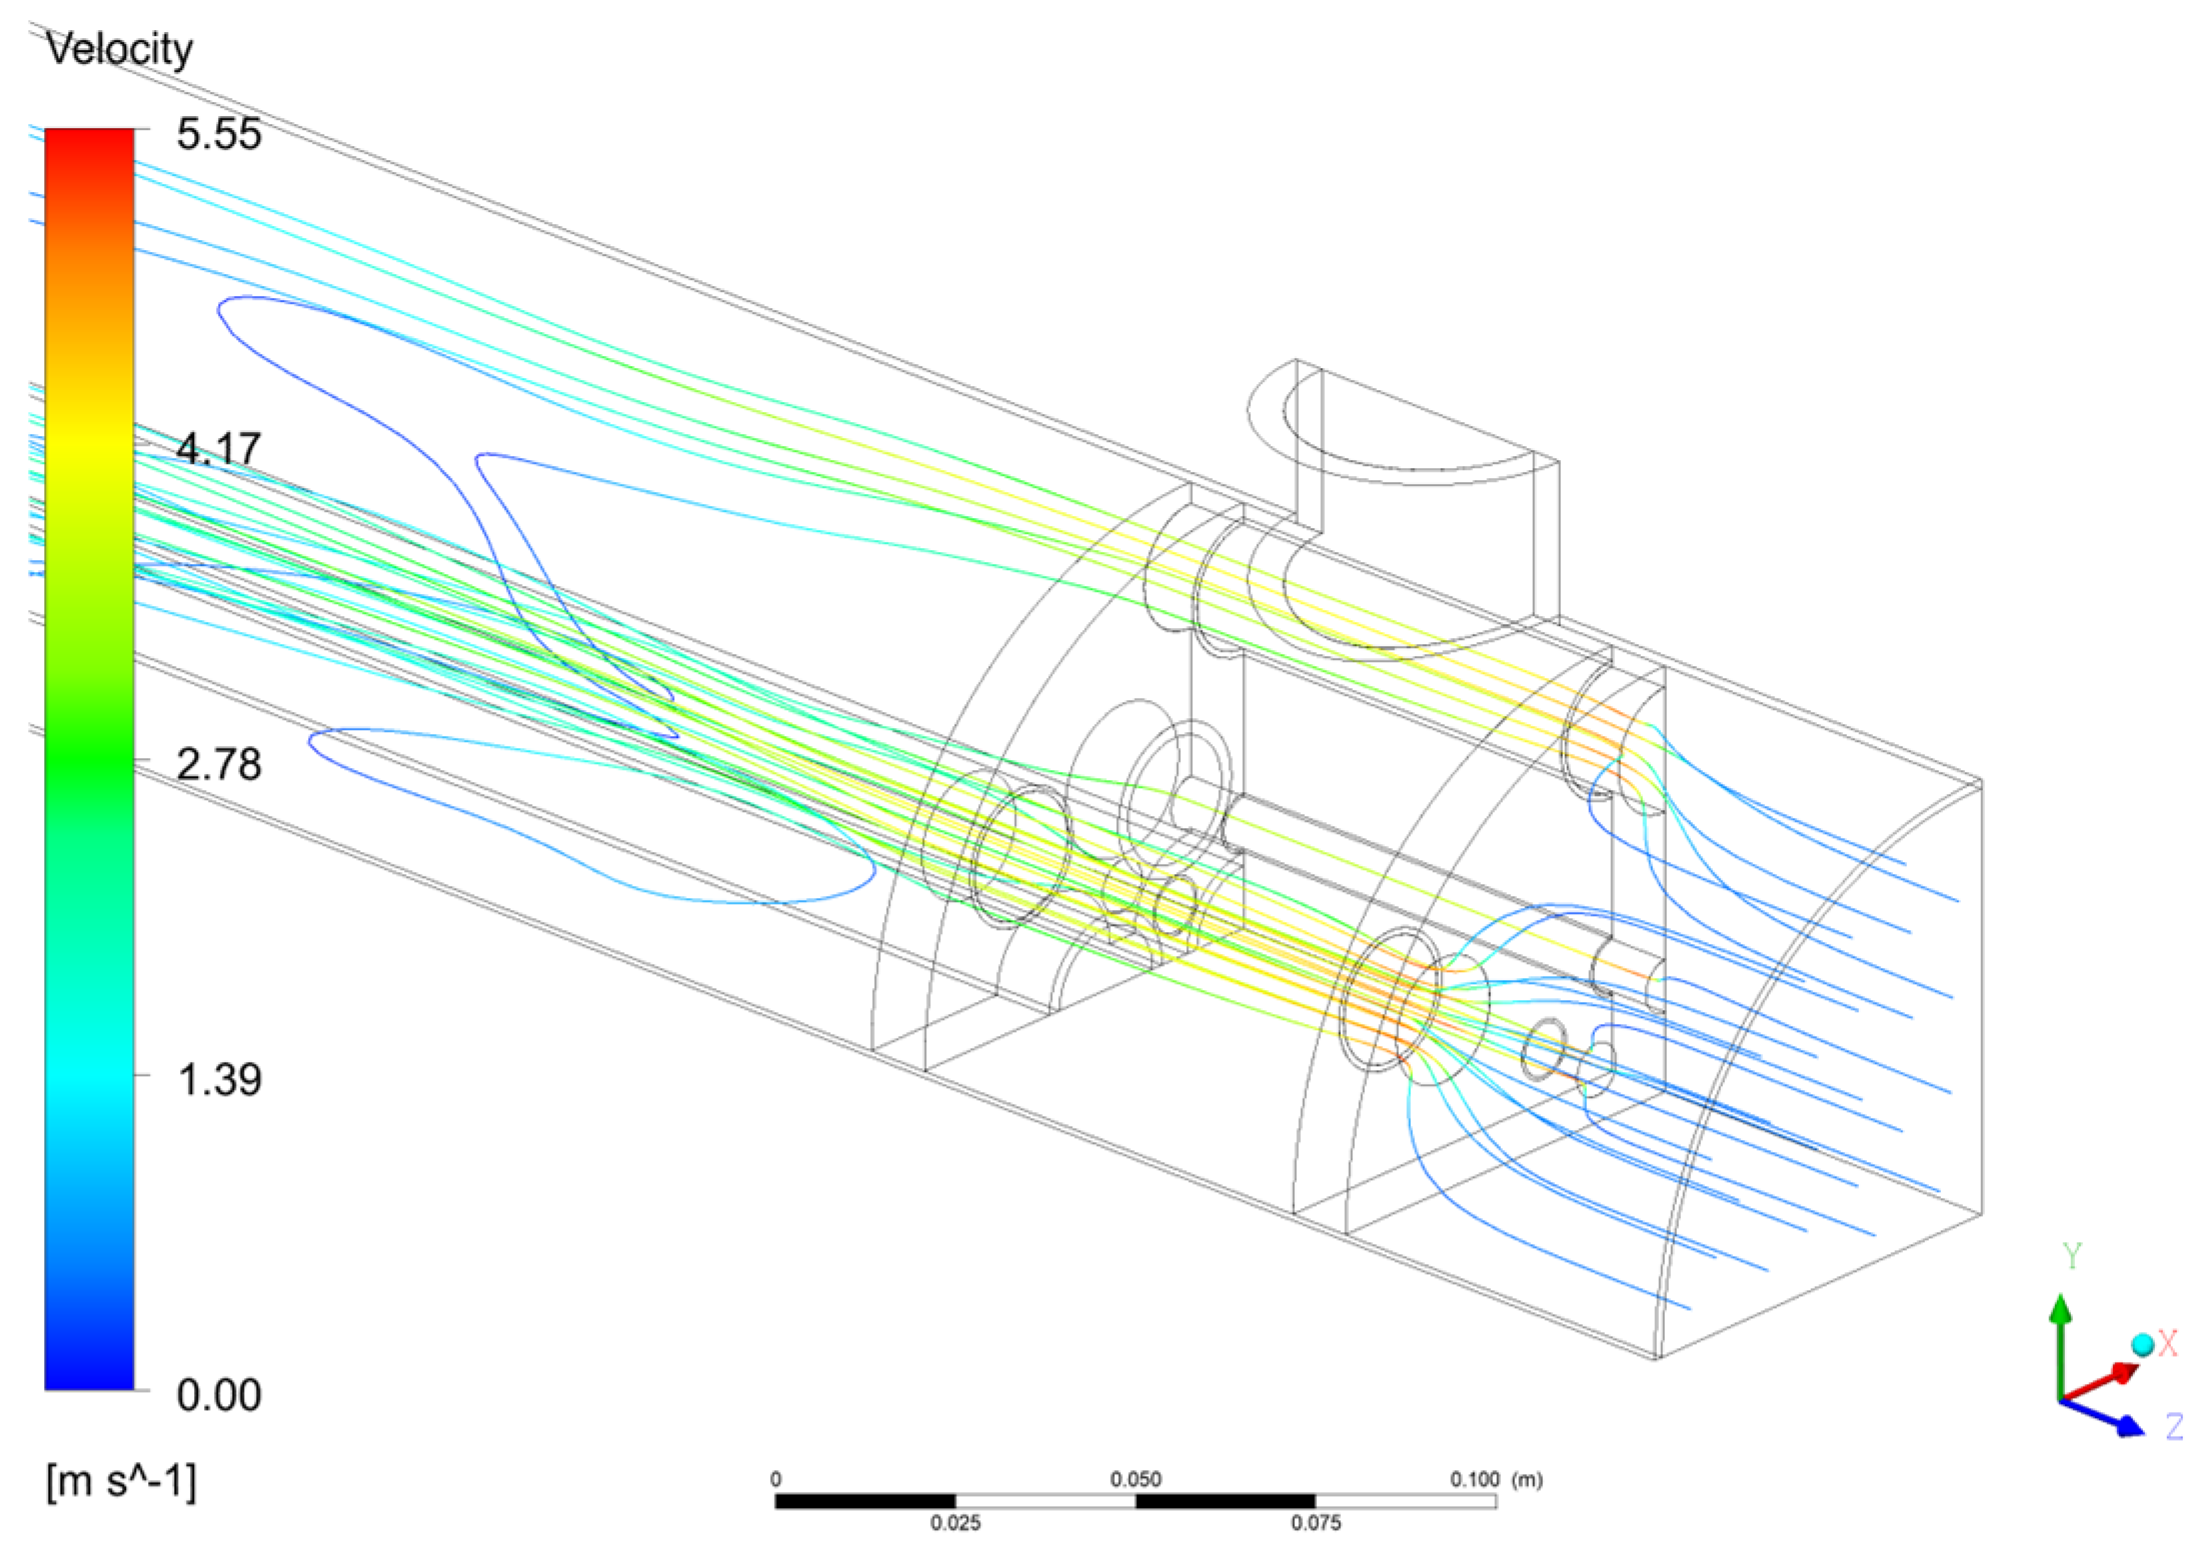
The fuel enters from the two entrances to the distribution zone with the highest nominal temperature in the designed model 1473 K. The fuel loses some of its heat within the distribution zone due to the large temperature difference between the fuel and the coolant. Additionally, the high turbulence of the fuel flow in the distribution zone resulting from the sharp change in the flow direction from the entrances flow direction and the exit of the distribution zone (entrance of the fuel pipes) which is 90 degrees, as well as the coolant pipes that act as obstacles in the flow stream front, altogether enhance the heat exchange in the zone (Figure 15).
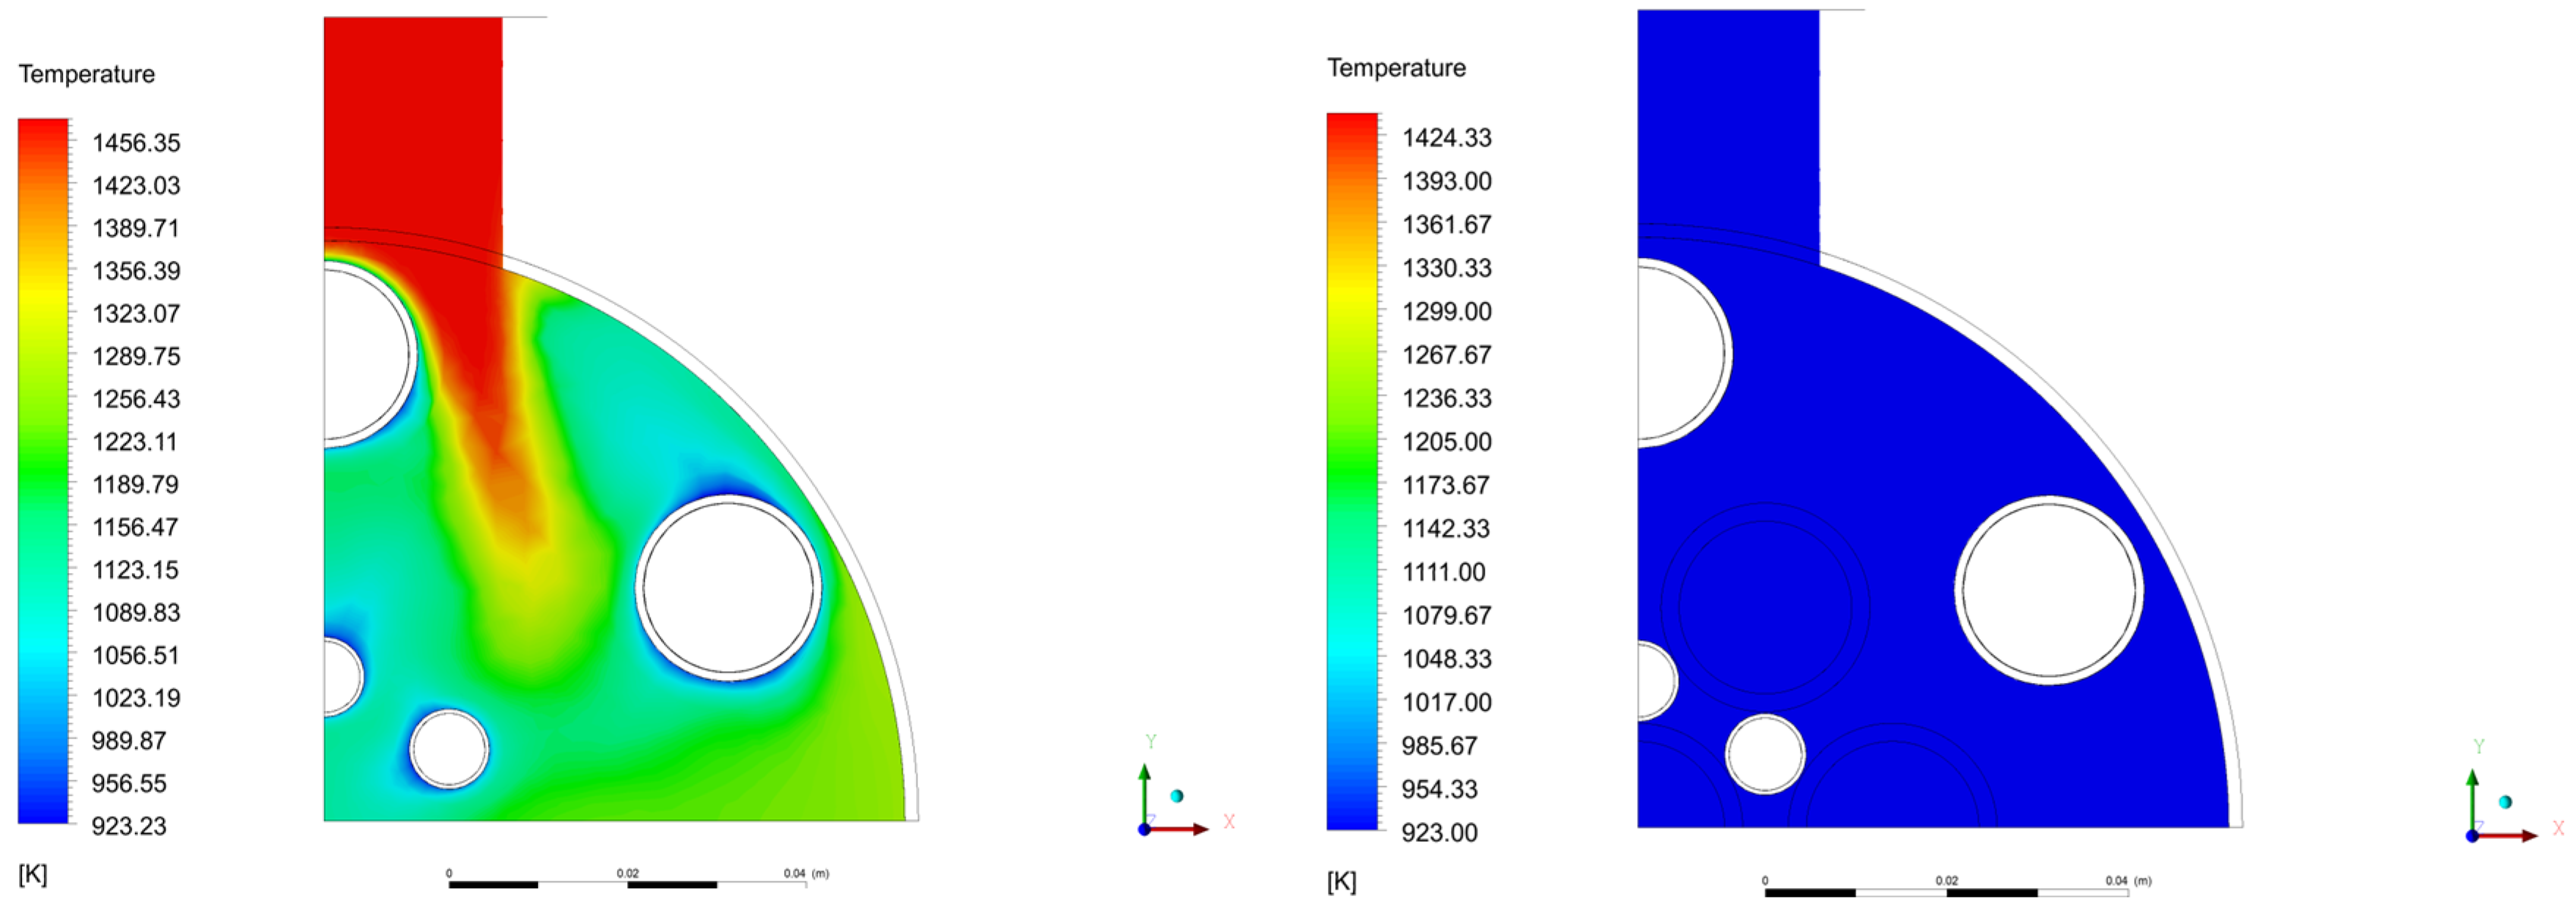
As the high temperature fuel flow faces the coolant pipe just in front of the entrance, it splits into two different streams over the sides of the coolant pipe facing the flow Figure 16. In section C2 (in the distribution zone), the fuel showed a significant temperature variation between 1020 and 1470 K (~450 degrees) due to the enhanced heat transfer as mentioned earlier. In contrast, a relatively small temperature variation is in plan C1 section (the collection zone), which is in the range between 849 and 883 K (~35 degrees). The differences between the two contours in the figure is due to the heat transfer occurring in the three stages of the MD (distribution zone, middle core zone, and the collection zone), resulting in a consistent temperature at the exit.

Coolant Temperature Contour Plots

At 873 K, the coolant enters from the top inlet area (Figure 17(left)), heading to the coolant pipes to pass the distribution zone then later to the core. In the distribution zone, the coolant inside the pipes gains a significant amount of its heat resulting in increasing of the temperature by around 100 degrees (Figure 17(right)). The coolant enters the core with a non-homogeneous temperature distribution but at the end of the core length and just before exiting the core to the outlet coolant pipes in the collection zone, it reaches a noticeable homogeneous temperature distribution that is biased gradually to the middle of the core where the fuel pipes are located. The temperature distribution in coolant pipes in the collection zone reflects the results obtained in the core, homogeneous distribution biased to the higher temperature by the middle (fuel pipes). Finally, the coolant exits the model in the exit terminal of the mini demonstrator.

3.3. Hot Spots in the Mini Demonstrator

High temperature gradients in reactors can be fatal in some cases where the material’s strength limit has been exceeded. The thermal stresses will cause different expansion strains in different areas of the construction, which can be a reason for element fracture and/or structure failure [38]. Residual creep loading to the core elements can also result from thermal stresses due to the continuous change of temperature non-homogenously [39,40]. Hence, locating such spots has a significant safety importance.
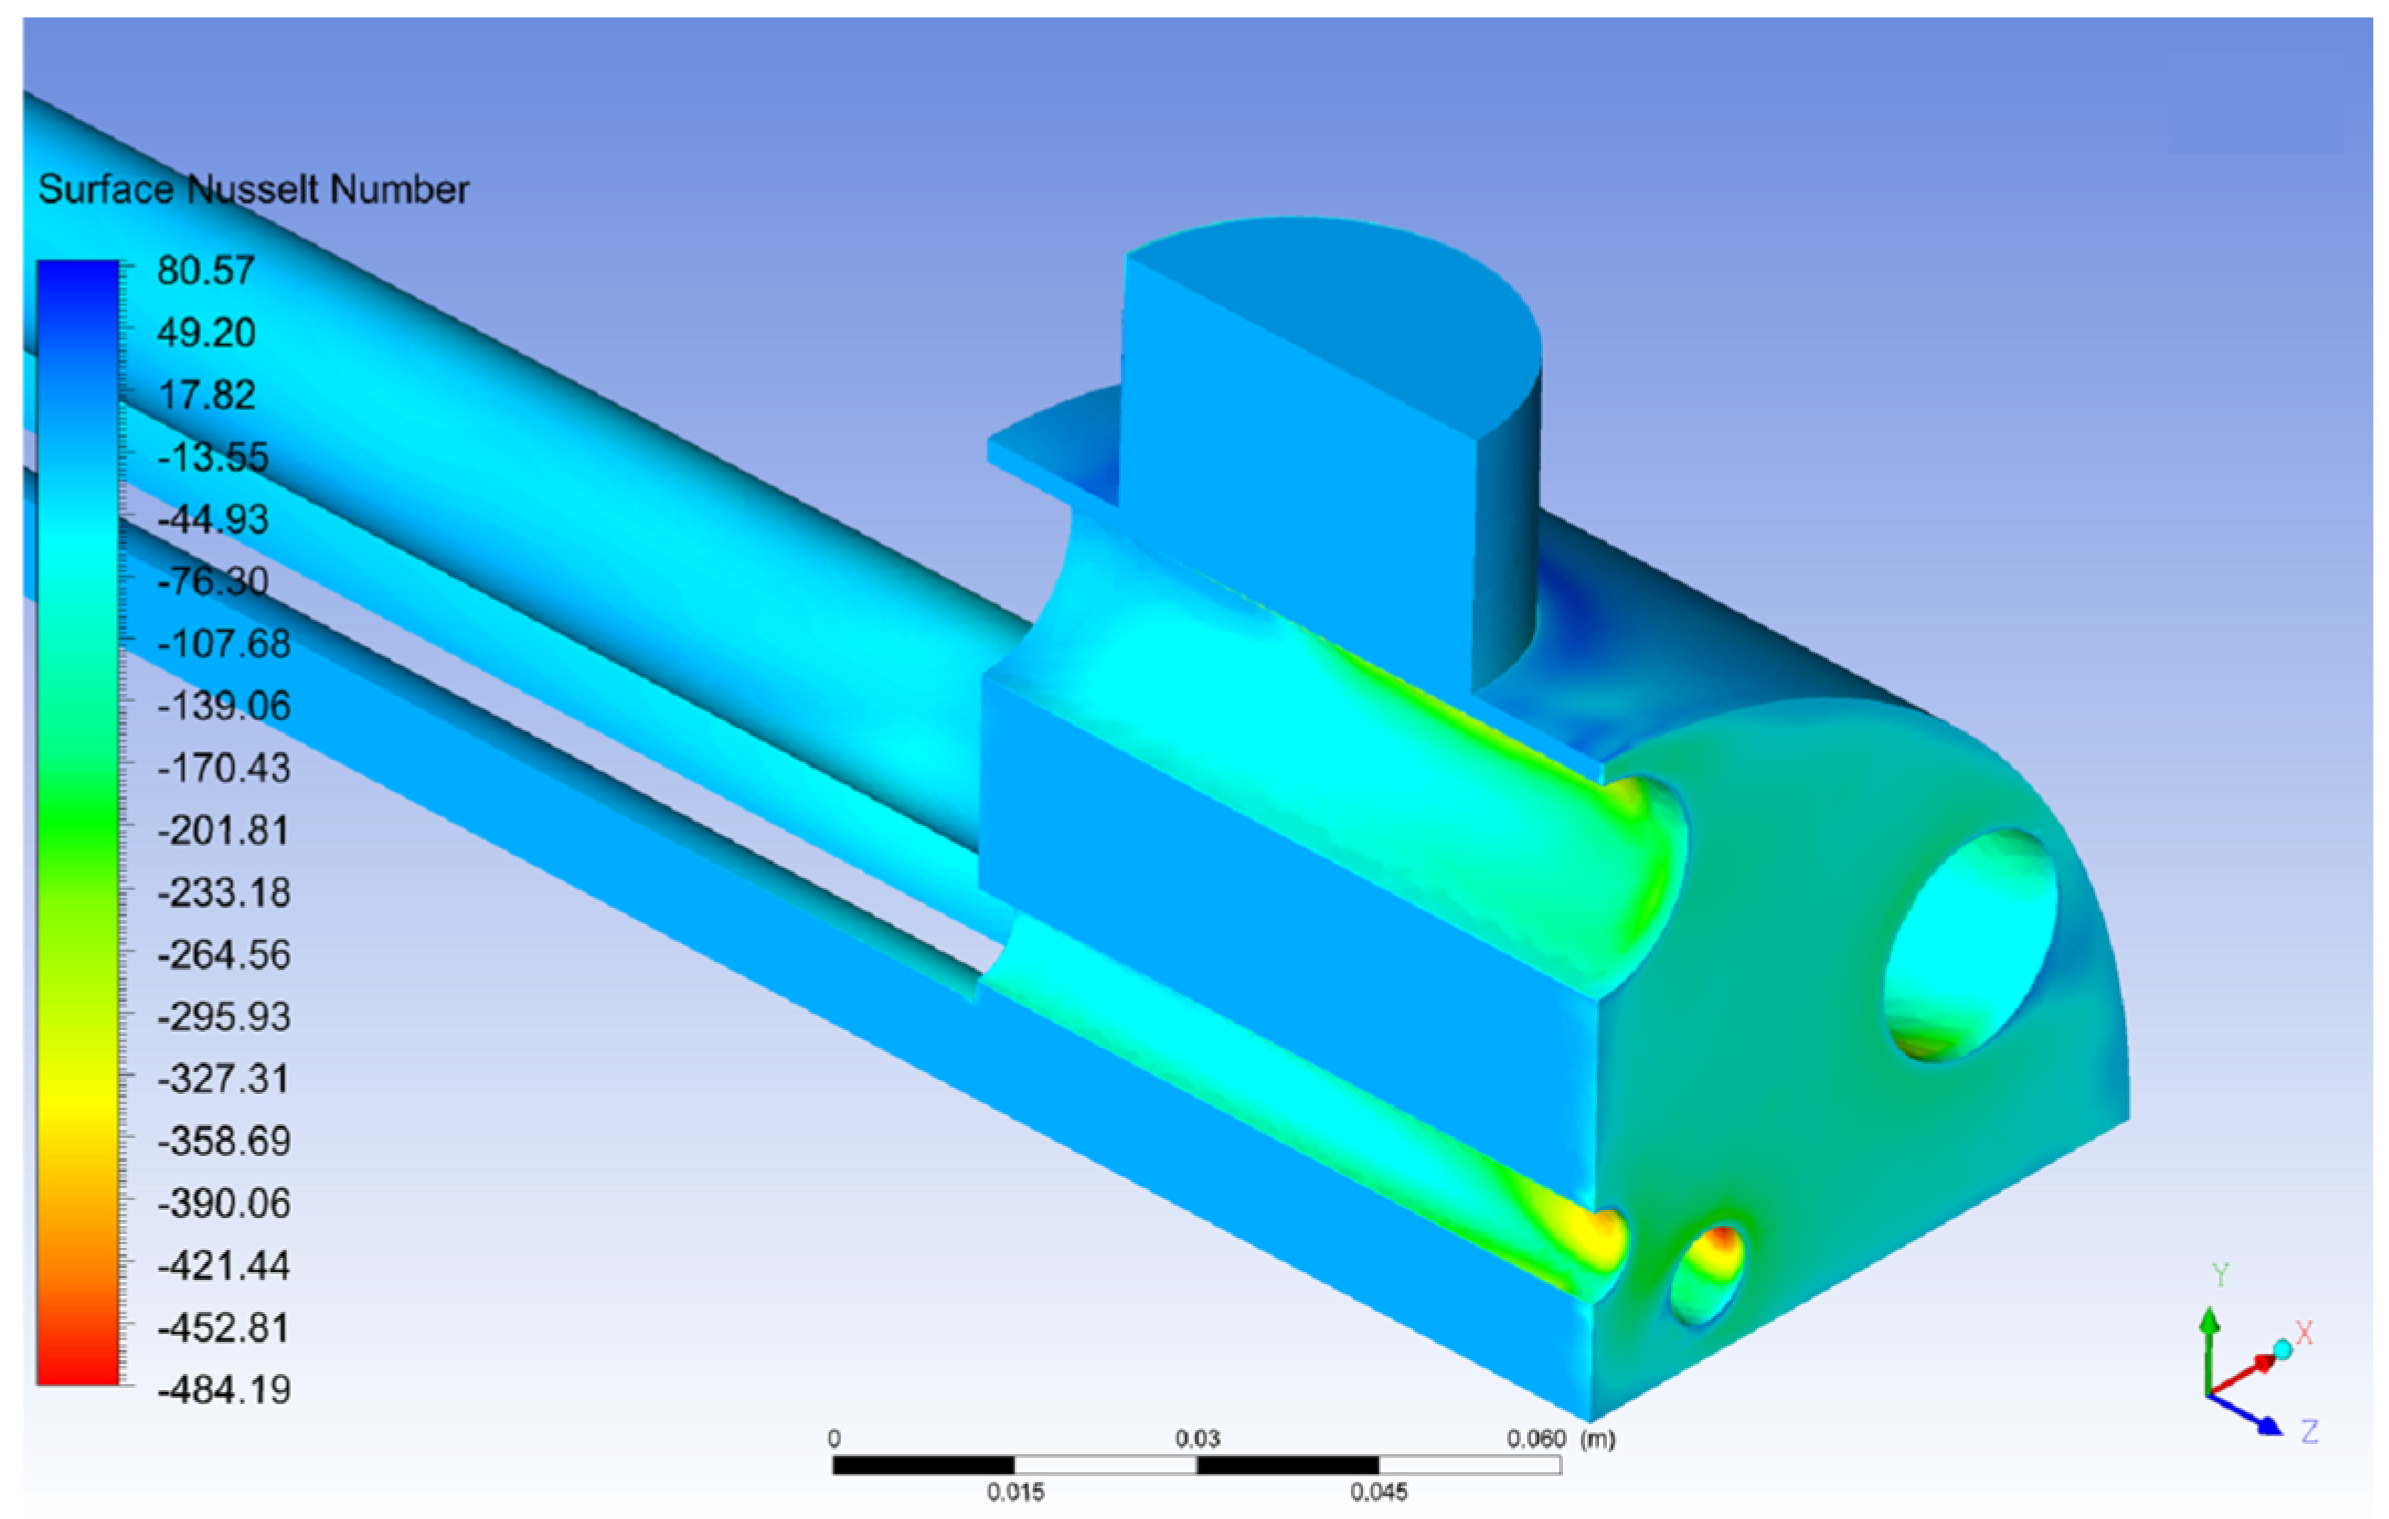
As Nusselt number describes the ratio between two heat transfer methods that are taking place in reactors (convective and conductive heat transfers), it is a point of interest in the current modeled case to recognize this ratio in different locations, especially the locations where high heat transfer is expected so we can have a better understanding of the heat transfer and hot spots in the mini demonstrator as a step to investigate the DFR vessel thermal hydraulics safety analysis. Since the convective heat transfer is strongly bonded to the velocity of the medium flow, the velocity must be seen together with the Nu number distribution. Below, the contour plots for the Nu number values and velocity streamlines side by side in the distribution zone where a high heat transfer rate needs to be investigated closely. The plots were developed for both fuel and coolant.

3.3.1. Fuel Nusselt Number Contour Plots and Streamlines

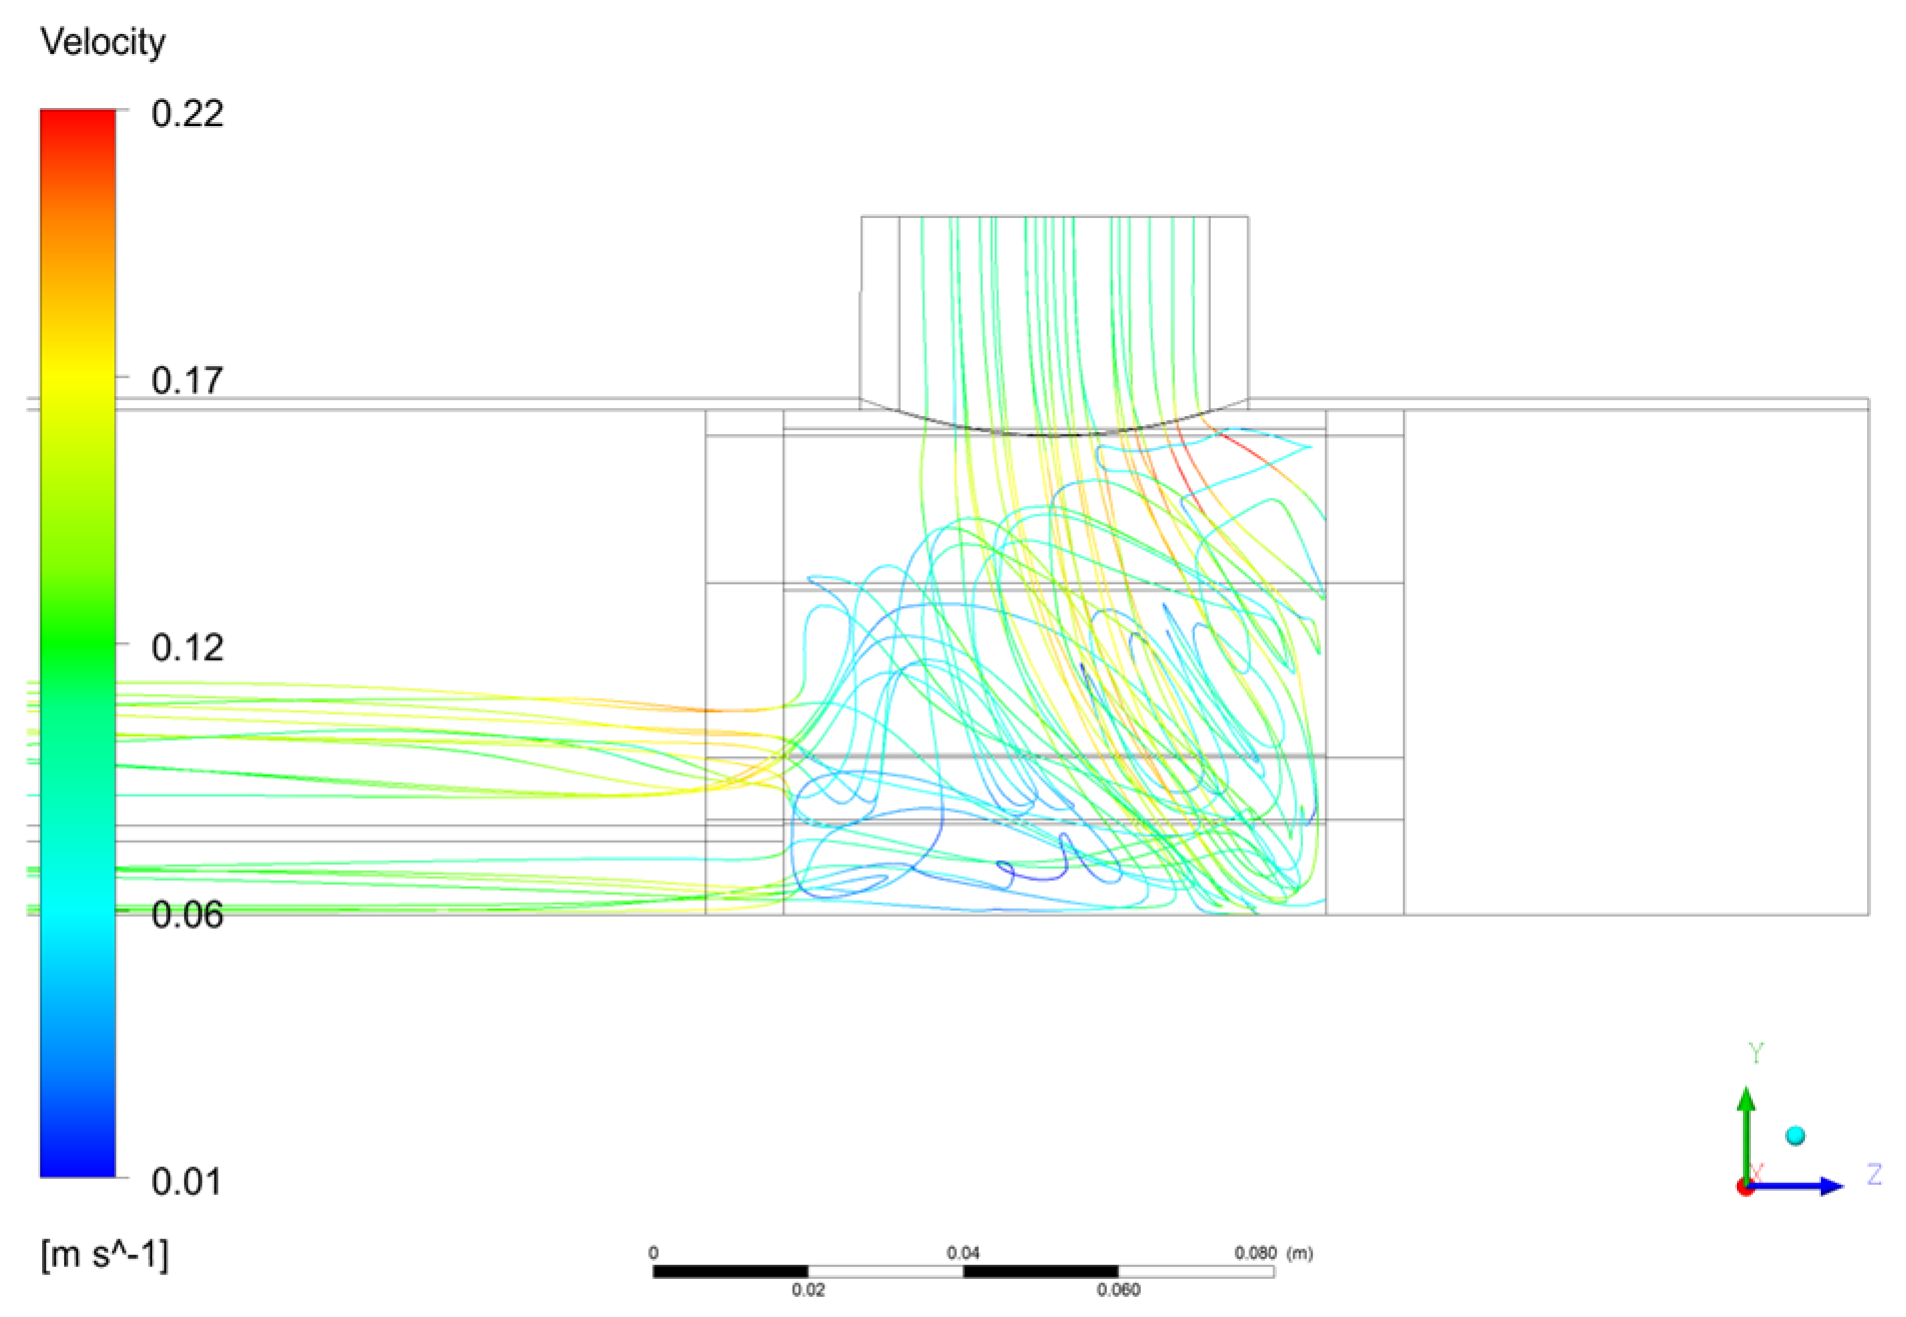
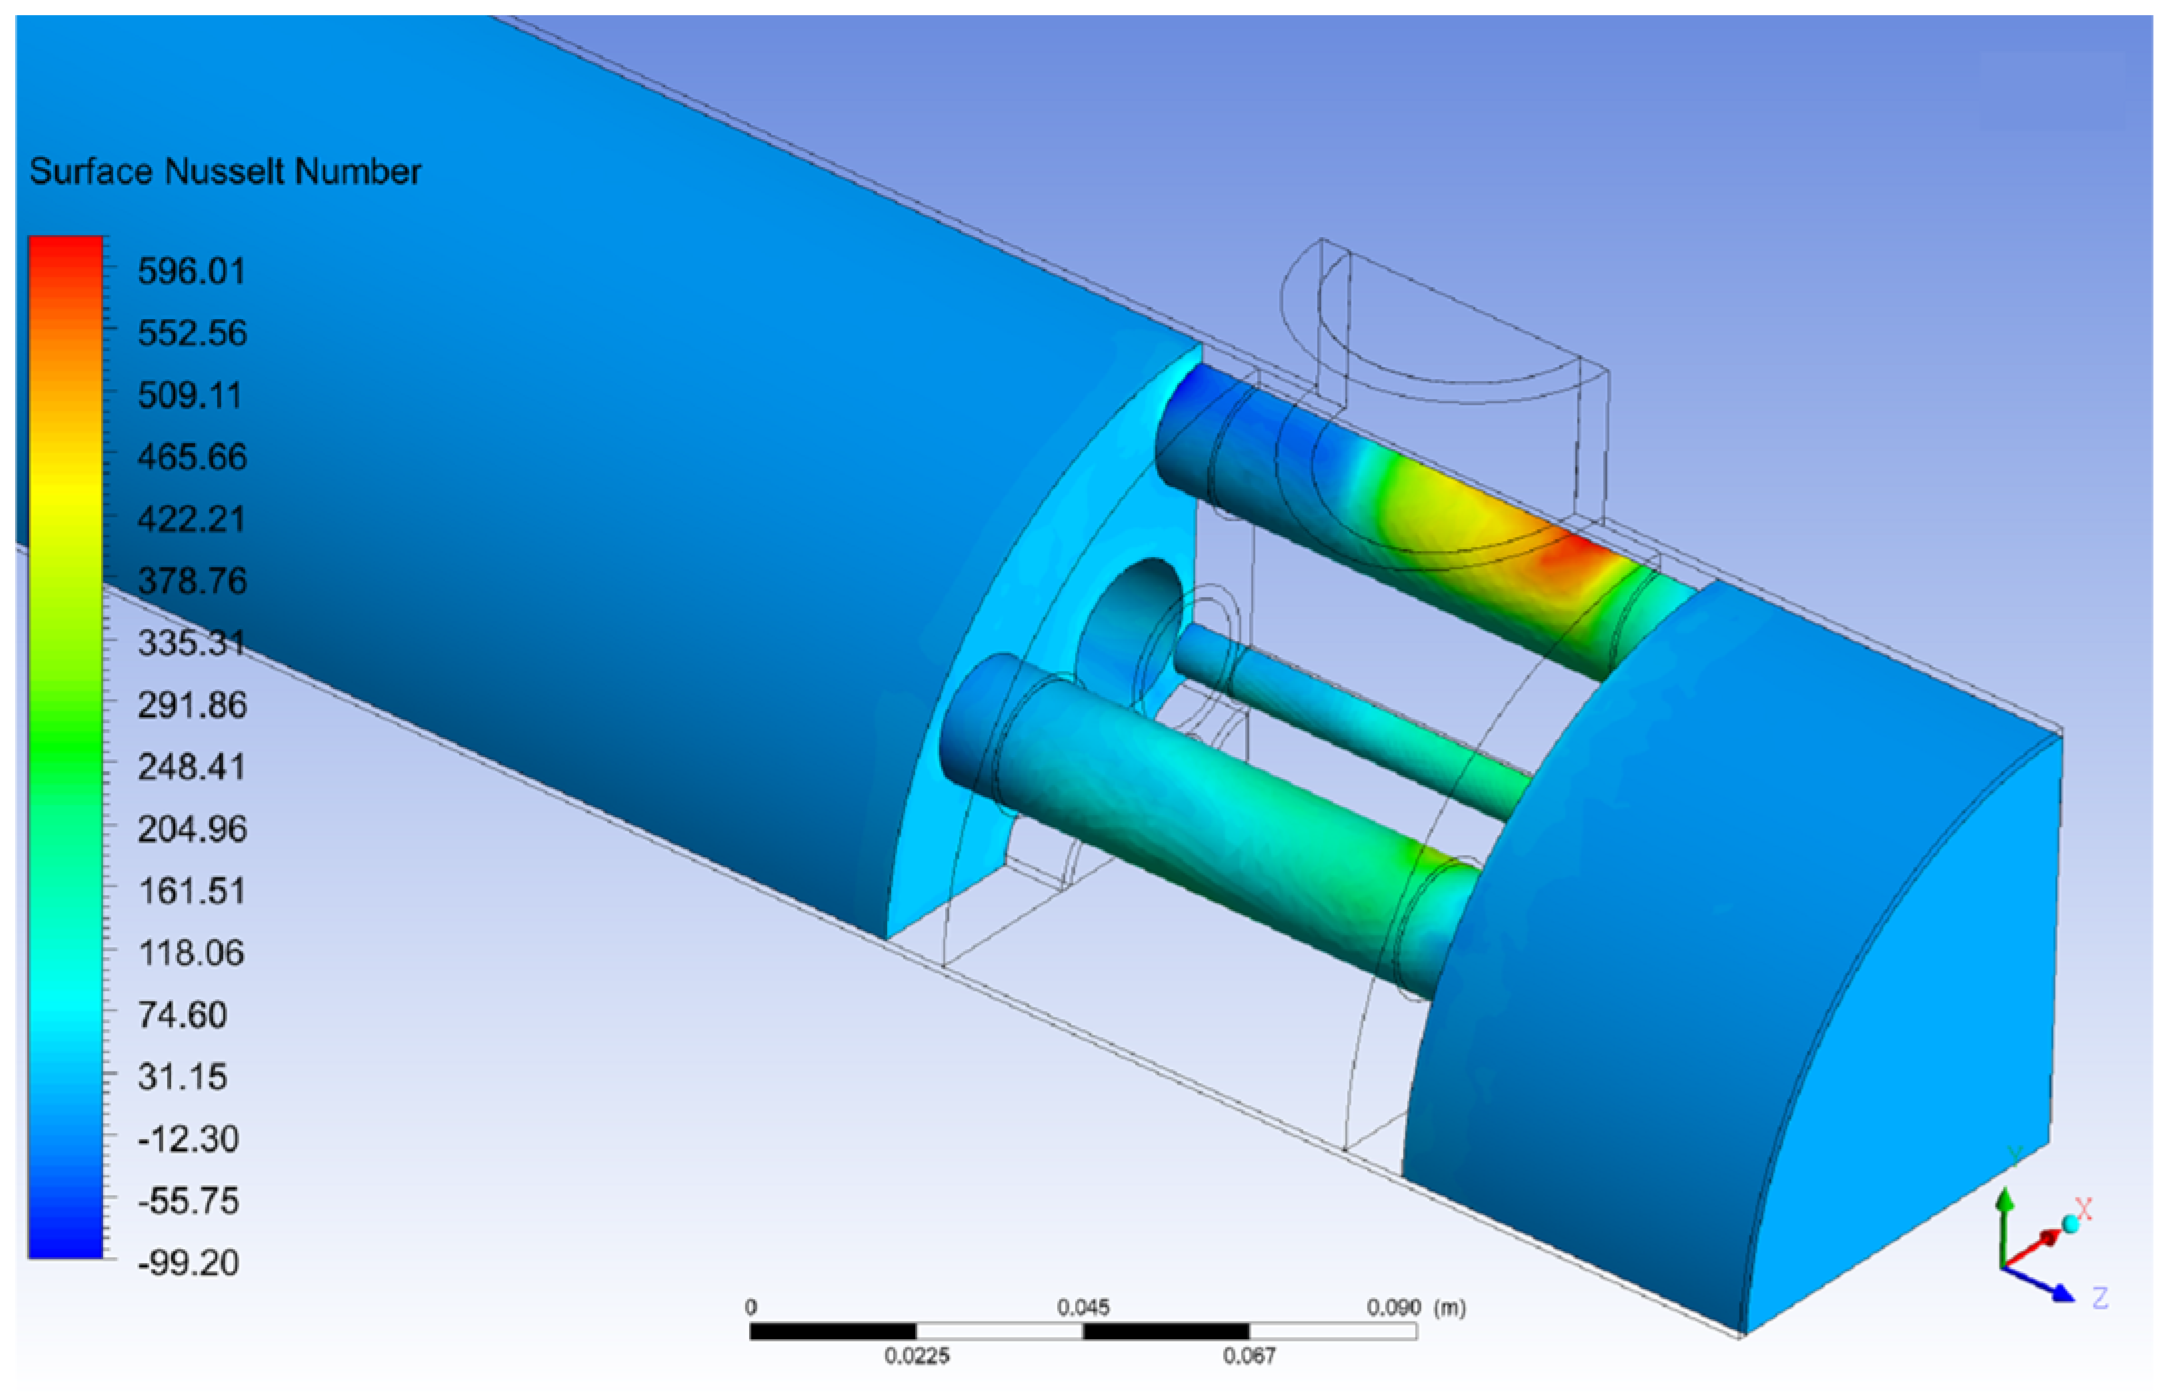
By the first look at the Nu number diagram (Figure 18), one can notice that the highest heat transfer compared to the convective heat transfer expressed in high values of Nu number, are in the upper surface of the coolant pipe, as well as around the two coolant pipes with smaller diameter. Due to the high velocity of the fuel that rapidly increased because of the decrease in the flow area close to the inlet (Figure 19), the convection heat transfer has higher values. The streamlines of the fuel illustrated in the same figure show the effect of the buoyancy forces on the fuel, as the fuel in this area has the highest temperature and the lowest density. This causes the fuel to tend in the upward direction before it enters the fuel pipes located at the bottom of this zone.
On the other hand, around the smaller diameter coolant pipes, the reason for observing the high Nu number is the high turbulence this time, unlike the high velocity in the other pipe with bigger diameter.
The fuel in the core has much lower Nu number values due to the lower velocities and relatively less turbulence. Note the negative values in the Nu number in Figure 18 (inverted rainbow are due to the sign convection used by solver (Ansys Fluent, Canonsburg, PA, USA). It is worth stating that due to the low flow rate and velocity of the fuel (~1.17 kg/s, ~0.1 m/s) compared to the coolant flow rate and velocity (8.5 kg/s, ~0.5 m/s), the value of the heat transfer due to conduction is also significant in case of the fuel because of the slow flow velocity and the longer time spent by the flow boundaries in contact with the surfaces of the coolant pipes as well as the container walls, especially within the distribution zone where the area has the largest value for the fuel domain (lowest velocities).

3.3.2. Coolant Nusselt Number Contour Plots and Streamlines

Similar to the fuel case, the coolant Nu number shows higher values in the same areas compared to other ones for the same reasons mentioned in the fuel case (Figure 20). However, in contrast to the fuel negative values, the coolant Nu number values are mostly positive as the two diagrams used the same sign convection, only here the contour colors are not inverted rainbow.
The Nu number values in the coolant domain in the distribution zone is relatively higher than in those for the fuel (regardless the sign convention). This is due to the previously mentioned fact that the higher velocity (Figure 21) of the coolant accompanied by the higher mass flow rate results in a relatively higher convection heat transfer than the conductive heat transfer in this zone, which leads to a higher Nu number in the same areas than the Nu number values of the fuel in the same spots, taking into consideration the heat transfer through the vessel walls, pipes, and separation desks.
This should be avoided either by the possibility of increasing the number of fuel inlets keeping the total mass flow rate the same, thus decreasing the flow velocity per inlet which will decrease the heat transfer rate over the coolant pipe, hence its temperature. A relocation of the fuel inlet to not face the coolant pipes directly might also be considered.

3.3.3. Q-Criterion of Fuel in Core Pipes

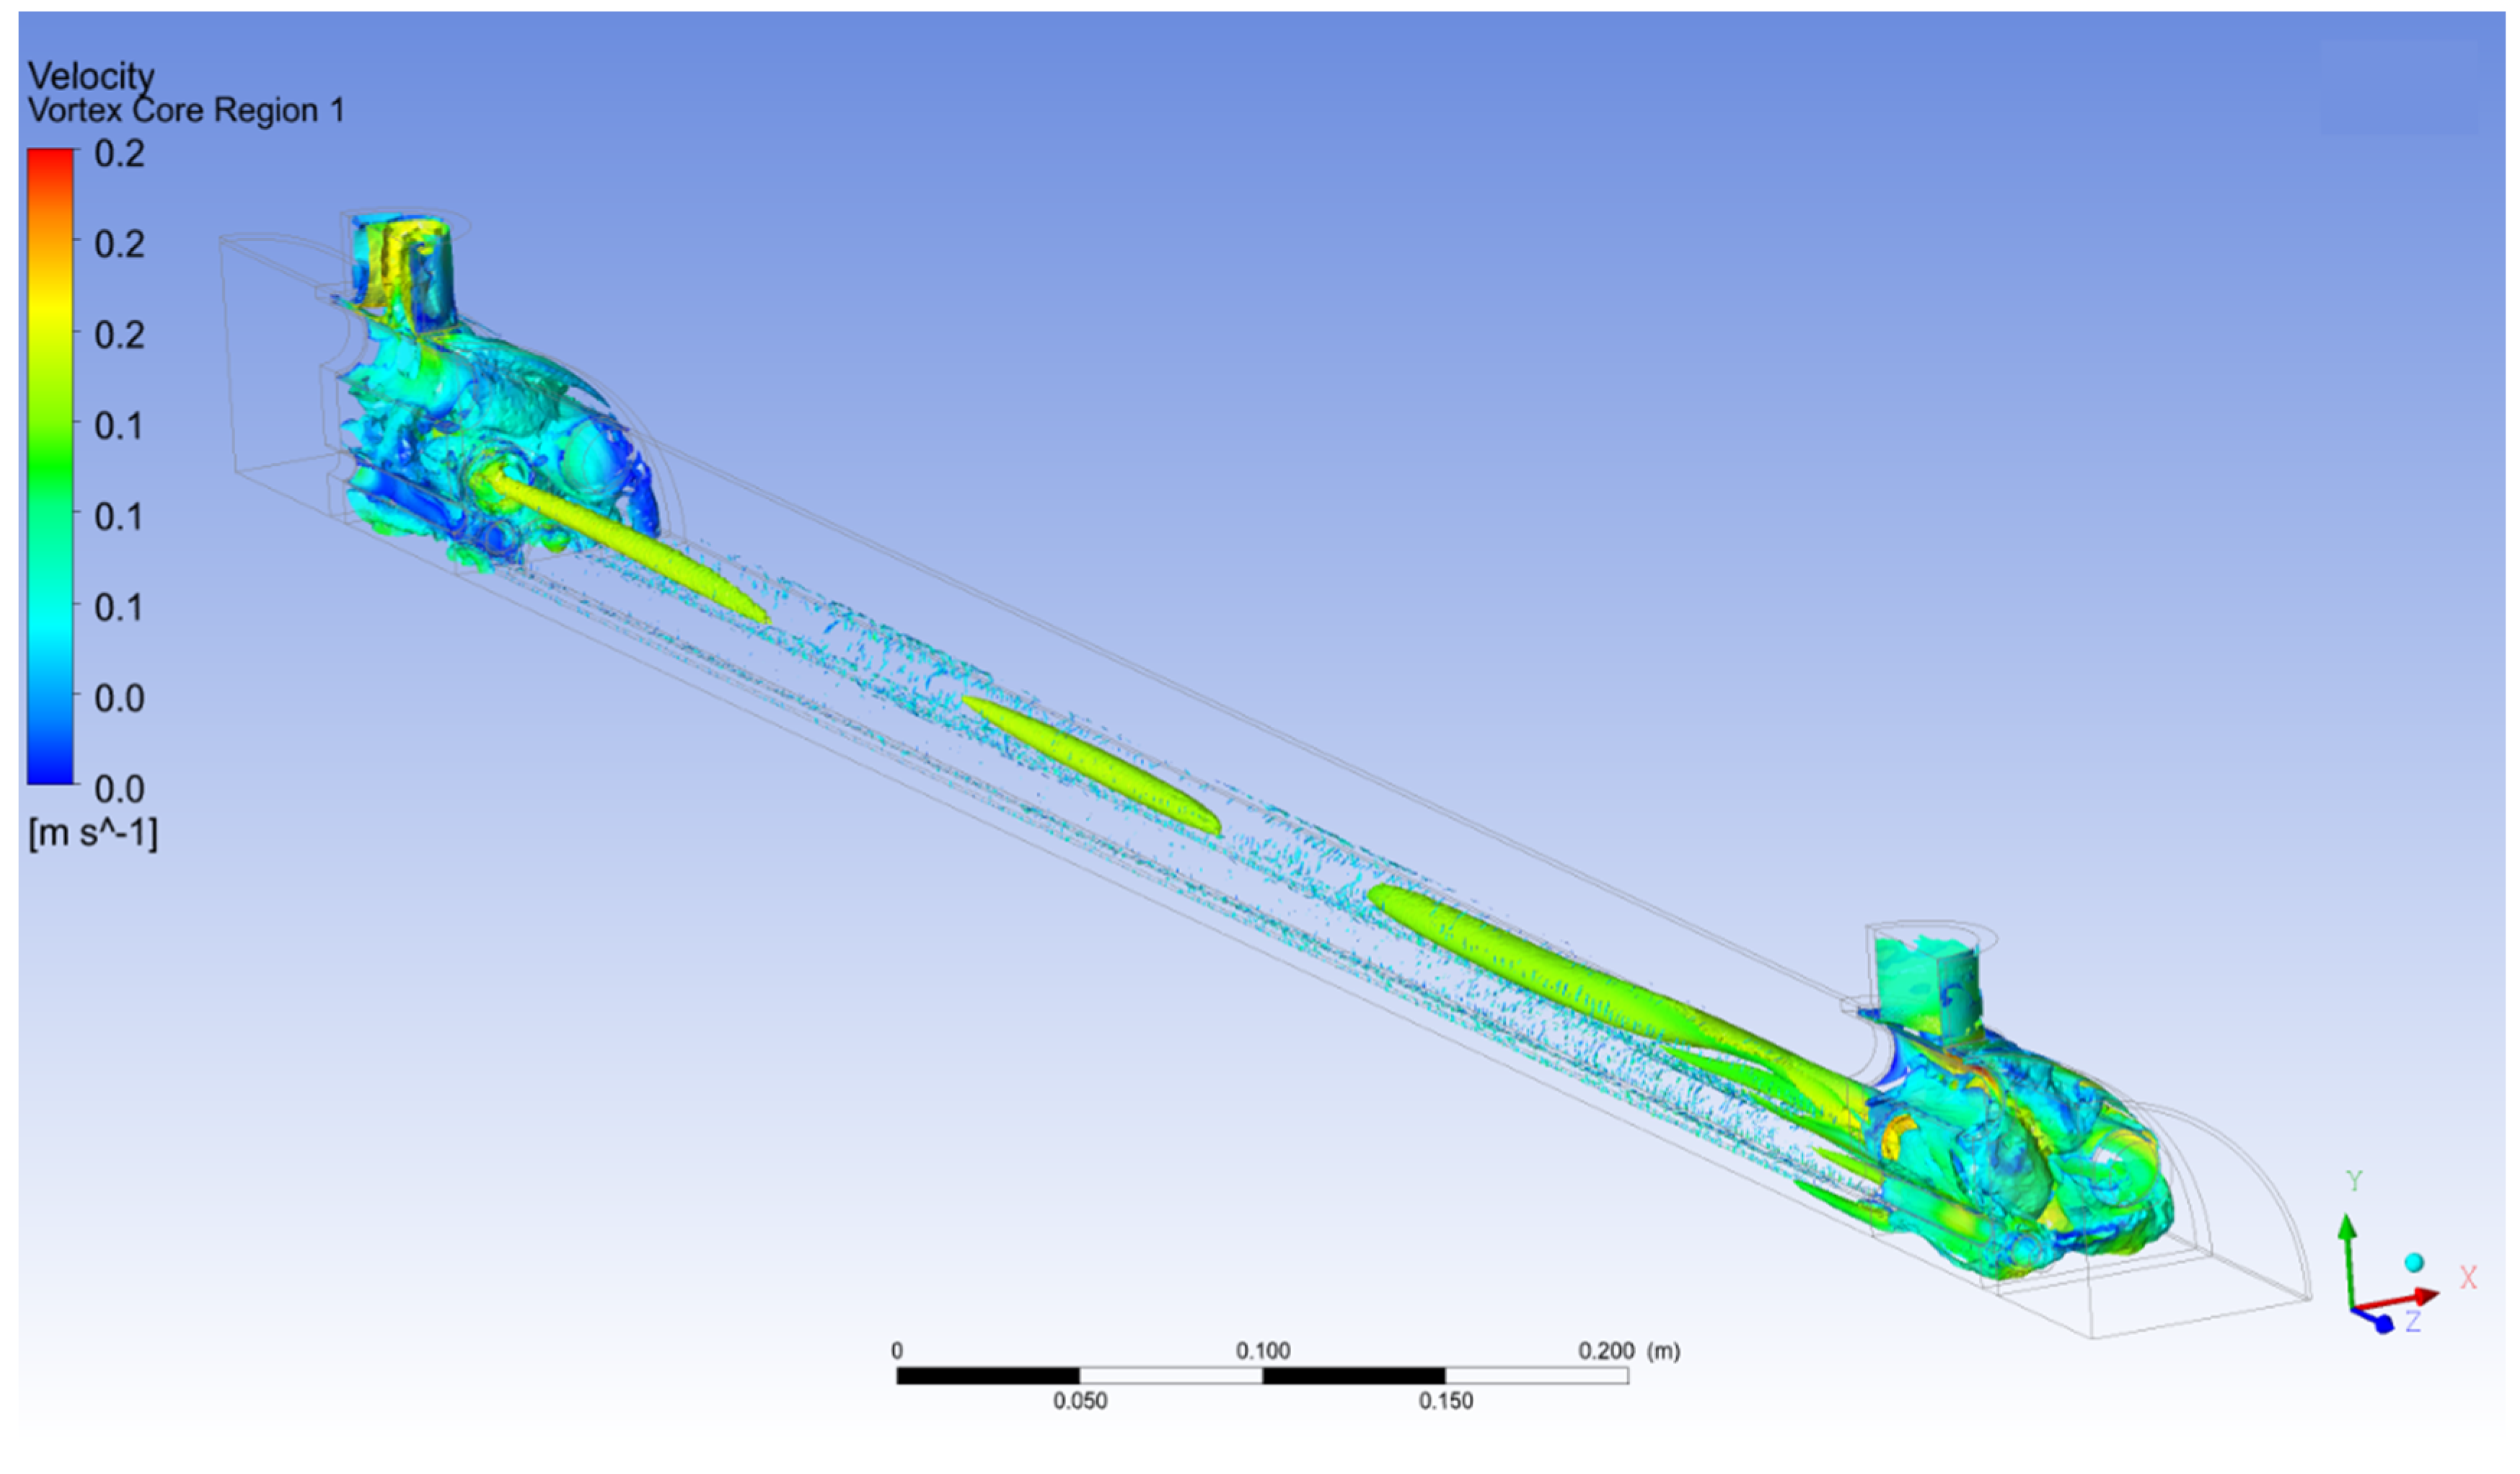
Distinct swirling phenomena were detected in select fuel pipes [41,42], exhibiting diverse frequencies (Figure 22). It is anticipated that the intensity of swirling will escalate with higher inlet fuel velocities. The observed swirling patterns can potentially induce vibrations within the pipes [43] imposing mechanical stresses on both the pipe body and its connections, such as those associated with fatigue loading, posing a conceivable risk of pipe fracture. Furthermore, it will increase the pressure inside the pipes, resulting in lower mass flow rates [44]. Additionally, the swirling will increase the corrosion and erosion rates in the applied areas of the inside wall of the pipes [45]. One potential remedy for this issue involves incorporating flow stabilizers, such as honeycomb grid discs, prior to the fuel inlet within the core pipes.

4. Conclusions

In the present work, we applied 3D computational fluid dynamics (CFD) not to the DFR core but to its model “mini demonstrator MD core” to be constructed in order to test the DFR functionality without any radioactivity. The structure of the proposed DFR mini demonstrator has been presented here in detail, encompassing key components and elements of the two loops, such as the core, pump, tanks, and heaters. The core design has been thoroughly described, highlighting the flow patterns of cold and hot fluids through the inlets, outlets, and piping system. The dimensions of the pipes and core vessel are presented, mirroring those of the real DFR, except for the number of pipes which is reduced to the minimum number of seven, reflecting the hexagonal geometry of the core.
The analysis focused on underlining the heat transfer between the fuel and coolant within the core, considering each pipe individually. Additionally, the mass flow rate for each fuel pipe was determined as a percentage of the total mass flow rate. This analysis showed a lack of uniformity of mass flow distribution percentage per pipe (16–4%). Eddy viscosity and surface Nusselt number contours were employed to identify regions with high heat transfer rates in different areas. The Reynolds numbers, based on mean velocity and hydraulic diameter, ranged from 15,000 to 30,000 for the fuel domain and from 200,000 to 250,000 for the coolant domain. The current design was found to exhibit a rapid increase in turbulence due to intense mixing and abrupt changes in flow areas and directions, despite the relatively low inlet velocities. The analysis conducted in this study revealed significant findings that merit discussion. Firstly, the identification of hot spots in close proximity to the fuel entrance was observed, leading to elevated temperatures within the coolant pipes (up to 1000 K). It is strongly advised to take measures to prevent such occurrences in order to ensure optimal system performance and safety of the reactor. This can be achieved by changing the position of the fuel inlets not to face coolant pipes directly. Furthermore, the mass flow rates within the fuel pipes located in the core exhibited irregular patterns dependent on the pipe’s position. Likewise, variations in heat transfer rates were observed among the different pipes. Flow swirling phenomena were also observed in the fuel pipes, characterized by varying swirling frequencies. These swirling patterns have the potential to induce pipe vibrations, which could lead to fracture under extreme operational conditions. To mitigate these thermal–hydraulic limitations, flow stabilizers can be added, e.g., honeycomb patterns.
Despite the satisfactory agreement obtained for the validation of the k-ω SST model, additional investigations are required for modeling techniques specific to liquid metals. Further validations are crucial for this model. Subsequently, with the construction of the mini demonstrator, additional experimental data can be gathered and compared against various models to identify and address modeling deficiencies and enhance validity. It is also crucial to explore different modeling conditions as different conditions might have different accuracies. Comparison of experimental data with CFD calculations will enable to improve construction of the final design of the reactor.
This study aimed to propose preliminary guidance to the DFR design work and safety analysis, in addition to the validation and future improvements of the model that will be used for both the MD and the DFR to explore optimal design parameters.

Author Contributions

H.E.: conceptualization, methodology, validation, software, writing. K.C.: conceptualization, supervision, writing. All authors have read and agreed to the published version of the manuscript.

Funding

This research was funded by the Polish National Center for Nuclear Research (NCBJ) project “New Reactor Concepts and Safety Analyses for the Polish Nuclear Energy Program”, POWR.03.02.00-00-I005/17 (years 2018–2023).

Data Availability Statement

No new data were created or analyzed in this study. Data sharing is not applicable to this article.

Conflicts of Interest

The authors declare no conflict of interest.

Abbreviations

BCBoundary Condition
CFDComputational Fluid Dynamics
DFRDual Fluid Reactor
DNSDirect Numerical Simulation
EROIEnergy Return On Investment
GenIVFourth Generation of nuclear reactors
IAEAInternational Atomic Energy Agency
LESLarge Eddy Simulation
LFRLead-Cooled Fast Reactor
MDMini-Demonstrator
MSRMolten Salt Reactor
PPUPyrochemical Processing Unit
RANSReynolds Averaged Navier–Stokes
SSTShear Stress Transport Model
Dimensionless quantities
PrPrandtl number
PrtTurbulent Prandtl number
ReReynolds number
RiRichardson number
NuNusselt number
Greek and Latin symbols
μDynamic viscosity
μtTurbulent viscosity (eddy viscosity)
νKinematic viscosity
ωSpecific dissipation rate
ρDensity
τShear stress
τwWall shear stress
εDissipation rate
KThermal conduction coefficient
mMass
vVelocity
tTime
kTurbulence kinetic energy
TTemperature
uCharacteristic velocity
yDistance from the wall
CpSpecific heat capacity

References

  1. International Atomic Energy Agency. Status of Molten Salt Reactor Technology; TRS No 489; International Atomic Energy Agency: Vienna, Austria, 2021. [Google Scholar]
  2. Thomas, J.D. (Ed.) Molten Salt Reactors and Thorium Energy; Woodhead Publishing Series in Energy; Woodhead Publishing: Sawston, UK, 2017. [Google Scholar]
  3. Bajorek, S.; Diamond, D.J.; Brown, N.R.; Denning, R. Thermal-Hydraulics Phenomena Important in Modeling and Simulation of Liquid-Fuel Molten Salt Reactors; Brookhaven National Lab. (BNL): Upton, NY, USA, 2018.
  4. Smith, O.; Cattell, O.; Farcot, E.; O’Dea, R.D.; Hopcraft, K.I. The Effect of Renewable Energy Incorporation on Power Grid Stability and Resilience. Sci. Adv. 2022, 8, eabj6734. [Google Scholar] [CrossRef] [PubMed]
  5. Huke, A.; Ruprecht, G.; Weißbach, D.; Czerski, K.; Gottlieb, S.; Hussein, A.; Herrmann, F. Dual-Fluid Reactor. In Molten Salt Reactors and Thorium Energy; Elsevier: Amsterdam, The Netherlands, 2017; pp. 619–633. ISBN 9780081012437. [Google Scholar]
  6. Wang, X.; Macián-Juan, R.; Dabrowski, M. Analysis and Evaluation of the Dual Fluid Reactor Concept; Südwestdeutscher Verlag für Hochschulschriften: London, UK, 2017. [Google Scholar]
  7. Weißbach, D.; Sierchuła, J.; Dąbrowski, M.P.; Czerski, K.; Ruprecht, G. Dual Fluid Reactor as a Long-term Burner of Actinides in Spent Nuclear Fuel. Int. J. Energy Res. 2021, 45, 11589–11597. [Google Scholar] [CrossRef]
  8. Weißbach, D.; Ruprecht, G.; Huke, A.; Czerski, K.; Gottlieb, S.; Hussein, A. Energy Intensities, EROIs, and Energy Payback Times of Electricity Generating Power Plants. Energy 2013, 52, 210–221. [Google Scholar] [CrossRef]
  9. Laidler, J.J.; Battles, J.E.; Miller, W.E.; Ackerman, J.P.; Carls, E.L. Development of Pyroprocessing Technology. Prog. Nucl. Energy 1997, 31, 131–140. [Google Scholar] [CrossRef]
  10. Dincer, I.; Zamfirescu, C. Other Hydrogen Production Methods. In Sustainable Hydrogen Production; Elsevier: Amsterdam, The Netherlands, 2016; pp. 411–439. [Google Scholar] [CrossRef]
  11. Vaidya, H.A.; Ertunç, Ö.; Genç, B.; Beyer, F.; Köksoy, Ç.; Delgado, A. Numerical Simulations of Swirling Pipe Flows- Decay of Swirl and Occurrence of Vortex Structures. J. Phys. Conf. Ser. 2011, 318, 062022. [Google Scholar] [CrossRef]
  12. Hanusek, T.; Macian-Juan, R. Analyses of the Shutdown System and Transients Scenarios for the Dual Fluid Reactor Concept with Metallic Molten Fuel. Int. J. Energy Res. 2022, 46, 17230–17246. [Google Scholar] [CrossRef]
  13. Nalbandyan, A.; Klinkby, E.; Lauritzen, B.; Groth-Jensen, J.; Steyn, R. Coupled Neutronics/Thermal Hydraulics Assessment of Graphite Moderated Molten Salt Reactors. In Proceedings of the 18th International Topical Meeting on Nuclear Reactor Thermal Hydraulics (NURETH 2019), Portland, OR, USA, 18–23 August 2019. [Google Scholar]
  14. IAEA. Available online: https://www.Iaea.Org/Topics/Construction-and-Commissioning-of-Nuclear-Power-Plants (accessed on 20 June 2023).
  15. Liu, C.; Li, X.; Luo, R.; Macian-Juan, R. Thermal Hydraulics Analysis of the Distribution Zone in Small Modular Dual Fluid Reactor. Metals 2020, 10, 1065. [Google Scholar] [CrossRef]
  16. Wang, X.; Liu, C.; Macian-Juan, R.; Wang, X.; Liu, C.; Macian-Juan, R. Preliminary Hydraulic Analysis of the Distribution Zone in the Dual Fluid Reactor Concept. Prog. Nucl. Energy 2019, 110, 364–373. [Google Scholar] [CrossRef]
  17. Shams, A.; De Santis, A. Towards the Accurate Prediction of the Turbulent Flow and Heat Transfer in Low-Prandtl Fluids. Int. J. Heat Mass Transf. 2019, 130, 290–303. [Google Scholar] [CrossRef]
  18. Shams, A.; De Santis, D.; Padee, A.; Wasiuk, P.; Jarosiewicz, T.; Kwiatkowski, T.; Potempski, S. High-Performance Computing for Nuclear Reactor Design and Safety Applications. Nucl. Technol. 2020, 206, 283–295. [Google Scholar] [CrossRef]
  19. Duponcheel, M.; Bricteux, L.; Manconi, M.; Winckelmans, G.; Bartosiewicz, Y. Assessment of RANS and Improved Near-Wall Modeling for Forced Convection at Low Prandtl Numbers Based on LES up to Re_T = 2000. Int. J. Heat Mass Transf. 2014, 75, 470–482. [Google Scholar] [CrossRef]
  20. Wei, H.; Bao, H.; Ruan, X. Genetic Algorithm-Driven Discovery of Unexpected Thermal Conductivity Enhancement by Disorder. Nano Energy 2020, 71, 104619. [Google Scholar] [CrossRef]
  21. Zou, H.; Feng, Y.; Qiu, L. Excellent Heat Transfer Enhancement of CNT-Metal Interface by Loading Carbyne and Metal Nanowire into CNT. Int. J. Heat Mass Transf. 2022, 186, 122533. [Google Scholar] [CrossRef]
  22. Rostamzadeh, A. Towards Multidimensional Artificially Characteristic-Based Scheme for Incompressible Thermo-Fluid Problems. Mechanics 2018, 23, 826–834. [Google Scholar] [CrossRef] [Green Version]
  23. Hashemi, M.Y.; Zamzamian, K. A Multidimensional Characteristic-Based Method for Making Incompressible Flow Calculations on Unstructured Grids. J. Comput. Appl. Math. 2014, 259, 752–759. [Google Scholar] [CrossRef] [Green Version]
  24. Nowak, M.; Spirzewski, M.; Czerski, K. Optimization of the DC Magnetohydrodynamic Pump for the Dual Fluid Reactor. Ann. Nucl. Energy 2022, 174, 109142. [Google Scholar] [CrossRef]
  25. Al-Habahbeh, O.M.; Al-Saqqa, M.; Safi, M.; Abo Khater, T. Review of Magnetohydrodynamic Pump Applications. Alex. Eng. J. 2016, 55, 1347–1358. [Google Scholar] [CrossRef] [Green Version]
  26. Smith, C.F.; Halsey, W.G.; Brown, N.W.; Sienicki, J.J.; Moisseytsev, A.; Wade, D.C. SSTAR: The US Lead-Cooled Fast Reactor. J. Nucl. Mater. 2007, 376, 255–259. [Google Scholar] [CrossRef] [Green Version]
  27. Singh, O.P. Nuclear Reactors of the Future. In Physics of Nuclear Reactors, 1st ed.; Elsevier: Amsterdam, The Netherlands, 2021. [Google Scholar]
  28. Serp, J.; Allibert, M.; Beneš, O.; Delpech, S.; Feynberg, O.; Ghetta, V.; Heuer, D.; Holcomb, D.; Ignatiev, V.; Kloosterman, J.L.; et al. The Molten Salt Reactor (MSR) in Generation IV: Overview and Perspectives. Prog. Nucl. Energy 2014, 77, 308–319. [Google Scholar] [CrossRef]
  29. Uhlíř, J. Chemistry and Technology of Molten Salt Reactors–History and Perspectives. J. Nucl. Mater. 2007, 360, 6–11. [Google Scholar] [CrossRef]
  30. Wilcox, D. Formulation of the k-Omega Turbulence Model Revisited. In Proceedings of the 45th AIAA Aerospace Sciences Meeting and Exhibit, Denver, CO, USA, 2–5 August 2009; American Institute of Aeronautics and Astronautics: Reston, VS, USA, 2007. [Google Scholar]
  31. Menter, F. Zonal Two Equation k-w Turbulence Models For Aerodynamic Flows. In Proceedings of the 23rd Fluid Dynamics, Plasmadynamics, and Lasers Conference, Orlando, FL, USA, 6–9 July 1993; American Institute of Aeronautics and Astronautics: Reston, VA, USA, 1993. [Google Scholar]
  32. Sierchuła, J.; Weissbach, D.; Huke, A.; Ruprecht, G.; Czerski, K.; Da¸browskida¸browski, M.P. Determination of the Liquid Eutectic Metal Fuel Dual Fluid Reactor (DFRm) Design-Steady State Calculations. Int. J. Energy Res. 2019, 43, 3692–3701. [Google Scholar] [CrossRef]
  33. Ma, W.; Karbojian, A.; Hollands, T.; Koch, M.K. Experimental and Numerical Study on Lead-Bismuth Heat Transfer in a Fuel Rod Simulator. J. Nucl. Mater. 2011, 415, 415–424. [Google Scholar] [CrossRef]
  34. Tong, L.L.; Hou, L.Q.; Cao, X.W. Analysis of the Flow Distribution and Mixing Characteristics in the Reactor Pressure Vessel. Nucl. Eng. Technol. 2021, 53, 93–102. [Google Scholar] [CrossRef]
  35. Zhao, P.; Shi, K.; Li, S.; Feng, J.; Chen, H. CFD Analysis of the Primary Cooling System for the Small Modular Natural Circulation Lead Cooled Fast Reactor SNRLFR-100. Sci. Technol. Nucl. Install. 2016, 2016, 9612120. [Google Scholar] [CrossRef] [Green Version]
  36. Feng, J.; Xu, L.; Baglietto, E. Assessing the Applicability of the Structure-Based Turbulence Resolution Approach to Nuclear Safety-Related Issues. Fluids 2021, 6, 61. [Google Scholar] [CrossRef]
  37. Blazek, J. Computational Fluid Dynamics: Principles and Applications; Elsevier: Amsterdam, The Netherlands, 2005; ISBN 9780080445069. [Google Scholar]
  38. Zhang, Q.; Ge, J.; Zhang, B.; He, C.; Wu, Z.; Liang, J. Effect of Thermal Residual Stress on the Tensile Properties and Damage Process of C/SiC Composites at High Temperatures. Ceram. Int. 2022, 48, 3109–3124. [Google Scholar] [CrossRef]
  39. Yingling, J.A.; Gamble, K.A.; Roberts, E.; Freeman, R.A.; Knight, T.W. UPDATED U3SI2 Thermal Creep Model and Sensitivity Analysis of the U3SI2-SIC Accident Tolerant FUEL. J. Nucl. Mater. 2021, 543, 152586. [Google Scholar] [CrossRef]
  40. Sklenicka, V.; Kral, P.; Kucharova, K.; Kvapilova, M.; Dvorak, J.; Kloc, L. Thermal Creep Fracture of a Zr1%Nb Cladding Alloy in the α and (A + β) Phase Regions. J. Nucl. Mater. 2021, 553, 152950. [Google Scholar] [CrossRef]
  41. Li, H.; Tomita, Y. Characteristics of Swirling Flow in a Circular Pipe. J. Fluids Eng. 1994, 116, 370–373. [Google Scholar] [CrossRef]
  42. Amini, Y.; Mokhtari, M.; Haghshenasfard, M.; Barzegar Gerdroodbary, M. Heat Transfer of Swirling Impinging Jets Ejected from Nozzles with Twisted Tapes Utilizing CFD Technique. Case Stud. Therm. Eng. 2015, 6, 104–115. [Google Scholar] [CrossRef] [Green Version]
  43. Hibara, H.; Sudo, K. Structure and Vibration Phenomenon of Swirling Flow through Conical Diffusers. Trans. Jpn. Soc. Mech. Eng. Ser. B 2002, 68, 3049–3057. [Google Scholar] [CrossRef] [Green Version]
  44. Takano, T.; Ikarashi, Y.; Uchiyama, K.; Yamagata, T.; Fujisawa, N. Influence of Swirling Flow on Mass and Momentum Transfer Downstream of a Pipe with Elbow and Orifice. Int. J. Heat Mass Transf. 2016, 92, 394–402. [Google Scholar] [CrossRef]
  45. Ramírez-Arreola, D.E.; Aranda-García, F.J.; Sedano-de la Rosa, C.; Vite-Torres, M.; Gallardo-Hernández, E.A.; Godínez-Salcedo, J.G. Influence of Swirl Number and Incidence Angle on Erosion-Corrosion Behavior of API 5L X-52 Steel under Swirling Jets. Wear 2022, 510–511, 204518. [Google Scholar] [CrossRef]
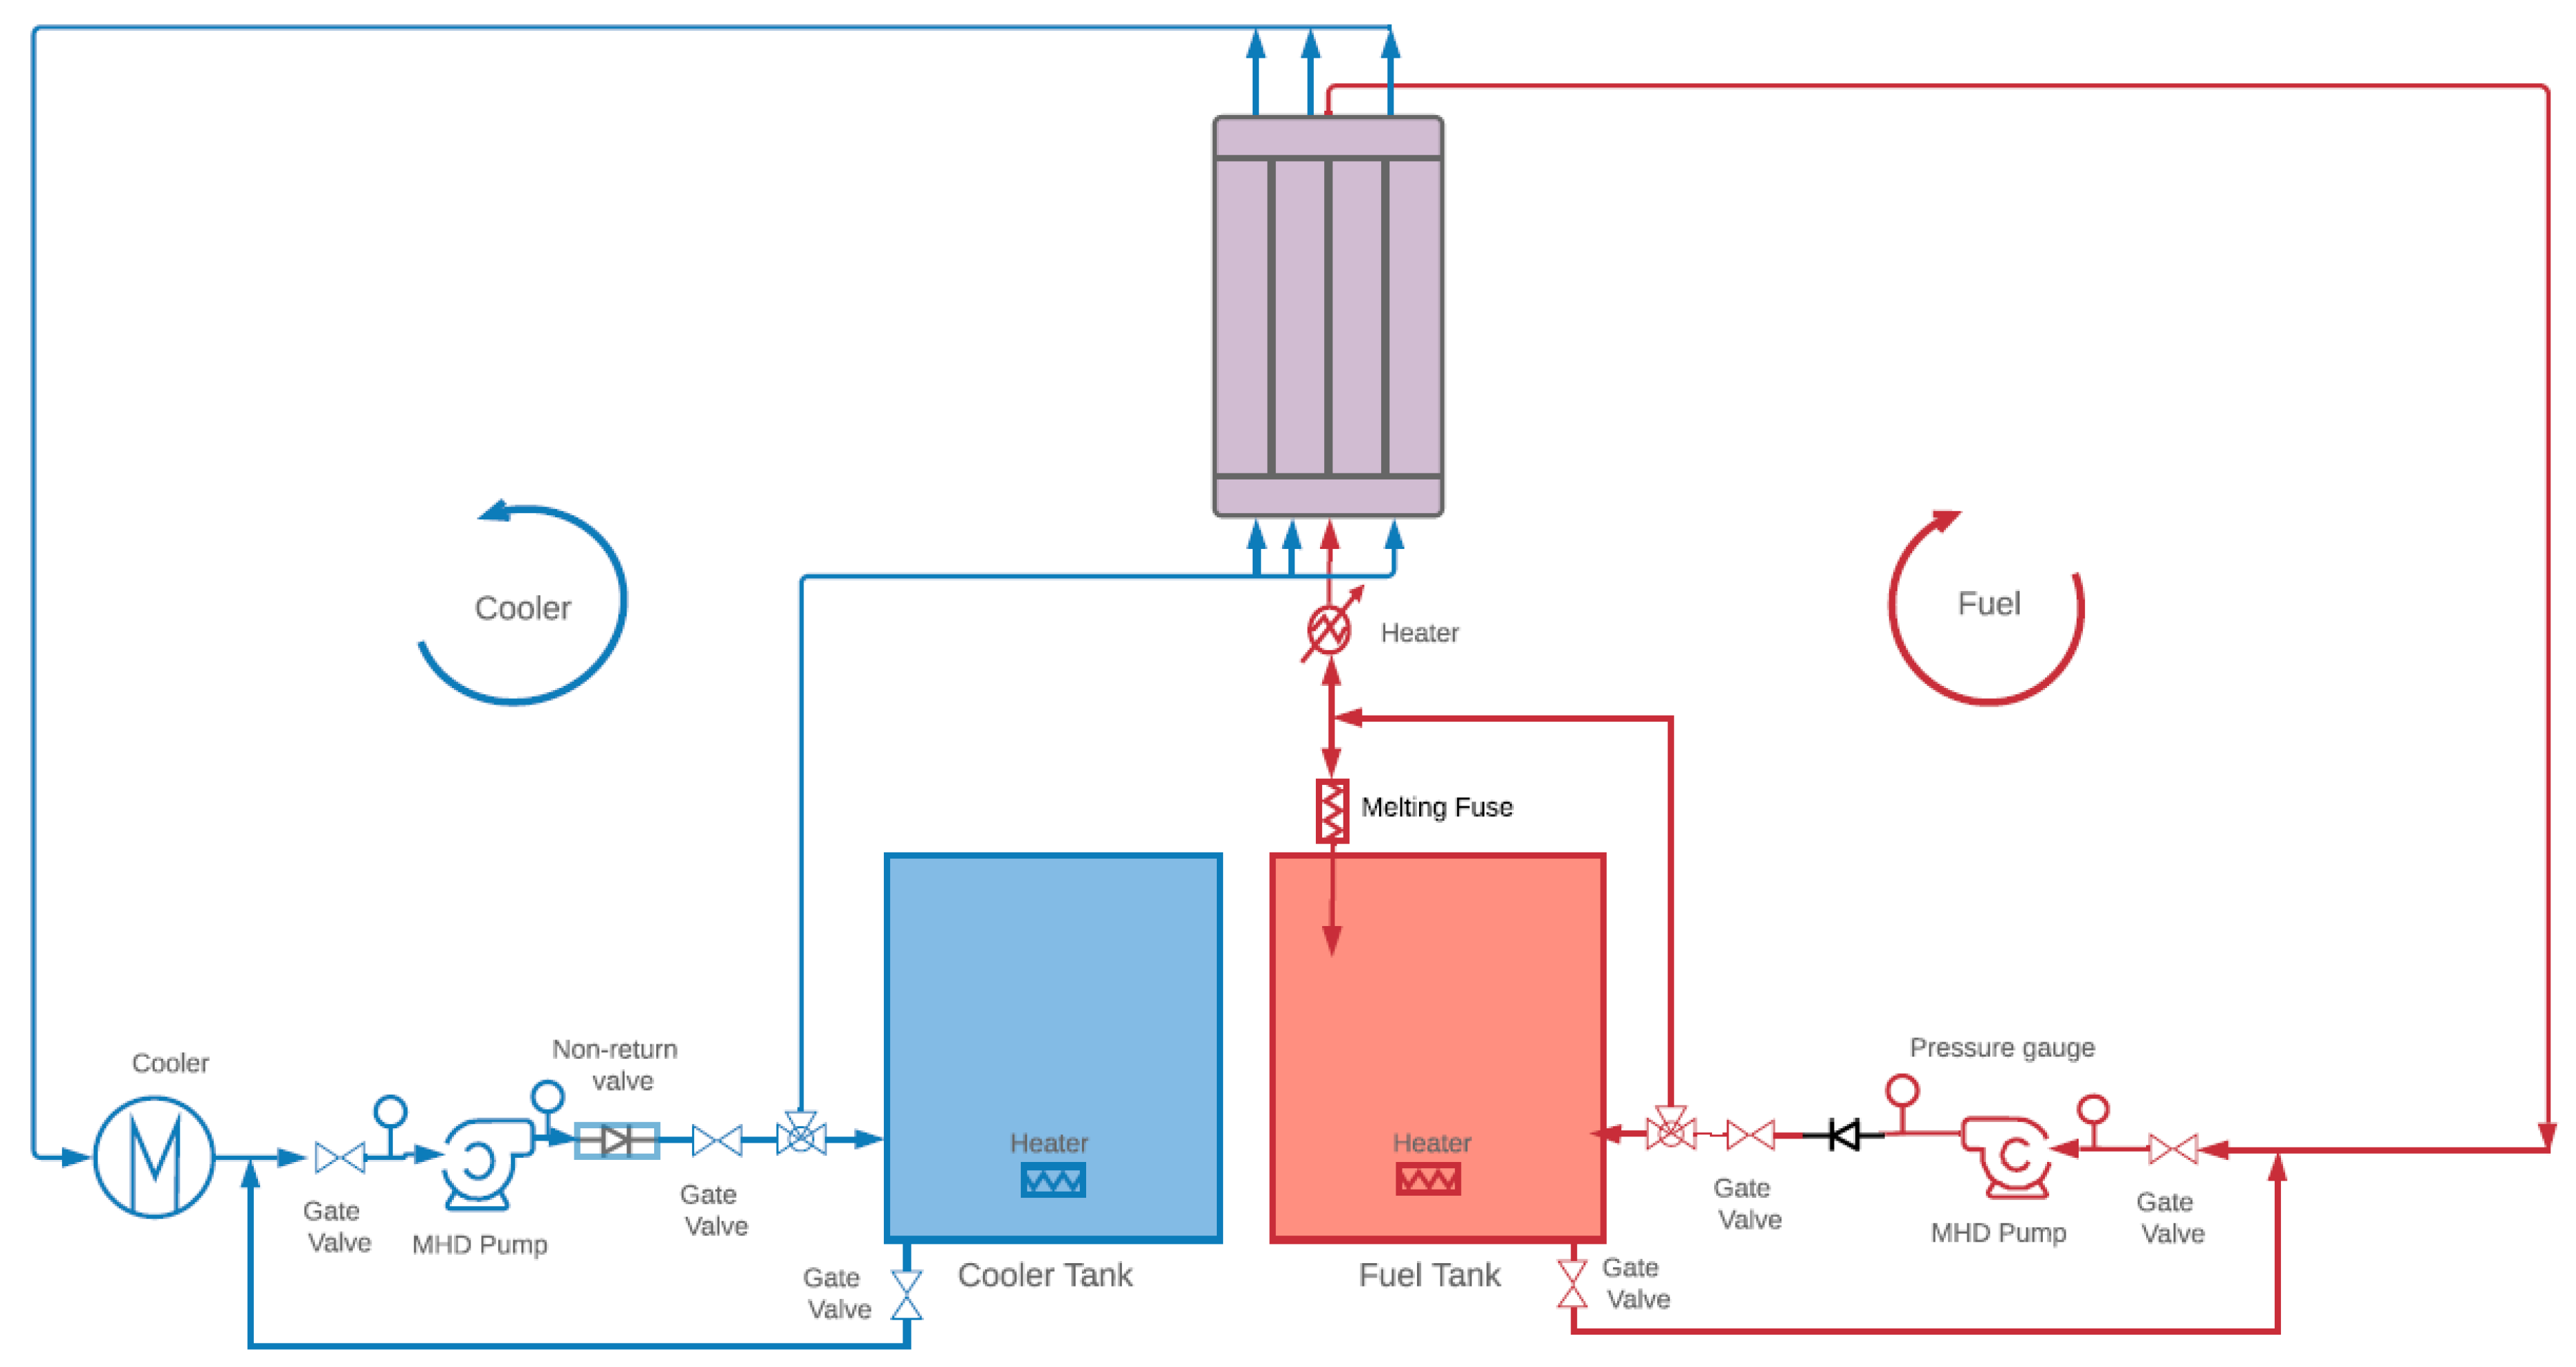
Figure 1. Schematic view of the mini demonstrator loops.
Energies 16 04989 g001
Figure 2. Full-body view of the MD core model showing the inlets/outlets and the outer casing.
Energies 16 04989 g002
Figure 3. MD zones definition.
Energies 16 04989 g003
Figure 4. MD core domains: all domains/zoom (a,b), sliced collection zone (c), sliced distribution zone (d), full coolant/distribution zone zoom (d,e), full fuel/distribution zone zoom (g,h).
Energies 16 04989 g004aEnergies 16 04989 g004b
Figure 5. Radial distribution of thermocouples in TALL testing section.
Energies 16 04989 g005
Figure 6. Temperature increase along the testing section, Re = 19,000.
Energies 16 04989 g006
Figure 7. Temperature increase along the testing section, Re = 61,000.
Energies 16 04989 g007
Figure 8. The change of error along the length for each tested Re number.
Energies 16 04989 g008
Figure 9. Different planes in different areas in the MD core used for contours analysis.
Energies 16 04989 g009
Figure 10. Velocity contours at inlet of the fuel pipes and percentages of mass flow rate in the pipe to total fuel flow in core.
Energies 16 04989 g010
Figure 11. Temperature contours at inlet of fuel pipes and percentage of heat transfer in the pipe to total in core.
Energies 16 04989 g011
Figure 12. Fuel velocity in plane A, (left): Inlet, (right): Outlet.
Energies 16 04989 g012
Figure 13. Fuel velocity in planes C2 (Inlet—left) and C1 (outlet—right).
Energies 16 04989 g013
Figure 14. Coolant velocity in plane A, (left): inlet, (right): outlet.
Energies 16 04989 g014
Figure 15. Fuel temperature at the inlet, (left): inlet, (right): outlet.
Energies 16 04989 g015
Figure 16. Fuel temperature contour profile at plane C2 (inlet), (left) and plane C1 (outlet), (right).
Energies 16 04989 g016
Figure 17. Coolant temperature in plane A, (left): inlet, (right): outlet.
Energies 16 04989 g017
Figure 18. Surface Nusselt number of fuel at inlet and distribution zone (inverted rainbow).
Energies 16 04989 g018
Figure 19. Velocity streamlines of fuel at the inlet and distribution zone (velocity color-coded).
Energies 16 04989 g019
Figure 20. Surface Nusselt number of coolant at the inlet and distribution zone.
Energies 16 04989 g020
Figure 21. Velocity streamlines of coolant at the inlet and distribution zone (velocity color-coded).
Energies 16 04989 g021
Figure 22. Fuel velocity Q-criterion level 0.0002.
Energies 16 04989 g022
Table 1. Technical data of the DFR model core.
ParameterValues
Outer diameter of MD (mm)133
Inner diameter of MD (mm)130
Length of the domain in axial direction (mm)880
Distribution zone height (mm)70
Collection zone height (mm)70
Number of fuel pipes7
Number of large-diameter coolant pipe6
Number of small-diameter coolant pipe6
Fuel pin pitch (mm)28
Outer/inner diameters of fuel pipes (mm)23/19
Outer/inner diameters of large-diameter coolant pipes (mm)23/19
Outer/inner diameter of small-diameter coolant pipes (mm)10/8
Table 2. Thermo-physical properties of liquid lead based on the temperature (K) [16].
PropertyInterpolation Function
Density (kg/m3)11,463 − 1.32 × T
Heat Capacity (J/kg.K)175.1 − 4.961 × 10⁻² × T + 1.985 × 10⁻⁵ × T2 2212 2.099 × 10⁻⁹ × T3 − 1.524 × 10⁶ × T2
Viscosity (Pa.s)(1032.2/T) − 7.6354
Table 3. Fuel and coolant boundary conditions.
Fuel boundary conditionsVelocity (m/s)0.1
Total pressure (atm)1
Total temp (K)1473
Coolant boundary conditionsVelocity (m/s)0.5
Total pressure (atm)1
Total temp (K)873
Table 4. Mass flow rate in pipe groups. Note: Mirror view was later added to the results after simulation was completed to show the full three-dimensional model perspective.
Pipe GroupMass Flow per Pipe kg/s
Pipe group X (pipes 1, 3, 4, 6)0.19
Pipe group Y (pipes 2, 5)0.18
Pipe group Z (pipe 7)0.05
Table 5. Heat transfer rate in pipe groups.
Pipe GroupHeat Transfer Rate/Pipe (Watt)
Pipe group X (pipes 1, 3, 4, 6)−1973
Pipe group Y (pipes 2, 5)−2001
Pipe group Z (pipe 7)−1183
Disclaimer/Publisher’s Note: The statements, opinions and data contained in all publications are solely those of the individual author(s) and contributor(s) and not of MDPI and/or the editor(s). MDPI and/or the editor(s) disclaim responsibility for any injury to people or property resulting from any ideas, methods, instructions or products referred to in the content.