Abstract
This work is devoted to the construction and analysis of the functioning of energy efficiency management systems for the technological processes of mining industries. The main idea of this work is to substantiate and describe an approach to the intellectualization of data processing methods and tools used in the operation of energy efficiency management systems. This paper provides a brief overview of the problems of implementing the ISO 50001 standard and provides a justification for the need to bring the energy efficiency management systems prescribed by the standard to an automated form. Functional requirements for the construction of such automated systems for mining industries, considering the use of Industry 4.0 technologies, are formulated. A structural–functional model of the conceptual architecture of the proposed system is given. The problems of the direct integration of computational methods of data mining for the implementation of the required functions are shown. A statistical analysis of the technological information of 11 enterprises is presented, confirming the described problems and the validity of the stated requirements for building the system. Based on the results of the work, steps to eliminate problems and further plans for the modernization of energy efficiency management systems in the industry have been identified.
1. Introduction
As is known, one of the traditional indicators of the quality of the functioning of enterprises is the energy efficiency of the implementation of processes, which is understood as the ratio of energy resources spent to the volume of work performed [1,2,3,4]. In order to minimize this indicator, various technical and organizational measures are taken at enterprises, including the mining sector, to ensure the solution of tasks in the field of energy management: monitoring the amount of energy resources spent per unit of time, forecasting and planning the required volumes [5,6,7], etc., which together allows monitoring energy efficiency and, as a consequence, reducing financial losses and increasing profits [8,9,10,11,12,13]. In the conditions of the modern approach to the organization of production within the framework of the concept of sustainable development, the tasks of accounting and analysis of energy consumption play a significant role not only in terms of profitability of processes but also environmental safety [14,15,16,17,18,19,20].
One of the fundamental and guiding regulatory documents in this area is the ISO 50001 standard (GOST R ISO 50001-2023 “Energy management systems. Requirements and application guidelines”), which regulates the general requirements for the organization of energy management in enterprises [9,10,21,22]. The key feature of this standard is recommendations on the application of the PDCA continuous improvement cycle methodology: Plan–Do–Check–Act, which offers several operations aimed at forming energy efficiency criteria, adopting a plan to achieve them, continuous monitoring of relevant indicators and performing actions to achieve their improvement. However, the standard itself, like the model, is generally descriptive and does not consider tools for implementing the necessary measures. In this regard, each individual enterprise is forced to determine its own approach to ensure compliance with the requirements of the standard [1,4,14].
On the one hand, this situation allows mining enterprises, taking into account various geological, technological and weather-climatic conditions, to find their own effective solutions to improve the quality of production [9,10,11,18,19,20,21]. On the other hand, the absence of any formal typification and unification of the description of processes, energy resources, indicators, monitoring, analysis and management methods leads to difficulties in scaling and transferring best practices and solutions between enterprises. At the same time, cases of such problems are not uncommon not only for enterprises from the same industry but also for enterprises located in the same holding, which ultimately leads to the impossibility of an objective analysis of the situation and low efficiency of company management. Moreover, this imposes significant limitations and complicates the possibilities of integrating advanced technologies from the field of Industry 4.0, especially in terms of using computational methods of data mining to build various kinds of predictive and optimization models and automation of energy efficiency management systems in general, which are currently the most rational way to fulfil the requirements of the standard [7,22,23,24,25,26,27,28,29,30].
It is worth noting that the very use of such methods does not imply a strict need for a unified list of initial parameters or the typification of objects and processes because the best results of their use can be achieved only in the case of creating individual (not universal) computational models with a set of data inherent in the object or process under study. However, the latter thesis can be more applicable when it comes to creating some high-precision models or a Digital Twin. In cases of building dispatching automated systems with a sufficient degree of accuracy (meaning permissible error) and reliability, the computational models included in such systems can be formed with a high generalizing ability, i.e., in such a way that they will be applicable to the same type of energy-consuming objects of different enterprises, regardless of their initial specific technical-technological and cumulative operational properties [5,6,7,22,31]. This means that for this type of energy-consuming object (ECO), such as excavators of the same series and brand, it is possible to build a unified model for predicting energy consumption with a unified list of input parameters and invariant to the specific initial characteristics of each individual excavator at each individual enterprise. Despite the possible loss in the accuracy of universal models relative to individual ones, the former has a tangible advantage in the context of the time and economic costs of their development and implementation in the existing processes of enterprises, as well as the speed of achieving the desired result to increase production efficiency and improve the observability and manageability of processes. The positive effect of this approach is achieved in the following cases:
- An explicitly defined list and characteristics of parameters that fully describe the objects or processes under consideration;
- Application of methods of control and data preprocessing to exclude possible anomalous values and bring them to a single template of input lists of model parameters;
- Implementation of automatic integration and data aggregation tools to support the functioning of models in the absence of the necessary parameters in the internal information contour of the enterprise.
Despite the adoption of organizational measures to ensure the requirements of the designated standard and the introduction of various means of dispatching monitoring of production processes, the analysis of the existing structural–functional schemes and information environments of a number of mining industries shows the persistence of problems in the field of energy management, which indicates not only the impossibility of switching to more advanced methods of solving the task but also the low efficiency of already operated means. In this regard, this work is devoted to identifying existing problems, as well as proposals for formalizing the approach to build automated energy efficiency management systems in the context of meeting the requirements of ISO 50001 and the digital transformation of mining industries [30]. This work is based on an analysis of the functioning of an automated energy efficiency management system implemented at 11 mining enterprises in Russia. According to the results of the analysis, several problems were identified and classified, both with poor-quality execution of the system itself and with a large number of factors caused by improper maintenance of operating conditions, from undeclared operational changes in the operating modes of technological equipment and ending with unauthorized changes in production indicators in distributed information repositories of enterprises. Thus, the purpose of this study, first of all, is to eliminate such problems as part of the modernization of the existing automated system to improve the accuracy and reliability of its operation.
2. Formalization of Requirements for Automation of Energy Efficiency Management Systems
The main content of this article is the issues that arise when building automated energy efficiency management systems, which, on the one hand, should take into account the necessary organizational regulations of energy management and, on the other, act as a direct tool for solving such problems [30]. In addition, bearing in mind the modern level of information technologies, it is necessary to consider the possibility of their implementation in an autonomously functioning form, ensuring the maximum exclusion of people from the implementation of processes in order to minimize the risks of human factor influence and increase the accuracy and reliability of solutions.
2.1. General Requirements for Automation of Energy Efficiency Management Systems
Thus, from the perspective of management tasks, automation of technological processes, and organization of production, the following can be formulated as the basic functions of such a system:
- Continuous monitoring of information on ECO activity recorded using sensor devices;
- Analysis of information to determine the effectiveness of the results of such activities, including the correspondence of the actual indicators of energy consumption to the volume of work performed relative to the normative, planned and prediction indicators;
- Formation of recommendations and/or control actions for changing the modes of operation of the ECO.
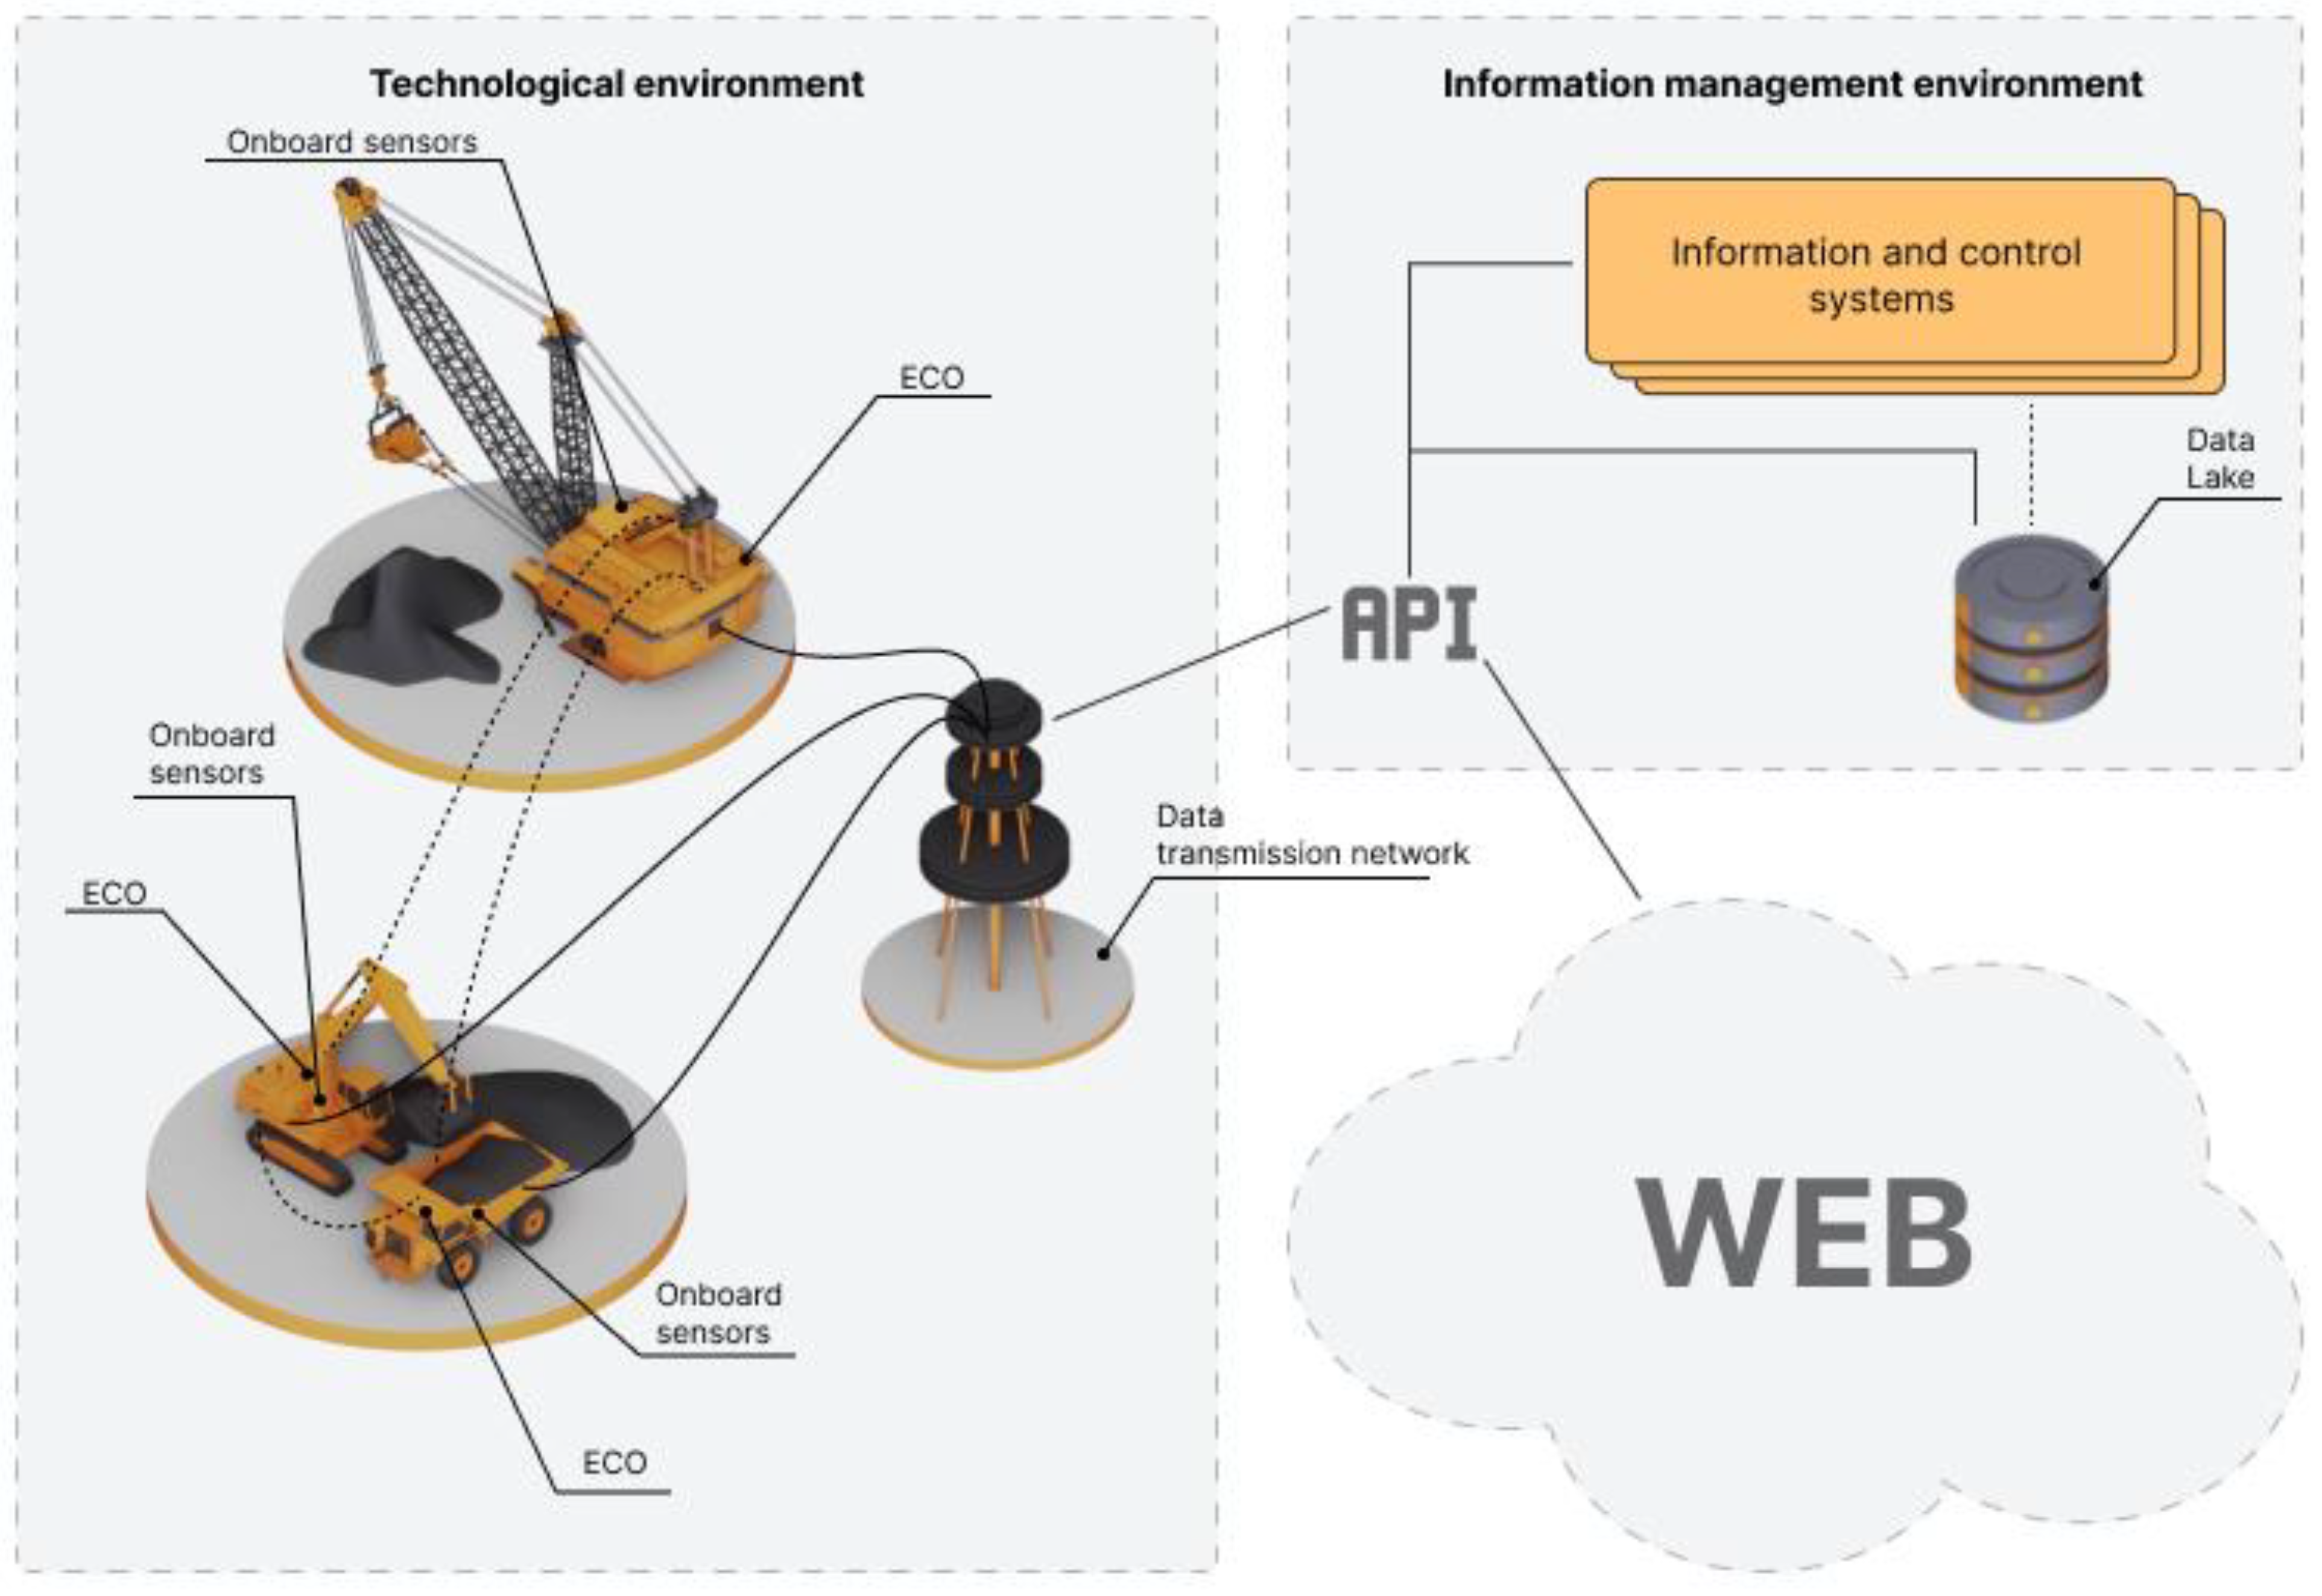
Regarding continuous monitoring of information, it is necessary to highlight such subtasks as directly collecting primary data from terminal nodes—on–board sensor devices—individual energy-consuming objects; preprocessing of primary data and their presentation in the information space of the enterprise; as well as general data control in terms of the continuity of their receipt, compliance of values with the required structures, formats and measurement ranges. To a greater extent, the listed subtasks already have one or another solution at the moment and questions about their automation cannot be called relevant. Therefore, it is almost impossible to find an enterprise that today has not integrated solutions in the field of dispatching monitoring, which includes the installation of the necessary data collection devices for each piece of equipment and the introduction of data visualization software for management personnel. The typical landscape architecture of the information management environment of a mining enterprise is a conditional division into technological and information management environments, which include technical agents (various kinds of technological equipment) implementing production processes with different levels of autonomy, the processes of collecting and transmitting integrated technological information about the results of their activities, and a set of automated, information and intelligent dispatch control systems (information and control systems, ICS), ensuring coordination and control of the work of technical agents, respectively (Figure 1).
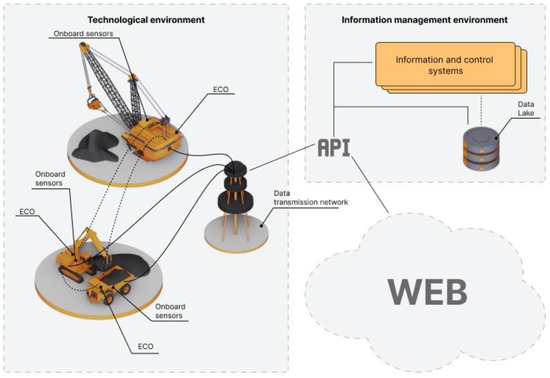
Figure 1.
Enlarged landscape architecture of the structural–functional environment of a mining enterprise.
However, mining enterprises, both open-cast and underground types, due to the specifics of technological environments, are traditionally characterized as objects with a “problematic” data transmission network [18]. Despite the high relevance, importance and critical need to obtain continuous information about the progress of production work, existing data transmission networks have significant limitations on bandwidth and coverage areas. Today, not a small number of solutions are offered for the use of modern technologies and data transmission protocols capable of leveling such problems (5G, White-Fi, IIoT protocols, etc.), which should significantly increase its performance and provide a through-flow of low-level information into the “upper-level” control contours for operated software systems. However, such solutions are still not widely used due to the need for large economic investments to modernize the transmission network and storage media, the lack of the necessary methodological and regulatory framework for their application in this industry, and the de facto lack of an obvious need for such modernization due to the lack of a few ready-made scalable solutions of Industry 4.0, for which such modernization is carried out.
Thus, from the standpoint of the tasks of collecting and presenting data in the information space of the enterprise, it should be borne in mind that at the moment continuous access to a large volume of primary data from terminal nodes is not possible, and, therefore, when solving subsequent tasks of information analysis, it is necessary to take into account the initial position of the “integrality” of parameters, that is, work with discrete averaged values, which may not always adequately describe the operational situation in the technological environment and allow you to build high-precision computational models. Based on this alone, it can be concluded that such data may carry “anomaly” values caused by software or technical failures, incorrect calibration of sensors or configuration of data preprocessing schemes. Such problems are unavoidable, and their elimination in automatic modes is not possible; however, the impact of such problems on subsequent calculations and, in fact, the efficiency of production process management can be leveled by introducing methods for detecting and identifying anomalies that exclude invalid values from the processed data arrays.
2.2. Requirements for Intelligent Data Processing Functions
The next task or group of tasks includes the analysis of the information received, which is the central problem of energy efficiency assessment and where it is more necessary to use data mining methods to build various kinds of computational models. This problem can be presented in the form of a recursive group of subtasks for calculating and evaluating actual indicators relative to the calculated (normative, planned, predicted), forming their predictive assessment, constructing and/or adjusting planned values. Thus, the implementation of processes in mining enterprises is carried out by building a production plan that regulates the required volumes of work (extraction of minerals) and its subsequent decomposition into equal time cycles to single shift tasks for specific energy-consuming objects. In accordance with the volume of work on the shift task, the required amount of energy resources for the ECO is calculated (in the form of a calculated or heuristic estimate), based on which an integral estimate of the volumes and a plan for the purchase and consumption of energy resources is formed. In cases of detecting discrepancies between actual indicators and planned and/or predicted, management personnel make decisions to adjust the plan and/or change the operating modes of the ECO, which in a general sense can be understood as instructions to increase or decrease the pace of work.
Due to the continuity of the production processes themselves and, consequently, the continuous operation of the equipment, for the initial assessment of the compliance of the actual indicators with the calculated ones, it is necessary to have additional technological and operational information. As such information, both the exclusively nominal passport consumption of the engine consumption of a particular ECO can act, and cumulative operational changes in the nominal consumption, in which it is already necessary to operate not only with the initial passport characteristics but also changes caused by the operating hours, operating modes, and other qualitative and quantitative parameters of the results of technical inspection and repair of equipment. Formalization of such information in the form of explicitly specified numerical parameters for constructing any computational procedures is a time-consuming task and, as a rule, their application remains at the level of vaguely defined terms for subjective expert evaluation during dispatcher analysis of the state of the ECO and the quality of production processes.
An important factor affecting the consumption of energy resources is also the impact of natural weather and climatic phenomena (especially for quarries), such as seasonal changes in ambient temperature. However, as in the case of technological and operational data, such information is not formalized in the form of explicit numerical parameters for subsequent calculations and is used as fuzzy defined terms of expert analysis. In some cases, when making forecasts and production plans with a long-time horizon, accounting for weather and climatic phenomena is expressed as an average (pseudo)statistical evaluation of seasonal fluctuations in production indicators. In other words, it is not the specific current parameters of the influencing factors that are considered but the historical values of production indicators taken as targets.
Nevertheless, due to the nonlinearity of processes and the stochastic nature of possible events—accidents and repairs of ECO, weather and climatic phenomena—the construction of a forecast and a plan for energy consumption should proceed not only from statistically observed values, but also from a dynamic assessment of the current situation, taking into account a complex set of loosely coupled factors. In general, such solutions are possible using data mining and machine learning methods, which has been confirmed in a large volume of scientific and engineering works [5,6,7,16,29,30,31,32]. The formation of the initial feature space of the training sample, although it may cause difficulties, should not be a significant problem in the way of applying such methods.
Summarizing the above, we will list the main functional tasks that must be solved within the framework of the energy efficiency management system of a mining enterprise:
- Calculation of the ratio of the actual consumption of spent energy resources to the volume of work performed for a separate ECO for a discrete unit of production time;
- Predicting individual indicators of energy consumption volumes per discrete unit of production time;
- Assessment of the projected individual energy efficiency indicators (the ratio of the projected energy consumption to the planned volume of work);
- Calculation of deviation of actual indicators of energy consumption from predicted and/or planned;
- Calculation of integral estimates of the actual consumption of energy resources by types of ECO, types of energy resources, and types of production work;
- Calculation of integral energy efficiency indicators by type of ECO, type of energy resources and type of production work;
- Calculation of integral energy efficiency indicators by type of ECO, type of energy resources and type of production work;
- Predicting integrated energy efficiency indicators by type of ECO, type of energy resources and type of production work;
- Planning of energy consumption by type of ECO, type of energy resources and type of production work;
Of course, in the context of managing mining companies, the listed list of tasks can be expanded to include functions such as grouping indicators by structural units (site, workshop, enterprise, holding) and cross-analysis of ECO indicators. However, such functions are more likely to have the nature of data representation problems than their calculations, as a result of which less attention is paid to them in this paper. It should be noted that the problems of data presentation lie precisely in the complete absence of unified approaches to energy management in the industry, which consists of high variability and individual formalization of the types and parameters of energy resources, types of work, types of ECO and methods of assessing the energy efficiency indicators themselves at each individual enterprise. Moreover, not all enterprises have a completely uniform set of information sources (operated software systems, primary data collection tools, etc.), which may differ both in the actual absence of the necessary sources and in their structural–functional implementation, imposing several restrictions on the viability of universal computing models. So, for example, not every enterprise can have its own meteorological station that provides the necessary operational data on weather and climatic phenomena in the production environment; as a result, a prediction model built considering the use of data of this kind may be meaningless.
In this regard, the following functional requirements for the system should be additionally noted:
- Declaration of the minimum set of parameters required for calculations and fully covering the feature space of factors influencing energy efficiency indicators;
- Identification of data in the information space, their automatic modification and conversion to the format of input parameters of models;
- End-to-end integration of software components to obtain parameters from external (relative to the contour of the enterprise) information sources.
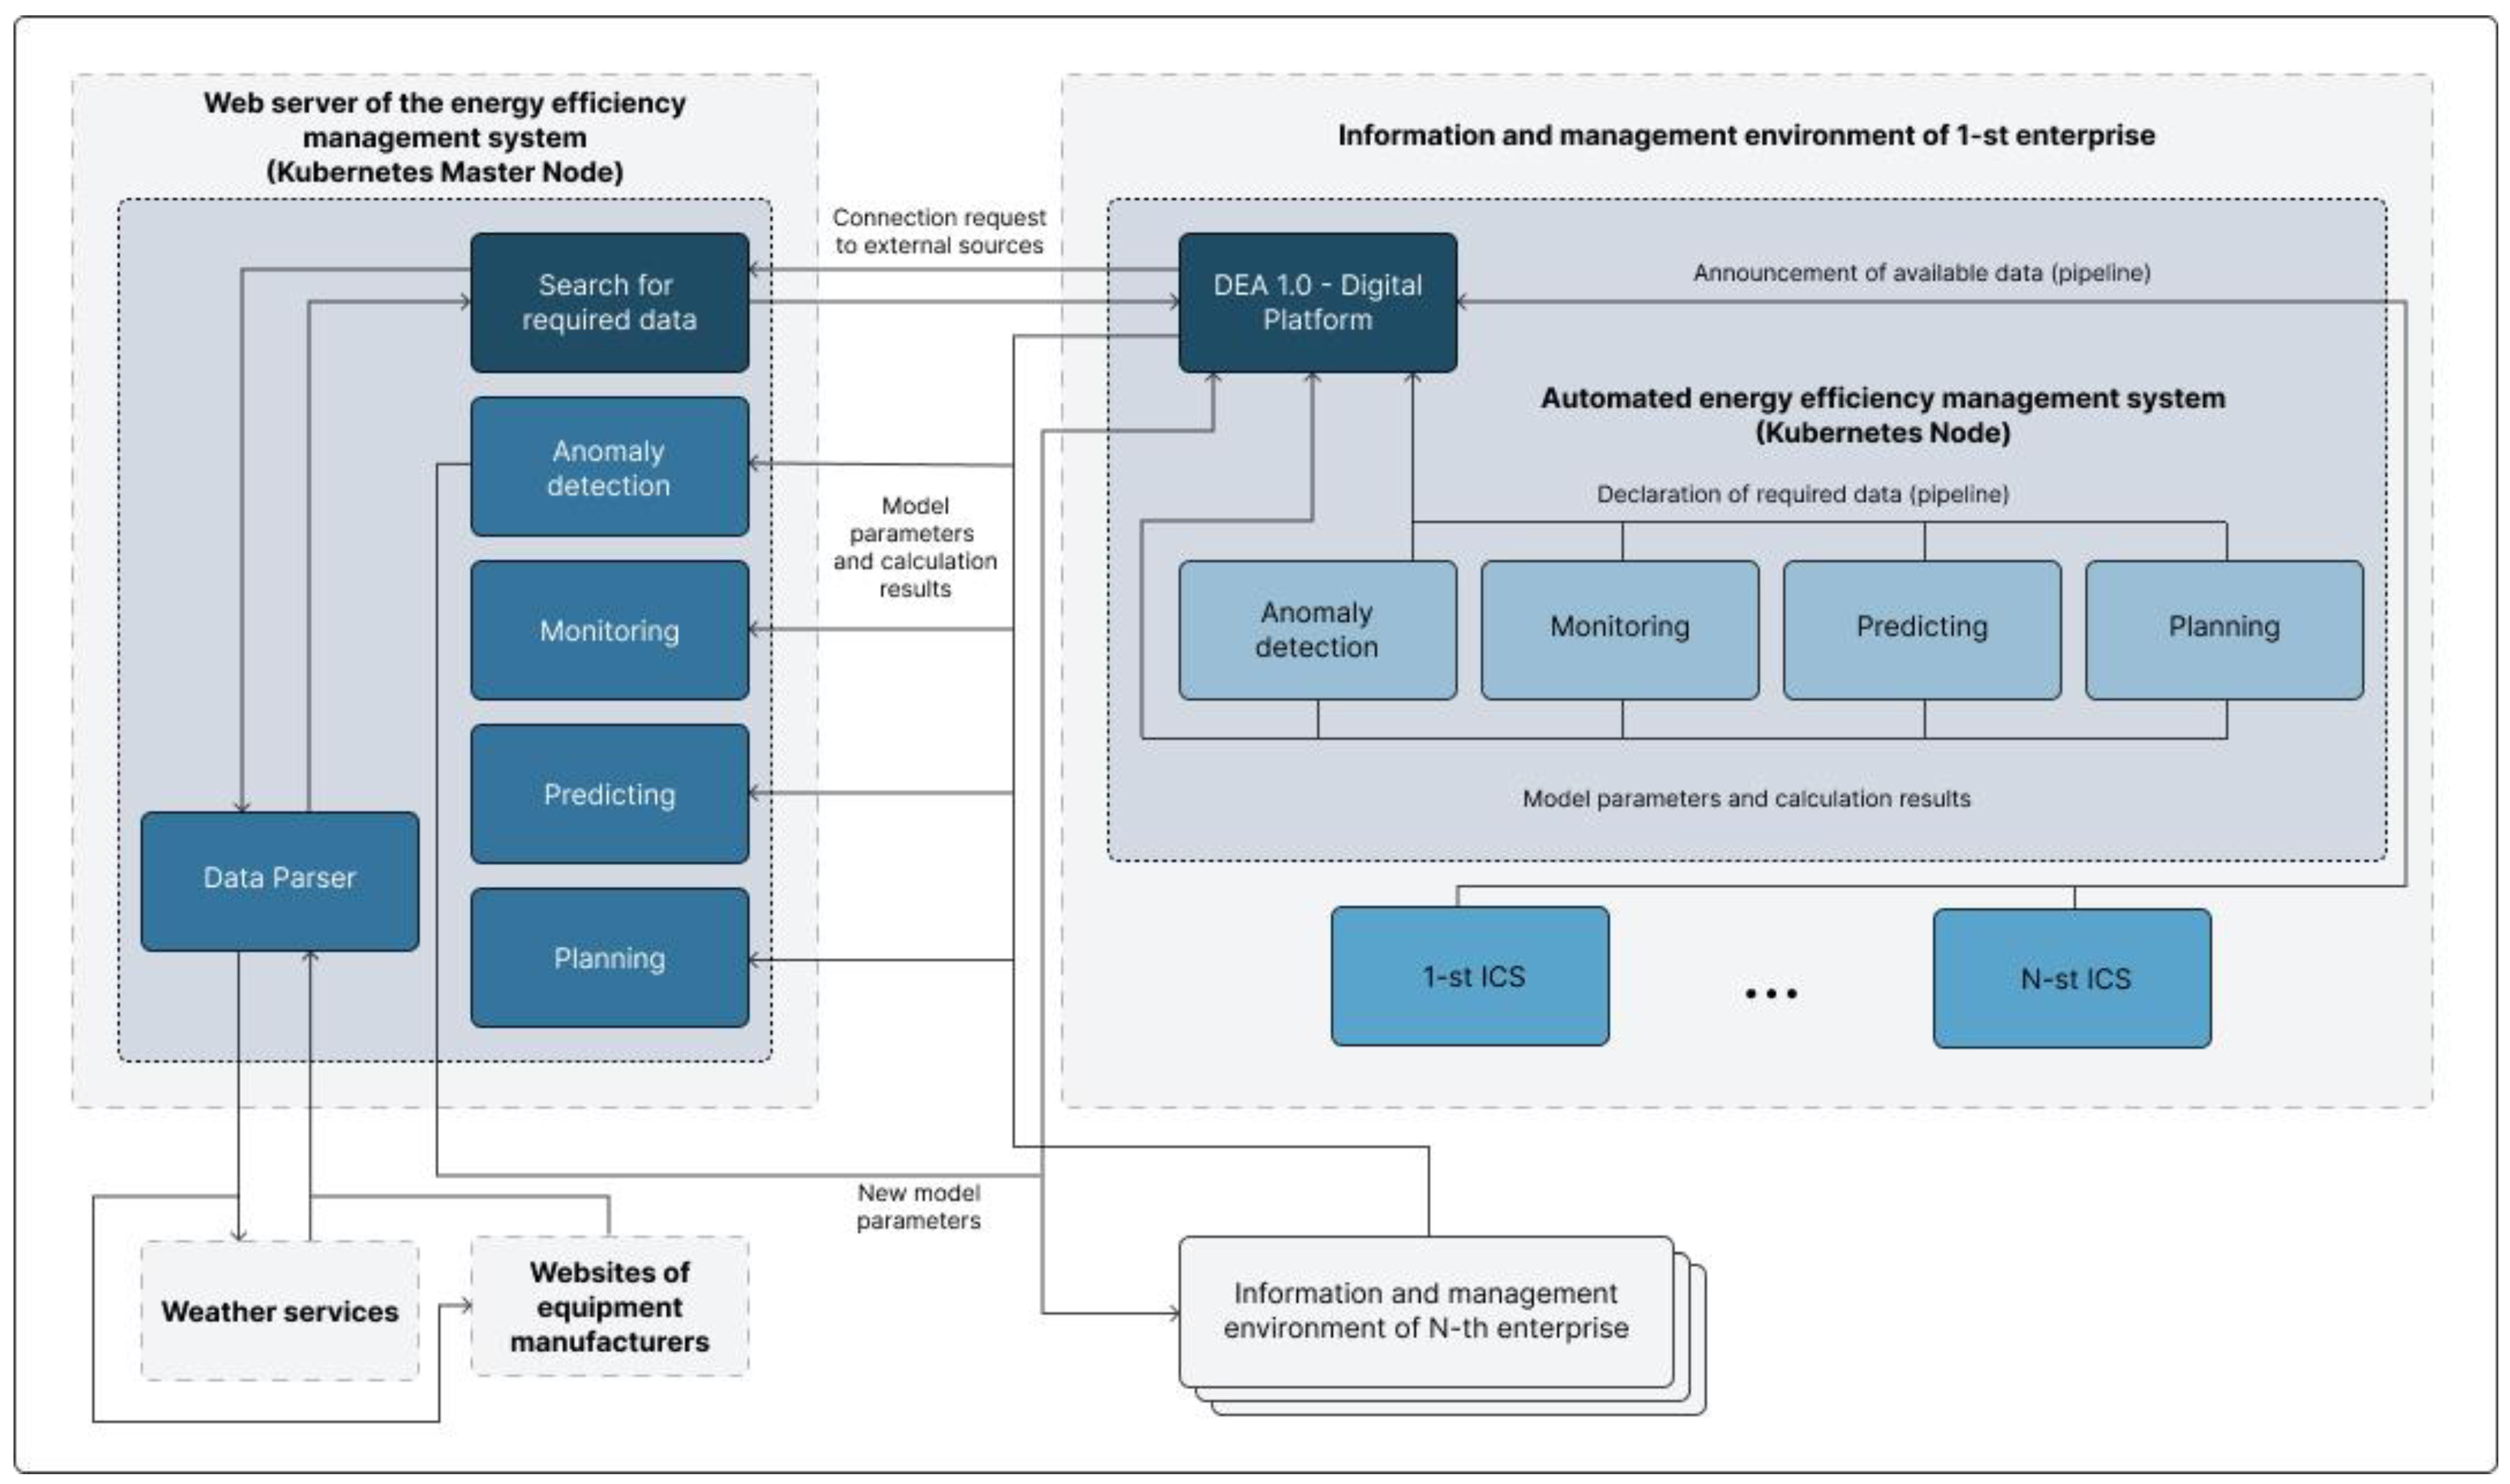
The listed additional functional requirements, generally speaking, can be replicated to any modern software system as part of the digital transformation of industry in the concept of Industry 4.0. In our earlier works, we gave both a justification for the need for such requirements and an example of their implementation in the form of a reference meta-model of the architecture of an industrial enterprise, DEA 1.0 (Digital Enterprise Architecture) [33]. The proposed model of data-centric microservice architecture formalizes the ways of building functional components of the system and the processes of information exchange between such components through specialized services, conventionally combined by the general term “Digital Platform”, which is also consistent with the results of scientific and engineering research in international and domestic practice [24,25,26,29,31,34].
In accordance with the conceptual architecture proposed in Figure 2, the implementation of the system involves the development of separate functional components—microservices that perform the assigned tasks of energy efficiency management in an independent (automatic) mode. The formation of functional components of decision-making on the management of energy consumption processes at the current stage cannot be considered due to the need to take into account a large number of factors of production, representing a multidimensional space of states of the cycle of technological work. Based only on (18)–(22), it is obvious that optimization calculations by linear programming methods involve risks of a combinatorial explosion. The solution to this problem is generally possible by hybridization of optimization models based on evolutionary or neural network algorithms and models of logical inference (including fuzzy inference) [35,36]. However, for this purpose, the optimization criteria and the corresponding control parameters must be formulated considering the heterogeneity of the types of energy resources consumed and the energy consumption objects themselves, which is a very difficult task that can be considered an independent scientific study. Undoubtedly, in one way or another, the tasks of dynamic power management are widely known, and there are quite a few high-class solutions [5,6,11,12,17,23,31,35,36]. However, for mining industries, this type of energy is not the only one, and in some cases, it may not even be the main one the type of resource. If we consider these tasks from the standpoint of digital transformation, by which we mean the transition to an autonomously functioning production, the construction of management models in isolation from the main process—mining—and the corresponding optimality criteria and control parameters can lead to contradictory logical conclusions and, consequently, the inability to choose a management solution. Moreover, even at the stage of consolidation of the energy consumption plan (22), which potentially should take into account the multidimensionality of production conditions, a number of questions arise about ways to bring different types of energy resources to a single format, which can be leveled only by unifying their presentation and developing appropriate data preprocessing methods. Thus, the primary task is to implement the components responsible for the functions of an anomaly search (data preprocessing), monitoring and predicting energy efficiency indicators of processes.
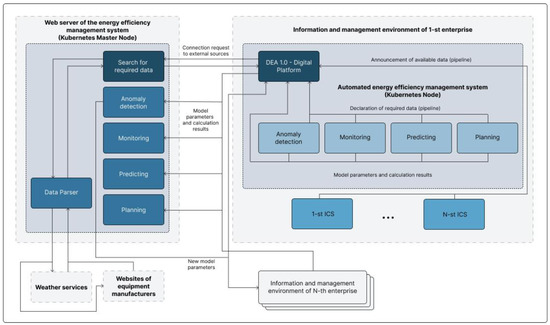
Figure 2.
Conceptual architecture of an automated energy efficiency management system of a mining enterprise.
3. Problems of Constructing Computational Models and Methods of Solution
As already noted, the implementation of the proposed functional components is based on the use of various kinds of computational methods of data mining, which, in turn, are based on training sets of information. Thus, the general methodology of the study suggests the following approach:
- Obtaining primary arrays of technological information (primarily the amount of work performed and energy expended).
- Data preprocessing, including elimination of noise and emissions, as well as grouping into different time intervals (half an hour, hour, shift, day, month, year).
- Conducting data exploration to identify their statistical characteristics, validity and methods of markup/transformation.
- Data enrichment with additional parameters (numerical and categorical features) with verification of statistical linear relationships with the basic parameters.
- Selective selection of objects of the same type and construction of primary computational procedures using various algorithms of intelligent information processing to identify the influence of parameters on target variables.
- Iterative selection of model parameters with the best metrics (accuracy/performance).
- Formation of final models.
If we talk about such functions as (1) and (6)–(11), then, of course, they do not require any complex calculation methods, but for unambiguous determination of energy efficiency indicators, a clear understanding of the following basic parameters is necessary:
- ECO model (object type, series, number, passport characteristics);
- Type of energy consumed (electricity, diesel fuel, etc.);
- Units of measurement of energy resources;
- Type of work performed;
- Units of measurement of the type of work;
- Threshold of the normal value of specific energy consumption;
- The actual indicator of the volumes of energy resources spent;
- The actual amount of work performed; planned scope of work.
Most of these parameters are produced by the operated information and control systems of enterprises and fall into a distributed data warehouse, from which they can be accessed for subsequent calculations. However, some of these parameters do not have strict formalization, which leads to the need for the individual configuration of a large number of unique computational operators of the system. For example, a big problem is the determination of the actual specific energy consumption due to the fact that each of the 11 enterprises studied adopted different designations of the same type of work, for which their units of measurement corresponded and, mainly, the thresholds of the normal value of specific energy consumption. It is also worth noting that the list of types of work at enterprises varies in the range of 200 to 430 units, even though monotonous technological operations are performed to a greater extent at enterprises. This is explained by the fact that in some cases, enterprises required an individual configuration of business logic to increase the convenience of information perception by personnel, and in others by improper work with databases, which is why one type of work could have two or more designations. Additionally, in most cases, the threshold of normal specific energy consumption was set for certain types of work based on expert assumptions by specialists of enterprises, without considering the specifics of a particular ECO, not to mention taking into account real statistical patterns and seasonal fluctuations in production indicators. In particular, it should be said that the main types of ECO that require energy efficiency monitoring include mining (excavators and combines) and transport (dump trucks and railway locomotives) equipment, among which there is also a fairly wide variety of brands, series and passport characteristics corresponding to them, which complicates the processes of unification of approaches to energy management.
Nevertheless, at the beginning of work on the modernization of the current automated energy efficiency management system as part of the implementation of functions (2)–(5) and (12)–(17), we proceeded from the assumption of the representativeness of the data obtained from the information databases of enterprises. The primary dataset consisted of a set of parameters: ID ECO, type, brand and series of ECO, type and units of measurement of energy consumed, types and units of measurement of work performed, the start and end dates of shifts, the time of registration of production indicators and the type of work corresponding to this time, the actual amount of energy consumption, and the amount of work performed for each cycle of the registration time for 273 ECO. The data were aggregated with a half-hour periodicity for 708 days, so that the total array consisted of 9,277,632 unique records. Due to the high variability of parameters for a more adequate assessment of the initial data, ECOs were grouped according to the principle of identity of series and brands of manufacturers, regardless of their service life.
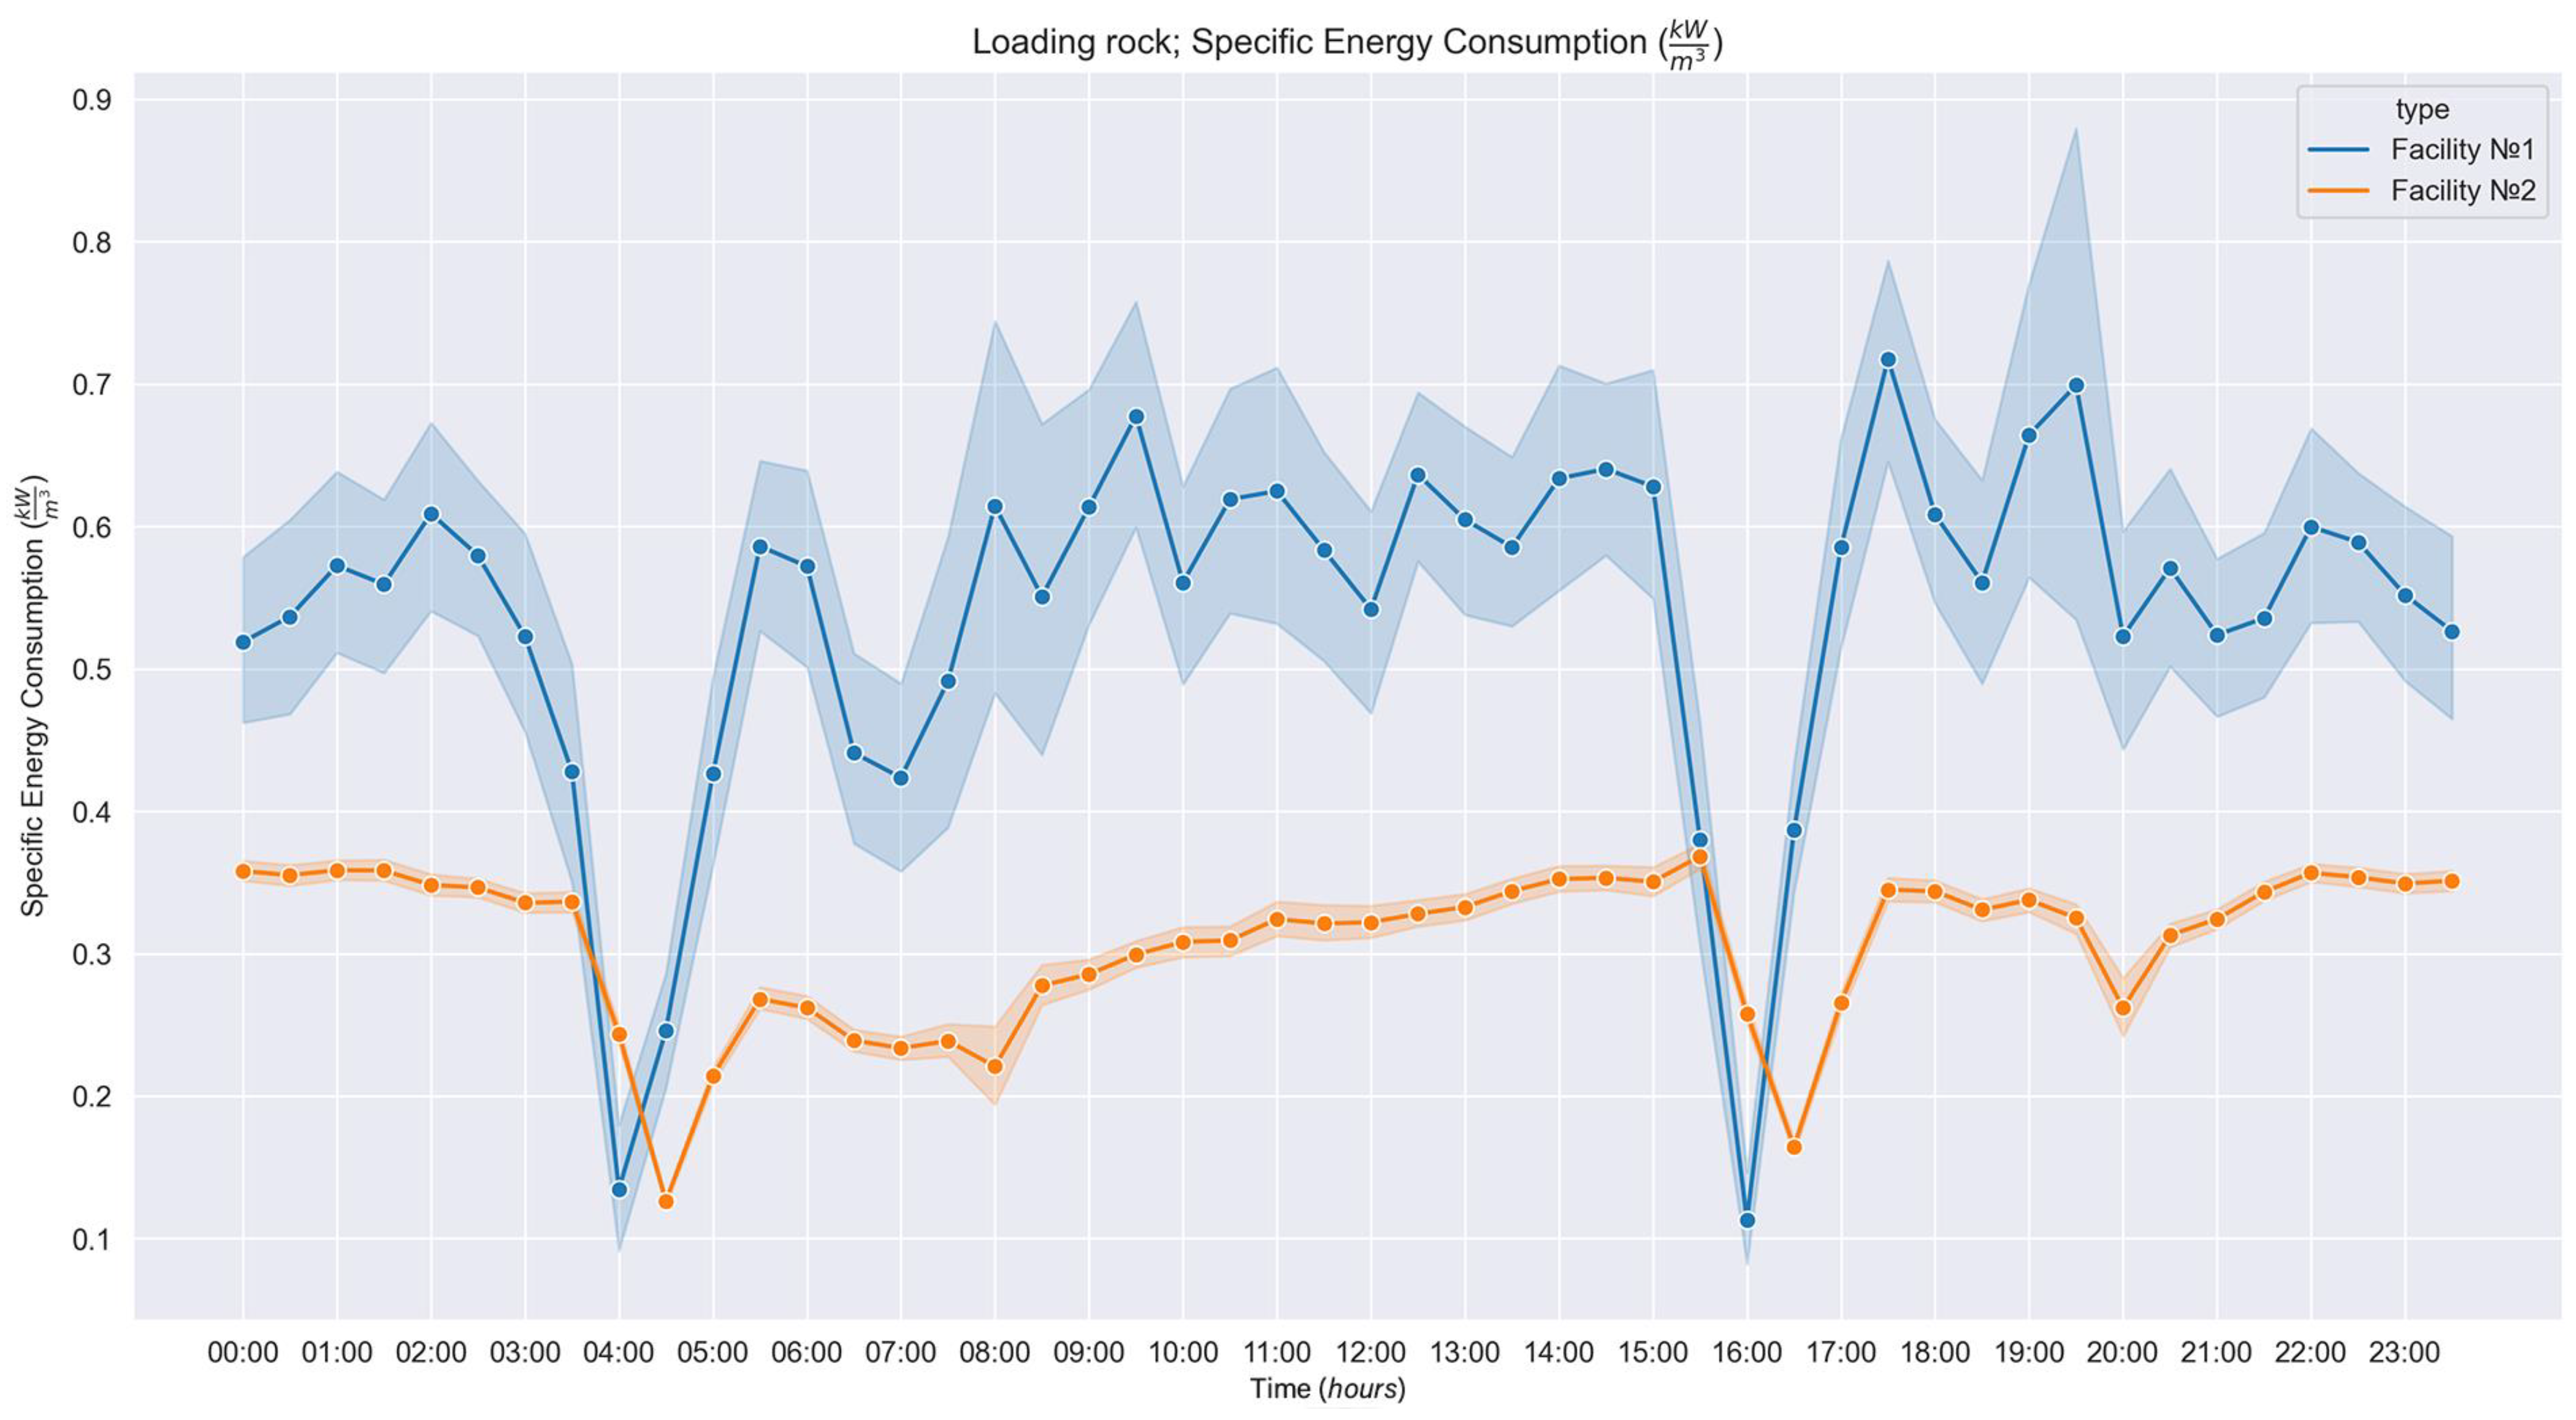
As an example, Figure 3 shows a graph of specific energy consumption (the ratio of energy resources consumed to the amount of work performed) for excavators “straight shovel” EKG-5A at two enterprises (7 units of ECO) for the type of work “loading rock mass”. The initial data were preprocessed, during which possible emissions were excluded (95% of the data were used) for the excavators of each enterprise (4 and 3 ECO units, respectively).
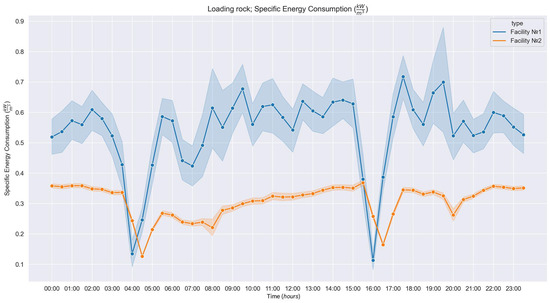
Figure 3.
Distribution of specific energy consumption values.
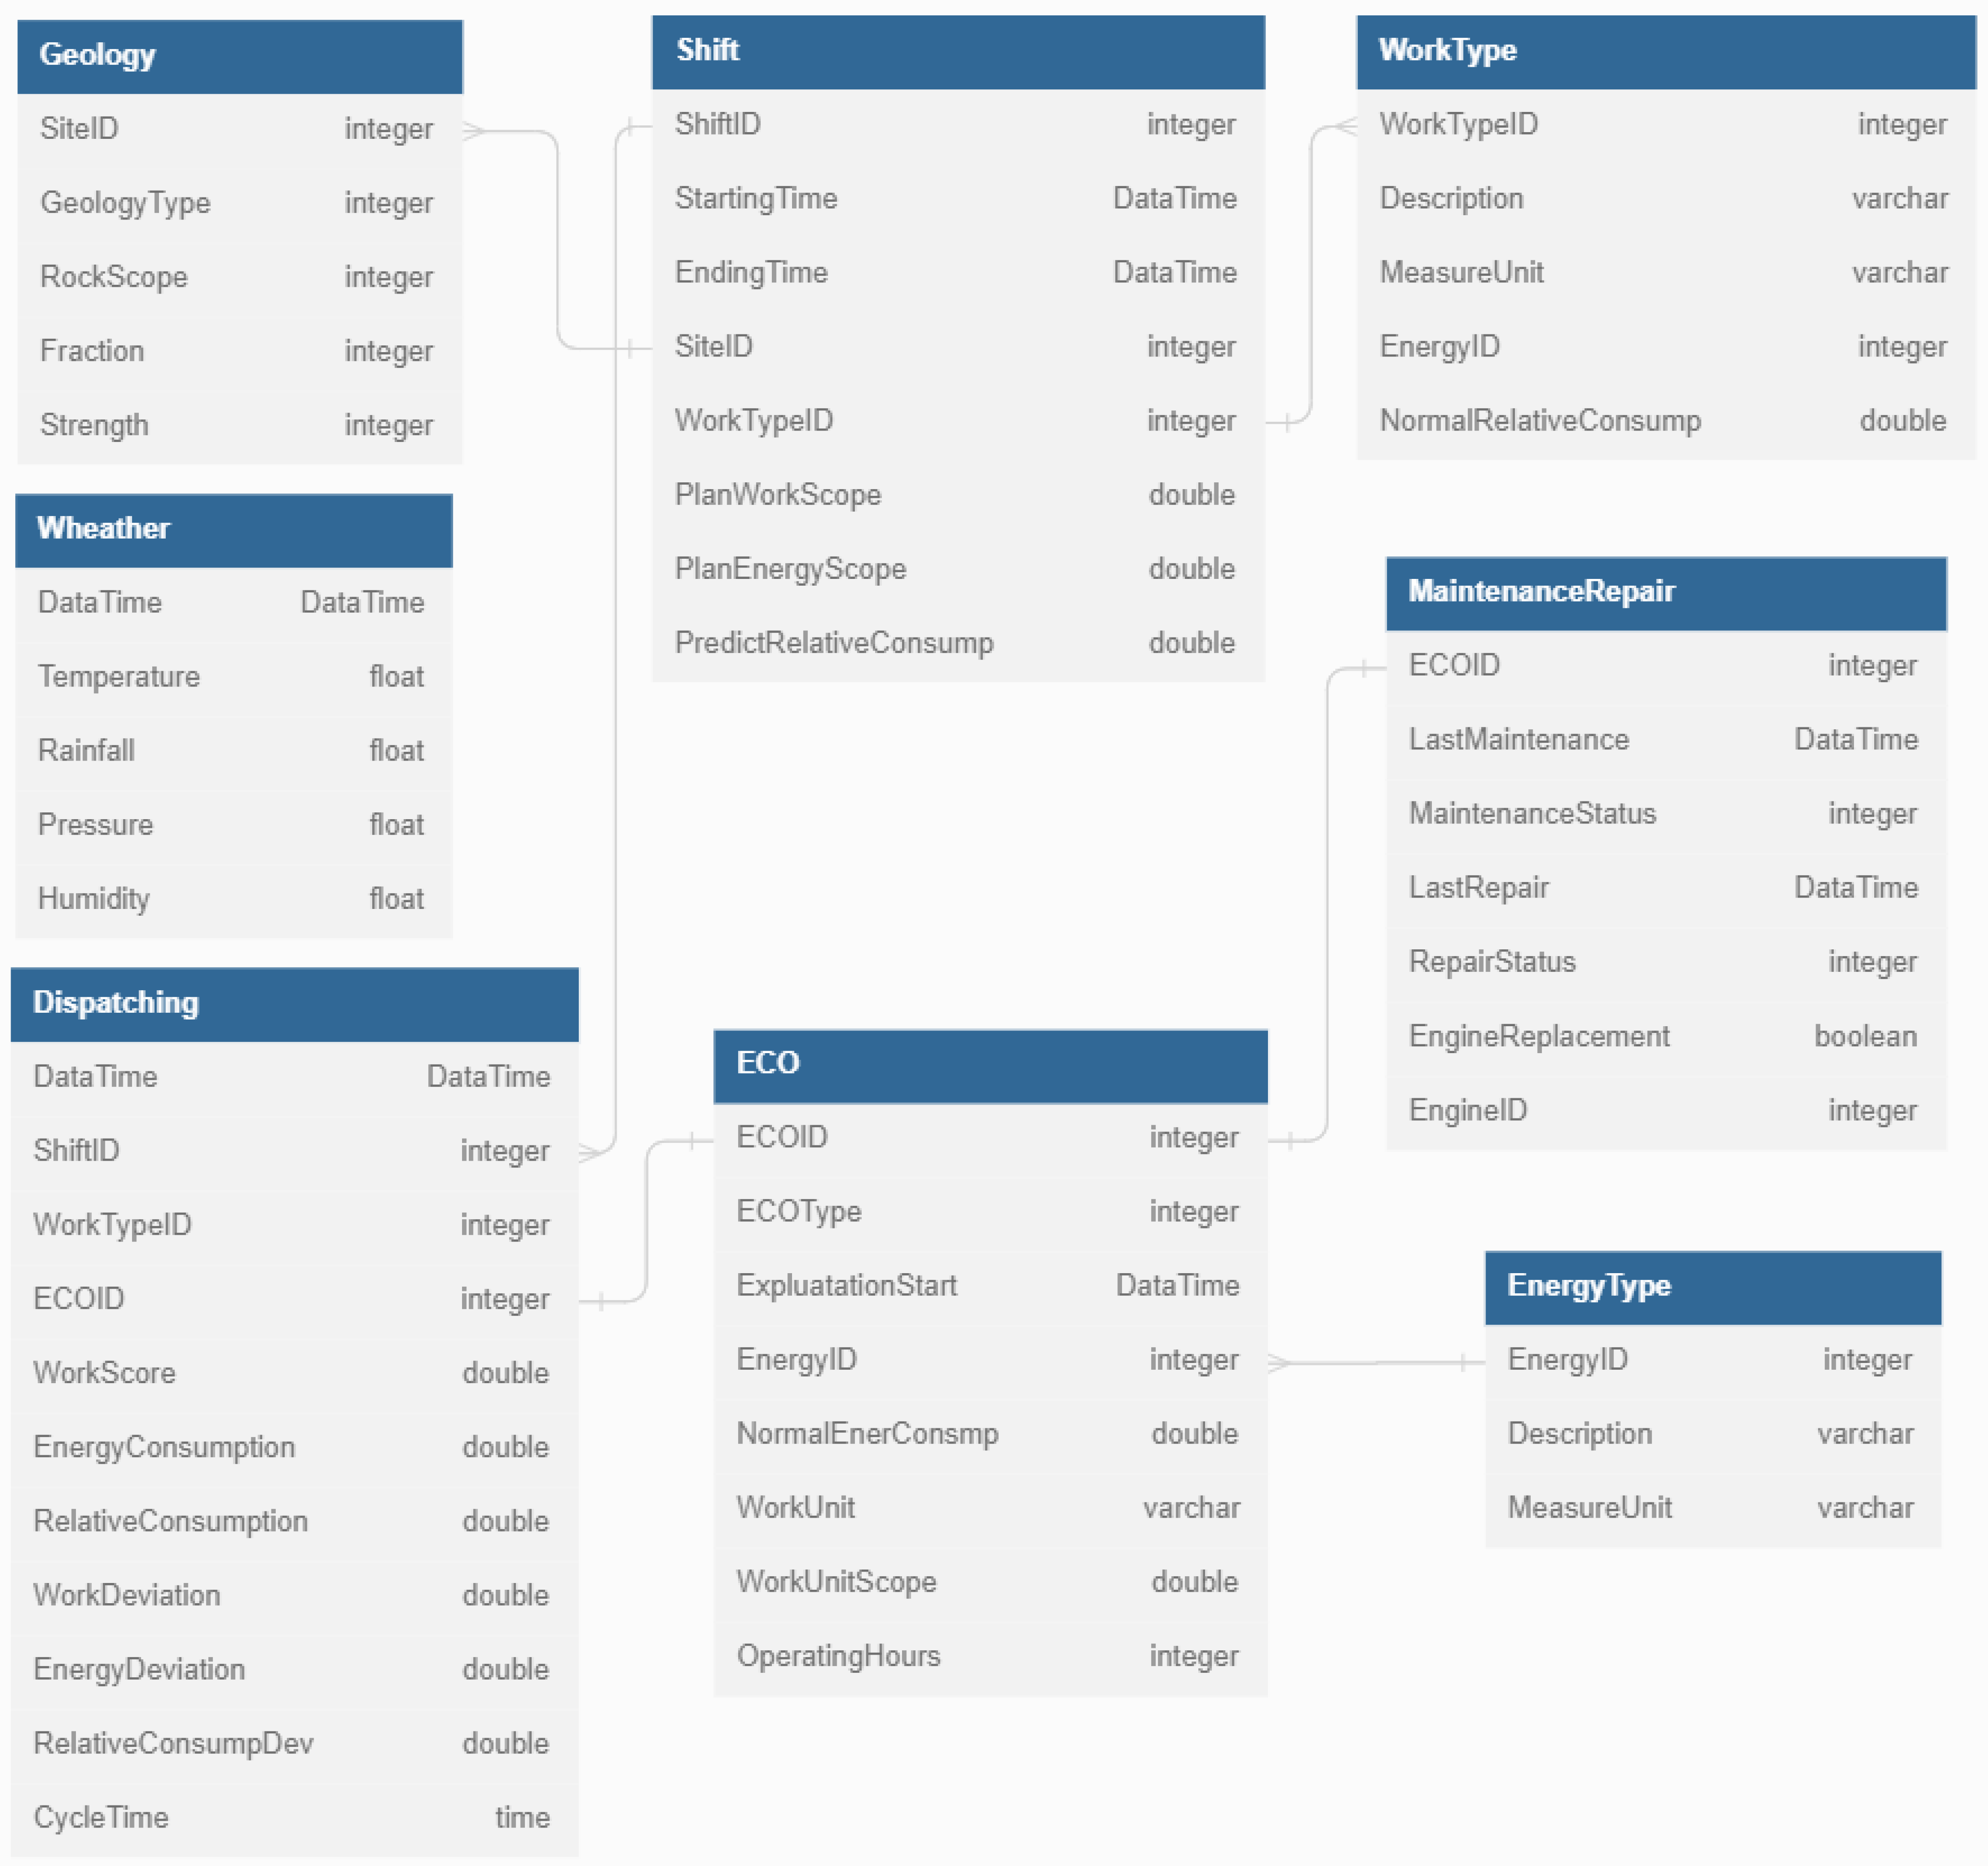
As can be seen in the graph, the distribution of data for two enterprises for identical ECOs and types of work differ significantly both in the median value (lines-points) and the scope of the confidence interval. Such a trend was observed for other types of work, which, of course, could be justified by the specifics of the organization of technological processes, the need to consider seasonal fluctuations, wear of equipment, different levels of professionalism of equipment operators, etc. However, the initial hypothesis about the possibility of forming universal computational models for the same type of energy-consuming object has been subjected to certain doubts. Nevertheless, we have put forward a few additional hypotheses about the need to include in future analytical models a set of features that take into account both formal engineering approaches to methods for assessing individual energy consumption indicators of excavators and considerations from the field of the organization of technological processes of mining industries. The generalized component data scheme proposed by us for the construction of such models is shown in Figure 4.
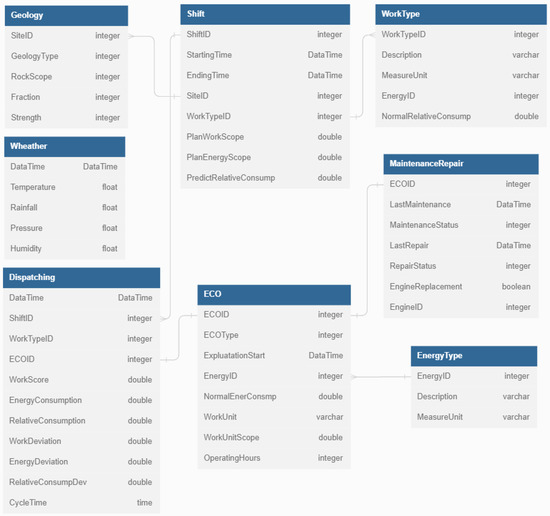
Figure 4.
Conceptual data model for solving energy efficiency management problems.
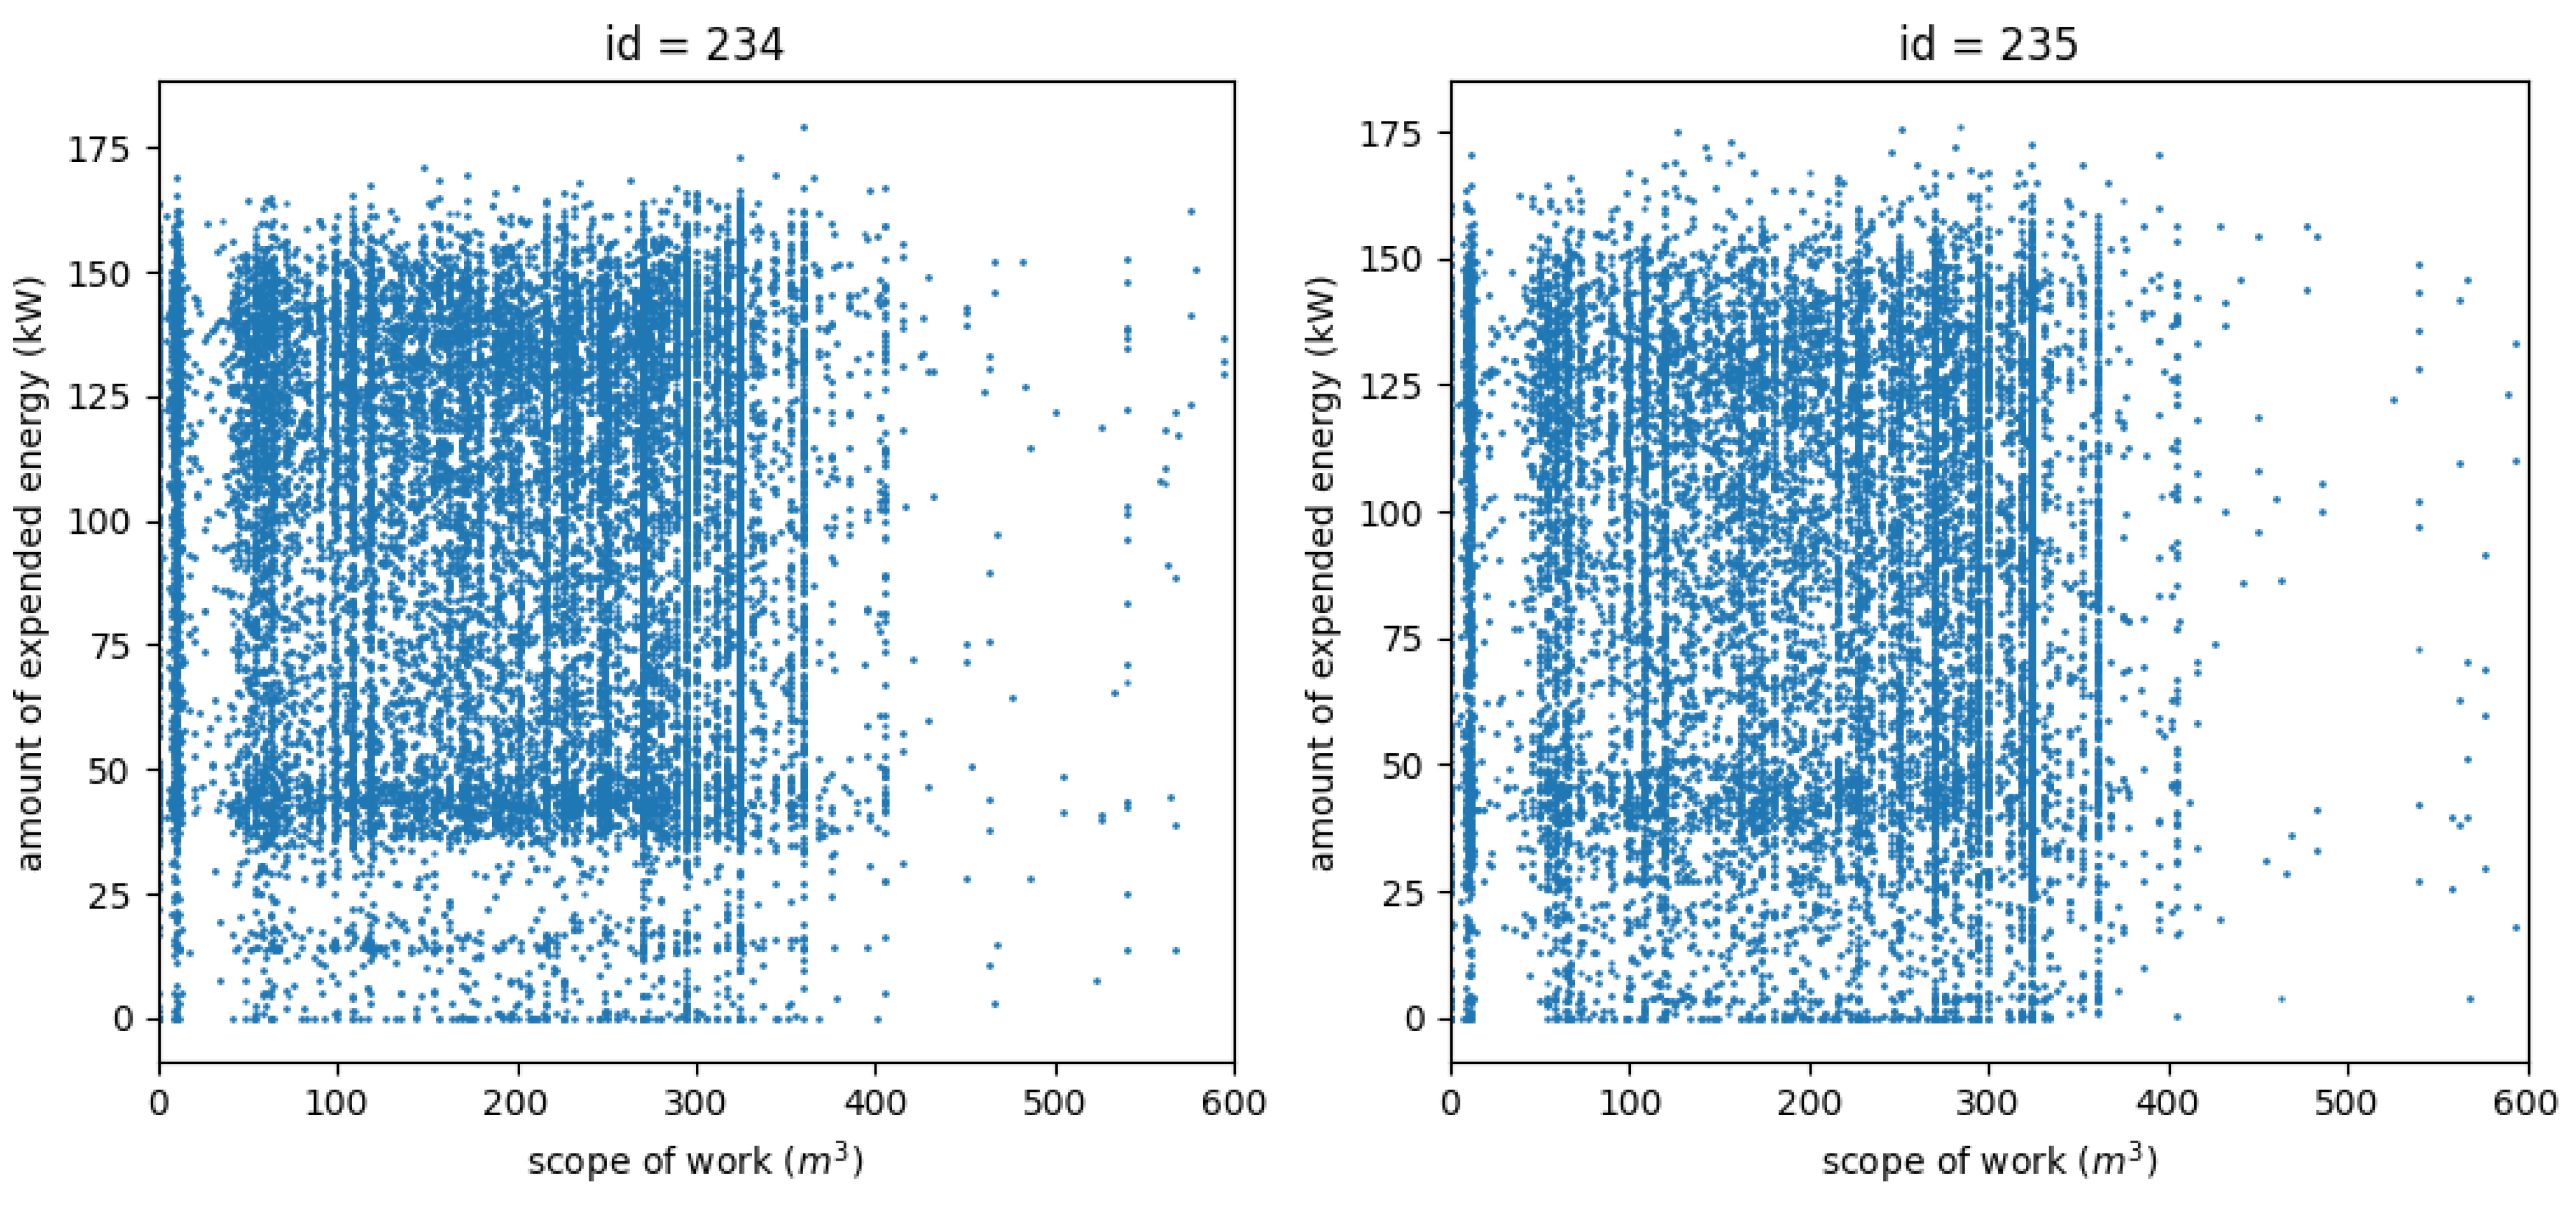
In order to check the influence of the proposed features on the basic production parameters, we began to carry out a correlation analysis of the linear relationship of weather and climatic conditions with the amount of work performed and energy expended. However, most of the results ranged from −0.1 to 0.1, which is somewhat inconsistent with our understanding of the technological processes of mining production. Eliminating possible errors in data preprocessing, repeated calculations showed that the correlation remained significantly lower than the expected values. As a result, we have several doubts related both to the incorrectness of the hypothesis about the existence of a connection in general and to the lack of representativeness of the initial data (incorrectness of production indicators). Obviously, there should be a strong linear relationship between the parameters “volume of work performed” and “volume of energy resources spent”. However, when obtaining correlation graphs for these two parameters, we determined the complete absence of a linear relationship (Figure 5), which caused serious concern.
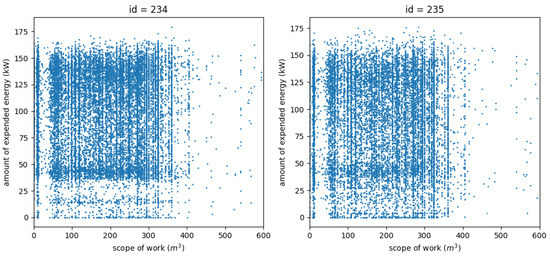
Figure 5.
Correlations of the scope of work performed and energy expended for two separate ECO.
During further definitions of the reasons for the absence of an explicit formal dependence, we were convinced that the original dataset obtained from the information databases of enterprises contained many invalid values. For further research, the operation logs of the automated energy management system were used, which reflected all the requests of users (employees of enterprises) and comments from specialists responsible for the development and technical support of the system. According to include the results of the analysis of the information in the journals, many recorded facts of anomaly data behavior caused by several objective and subjective factors were revealed, for which the following classification scheme was given:
- Technical reasons: These are understood as problems with the functioning of data collection and processing facilities.
- Technological reasons: These are understood as problems related to operational changes in production and the specifics of the organization of business processes in general.
- Human reasons: These are understood as situations of accidental or malicious distortion of information about the modes and work plans of the ECO, as well as the concealment of facts of inappropriate consumption of energy resources.
In the future, this classification scheme was expanded to the typical causes of data anomalies in accordance with the description of the system operation problems recorded in the logs:
—sensor failure: cases of failure of on-board ECO data acquisition devices;
—sensor calibration failure: cases of hardware or software failure in the operation mode of on-board data acquisition devices;
—data transmission network failure: cases of lack of Internet connection in the information management environment of the enterprise;
—error when writing to the database: cases of failure of elements of the information management environment at the time of saving data in the systems databases;
—database access error: cases of incorrect access to the systems databases to obtain data;
—ICS failure: cases of disconnection of information and control systems of the enterprise;
—error in calculating the parameters of the ECO operation in the ICS: cases of incorrect calculations of the integral indicators of the ECO operation;
—non-standard change of units of measurement: cases of changes in units of measurement of ECO performance indicators;
—unauthorized modification of data in the ICS: cases of making changes about the actual performance of the ECO period of time;
—changing the mode of operation of the ECO: cases of operational changes in the modes of operation of the ECO, undeclared in the ICS;
—change of planned indicators: cases of operational changes in the planned performance indicators of the ECO.
In total, 5,940,806 records containing anomalous data were recorded in the initial array of 9,277,632, which accounted for 64% of all observations (Table 1), of which 12% were related to technical reasons (8% of all observations), 35% to technological (22% of all observations), and 53% to the human factor (34% of all observations). For our part, we would like to refrain from any comments on the discussion of the results of this analysis; however, this state of affairs significantly complicates the tasks both in the field of constructing any computational models of intelligent data processing and the actual fulfillment of the requirements of the energy management standard.

Table 1.
The number of unique data values for reasons of data anomalies.
In this regard, the obvious need arose to develop methods for detecting and identifying anomalies in order to automatically exclude them from the available information arrays for further work and for the subsequent functioning of the system in accordance with the architecture model (Figure 2). Of course, appropriate approaches based on methods of statistical and intellectual information processing are known to search for anomalies in the behavior of objects [37,38,39,40]. However, taking into account the initial causes of the anomalies and the visual representations of their manifestations, we decided to form a classification scheme and heuristic search methods.
Therefore, the observed anomalies can be classified as follows:
—zero values:
—non-zero amount of energy resources with zero volumes of work:
where is the current value of the energy volume at the moment , and is the current value of the volume of work performed.
—zero volume of energy resources with non-zero volumes of work:
—single peak values:
—a sharp increase in the volume of energy resources while maintaining the volume of work:
where is the standard deviation of energy consumption for the same type of ECO for all enterprises at a discrete time , is the average value of the volume of work of the general population, and is the standard deviation of the volume of work of the general population.
—a sharp decline in the volume of energy resources while maintaining the volume of work:
—saving the volume of energy resources with a sharp increase in the volume of work:
—saving the volume of energy resources in case of a sharp decline in the volume of work:
—missing values:
—lack of data on the volume of energy resources in the presence of volumes of work:
—availability of data on energy consumption in the absence of work performed:
—trend deviation trend:
—exceeding the expected volumes of energy resources for the completed volumes of work:
—reduction of expected volumes of energy resources for completed volumes of work:
—exceeding the expected volumes of energy resources and works:
—reduction of expected volumes of energy resources and works:
—exceeding the expected amount of work for the energy consumed:
—reducing the expected amount of work for the energy expended:
In accordance with the proposed heuristic procedures for finding anomalies, the original dataset was processed in order to determine the adequacy of the proposed solution by comparing the known facts of the anomalous behavior of the parameters and the identified ones. Table 2 shows the actual distribution of data on known anomalies and the causes of their manifestation.

Table 2.
The number of unique data values for reasons of data anomalies.
Estimates of the accuracy of anomaly detection for each of the proposed procedures are given in Table 2, while the overall accuracy (arithmetic mean) of anomaly detection was 0.92.
4. Discussion
As can be seen from the results obtained, the proposed methods for searching for anomalies allow us to discuss some perspective in terms of improving the accuracy and reliability of the energy efficiency management system. The problems of not fully determining all known facts of anomalous data behavior are explained by the following reasons:
- First, we proceeded from the generalization of the general set of information on all 11 enterprises and used a static approach (standard deviations) in terms of methods, which did not cover the cases of individual enterprises and energy-consuming objects, which are characterized by deviations of a smaller dimension. On the one hand, it is possible to narrow the thresholds of deviation of values; however, in the paradigm of the unified approach, this may lead to the complete exclusion of some data arrays and, as a result, affect the generalizing ability of subsequent computational models. On the other hand, it can be said that those deviations of values that have not been detected are rather a “subnormal distribution” and can be used for a general analysis of the activities of mining industries, and the enterprises themselves that produce such data have a stricter organization of production and methods of monitoring the activities of ECO;
- The preprocessing and marking of data for typical causes of anomalies was carried out by us in semi-automatic mode, during which the logs of the system operation were viewed, and the causes and time ranges of anomalous data were determined for subsequent comparison with actual data. The data itself, due to its large volume, was viewed selectively, which could lead to incorrect determination of data behavior or false capture of unnecessary ranges of values;
- It is also possible that the hypothesis of the applicability of the heuristic approach to the search for anomalous data values may be questioned, and the problem itself should be solved using more complex (intelligent) data processing methods, which will be tested in our future work.
From the position of the original research methodology aimed at forming the functions of predictive analysis of energy efficiency indicators, the results of statistical analysis and the proposed procedures for finding anomalies allow us to say the following:
- Based on the exclusion of invalid values from the original data array, it is possible to proceed to further steps to enrich it with additional features and directly build intelligent computing procedures.
- The proposed procedures in the future can (and should) be included in the overall architecture of an automated energy efficiency management system in order to ensure the control of technological information (prompt notification of enterprise personnel about the detection of abnormal situations) and support the viability of predictive analysis procedures by excluding inaccurate and unreliable calculation results.
- The absence of such tools today shows critical problems in the management of energy efficiency of mining enterprises. Now, it is quite difficult to assess the real economic losses caused by the paradoxically low reliability of the information produced, but the fact itself indicates the need to take a number of organizational and technical measures.
In general, based on the formulated proposals for the construction of automated energy efficiency management systems in accordance with the ISO 50001 standard and the Industry 4.0 concept, the following conclusions can be drawn:
- The construction of modern energy efficiency management systems in mining industries should be based on methods of intelligent information processing to minimize the risks of human influence, improve the accuracy and reliability of problem solving, and increase the observability and controllability of processes.
- Direct application of intelligent information processing methods to implement a number of functions in the field of energy efficiency management is impossible without providing data preprocessing tools to exclude anomalous behavior of parameters and end-to-end integration interaction to support the functioning of computational models, including data enrichment from external information sources.
- End-to-end integration interaction is possible by implementing the proposed architecture model of the energy efficiency management system, implying the organization of the interaction of functional components in the form of a data-centric microservice architecture (DEA 1.0).
- Data enrichment should be carried out automatically in accordance with declarations about the required parameters by the functional components of the system. At the same time, the actual set of parameters, in accordance with Figure 4, can be refined at the stage of constructing the corresponding computational models.
- The detection and identification of anomalous behavior of parameters can be implemented using heuristic procedures based on generalized statistical estimates of the behavior of the general dataset for all available energy-consuming objects of the same type. At the same time, the search for anomalies should be carried out in a continuous mode at individual enterprises, and the generalization and correction of statistical parameters of search models should be carried out in an integral form.
At the same time, it should be noted that for a number of tasks, especially such as the construction and consolidation of a plan for the purchase and consumption of energy resources, it is necessary to unify the data structures produced by the operated information and control systems of enterprises. Due to the impossibility of making any changes to such systems, the uniformity of parameters can be organized on the side of the energy efficiency management system. In particular, units of measurement of energy resources can be reduced to a single form, for example, kJ, and within the framework of the functioning of an automated system, data received in other units of measurement can be subjected to automatic preprocessing (including methods of anomaly detection) to determine the operators of their translation to the desired format.
In further work on this study, we plan to present methods for automatically translating data units by algorithmizing decision-making procedures for excluding or converting parameters based on heuristic and statistical procedures. As an example of such procedures, statistical comparisons of the data obtained for a specific EPO with an integral confidence interval for this type (series and brand) of EPO can be used. In the case of a clear discrepancy between the obtained values and the confidence interval, procedures for automatic conversion of units of measurement to those established in the energy efficiency management system can be applied. If, after the transformation of the parameters, they begin to coincide with the expected confidence interval, then the data obtained cannot be fixed as anomalous. However, it is worth noting that this approach is extremely controversial and requires special attention. In particular, much attention will be paid to the development of the already designated computational procedures for predictive analysis of energy efficiency indicators in continuation of the stated research methodology.
Author Contributions
Conceptualization, U.R. and S.D.; methodology, U.R. and S.D.; software, U.R.; validation, I.T. and A.I.; formal analysis, I.T. and A.I.; investigation, U.R.; resources, E.K.; data curation, E.K.; writing—original draft preparation, S.D.; writing—review and editing, I.T.; visualization, E.K.; supervision, I.T.; project administration, S.D.; funding acquisition, I.T. All authors have read and agreed to the published version of the manuscript.
Funding
This research was funded by the Russian Science Foundation, grant number 23-11-00197.
Data Availability Statement
The data presented in this study are available at the request of the corresponding author. The data are not publicly available due to the content of confidential information/trade secrets in them.
Conflicts of Interest
The authors declare no conflict of interest.
References
- Lawrence, A.; Thollander, P.; Andrei, M.; Karlsson, M. Specific Energy Consumption/Use (SEC) in Energy Management for Improving Energy Efficiency in Industry: Meaning, Usage and Differences. Energies 2019, 12, 247. [Google Scholar] [CrossRef]
- Peng, L.; Zeng, X.; Wang, Y.; Hong, G.-B. Analysis of energy efficiency and carbon dioxide reduction in the Chinese pulp and paper industry. Energy Policy 2015, 80, 65–75. [Google Scholar] [CrossRef]
- Zhang, Y.; Hong, M.; Li, J.; Chen, X.; Zeng, Z. Benchmarking Analysis of Energy Efficiency Indicators in Paper Mill. Bioresources 2016, 11, 9723–9740. [Google Scholar] [CrossRef]
- Arriola-Medellin, A.M.; Lopez-Cisneros, L.F.; Aragon-Aguilar, A.; Romo-Millares, C.A.; Fernández-Montiel, M.F. Energy efficiency to increase production and quality of products in industrial processes: Case study oil and gas processing center. Energy Effic. 2019, 12, 1619–1634. [Google Scholar] [CrossRef]
- Morgoeva, A.D.; Morgoev, I.D.; Klyuev, R.V.; Khetagurov, V.N.; Gavrina, O.A. Short-term prediction of energy consumption at concentration factory. Min. Inf. Anal. Bull. 2023, 5, 157–169. (In Russian) [Google Scholar] [CrossRef]
- Onaolapo, A.K.; Carpanen, R.P.; Dorrell, D.G.; Ojo, E.E. A Comparative Assessment of Conventional and Artificial Neural Networks Methods for Electricity Outage Forecasting. Energies 2022, 15, 511. [Google Scholar] [CrossRef]
- Petrochenkov, A.B.; Romodin, A.V.; Luzyanin, I.S. Developing of the decision support system for intelligent control of oil producing installations on the oil and gas fields. Inf.-Meas. Control. Syst. 2018, 9, 59–67. [Google Scholar]
- Brahmana, R.K.; Ono, H. Energy efficiency and company performance in Japanese listed companies. Int. J. Energy Technol. Policy 2020, 16, 24–40. [Google Scholar] [CrossRef]
- Lyakhomskii, A.V.; Petrochenkov, A.B.; Petukhov, S.V.; Perfileva, E.N. Consulting on energy management systems in mining industry. Eurasian Min. 2022, 2, 30–33. [Google Scholar] [CrossRef]
- Galiev, Z.K.; Galieva, N.V. Development of the fuel and energy sector in compliance with the energy strategy in Russia. Min. Inf. Anal. Bull. 2019, 6, 215–220. (In Russian) [Google Scholar] [CrossRef]
- Ward, D.M. The effect of weather on grid systems and the reliability of electricity supply. Clim. Chang. 2013, 121, 103–113. [Google Scholar] [CrossRef]
- Rogalev, N.; Sukhareva, Y.; Mentel, G.; Brozyna, J. Economic approaches for improving electricity market. Terra Econ. 2018, 16, 140–149. [Google Scholar] [CrossRef]
- Tcvetkov, P.; Cherepovitsyn, A.; Makhovikov, A. Economic assessment of heat and power generation from small-scale liquefied natural gas in Russia. Energy Rep. 2020, 6, 391–402. [Google Scholar] [CrossRef]
- Zhukovskiy, Y.; Tsvetkov, P.; Buldysko, A.; Malkova, Y.; Stoianova, A.; Koshenkova, A. Scenario Modeling of Sustainable Development of Energy Supply in the Arctic. Resources 2021, 10, 124. [Google Scholar] [CrossRef]
- Lisin, E.; Kurdiukova, G.; Ketoeva, N.; Katina, J. Sustainability issues of territorial power systems in market conditions. Entrep. Sustain. Issues 2018, 6, 1041–1052. [Google Scholar] [CrossRef]
- Aljendy, R.I.; Nasyrov, R.R.; Tulsky, V.N.; Sultan, H.M. Optimal installed capacity of renewable energy sources for active power shortage minimization. In Proceedings of the 2019 International Ural Conference on Electrical Power Engineering, UralCon, Chelyabinsk, Russia, 1–3 October 2019; pp. 349–354. [Google Scholar] [CrossRef]
- Amez, I.; León, D.; Ivannikov, A.; Kolikov, K.; Castells, B. Potential of CBM as an Energy Vector in Active Mines and Abandoned Mines in Russia and Europe. Energies 2023, 16, 1196. [Google Scholar] [CrossRef]
- Eremenko, V.A.; Galchenko, Y.P.; Yanbekov, A.M. Justification of new opportunities for the use of the gravitational energy of the earth in underground ore mining with convergent geotechnologies. Eurasian Min. 2022, 37, 3–7. [Google Scholar] [CrossRef]
- Rybak, J.; Adigamov, A.; Kongar-syuryun, C.; Khayrutdinov, M.; Tyulyaeva, Y. Renewable-resource technologies in mining and metallurgical enterprises providing environmental safety. Minerals 2021, 11, 1145. [Google Scholar] [CrossRef]
- Rybak, J.; Khayrutdinov, M.; Kongar-Syuryun, C.; Tyulyaeva, Y. Resource-saving technologies for development of mineral deposits. Sustain. Dev. Mt. Territ. 2021, 13, 405–415. [Google Scholar] [CrossRef]
- Puchkov, L.A.; Kaledina, N.O.; Kobylkin, S.S. Global energy consumption: Forecasts and reality. Gorn. Zhurnal 2016, 1, 4–6. [Google Scholar] [CrossRef]
- Lisin, E.; Kurdiukova, G. Energy Supply System Development Management Mechanisms from the Standpoint of Efficient Use of Energy Resources. In Proceedings of the IOP Conference Series: Earth and Environmental Science, Vladivostok, Russia, 8–10 December 2020; Volume 666, p. 062090. [Google Scholar] [CrossRef]
- Idries, A.; Krogstie, J.; Rajasekharan, J. Dynamic Capabilities in Electrical Energy Digitalization: A Case from the Norwegian Ecosystem. Energies 2022, 15, 8342. [Google Scholar] [CrossRef]
- Lv, T. The trend and path of digital transformation of traditional industries. People’s Forum Acad. Front. 2019, 18, 13–19. [Google Scholar]
- Braglia, M.; Gabbrielli, R.; Marrazzini, L. Key Performance Indicators and Industry 4.0—A structured approach for monitoring the implementation of digital technologies. Procedia Comput. Sci. 2022, 200, 1626–1635. [Google Scholar] [CrossRef]
- Idries, A.; Krogstie, J.; Rajasekharan, J. Challenges in platforming and digitizing decentralized energy services. Energy Inform. 2022, 5, 8. [Google Scholar] [CrossRef]
- Warner, K.S.; Wäger, M. Building dynamic capabilities for digital transformation: An ongoing process of strategic renewal. Long Range Plan. 2019, 52, 326–349. [Google Scholar] [CrossRef]
- Witschel, D.; Baumann, D.; Voigt, K.I. How manufacturing firms navigate through stormy waters of digitalization: The role of dynamic capabilities, organizational factors and environmental turbulence for business model innovation. J. Manag. Organ. 2022, 28, 681–714. [Google Scholar] [CrossRef]
- Weigel, P.; Fischedick, M. Review and Categorization of Digital Applications in the Energy Sector. Appl. Sci. 2019, 9, 5350. [Google Scholar] [CrossRef]
- Fargnoli, M.; Haber, N. A QFD-based approach for the development of smart product-service systems. Eng. Rep. 2023, e12665. [Google Scholar] [CrossRef]
- Barber, S.; Izagirre, U.; Serradilla, O.; Olaizola, J.; Zugasti, E.; Aizpurua, J.I.; Milani, A.E.; Sehnke, F.; Sakagami, Y.; Henderson, C. Best Practice Data Sharing Guidelines for Wind Turbine Fault Detection Model Evaluation. Energies 2023, 16, 3567. [Google Scholar] [CrossRef]
- Pinheiro, M.G.; Madeira, S.C.; Francisco, A.P. Shapelets to Classify Energy Demand Time Series. Energies 2022, 15, 2960. [Google Scholar] [CrossRef]
- Deryabin, S.; Temkin, I.; Rzazade, U.; Kondratev, E. Models and Methods of Designing Data-Centric Microservice Architectures of Digital Enterprises. Informatics 2023, 10, 4. [Google Scholar] [CrossRef]
- Zhu, Y.; Li, J.; Lan, X.; Lu, S.; Yu, J. Research on Evaluation Method of Digital Project Cloud Model Considering Weight Sensitivity. Energies 2022, 15, 5738. [Google Scholar] [CrossRef]
- López-Garza, E.; Domínguez-Cruz, R.F.; Martell-Chávez, F.; Salgado-Tránsito, I. Fuzzy Logic and Linear Programming-Based Power Grid-Enhanced Economical Dispatch for Sustainable and Stable Grid Operation in Eastern Mexico. Energies 2022, 15, 4069. [Google Scholar] [CrossRef]
- Alghamdi, B. Fuzzy Logic–Based Decentralized Voltage–Frequency Control and Inertia Control of a VSG-Based Isolated Microgrid System. Energies 2022, 15, 8401. [Google Scholar] [CrossRef]
- Chandola, V.; Banerjee, A.; Kumar, V. Anomaly Detection: A Survey. ACM Comput. Surv. 2009, 41, 3. [Google Scholar] [CrossRef]
- Thudumu, S.; Branch, P.; Jin, J.; Singh, J. A comprehensive survey of anomaly detection techniques for high dimensional big data. J. Big Data 2020, 7, 42. [Google Scholar] [CrossRef]
- Wang, B.; Hua, Q.; Zhang, H.; Tan, X.; Nan, Y.; Chen, R.; Shu, X. Research on anomaly detection and real-time reliability evaluation with the log of cloud platform. Alex. Eng. J. 2022, 61, 7183–7193. [Google Scholar] [CrossRef]
- Nassif, A.; Talib, M.; Nasir, Q.; Dakalbab, F. Machine Learning for Anomaly Detection: A Systematic Review. IEEE Access 2021, 9, 78658–78700. [Google Scholar] [CrossRef]
Disclaimer/Publisher’s Note: The statements, opinions and data contained in all publications are solely those of the individual author(s) and contributor(s) and not of MDPI and/or the editor(s). MDPI and/or the editor(s) disclaim responsibility for any injury to people or property resulting from any ideas, methods, instructions or products referred to in the content. |
© 2023 by the authors. Licensee MDPI, Basel, Switzerland. This article is an open access article distributed under the terms and conditions of the Creative Commons Attribution (CC BY) license (https://creativecommons.org/licenses/by/4.0/).

