Abstract
In recent years, lithium-ion batteries (LiBs) have gained a lot of importance due to the increasing use of renewable energy sources and electric vehicles. To ensure that batteries work properly and limit their degradation, the battery management system needs accurate battery models capable of precisely predicting their parameters. Among them, the state of charge (SOC) estimation is one of the most important, as it enables the prediction of the battery’s available energy and prevents it from operating beyond its safety limits. A common method for SOC estimation involves utilizing the relationship between the state of charge and the open circuit voltage (OCV). On the other hand, the latter changes with battery aging. In a previous work, the authors studied a simple function to model the OCV curve, which was expressed as a function of the absolute state of discharge, q, instead of SOC. They also analyzed how the parameters of such a curve changed with the cycle aging. In the present work, a similar analysis was carried out considering the calendar aging effect. Three different LiB cells were stored at three different SOC levels (low, medium, and high levels) for around 1000 days, and an analysis of the change in the OCV-q curve model parameters with the calendar aging was performed.
1. Introduction
The recent energy crisis and the issue of climate change are spurring governments to incentivize the production of energy through renewable energy sources (RESs) and electric mobility to reduce gas emissions and reliance on fossil fuels. Unfortunately, the power produced by RESs is intermittent and unpredictable, which means that they may not provide energy when needed or, conversely, produce it when not required. Therefore, to make the most of them, it is convenient to install energy storage systems. Additionally, energy storage systems are also necessary for electric mobility, preferably with high energy density, high efficiency, and a long lifecycle. In this scenario, lithium-ion batteries (LiBs) are currently the preferred technology due to their high energy density, relatively high power density, and low self-discharge, making them suitable for both mobile and stationary applications [1].
LiBs are subjected to various degradation mechanisms that limit their lifespan and degrade their performance. These degradation mechanisms are caused by storage and operating conditions. The former is known as calendar aging and mainly depends on the temperature and state of charge (SOC) as a function of the time for which the battery has been stored under those conditions. The latter, commonly referred to as cycle aging, mainly depends on the temperature, current rate, SOC, and charging and discharging cut-off voltages as a function of the total charge exchanged with the battery [2,3]. To reduce the degradation and extend the lifespan of batteries, it is essential to control battery operations properly and store them under optimal conditions. The former is ensured by the battery management system (BMS), which predicts battery parameters such as the SOC, temperature, and state of health (SOH), using appropriate models and controlling the battery accordingly. Therefore, it is crucial for the aforementioned battery models to be as accurate as possible [4].
The estimation of the SOC is of paramount importance as it allows the determination of the remaining available battery capacity and ensures that the battery operates within its safety limits. In fact, properly controlling the SOC of the battery helps avoid working in an operating area where its degradation increases. Many different SOC estimation methods can be found in the literature. In recent years, some filter-based methods (Kalman filter [5], unscented Kalman filter [6], etc.) together with some observer methods (sliding mode observer [7], nonlinear observer [8], etc.) and intelligent algorithms (fuzzy logic [9], neural networks [10], etc.) have been proposed. However, traditional methods are still preferred in BMSs [11]. Among them, Coulomb counting remains the most widely used method due to its simplicity and execution speed [12]. Unfortunately, this method has some drawbacks, including heavy reliance on initial SOC values, the need for highly accurate current sensors, and susceptibility to cumulative errors. Other traditional methods are the model-based approaches which are quite accurate and simple [13]. On the other hand, they require a good knowledge of the open circuit voltage (OCV) curve [14], which is typically obtained through lengthy tests involving full charge or discharge of the battery at very low current rates or through the hybrid pulse power characterization method [15]. Furthermore, the model-based approaches are generally used to correct the Coulomb counting estimation method [11].
Different models can be found in the literature that are able to describe the dependence of the OCV curve as a function of the SOC. They can be mainly divided into table-based models and analytical models. In the former, pairs of OCV and SOC values are stored in a table, and interpolation is performed between the stored values [16,17]. The main advantage of this method is its low computational requirements, but it may require significant memory if high precision is desired. The analytical models, instead, use mathematical functions to describe the OCV curve and can be further classified into linear regression models and nonlinear regression models. Linear regression models consist of a sum of products between parameters and linear or nonlinear functions of SOC, while nonlinear regression models involve a general function of SOC and parameters. In linear regression models, the parameters can be determined using linear regression methods such as the linear least square method. In contrast, nonlinear regression methods like the nonlinear least square method are required for parameter estimation in nonlinear regression models. In some cases, it is also possible to linearize the nonlinear regression model and employ a linear regression method.
Among the mathematical expressions used in the OCV-SOC curve modeling, polynomial functions are the most commonly employed. These polynomials can range from the second-degree [18] to the twelfth-degree [19,20], depending on the desired accuracy and complexity. Lower-degree polynomials are simpler but offer limited precision and can accurately represent only a small portion of the OCV-SOC curve. Conversely, the higher-degree polynomials can provide excellent precision and fit the entire OCV curve well. However, they require many parameters to be fitted and may exhibit incorrect trends outside the range or between the experimental points. Other analytical models, which are possible to find in the literature, are based on logarithmic functions, also called Nernst models [15,21,22] or exponential functions [23]. Logarithmic functions offer a good accuracy with only three parameters to be fitted but cannot be defined for an SOC equal to 0 or 1. Moreover, there are a lot of different combinations of the aforementioned functions [24,25,26,27,28], some of which yield higher accuracy than others. Among them, the model proposed in [23] demonstrates high accuracy and low complexity. The latter is composed of two exponentials and a quadratic term, with a total of five parameters.
The OCV-SOC curve changes with the battery temperature and aging. Therefore, accurately estimating this curve and understanding its dependence on these factors is crucial for building a reliable battery model and, consequently, a reliable BMS. In [29], the authors corrected the SOC estimation with the value of the actual battery capacity and stated that the OCV curves were the same with this correction, despite different aging conditions. A similar procedure was employed in [30], where the SOC was defined as a function of the SOH and then used inside the OCV-SOC relation. The changes in the OCV-SOC curve and the consequent variations in the incremental capacity of a LiB were analyzed in [25], in which an extended Kalman filter was used for the parameter estimation. In [31], a correction of the OCV-SOC curve based on the SOH and temperature was proposed, while the authors in [32] used a convolutional neural network to estimate the electrode aging parameters, which were then used for the OCV-SOC curve estimation.
In all cases, there seems to be a lack of understanding regarding how the parameters of an OCV-SOC curve change as a function of aging. In a previous work [33], the authors used a double exponential function to model the discharge OCV curve as a function of the absolute state of discharge, q, instead of the SOC, and investigated the dependency of its parameters on cycle aging at a fixed temperature.
In light of the above, the focus of the present paper was to examine the variation of the discharge OCV-q curve as a function of the calendar aging at a fixed temperature. The same procedure and OCV-q curve model adopted in [33] to analyze the cycle aging of a LiB were applied to three different LiB cells of the same type. The latter were stored at three different SOC levels (low, medium, and high levels) for a period of almost three years under the same temperature conditions. Therefore, the parameter variation of the OCV-q curve model was studied for different calendar aging levels (i.e., different storage times) and three different SOC levels, developing a calendar aging model. Finally, the proposed model was validated through a wide campaign of experimental tests.
2. Battery Model
To develop an aging model that considers how the discharge OCV-q curve changes as a function of calendar aging, we needed to start from an equivalent electric circuit battery model. This allowed us to model the discharge OCV-q curve and develop a test procedure to extract it. In the literature, it is possible to retrieve many equivalent electric circuit models able to predict both the static and dynamic behavior of batteries. They can be very simple, as the ones reported in [34,35,36], or much more complex, as the ones reported in [37,38,39]. The choice of the appropriate equivalent electric circuit model depends on the desired accuracy and the specific aspects to be described for the application.
For the scope of the present paper, the simplest model, shown in Figure 1, was suitable for characterizing the discharge OCV-q curves. This model consists of a voltage source, E, as a function of the absolute state of discharge, q, which models the OCV of the battery, and a series resistor Rin, which represents the total internal resistance of the battery. This resistance is related to the ohmic resistance of the electrode and electrolyte, charge transfer chemical reaction resistance, solid electrolyte interface (SEI) resistance, and diffusion resistance.
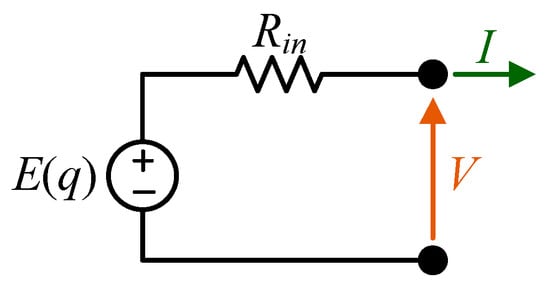
Figure 1.
Equivalent electric circuit model.
According to this model, it is possible to express the battery terminal voltage as follows:
where I is the battery current.
The analytical expression chosen to model the discharge OCV-q curve was the same as that reported in [33], which, in that case, was used to model the changes in the discharge OCV-q curve as a function of the cycle aging. This analytical expression consists of two exponential terms and a constant one:
where a, b, c, d, and f are five parameters that, in our case, are functions of the calendar aging, e is the Euler’s number, while q is the absolute state of discharge in Ah and defined as follows:
where q(0) is the initial state of discharge. In this way, when q is null, the battery is fully charged, i.e., SOC = 100%; conversely, when q equates the actual capacity of the battery, Ca, the latter is fully discharged, i.e., SOC = 0%. Therefore, the SOC can be expressed as a function of the absolute state of discharge, as follows:
To quantify calendar aging, the calendar time taging expressed in days was used. Thus, the five parameters of (2) could be expressed as a function of this calendar time.
In this work, the procedure to obtain the discharge OCV-q curve was performed by discharging the battery at the nominal current rate (1C) to speed up the tests, as performed in [33]. Therefore, it was essential to correct the discharge voltage curve by eliminating the voltage drop over the total internal resistance of the battery. Thus, it was necessary to estimate the value of such an internal resistance. For the sake of simplicity, as assumed in [33], the battery’s internal resistance was considered to be quite constant as a function of the absolute state of discharge. Moreover, assuming the battery was fully charged, when the discharge at constant current started, different phenomena, with different time constants, led to an electrical transient. To obtain the total battery’s internal resistance, the entire electric transient had to be extinguished. To do this, we had to consider a proper time interval related to the largest time constant τ, which corresponds to the diffusion process of the lithium/lithium ions into the electrodes and electrolyte. Through the procedure reported in [26,27], it was possible to identify that time interval, considered to be five times the largest time constant τ, in the first part of the discharge voltage curve (Figure 2). Therefore, the resulting voltage variation related to that time interval was estimated. By calculating the ratio between that voltage variation and the current step, the battery’s internal resistance was calculated, and the discharge voltage curve was corrected, obtaining the discharge OCV-q curve. Finally, the part of the OCV-q curve corresponding to the considered electric transient was eliminated to avoid errors in the following analysis.
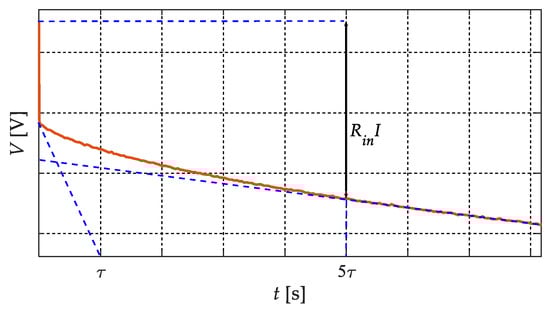
Figure 2.
Electric transient at the beginning of the battery discharge.
3. Experimental Setup and Test Procedure
In the present work, three LiCoO2 8773160K pouch cells of the same batch, manufactured by General Electronics Battery Co. Ltd. (Shenzhen, China), were employed for the experimental tests. The main specifications of this type of cell are reported in Table 1.

Table 1.
Battery cell specifications.
The three battery cells were used to test how the discharge OCV-q curve changed as a function of the calendar aging under three different storage conditions related to low SOC (about 7%), medium SOC (about 50%), and high SOC (about 93%).
3.1. Experimental Setup
Figure 3 shows the experimental setup that was composed of a potentiostat (SP-150) connected to a 100 A booster (VMP3B-100). Both instruments are manufactured by Biologic Science Instrument, and they are connected to a PC via an ethernet cable. The PC controlled them through the EC-Lab software. The 100 A booster was connected to the battery cell under test through a power cable.
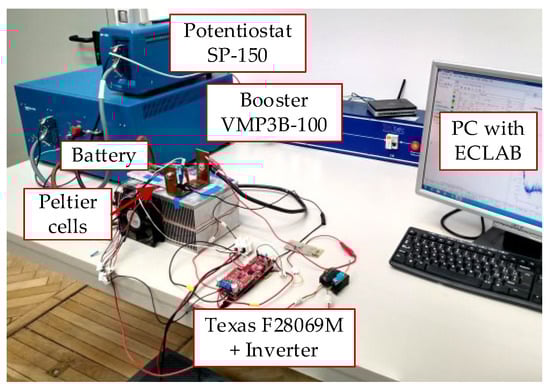
Figure 3.
Experimental setup.
The battery cell arrangement consisted of a heatsink, two fans, three Peltier cells, a dc voltage source, a temperature probe, and a Texas Instrument DRV8303 inverter controlled by an F28069M controller board. The three Peltier cells were put between the battery cell under test and the heatsink to maintain the battery temperature as uniform and constant as possible at 25 °C during the discharge voltage curve measurements. This was carried out to avoid changes on the OCV-q curve due to temperature variation. To do this, they were connected in series and powered by the inverter, which was, in turn, controlled by the F28069M with a PI controller. Finally, the inverter was supplied using a dc voltage source. Figure 4 shows the schematics of the temperature control.
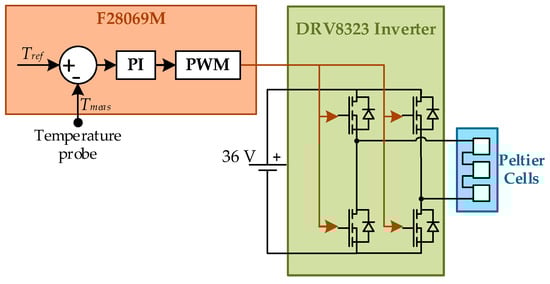
Figure 4.
Temperature control scheme.
3.2. Test Procedure
The test procedure used for the analysis consisted of two main phases: the discharge voltage curve measurement phase and the calendar aging phase. The former phase was conducted at the beginning of the test and after each calendar aging phase for all three battery cells. In this way, it was possible to assess how the discharge OCV-q curve changed as a function of the calendar aging at different SOC levels.
3.2.1. Voltage Discharge Curve Measurement Phase
This phase consisted of fully charging and discharging the battery cell under test at the nominal current (1C) using the well-known constant current–constant voltage (CC-CV) protocol for the charging phase and the constant current protocol for the discharging phase. In particular, the battery cell was charged with a constant current of 10 A (1C) until the battery terminal voltage reached 4.2 V. After that, this voltage was applied until the battery current dropped by 100 mA (0.01C). At that stage, the battery cell could be considered charged at 100% of SOC. After completing the previous step, the battery cell was discharged at a constant current of 10 A (1C) until the battery terminal voltage reached 2.75 V. This entire procedure was repeated seven times for each of the three battery cells. In fact, for the first use of the batteries and after each calendar aging phase, the battery cells needed to be activated.
Finally, after each voltage discharge curve measurement phase, the three battery cells were brought to about 7%, 50%, and 93% of SOC for the low, medium, and high SOC tests, respectively. In particular, for the low and medium SOC tests, the cells were initially fully discharged with the CC-CV protocol, and then a charge current of 10 A (1C) was applied to move 0.7 Ah (7% of the nominal capacity) and 5 Ah (50% of the nominal capacity), respectively. On the other hand, for the high SOC test, the battery cell was first fully charged with the CC-CV protocol, and then a discharge current of 10 A (1C) was applied to move 0.7 Ah (7% of the nominal capacity). It is worth noting that since, during the aging, the actual capacity of the battery cells decreases, the moved charge (0.7 Ah and 5 Ah) corresponds to different percentages of SOC. In any case, these differences are minimal (about 5%) and do not change the SOC ranges at which the three cells were stored.
3.2.2. Calendar Aging Phase
This phase consisted of storing the three battery cells in a cabinet at a temperature between 20 °C and 30 °C for a certain time interval. The duration of this time interval was not constant throughout the entire analysis, but it varied according to the availability of the experimental setup.
4. Results and Model Validation
According to the test procedure reported in the previous section, a total of twelve calendar aging phases were evaluated at specific time intervals: 0th, 35th, 70th, 99th, 136th, 205th, 273rd, 344th, 437th, 682nd, 743rd, and 997th day. The entire duration of the testing period was about 1000 days. Among these twelve tests, a subset of four (at the 0th, 205th, 437th, and 997th day) was selected and used to tune the proposed aging model. As stated before, for each calendar aging phase and battery cell under test, seven voltage discharge curves were performed to activate the battery cells and stabilize their capacities. The latter were estimated in Ah at the rated nominal current of 10 A (1C) by integrating the current over the entire discharging time. Figure 5a shows an example of the battery capacity trend, as a function of the seven voltage discharge curve measurements, for the high SOC test battery cell on the 0th day. From this figure, it is possible to recognize that the values of the battery capacity become quite stable after at least five full charge–discharge cycles. Therefore, the last two voltage discharge curves were averaged and used for the analysis. Figure 5b illustrates the related temperature profile during the entire discharge curve measurement. Finally, according to the procedure proposed in [26,27], the time interval related to the lithium-ion diffusion was estimated to be approximately 50 s for all discharge curves. Therefore, for each of them, the total battery’s internal resistance was evaluated along with the related voltage drops, and the initial section of the curve was eliminated. In this way, the OCV-q curves for each calendar aging phase and SOC level were obtained.
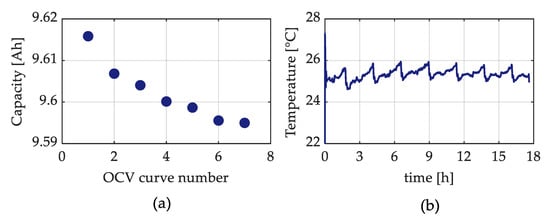
Figure 5.
(a) battery capacity; (b) battery temperature.
4.1. Model Characterization
In the discharge voltage curve measurements, each battery cell under test was initially fully charged up to 4.2 V using the CC-CV protocol and then fully discharged with the CC protocol to obtain the OCV-q curves. Consequently, we can assume that all the OCV-q curves started from the maximum battery voltage of 4.2 V, and the parameter f of (2) can be rearranged as follows:
Therefore, the total number of parameters to be tuned in (2) reduces to just four. At this stage, the OCV-q curves were fitted using the proposed OCV-q analytical expression through the nonlinear least square regression method, and the coefficients of determination (R2) were evaluated.
Figure 6 illustrates the experimental OCV-q curves along with the corresponding fitting functions for the four tests chosen for the characterization of the model at each SOC level, and Figure 7 shows the related R2. From these figures, it is possible to recognize a very good agreement between the experimental and modeled data for the low, medium, and high SOC tests. Moreover, the R2 is greater than 0.995 for all tests.
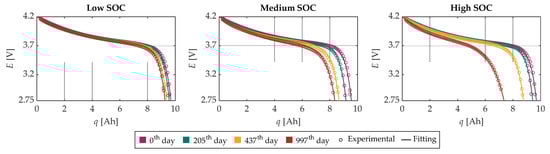
Figure 6.
Experimental OCV-q curves and their fitting functions obtained through the nonlinear least square method for the characterization subset.
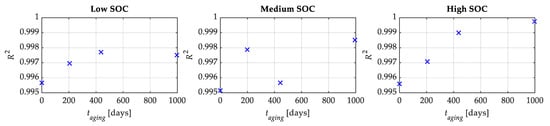
Figure 7.
Coefficients of determinations R2 for the characterization subset.
Furthermore, it is worth noting that the capacity fade experienced by the battery cells becomes more pronounced as the storage SOC level increases. In fact, for the battery cell stored at a low SOC, the capacity fade is about 5%, while for the medium SOC, it is about 13%, and for the high SOC, it is about 25%. This can be attributed to a significant potential disequilibrium at the electrode/electrolyte interface resulting from a high SOC. Therefore, secondary chemical reactions such as corrosion, electrolyte decomposition, and SEI decomposition occur, leading to the loss of lithium inventory and active material, thus resulting in faster capacity fade [40,41].
Figure 8 shows the behavior of the parameters a, b, c, and d of (2) as a function of the calendar time for the three SOC levels. From this figure, it is possible to note that, similar to the results obtained in [33] for cycle aging, the parameters a, b, and d do not present a well-defined trend as a function of the calendar time. Therefore, following the analysis performed in [33], we opted to consider, for each SOC level, the values of the parameters b and d constant at their mean values obtained previously and reported in Table 2. In this way, the function of the discharge OCV-q curve becomes linear in the parameters a and c; thus, the linear least square regression method could be applied.
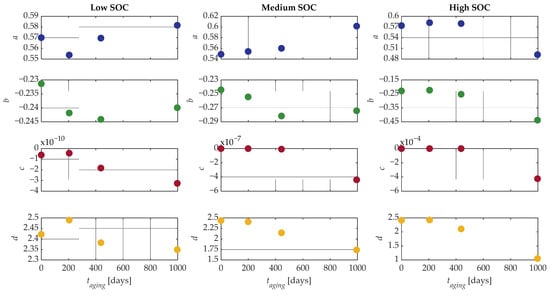
Figure 8.
Parameters a, b, c, and d as a function of the calendar time for the characterization subset.
Table 2.
Mean values of parameters b and d.
Figure 9 illustrates the comparison between the experimental OCV-q curves and the corresponding fitting functions for the four tests chosen for the characterization of the model and for each SOC level. Additionally, Figure 10 shows the related R2 values obtained by maintaining parameters b and d constant. From these figures, it is possible to recognize a good agreement between the experimental and modeled data for the low and medium SOC tests, while the agreement for the high SOC tests is a little worse. In any case, the R2 is greater than 0.985 for all the tests.
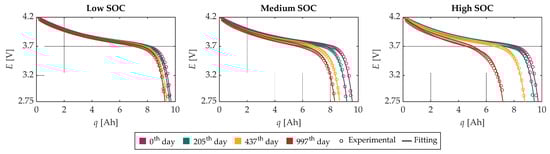
Figure 9.
Experimental OCV-q curves and their fitting functions obtained by fixing the parameters b and d and through the linear least square method for the characterization subset.
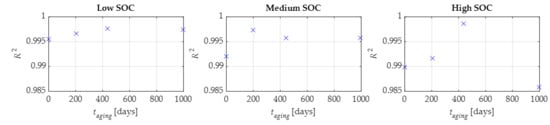
Figure 10.
Coefficients of determination R2 obtained by fixing the parameters b and d for the characterization subset.
In all cases, the new values of parameters a and c exhibited a well-defined behavior, enabling them to be fitted as a function of the calendar time. For the parameter a, a linear least square regression was performed using the following fitting function:
where αa and βa are the coefficients of the fitting function of the parameter a. For the parameter c, a nonlinear least square regression was performed instead, using the following expression:
where αc, βc, and δc are the coefficients of the fitting function of the parameter c. The choice to use the expression (7) for parameter c was made to find an analytical expression that was suitable for all three SOC levels. Finally, Figure 11 shows the behavior of parameters a and c of (2) as a function of the calendar time for the three SOC levels, along with their related fitting functions. Table 3 reports the coefficients of (6) and (7). In this way, an aging model with only two parameters that depend on calendar aging was derived.
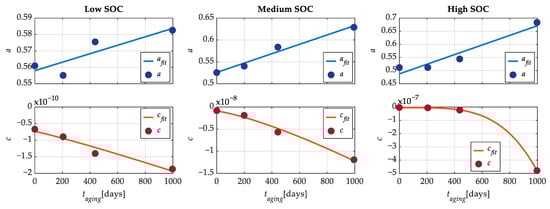
Figure 11.
Parameters a and c as a function of the calendar time (with b and d fixed) and their fitting functions for the characterization subset.
Table 3.
Coefficients of the parameters a and c.
4.2. Model Validation
The validation of the model was assessed by evaluating the absolute error () and relative percentage error () between the estimated discharge OCV-q curves and the corresponding experimental curves, using all twelve experimental tests at different calendar times for each SOC level. They were evaluated as follows:
where and are, respectively, the experimental and modeled values of the OCV-q curves. Moreover, to have an overall indicator of the goodness of fit, the R2 was also calculated.
Figure 12 shows the maximum and mean values of the relative percentage error of the OCV-q curves as a function of calendar aging. From this figure, it is possible to note that the highest maximum relative percentage errors are about 5%, 7%, and 6.5% for the low, medium, and high SOC tests, respectively. Instead, the mean relative percentage errors for the low, medium, and high SOC tests are lower than 0.45%, 0.65%, and 0.9%, respectively, across all calendar aging levels. On the other hand, the relative percentage error can have different weights for different states of discharge because the OCV curve changes as a function of q. For this reason, Figure 13 shows the maximum and mean values of the absolute error. The maximum value of the latter is about 165 mV for the low SOC tests and 220 mV for the medium and high SOC tests, while the mean values of the absolute error are lower than 15 mV, 22 mV, 30 mV for the low, medium, and high SOC tests, respectively, across all aging levels. Finally, Figure 14 reports the experimental OCV-q curves compared with the ones obtained through the proposed model for all tests and SOC levels, while Figure 15 shows the related R2. The latter are larger than 0.9763, 0.9542, and 0.9490 for the low, medium, and high SOC tests, respectively.
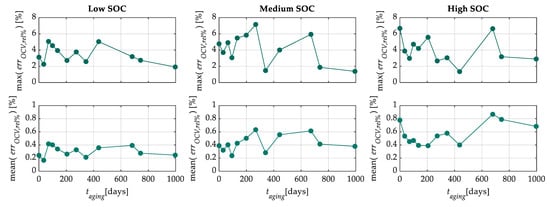
Figure 12.
Mean and maximum percentage relative error as a function of the calendar time.
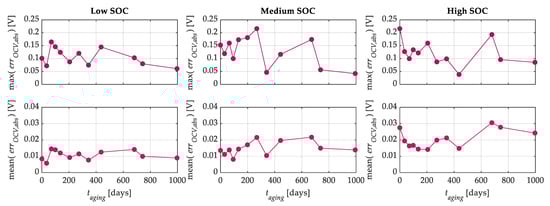
Figure 13.
Mean and maximum absolute error as a function of the calendar time.
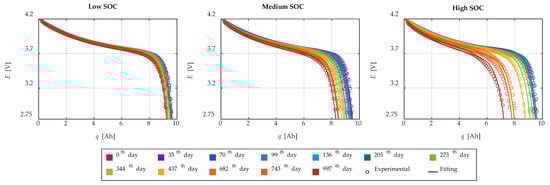
Figure 14.
Experimental OCV-q curves and modeled ones for all the experimental tests.
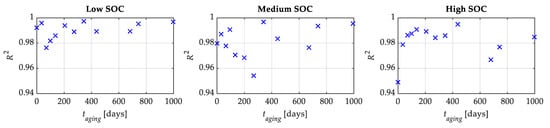
Figure 15.
Coefficients of determination R2 for all the experimental tests.
The knowledge of the variation law of the OCV-q curve as a function of calendar aging can be employed to estimate the actual battery capacity. This, in turn, allows the correction of the SOC estimation and updating of the SOH in terms of capacity fade. In particular, the actual battery capacity, Ca, can be calculated by equating the (2) to the minimum cut-off voltage Emin of the battery. This is due to the fact that when the open circuit voltage E of the battery equals its minimum cut-off voltage, the absolute state of discharge q is equal to the actual battery capacity. The percentage relative error of the capacity was evaluated as follows:
where qmod (Emin) and qexp (Emin) are the estimated and experimental actual battery capacities, respectively.
Theoretically, the minimum cut-off voltage for the battery used in this work would be 2.75 V. However, due to the elimination of the voltage drop over the internal resistance, the actual cut-off voltage was higher and depended on the amplitude of that voltage drop itself. Nonetheless, since the last experimental point of each discharge OCV-q curve is close to the minimum cut-off voltage, this experimental point was considered as Emin, and the related value of the actual battery capacity, Ca, was compared with the modeled one. Figure 16 shows the capacity percentage errors for the three SOC levels. From this figure, it is possible to recognize that the capacity error is lower than 1.5% for all the aging and SOC levels.
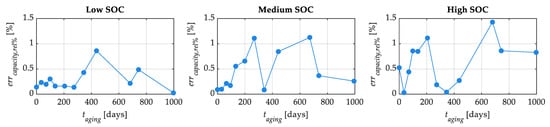
Figure 16.
Capacity estimation error as a function of the calendar time.
Finally, once the actual capacity of the battery is obtained, it becomes possible to correct the SOC estimation according to (4) and update the value of SOH in terms of capacity fade as follows:
where Ci is the initial battery capacity. The results highlight the significant impact of storing the battery at a high SOC, as it degrades much faster. Specifically, the battery stored at a high SOC reached the end of its life in less than three years, whereas the one stored at a low SOC experienced minimal capacity fade.
5. Conclusions
In this work, a simple analytical function composed of two exponential terms and a constant one with five parameters was used to model the behavior of the discharge OCV-q curves of three LiCoO2 batteries of the same batch stored at three different levels of SOC (low, medium, and high levels) for different calendar aging levels. Twelve discharge OCV-q experimental curves were performed over about 1000 days at different calendar times.
The proposed model was characterized using a subset of four discharge OCV-q experimental curves at the 0th, 205th, 437th, and 997th day. Firstly, the proposed analytical model, being nonlinear in its parameters, was fitted using the nonlinear regression least square method. Moreover, one of the parameters, namely f, was expressed as a function of the other two parameters, a and c, with the constraint that all the OCV-q curves started from the maximum cut-off voltage of 4.2 V. This reduced the number of parameters to be found to four. The fitting procedure yielded modeled data for the three SOC levels that showed good agreement with the experimental ones. This agreement was further confirmed by the high value of the R2 for all the tests. The four parameters a, b, c, and d were reported as a function of the calendar time. On the other hand, the parameters a, b, and d did not exhibit a well-defined trend. Following the analysis performed in [33], we considered the value of the parameters b and d fixed at their mean values obtained previously for all the SOC levels. Therefore, the analytical model became linear in its parameters, and the fitting procedure was performed again using the linear least square method. In this way, the parameters a and c could be fitted using simple analytical expressions for the three SOC levels, and the OCV-q model considering the calendar aging was obtained.
Afterward, the model was validated through all twelve experimental OCV-q curves, and the absolute error, percentage relative error, and coefficients of determination R2 were evaluated as indicators of the goodness of fit. Through the analysis of the results, it is possible to recognize that the mean relative percentage errors of the low, medium, and high SOC tests are, respectively, lower than 0.45%, 0.65%, and 0.9% for all the calendar aging levels. Additionally, the R2 values are greater than 0.9763, 0.9542, and 0.9490 for the low, medium, and high SOC tests, respectively.
Finally, the proposed model can also be used to estimate the battery capacity for all storage SOC and aging levels. The estimated battery capacity values were compared with the corresponding experimental ones, and the capacity relative percentage error was calculated. This error is lower than 1.5% for all the tests. The battery capacity obtained can then be used to correct the SOC estimation and evaluate the capacity fade. Based on the results, it is possible to confirm that the worst storage condition for these kinds of LiBs occurs at high SOCs. Indeed, the battery stored at a high SOC reached its end of life before three years. On the other hand, the batteries stored at lower SOCs are still usable considering the same time span. This can be due to a notable imbalance that arises between the electrode and electrolyte interface caused by a high SOC. As a consequence, secondary chemical reactions such as corrosion, electrolyte decomposition, and SEI decomposition take place, resulting in the depletion of lithium inventory and active material.
In light of the above, it is possible to claim that the proposed calendar aging model is simple yet quite accurate in modeling the OCV-q curve. Moreover, it can be valuable for correcting SOC estimations and evaluating the actual battery capacity as an indicator of the SOH.
Author Contributions
Conceptualization, S.B. and S.C.; methodology, S.B. and S.C.; validation, S.B. and S.C.; writing—original draft preparation, S.B. and S.C.; writing—review and editing, S.B. and S.C.; supervision, L.P. and L.C. All authors have read and agreed to the published version of the manuscript.
Funding
This research received no external funding.
Data Availability Statement
Data sharing is not applicable.
Conflicts of Interest
The authors declare no conflict of interest.
References
- Divakaran, M.A.; Minakshi, M.; Bahri, P.A.; Paul, S.; Kumari, P.; Divakaran, A.M.; Manjunatha, K.N. Rational Design on Materials for Developing next Generation Lithium-Ion Secondary Battery. Prog. Solid State Chem. 2021, 62, 100298. [Google Scholar] [CrossRef]
- Nunotani, K.; Yoshida, F.; Kamiya, Y.; Daisho, Y.; Abe, K.; Kono, M.; Matsuo, H. Development and Performance Evaluation of Lithium Iron Phosphate Battery with Superior Rapid Charging Performance—Second Report: Evaluation of Battery Capacity Loss Characteristics. In Proceedings of the 2011 IEEE Vehicle Power and Propulsion Conference, Chicago, IL, USA, 6–9 September 2011; pp. 1–4. [Google Scholar]
- Barcellona, S.; Brenna, M.; Foiadelli, F.; Longo, M.; Piegari, L. Analysis of Ageing Effect on Li-Polymer Batteries. Sci. World J. 2015, 2015, 979321. [Google Scholar] [CrossRef] [PubMed]
- Barcellona, S.; Brenna, M.; Foiadelli, F.; Longo, M.; Piegari, L. Battery Lifetime for Different Driving Cycles of EVs. In Proceedings of the 2015 IEEE 1st International Forum on Research and Technologies for Society and Industry Leveraging a better Tomorrow (RTSI), Torino, Italy, 16–18 September 2015; pp. 446–450. [Google Scholar]
- Mawonou, K.S.R.; Eddahech, A.; Dumur, D.; Beauvois, D.; Godoy, E. Improved State of Charge Estimation for Li-Ion Batteries Using Fractional Order Extended Kalman Filter. J. Power Sources 2019, 435, 226710. [Google Scholar] [CrossRef]
- Li, Y.; Wang, C.; Gong, J. A Multi-Model Probability SOC Fusion Estimation Approach Using an Improved Adaptive Unscented Kalman Filter Technique. Energy 2017, 141, 1402–1415. [Google Scholar] [CrossRef]
- Ning, B.; Xu, J.; Cao, B.; Wang, B.; Xu, G. A Sliding Mode Observer SOC Estimation Method Based on Parameter Adaptive Battery Model. Energy Procedia 2016, 88, 619–626. [Google Scholar] [CrossRef]
- Ouyang, Q.; Chen, J.; Wang, F.; Su, H. Nonlinear Observer Design for the State of Charge of Lithium-Ion Batteries. IFAC Proc. Vol. 2014, 47, 2794–2799. [Google Scholar] [CrossRef]
- Gan, L.; Yang, F.; Shi, Y.F.; He, H.L. Lithium-Ion Battery State of Function Estimation Based on Fuzzy Logic Algorithm with Associated Variables. IOP Conf. Ser. Earth Environ. Sci. 2017, 94, 012133. [Google Scholar] [CrossRef]
- Jiao, M.; Wang, D.; Qiu, J. A GRU-RNN Based Momentum Optimized Algorithm for SOC Estimation. J. Power Sources 2020, 459, 228051. [Google Scholar] [CrossRef]
- Zhou, W.; Zheng, Y.; Pan, Z.; Lu, Q. Review on the Battery Model and SOC Estimation Method. Processes 2021, 9, 1685. [Google Scholar] [CrossRef]
- Ren, X.; Liu, S.; Yu, X.; Dong, X. A Method for State-of-Charge Estimation of Lithium-Ion Batteries Based on PSO-LSTM. Energy 2021, 234, 121236. [Google Scholar] [CrossRef]
- Li, N.; Zhang, Y.; He, F.; Zhu, L.; Zhang, X.; Ma, Y.; Wang, S. Review of Lithium-Ion Battery State of Charge Estimation. Glob. Energy Interconnect. 2021, 4, 619–630. [Google Scholar] [CrossRef]
- Xiong, R.; Yu, Q.; Wang, L.Y.; Lin, C. A Novel Method to Obtain the Open Circuit Voltage for the State of Charge of Lithium Ion Batteries in Electric Vehicles by Using H Infinity Filter. Appl. Energy 2017, 207, 346–353. [Google Scholar] [CrossRef]
- Xiong, R.; He, H.; Guo, H.; Ding, Y. Modeling for Lithium-Ion Battery Used in Electric Vehicles. Procedia Eng. 2011, 15, 2869–2874. [Google Scholar] [CrossRef]
- Sundaresan, S.; Devabattini, B.; Kumar, P.; Pattipati, K.; Balasingam, B. Tabular Open Circuit Voltage Modelling of Li-Ion Batteries for Robust SOC Estimation. Energies 2022, 15, 9142. [Google Scholar] [CrossRef]
- Pillai, P.; Sundaresan, S.; Kumar, P.; Pattipati, K.R.; Balasingam, B. Open-Circuit Voltage Models for Battery Management Systems: A Review. Energies 2022, 15, 6803. [Google Scholar] [CrossRef]
- He, H.; Xiong, R.; Zhang, X.; Sun, F.; Fan, J. State-of-Charge Estimation of the Lithium-Ion Battery Using an Adaptive Extended Kalman Filter Based on an Improved Thevenin Model. IEEE Trans. Veh. Technol. 2011, 60, 1461–1469. [Google Scholar] [CrossRef]
- Sun, D.; Yu, X.; Wang, C.; Zhang, C.; Huang, R.; Zhou, Q.; Amietszajew, T.; Bhagat, R. State of Charge Estimation for Lithium-Ion Battery Based on an Intelligent Adaptive Extended Kalman Filter with Improved Noise Estimator. Energy 2021, 214, 119025. [Google Scholar] [CrossRef]
- Zhao, S.; Duncan, S.R.; Howey, D.A. Observability Analysis and State Estimation of Lithium-Ion Batteries in the Presence of Sensor Biases. IEEE Trans. Control. Syst. Technol. 2017, 25, 326–333. [Google Scholar] [CrossRef]
- Xiong, R.; He, H.; Sun, F.; Zhao, K. Online Estimation of Peak Power Capability of Li-Ion Batteries in Electric Vehicles by a Hardware-in-Loop Approach. Energies 2012, 5, 1455–1469. [Google Scholar] [CrossRef]
- Ta, K.P.; Newman, J. Proton Intercalation Hysteresis in Charging and Discharging Nickel Hydroxide Electrodes. J. Electrochem. Soc. 1999, 146, 2769–2779. [Google Scholar] [CrossRef]
- Baccouche, I.; Jemmali, S.; Manai, B.; Omar, N.; Amara, N. Improved OCV Model of a Li-Ion NMC Battery for Online SOC Estimation Using the Extended Kalman Filter. Energies 2017, 10, 764. [Google Scholar] [CrossRef]
- Zhang, C.; Jiang, J.; Zhang, L.; Liu, S.; Wang, L.; Loh, P. A Generalized SOC-OCV Model for Lithium-Ion Batteries and the SOC Estimation for LNMCO Battery. Energies 2016, 9, 900. [Google Scholar] [CrossRef]
- Weng, C.; Sun, J.; Peng, H. A Unified Open-Circuit-Voltage Model of Lithium-Ion Batteries for State-of-Charge Estimation and State-of-Health Monitoring. J. Power Sources 2014, 258, 228–237. [Google Scholar] [CrossRef]
- Zhang, R.; Xia, B.; Li, B.; Cao, L.; Lai, Y.; Zheng, W.; Wang, H.; Wang, W.; Wang, M. A Study on the Open Circuit Voltage and State of Charge Characterization of High Capacity Lithium-Ion Battery Under Different Temperature. Energies 2018, 11, 2408. [Google Scholar] [CrossRef]
- Dong, G.; Wei, J.; Zhang, C.; Chen, Z. Online State of Charge Estimation and Open Circuit Voltage Hysteresis Modeling of LiFePO4 Battery Using Invariant Imbedding Method. Appl. Energy 2016, 162, 163–171. [Google Scholar] [CrossRef]
- Hu, Y.; Yurkovich, S.; Guezennec, Y.; Yurkovich, B.J. Electro-Thermal Battery Model Identification for Automotive Applications. J. Power Sources 2011, 196, 449–457. [Google Scholar] [CrossRef]
- Wang, L.; Lu, D.; Liu, Q.; Liu, L.; Zhao, X. State of Charge Estimation for LiFePO4 Battery via Dual Extended Kalman Filter and Charging Voltage Curve. Electrochim. Acta 2019, 296, 1009–1017. [Google Scholar] [CrossRef]
- Tong, S.; Klein, M.P.; Park, J.W. On-Line Optimization of Battery Open Circuit Voltage for Improved State-of-Charge and State-of-Health Estimation. J. Power Sources 2015, 293, 416–428. [Google Scholar] [CrossRef]
- Farmann, A.; Sauer, D.U. A Study on the Dependency of the Open-Circuit Voltage on Temperature and Actual Aging State of Lithium-Ion Batteries. J. Power Sources 2017, 347, 1–13. [Google Scholar] [CrossRef]
- Tian, J.; Xiong, R.; Shen, W.; Sun, F. Electrode Ageing Estimation and Open Circuit Voltage Reconstruction for Lithium Ion Batteries. Energy Storage Mater. 2021, 37, 283–295. [Google Scholar] [CrossRef]
- Barcellona, S.; Codecasa, L.; Colnago, S.; Piegari, L. Cycle Aging Effect on the Open Circuit Voltage of Lithium-Ion Battery. In Proceedings of the International Conference on Electrical Systems for Aircraft, Railway, Ship Propulsion and Road Vehicles & International Transportation Electrification Conference (ESARS-ITEC), Venice, Italy, 28–31 March 2023. [Google Scholar]
- Kim, Y.H.; Ha, H.D. Design of Interface Circuits with Electrical Battery Models. IEEE Trans. Ind. Electron. 1997, 44, 81–86. [Google Scholar] [CrossRef]
- Dürr, M.; Cruden, A.; Gair, S.; McDonald, J.R. Dynamic Model of a Lead Acid Battery for Use in a Domestic Fuel Cell System. J. Power Sources 2006, 161, 1400–1411. [Google Scholar] [CrossRef]
- Chan, H.L. A New Battery Model for Use with Battery Energy Storage Systems and Electric Vehicles Power Systems. In Proceedings of the 2000 IEEE Power Engineering Society Winter Meeting. Conference Proceedings (Cat. No.00CH37077), Singapore, 23–27 January 2000; Volume 1, pp. 470–475. [Google Scholar]
- Randles, J.E.B. Kinetics of Rapid Electrode Reactions. Discuss. Faraday Soc. 1947, 1, 11. [Google Scholar] [CrossRef]
- Zhang, S.S.; Xu, K.; Jow, T.R. Electrochemical Impedance Study on the Low Temperature of Li-Ion Batteries. Electrochim. Acta 2004, 49, 1057–1061. [Google Scholar] [CrossRef]
- Buller, S.; Thele, M.; DeDoncker, R.W.A.A.; Karden, E. Impedance-Based Simulation Models of Supercapacitors and Li-Ion Batteries for Power Electronic Applications. IEEE Trans. Ind. Appl. 2005, 41, 742–747. [Google Scholar] [CrossRef]
- Barré, A.; Deguilhem, B.; Grolleau, S.; Gérard, M.; Suard, F.; Riu, D. A Review on Lithium-Ion Battery Ageing Mechanisms and Estimations for Automotive Applications. J. Power Sources 2013, 241, 680–689. [Google Scholar] [CrossRef]
- Birkl, C.R.; Roberts, M.R.; McTurk, E.; Bruce, P.G.; Howey, D.A. Degradation Diagnostics for Lithium Ion Cells. J. Power Sources 2017, 341, 373–386. [Google Scholar] [CrossRef]


Disclaimer/Publisher’s Note: The statements, opinions and data contained in all publications are solely those of the individual author(s) and contributor(s) and not of MDPI and/or the editor(s). MDPI and/or the editor(s) disclaim responsibility for any injury to people or property resulting from any ideas, methods, instructions or products referred to in the content. |
© 2023 by the authors. Licensee MDPI, Basel, Switzerland. This article is an open access article distributed under the terms and conditions of the Creative Commons Attribution (CC BY) license (https://creativecommons.org/licenses/by/4.0/).