
Revisiting Market Power in the Polish Power System


Abstract
1. Introduction
2. Literature Review
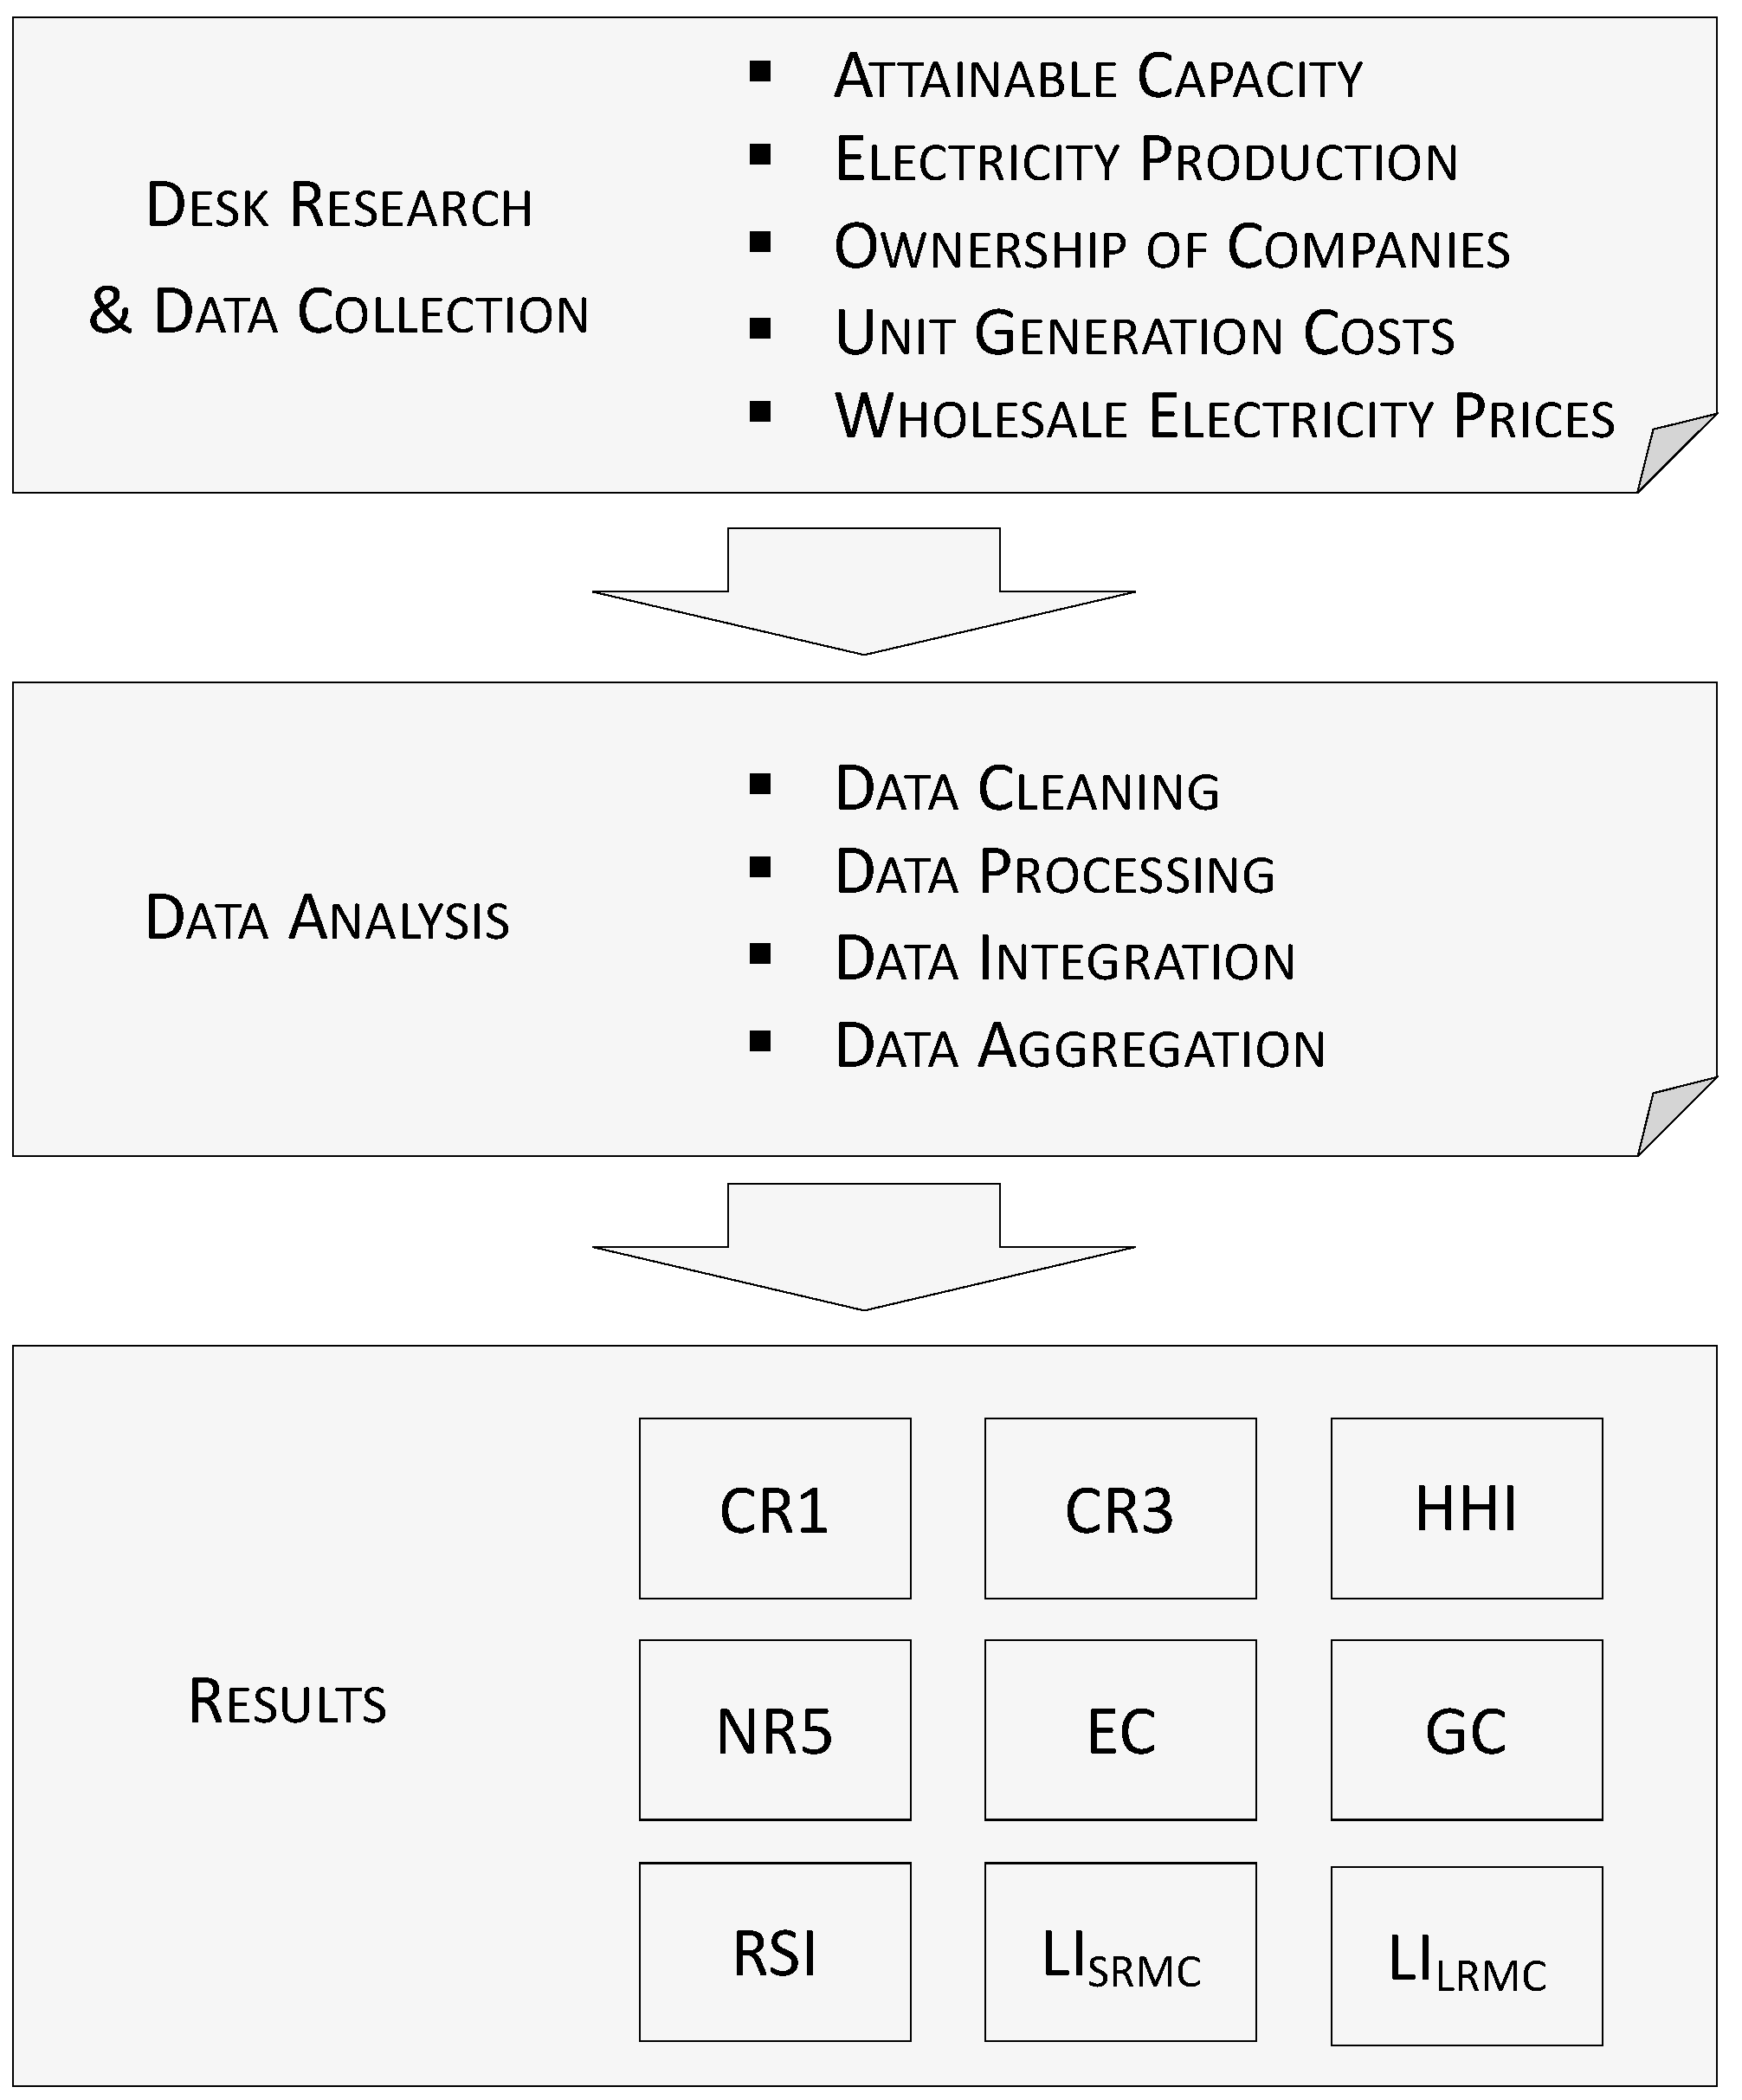
3. Methods
4. Case Study
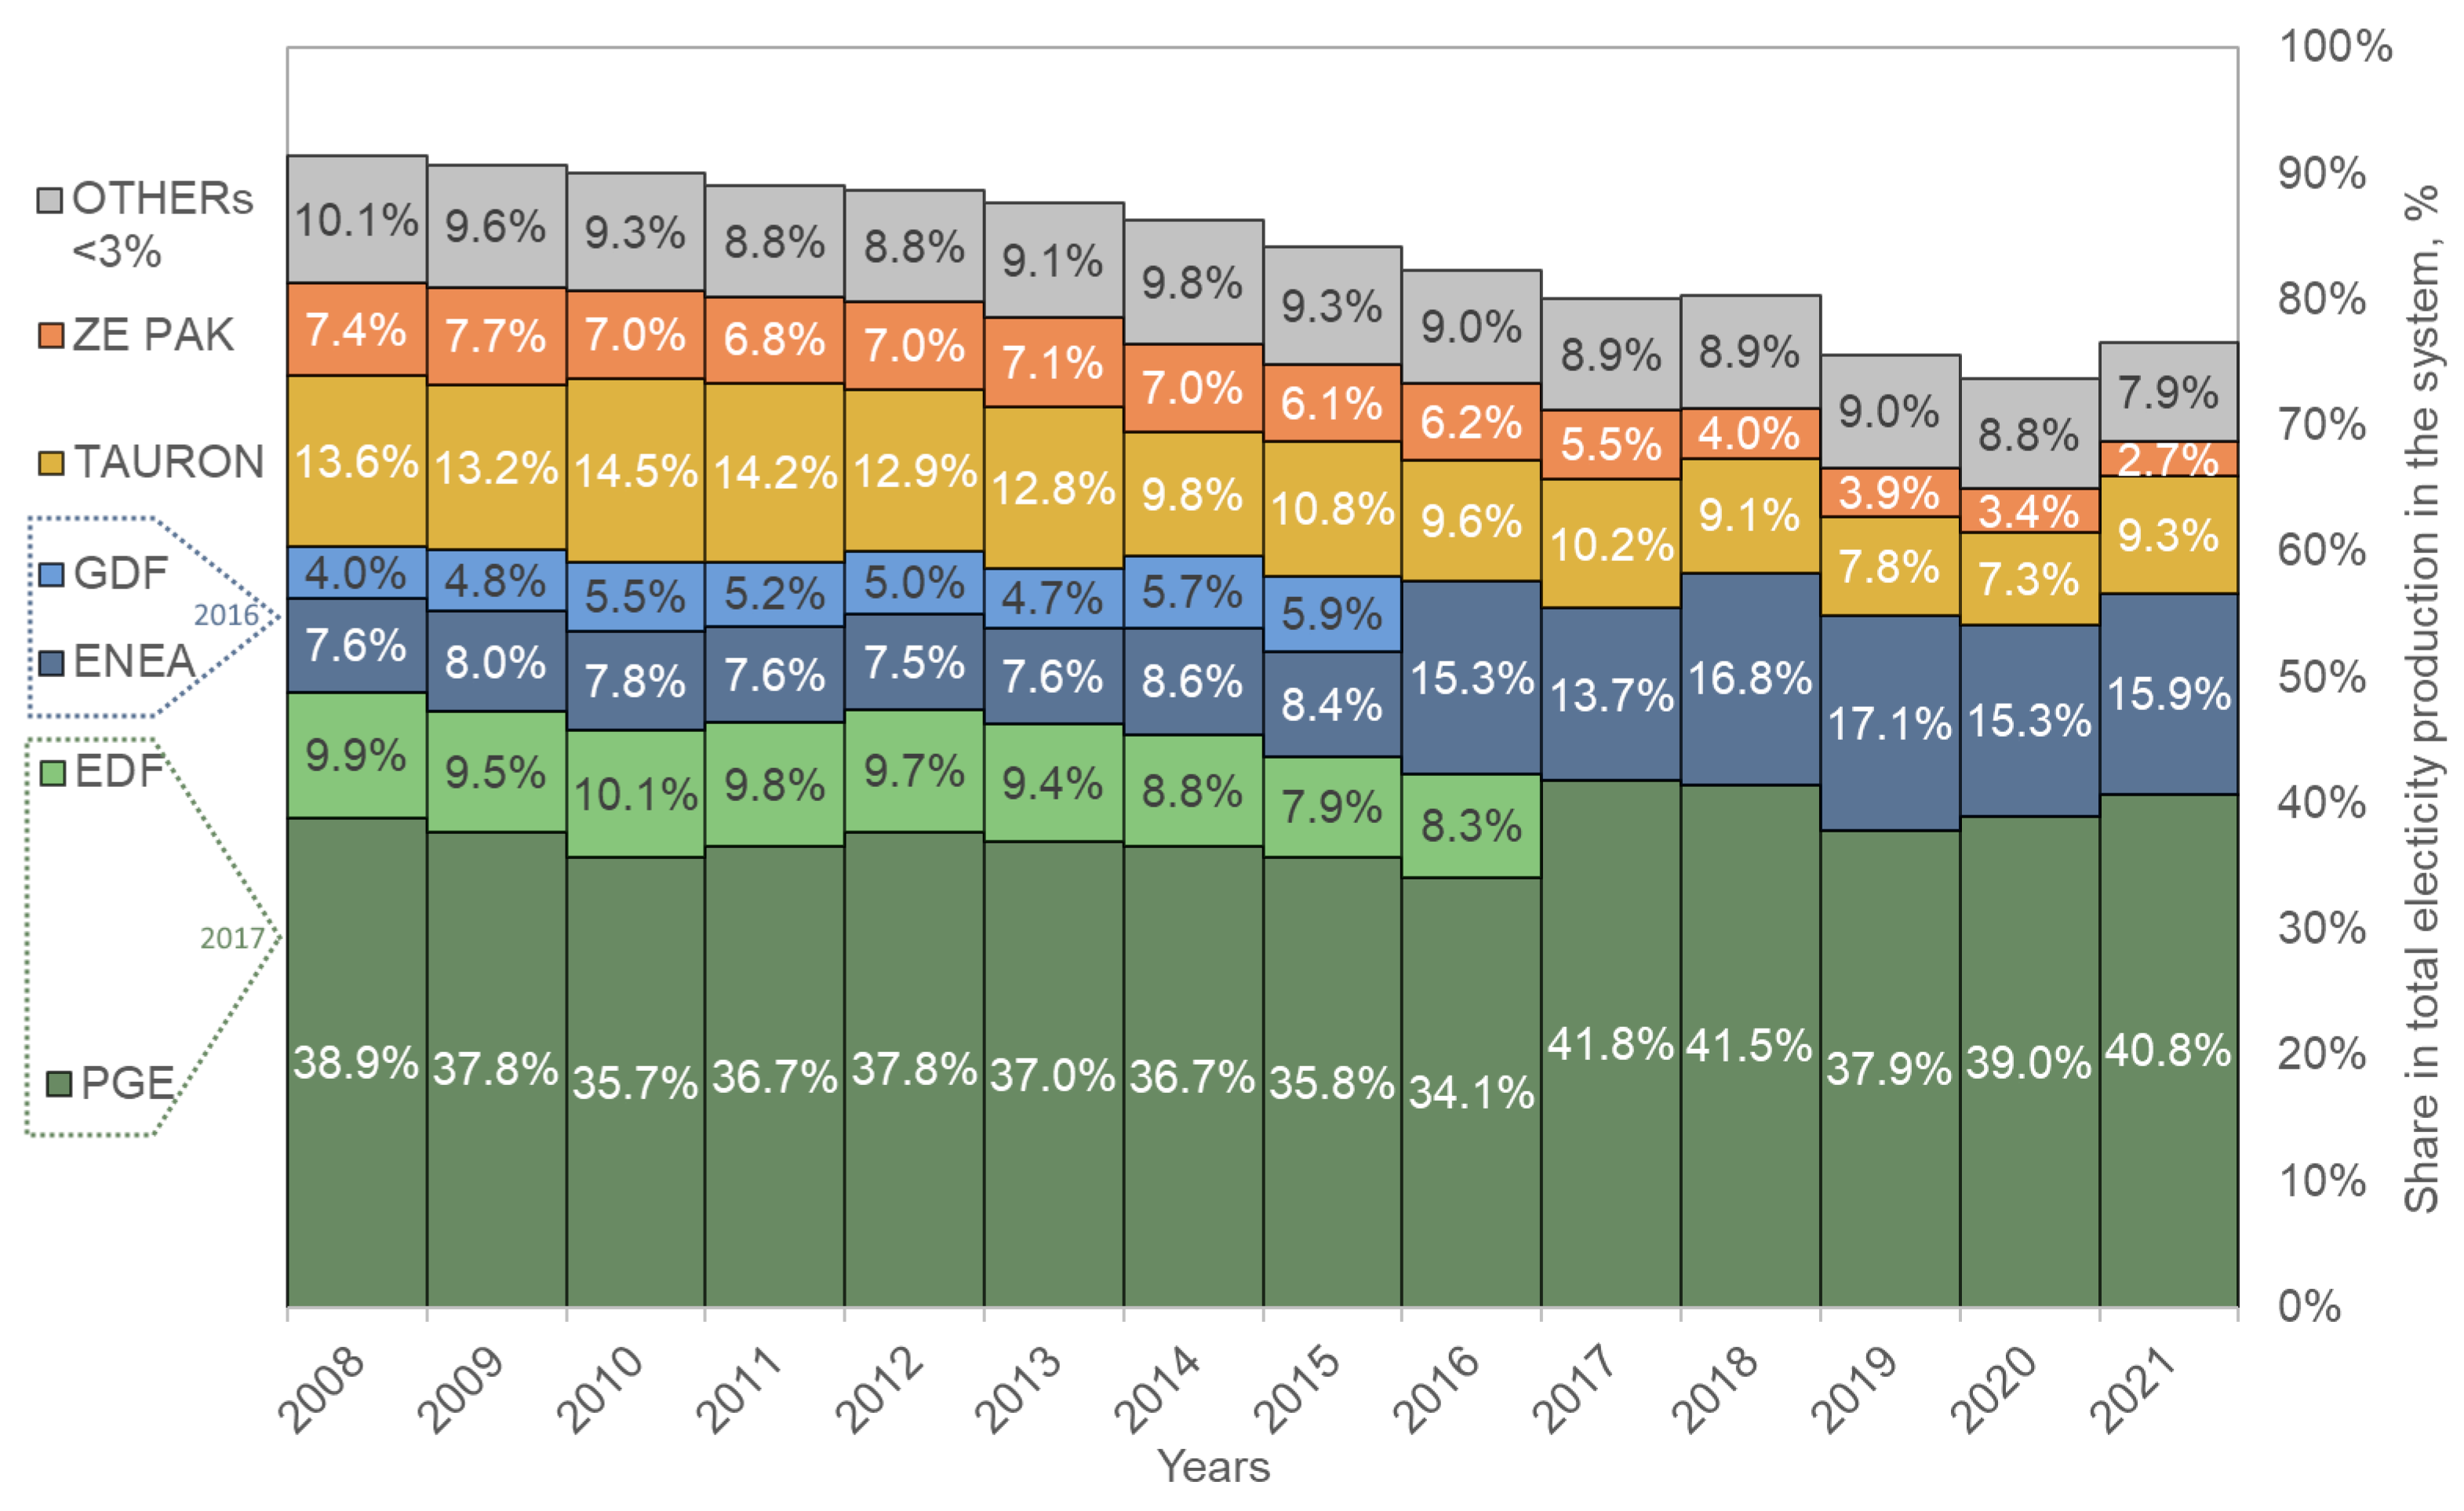
4.1. The Polish Power System
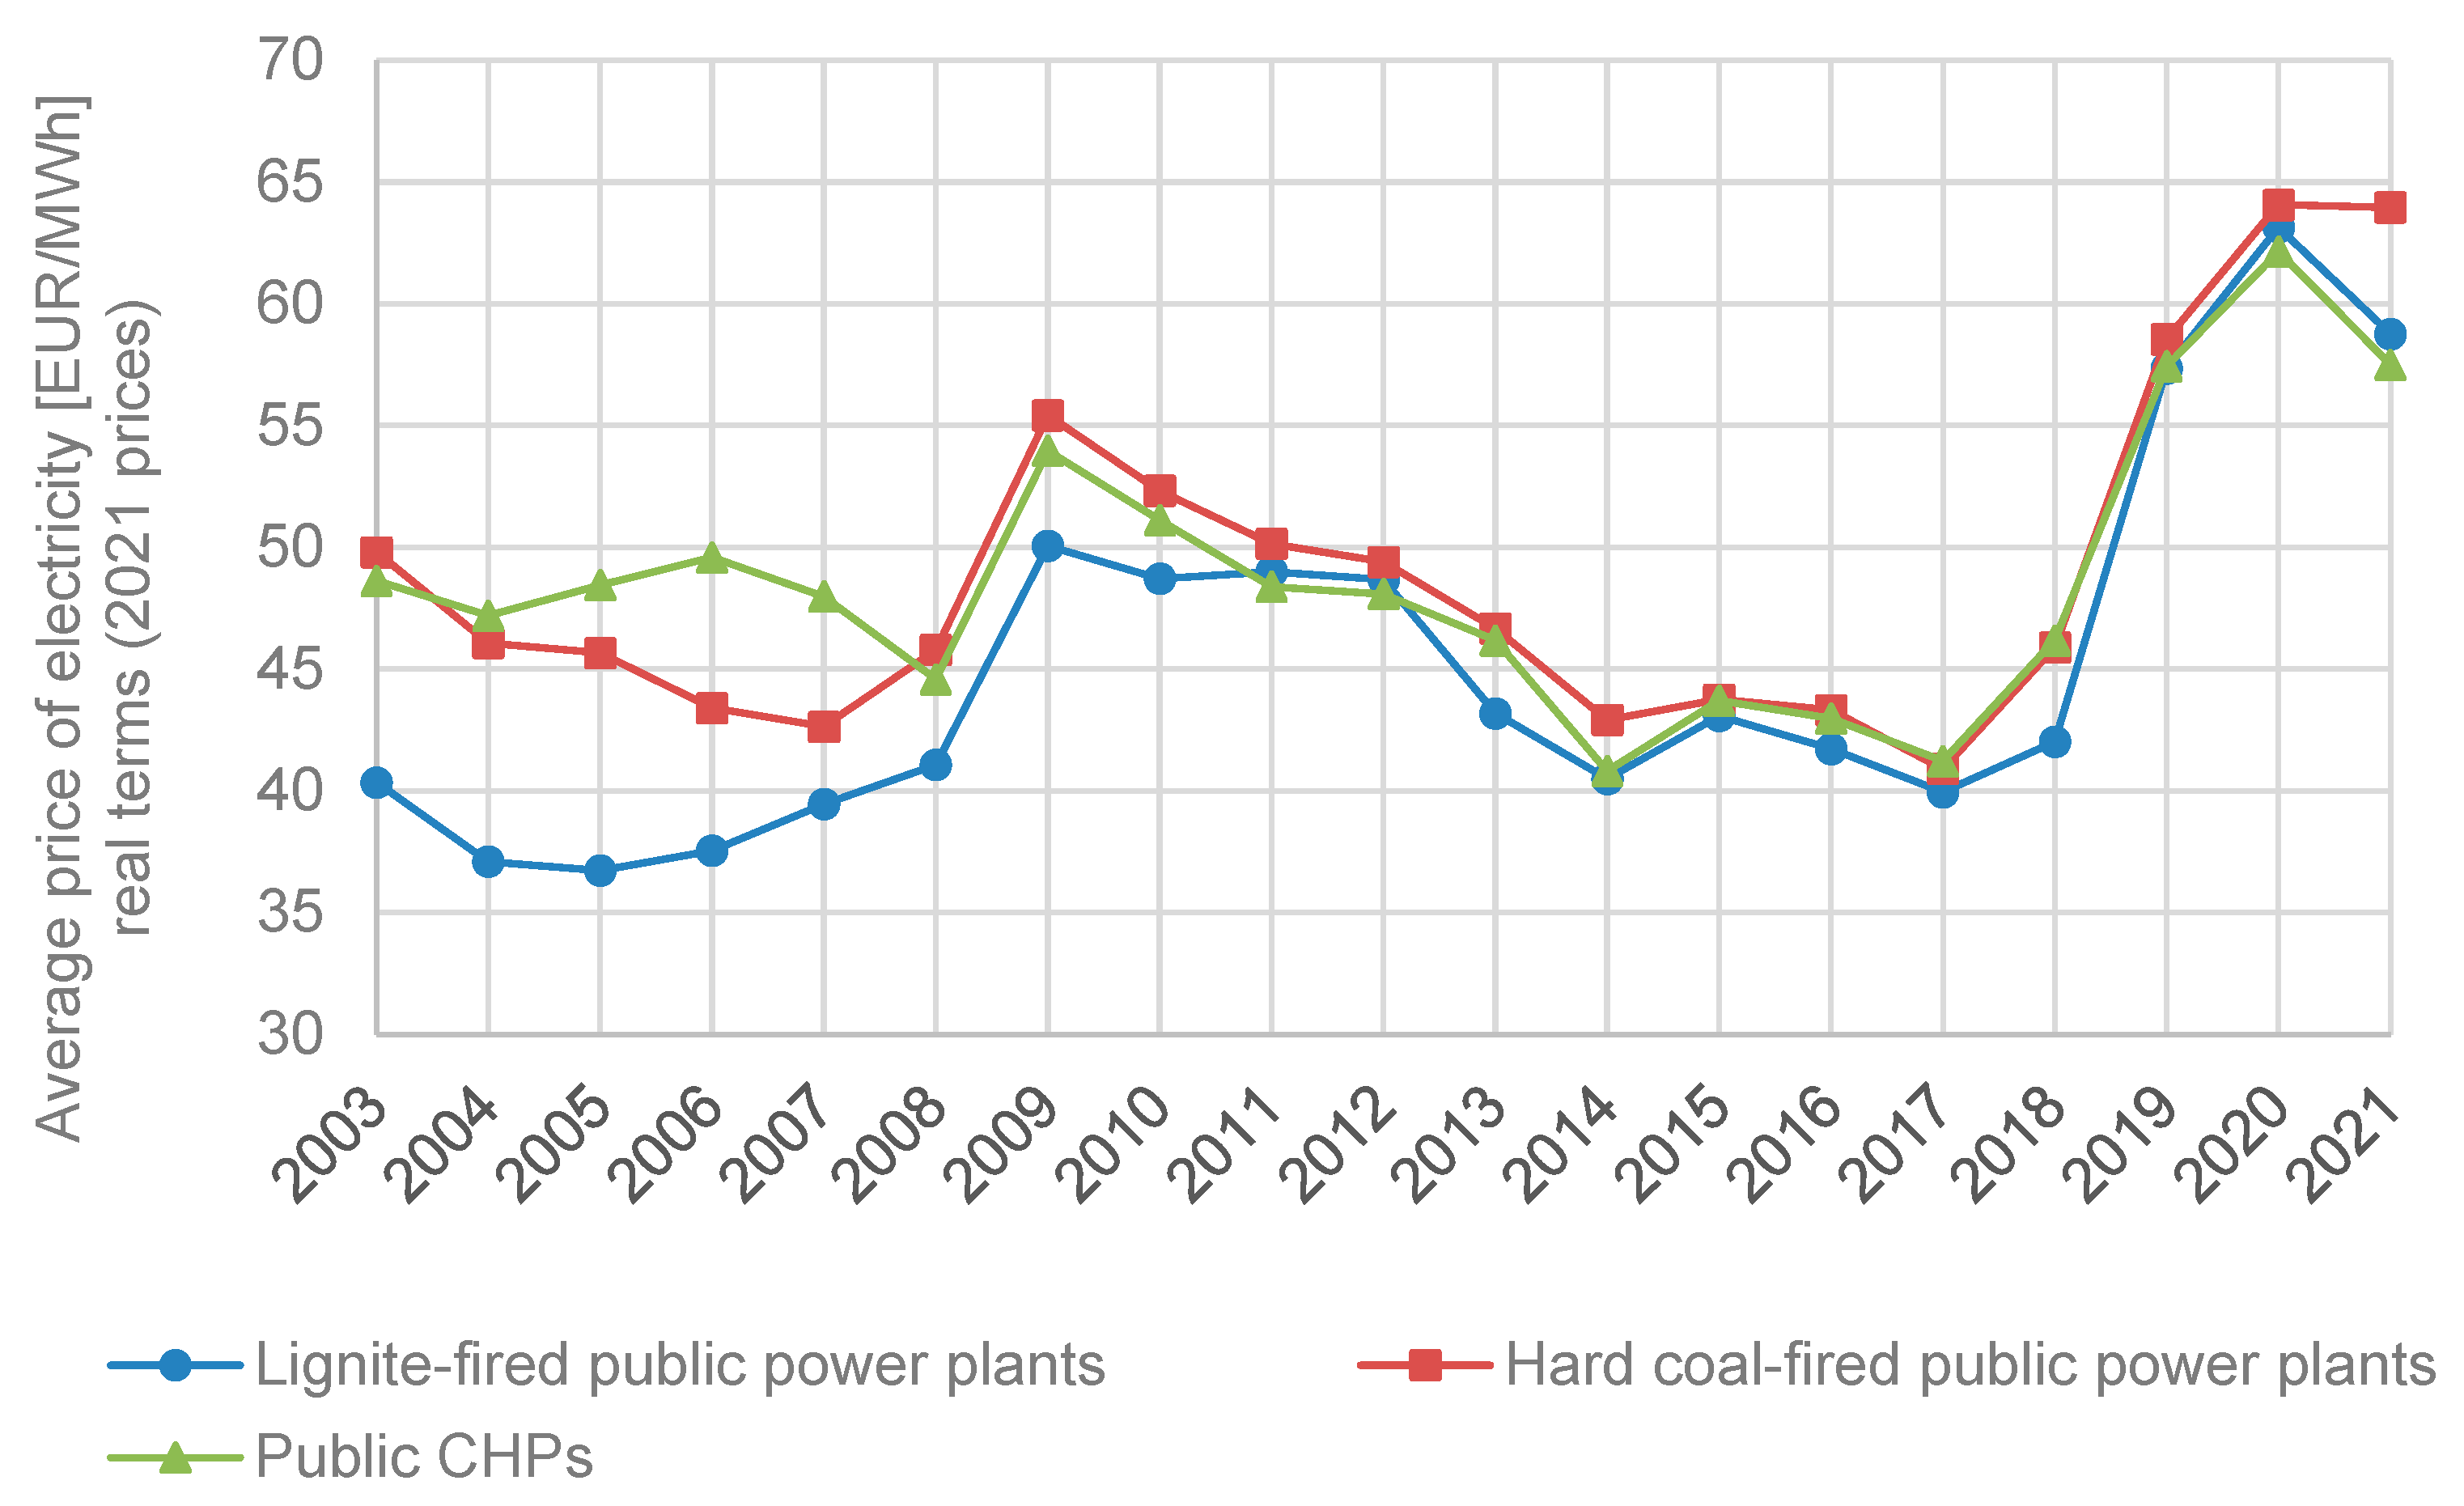
4.2. Costs of Electricity Generation and Wholesale Electricity Prices
5. Results and Discussion
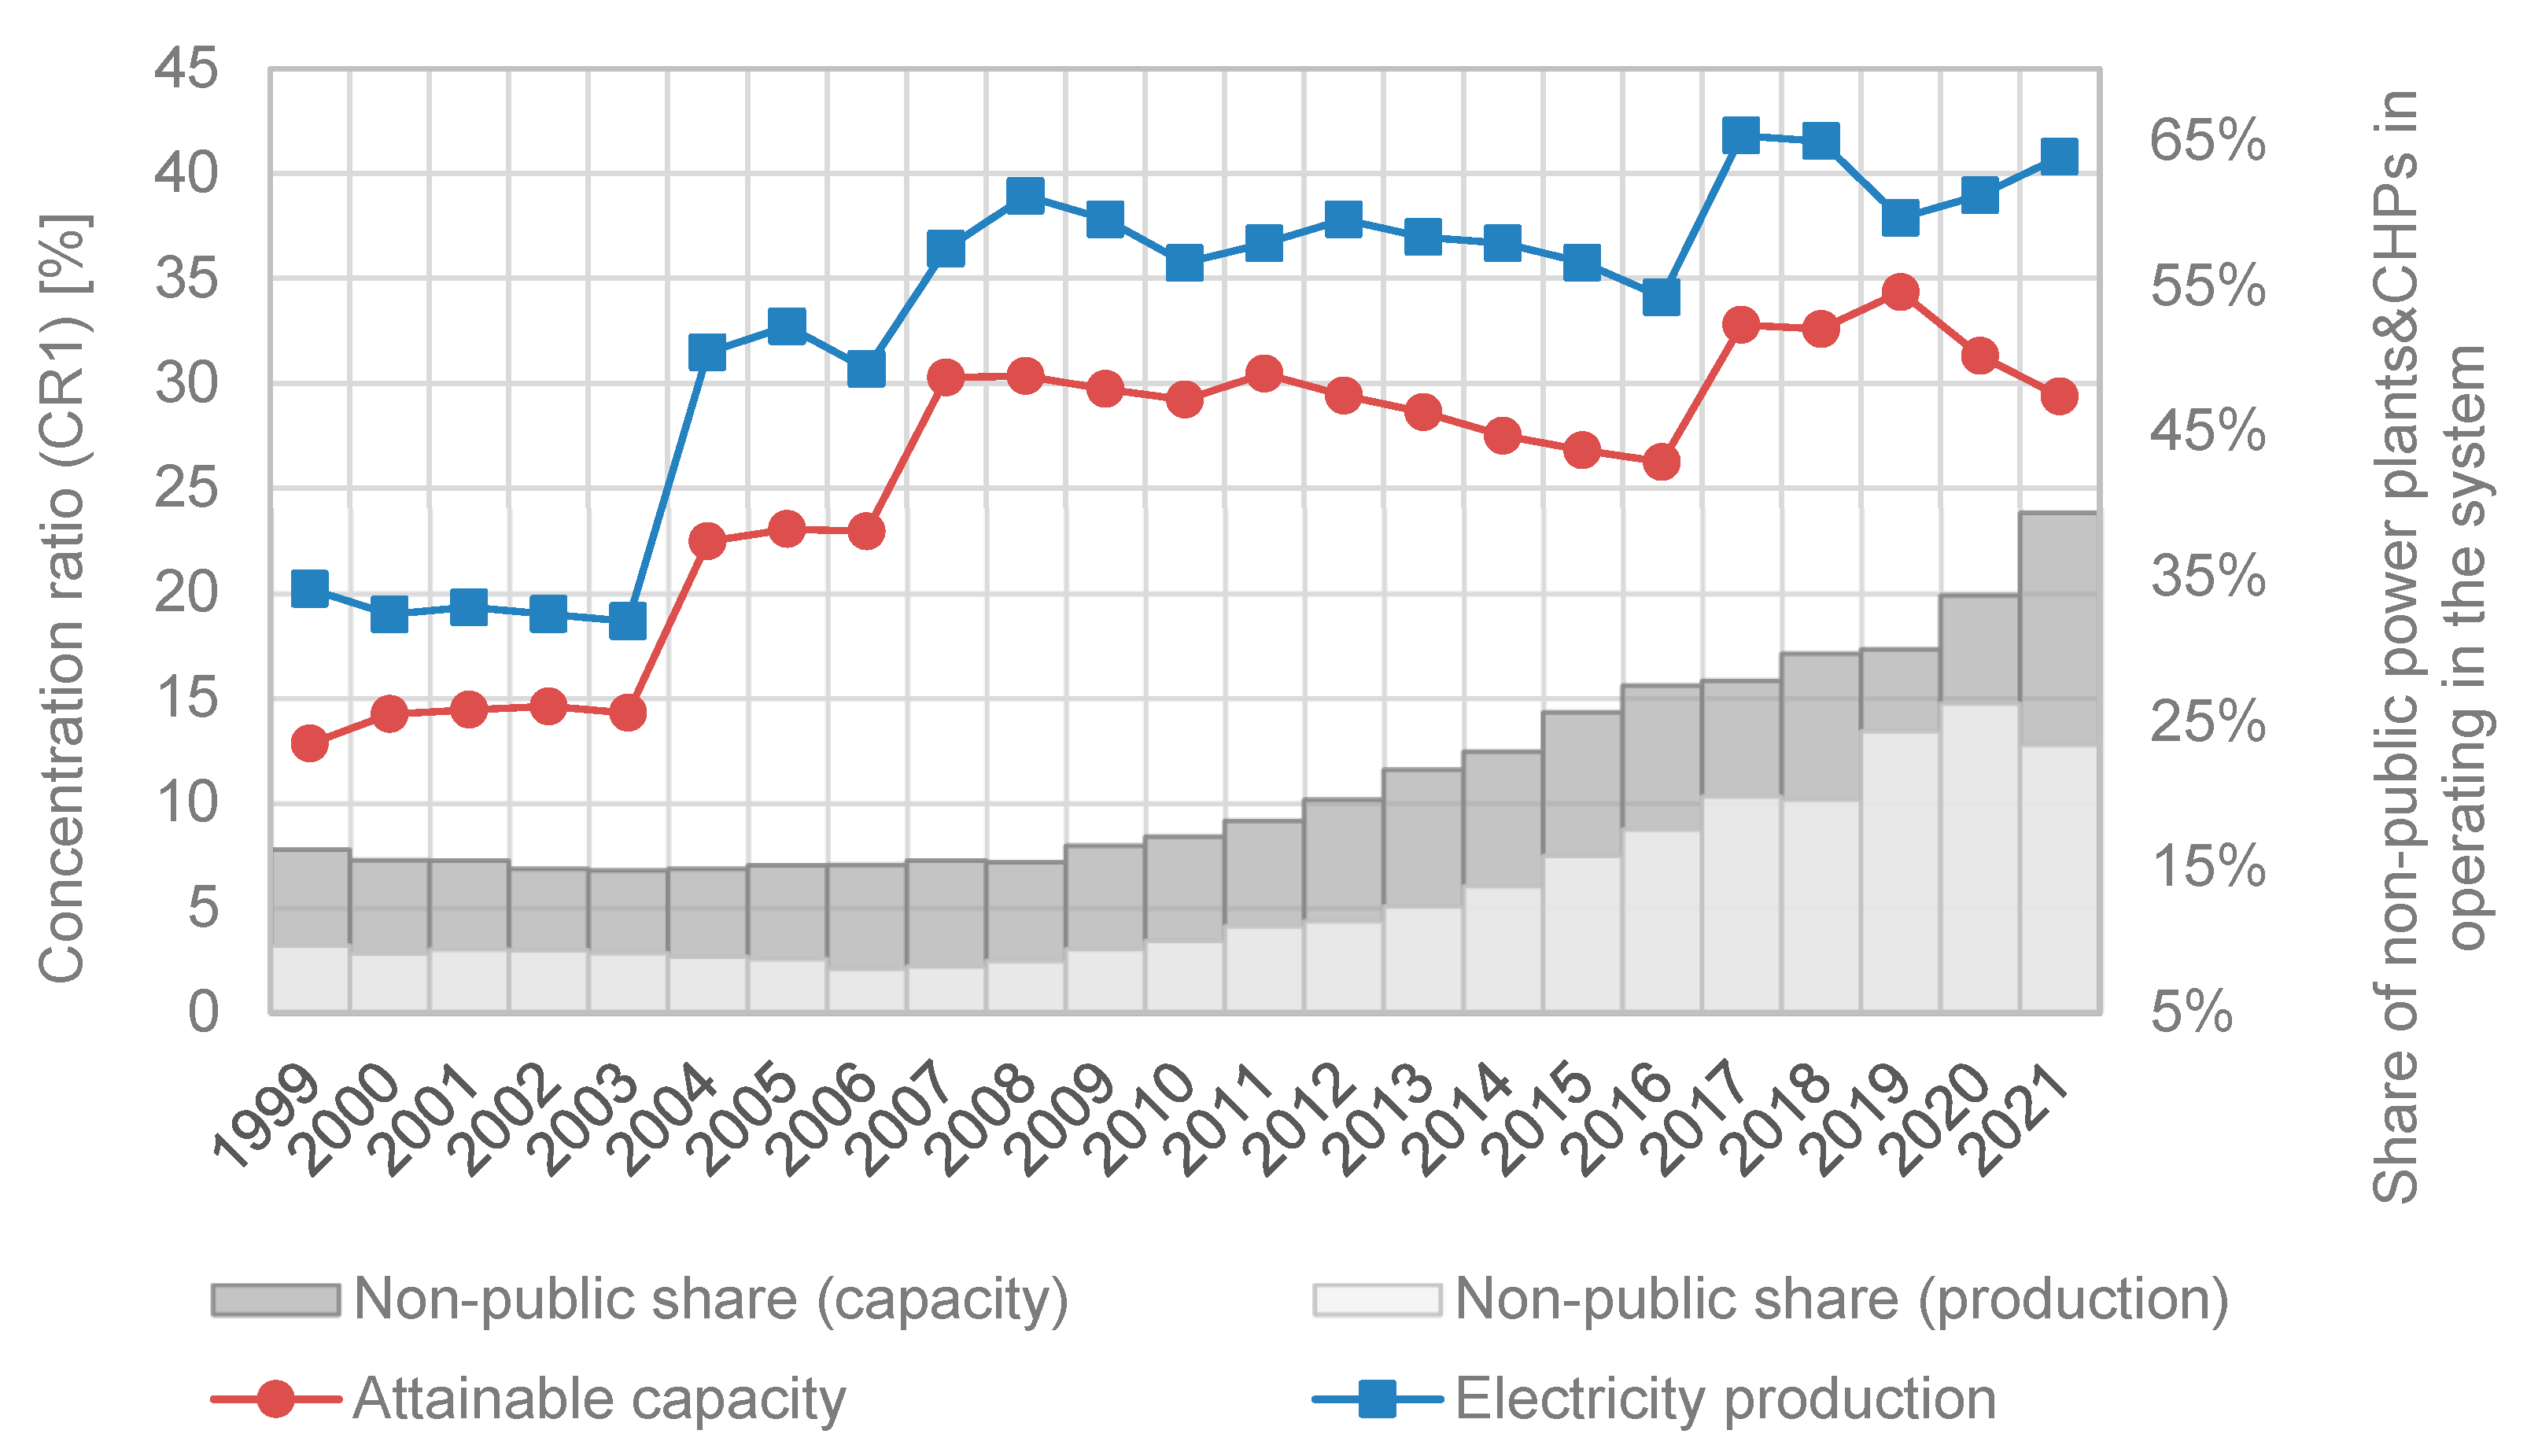
5.1. Concentration Ratios
5.2. Herfindahl–Hirschman Index
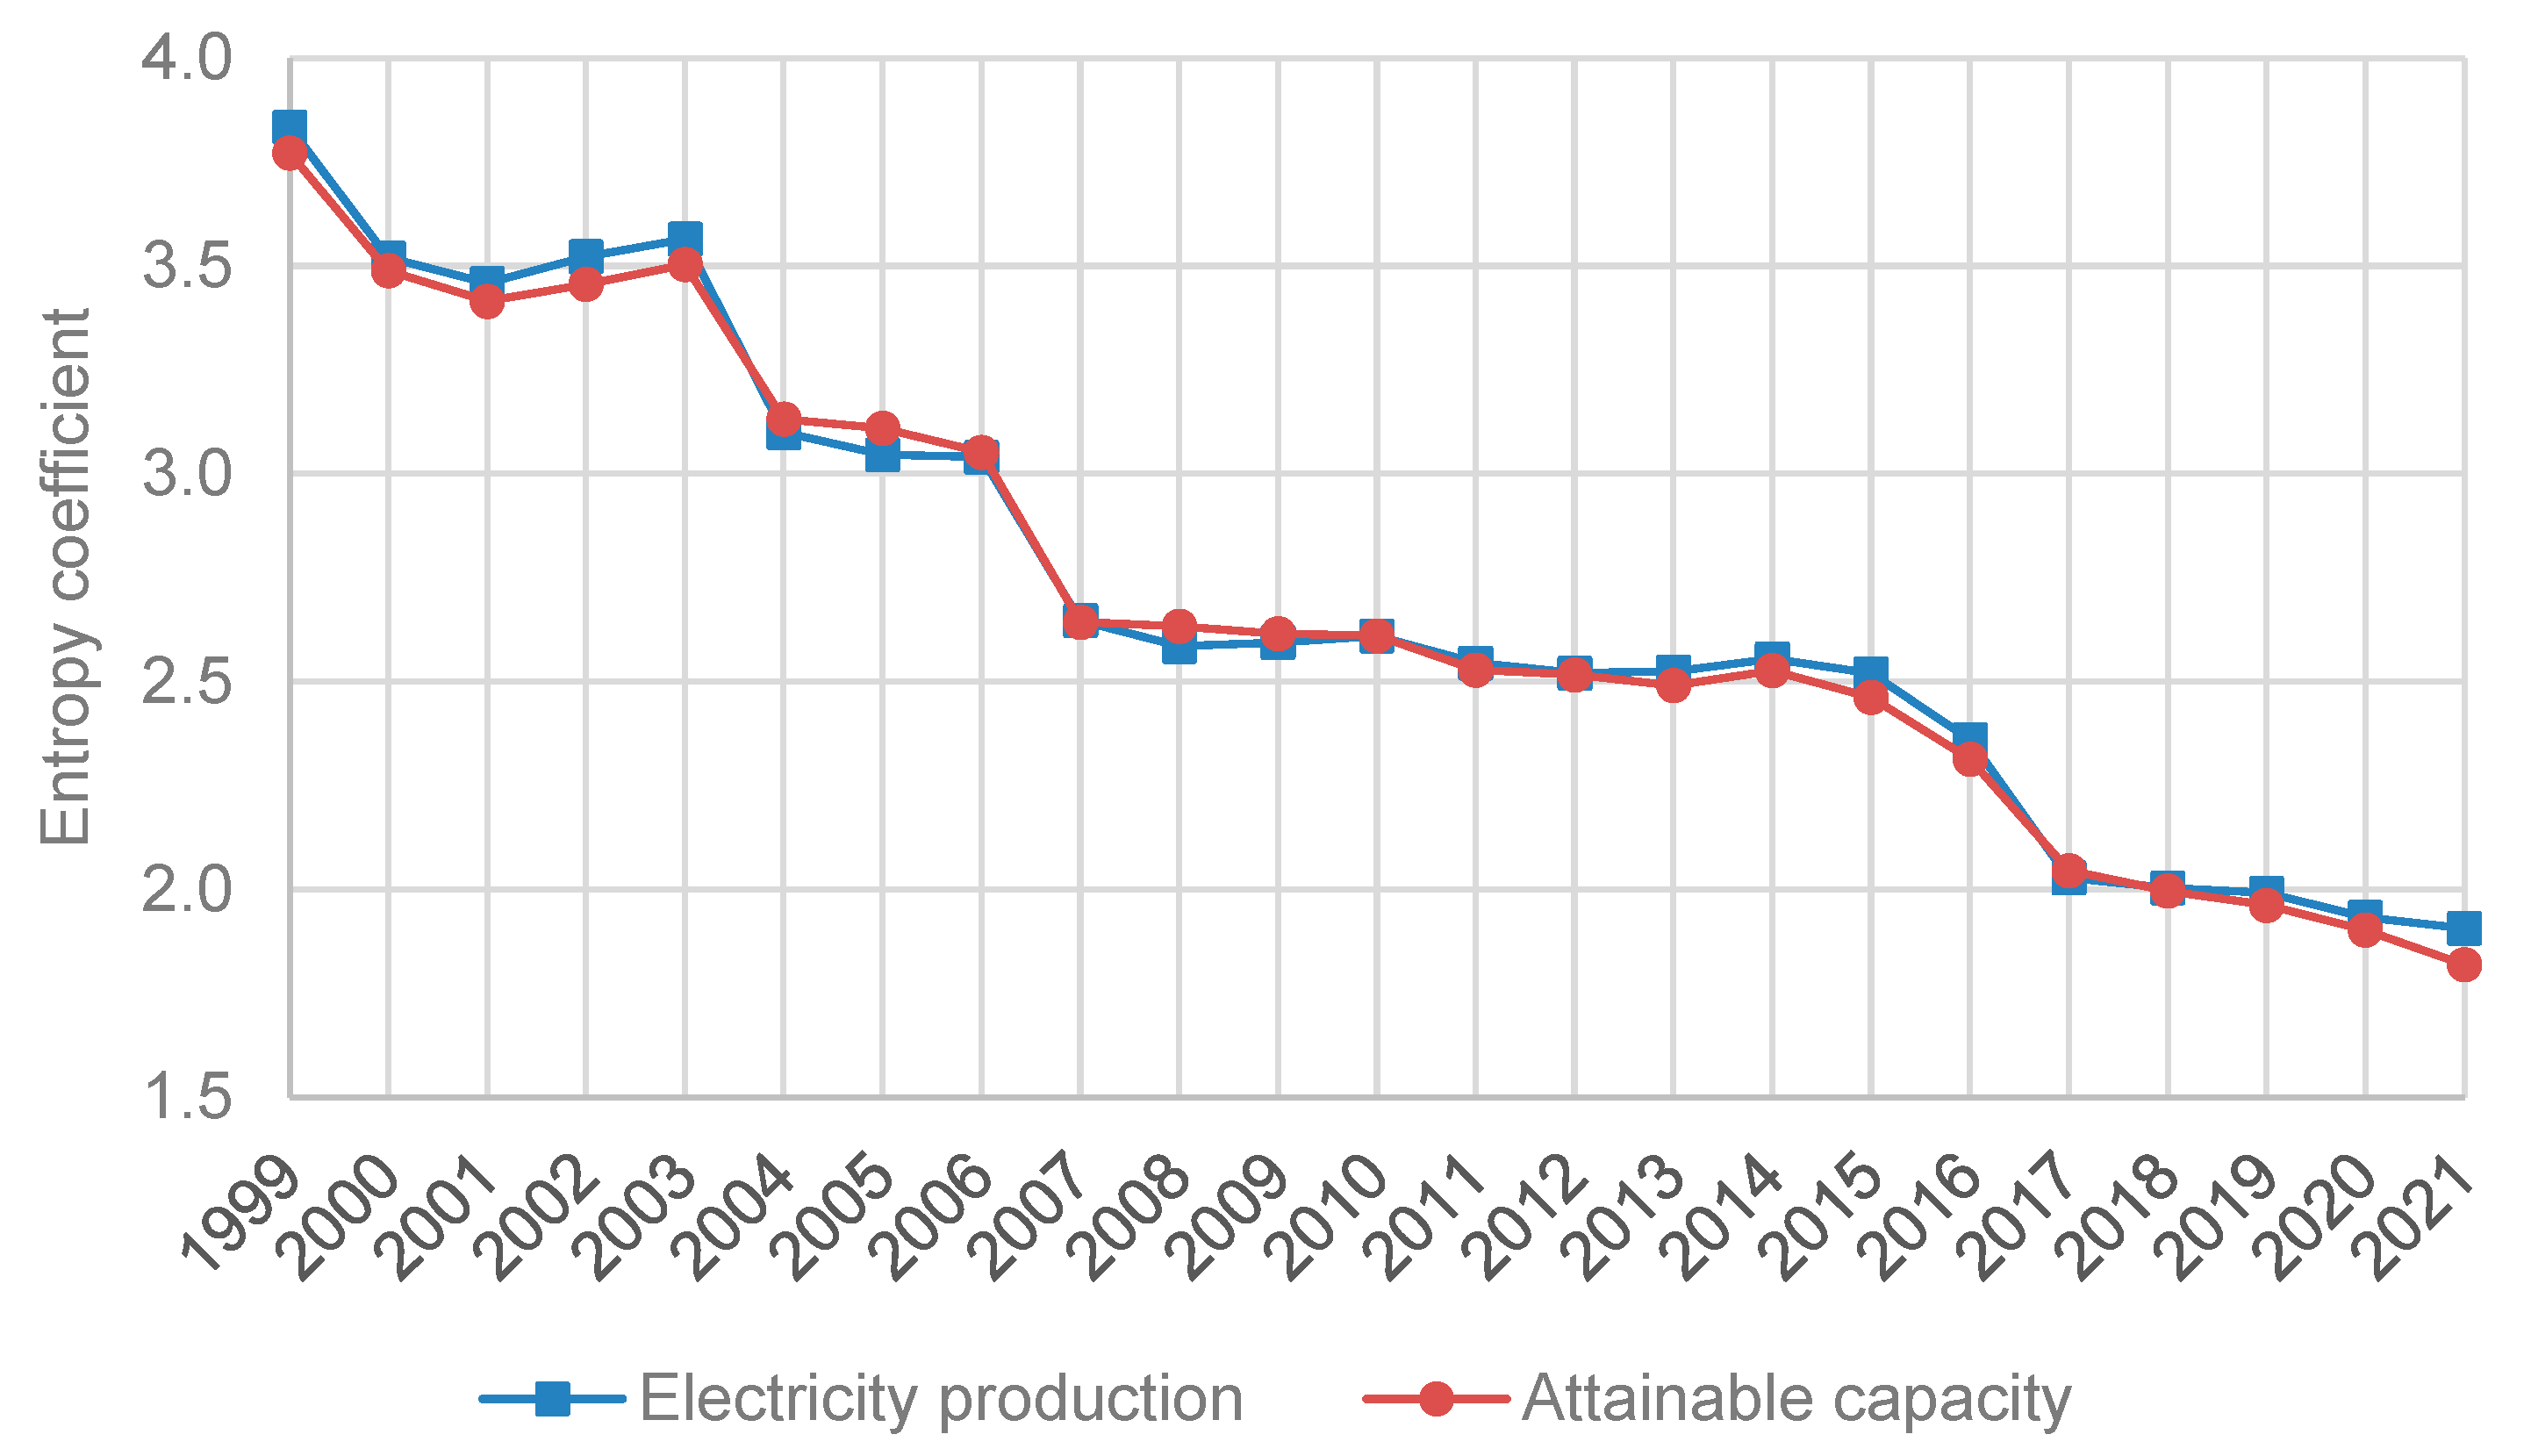
5.3. Entropy Coefficient
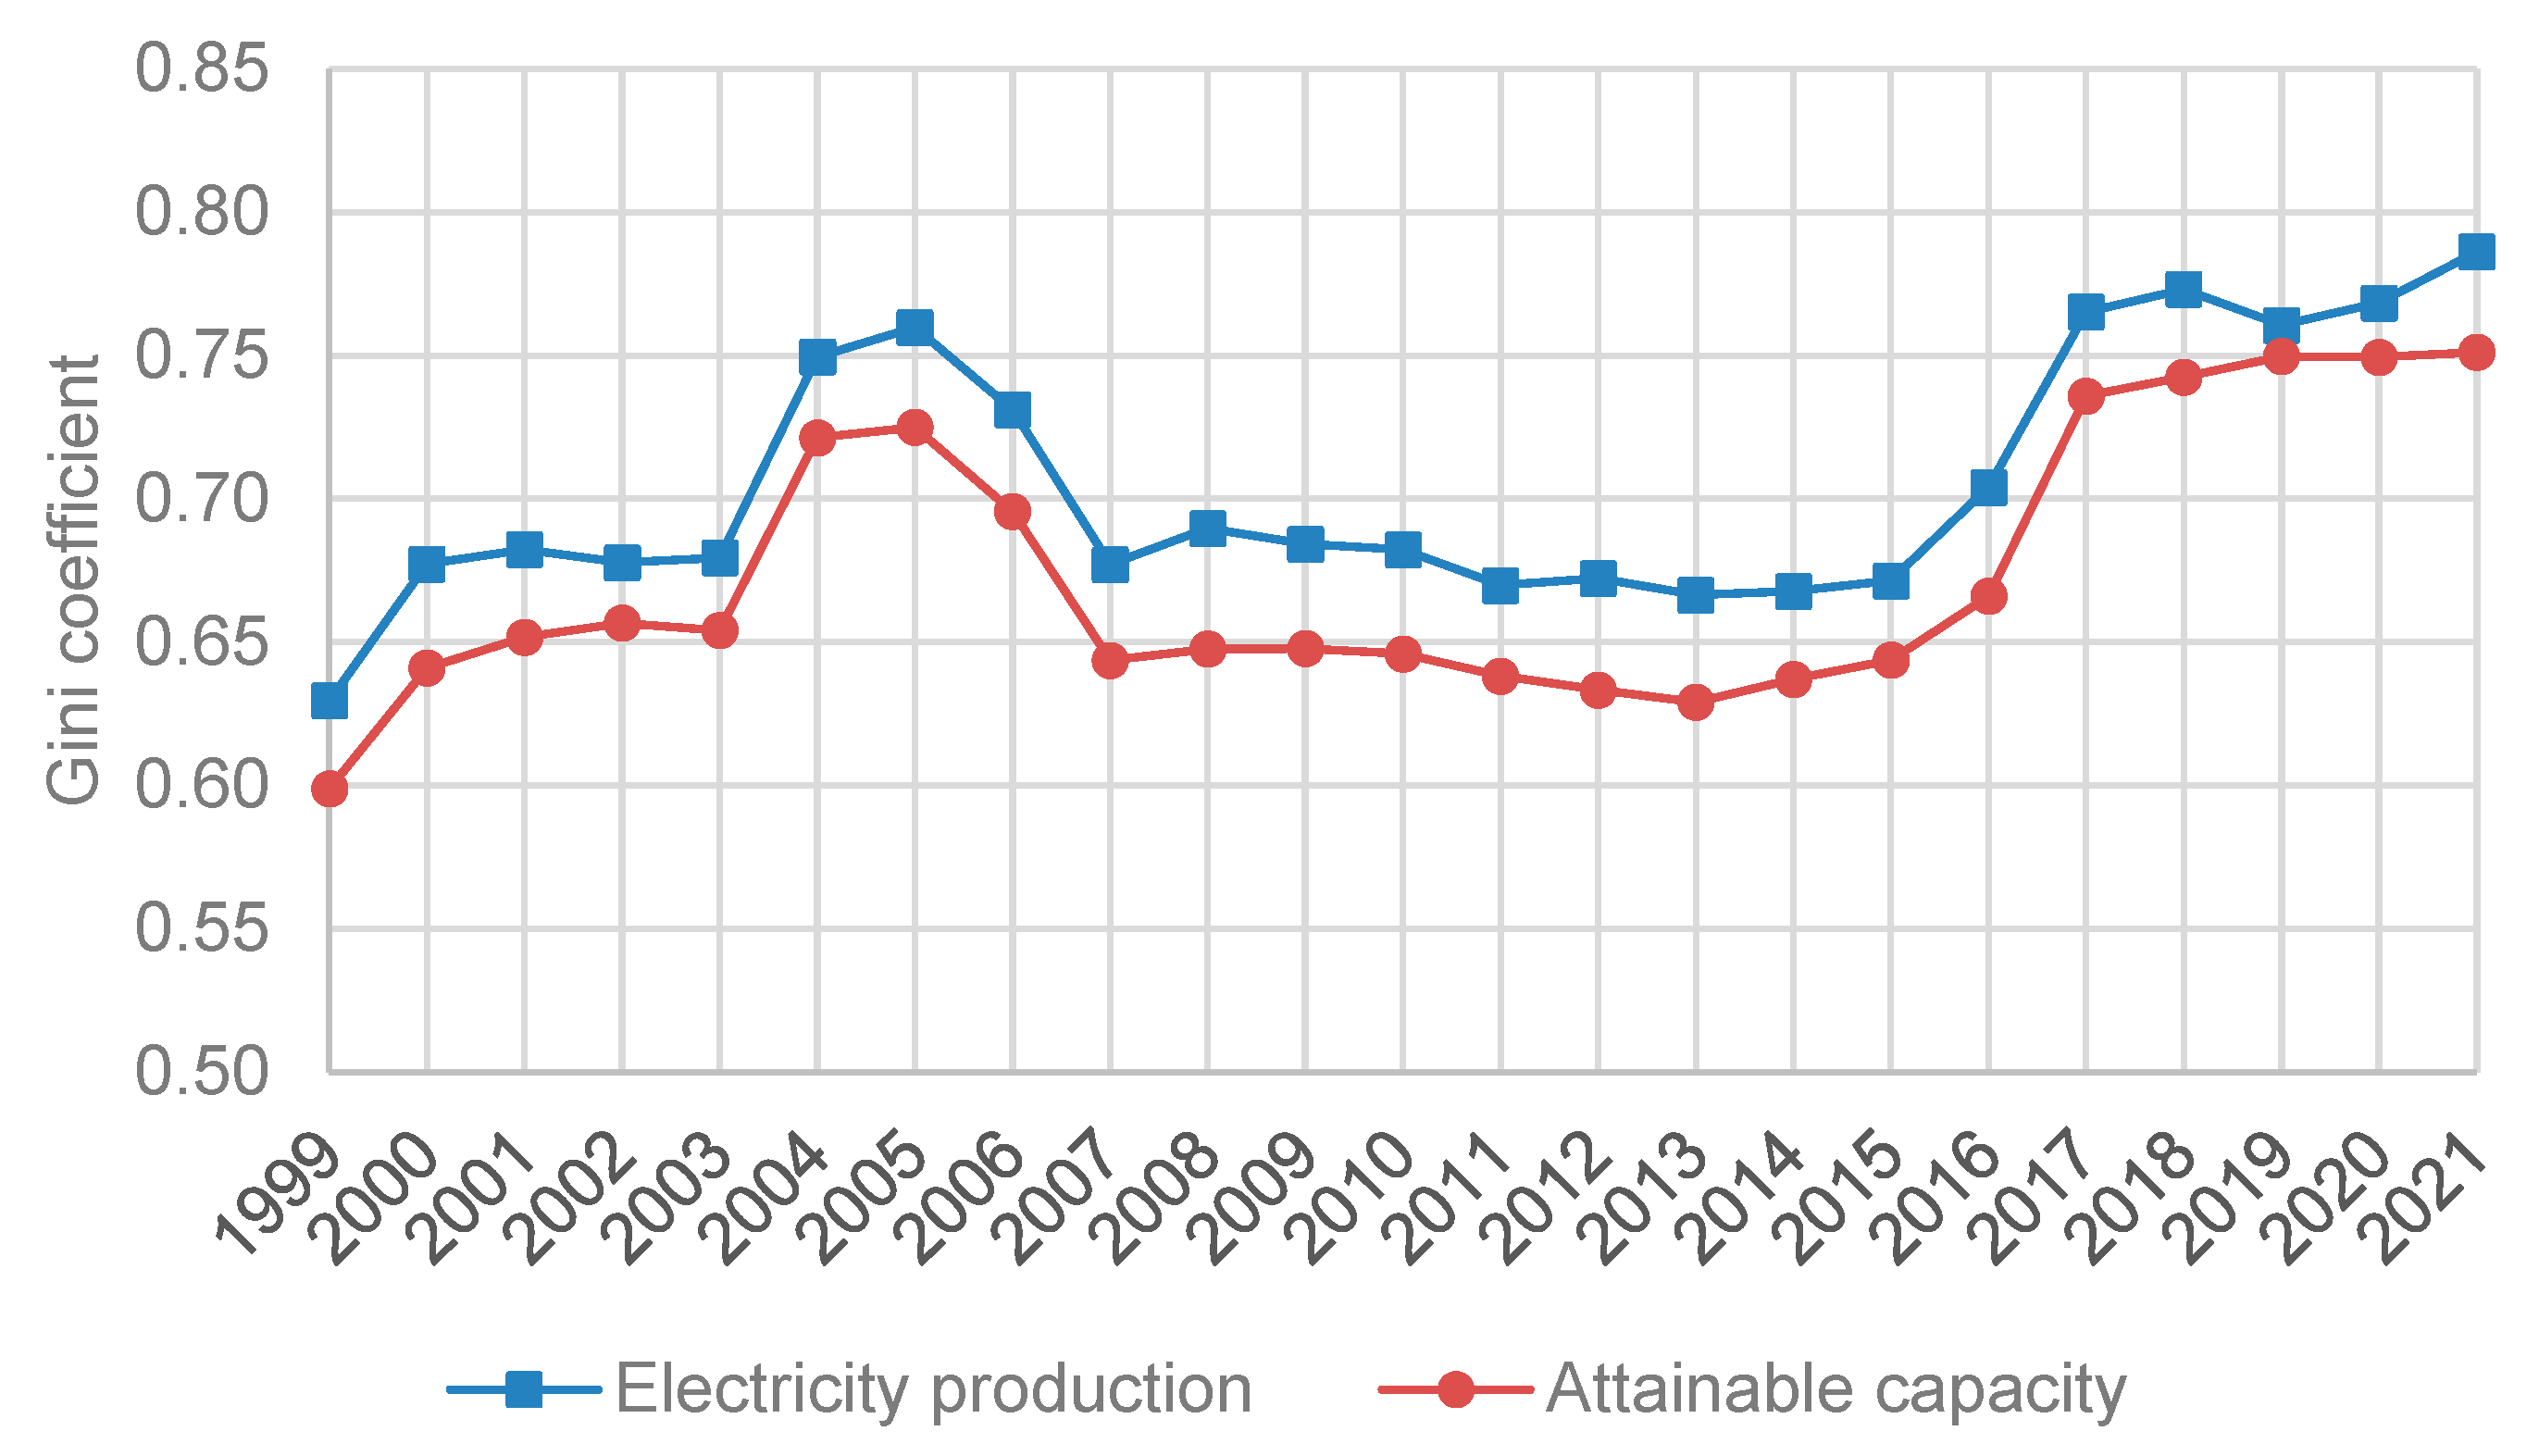
5.4. Gini Coefficient
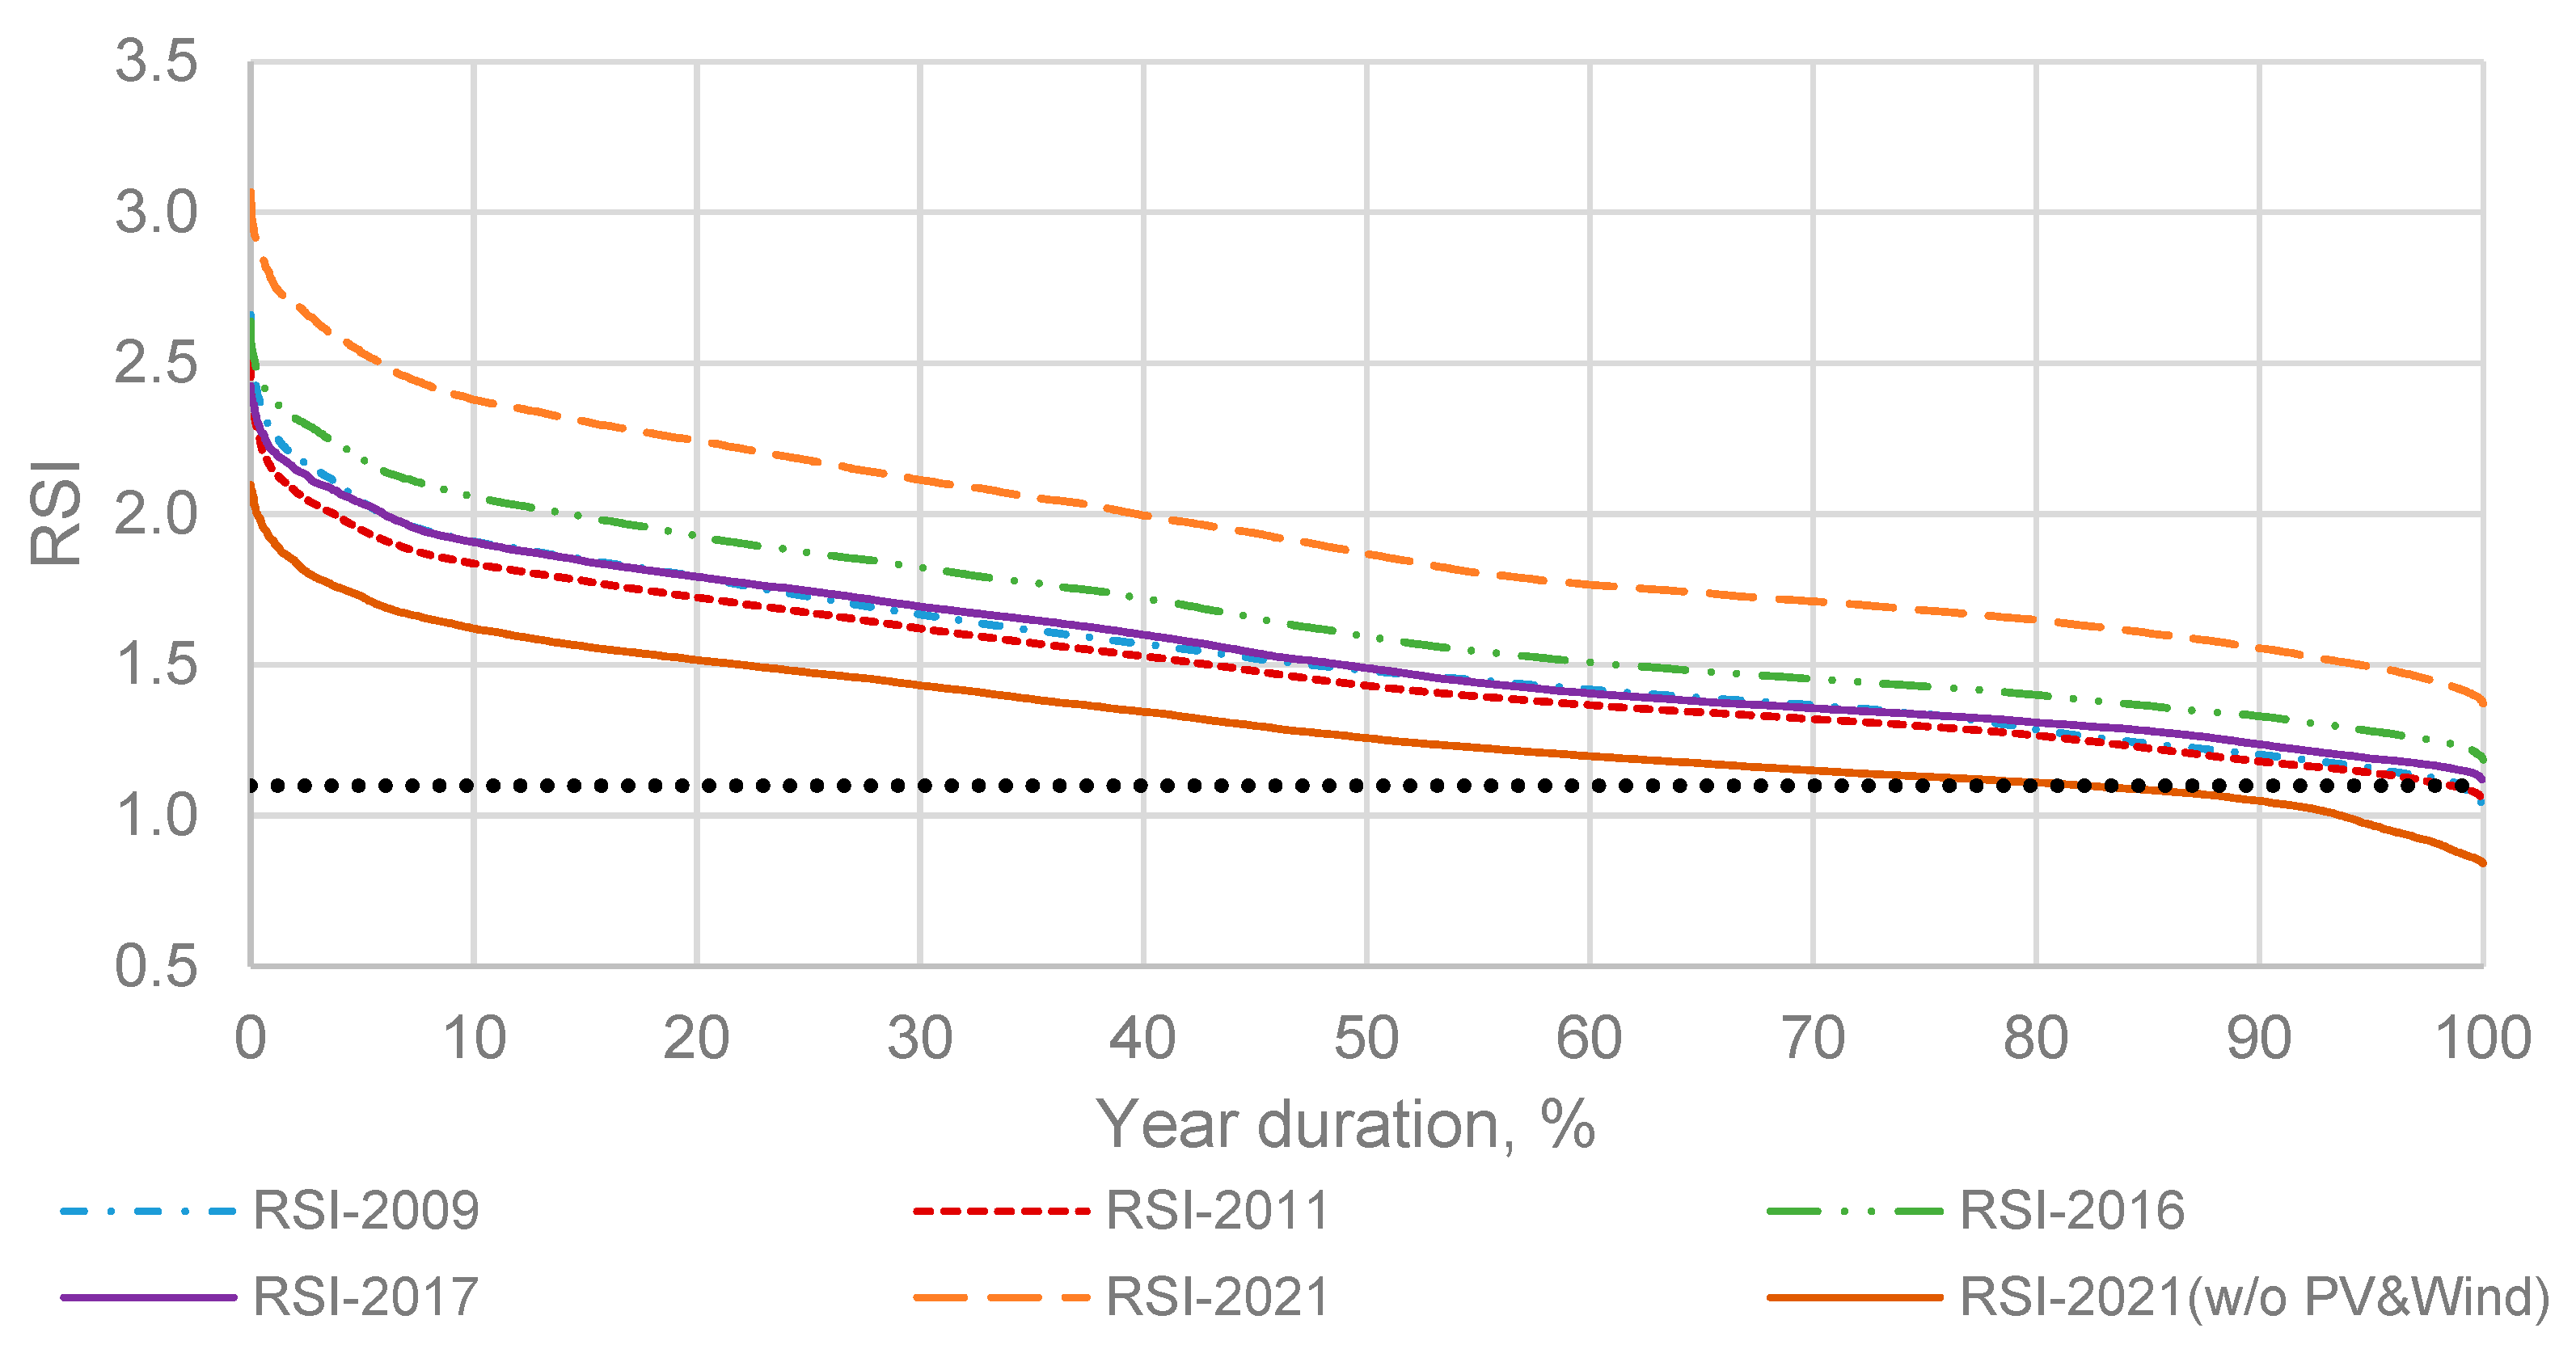
5.5. Residual Supply Index
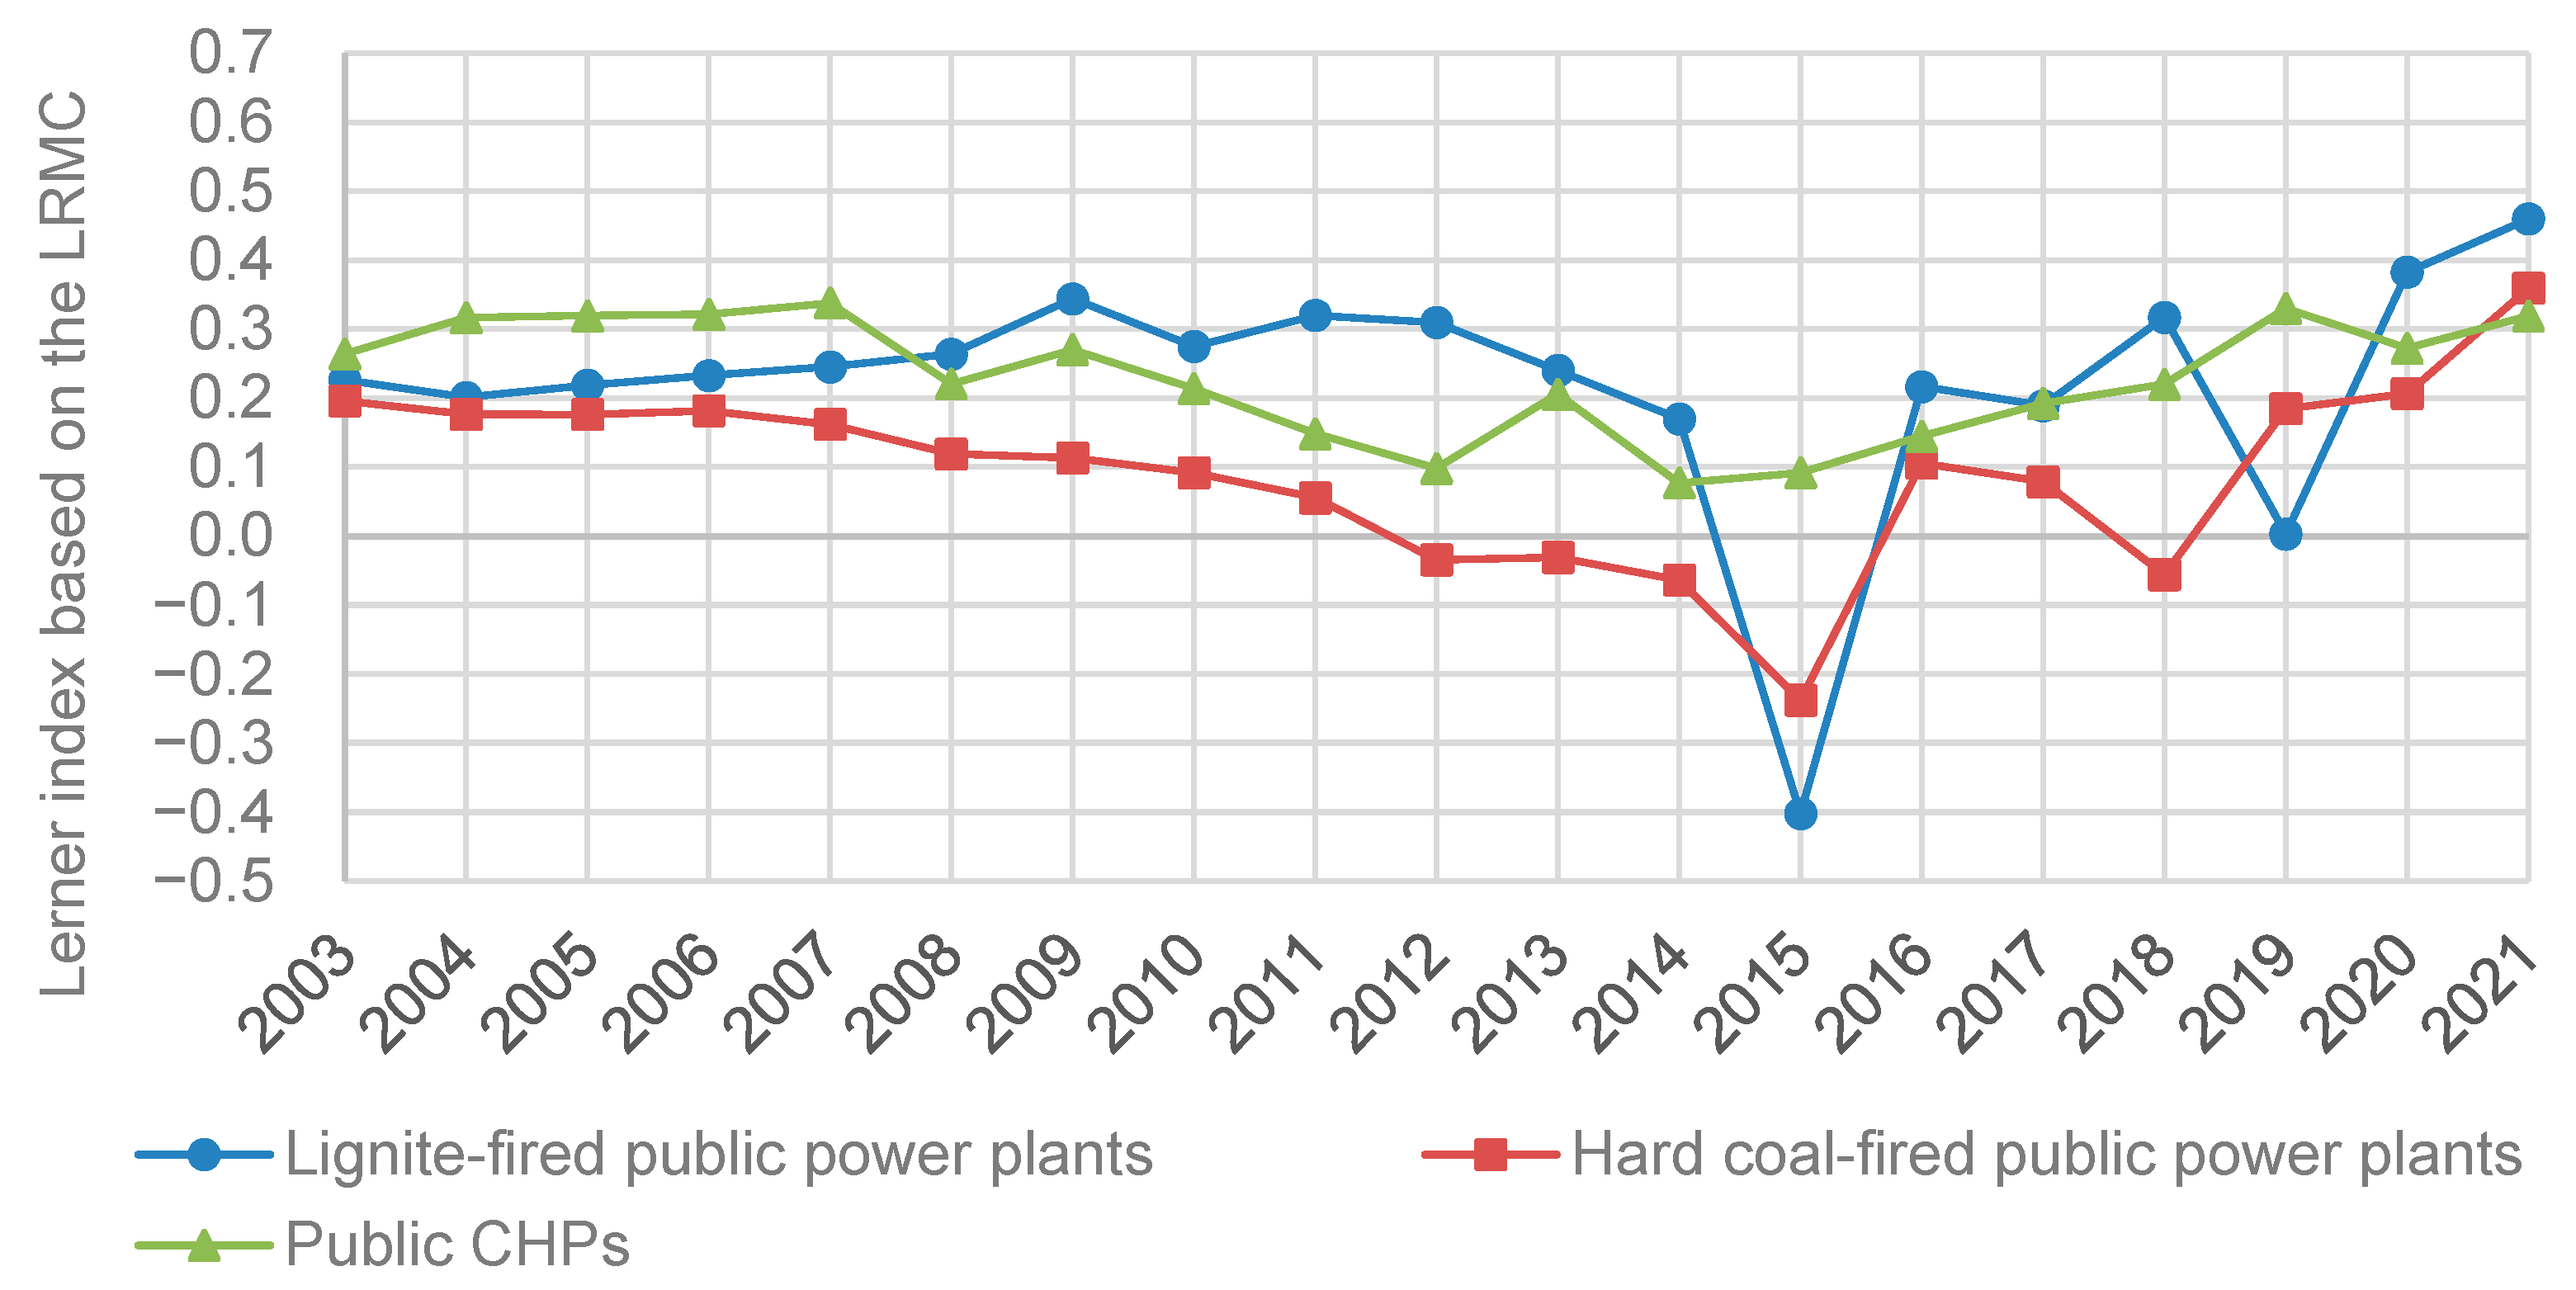
5.6. Lerner Index
6. Conclusions and Policy Implications
- The concentration ratio of the largest electric power company increased from 37.8% in 2009 to 40.8% in 2021 in terms of electricity generation and decreased from 29.7% to 29.4% in terms of capacity.
- The concentration ratio of the three largest electric power companies increased from 60.5% in 2009 to 66.0% in 2021 in terms of electricity generation and decreased from 53.7% to 50.2% in terms of capacity.
- The number of companies with at least a 5% market share decreased from five in 2009 to three in 2021 in terms of electricity generation and from six to three in terms of capacity.
- The Herfindahl–Hirschman Index increased from 1858.6 in 2009 to 2020.9 in 2021 in terms of electricity generation and decreased from 1334.4 to 1101.1 in terms of capacity.
- The Entropy Coefficient decreased from 2.6 in 2009 to 1.9 in 2021 in terms of electricity generation and decreased from 2.6 to 1.8 in terms of capacity.
- The Gini Coefficient increased from 0.68 in 2009 to 0.78 in 2021 in terms of electricity generation and from 0.65 to 0.75 in terms of capacity.
- The Residual Supply Index of the largest electric power company increased from 1.03 in 2009 to 1.38 in 2021 when the total capacity in the system was considered and decreased from 1.0 to 0.85 when wind and solar PV capacity was excluded.
- The Lerner Index based on short-run marginal costs increased from 0.57 in 2009 to 0.66 in 2021 for lignite-fired power plants, from 0.35 to 0.56 for hard coal-fired power plants, and from 0.47 to 0.56 for hard coal-fired CHPs.
- The Lerner Index based on long-run marginal costs increased from 0.34 in 2009 to 0.46 in 2021 for lignite-fired power plants, from 0.11 to 0.36 for hard coal-fired power plants, and from 0.27 to 0.32 for hard coal-fired CHPs.
Author Contributions
Funding
Data Availability Statement
Acknowledgments
Conflicts of Interest
Nomenclature
| Name | Explanation |
| Abbreviations | |
| 10H | 10 times the tip height of a wind turbine |
| CHP | Combined heat and power |
| CR | Concentration ratio |
| EC | Entropy coefficient |
| ERO | Energy Regulatory Office |
| EUA | European Union Allowance |
| EU ETS | European Union Emission Trading System |
| GC | Gini Coefficient |
| HHI | Herfindahl–Hirschman Index |
| LI | Lerner Index |
| NR5 | Number of companies with at least a 5% market share |
| LRMC | Long-run marginal cost |
| OPFs | Open pension funds |
| PP | Power plant |
| RSI | Residual Supply Index |
| SRMC | Short-run marginal cost |
| Symbols | |
| CR1; CR3 | Concentration ratios of the largest (CR1) and three largest (CR3) companies in the market |
| -th company | |
| Average market share | |
| Demand in time period | |
| -th company | |
| Marginal cost of electricity generation of the -th company | |
| Number of electric power companies in the market | |
| Wholesale electricity price | |
| Quantity of electricity generation or capacity of the -th company | |
| Time period | |
References
- Pollitt, M.G. The Role of Policy in Energy Transitions: Lessons from the Energy Liberalisation Era. Energy Policy 2012, 50, 128–137. [Google Scholar] [CrossRef]
- Keppler, J.H.; Quemin, S.; Saguan, M. Why the Sustainable Provision of Low-Carbon Electricity Needs Hybrid Markets. Energy Policy 2022, 171, 113273. [Google Scholar] [CrossRef]
- Kirschen, D.; Strbac, G. Fundamentals of Power System Economics, 2nd ed.; John Wiley & Sons Ltd.: Hoboken, NJ, USA, 2019. [Google Scholar]
- Komorowska, A.; Kaszyński, P.; Kamiński, J. Where Does the Capacity Market Money Go? Lessons Learned from Poland. Energy Policy 2023, 173, 113419. [Google Scholar] [CrossRef]
- Nicolli, F.; Vona, F. Energy Market Liberalization and Renewable Energy Policies in OECD Countries. Energy Policy 2019, 128, 853–867. [Google Scholar] [CrossRef]
- Kamiński, J. The Impact of Liberalisation of the Electricity Market on the Hard Coal Mining Sector in Poland. Energy Policy 2009, 37, 925–939. [Google Scholar] [CrossRef]
- Kamiński, J. The Development of Market Power in the Polish Power Generation Sector: A 10-Year Perspective. Energy Policy 2012, 42, 136–147. [Google Scholar] [CrossRef]
- Ciarreta, A.; Nasirov, S.; Silva, C. The Development of Market Power in the Spanish Power Generation Sector: Perspectives after Market Liberalization. Energy Policy 2016, 96, 700–710. [Google Scholar] [CrossRef]
- Prabhakar Karthikeyan, S.; Jacob Raglend, I.; Kothari, D.P. A Review on Market Power in Deregulated Electricity Market. Int. J. Electr. Power Energy Syst. 2013, 48, 139–147. [Google Scholar] [CrossRef]
- Kvålseth, T.O. Relationship between Concentration Ratio and Herfindahl-Hirschman Index: A Re-Examination Based on Majorization Theory. Heliyon 2018, 4, e00846. [Google Scholar] [CrossRef]
- Hesamzadeh, M.R.; Biggar, D.R.; Hosseinzadeh, N. The TC-PSI Indicator for Forecasting the Potential for Market Power in Wholesale Electricity Markets. Energy Policy 2011, 39, 5988–5998. [Google Scholar] [CrossRef]
- Shafie-khah, M.; Parsa Moghaddam, M.; Sheikh-El-Eslami, M.K. Development of a Virtual Power Market Model to Investigate Strategic and Collusive Behavior of Market Players. Energy Policy 2013, 61, 717–728. [Google Scholar] [CrossRef]
- Samadi, M.; Hajiabadi, M.E. Assessment of the Collusion Possibility and Profitability in the Electricity Market: A New Analytical Approach. Int. J. Electr. Power Energy Syst. 2019, 112, 381–392. [Google Scholar] [CrossRef]
- Beni, S.A.; Sheikh-El-Eslami, M.K. Market Power Assessment in Electricity Markets Based on Social Network Analysis. Comput. Electr. Eng. 2021, 94, 107302. [Google Scholar] [CrossRef]
- De Almeida, L.; Esposito, F.; van Zeben, J. When Indicators Fail Electricity Policies: Pitfalls of the EU’s Retail Energy Market Barrier Index. Energy Policy 2022, 165, 112892. [Google Scholar] [CrossRef]
- Loi, T.S.A.; Jindal, G. Electricity Market Deregulation in Singapore–Initial Assessment of Wholesale Prices. Energy Policy 2019, 127, 1–10. [Google Scholar] [CrossRef]
- Sensoy, N. Market Power Analysis for the Turkish Electricity Market. In Proceedings of the International Conference on the European Energy Market, EEM, Ljubljana, Slovenia, 18–20 September 2019. [Google Scholar]
- Marshall, L.; Bruce, A.; MacGill, I. Assessing Wholesale Competition in the Australian National Electricity Market. Energy Policy 2021, 149, 112066. [Google Scholar] [CrossRef]
- Shukla, U.K.; Thampy, A. Analysis of Competition and Market Power in the Wholesale Electricity Market in India. Energy Policy 2011, 39, 2699–2710. [Google Scholar] [CrossRef]
- Salarkheili, S.; Foroud, A.A. Market Power Assessment in Electricity Markets: Supply Function Equilibrium-Based Model. Int. Trans. Electr. Energy Syst. 2013, 23, 553–569. [Google Scholar] [CrossRef]
- Bataille, M.; Bodnar, O.; Steinmetz, A.; Thorwarth, S. Screening Instruments for Monitoring Market Power — The Return on Withholding Capacity Index (RWC). Energy Econ. 2019, 81, 227–237. [Google Scholar] [CrossRef]
- Bataille, M.; Steinmetz, A.; Thorwarth, S. Screening Instruments for Monitoring Market Power in Wholesale Electricity Markets–Lessons from Applications in Germany. SSRN Electron. J. 2014. [Google Scholar] [CrossRef]
- Szőke, T.; Hortay, O.; Balogh, E. Asymmetric Price Transmission in the Hungarian Retail Electricity Market. Energy Policy 2019, 133, 110879. [Google Scholar] [CrossRef]
- Busu, M. A Market Concentration Analysis of the Biomass Sector in Romania. Resources 2020, 9, 64. [Google Scholar] [CrossRef]
- Kruger, W.; Nygaard, I.; Kitzing, L. Counteracting Market Concentration in Renewable Energy Auctions: Lessons Learned from South Africa. Energy Policy 2021, 148, 111995. [Google Scholar] [CrossRef]
- Financial Aspects in Energy; Springer Science & Business Media: Berlin/Heidelberg, Germany, 2011. [CrossRef]
- Sutrisno, A.; Nomaler, Ö.; Alkemade, F. Has the Global Expansion of Energy Markets Truly Improved Energy Security? Energy Policy 2021, 148, 111931. [Google Scholar] [CrossRef]
- Asgari, M.H.; Monsef, H. Market Power Analysis for the Iranian Electricity Market. Energy Policy 2010, 38, 5582–5599. [Google Scholar] [CrossRef]
- Brown, D.P.; Zarnikau, J.; Woo, C.-K.; Woo, H.-C. Does Locational Marginal Pricing Impact Generation Investment Location Decisions? An Analysis of Texas’s Wholesale Electricity Market. J. Regul. Econ. 2020, 58, 99–140. [Google Scholar] [CrossRef]
- Keller, J.T.; Kuper, G.H.; Mulder, M. Challenging Natural Monopolies: Assessing Market Power of Gas Transmission System Operators for Cross-Border Capacity. Energy Policy 2022, 170, 113228. [Google Scholar] [CrossRef]
- Energy Statistics Energy Market Agency. Available online: https://www.are.waw.pl/wydawnictwa#statystyka-elektroenergetyki-polskiej (accessed on 6 February 2023).
- Dechezleprêtre, A.; Nachtigall, D.; Venmans, F. The Joint Impact of the European Union Emissions Trading System on Carbon Emissions and Economic Performance. J. Environ. Econ. Manag. 2023, 118, 102758. [Google Scholar] [CrossRef]
- Economidou, M.; Ringel, M.; Valentova, M.; Castellazzi, L.; Zancanella, P.; Zangheri, P.; Serrenho, T.; Paci, D.; Bertoldi, P. Strategic Energy and Climate Policy Planning: Lessons Learned from European Energy Efficiency Policies. Energy Policy 2022, 171, 113225. [Google Scholar] [CrossRef]
- Rogus, R.; Castro, R.; Sołtysik, M. Comparative Analysis of Wind Energy Generation Forecasts in Poland and Portugal and Their Influence on the Electricity Exchange Prices. Inventions 2020, 5, 35. [Google Scholar] [CrossRef]
- Ministry of Energy. The Act on Wind Farm Investments (Dz.U. 2016 Poz. 961); Ministry of Energy: Warsaw, Poland, 2016. [Google Scholar]
- Sliz-Szkliniarz, B.; Eberbach, J.; Hoffmann, B.; Fortin, M. Assessing the Cost of Onshore Wind Development Scenarios: Modelling of Spatial and Temporal Distribution of Wind Power for the Case of Poland. Renew. Sustain. Energy Rev. 2019, 109, 514–531. [Google Scholar] [CrossRef]
- Kulpa, J.; Olczak, P.; Surma, T.; Matuszewska, D. Comparison of Support Programs for the Development of Photovoltaics in Poland: My Electricity Program and the RES Auction System. Energies 2021, 15, 121. [Google Scholar] [CrossRef]
- Kaczmarzewski, S.; Matuszewska, D.; Sołtysik, M. Analysis of Selected Service Industries in Terms of the Use of Photovoltaics before and during the COVID-19 Pandemic. Energies 2021, 15, 188. [Google Scholar] [CrossRef]
- Office of Competition and Consumer Protection Decision No. DKK-156/2017. Available online: https://decyzje.uokik.gov.pl/bp/dec_prez.nsf/1/99CFF28A924BF296C12581E10052CFCA?editDocument&act=Decyzja (accessed on 15 March 2023).
- Energy Market Agency. Technical and Economic Situation of the Power Sector; ARE: Warsaw, Poland, 2022. [Google Scholar]
- Komorowska, A. Can Decarbonisation and Capacity Market Go Together? The Case Study of Poland. Energies 2021, 14, 5151. [Google Scholar] [CrossRef]
- Shefferin, A. Predicting Market Power Using the Residual Supply Index. Department of Market Analysis. California Independent System Operator (CISO). 2002. Available online: https://www.caiso.com/Documents/PredictingMarketPowerUsingResidualSupplyIndex_AnjaliSheffrin_FERCMarketMonitoringWorkshop_December3-4_2002.pdf (accessed on 15 February 2023).
- Energy Regulatory Office Potential Manipulation in Energy Market. Available online: https://www.ure.gov.pl/pl/urzad/informacje-ogolne/aktualnosci/8257,Prezes-URE-zlozyl-kolejne-zawiadomienie-do-Prokuratury-o-podejrzeniu-popelnienia.html#_ftn1 (accessed on 12 February 2023).


| Company Name | Ownership Structure (%) | Power Plants (PPs) and Heat and Power Plants (CHPs) Controlled by the Company | Electricity Generation | Capacity | ||
|---|---|---|---|---|---|---|
| TWh | Market Share (%) | MW | Market Share (%) | |||
| PGE Capital Group (PGE Polska Grupa Energetyczna) | 57.4%—State treasury 18.3%—Open Pension Funds (OPFs) 24.3%—Other stakeholders | Bełchatów (PP) | 73.47 | 52.19% | 15 619.1 | 47.43% |
| Opole (PP) | ||||||
| Turów (PP) | ||||||
| Rybnik (PP) | ||||||
| Dolna Odra (PP) | ||||||
| Kraków-Łęg (CHP) | ||||||
| Zielona Góra (CHP) | ||||||
| Gorzów (CHP) | ||||||
| Wrocław (CHP) | ||||||
| Gdańsk (CHP) | ||||||
| Lublin-Wrotków (CHP) | ||||||
| Rzeszów (CHP) | ||||||
| Pomorzany (CHP) | ||||||
| Bydgoszcz (CHP) | ||||||
| Gdynia (CHP) | ||||||
| Toruń (CHP) | ||||||
| Other CHPs <100 Mwe | ||||||
| ENEA Group | 51.5%—State treasury 48.5%—Other stakeholders | Kozienice (PP) | 28.51 | 20.25% | 6089.3 | 18.49% |
| Połaniec (PP) | ||||||
| Białystok (CHP) | ||||||
| Other CHPs | ||||||
| TAURON Polish Energy (TAURON Polska Energia) | 30.06%—State treasury 10.39%—KGHM Polska Miedź S.A. (controlled by state treasury) 5.06%—Nationale-Nederlanden OPF 54.49%—Other stakeholders | Jaworzno (PP) | 16.76 | 11.90% | 4997.2 | 15.18% |
| Łaziska (PP) | ||||||
| Stalowa Wola (CHP) | ||||||
| Łagisza (PP) | ||||||
| Siersza (PP) | ||||||
| Katowice (CHP) | ||||||
| Tychy (CHP) | ||||||
| Bielsko-Biała (CHP) | ||||||
| Other PPs/CHPs | ||||||
| ZE PAK Group | 65.96%—Private investor 9.12%—PZU OPF (controlled by state treasury) 8.86%—Nationale-Nederlanden OPF 16.06%—Other stakeholders | Pątnów (PP) | 4.91 | 3.49% | 1296.0 | 3.94% |
| Konin (PP) | ||||||
| PGNiG (Polskie Górnictwo Naftowe i Gazownictwo) | 71.88%—State treasury 28.12%—Other stakeholders | Siekierki (CHP) | 4.15 | 2.95% | 1511.1 | 4.59% |
| Żerań (CHP) | ||||||
| Pruszków (CHP) | ||||||
| and other CHPs | ||||||
| PKN ORLEN | 27.52%—State treasury 7.54%—Aviva Santander OPF 6.43%—Nationale-Nederlanden OPF 58.51%—Other stakeholders | Ostrołęka B (PP) | 2.71 | 1.93% | 725.0 | 2.20% |
| Elbląg (CHP) | ||||||
| Kalisz (CHP) | ||||||
| VEOLIA Energy Poland (VEOLIA Energia Polska) | 60.0%—Veolia Energie International 40.0%—Global InfraCo S.à r.l. | Poznań-Karolin (CHP) | 2.71 | 1.92% | 683.4 | 2.08% |
| Łódź 4 (CHP) | ||||||
| Łódź 3 (CHP) | ||||||
| & other CHPs | ||||||
| CEZ Poland (CEZ Polska) | 100% Controlled by ČEZ. A.s. | Chorzów 2 (CHP) | 2.14 | 1.52% | 556.0 | 1.69% |
| Skawina (PP) | ||||||
| Other companies | - | - | 5.42 | 3.85% | 1 452.2 | 4.41% |
| Total public thermal plants (PPs and CHPs) | - | - | 140.77 | 100.00% | 32,929.3 | 100.00% |
Disclaimer/Publisher’s Note: The statements, opinions and data contained in all publications are solely those of the individual author(s) and contributor(s) and not of MDPI and/or the editor(s). MDPI and/or the editor(s) disclaim responsibility for any injury to people or property resulting from any ideas, methods, instructions or products referred to in the content. |
© 2023 by the authors. Licensee MDPI, Basel, Switzerland. This article is an open access article distributed under the terms and conditions of the Creative Commons Attribution (CC BY) license (https://creativecommons.org/licenses/by/4.0/).
Share and Cite
Kaszyński, P.; Komorowska, A.; Kamiński, J. Revisiting Market Power in the Polish Power System. Energies 2023, 16, 4856. https://doi.org/10.3390/en16134856
Kaszyński P, Komorowska A, Kamiński J. Revisiting Market Power in the Polish Power System. Energies. 2023; 16(13):4856. https://doi.org/10.3390/en16134856
Chicago/Turabian StyleKaszyński, Przemysław, Aleksandra Komorowska, and Jacek Kamiński. 2023. "Revisiting Market Power in the Polish Power System" Energies 16, no. 13: 4856. https://doi.org/10.3390/en16134856
APA StyleKaszyński, P., Komorowska, A., & Kamiński, J. (2023). Revisiting Market Power in the Polish Power System. Energies, 16(13), 4856. https://doi.org/10.3390/en16134856