Abstract
Photovoltaics and batteries can be connected to a traction power supply system through a railway power conditioner (RPC) to switch between different control strategies. This can address power quality issues or provide emergency traction for locomotives that unexpectedly lose power and even break through traditional energy barriers in the railway field, achieving a low-carbon power supply for railway energy, and a mutual backup with substations. However, methods to coordinate the control strategies of PV and the battery locomotive traction have not been clearly revealed, nor has the actual stability of the system. In this study, to address the above issues, an emergency power supply scheme is proposed for the first time that utilizes a dual-mode RPC inverter combined with a coordinated control strategy for the PV and battery, achieving the traction of locomotives. In addition, a one-dimensional impedance model was established for the PV system, battery system, locomotive (CRH3), and RPC projected onto the dq coordinate system, and the critical amplitude margin (CAM) was defined to quantitatively analyze the sensitivity and laws of different parameters concerning the low-frequency stability of the system. At the same time, impedance ratios and passive criteria were used to reveal the stability mechanism, and parameter adjustment criteria and design suggestions were put forward. Finally, the feasibility of the emergency power supply scheme of the “PV–battery locomotive network” coupling system and the correctness of the low-frequency stability study were verified using the Starsim semi-physical experiment platform.
1. Introduction
The “2022 Climate Services Status” report released by the World Meteorological Organization (WMO), a specialized agency of the United Nations, states that the clean energy power supply must be doubled by 2030 to limit the global temperature rise. Railway transportation is a significant contributor to energy consumption and carbon emissions in the transportation sector due to its massive electricity usage. With the depletion of fossil fuels and the consequences of global warming, there is mounting pressure on the railway industry to take action and reduce its carbon emissions. To achieve the green transformation of railways, progress has been made internationally in the adoption of new energy sources for railways: JR-East has installed 453 kW solar panels at Tokyo Station, serving locomotives on the Tokaido line 3 [1]; the subway operator in Santiago, Chile, built two solar photovoltaic power stations in 2017, supplying 60% of the subway’s electricity and achieving a renewable energy utilization rate of 76% [2]; 100% of the primary energy used by the Dutch railway is provided by wind [3]; a 2.2 MW rooftop photovoltaic system has been built at Wuhan Railway Station in China; a 10 MW solar power generation device has been installed on the roof of Hangzhou East Station [4]; the total installed capacity of the photovoltaic system of the Xiong’an high-speed railway in China is 6 MW [5]. The photovoltaic (PV) resources along China’s AC-electrified railways are abundant, and their high proportion of utilization can promote China’s achievement of the “dual carbon” goal and increase the national independent contribution under the global energy conservation and emission reduction goal [6].
Currently, access methods of PV and battery devices are roughly divided into two categories: one is to access the battery device from the side of the locomotive to recover braking energy and control the voltage fluctuation of the traction network [7], and the other is to access the traction network side. For example, China’s electrified railway mainly considers access to PV and battery devices from the high-voltage side (110 kV) and the traction side (27.5 kV). There are two types of PV and battery inverters: one is a three-phase inverter combined with a three-phase/two-phase transformer, and the other is a back-to-back single-phase inverter [8]. The high-voltage side access method is suitable for small-capacity PV and battery devices, and the large capacity required for three-phase inverters leads to higher costs. At present, the railway power conditioners (RPCs) that utilize single-phase inverters to connect multiple source devices from the traction side have received frequent attention due to their excellent comprehensive performance [9]. The authors of [10,11,12,13,14] studied the unbalanced power compensation and harmonic control of the traction power supply systems with different RPC topologies. In [15], the train braking energy was recycled and reused through a RPC in conjunction with battery devices. In [16], a coordinated control scheme based on a RPC for PV and battery access to a traction power supply system was proposed, utilizing new energy to provide additional active power. Most of the above studies considered using PV or battery compensation power to reduce the consumption of fossil fuels but electricity is still mainly provided by thermal power generation. In [17], an overview of an emergency traction scheme for locomotive and substation coordination based on battery devices was presented and this paper aims to solve the problem of sudden accidents such as substation failures leading to locomotive power loss. In this state, the locomotive is completely powered by the battery. However, the research on the combined application of PV and battery for emergency traction in locomotives is not yet widely explored, and more research is needed to explore its potential and feasibility, if the PV power is connected to the battery for charging and collaborates with the battery to traction the locomotive, almost all of the electrical energy comes from renewable energy. However, to design the emergency power supply scheme for PV and battery systems and identify whether the collaborative integration of PV and battery systems can further change the railway energy supply system to achieve the long-term stable full-power traction of locomotives, the above-mentioned problems are worth deep research and solving. Due to the wide coverage of Chinese railways and superior energy storage conditions, as well as the long routes and abundant solar resources along such lines, solar power for AC-electrified railways has broad application prospects and extensive benefits. Therefore, this article takes the AC power supply system of Chinese railways with a rated voltage of 27.5 kV as an example and proposes the use of RPC access to PV and battery devices to achieve the emergency or long-term traction of locomotives, thus, expanding the function of RPCs and promoting the consumption of PV resources. In addition, due to differences in operational modes and design parameters between DC railways and AC railways, this article does not explore issues related to DC railways.
However, it is also important to determine whether the system remains stable when using the PV and battery locomotive traction and to reveal the main factors and laws that affect the stable operation of the system; all of these issues need to be addressed prior to the implementation of PV and battery traction locomotives in practice. At present, there are multiple frequency-scale instability issues in the traction power supply system of railways, such as low-frequency oscillation (LFO), harmonic resonance, and harmonic instability. Among them, LFO has been commonly reported in the electric railway domain around the world, thus, attracting widespread research attention [18,19]. The first reported occurrence of the LFO phenomenon dates back to 1996 in Norway when a rotating converter was adopted in a traction substation [20]. Since then, in Germany, Sweden, and Norway, rotating converters have been used to interface the traction network, transforming three-phase utility power into a single phase for the catenary network [21]. The main cause of LFO has been attributed to the electromechanical characteristics of rotating converters [22]. However, for other electric railway systems [23,24], the mechanism of LFO remains unclear. Recently, from 2008 to 2016, there has been an increasing frequency of LFOs observed in Chinese railways [25,26]. Many studies have revealed that the occurrence of LFO in China is caused by the introduction of more converters and impedance mismatch [27,28,29]. Concurrently, locomotives have a LC resonant onboard filter that may oscillate, in addition, such a filter combined with the line can be triggered in oscillation by electric arcs, which is quite a commonplace phenomenon caused by the sliding contact mechanism [30]. In PV and battery locomotive traction, more converters may be introduced, which may further induce LFO. Research on the low-frequency stability of multi-source connected traction power supply systems is not yet complete. In [31], the integration of PV power into the traction network through a RPC was considered and an impedance model of a “PV-locomotive-traction network” was established. It was found that unreasonable parameter settings during the integration of the PV systems did indeed induce LFO; at the same time, the parallel connection of the PV modules led to multiple increases in the converters, which can also lead to LFO in the system. However, the instability mechanism of the system and methods to improve the system stability were not specifically revealed. The variation in the source impedance caused by the parallel connection of the subsystem modules and the parameter adjustment of the converter controller may lead to artificial active enhancement or the weakening of the low-frequency stability of the system. Therefore, to further improve the system stability, it is necessary to specifically reveal the sensitivity and law of the influence of controller parameters on the system’s stability.
Regarding the above issues, this article proposes an emergency power supply scheme based on RPC access to PV and battery devices in Section 2.1. Through coordinated control strategies, PV and batteries can be used independently for the day and night emergency traction of locomotives. They may achieve “low-carbon” locomotive operation and also serve as a backup power source for the long-term traction of locomotives. On this basis, an impedance model of the “PV–battery locomotive network” coupling system under this scheme is established on the RPC DC bus side in Section 2.2. Then, the critical amplitude margin is defined for the first time based on the impedance ratio criterion; the influence of parameters on the low-frequency stability of the system is quantitatively evaluated and passive evidence is introduced to reveal the mechanism of the influence of the parallel number of PV and battery modules on the stability. Furthermore, parameter adjustment criteria and main circuit impedance reshaping governance are proposed to prevent LFO in Section 2.3. Finally, the feasibility of the emergency power supply scheme and the correctness of the stability study are verified through testing on the Starsim platform in Section 3.
2. Materials and Methods
2.1. Proposal of Emergency Power Supply Scheme
2.1.1. System Topology
The topology of the “PV–battery locomotive network” system is shown in Figure 1, which includes a traction network, a high-speed locomotive, a railway power conditioner, and a new energy power supply system composed of PV and a battery.
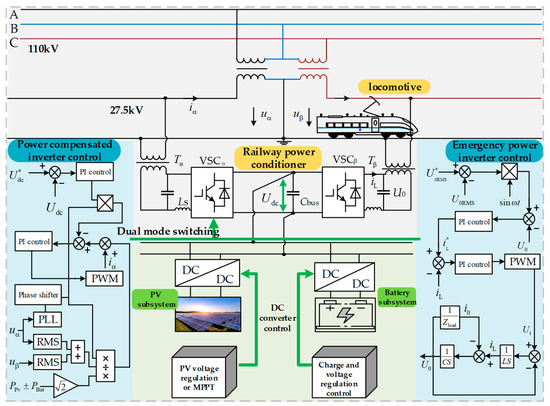
Figure 1.
System topology and control block diagram.
The three-phase electricity from the grid is converted from the traction substation to a 27.5 kV single-phase AC current, which is sent to the α and β power supply arms. The PV and battery are integrated into a 2 kV DC bus via their respective DC/DC converters, and the RPC-side single-phase inverter and LC-type filtering circuit are used to convert the power into 1.5 kV single-phase AC power through step-up transformers Tα and Tβ, which is then sent to the α and β power supply arms. The Udc is the DC voltage on the input side of the RPC; U0 is the single-phase AC voltage on the output side of the filtering circuit; Ui is the unfiltered voltage of the RPC; Cbus is the capacitor on the DC side of the RPC; VSCα and VSCβ are single-phase inverters in RPC; iα, uα, and uβ are the corresponding voltage and current of the supply arm; RMS means root-mean-square extraction; PPV and PBat, respectively, represent the output power of the PV and battery; PLL stands for phase-locked loop; U0RMS is the root-mean-square value of U0; iL is the output current of the RPC inverter; i0 is the output current after filtering; and sinωt is the reference sine wave and Zload is the equivalent load in Section 2.2.2. DC converters in PV systems mainly include voltage regulation control and maximum power point tracking control (MPPT), while in battery systems they mainly include charging and voltage regulation control. Under the emergency power supply scheme, the PV and battery systems provide the locomotive’s traction but it is still necessary to consider the overall plan for the connection of the PV and battery systems to the traction power supply system to formulate the control strategy.
The RPC converter is a dual-mode single-phase inverter. Its control strategy is shown in Figure 1. When it is applied to power compensation, the voltage U0 is controlled to track the phase frequency of the traction network voltages uα and uβ, and the output signal is compared with the harmonic and negative sequence reference signal, followed by the PWM input signal from the PI controller. At this time, the PV and battery are used as auxiliary power supplies, and the traction net is used as the main power source to control the single-phase inverter to support the voltage amplitude and frequency of both the DC and AC sides of the RPC. In the emergency power supply scheme, the PV and battery provide the DC-side voltage, the Udc amplitude, and the AC-side U0 frequency support through a DC converter, and the inverter independently outputs the sinusoidal AC power. At this time, the PV and battery serve as the main power supply. The DC converter coordinates with the RPC inverter according to the actual working conditions to achieve traction network voltage management and locomotive traction under different power supply schemes.
2.1.2. Division of Multiple Working Modes
The sum of the power inputs and outputs of the PV, battery, and RPC ports will affect the DC bus voltage Udc, as shown in Figure 1. It is necessary to balance the power of each port through the division of the working modes. The flowchart for the system’s power control is shown in Figure 2.
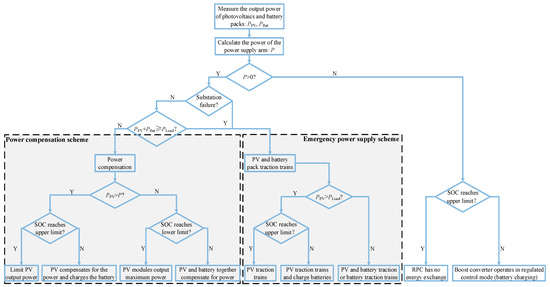
Figure 2.
Flowchart for the traction power supply system’s power control.
In the above figure, PPV is the output power of the PV system, PBat is the output power of the battery system, PLoad is the maximum operating power of locomotives, and P is the power of the power supply arm calculated by measuring the voltage and current of the power supply arm. Based on the positive, negative, and zero values of P, the locomotive’s operating conditions can be distinguished, which are namely, traction, braking, and no-load. In cases where P ≤ 0, if there is remaining capacity in the battery, it can be used to absorb the energy generated by the braking of the locomotive, as well as the energy provided by the PV system; In cases where P > 0 but the total power generated from the PV and battery systems is still lower than Pload, the RPC system will operate under the power compensation scheme. However, if the traction substation experiences a fault or the output power generated from the PV and battery systems goes beyond Pload, the RPC system will automatically switch to the emergency power supply scheme in order to utilize the PV and battery systems for the locomotive traction. Furthermore, the state-of-charge (SOC) threshold value is considered to prevent over-charging and over-discharging from affecting the battery life.
This article focuses on the study of using PV and battery systems for emergency locomotive traction. For different working conditions, such as different levels of irradiance and state-of-charge (SOC), the proposed emergency power supply scheme includes different working modes as follows:
Mode One: When the PV power generation is much greater than the sum of the maximum operating power of the load and the lithium battery charging power, i.e., PPV ≫ PLoad + PBat, and the SOC is less than 90%, the PV system can be used to provide the locomotive’s traction and simultaneously charge the battery. When PPV ≫ PLoad + PBat but the SOC is above 95%, in order to prevent the battery from over-charging, the PV system will be responsible for the locomotive’s traction while the battery will be on standby.
Mode Two: When the PV power generation is slightly greater than the maximum operating power of the load but there is no additional power to charge the battery, that is, PLoad < PPV ≤ PLoad + PBat, and the SOC is less than 90%, the PV system will only supply power to the locomotive, and the battery will be on standby.
Mode Three: When the PV power generation is less than the maximum operating power of the load, that is, PPV < PLoad < PPV + PBat, and the battery’s SOC is higher than 5%, the PV and battery will work in voltage control mode to jointly provide the locomotive’s traction.
Mode Four: When the PV power generation approaches zero, that is, PPV < PLoad < PPV + PBat, and the battery’s SOC is higher than 5%, the PV system will be on standby, and the battery will provide the locomotive’s traction.
The system topologies under the above four modes are different, meaning that it will be time-consuming and complex to analyze the system stability from the RPC AC side by using the impedance method. However, the operating conditions of the PV and battery combined locomotive traction under mode three are relatively common. Meanwhile, when carrying out RPC DC bus segmentation modeling, since the control method of each mode’s DC converter is similar to mode three, the parallel connection or split of the DC converter output impedance is equivalent to the switching of modes, and the impedance resolution of the other modes becomes a high-proportion intersection or a subset of mode three, which is convenient to quickly reveal the factors and regularity affecting the stability under multiple working modes. The next section builds a mathematical model for the “PV–battery locomotive network” coupling system using the specific control method of mode three.
2.2. Impedance Modeling of Proposed Emergency Power Supply Scheme
2.2.1. PV and Battery Power Generation Systems
Due to how the topology and control of PV and battery systems are similar, this section will describe and establish the impedance model of the power generation system simultaneously. As shown in Figure 3, in the Boost circuit, uPV is the output voltage of the PV side; iPV is the output current of the PV side; iLPV is the inductor current of the PV side; uBus and iBus are the DC bus voltage and current; LPV is the energy storage inductor of the PV side; CPV is the support capacitor of the PV side; CBus1 is the DC-side capacitor of the RPC; dPV is the duty cycle of the Boost converter’s switching tube, d*PV = 1 − dPV; and u*Bus and i*LPV are the reference signals for their corresponding variables. In the DC/DC circuit, uBat is the output voltage of the lithium battery side, iBat is the output current of the lithium battery, LBat is the energy storage inductor, CBus2 is the DC-side capacitor of the RPC, dBat is the duty cycle of the T1 switching tube, and the T2 switching tube is complementary to the T1 switching tube. In addition, u*Bus and i*Bat are the reference signals for their corresponding variables.
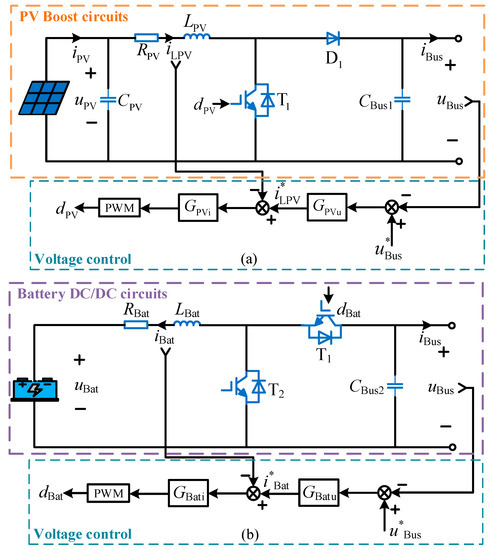
Figure 3.
Topology and control of DC converters under mode three. (a) PV boost converter; (b) battery DC/DC converter.
The state equations for the PV and battery systems are given by Equations (1) and (2), respectively.
With small signal linearizing Equations (1) and (2), we obtain Equations (3) and (4):
According to the superposition theorem, the transfer functions between each variable of the PV and battery systems can be obtained from Equations (3) and (4), and the specific expressions are shown in Appendix A, where Equation (A1) includes the transfer function expansion of the PV system, and Equation (A2) includes the transfer function expansion of the battery system. Then, based on the control strategies of the PV and battery systems, draw the closed-loop block diagrams of the small signal transfer functions as shown in Figure 4.

Figure 4.
Small-signal closed-loop control block diagram. (a) PV transfer function; (b) battery transfer function.
Using the Mason’s formula, the output impedances of the PV and battery systems are, respectively:
2.2.2. Locomotive Network and Railway Power Conditioner
In the study of the low-frequency stability of locomotive network coupling systems, two-level locomotives are often considered. The China railway high-speed 3 (CRH3) locomotive with four power units is the research object of this paper. In [32], the impedance expression of a single power unit is presented. After converting the impedance of the China Railway High-speed 3 (CRH3) locomotive to the RPC AC side, the expression is:
where the transformation ratio of the onboard transformer is ka and the transformation ratio of the RPC-side step-up transformer is kb.
At present, the equivalent circuit model is commonly used in low-frequency stability analysis of traction networks [31] and its expression corresponds to the RPC AC side:
The equivalent impedance of the locomotive network converted to the RPC AC side is recorded as Zload (s), where Zload (s) = Zs (s) + ZCRH3 (s).
RPC impedance modeling is conducted on the DC port of the inverter, that is, the input impedance of the RPC is studied. Considering that the back-to-back inverter in the RPC has a symmetrical structure and the impedance calculation and modeling method are similar, the β power supply arm is selected as the research object. For the emergency power supply scheme, the specific control method and topology of the inverter are shown in Figure 5.
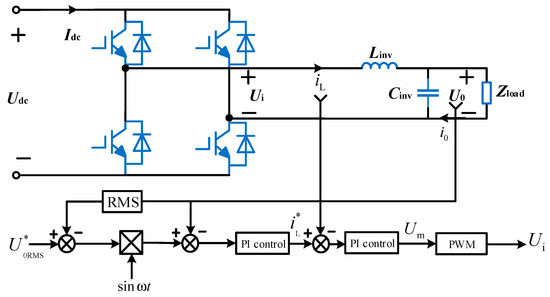
Figure 5.
RPC inverter main circuit topology and control.
In the above figure, Zload is the equivalent impedance of the locomotive network converted to the RPC AC side; Um is the amplitude of the modulated wave signal; and sinωt is the sine wave frequency reference signal. Linearization is performed on the DC side and the variables are decomposed into a closed-loop impedance model in the dq coordinate system. According to the main circuit, the state equation under dq decoupling can be derived by:
Based on the basic derivation process of SPWM, the relationship between the output voltage Ui before filtering and the modulation wave Um can be obtained using the switch average period method:
In Equation (10), Utri is the amplitude of the triangular carrier wave, and the remaining symbols are the system variables under dq decoupling. In the dual-loop control strategy, the response speed of the inner loop is much faster than that of the outer loop. This article assumes that the response of the current inner loop is approximately the same within the average time of a single switching cycle. Due to the PI controller used in the voltage outer loop, the input–output relationship of the controller is:
where U*vd and U*vq are the product of the effective value of the voltage outer-loop output and the reference sine signal; kinvp and kinvi are proportional integral parameters of the voltage outer-loop PI controller.
According to the input power and output power of the RPC that are equal:
After processing the small signal in Equation (12), the following is obtained:
Equations (9) to (11) can be substituted into Equation (13) to obtain the input admittance on the DC side of the β arm inverter:
As output impedance is the reciprocal of admittance, it can be inferred that Zinv = 1/Yinv and the variables in Equation (14) are as follows:
2.2.3. Verification of Established Impedance Model
To verify the established one-dimensional impedance model, the disturbance injection method was used for the simulation measurements [33]. By injecting disturbance signals with specific frequencies during the steady-state state of the system and using the Fourier transform to process these signals, the impedances of the three ports of the “PV–battery locomotive network” can be simultaneously measured at specific frequencies, and it should be noted that the impedances of the three ports of the “PV-battery locomotive network” refer to the output impedances ZPV towards the PV boost circuit port, ZBat towards the battery DC/DC circuit port, and Zinv towards the inverter DC port. We will validate whether the theoretical deduced values of these impedances in the frequency domain match the simulation results.
Validation results are shown in Figure 6, the first row shows the corresponding impedance function’s Bode plot, and the second row is the corresponding phase plot, with the blue curves representing the theoretical values of the model and the red circles representing the actual measured values. It can be seen that the modeling of the PV and battery system’s output impedance and RPC’s input impedance is consistent with the simulation test results.
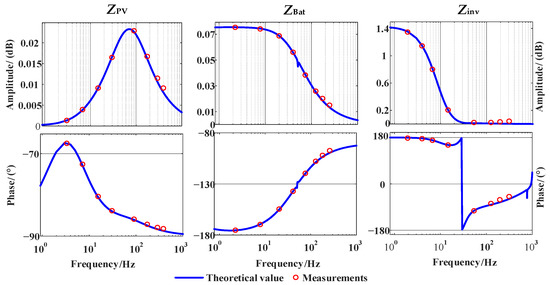
Figure 6.
Three-port impedance verification.
2.3. Low-Frequency Stability Analysis of Proposed Emergency Power Supply System
2.3.1. Stability Judgment Based on Generalized Nyquist Criterion
According to the mathematical model established earlier, the impedance equivalent circuit of the PV and battery locomotive traction is shown in Figure 7a, where Z0 is equal to the parallel value of ZPV and ZBat, and Zg is the impedance of the traditional locomotive network system source side. Due to the PI controller parameters of the converters in PV and battery systems that affect the output impedance of the system, Z0, ZPV, and ZBat are different from Zg because the value of Zg depends on factors such as the material of the transmission line, its length, and the capacity of transformers, which are difficult to adjust in practical operation. In comparison, the values of Z0, ZPV, and ZBat are related to the parameters of the PI controller, and adjusting the control parameters of the PI controller is less costly as well as more simple and fast. The introduction of a controllable equivalent impedance may exacerbate the LFO of the system or prevent system instability caused by impedance mismatch; this characteristic makes it particularly important to explore the impact of the control parameters and number of PV and battery parallel connections on the system’s low-frequency stability. This section uses stability judgment methods based on impedance ratio criteria to conduct the research [27,28].
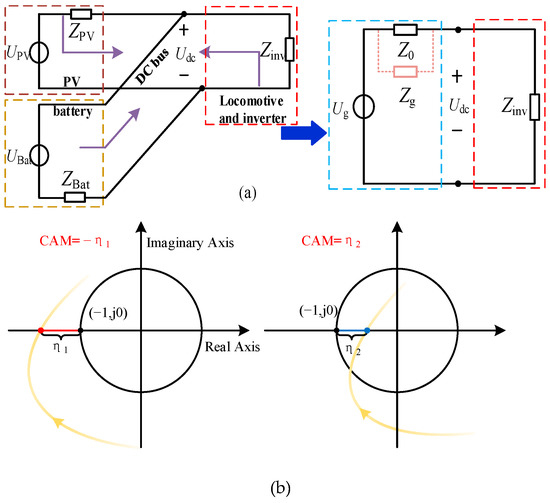
Figure 7.
(a) System impedance equivalent circuit; (b) CAM value scenario diagram.
Firstly, it must be ensured that there are no RHP poles for Z0, ZPV, ZBat, and Yinv and that each subsystem can operate independently and stably in the simulation. Under different traction modes, applying the one-dimensional impedance model established earlier, the Nyquisit curve based on the impedance ratio of Z0/Zinv, ZPV/Zinv, and ZBat/Zinv can be obtained. Taking Z0/Zinv as an example, the expression for the system’s impedance ratio can be represented by a transfer function of G(s) = Z0/Zinv. The stability of the system can be measured by plotting the Nyquist curve of G(s) and determining whether it encircles (−1, j0). Additionally, the variations in parameter values based on the impedance model discussed earlier can affect Z0, thus, modifying the Nyquist curve of G(s). Therefore, the parameters of each variable may have some effect on the stability of the system. Meanwhile, due to the lack of a clear concept of the stability margin in the impedance ratio criterion for MIMO equivalent systems, and to showcase the analysis process concisely and clearly, the critical amplitude margin (CAM) is defined to quantitatively analyze the system stability in order to reveal sensitive parameters and their influence laws. If CAM ≥ 0, the system is stable; if CAM < 0, the system is unstable. The Nyquist plot of the impedance ratio transfer function for this system may change due to the effect of different parameters, leading to two different scenarios, as shown in Figure 7b.
Scenario 1: When the curve surrounds (−1, j0), the distance from the intersection point of the real axis of the curve to (−1, j0) is expressed as η1, CAM = −η1;
Scenario 2: When the curve does not surround (−1, j0), the corresponding distance is expressed as η2, CAM = η2.
In summary, changes in system variables can affect the Nyquist curve of G(s), thus, impacting the stability of the system. Such an impact can be translated into changes in CAM values to quantify the effect of a particular variable on the stability of the system. To further reveal the main controller parameters that affect the system stability, this article defines the sensitivity of the parameters as:
where ky is a certain original parameter in Table 1, ks is the value of the critical instability parameter with the smallest change from ky, (ks − ky)/ky is the multiple of the minimum change in the original parameters when the system is in critical instability, and CAMn is the critical amplitude margin corresponding to the original parameter ky under different operating conditions. The introduction of CAMn is aimed at correcting the sensitivity under different traction conditions (PV traction, battery traction, PV, and battery co-traction). This expression can be simply understood as the sensitivity to the electrical instability of the nearest value of the original parameter.

Table 1.
Original simulation system parameters.
2.3.2. Influence of DC Converter and RPC Parameters on the Low-Frequency Stability of the Proposed System
Based on the method proposed in Section 2.3.1, Figure 8a shows the electrical sensitivity bar chart of the control parameters of the DC converter and RPC inverter under three different traction modes when the ratio between the PV module, battery module, and CRH3 locomotive is 1:1:1. Due to the sensitivity of the inner-loop control parameters of the system under this scheme being less than 1%, the Nyquist curve hardly changes with the changes in the parameters, and the corresponding test shows that the system remains stable even after a large number of changes in the inner-loop control parameters; therefore, it is not included in the research object. The bar chart shows that the proportional gain of the outer ring is more sensitive to the system stability and the combined traction of the PV and battery will reduce the parameter sensitivity.
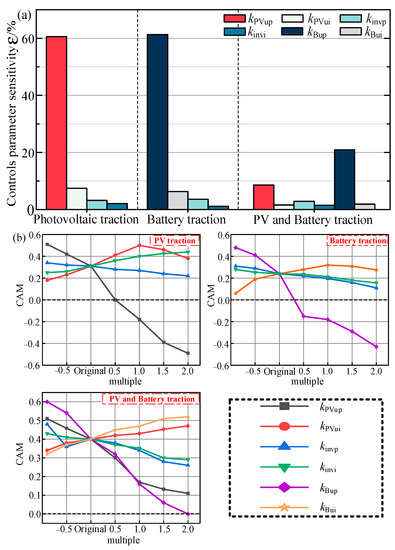
Figure 8.
(a) Parameter sensitivity of the RPC and DC converters; (b) CAM change law of the control parameters.
The corresponding parameter influence law is shown in Figure 8b. Within the range of −0.9 to 2 times the original parameter value, the proportional gain of the outer ring of each converter exhibits monotonic, identical laws under different operating conditions, and the sensitivity (i.e., slope) is relatively high. However, the sensitivity of the integral gain of the outer ring is low, and the impact of the integral gain on the stability of the system exhibits diversification and non-monotonic characteristics under different traction conditions. Therefore, the outer-loop proportional gain of the system can be more easily used to control or prevent system impedance mismatch instability. The specific parameter adjustment criterion and case verification are expounded in Section 2.3.3.
In addition, LFO in locomotive network systems always occurs when the Nyquist curve of the impedance ratio (Zg/ZCRH3) passes through (−1, j0). To investigate whether the occurrence of LFO under the topology and control scheme proposed in this paper is consistent with the theoretical analysis of locomotive network systems when the locomotive is separately tractioned by the PV or battery, the impedance ratio expression for the PV traction locomotive is ZPV/Zinv, and the expression for battery traction locomotive is ZBat/Zinv, where ZPV, ZBat, and Zinv come from Equations (5), (6), and (14), and these impedance ratio expressions are used to plot Nyquist curves under different traction conditions. Then adjust the high sensitivity parameters kPVup and kBup so that the Nyquist curve just surrounds (−1, j0), thereby obtaining the Nyquist curve shown in Figure 9 and the test waveform shown in Figure 10. The results show that when the Nyquist curve of the impedance ratio for the system described in this paper precisely intersects the (−1, j0) point, LFO at around 9.6 Hz also occurs. The principle and testing results are consistent under other parameters in Figure 8 but due to the large number of parameters, they are not listed in detail.
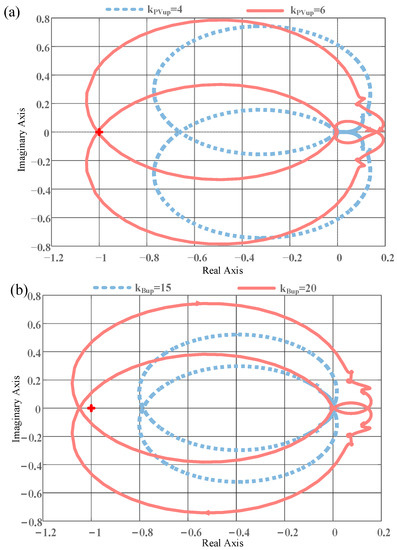
Figure 9.
Nyquist curve before and after changes in high-sensitivity parameters: (a) working conditions of PV locomotive traction; (b) working conditions of battery locomotive traction.
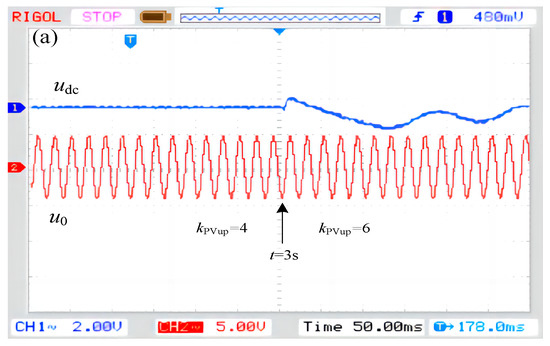
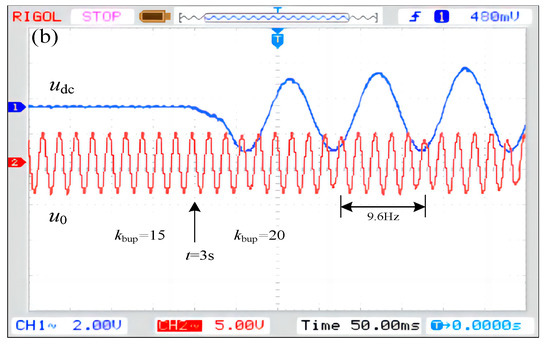
Figure 10.
(a) Experimental waveform of the critical instability of photovoltaic locomotive traction; (b) experimental waveform of the critical instability of battery pack locomotive traction.
2.3.3. Parameter Adjustment Criterion and Case
Usually, an increase in the transformer capacity and the addition of other types of equipment such as static synchronous reactive power compensators on the source side are considered in locomotive network systems to address LFO caused by impedance mismatch. Such problems also exist in systems under emergency power supply schemes. However, when using PV and battery locomotive traction, based on the stability law of the control parameters revealed in Section 2.3.2, the goal can be achieved by adjusting the converter parameters accordingly. The specific parameter adjustment criteria are as follows: Firstly, if the system experiences instability, consider lowering the PV boost converter kPVup, battery DC/DC converter kBup, and RPC single-phase inverter kinvp. Secondly, consider slightly lowering the kinvi during PV and battery co-traction or battery traction, and slightly increasing the kinvi during PV traction. It is worth noting that the RPC outer-loop proportional gain seriously affects the control accuracy (i.e., voltage amplitude); therefore, prioritize adjusting the proportional gain of the PV and battery DC converters unless faced with a situation that has special requirements. Taking the ratio of PV modules to battery modules as 1:1 as an example, the following explains the methods of parameter adjustment and governance in three cases. The Nyquist curve of Case 1 is shown in Figure 11a. When using the PV and battery locomotive co-traction, the battery system’s energy storage inductance deteriorates from 1 mH to 1.23 mH, and the curve surrounds (−1, j0); at this time, the adjustment kBup is reduced from 15 to 5, and the Nyquist criterion shows that the system will return to stability. The theoretical curve of Case 2 is shown in Figure 11b. When the kPVup of the PV locomotive traction deteriorates, it causes a critical oscillation in the system. The kBup is adjusted and connected to the battery system; at this time, the PV and battery combined locomotive traction are stable. The test validation waveforms of the parameter adjustment criteria and related conclusions described in this section will be presented in Section 3.2.1.
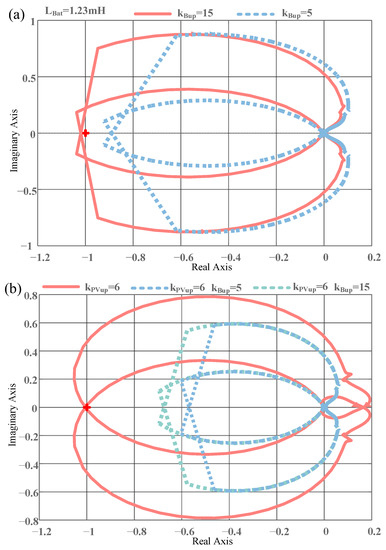
Figure 11.
(a) Nyquist curve for Case 1; (b) Nyquist curve for Case 2.
2.3.4. The Influence of Mixed Proportional Parallel Numbers of PV and Battery Modules on System Stability
The number of PV and battery hybrid proportional parallel connections will also change the source-side impedance model to weaken or improve the stability of the system. Therefore, the original parameters were substituted into the hybrid parallel connection system. Based on the generalized Nyquist criterion, the bar chart shown in Figure 12a was obtained. The results show that the system operated stably under different PV and battery module proportions. To reveal its stability mechanism, the number of PV and battery modules were introduced as system variables, and because all the modules are connected in parallel, thus, expanding the impedance ratio expression Z0/Zinv in Section 2.3.1, we achieve the following formula:
where npv represents the number of PV modules, and nbat represents the number of battery modules.
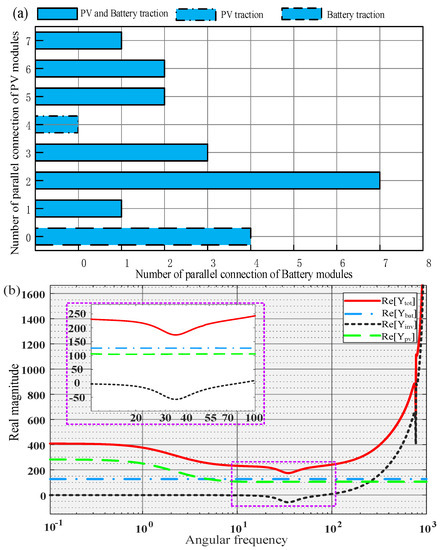
Figure 12.
(a) The proportion of stable system operation when the PV and battery modules were connected in parallel; (b) analysis results of the passive criterion when the ratio of modules was 1:1.
If npv = nbat = n, the expression is rewritten as Lhui = (Z0/Zinv)/n, which is equivalent to proportionally reducing the Nyquist function curve (Lhui) by n times. Systems that do not originally include (−1, j0) will be more stable. In the previous work, it was proven and verified that the system was stable when the PV traction module ratio was 1:0, the battery traction module ratio was 0:1, and the PV and battery co-traction module ratio was 1:1 under the original parameters; therefore, the stability of the system with the PV and battery module ratios of 4:0, 0:4, and 3:3 in Figure 12a is explained. However, it is complex and difficult to give an answer for the stability mechanism of non 1:1, 1:0 systems using the impedance ratio criterion, since it changes a variable to directly judge the stability of the overall system. Therefore, this paper introduces a passive criterion applicable to the stability analysis of variables, subsystems, and overall systems. The judgment criterion is as follows: if the sum of the real parts of the total admittance of all parallel systems in the bus is guaranteed to be constantly greater than 0, all subsystems can operate stably at the same time. This passive criterion was proposed and verified by Riccobono A. in 2012 [34] but compared to the impedance ratio criterion, it is less used. Based on the “PV–battery locomotive network” coupling system, this article additionally provides the proof process of the passive criterion from the perspective of dissipative system stability, as shown in Appendix B. The criterion combines Equations (5), (6), and (14) and Figure 7a, resulting in the following expression:
Applying Equation (18), the function curve is plotted under the original parameters when the locomotive traction has a PV and battery module ratio of 1:1, as shown in Figure 12b. At this time, the real parts of the admittance of the PV and battery modules are both greater than 0 in the entire frequency band. If the subsystem is paralleled in any proportion, it will increase the distance between Re[Ytot(s)] and the horizontal axis, and the system will obtain an additional stability margin to maintain stability. This reveals the reason why the system always maintains stability after the PV and battery module mixing ratio is paralleled. Based on the above analysis, the problem of LFO in PV and battery locomotive co-traction under specific working conditions can also be solved by using the law of the influence of the number of module parallel connections on stability to reshape the system impedance from the main circuit structure through the passive criterion. In Section 3.2.2 Case 1, we designed experiments and demonstrated the validity of the theoretical analysis.
Increasing the number of PV battery parallel connections in a targeted manner can address instability caused by multiple locomotives running together or unreasonable RPC parameter settings but it is difficult to use this method to solve instability caused by the deterioration of the system. The instability process of this phenomenon can be revealed using passive criteria, as shown in Figure 13, which shows the criterion curve after the 1:1 parameters of the PV and battery modules deteriorate. Increasing npv and nbat will cause Re[YPV(s)], Re[Ybat(s)], and Re[Ytot(s)] to extend towards negative infinity, thereby exacerbating the system instability, and this was validated in Section 3.2.2 Case 2.
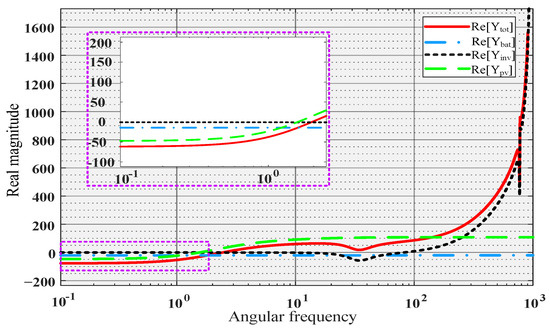
Figure 13.
Passive criterion analysis results after deterioration of the system parameters.
Based on the research in this section, it is recommended to ensure that the real part of the admittance of the PV and battery subsystem is always greater than 0 during the design.
2.3.5. Passive Criterion Is Used to Reveal the Influence Law of Parameters on Stability
As shown in Section 2.3.4, the passive criterion based on the DC bus has clear boundary conditions and judgment criteria, which makes it easier to explore the law of the influence of parameters on the stability of the system, in comparison with the Nyquist criterion. This is reflected in the bivariate function curve, which directly shows the influence of a parameter of the system on its stability. This means that the law of stability near the original parameter will no longer be experimentally searched as before, and the three-dimensional plotting of the function can immediately reveal the influence of arbitrary values of a parameter on the stability of the original system. In order to verify the above analysis, passive criteria are used to reveal the stability influence laws of kPVup and kBup, which have been verified before. By taking kPVup and kBup as variables, we can obtain functions similar to Equation (19) but because the expressions are verbose, they are presented in the form of graphs, as shown in Figure 14 and Figure 15, where the z axis is Re[Ytot(s)].
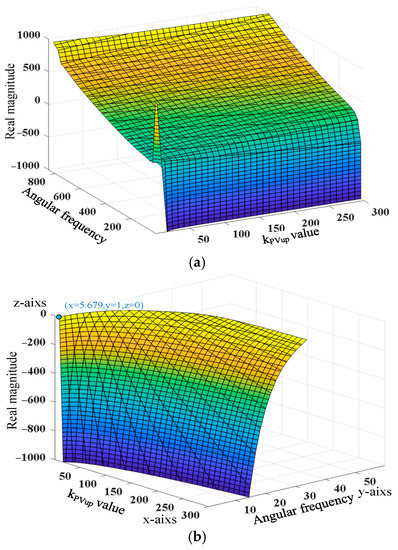
Figure 14.
The influence of kPVup on the system stability: (a) global diagram; (b) local diagram of the system instability.
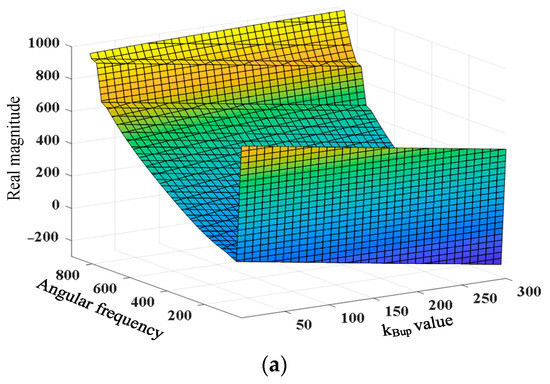
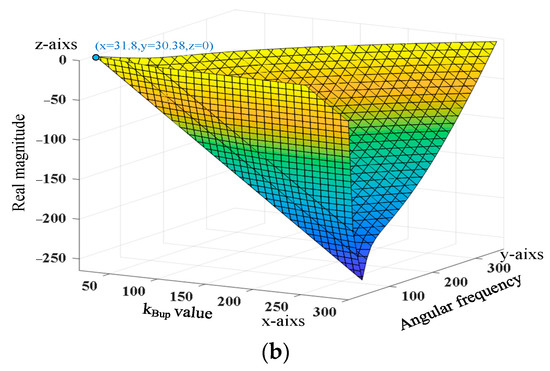
Figure 15.
The influence of kBup on the system stability: (a) global diagram; (b) local diagram of the system instability.
Figure 14a and Figure 15a show that with the increase in kPVup and kBup, the surface gradually extends to the negative plane; in other words, the system gradually becomes unstable, which is consistent with the results obtained using Nyquist’s criterion and in the semi-physical simulation, however, we are more concerned about the LFO phenomenon that often occurs in actual railway systems, that is, the critical instability of the system. Accordingly, the local amplification when the corresponding parameter is unstable is shown in Figure 14b and Figure 15b, and the values of the LFO parameters given by the criterion are kPVup = 5.679 or kBup = 31.8, which are obviously lower than the values given by the generalized Nyquist criterion, as shown in Figure 10b. The system ran stably in the simulation experiment under these parameters. It is also necessary to continue to increase the parameter values to cause LFO. This is caused by the large conservatism of the passive criterion. Assuming that the law revealed by the criterion is used to control the LFO, if the stability of a parameter affecting the law is not monotonic and there are lots of extreme points, this situation may lead to a counterproductive parameter adjustment. Here, the law revealed by the criterion is more suitable when parametric influences are monotonic over a large scale. However, in the system design, the conservativeness of the criterion is favorable, and it will leave a certain stability margin.
In addition, by applying passive criteria to the AC bus, the designed virtual impedance compensator successfully suppresses LFO [17] but the specific proof process in the AC system and its conservative improvement are the next research foci concerning this criterion.
3. Results and Discussion
3.1. Emergency Power Supply Scheme Testing
To verify the feasibility of the proposed emergency power supply scheme and the accuracy of the stability analysis, a simulation model of the PV and battery power generation systems, RPC, and CRH3 locomotive, as shown in Figure 1, was built based on Starsim. Figure 16 shows Shanghai Yuankuan Energy’s Starsim HIL real-time simulation software 5.0 and HIL real-time simulator (Modeling Tech, Shanghai, China). This system can perform small-step real-time testing on power electronic models based on state equations, switch averaging, and modeling of large and small resistors. In this paper, the model was verified using a real-time test system (MT 6020) with a 5 μs step size and 20 kHz sampling frequency.
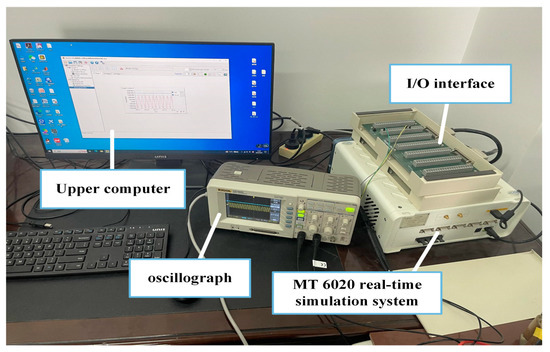
Figure 16.
Hardware-in-the-loop real-time testing platform.
Here are the model parameters in the above-mentioned testing system, as shown in Table 1. In this paper, the parameters in Table 1 are referred to as the original parameters. Unless otherwise specified, analysis or testing will default to using the original parameters.
3.1.1. Emergency Traction Test based on Locomotive Power Failure
The upper computer calculation display is shown in Figure 17a, where PRPC is the output power of the PV and battery, Pnet is the output power of the substation, and PCRH3 is the absorbed power of one locomotive. At 1 s, the traction network unexpectedly lost power to the locomotive; after a short response time, the RPC identified the operation status of the PV and battery devices and switched to the corresponding mode to achieve the emergency power supply for the locomotive. At 2 s, the power supply to the substation was restored; to ensure passenger safety, the RPC delayed the power outage. Finally, at 2.5 s, the RPC exited the power supply or returned to the power compensation scheme. During this power outage process, the locomotive remained running, as shown in Figure 17b. If emergency-response-type locomotive traction is started in actual engineering, it can provide on-site measured data support and technical guidance for future new energy self-sufficient traction. For example, the working conditions of delayed power outages are equivalent to the actual test of changing to the substation supply when the new energy self-sufficient traction encounters an accident.
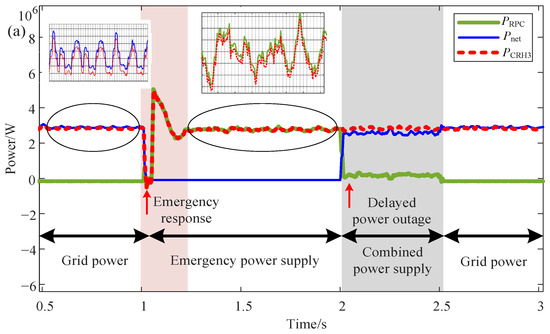
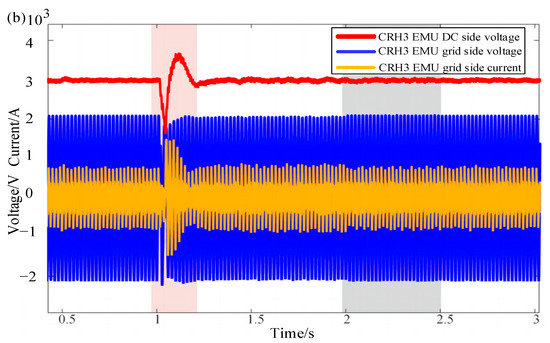
Figure 17.
Emergency response traction power supply: (a) system energy flow; (b) locomotive voltage and current.
3.1.2. Coordinated Traction Test
The test setup of the operating power Pload of the high-speed locomotive is set to 3.6 MW, and the light intensity will continue to rise, as shown in Figure 18 obtained from the upper computer. Among the modes, mode four to mode one correspond to battery traction, PV and battery co-traction, PV traction, and PV locomotive traction and battery charging. By switching operation modes under different working conditions, the locomotive traction power can be stabilized while charging the battery. Under this scheme, the renewable energy continuous closed-loop power supply allows the locomotive to remain “low-carbon” for a long time, and a substation can be used for backup power in case of accidents.
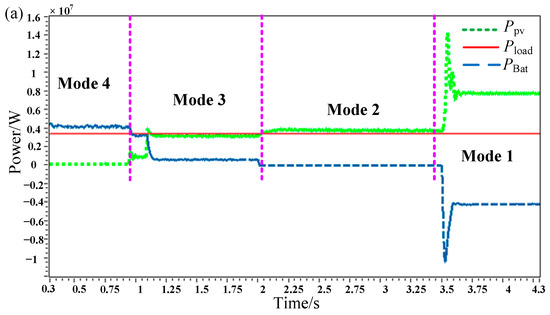
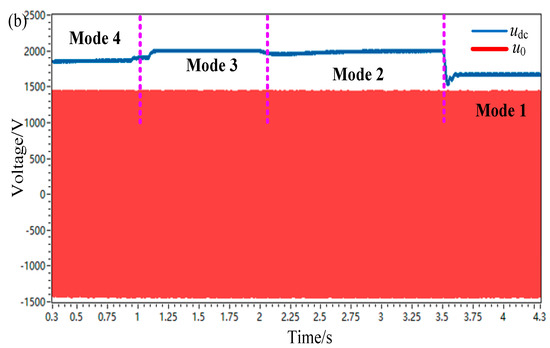
Figure 18.
Energy self-sufficient traction power supply: (a) multi-mode power flow conditions; (b) voltage waveform on both sides of the RPC.
3.2. Verification of Low-Frequency Stability Analysis
The main purpose of this section is to verify the results of the low-frequency stability analysis in Section 2.3 to ensure the correctness of the analysis. The following subsections will present corresponding test results in the order of the analysis in Section 2.3.
3.2.1. Verification of Parameter Adjustment Criterion
- Case 1: Adjusting control parameters to address instability caused by deteriorating circuit parameters. Under the original parameters, the PV and battery stably provided co-traction for the locomotive, which is verified in Figure 18. However, at this time, the parameters of the energy storage inductor Lbat deteriorated. The waveform of the traction-network-side voltage Uac and current Iac is shown in Figure 19b. The system experienced a low-frequency constant-amplitude oscillation of 5.7 Hz after 2 s, and after kBup decreased after 2 s, the system was stabilized and restored. This case demonstrates that numerically adjustable control parameters can govern LFO caused by the deterioration of topology circuit parameters.
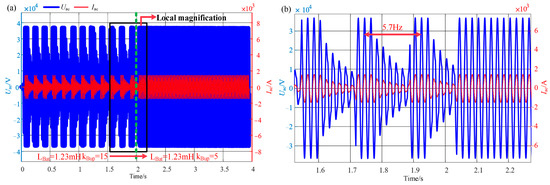 Figure 19. Waveform for parameter adjustment after the deterioration of the main circuit parameters: (a) global diagram; (b) local diagram.
 - Case 2: Connecting a parameter-adjusted other-source subsystem to address single-source traction instability. Due to the unreasonable setting of kPVup during the PV locomotive traction, the system became unstable. Finally, a parameter-adjusted battery system was connected to control the constant-amplitude oscillation. The experimental waveform is shown in Figure 20, where udc and u0 are the output voltages of the RPC DC and AC sides, respectively. By comparing and observing the oscilloscope, it was found that a lower value of kBup made the bus voltage fluctuation smaller and smoother when the battery system was connected. The reason for the successful governance of the parameter adjustment, in this case, is reflected in the addition of the circuit topology of the battery subsystem and the parameter setting under the parameter adjustment criteria, which improved the impedance matching relationship. At the same time, the relatively lower electrical sensitivity under the combined traction of the PV and battery provided the control parameters with a wider range of choices in the stable domain.
 Figure 20. When the PV locomotive traction is unstable, it can be corrected by connecting a parameter-adjusted battery subsystem: (a) experimental waveform after the battery was connected when kBup = 5; (b) experimental waveform after the battery was connected when kBup = 15.
 - Case 3: Adjusting the control parameters to govern LFO caused by multi-locomotive operation (heavy load). The impedance ratio criterion mechanism shows that the smaller the load-side impedance, the more unstable the system will be. Therefore, many studies on locomotive network systems have found that multi-locomotive operation or mixed operation is an important factor inducing LFO. The problem of heavy loads reducing the stability of traction power supply systems also exists in the study of PV and battery locomotive traction but the parameter-adjustable “artificially controllable traction network impedance” has a certain adaptability. The CRH3 high-speed locomotive was used as the research object, and the simulation waveform is shown in Figure 21, which includes the locomotive DC-side voltage UCRH3dc, locomotive-network-side voltage UCRH3ac, and locomotive-network-side current ICRH3ac. After 2.5 s, the addition of three high-speed locomotives caused a 4Hz low-frequency constant-amplitude oscillation among the high-speed locomotives. According to the parameter adjustment criteria, kPVup and kBup were decreased after 2.5 s, and then the locomotives were stabilized.
 Figure 21. Adjustment of the parameters to control system instability caused by multi-locomotive parallel connection: (a) global diagram; (b) local diagram.
3.2.2. The Impact of Parallel Connections of PV and Battery Modules
- Case 1: Worsening RPC parameters and overloading lead to LFO and then an increase in the number of parallel connections of the PV and battery modules. According to the passive criterion, overloading and deteriorating RPC parameters will cause Re[Yinv(s)] to extend towards the negative plane until the system experiences critical instability. According to the impedance ratio criterion, overloading is equivalent to proportionally amplifying the Nyquist curve until it envelops (−1, j0). Under this operating condition, it will cause low-frequency divergent oscillations, as shown in Figure 22a, where Udc and U0 are the voltages on both the RPC DC and AC sides, respectively. Increasing the number of parallel PV battery modules and reshaping the impedance to provide an additional stability margin can compensate for this, as shown in Figure 22b. In this case, the system can regain stability after 1.6 s.
 Figure 22. (a) Overloading and worsening RPC parameters lead to system instability: (b) the ratio of PV and battery module parallel connections can multiply and increase to reshape the system impedance.
 - Case 2: Increasing the number of parallel modules after the module parameters deteriorate. As shown in Figure 23, multiple increases in the number of module parallel connections after the PV and energy storage inductance parameters and control parameters deteriorate will actually exacerbate the system instability.
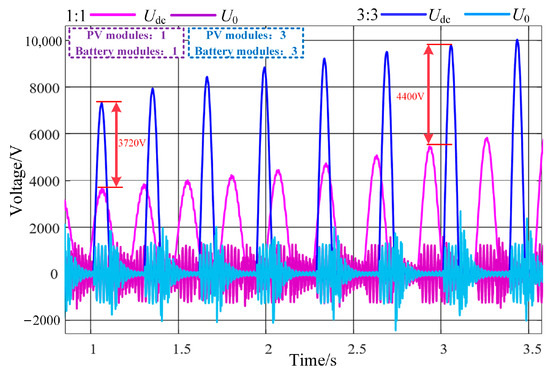 Figure 23. Deterioration of the system parameters leads to instability and multiple increases in the ratio of modules will aggravate the voltage oscillation.
4. Discussion
This paper mainly proposes an emergency power supply scheme to solve the problem of interruption in train power supply caused by unexpected faults in traction substations. The solution coordinates with the PV and battery systems to achieve emergency traction of locomotives, thereby expanding the functions of the railway power conditioner (RPC). Meanwhile, this paper proves through theoretical modeling and verification tests that the PV and battery traction locomotive additionally have the problem of low-frequency oscillation. To curb low-frequency oscillation occurring during the emergency power supply, this paper quantitatively analyzes the influence law of PI control parameters and topological structures on the low-frequency stability of the system, proposes a design method for the impedance real part greater than 0 of the PV and battery systems module, and provides parameter adjustment criteria to suppress or even prevent low-frequency oscillations.
Most studies on the integration of PV and battery into electrified railways focus on RPC grid compensation of traction power and harmonic governance. However, it is necessary to make RPC multifunctional, and few of the literature studies the coordinated control scheme of PV and battery for emergency train traction. If the majority of current RPC research’s control strategies, such as the ones described in references [16,31], are used to independently traction the locomotive, the lack of phase information obtained by the phase-locked loop will cause the frequency and current of the traction network to be incorrect, forcing the locomotive to stop running. Therefore, this paper proposes the use of a dual-mode RPC with an independent power supply function, which can not only compensate for the power of the traction power supply system but also provide emergency traction for the locomotive.
Meanwhile, current research of the literature applies various criteria to analyze the low-frequency stability of a system. However, many research methods and processes in the literature are rather similar, in that they require graph redrawing every time a variable is modified to display the corresponding result [18,27,28]. This process is not intuitive enough and does not facilitate a thorough investigation of the impact of parameters on the stability and sensitivity of the system, simultaneously considering that there is little research on the low-frequency stability of the PV–battery locomotive network coupling system. Therefore, this paper defines CAM to quantify system stability and provides a method to calculate the sensitivity ε of parameters, which can weigh the importance of different parameters under different working conditions and explore the main influencing parameters and their influence laws. This paper also proposes the use of a passive criterion to reveal the influence mechanism of the number of PV and battery modules in parallel on system stability. Moreover, it finds that it has great potential for exploring parameter influence laws, it can intuitively give the law that a variable affects system stability within any value range through functions or three-dimensional drawings, however, the passive criterion still needs some improvement to achieve analysis accuracy similar to that of the Nyquist criterion.
Furthermore, PV and battery co-traction locomotives are environmentally friendly, because almost all of the electricity comes from renewable energy sources. Based on the research results of this article, further optimization and improvements in the power supply scheme of emergency traction locomotives, and exploring the impact of more variables on the low-frequency stability of the system, such as different types of locomotives running together under different working conditions, and conducting comprehensive research on the simultaneous impact of multiple parameters on the system, all have a profound significance and great value. Meanwhile, issues such as whether the emergency power supply scheme proposed in this article be used for long-term traction locomotives persist. How to configure the capacity of the PV and battery, whether the PV resources can be recycled by the power grid while the supply arm is idle and the locomotive is running, etc., are also the focus of future research. Compared to the traditional AC-electrified railway, the fact that the output of both PV and energy storage is DC suggests that there may be broader application prospects for PV and battery traction locomotives in DC railways and urban rail transit systems, and how to further explore its specific scheme and system stability are yet to be discussed.
5. Conclusions
This work demonstrates that it is feasible to independently drive locomotives using PV and battery equipment under different working conditions during the day and night, and it established a one-dimensional impedance model for a PV–battery locomotive network system from the DC side. At the same time, this study suggests that low-frequency stability analysis of the system of the PV–battery locomotive network may be very important. On this basis, the stability of the system was studied using the generalized Nyquist criterion and a passive criterion. The critical amplitude margin (CAM) and the sensitivity of the controller parameters were proposed to quantitatively evaluate the influence law of the source-side DC converter control parameters and RPC control parameters on this system stability under different emergency traction modes, and corresponding parameter tuning criteria and design suggestions were provided to improve the stability of the system. Finally, the findings were verified through time-domain simulation models and semi-physical testing. The main research conclusions are as follows:
- (1)
- Proposal of a coordinated control strategy, achieving locomotives emergency traction by using PV and battery, thus, increasing the function of the RPC.
- (2)
- When the locomotive is co-tractioned by the PV and battery, the sensitivity of the control parameters is reduced compared to when the locomotive is powered by a single source. Moreover, the parameter selection in the stable region is more extensive, and the control accuracy is higher. In addition, the influence of the proportional gain parameters of the outer loop of the PV and battery DC converters on the system stability is consistent under different traction conditions. Compared to the RPC control parameters and the integral gain sensitivity of the outer loop of the PV and battery DC converter controller, it is more reasonable to improve the system stability by adjusting the proportional gain of the PV and battery DC converters. Priority should be given to reducing the proportional coefficient kPVup and kBup to improve the stability of the system.
- (3)
- The numerical value of the connection ratio between the PV modules and battery modules has a significant impact on the low-frequency stability of the system. If the output admittance of the PV and battery modules is less than 0, increasing the number of parallel connections will weaken the system stability; if it is greater than 0, the stability margin will be increased to a certain extent. By utilizing this feature, the impedance can be reshaped during system design and operation.
Author Contributions
Conceptualization, Y.W.; methodology, Y.X.; software, Z.X.; validation, Y.W. and Y.X.; formal analysis, X.M.; data curation, X.C.; writing—original draft preparation, Y.X.; writing—review and editing, Y.W.; visualization, X.C. All authors have read and agreed to the published version of the manuscript.
Funding
This research was funded by National Natural Science Foundation of China (52067013); the Natural Science Key Foundation of Science and Technology Department of Gansu Province (22JR5RA318, 21JR7RA280, 22JR5RA353).
Data Availability Statement
Data are available on request from the authors. The data that support the findings of this study are available from the corresponding author upon reasonable request.
Conflicts of Interest
The authors declare no conflict of interest.
Appendix A
Appendix B
The passive criterion is additionally proven from the perspective of the dissipative system:
Based on the DC bus, the equivalent impedance circuit of “PV-Battery-locomotive network” is obtained by using Thevenin’s and Norton theorems, as shown in Figure A1, where u(t) = Udc.

Figure A1.
“PV-Battery-locomotive network” equivalent impedance circuit.
The energy function is listed using the output current and voltage, as shown in the following equation.
When the above equation is always greater than zero, the system is a dissipative system and remains stable at all times. According to Passerval’s theorem, the conversion to the frequency domain yields:
Among them, * represents conjugation, Ytot represents the sum of the admittance realities of the optical storage network, and ensuring that the above equation is greater than 0 is ensuring that the admittance Ytot real part is greater than 0.
References
- JR East Group. CSR Report 2017: Aiming for a Sustainable Society; JR East Group: Shibuya City, Japan, 2017. [Google Scholar]
- Metro de Santiago. Sustainability Report 2017; Metro de Santiago: Santiago, Chile, 2018. [Google Scholar]
- Zhong, J.; Bollen, M.; Rönnberg, S. Towards a 100% renewable energy electricity generation system in Sweden. Renew. Energy 2021, 171, 812–824. [Google Scholar] [CrossRef]
- Zhou, X. A Study on Potential for Using New Energy and Renewable Energy Sources in Railways. Int. J. Energy Power Eng. 2019, 8, 45. [Google Scholar] [CrossRef]
- Zhang, G.; Xue, H.; Wang, Y. Systematic study and innovation practice of new concept for the construction of Xiongan station. China Railw. 2021, 50–56. [Google Scholar] [CrossRef]
- Wang, J.; Yang, X.; Kumari, S. Investigating the Spatial Spillover Effect of Transportation Infrastructure on Green Total Factor Productivity. Energies 2023, 16, 2733. [Google Scholar] [CrossRef]
- Chen, J.; Wang, Y.; Chen, X. An on board energy storage solution considering voltage fluctuations and harmonic control of traction networks under mountain area conditions. J. Railw. Sci. Eng. 2021, 18, 1582–1594. [Google Scholar]
- Chen, W.; Wang, X.; Li, Q. Review on the development status of pv power station accessing to traction power supply system for rail transit. Power Syst. Technol. 2019, 43, 3663–3670. [Google Scholar]
- Tanta, M.; Pinto, J.G.; Monteiro, V.; Martins, A.P.; Carvalho, A.S.; Afonso, J.L. Topologies and Operation Modes of Rail Power Conditioners in AC Traction Grids: Review and Comprehensive Comparison. Energies 2020, 13, 2151. [Google Scholar] [CrossRef]
- Guo, Y.; Chen, X.; Wang, Y. Negative sequence optimization compensation strategy for energy storage type railway power conditioner considering grid voltage imbalance. High Volt. Eng. 2023, 49, 772–780. [Google Scholar]
- Tanta, M.; Cunha, J.; Barros, L.A.M.; Monteiro, V.; Pinto, J.G.O.; Martins, A.P.; Afonso, J.L. Experimental Validation of a Reduced-Scale Rail Power Conditioner Based on Modular Multilevel Converter for AC Railway Power Grids. Energies 2021, 14, 484. [Google Scholar] [CrossRef]
- Zhang, D.; Zhang, Z.; Wang, W.; Yang, Y. Negative Sequence Current Optimizing Control Based on Railway Static Power Conditioner in V/v Traction Power Supply System. IEEE Trans. Power Electron. 2015, 31, 200–212. [Google Scholar] [CrossRef]
- Li, T.; Shi, Y. Power Quality Management Strategy for High-Speed Railway Traction Power Supply System Based on MMC-RPC. Energies 2022, 15, 5205. [Google Scholar] [CrossRef]
- Barros, L.A.M.; Martins, A.P.; Pinto, J.G. Balancing the Active Power of a Railway Traction Power Substation with an sp-RPC. Energies 2023, 16, 3074. [Google Scholar] [CrossRef]
- Lu, Q.; Gao, Z.; He, B.; Che, C.; Wang, C. Centralized-Decentralized Control for Regenerative Braking Energy Utilization and Power Quality Improvement in Modified AC-Fed Railways. Energies 2020, 13, 2582. [Google Scholar] [CrossRef]
- Chen, W.; Wang, X.; Han, Y. Research on coordinated control method of pv and battery access traction power supply system based on RPC. In Proceedings of the 2020 IEEE Sustainable Power and Energy Conference (iSPEC), Chengdu, China, 23–25 November 2020. [Google Scholar]
- Hu, H.; GE, Y.; Huang, Y. A novel “source-network-train-storage” integrated power supply system for electric railways. In Proceedings of the CSEE 2022, Lisbon, Portugal, 10–12 April 2022; Volume 42, pp. 4374–4391. [Google Scholar]
- Liao, Y.; Liu, Z.; Zhang, H.; Wen, B. Low-Frequency Stability Analysis of Single-Phase System with dq-Frame Impedance Approach—Part II: Stability and Frequency Analysis. IEEE Trans. Ind. Appl. 2018, 54, 5012–5024. [Google Scholar] [CrossRef]
- Hu, H.; Zhou, Y.; Li, X.; Lei, K. Low-Frequency Oscillation in Electric Railway Depot: A Comprehensive Review. IEEE Trans. Power Electron. 2020, 36, 295–314. [Google Scholar] [CrossRef]
- Carlos, S.B. Direct Generation of Low Frequency Single Phase AC for the Railway in Norway and Sweden. Ph.D. Thesis, Royal Institute of Technology, Stockholm, Sweden, 2009. [Google Scholar]
- Danielsen, S.; Molinas, M.; Toftevaag, T.; Fosso, O.B. Constant power load characteristic’s influence on the low-frequency interaction between advanced electrical rail vehicle and railway traction power supply with rotary converters. In Proceedings of the 9th International Scientific Conference “Modern Electric Traction”, Gdansk, Poland, 24–26 September 2009; pp. 1–6. [Google Scholar]
- Danielsen, S. Electric Traction Power System Stability. Ph.D. Thesis, Norwegian University of Science and Technology, Trondheim, Norway, 2010. [Google Scholar]
- Song, Y.; Liu, Z.; Ronnquist, A.; Navik, P.; Liu, Z. Contact wire irregularity stochastics and effect on high-speed railway pantograph-catenary interactions. IEEE Trans. Instrum. Meas. 2020, 69, 8196–8206. [Google Scholar] [CrossRef]
- Song, Y.; Wang, Z.; Liu, Z.; Wang, R. A spatial coupling model to study dynamic performance of pantograph-catenary with vehicle-track excitation. Mech. Syst. Signal Process. 2020, 151, 107336. [Google Scholar] [CrossRef]
- Frugier, D.; Ladoux, P. Voltage disturbances on 25 kV–50 Hz railway lines Modelling method and analysis. In Proceedings of the SPEEDAM 2010, Pisa, Italy, 14–16 June 2010; pp. 1080–1085. [Google Scholar] [CrossRef]
- Jiang, X.; Hu, H.; He, Z.; Tao, H.; Qian, Q. Study on low-frequency voltage fluctuation of traction power supply system introduced by multiple modern trains. Electr. Power Syst. Res. 2017, 146, 246–257. [Google Scholar] [CrossRef]
- Mu, X.; Wang, Y.; Chen, S. Stability research on high-speed railway vehicle network electric coupling system based on improved sum-norm criterion. Trans. China Electrotech. Soc. 2019, 34, 3253–3264. [Google Scholar]
- Xia, W.; Wang, H.; Meng, X. Electrical stability research on vehicle-grid coupling system of high-speed railways for mixed passenger and freight traffic. Power Syst. Technol. 2021, 45, 4837–4848. [Google Scholar]
- Zhang, X.; Wang, L.; Dunford, W.; Chen, J.; Liu, Z. Integrated Full-Frequency Impedance Modeling and Stability Analysis of the Train-Network Power Supply System for High-Speed Railways. Energies 2018, 11, 1714. [Google Scholar] [CrossRef]
- Fan, F.; Wank, A.; Seferi, Y.; Stewart, B.G. Pantograph Arc Location Estimation Using Resonant Frequencies in DC Railway Power Systems. IEEE Trans. Transp. Electrif. 2021, 7, 3083–3095. [Google Scholar] [CrossRef]
- Zhao, X.; Xie, Z.; Wang, Y. Low frequency stability analysis of photovoltaic connected traction power supply system based on extended forbidden region-based criterion. High Volt. Eng. 2023, 1–12. [Google Scholar] [CrossRef]
- Zhou, Y. Research on Low Frequency Oscillation Suppression of Emu Based on On-Board Energy Storage and Virtual Synchronous Machine Technology; Beijing Jiaotong University: Beijing, China, 2021. [Google Scholar]
- Pedra, J.; Sainz, L.; Monjo, L. Three-Port Small Signal Admittance-Based Model of VSCs for Studies of Multi-Terminal HVDC Hybrid AC/DC Transmission Grids. IEEE Trans. Power Syst. 2020, 36, 732–743. [Google Scholar] [CrossRef]
- Riccobono, A.; Santi, E. A novel Passivity-Based Stability Criterion (PBSC) for switching converter DC distribution systems. In Proceedings of the 2012 Twenty-Seventh Annual IEEE Applied Power Electronics Conference and Exposition, Orlando, FL, USA, 5–9 February 2012; pp. 2560–2567. [Google Scholar] [CrossRef]
Disclaimer/Publisher’s Note: The statements, opinions and data contained in all publications are solely those of the individual author(s) and contributor(s) and not of MDPI and/or the editor(s). MDPI and/or the editor(s) disclaim responsibility for any injury to people or property resulting from any ideas, methods, instructions or products referred to in the content. |
© 2023 by the authors. Licensee MDPI, Basel, Switzerland. This article is an open access article distributed under the terms and conditions of the Creative Commons Attribution (CC BY) license (https://creativecommons.org/licenses/by/4.0/).