Article

Greenhouse Gas Emissions from Incineration of Municipal Solid Waste in Seoul, South Korea

Department of Environmental Engineering, Chungnam National University, Daejeon 34134, Republic of Korea
*
Author to whom correspondence should be addressed.
Energies 2023, 16(12), 4791; https://doi.org/10.3390/en16124791
Submission received: 1 May 2023 / Revised: 12 June 2023 / Accepted: 14 June 2023 / Published: 19 June 2023

Abstract

:
Greenhouse gas (GHG) emissions from the incineration of municipal solid waste (MSW) have become a concern in the solid waste community from the perspective of climate change mitigation and response. In this study, we aimed to estimate the GHG emissions from the incineration of MSW in Seoul, with a population of about 10 million, by using the IPCC (Intergovernmental Panel on Climate Change) 2006 guideline and scenario analysis for 2030 and 2040. In 2021, Seoul generated 2899 kt of MSW/yr. Approximately 40% (1163 kt/yr) of Seoul’s MSW was disposable (or non-recyclable) waste. Out of the disposable waste, about 741 kt/yr of combustible waste was treated by incineration, resulting in 545 kt CO2 eq emissions, which was about 7.5 times higher than the 74 kt CO2 eq in 2000. The dominant contributor to the GHG emissions was plastic waste, accounting for the largest fraction of 92% (501 kt CO2 eq/yr in 2021). Scenario analysis showed that if the current situation (BAU scenario) is considered, with the assumption of no reduction in MSW generation, the capacity of Seoul’s four incineration facilities will be exceeded in 2029. All other scenarios (S1, S2, and S3) showed reduced amounts of MSW incineration and GHG emissions compared to the BAU scenario. Especially, S3 (waste reduction and increased recycling rate) revealed a 53% reduction when compared to the BAU scenario. Based on the results of our scenario analysis, it is expected that in 2040, the GHG emissions from incineration will be in a range of from about 389 kt CO2 eq to 832 kt CO2 eq, depending on the waste minimization policy and recycling efforts in the future. Strengthened regulations on and efforts towards plastic waste reduction and the recycling of MSW will be crucial with the perspectives of GHG emissions by incineration and resource recovery.

1. Introduction

Incineration is one of the common methods of municipal solid waste (MSW) treatment [1]. This treatment can reduce the volume of waste by up to 90%, which can help to solve the land-shortage problem caused by disposal. It also has the advantage of a significantly lower possibility of soil and water pollution than landfilling. It has been gaining popularity worldwide, as it can effectively recover energy from waste [2,3]. However, various pollutants (e.g., SOx, NOx, heavy metals, and dioxins/furans) and greenhouse gases (GHGs) (e.g., CO2 and N2O) can be emitted into the atmosphere through MSW incineration processes [4]. The GHG emitted capture infrared radiation and cause the steady heating of the earth, atmosphere, and surface, affecting global warming and climate change [5,6]. Therefore, it is important to identify the major contributing factors of GHG emitted from incineration, and to reduce the amount of GHG emissions in response to climate change.
Previous studies on GHG emissions by the incineration of MSW were conducted in various countries, such as China [7,8], Malaysia [9], Saudi Arabia [10], and Brazil [11]. Major factors affecting GHG emissions by MSW incineration were identified by Yang et al. (2012) and Kadir et al. (2013) [7,9]. Yang et al. (2012) compared and studied the amount of GHG emitted during the incineration of MSW in six cities in China. This study showed a correlation between incinerator CO2 emissions and plastic waste in MSW, and that CO2 emissions were mainly due to plastics (which accounted for from 90 to 98% of GHG emissions) [7]. The evaluation of Kadir et al. (2013) was from the perspective of energy recovery through MSW incineration in Kuala Lumpur in Malaysia. According to the study, Kuala Lumpur generated about 2500 tons of MSW/day. Collected MSW consisted of mainly food, paper, and plastics, accounting for 80% by weight. The incineration of MSW recovered about 639 kWh of energy, which was higher than the recoveries using other technologies (e.g., 131 kWh for MSW to anaerobic digester and biogas to energy; 305 kWh for MSW to refuse-derived fuel (RDF) and incineration; and 418 kWh for MSW to anaerobic digester and biogas to steam energy) [9]. Studies on GHG reduction and energy recovery from incineration were conducted by Yaman et al. (2020) and Yao et al. (2019) [8,10]. Yaman et al. (2020) identified the energy recovery potentials and reduction in GHG emissions from MSW in Saudi Arabia. According to the study, a comparison of the potential of material recycling facilities using composting, landfilling, and incineration revealed that incineration had a GHG reduction effect of −0.147 t CO2 eq/ton of MSW, resulting in about 1.91 × 10⁹ kWh/yr of energy recovery [10]. Yao et al. (2019) studied the possibility of a decrease in GHG emissions due to the incineration of MSW in Beijing, China. An evaluation of the reduction potential of the GHG emissions by three scenarios showed that the high-efficiency scenario predicted the greatest reduction potential of GHG (63.8% more reduction than the BAU scenario). It was found that power generation from municipal solid waste incineration (MSWI) reduced GHG emissions through energy recovery from incineration. Some countries tend to adopt incineration technology rather than landfilling for MSW treatment [8]. According to Lino et al. (2017), eight countries, including Austria, Denmark, Germany, the Netherlands, Sweden, Switzerland, Belgium, and Japan, had higher rates of incineration and recycling than landfilling [11]. Among them, countries such as Denmark and Japan incinerated more than 65% of their MSW [12].
In Korea, the landfilling of MSW was a dominant method until 2004 (62%), after which both incineration and recycling rates gradually increased [13]. The amounts of GHG emitted from incineration increased as the amount of treatment by incineration of MSW increased after 2010 [14]. Studies on GHG emissions by incineration in Korea have already been investigated by several authors [15,16,17,18]. According to Kang et al. (2019), as of 2016, the GHG emissions from the incinerated waste, including MSW in Gyeonggi-do, were predicted to be about 1397 kt CO2 eq/yr based on the IPCC 2006 guideline. In Gyeonggi-do, about 12,070 tons/day (22% of Korea) of waste was generated in 2016, and 22.4% of the waste was treated by incineration [15]. Hwang et al. (2017) revealed the GHG emissions and emission factors of nine incineration facilities in Korea. The total emissions from MSWI ranged from 3587 to 11,082 t CO2 eq [3]. Kwon et al. (2018) revealed the quantitative effect of reducing GHG emissions from the recycling and energy recovery of MSW in Daejeon Metropolitan City [16]. Park et al. (2011) estimated the N2O emission coefficient (from 71 to 153 g N2O/t waste) of MSWI facilities and calculated the N2O emissions (from 2.31 to 8.27 tons N2O/yr) [17]. Kim et al. (2016) studied the calculation of GHG emissions from MSW incineration facilities in three scenarios based on the IPCC guideline, and calculated emissions according to generation characteristics. The GHG emissions based on the IPCC guideline ranged from 244.4 to 322.1 t CO2 eq/day, while the emissions determined by the assay value method of the study were from 151.8 to 230.3 t CO2 eq/day [18].
However, there is a lack of in-depth research on the characteristics and prediction of GHG emissions by incineration in Seoul Metropolitan City, the capital of South Korea, with a population of approximately 10 million. In addition, there is a need to evaluate the reduction potentials of GHG by the change in MSW management methods because the landfill ban on MSW will be enforced at the beginning of 2026. Thus, it is necessary to identify the major sources and contributing factors to the GHG emissions from MSWI, and to evaluate the GHG reduction potentials by incineration in Seoul in the future.
This study was carried out to determine the GHG emissions from the incineration of MSW in Seoul between 2000 and 2021. It also predicted the amount of MSW treated by incineration in Seoul by 2030 and 2040 using linear models and scenario analyses. Based on the predicted amounts of incineration, the characteristics of GHG emissions and the temporal trends of MSW treatment methods were examined. The main influencing factors for the GHG emissions were identified. Scenario analysis was conducted to predict changes in MSWI and GHG emissions in response to the landfill bans and increased recycling rate. The results from this study can be used for developing future management plans for MSW in order to reduce GHG by 2040, and for identifying the priority of waste components as a policy target in Seoul, as well as in many other megacities. Furthermore, the results can be supported to evaluate GHG reduction policies in Seoul’s future efforts towards establishing a carbon-neutral city and sustainable MSW management.

2. Methodology

2.1. Data Acquisition

In this study, we used the data of ‘National Waste Generation and Treatment Statistics (2000~2021)’ for determining the emissions of GHG from MSWI [13]. A total of seven mathematical models were employed to estimate the MSW generation and incineration amounts from 2022 to 2040. The models in this study included the linear model, arithmetic series model, geometric series model, exponential function model, least-squares method, logistic curve, and Gompertz model [19,20,21]. Waste composition and treatment statistics of MSW were also obtained from the Korea Ministry of Environment (Korea MOE), and Seoul Metropolitan Government [13,22]. Emission factors and parameters for calculating GHG emissions were collected from the Korea Environment Corporation (KECO) [23]. Table 1 shows the data and periods for determining the amounts of MSWI and GHG emissions.

2.2. Calculation of GHG Emissions by Incineration

The GHG emissions from MSWI in Seoul were calculated using the GHG emission calculation tool provided by the KECO, which is based on the Intergovernmental Panel on Climate Change (IPCC) guideline 2006 [23]. From 2000 to 2021, GHG emissions by incineration with stoker-type incinerators (or mass-burn incinerators) were calculated by using the physical composition (food, textiles, wood, paper, rubber, plastic, and others) of MSW by year with the Tier 1 approach. Predicted GHG emissions from MSWI between 2022 and 2040 were calculated using the previous five years of physical composition, on average, from 2017 to 2021 by reflecting recent trends in MSW composition. According to the GHG emissions from MSWI, GHG emissions, such as those from CO2, CH4, and N2O, were calculated as Equations (1) and (2). The CO2 emissions were calculated using Equation (1) [4]:
C O 2   e m i s s i o n s   ( t C O 2 e q y r ) = i ( S W i × d m i × C F i × F C F i × O F i ) × 44 12
where SWi is the total amount of solid waste of type i (wet weight) incinerated (t waste/yr); dmi is the dry matter content in solid waste (wet weight) incinerated (%); CFi is the total carbon content in dry matter (t C/t waste); FCFi is the fossil carbon in total carbon (%); OFi is the oxidation factor; 44/12 is the conversion factor from C to CO2; i is the type of waste incinerated.
CH4 and N2O emissions were calculated using Equation (2):
C H 4   o r   N 2 O   e m i s s i o n s   ( t C O 2 e q y r ) = i ( I W i × E F i × F e q ,   i × 10 3 )
where IWi is the amount of solid waste of type i incinerated (t waste/yr); EFi is the emission factor of CH4 or N2O (kg CH4 or N2O/t waste); Feq, i is the global warming potential equivalent coefficient of CH4 or N2O (CH4 = 21, N2O = 310); i is the type of waste incinerated.
Total GHG emissions were determined by using Equation (3):
T o t a l   G H G s   e m i s s i o n s   ( t C O 2 e q y r ) = C O 2   e m i s s i o n s + C H 4   e m i s s i o n s + N 2 O   emissions
The emission factors and parameters used for the calculations of the GHG emissions from MSWI in Seoul are presented in Table 2 [23]. The emission factors of CO2, CH4, and N2O and the parameters were country-specific and included dry mass (dm), carbon fraction (CF), fossil carbon fraction (FCF), and oxidation factor (OF).

2.3. Scenario Analysis

According to the 2030 National Determined Contributions (NDCs) by Korea in 2021, the recycling rate of MSW increased from 62% in 2018 to 83% in 2030 [24]. Another important policy was related to bans of non-recyclable MSW in landfills. According to the Enforcement Rules of the Waste Management Act, three major cities (Seoul, Incheon, and Gyeonggi-do) will be banned from the landfilling of MSW in 2026, while all other cities will be adopting the regulation in 2030 [25]. Accordingly, the Seoul Metropolitan Government is planning to construct additional incineration facilities to accommodate more MSW. It will be a challenge to deal with the treatment of MSW after the landfill ban. The most preferred option would be a reduction in MSW for disposal. Another proper option for the treatment of MSW is to increase the recycling rate of MSW by diverting it from landfills. The possible and realistic option would be an increase in the incineration capacity for MSW treatment. Therefore, by considering the future waste reduction and landfill ban policy, we set four management scenarios during this study: the business-as-usual scenario (BAU), Scenario 1 (S1), Scenario 2 (S2), and Scenario 3 (S3). The detailed assumptions for each scenario are described in Table 3.

2.4. Calculation of Net GHG Emissions by Incineration

In this study, net GHG emissions were calculated using the amounts of GHG emissions and reductions (or offset). The calculation method for net GHG emissions was as Equation (4):
Net GHG emissions = Total GHG emissions − GHG reductions
where total GHG emissions are the sum of direct GHG emissions from incineration and indirect GHG emissions, such as from facility operations. GHG reductions are the sum of energy (waste heat) recovery through steam production and electricity generation. GHG reductions by waste heat recovery from incineration facilities were calculated using Equation (5) [26]:
GHG reductions by waste heat recovery (t CO2 eq) = waste heat recovery by incineration (Gcal) × 1000 kcal/1 Gcal × 1 TOE (oil conversion factor)/107 kcal × 0.63 t Carbon/TOE (LNG carbon emission factor) × 44/12 (conversion factor from Carbon to CO2)
In this study, the emission factors (EFs) for calculating GHG emissions by incineration were referred to as the national emission factors (2022). Other factors not presented in the national emission factors were used based on the IPCC emission factors (2006). The emission factors of power generation, power consumption, and LNG (Liquefied Natural Gas) are presented in Table 4 [27].
The net GHG emissions for 2030 and 2040 were calculated considering the total capacity of four currently operating incinerators in Seoul, which was 2850 tons/day (as of 2023). Additional incineration facilities of 1000 tons/day have been designed to be built in 2030 and 2040. By 2030, it is assumed that a total of 3850 tons/day will be processed by adding 1000 tons/day. By 2040, a total of 4850 tons/day can be treated by incineration. It is assumed that the predicted GHG emissions for 2030 and 2040 are based on the same ratios of waste heat recovery, power generation and consumption, and LNG usage as in proportion to the previous three-year average from 2019 to 2021. The energy recovery and consumption data from the four incinerators in Seoul were acquired from the operational report of the Seoul Resource Recovery Facility published by the Seoul Metropolitan Government [22]. After collecting the data, net GHG emissions were calculated using Equation (4), using waste heat recovery as GHG reductions, and consumption of power and LNG as GHG emissions.

3. Results and Discussion

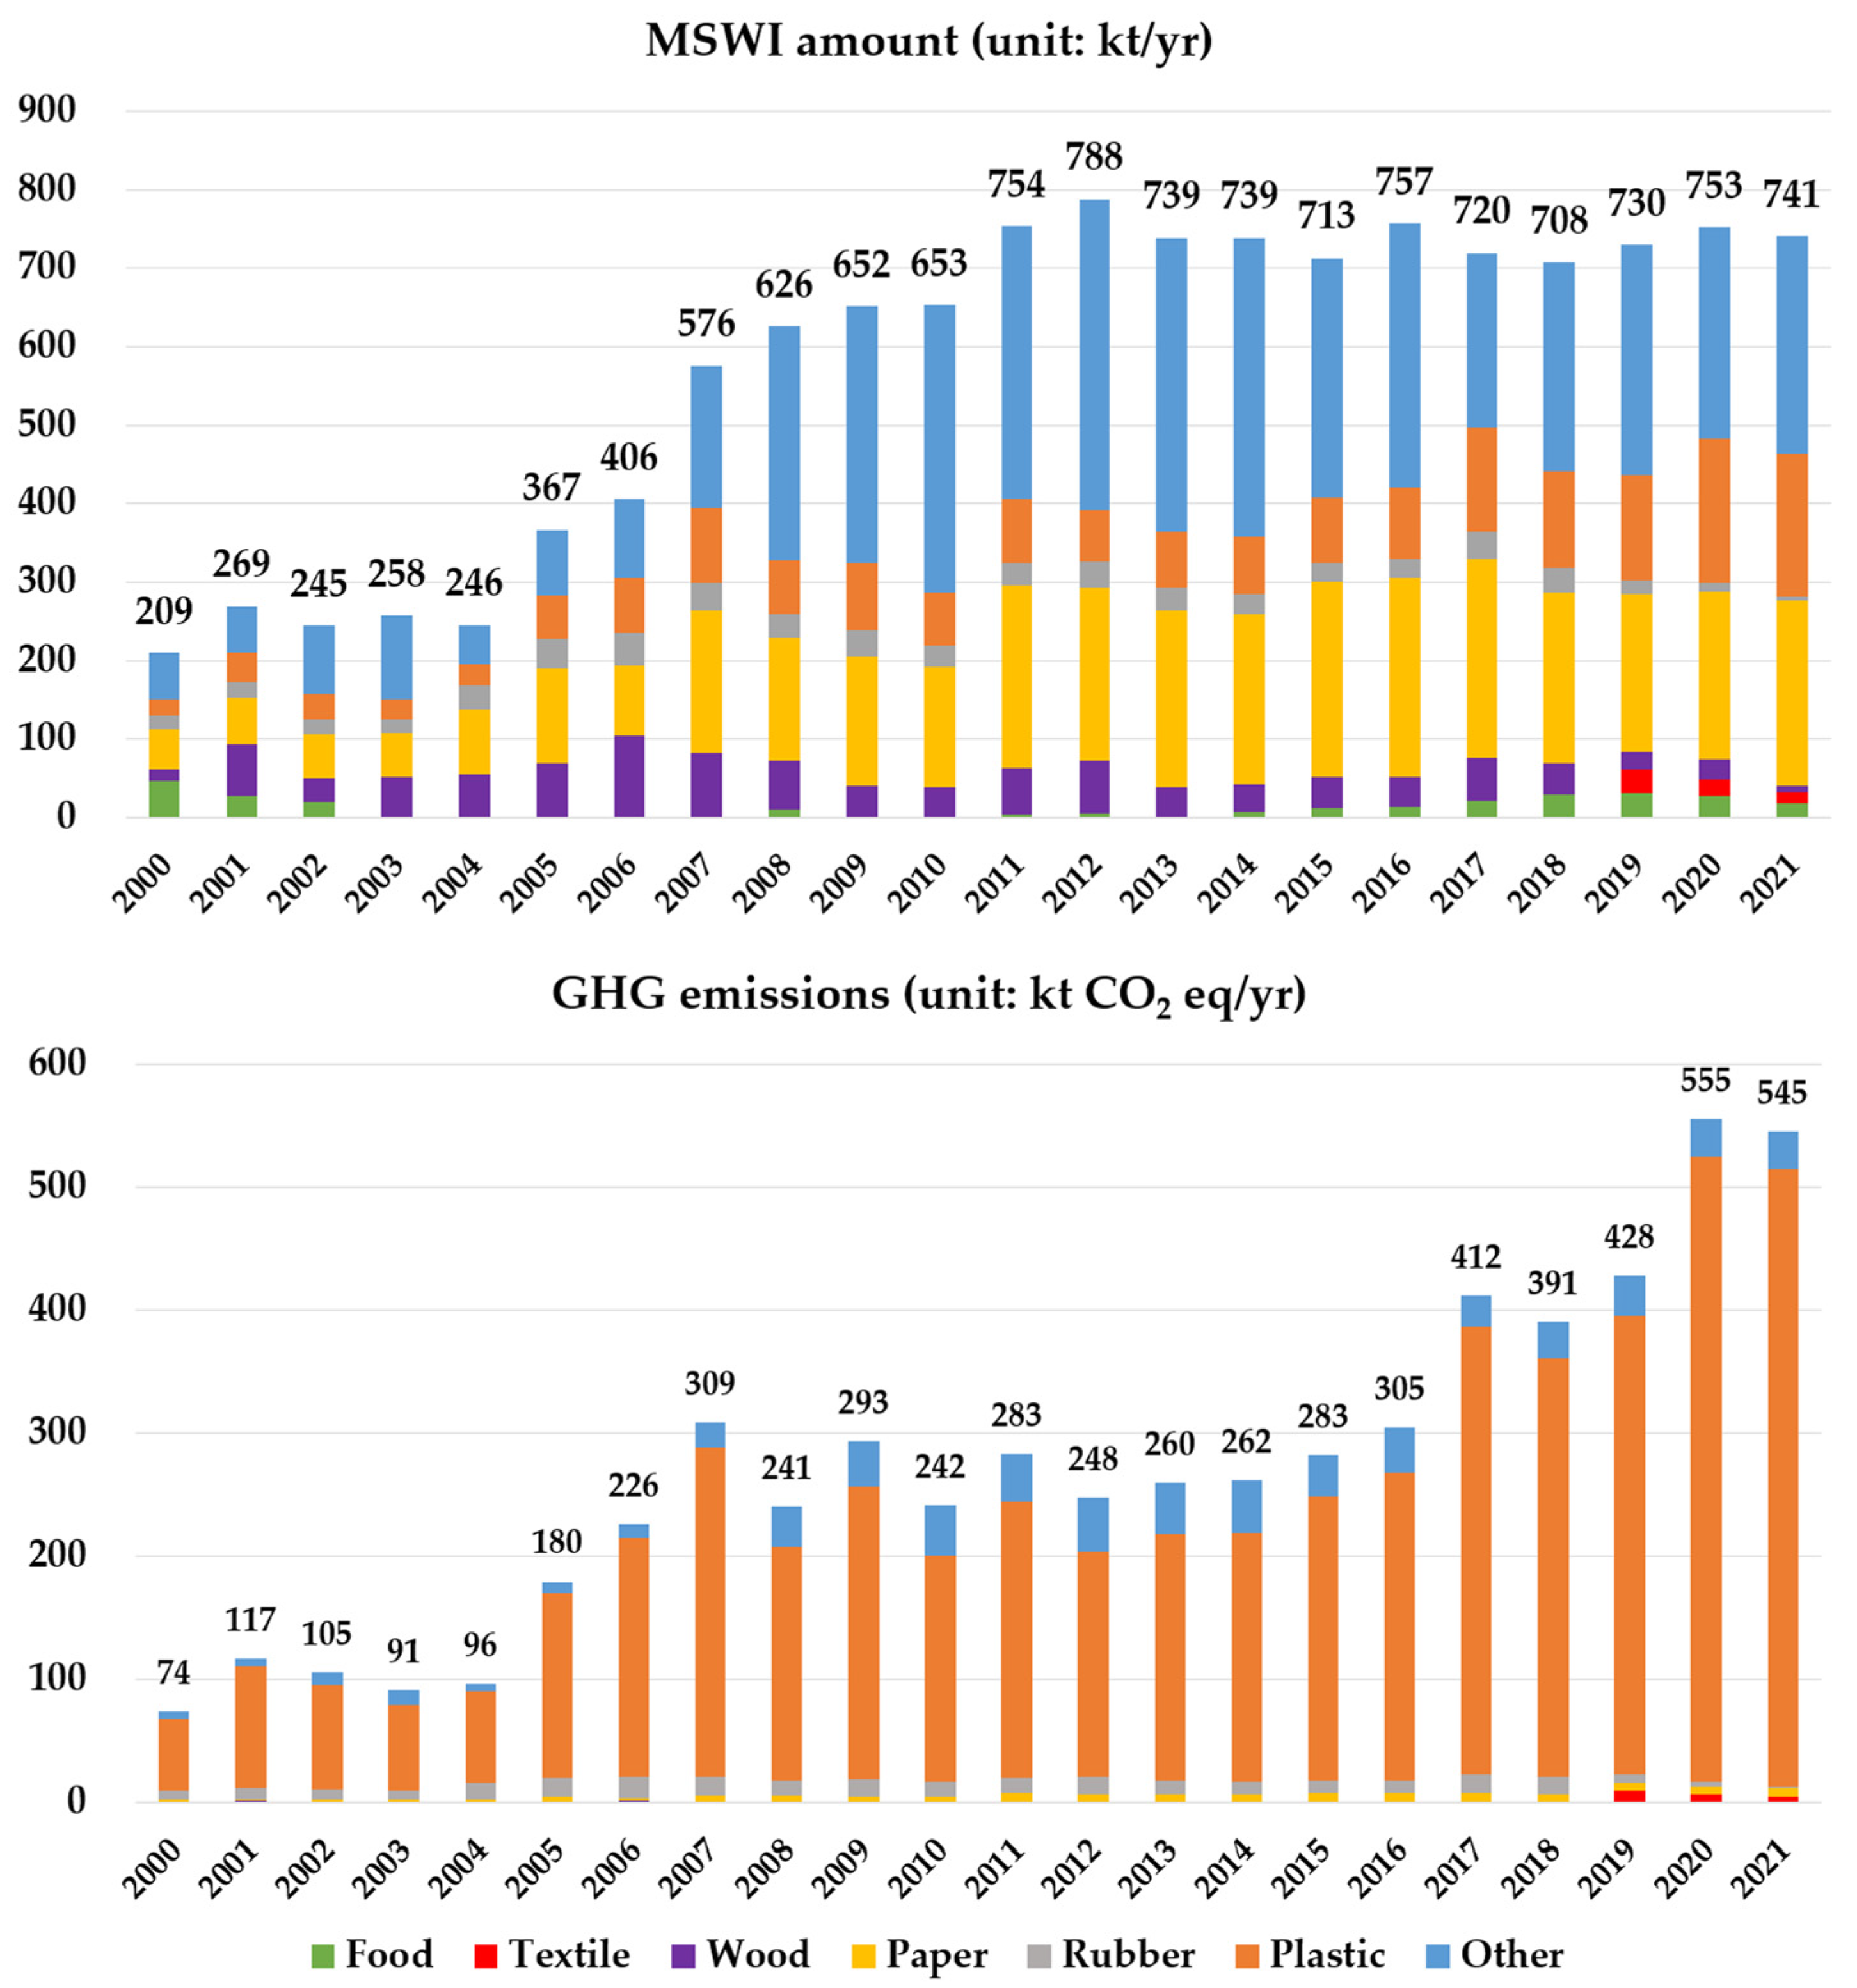
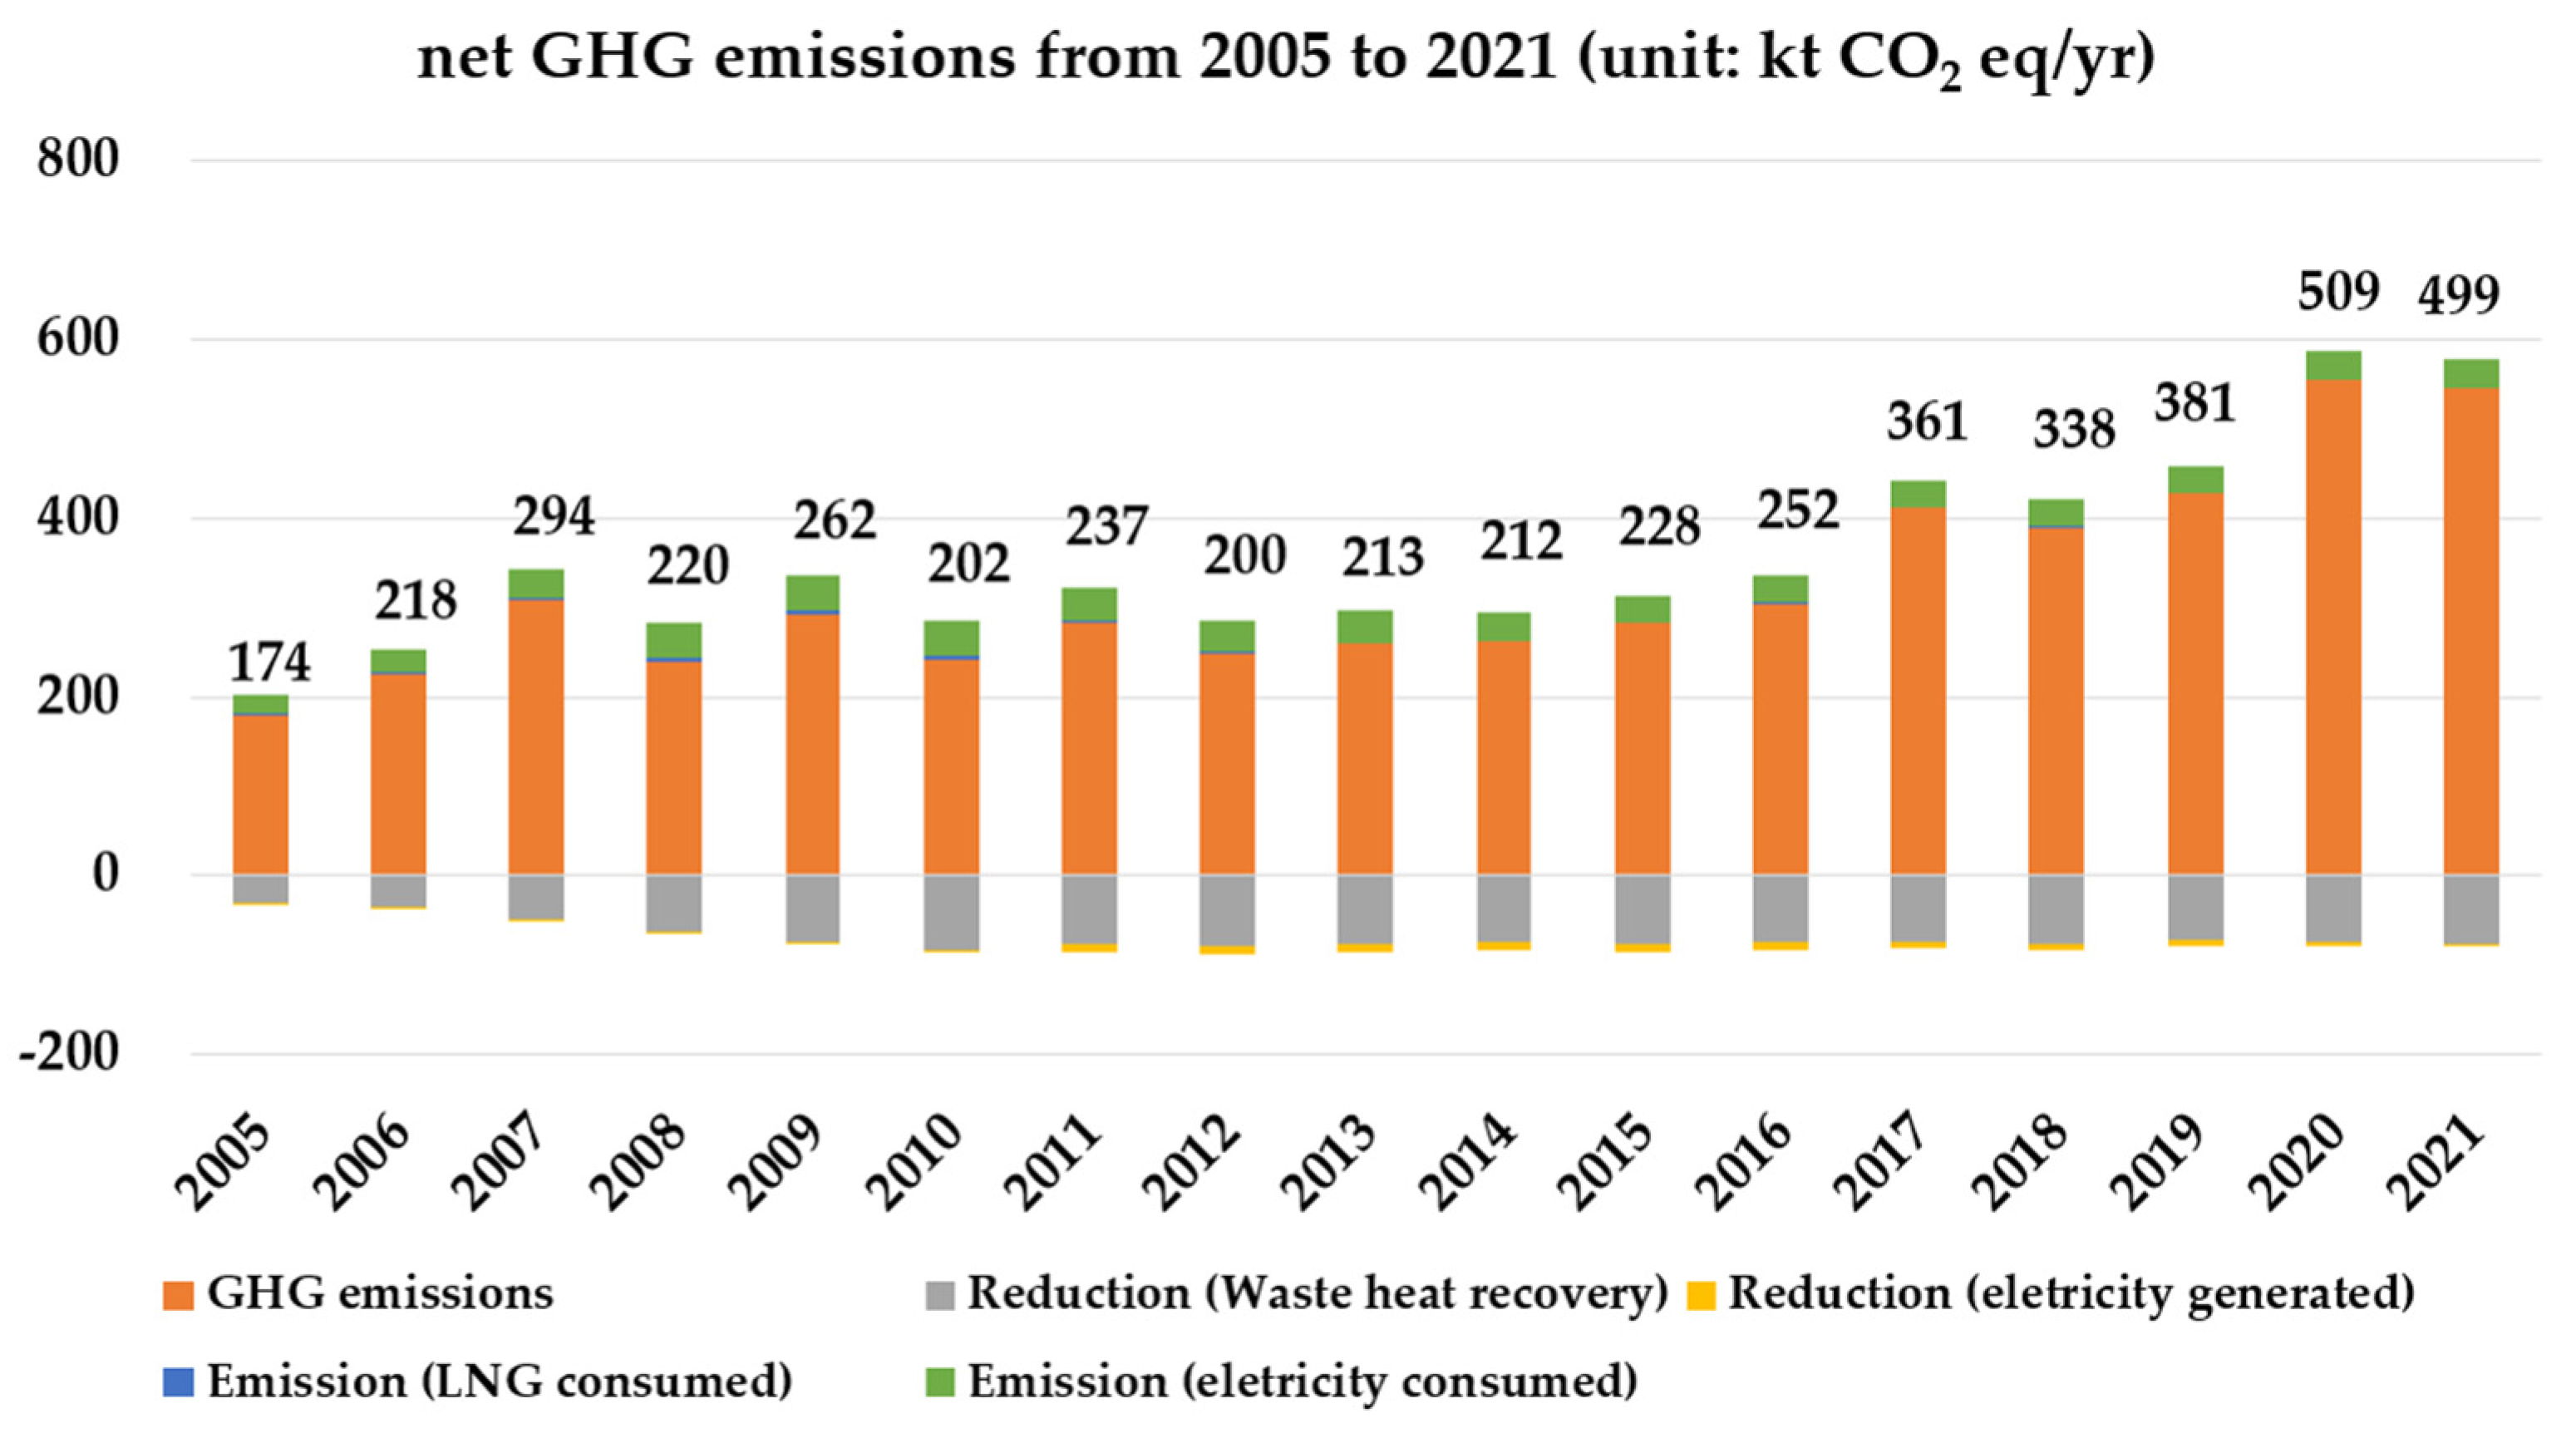
3.1. Esimated GHG Emissions from MSWI from 2000 to 2021

In Korea, the landfilling rate of MSW was relatively high before 1995, after which the rates of incineration and recycling gradually increased over the next three decades. GHG emissions from incineration consequently tended to increase due to the increased amounts of incineration after 2010 [13,14]. In Japan, the proportion of landfilling gradually decreased over the years. Much of the waste was combusted at incineration facilities, along with recycling. As of 2020, 79.5% of waste was disposed of by incineration, 19.6% by recycling, and 0.9% by landfilling [28].
Figure 1 shows the amounts and flows of MSW in Seoul in 2021 [13]. The total amount of MSW generated was 2899 kt/yr. In Korea, MSW is commonly divided into three major types (i.e., recyclables, food waste, and disposal waste or non-recyclables). Among Seoul’s MSW in 2021, disposal waste or non-recyclables was the largest fraction (40%, 1163 kt/yr), followed by recyclables (31%, 901 kt/yr) and food waste (29%, 835 kt/yr). Recyclables (e.g., paper, plastic, metal cans, glass, etc.) and food waste were source-separated in all households and commercial areas by adopting pay-as-you-throw schemes [29]. Food waste, which has been banned from landfilling since 2005, was commonly treated through animal feed manufacturing, composting, and anaerobic digestion. Disposable waste in plastic bags or non-recyclable waste was typically treated at incineration facilities or disposed of in landfills. In 2021, the fraction of combustible waste accounted for 93% (1086 kt/yr) of the disposal waste, while other fractions included incombustible (69 kt/yr, 6%) and construction (8 kt/yr, 1%) waste. Mixed waste (399 kt/yr, 37%), paper waste (340 kt/yr, 31%), and plastic waste (248 kt/yr, 23%) were the larger fractions in combustible waste streams, while other small fractions included wood (45 kt/yr, 4%), food (26 kt/yr, 2%), textiles (22 kt/yr, 2%), and rubber (6 kt/yr, 1%). Most of the combustible waste was treated by incineration (741 kt/yr, 68%), followed by landfilling (305 kt/yr, 28%) and limited recycling (41 kt/yr, 4%).
Figure 2 shows the GHG emissions from MSWI by waste component type from 2000 to 2021. In 2000, 74 kt CO2 eq/yr was emitted into the atmosphere, after which the GHG emissions have been steadily increasing over time. In 2021, the GHG emissions were estimated to be about 545 kt CO2 eq/yr, more than 7.3 times higher than those in 2000. It should be noted that the CO2 emissions from biomass wastes (food, wood) were excluded from the calculation, as they are biogenic emissions. Thus, only CO2 emissions from wastes (plastic, paper, textile, etc.) originating from fossil fuel sources were calculated. In addition, CH4 and N2O were calculated according to the Tier 1 emission factor values [30]. According to Park’s study (2022), the GHG emissions from four incineration facilities in Seoul were about 876 kt CO2 eq/yr [31], which is higher than those of our study. The reason for the difference between the studies is likely due to the difference in the percentage of waste composition used to calculate GHG emissions. In Park’s study, the combustible waste accounted for 86% of the average of the four incinerators. The paper accounted for 43% of the combustible waste, followed by plastics (20%), textiles (12%), food (10%), wood (5%), other (4.5%), and rubber (4.2%) [31].
The waste type that contributed the most to GHG emissions was plastic waste. Plastic waste treated by incineration has increased over the past two decades. It was 8.6 times higher, from 21 kt plastic waste/yr in 2000 to 182 kt plastic waste/yr in 2021. As plastic waste materials in MSWI increased, GHG emissions also significantly increased. The GHG (CO2) emitted by the incineration of 1 ton of plastic waste was found to be 2.7 tons, indicating that the contribution to GHG emissions was greater than that of other waste [4]. In particular, there was a sharp increase in GHG emissions in 2021 compared to 2019, likely due to increased amounts of plastic materials (a 34% increase from 2019). It is worth noting the significant contribution of plastic waste to GHG emissions. While the amount of plastic waste in 2021 was 182 kt/yr (25% of total MSWI), the resulting GHG emissions were 501 kt CO2 eq/yr (92% of total GHG emissions). This corresponds to 2.8 times the GHG of the amount of plastic waste. Because plastics are made from fossil fuels, the increase in plastics has led to an increase in fossil carbon fractions, which contribute to GHG emissions from incineration during oxidation processes [32,33].
According to the OECD report, global plastic in 2019 was produced at about 460 million metric tons (Mt), which doubled since 2000. During the same period, plastic waste was 353 Mt, which more than doubled. As plastic production and plastic waste increase globally, it is expected that the amount of GHG emissions will tend to increase [34]. Because the GHG emissions from incinerated paper and plastic wastes are higher than those of other waste types, there is a need for substantial efforts towards a reduction in such waste materials in MSWI. Material recovery processing (e.g., removal of paper and plastic) for waste disposal bags generated from households along with more strengthened source-separation regulations could be a viable option before incineration.

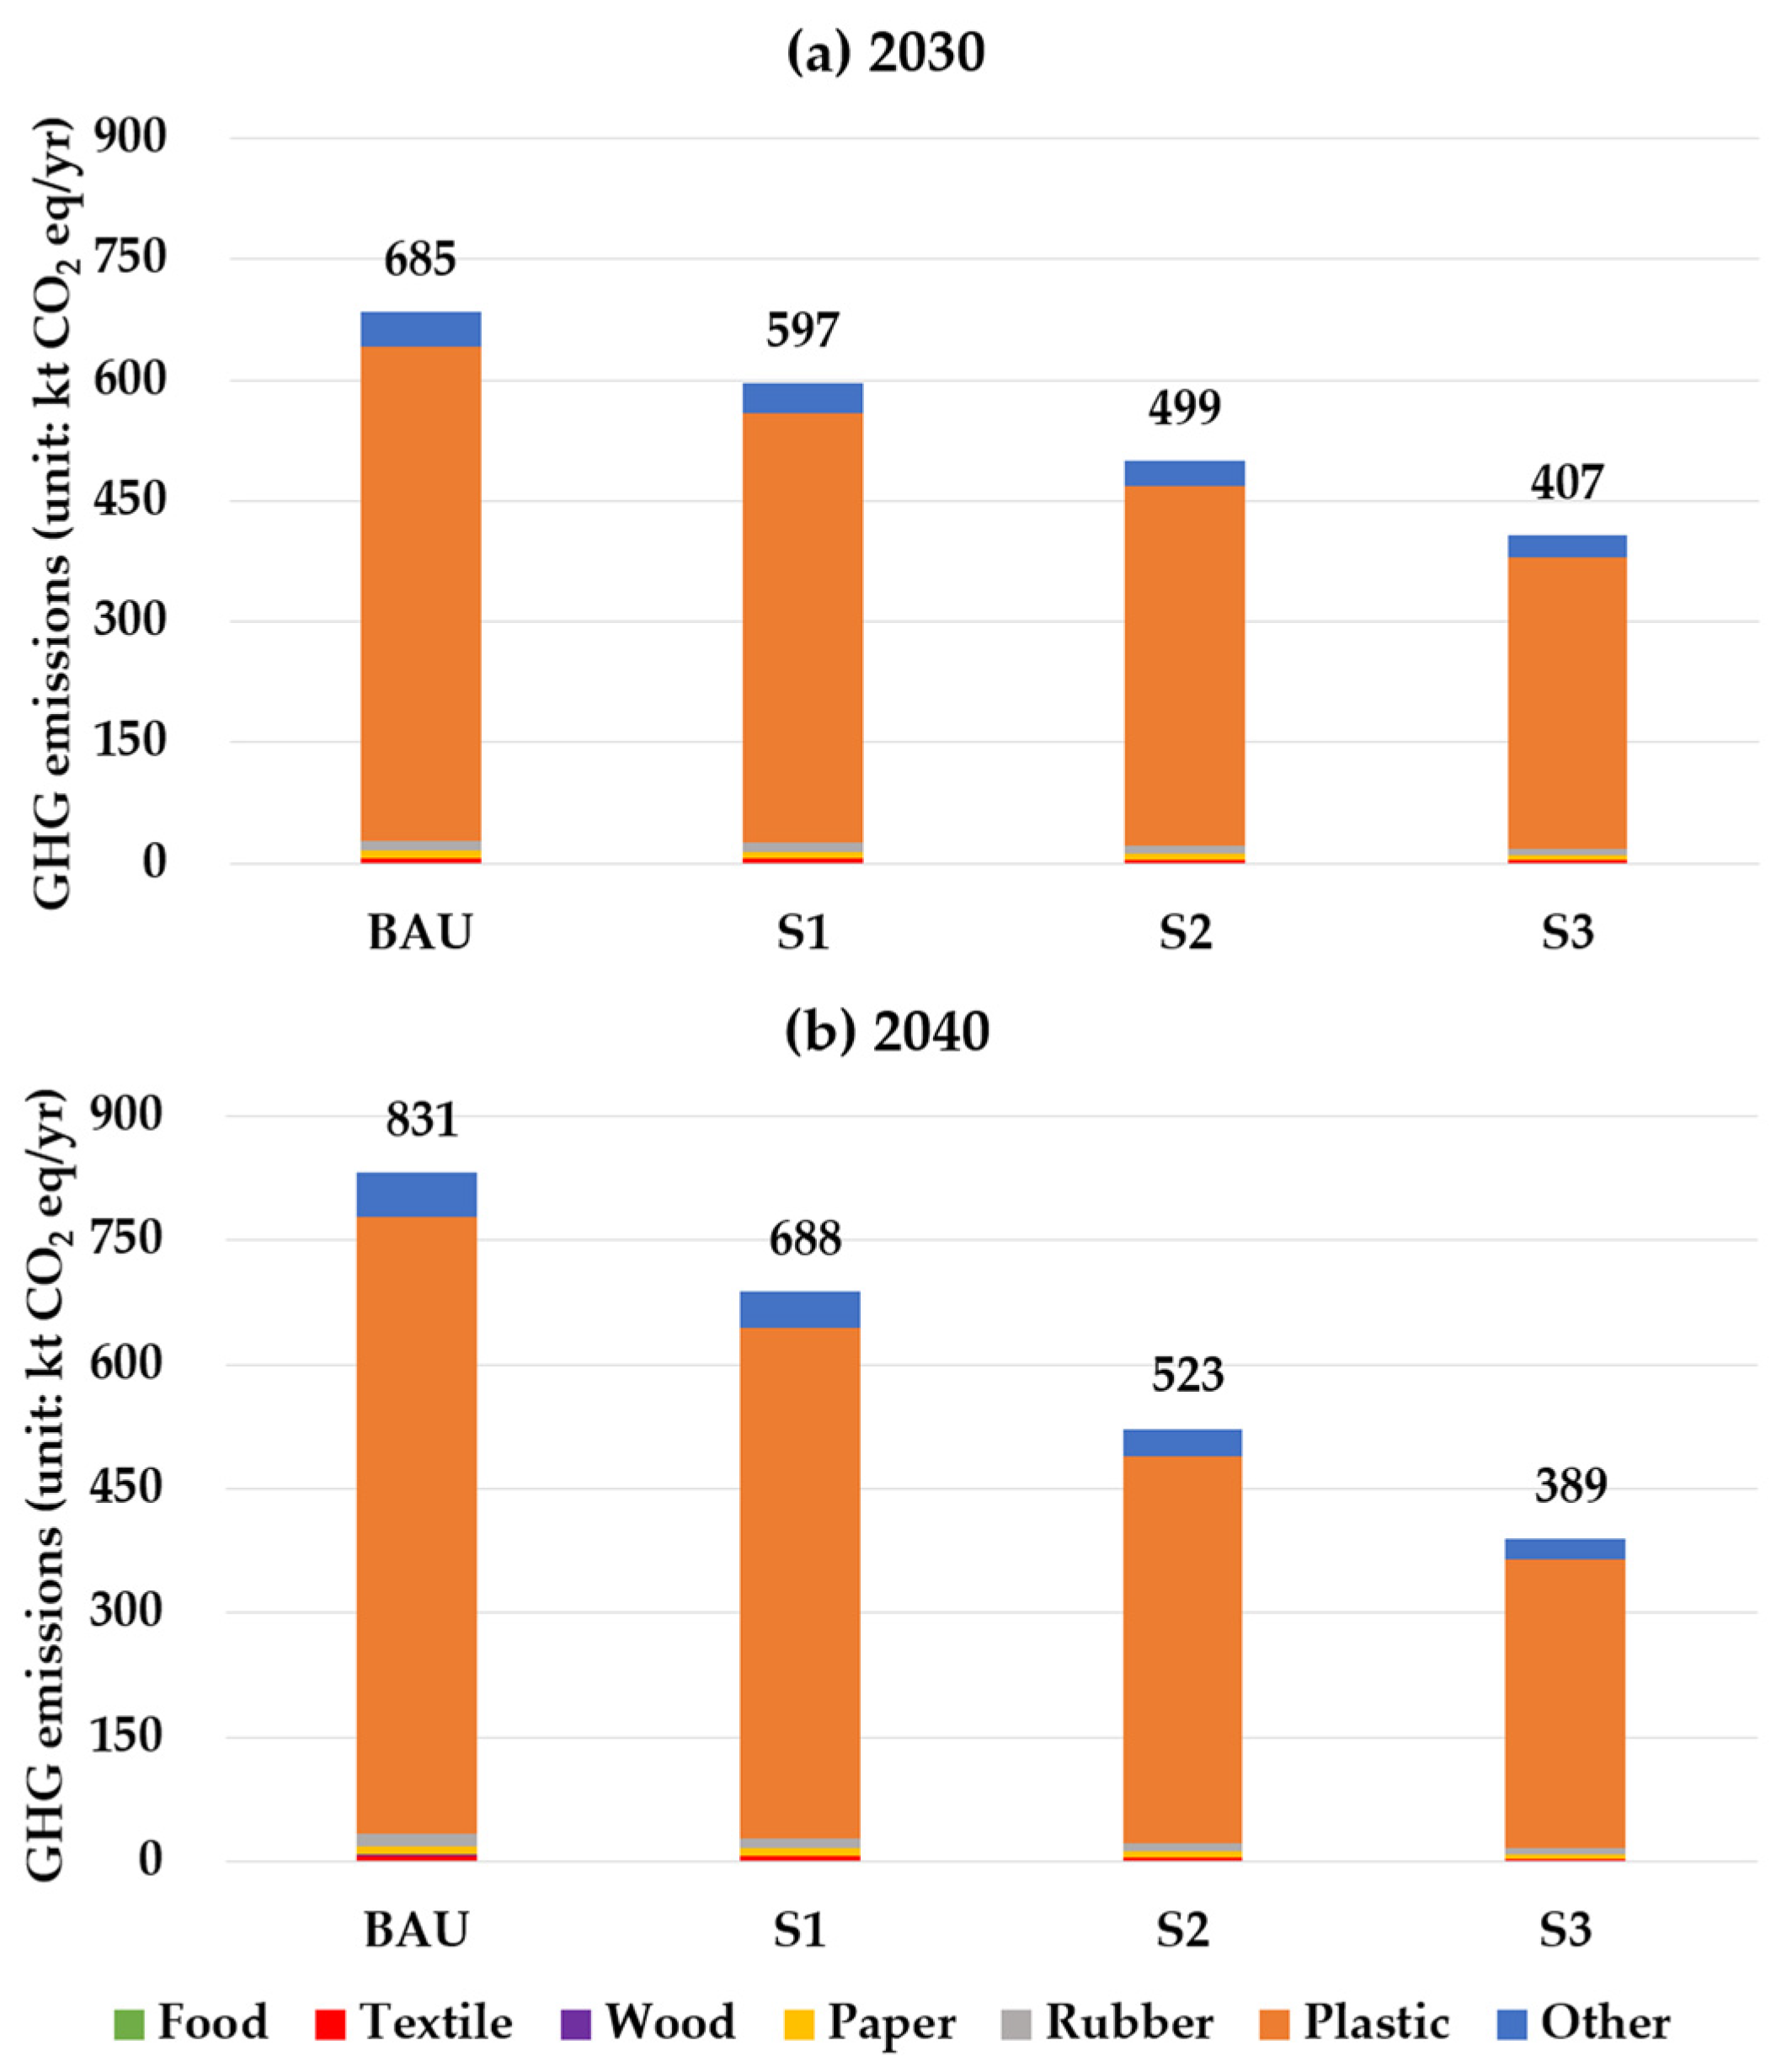
3.2. Predicted GHG Emissions from MSWI in 2030 and 2040

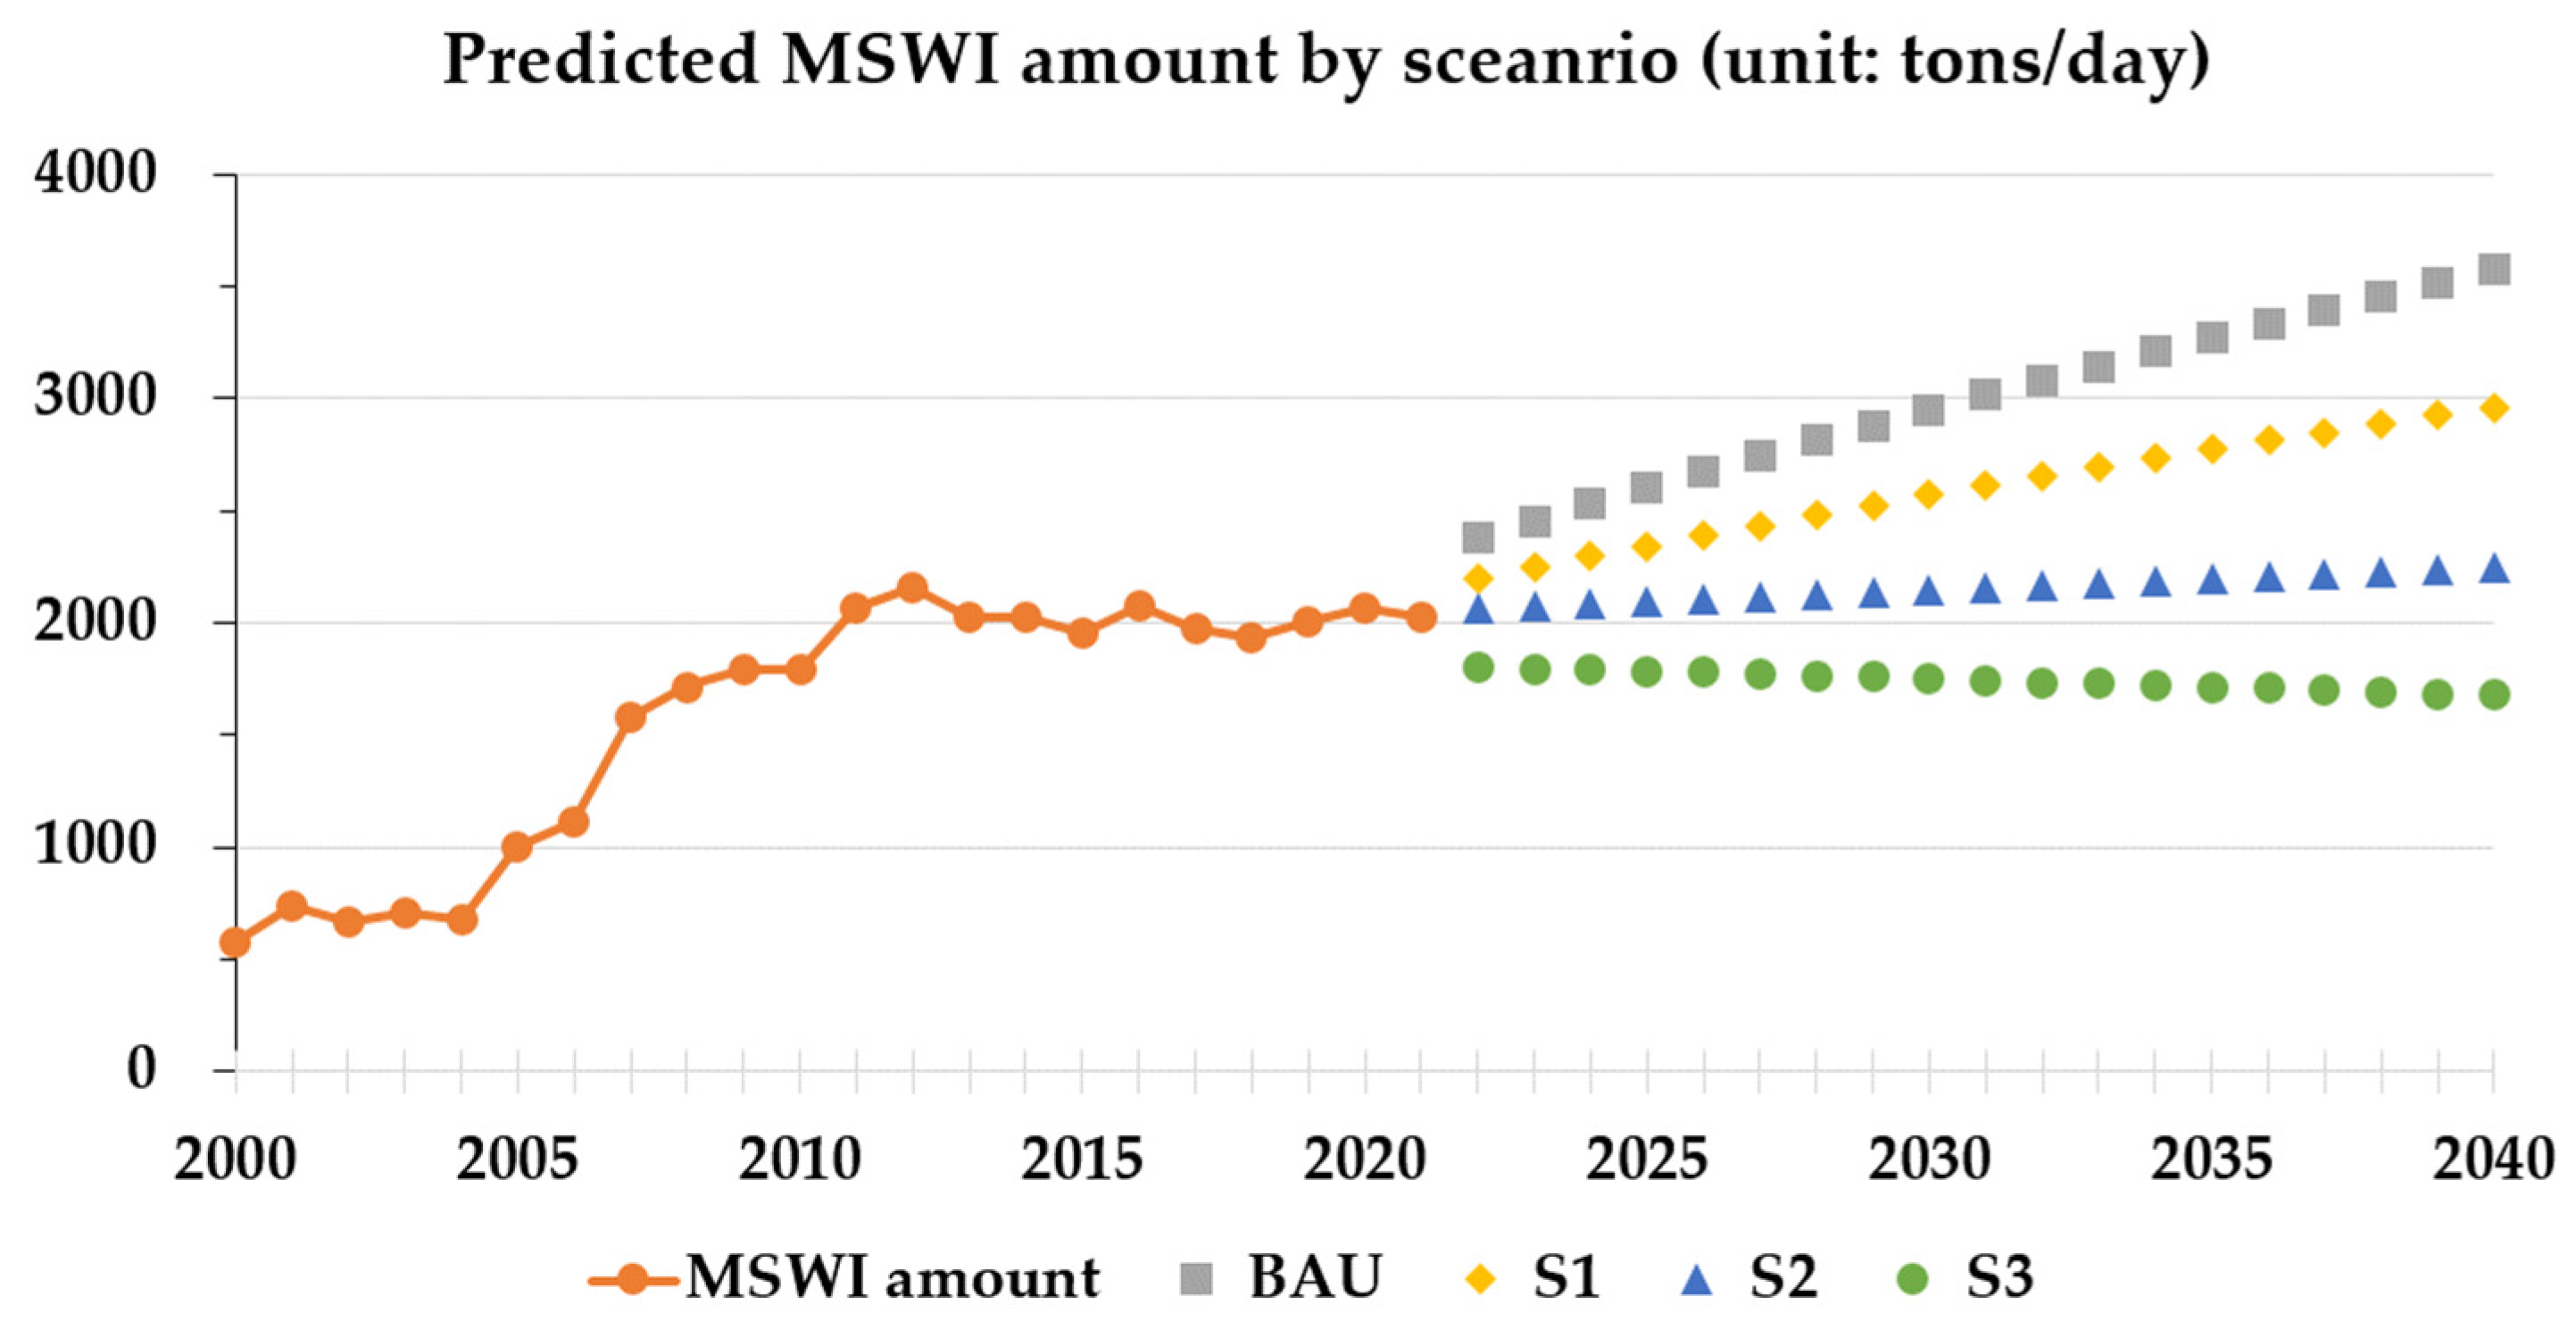
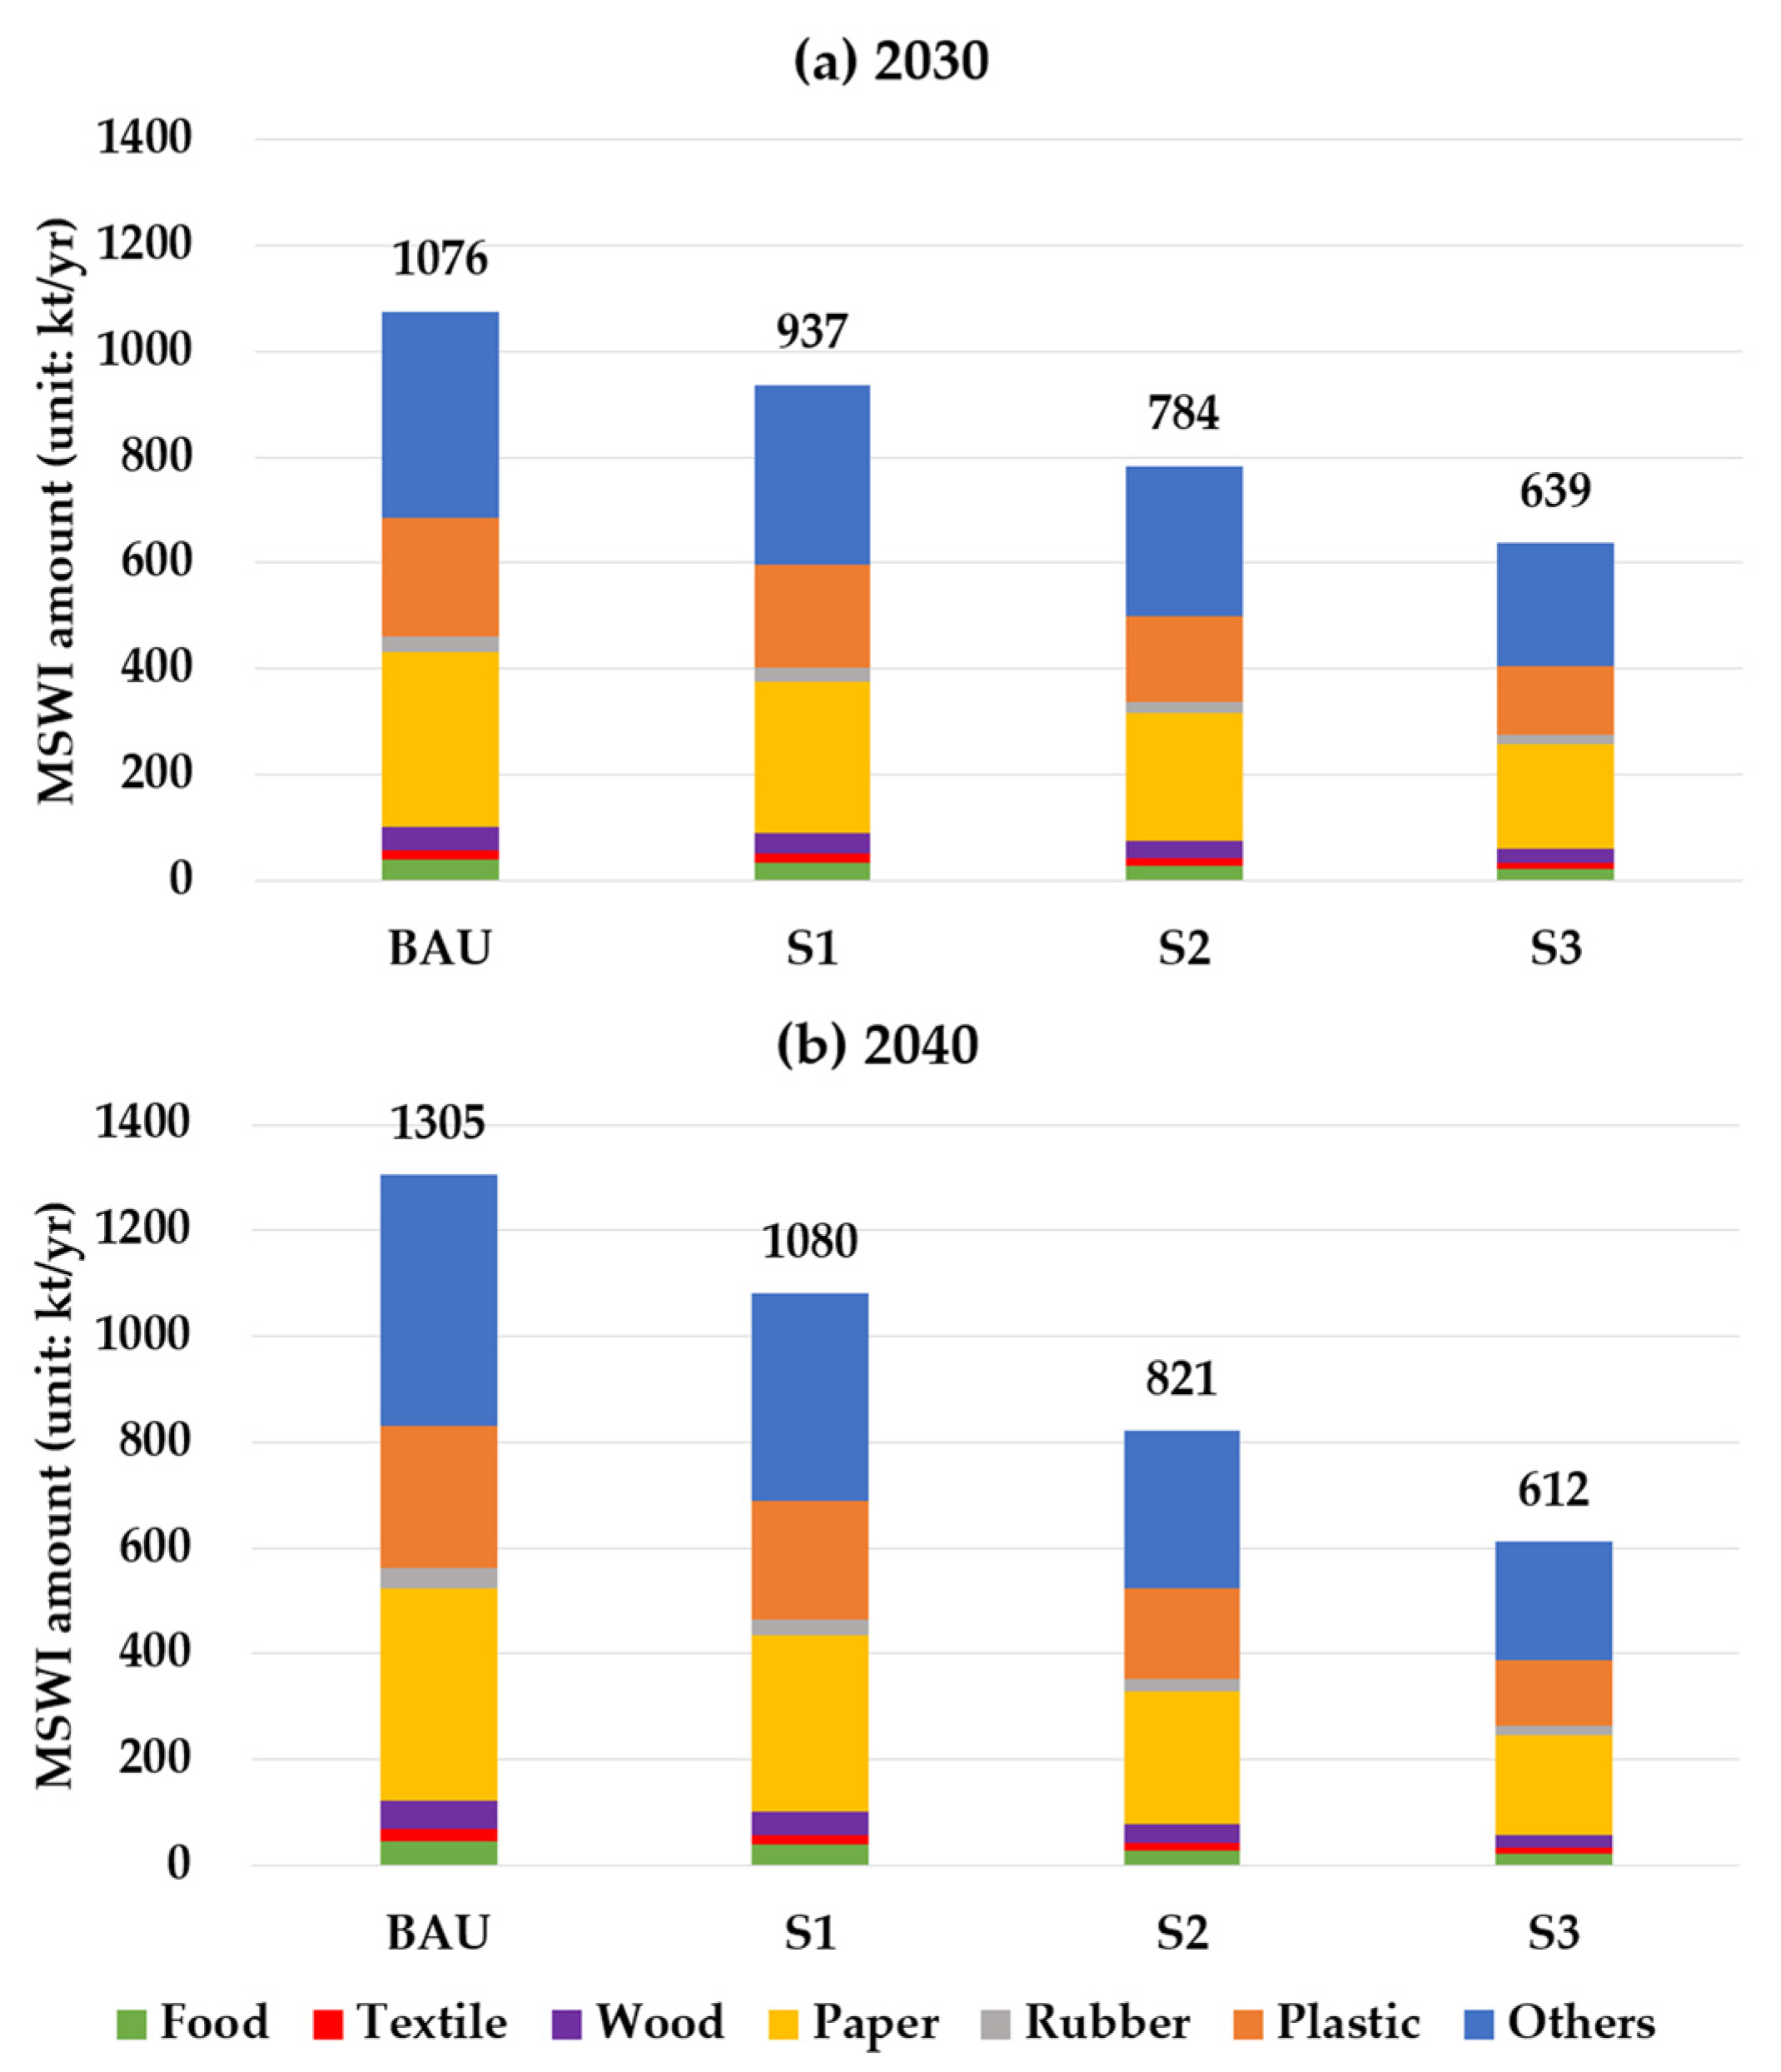
3.2.1. Predicted Amounts of MSWI by Scenario Analysis

Figure 3 presents the predicted amounts of MSWI between 2022 and 2040 by scenario. In 2021, Seoul disposed of 2030 tons/day of MSWI. Under the BAU scenario, the amounts of MSWI will continually increase by 2948 tons/day (45% increase over 2021) in 2030, and by 3575 tons/day (76% increase over 2021) in 2040. Unless any reduction in MSWI is implemented, the predicted amount of 2881 tons/day in 2029 will reach the treatment capacity of the four current MSW incinerators in Seoul (2865 tons/day). Under Scenario 1, it was estimated to be about 2568 tons/day in 2030 and 2960 tons/day in 2040. It was predicted to be 17% lower than that in the BAU scenario in 2040. The Scenario 2 analysis showed relatively constant trends in MSWI treatment reductions and GHG emissions. It was predicted to be approximately 2149 tons/day and 2249 tons/day in 2030 and 2040, respectively. Scenario 3 showed a slight decrease in MSWI. It was estimated to be 1750 tons/day in 2030 and 1676 tons/day in 2040. The amount of MSWI decreased only in the case of Scenario 3.

3.2.2. Predicted GHG Emissions by Scenario Analysis

Figure 4 shows the predicted amounts of MSWI in Seoul in 2030 and 2040, while Figure 5 presents the predicted GHG emissions from MSWI by years. The GHG emissions in the BAU scenario were calculated to be 685 kt CO2 eq/yr in 2030 and 831 kt CO2 eq/yr in 2040. According to the scenario analysis, the predicted GHG emissions in Scenario 1 were found to be 597 kt CO2 eq/yr in 2030 and 688 kt CO2 eq/yr in 2040. Under Scenario 2, the GHG emissions were calculated to be about 523 kt CO2 eq/yr in 2040, which is 37% lower than those of the BAU scenario in 2040. They were predicted to be about 407 kt CO2 eq/yr and 389 kt CO2 eq/yr in 2030 and 2040, respectively, according to Scenario 3. The emission rate in Scenario 3 in 2040 is 53% lower than that of the BAU scenario in 2040. This implies that the waste reduction in Scenario 3 could significantly affect the decrease in GHG emissions. If plastic waste materials in disposal waste streams are removed and separated for resource recovery by adopting pretreatment processes, such as material recovery facilities, then the GHG emissions from MSWI could be substantially decreased. According to Mitchell et al.’s study (2022), it was found that the amount of CO2 emitted by converting plastic waste treatment from incineration to recycling was reduced up to a GHG saving (or benefit) of 0.82 kg CO2 eq/kg per feedstock [35]. Sevigné-Itoiz et al. (2015) showed that increasing the waste recycling of plastics by 1 ton resulted in a reduction of 620 kg CO2 eq/ton, compared to the baseline scenario [36]. Reducing the amount of waste generated and increasing recycling have been shown to be effective at reducing GHG emissions. Moreover, it is important to reduce the amount of plastic waste in incoming waste streams in incineration facilities by separating it for recycling.

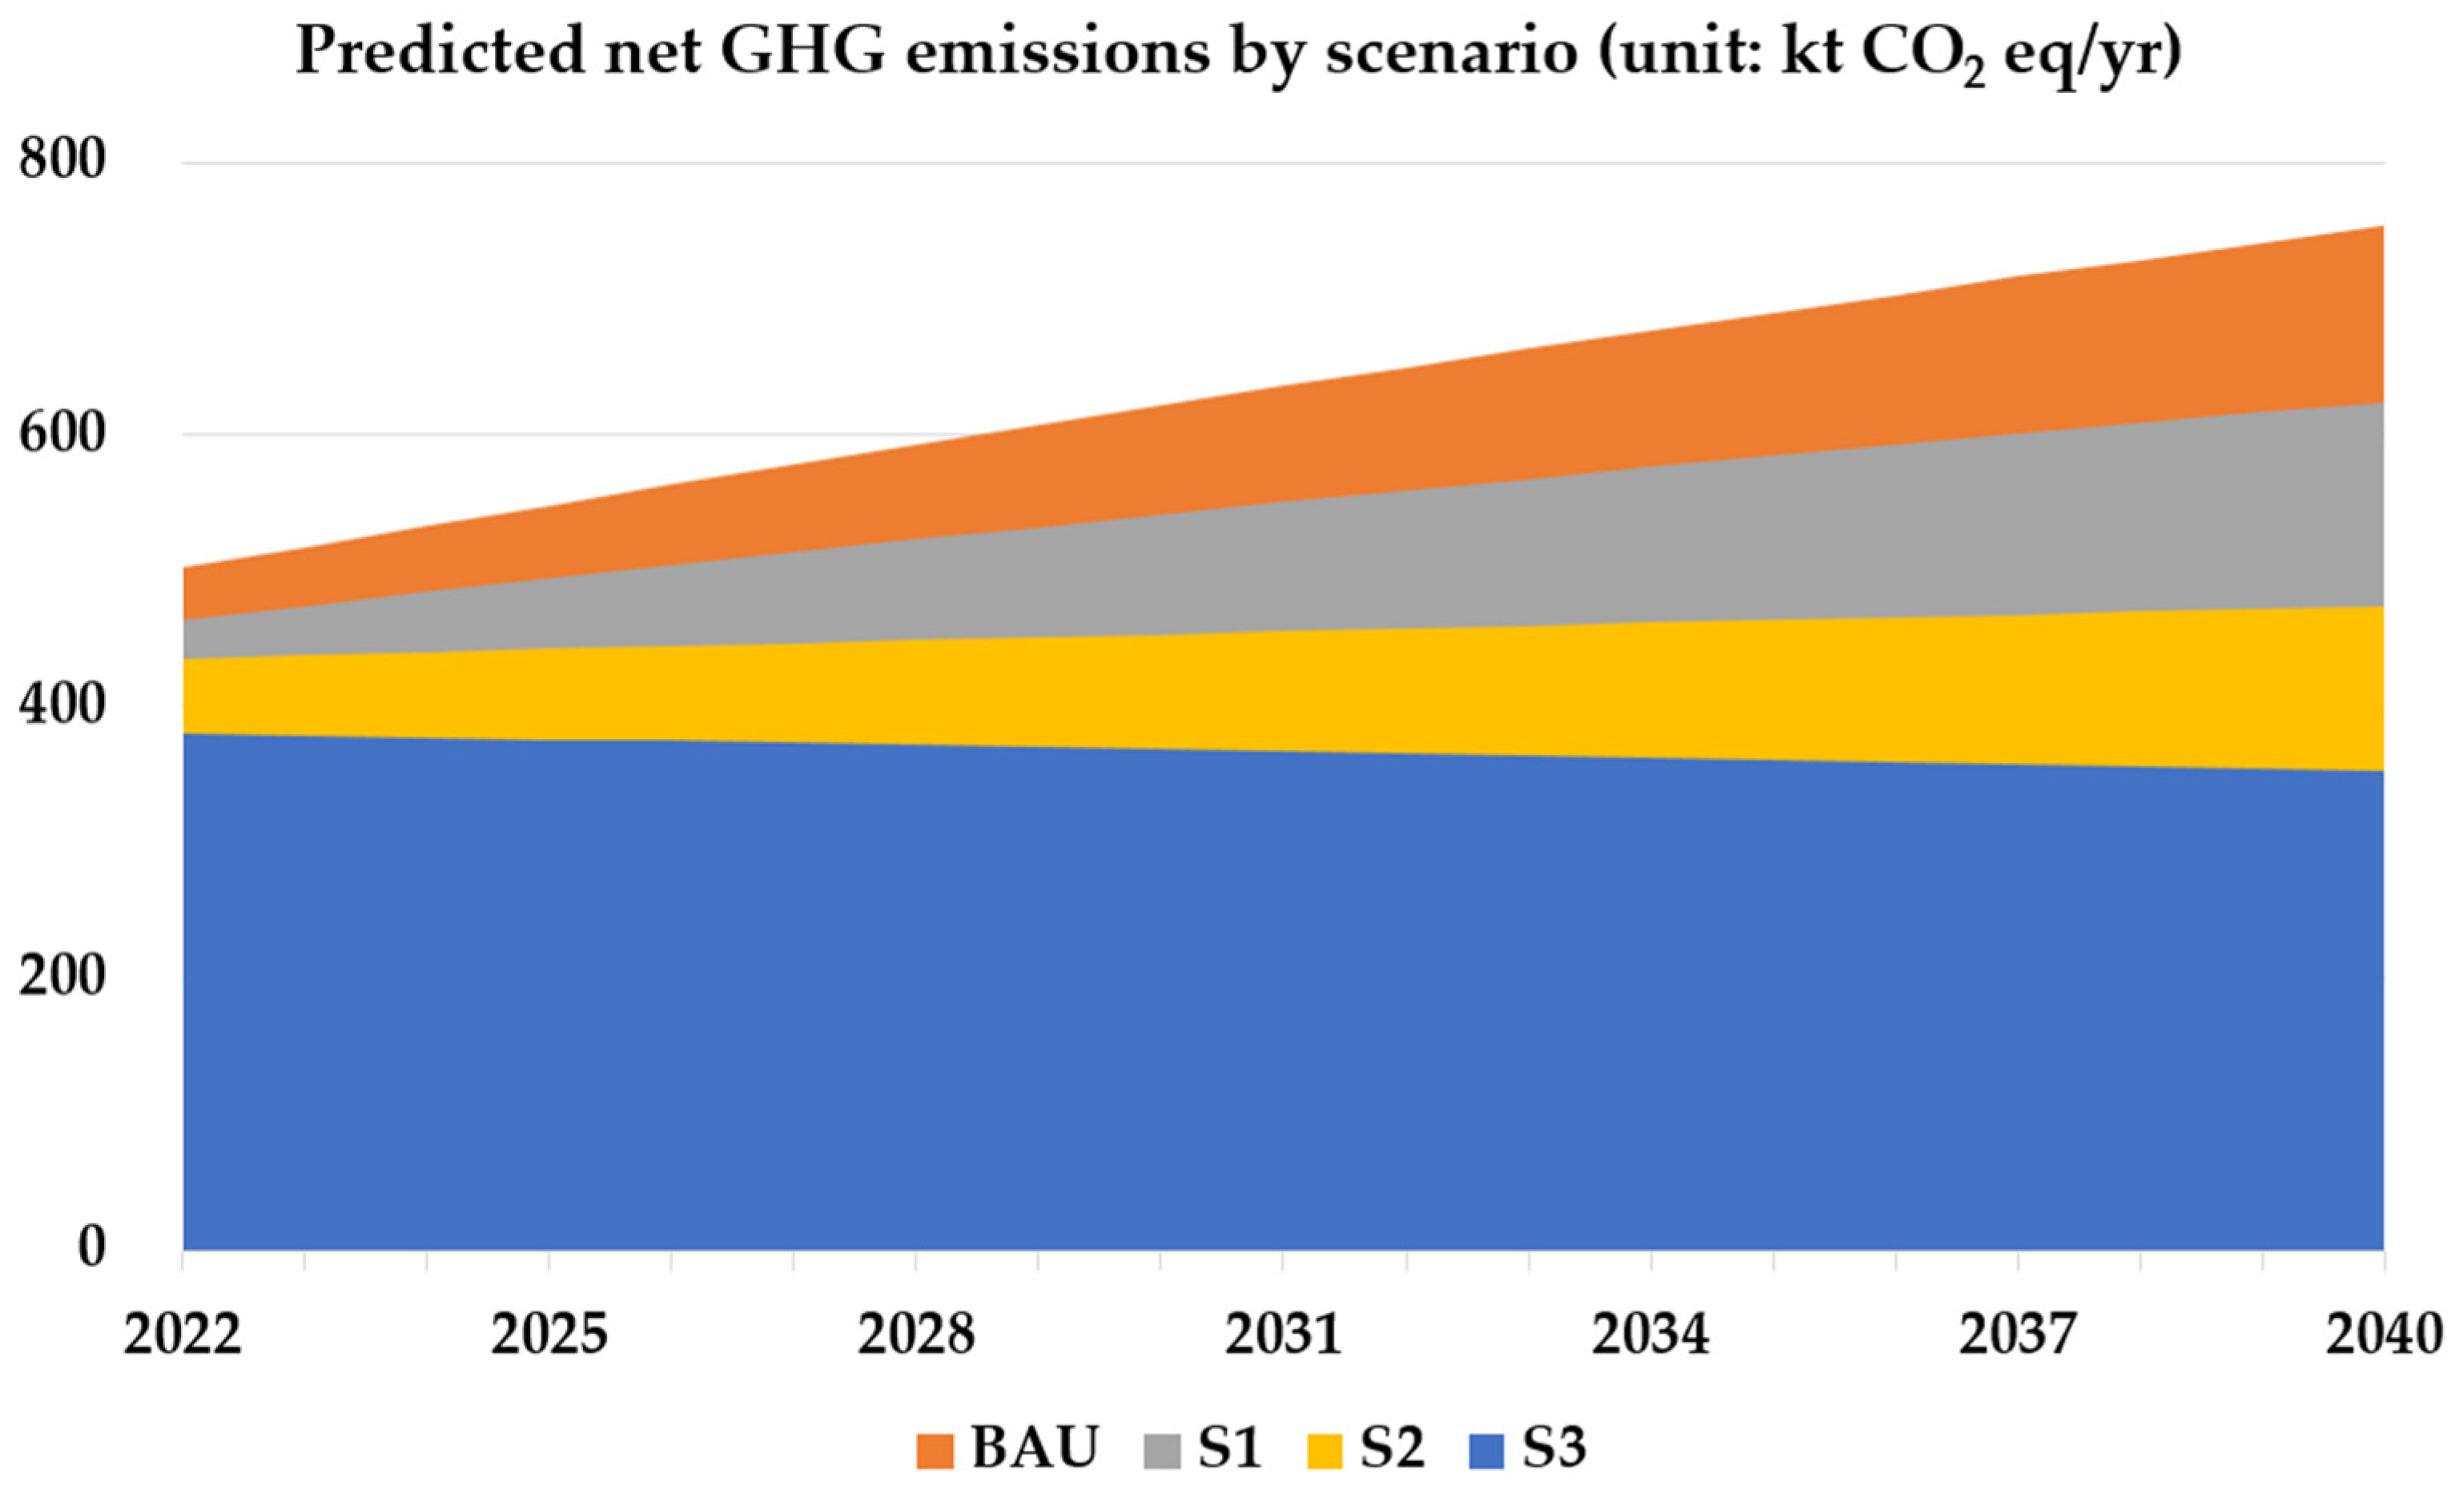
3.3. Predicted Net GHG Emissions from MSWI from 2005 to 2040

To calculate and predict the net GHG emissions from MSWI, operational data of the four incineration plant facilities in Seoul in 2022 were analyzed and are presented in Table 5 [22]. All four incinerators were operated by continuous stoker-type methods with an average 80% operation rate in 2022. The total capacity of the four incinerators (Gangnam, Nowon, Mapo, and Yangcheon) currently operated by the Seoul Metropolitan Government was 2850 tons/day. The Mapo and Yangcheon facilities employ steam turbines to generate electricity. The Gangnam and Nowon facilities do not have their own steam turbines, but the neighboring cogeneration plants do. The total electricity produced by the facilities was only 14.6% of the total electricity consumed by the four sites. There have been global efforts to develop and apply technology to recover energy generated by the incineration of waste. Denmark had already implemented a policy to recover waste incineration energy 100 years ago [37]. Materials that were able to be incinerated were prohibited from landfills, and waste-to-energy facilities are actively operated. According to the EU circular economy action plan, the landfilling of waste that could be recycled or recovered energy will be restricted after 2030. It also limits the landfilling of municipal solid waste to 10% after 2035 [38].
Figure 6 shows the net GHG emissions from MSWI between 2005 and 2021. The net GHG emissions at the four incineration facilities in Seoul were estimated by following Equation (4) in the methodology. GHG reduction can occur through waste heat recovery and electricity generation, by subtracting GHG emissions from incineration, LNG, and electricity (consumed). From 2005 to 2021, the observed and predicted GHG emissions from MSWI were higher than the GHG reductions. Thus, all net GHG emissions showed positive values. Net GHG emissions increased by about 2.9 times, from about 174 kt CO2 eq/yr in 2005 to about 499 kt CO2 eq/yr in 2021. Since 2005, net GHG emissions have shown an increasing trend. Especially, it was found that they increased rapidly between 2019 and 2020. This was estimated to be due to an increase in GHG emissions from incineration in 2020. The generation of plastic and paper wastes, which had a significant impact on GHG emissions, increased 1.36 times and 1.06 times, respectively. In addition, wood was also estimated to increase 1.13 times, increasing the GHG emissions.
The net GHG emissions between 2022 and 2040 by scenario analysis were calculated using the difference between the annual MSWI GHG emissions and reductions (Figure 7). The net GHG emissions for all scenarios were positive values because the GHG emissions were greater than the reductions. For the BAU scenario, the predicted emissions were found to be 621 kt CO2 eq/yr in 2030 and 753 kt CO2 eq/yr in 2040. Scenario 1 showed lower GHG emissions (541 kt CO2 eq/yr in 2030 and 623 kt CO2 eq/yr in 2040) than those of the BAU scenario. The GHG emissions tended to increase 1.25 times for 2040, compared to 2021. Scenario 2 showed a slight increase in emissions to 452 kt CO2 eq/yr in 2030 and 474 kt CO2 eq/yr in 2040. There was about a 5% decrease in emissions for 2040 compared to 2021. The net GHG emissions in Scenario 3 showed a decreasing trend to 369 kt CO2 eq/yr in 2030 and 353 kt CO2 eq/yr in 2040. Compared to 2021, the GHG emissions for 2040 decreased by 29%. Reducing the generation of MSWI can have a significant impact on GHG emission reduction. According to Park (2022), if 70% of the plastic waste entering the incineration facility is separated, then annual GHG emissions can be reduced by 26% [31].
Wang et al. (2020) calculated the net GHG emissions of incinerating waste in a fluidized-bed incinerator under two different scenarios. According to the study, the net GHG emissions of incinerating the waste were 416 kt CO2 eq/yr without further treatment. After screening and separating the non-combustible waste, the energy efficiency of the fluidized-bed incinerator was improved. This resulted in net GHG emissions of 277 kt CO2 eq/yr, which was 66.6% less than the net GHG emissions without separation [39]. Fluidized-bed incinerators are known to show better thermal efficiency than stoker incinerators by promoting uniform mixing and heat transfer [40,41]. Due to these features, GHG emissions from fluidized-bed incinerators are estimated to be less than those from stoker incinerators. According to a study by Kristanto et al. (2019), the net GHG emissions from MSWI in Depok, Indonesia, were found to be 83~86 kt CO2 eq/yr. The MSW in Depok, Indonesia, was mostly food waste, which accounted for 73% of the total. This was followed by paper (7%) and plastic (4%) [42]. Despite using the same stoker-type incinerator as those in Seoul, the different components of the waste resulted in lower net GHG emissions. The present study in Korea showed higher fractions of paper and plastics (around 56.4% of the total waste), resulting in high contributions of GHG emissions. This implies that even with the same type of incinerator, different compositions of waste materials can have a significant impact on GHG emissions.

4. Conclusions

In this study, we calculated the GHG emissions from 2000 to 2021 by focusing on the amount of disposal waste (or non-recyclables) in MSW treated by incineration in Seoul. In addition, future GHG emissions from MSWI were estimated for 2030 and 2040. The trend of GHG by incineration has continued to increase over time. The GHG emissions in 2021 were more than 7.3 times higher than those in 2000. The increase in GHG emissions is largely due to an increase in the amount of MSWI, especially plastic waste. Plastic waste consisted of 25% of MSWI, but the GHG emissions accounted for 92% of the total. Based on the scenario analysis, Scenarios 1, 2, and 3 showed a decreasing trend in MSWI and GHG emissions compared to the BAU scenario. As a result of assuming and calculating the reduction rate of disposable waste in MSW and the ratio of recycling and incineration, Scenario 3 showed the largest reduction rate. For 2040, the amount of MSWI was 1676 tons/day, and GHG emissions were 389 kt CO2 eq/yr, all of which decreased by 53% compared to the BAU scenario. This might be attributed to reducing MSW generation and increasing recycling rates, resulting in reduced GHG emissions. Net GHG emissions from MSWI have been increasing since 2005, with an increase of 2.9 times in 2021 compared to 2005. All scenarios’ net GHG emissions showed positive values, as the GHG emissions were greater than the GHG reductions. The BAU scenario and Scenario 1 showed a continuous increase in net GHG emissions until 2040. Scenario 2 and Scenario 3, which reduced the MSW generation and increased the recycling rate, showed a decrease compared to 2021. Especially, Scenario 3 showed only a decreasing trend, and a 29% net GHG emission decrease in 2040 compared to 2021.
In order to reduce GHG emissions from MSWI, the first viable option is to reduce the MSW generation by households by implementing more strengthened measures (e.g., disposal fee increase, incentives for consumers to reuse). The second option is to establish material recovery facilities for resource recovery by diverting the waste from landfilling and incineration. During the recovery processes, plastic materials and other recyclable materials can be recovered for recycling. In the long term, GHG emissions could be reduced if CO2 from incineration is captured through CCUS (Carbon Capture Utilization and Storage) technology in the future, along with technical developments.
The limitations of this study include the uncertainty of the five mathematical models for predicting MSWI. The models’ predicted future MSWI trends are based on the average values from previous generation rates. Thus, the actual MSWI could be different from the predicted amounts, depending on the waste management policy. Second, the results of the scenario analysis with the assumptions (e.g., source reduction, recycling rates) could be different from actual MSW management practices in the future. Third, GHG emission factors from MSWI with IPCC guidelines can be modified by developing national-specific emission factors when calculating GHG emissions from MSWI.
It is expected that Seoul’s MSWI will increase over the next few years. In particular, increased plastic consumption in households may be inevitable, resulting in an increase in GHG emissions by incineration if plastics are not reduced and recycled [43,44]. Thus, it is urgent for actions and measures to reduce the plastic waste in MSWI in Seoul by considering the adoption of a landfill ban policy by 2026. The results of this study can be used as climate change mitigation measures and responses for reducing GHG emissions from waste sectors in Seoul and other megacities in many countries.

Author Contributions

Conceptualization, methodology, and study plan, Y.-C.J. and K.C.; methodology and results, Y.K.; data organization and writing—original draft preparation, Y.K.; writing—review and editing, Y.-C.J. and K.C. All authors have read and agreed to the published version of the manuscript.

Funding

This research received no external funding.

Data Availability Statement

Not applicable.

Acknowledgments

This work was financially supported by the Korea Ministry of Environment (Korea MOE) as the Waste-to-Energy Human Resource Development Project.

Conflicts of Interest

The authors declare no conflict of interest.

References

  1. Intergovernmental Panel on Climate Change (IPCC). Good Practice Guidance and Uncertainty Management in National Greenhouse Gas Inventories; IPCC: Geneva, Switzerland, 2001; Chapter 5; p. 5.25. [Google Scholar]
  2. Pablo, E.E.-G.; Raúl, H.C.-L.; Carrasco-Hernández, R.; Emmanuel, F.-R.; Jesús, M.L.-H. Technical and economic analysis of energy generation from waste incineration in Mexico. Energy Strat. Rev. 2020, 31, 100542. [Google Scholar] [CrossRef]
  3. Hwang, K.-L.; Choi, S.-M.; Kim, M.-K.; Heo, J.-B.; Zoh, K.-D. Emission of greenhouse gases from waste incineration in Korea. J. Environ. Manag. 2017, 196, 710–718. [Google Scholar] [CrossRef] [PubMed]
  4. Intergovernmental Panel on Climate Change (IPCC). 2006 IPCC Guidelines for National Greenhouse Gas Inventories, Prepared by the National Greenhouse Gas Inventories Programme; Eggleston, H.S., Buendia, L., Miwa, K., Ngara, T., Tanabe, K., Eds.; IGES: Kanagawa, Japan, 2006; Volume 5. [Google Scholar]
  5. Kweku, D.W.; Bismark, O.; Maxwell, A.; Desmond, K.A.; Danso, K.B.; Oti-Mensah, E.A.; Quachie, A.T.; Adormaa, B.B. Greenhouse Effect: Greenhouse Gases and Their Impact on Global Warming. J. Sci. Res. Rep. 2018, 17, 1–9. [Google Scholar] [CrossRef]
  6. United Nations Environment Programme (UNEP). Emissions Gap Report 2022; UNEP: New York, NY, USA, 2022; p. XII. ISBN 978-92-807-3979-4. [Google Scholar]
  7. Yang, N.; Zhang, H.; Chen, M.; Shao, L.-M.; He, P.-J. Greenhouse gas emissions from MSW incineration in China: Impacts of waste characteristics and energy recovery. Waste Manag. 2012, 32, 2552–2560. [Google Scholar] [CrossRef] [PubMed]
  8. Yao, X.; Guo, Z.; Liu, Y.; Li, J.; Feng, W.; Lei, H.; Gao, Y. Reduction potential of GHG emissions from municipal solid waste incineration for power generation in Beijing. J. Clean. Prod. 2019, 241, 118283. [Google Scholar] [CrossRef]
  9. Kadir, S.A.S.A.; Yin, C.-Y.; Sulaiman, M.R.; Chen, X.; El-Harbawi, M. Incineration of municipal solid waste in Malaysia: Salient issues, policies and waste-to-energy initiatives. Renew. Sustain. Energy Rev. 2013, 24, 181–186. [Google Scholar] [CrossRef] [Green Version]
  10. Yaman, C.; Anil, I.; Alagha, O. Potential for greenhouse gas reduction and energy recovery from MSW through different waste management technologies. J. Clean. Prod. 2020, 264, 121432. [Google Scholar] [CrossRef]
  11. Lino, F.A.M.; Ismail, K.A.R. Incineration and recycling for MSW treatment: Case study of Campinas, Brazil. Sustain. Cities Soc. 2017, 35, 752–757. [Google Scholar] [CrossRef]
  12. Zhao, Y.; Xing, W.; Lu, W.; Zhang, X.; Christensen, T.H. Environmental impact assessment of the incineration of municipal solid waste with auxiliary coal in China. Waste Manag. 2012, 32, 1989–1998. [Google Scholar] [CrossRef] [PubMed]
  13. Korea Ministry of Environment (Korea MOE). Annual Statistics of Waste Generation and Treatment (2000–2021); Korea Ministry of Environment (Korea MOE): Sejong, Republic of Korea, 2023. (In Korean) [Google Scholar]
  14. Korea Ministry of Environment (Korea MOE). National Greenhouse Gas Statistics (1990~2020); Korea Ministry of Environment (Korea MOE): Sejong, Republic of Korea, 2023. (In Korean) [Google Scholar]
  15. Kang, S.; Roh, J.; Cho, C.; Lee, H.S.; Jeon, E.-C. Analysis of Factors for Emission Change in the Waste Incineration Sector caused by Change of Guidance in the Greenhouse Gas Emissions Estimate Method. J. Clim. Chang. Res. 2019, 10, 35–46. [Google Scholar] [CrossRef]
  16. Kwon, Y.; Chang, Y.; Jang, Y.-C. Estimation of Greenhouse Gas Reduction by Resource and Energy Recovery of Municipal Solid Waste (MSW). J. Korea Soc. Waste Manag. 2018, 35, 525–532. [Google Scholar] [CrossRef]
  17. Park, S.; Choi, J.-H.; Park, J. The estimation of N2O emissions from municipal solid waste incineration facilities: The Korea case. Waste Manag. 2011, 31, 1765–1771. [Google Scholar] [CrossRef] [PubMed]
  18. Kim, S.; Kang, S.; Lee, J.; Lee, S.; Kim, K.-H.; Jeon, E.-C. The comparison of fossil carbon fraction and greenhouse gas emissions through an analysis of exhaust gases from urban solid waste incineration facilities. J. Air Waste Manag. Assoc. 2016, 66, 978–987. [Google Scholar] [CrossRef] [PubMed] [Green Version]
  19. Hathout, D. Modeling Population Growth: Exponential and Hyperbolic Modeling. Appl. Math. 2013, 4, 299–304. [Google Scholar] [CrossRef] [Green Version]
  20. Yu, Y.; Du, Y. Impact of technological innovation on CO2 emissions and emissions trend prediction on ‘New Normal’ economy in China. Atmos. Pollut. Res. 2019, 10, 152–161. [Google Scholar] [CrossRef]
  21. Moharir, S.; Bondre, A.; Vaidya, S.; Patankar, P.; Kanaskar, Y.; Karne, H. Comparative Analysis of the Amount of Biogas Produced by Different Cultures using the Modified Gompertz Model and Logistic Model. Eur. J. Sustain. Dev. Res. 2020, 4, em0141. [Google Scholar] [CrossRef]
  22. Seoul Metropolitan Government. Resource Recovery Facility Operation Status. Available online: https://rrf.seoul.go.kr/content/bcreb228.do (accessed on 29 April 2023).
  23. Korea Environment Corporation (KECO). Greenhouse Gas Emission and Energy Consumption in Waste Sector Calculation Tool (Ver. 2.44 (2016.02.23)); Korea Environment Corporation (KECO): Incheon, Republic of Korea, 2023. (In Korean) [Google Scholar]
  24. Korea Ministry of Environment (Korea MOE). 2030 National Greenhouse Gas Reduction Targets(NDC); Korea Ministry of Environment (Korea MOE): Sejong, Republic of Korea, 2021. (In Korean) [Google Scholar]
  25. Korea Ministry of Environment (Korea MOE). Disposable Bag Waste to Be Banned from Direct Landfills in the Capital Region Starting in 2026; Korea Ministry of Environment (Korea MOE): Sejong, Republic of Korea, 2021. (In Korean) [Google Scholar]
  26. National Institute of Environment Research. A Study on Setting Greenhouse Gas Reduction Target by Recycling Waste (III); National Institute of Environment Research: Incheon, Republic of Korea, 2012. [Google Scholar] [CrossRef]
  27. Korea Ministry of Environment (Korea MOE). National Carbon Emission Factor; Korea Ministry of Environment (Korea MOE): Sejong, Republic of Korea, 2022. (In Korean) [Google Scholar]
  28. Japan Ministry of Environment (Japan MOE). Waste Management in Japan; Japan Ministry of Environment (Japan MOE): Tokyo, Japan, 2020. (In Japanese) [Google Scholar]
  29. Korea Ministry of Environment (Korea MOE). Direct Landfill Ban on Food Waste Since 2005; Korea Ministry of Environment (Korea MOE): Sejong, Republic of Korea, 2004. (In Korean) [Google Scholar]
  30. United States Environmental Protection Agency (US EPA). Greenhouse Gas Inventory Guidance: Direct Emissions from Stationary Combustion Sources. Available online: https://www.epa.gov/sites/default/files/2020-12/documents/stationaryemissions.pdf (accessed on 29 April 2023).
  31. Park, S.-W. Diagnosis and Improvement Strategies of Greenhouse Gases Reduction Policies in the Waste Sector of Seoul; Seoul Institute of Technology: Seoul, Republic of Korea, 2022; ISBN 979-11-92456-51-5. [Google Scholar]
  32. Walker, S.; Rothman, R. Life cycle assessment of bio-based and fossil-based plastic: A review. J. Clean. Prod. 2020, 261, 121158. [Google Scholar] [CrossRef]
  33. Liao, N.; Bolyard, S.C.; Lü, F.; Yang, N.; Zhang, H.; Shao, L.; He, P. Can waste management system be a Greenhouse Gas sink? Perspective from Shanghai, China. Resour. Conserv. Recycl. 2022, 180, 106170. [Google Scholar] [CrossRef]
  34. Organization for Economic Co-Operation and Development (OECD). Global Plastics Outlook: Policy Scenarios to 2060; OECD: Paris, France, 2022; ISBN 978-92-64-89881-3. [Google Scholar] [CrossRef]
  35. van der Hulst, M.K.; Ottenbros, A.B.; van der Drift, B.; Špela, F.; van Harmelen, T.; Schwarz, A.E.; Worrell, E.; van Zelm, R.; Huijbregts, M.A.; Hauck, M. Greenhouse gas benefits from direct chemical recycling of mixed plastic waste. Resour. Conserv. Recycl. 2022, 186, 106582. [Google Scholar] [CrossRef]
  36. Sevigné-Itoiz, E.; Gasol, C.M.; Rieradevall, J.; Gabarrell, X. Contribution of plastic waste recovery to greenhouse gas (GHG) savings in Spain. Waste Manag. 2015, 46, 557–567. [Google Scholar] [CrossRef] [Green Version]
  37. Heron, K.; Søren, D. 100 Years of Waste Incineration in Denmark. Available online: https://ramboll.com/-/media/files/rgr/documents/markets/energy/waste-to-energy/100-years-of-waste-incineration-in-denmark.pdf?la=en (accessed on 29 April 2023).
  38. European Commission. A New Circular Economy Action Plan for a Cleaner and More Competitive Europe. Available online: https://environment.ec.europa.eu/topics/waste-and-recycling/landfill-waste_en (accessed on 29 April 2023).
  39. Wang, K.; Nakakubo, T. Comparative assessment of waste disposal systems and technologies with regard to greenhouse gas emissions: A case study of municipal solid waste treatment options in China. J. Clean. Prod. 2020, 260, 120827. [Google Scholar] [CrossRef]
  40. Su, X.; Zhang, L.; Xiao, Y.; Sun, M.; Gao, X.; Su, J. Evaluation of a flue gas cleaning system of a circulating fluidized bed incineration power plant by the analysis of pollutant emissions. Powder Technol. 2015, 286, 9–15. [Google Scholar] [CrossRef]
  41. Vukovic, N.; Makogon, E. Waste-to-Energy Generation: Complex Efficiency Analysis of Modern Technologies. Sustainability 2022, 14, 13814. [Google Scholar] [CrossRef]
  42. Kristanto, G.A.; Koven, W. Estimating greenhouse gas emissions from municipal solid waste management in Depok, Indonesia. City Environ. Interact. 2019, 4, 100027. [Google Scholar] [CrossRef]
  43. Korea Greenpeace and Chungnam National University. 2023 Plastic Korea 2.0. 2023. Available online: https://www.greenpeace.org/korea/update/25774/report-disposable-korea-ver2/ (accessed on 25 May 2023). (In Korean).
  44. Chen, Y.; Awasthi, A.K.; Wei, F.; Tan, Q.; Li, J. Single-use plastics: Production, usage, disposal, and adverse impacts. Sci. Total Environ. 2021, 752, 141772. [Google Scholar] [CrossRef]
Figure 1. Waste generation and flow of MSW in Seoul in 2021 (unit: kt/yr or %).
Energies 16 04791 g001
Figure 2. Amounts of MSWI (above) and trends of GHG emissions (below) in Seoul between 2000 and 2021.
Energies 16 04791 g002
Figure 3. Predicted amounts of MSWI in Seoul by 2040 by scenario analysis.
Energies 16 04791 g003
Figure 4. Estimated amount of MSWI in Seoul in 2030 (a) and 2040 (b).
Energies 16 04791 g004
Figure 5. Predicted GHG emissions from MSWI in Seoul in 2030 (a) and 2040 (b).
Energies 16 04791 g005
Figure 6. Net GHG emission trends from MSWI in Seoul between 2005 and 2021.
Energies 16 04791 g006
Figure 7. Predicted net GHG emissions from MSWI by scenario analysis.
Energies 16 04791 g007
Table 1. Data collection of MSW generation and treatment.
CategoryYear of DataReferences
National generation amount of
waste disposal bags in MSW in Seoul
(non-recyclables)
2000~2021Korea MOE, 2000~2021 [13]
National treatment statistics of
waste disposal bags in MSW in Seoul
(landfill and incineration)
2000~2021Korea MOE, 2000~2021 [13]
Operational data on MSW
incineration facilities in Seoul
2005~2022Seoul Metropolitan Government, 2005~2022 [22]
Table 2. Emission factors and parameters for combustible waste components.
TypeDry Mass
(dm)
Carbon Fraction
(CF)
Fossil
Carbon Fraction
(FCF)
Oxidation Factor
(OF)
Emission Factor (EF)
CO2
(t CO2/
t Waste)
CH4
(kg CH4/
t Waste)
N2O
(g N2O/
t Waste)
Food0.400.380.001.00.00000.000239.8
Textile0.800.500.200.2931
Wood0.850.500.000.0000
Paper0.900.460.010.0152
Rubber0.840.670.200.4124
Plastic1.000.751.002.7480
Other0.900.031.000.0989
Table 3. Major assumptions in each scenario analysis in this study.
CategoryAssumptions for Scenario
Business-as-usual (BAU) scenarioNo landfilling of disposable (non-recyclable) waste after 2026
Assumptions
for S1~S3
  • No landfilling of disposable (non-recyclable) waste after 2026;
  • Reduce MSW generation by 2040 compared to 2021;
  • Disposable waste treated by either incineration or recycling.
CategoryScenario 1
(S1)
Scenario 2
(S2)
Scenario 3
(S3)
(Assumption 2) Target reduction rate of
disposable waste in MSW by 2040
10%20%30%
(Assumption 3) Ratio of
recycling and
incineration
Recycling0%50%100%
Incineration100%50%0%
Table 4. The emission factors of power generation, power consumption, and LNG.
CategoryEmission FactorUnitReference
Power generation0.4403t CO2 eq/MWhKorea MOE (2022) [27]
Power consumption0.4747t CO2 eq/MWh
LNG15.236t C/TJ
Table 5. Operational results of four MSW incineration facilities in Seoul in 2022.
CategoryIncineration StatusEnergy SalesEnergy Consumption
Daily Input Amounts
(Tons/Day)
Daily Incinerated Amounts
(Tons/Day)
Operation Rate *
(%)
Waste Heat
(Gcal)
Electricity
(Generated)
(kWh)
LNG
(Nm3)
Electricity
(Consumed)
(kWh)
Gangnam88879388442,9890333,83026,491,356
Nowon59155169247,9360234,13316,629,469
Mapo62958978795,4527,878,847263,41418,957,875
Yangcheon40634185171,3652,479,464664,4898,733,110
Total2514227480
(average)
1,157,74210,358,3111,495,86670,811,810
* Operation rate = average daily incinerate amount (tons/day) ÷ incineration capacity (ton/day) × 100 (%).
Disclaimer/Publisher’s Note: The statements, opinions and data contained in all publications are solely those of the individual author(s) and contributor(s) and not of MDPI and/or the editor(s). MDPI and/or the editor(s) disclaim responsibility for any injury to people or property resulting from any ideas, methods, instructions or products referred to in the content.

