Article

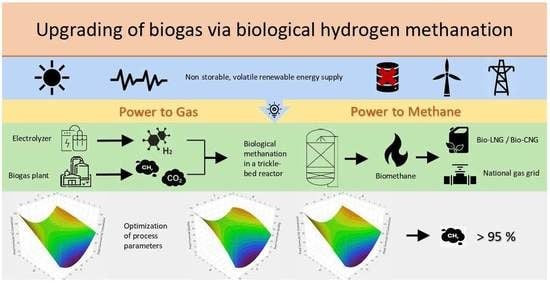
Optimization of Thermodynamic Parameters of the Biological Hydrogen Methanation in a Trickle-Bed Reactor for the Conditioning of Biogas to Biomethane

1
State Institute of Agricultural Engineering and Bioenergy, University of Hohenheim, 70599 Stuttgart, Germany
2
Specialist Department for Biocatalysis and Process Technology, School of Life Sciences and Facility Management, ZHAW Zurich University of Applied Sciences, 8400 Winterthur, Switzerland
*
Authors to whom correspondence should be addressed.
Energies 2023, 16(12), 4720; https://doi.org/10.3390/en16124720
Submission received: 15 May 2023 / Revised: 31 May 2023 / Accepted: 13 June 2023 / Published: 15 June 2023
(This article belongs to the Special Issue Anaerobic Digestion in the Bioeconomy)

Abstract

:
The increased demand for resources and energy that is developing with rising global consumption represents a key challenge for our generation. Biogas production can contribute to sustainable energy production and closing nutrient cycles using organic residues or as part of a utilization cascade in the case of energy crops. Compared to hydrogen (H2), biogas with a high methane (CH4) content can be fed into the gas grid without restrictions. For this purpose, the CH4 content of the biogas must be increased from 52 to 60% after anaerobic digestion to more than 96%. In this study, biological hydrogen methanation (BHM) in trickling-bed reactors (TBR) is used to upgrade biogas. Design of experiments (DoE) is used to determine the optimal process parameters. The performance of the reactors is stable under all given conditions, reaching a “low” gas grid quality of over 90%. The highest CH4 content of 95.626 ± 0.563% is achieved at 55 °C and 4 bar, with a methane formation rate (MFR) of 5.111 ± 0.167 m3/(m3·d). The process performance is highly dependent on the H2:CO2 ratio in the educts, which should be as close as possible to the stochiometric ratio of 4. In conclusion, BHM is a viable approach to upgrade biogas to biomethane quality and can contribute to a sustainable energy grid.

Graphical Abstract

1. Introduction

Biogas is a natural secondary energy source produced by the microbial degradation of biomass under anaerobic conditions, the combustion of which does not lead to an accumulation of CO2 in the atmosphere. Biogas consists of 50–75% CH4 and about 25–50% CO2, less than 10% water vapor, and trace amounts of H2 (<1%) and hydrogen sulfide (<3%) [1], which corresponds to a calorific value of the gas at standard temperature and pressure of 17.95 to 25.12 MJ/m3 [2]. Currently, desulphurized and dried biogas is mostly used as a fuel in combined heat and power units (CHP) in Germany to generate electrical and thermal energy [3]. The role of biogas in power generation and distribution can be significantly expanded if the quality of biogas is brought up to the standards of natural gas fed into to the gas grid. The natural gas grid in Germany is divided into low-calorific gas (L-gas) with an energy content of 28.8 to 32.4 MJ/m3 and high-calorific gas (H-gas) with an energy content of 36.0–43.2 MJ/m3. To be fed into the natural gas grid, the calorific value of the biogas must first be raised—which is usually achieved by removing CO2. At a CH4 content of 95%, the threshold value for feeding into the H-gas grid biogas reaches an energy content of 34.1 MJ/m3 [4]. In the second step, the calorific value of this biomethane has to be adjusted to the calorific value of the natural gas in the gas pipeline, usually by adding propane or butane. There are already several CO2 removal technologies on the market: amine scrubbing, pressure swing absorption, water scrubbing, organic physical scrubbing, cryogenic distillation, and membrane separation [5]. Another promising approach for biomethane production is biological hydrogen methanation (BHM). Following the concept of power-to-gas (PtG), the excess electrical energy from renewable energy sources is used in an electrolyzer that produces “green” H2. It is then fed into a trickling-bed reactor (TBR) together with CO2, which is an integral part of a biogas mixture. In the TBR, hydrogenotrophic microorganisms immobilized on plastic carrier bodies will convert both gases into CH4. Then, high-quality biomethane can be injected into the gas grid and is therefore a storage system for excess electrical energy [6]. Previously conducted studies on CO2 methanation have shown the influence of operating parameters such as pressure, temperature, and drip interval on process performance in TBRs [7,8,9,10]. Researchers found that when the pressure was increased from 1.5 to 9 bar, the CH4 content increased simultaneously at mesophilic temperatures of 41 °C [7]. The effect of temperature was investigated in [8] using the same experimental setup. It showed that the conversion rates of H2 and CO2 increase, leading to an increasing CH4 content at increasing temperatures from 40 to 55 °C. The analysis in [9,10] achieved CH4 concentrations above 98% at ambient pressure and argued the H2:CO2 ratio, pH control, and sufficient nutrient supply as limiting factors. At the same time, it was shown in [9] that CH4 concentrations above 90% can be achieved in TBR with established microbial culture under thermophilic conditions (55 °C) and ambient pressure at H2 gas feed rate above 23.2 m3/(m3·d).
Since previous studies focused mainly on CO2 methanation, which was later referred to as mono-methanation, this study analyzes the co-methanation of biogas and H2 in a TBR. As it was shown in [11], at optimized conditions biomethane could be produced with mono-methanation in a TBR by thermophilic microorganisms with a maximum CH4 content of 95.3%. Therefore, the objective of this study was to verify the possibility of upgrading biogas with a 55% CH4 to biomethane above 95% CH4 with BHM, and to optimize the thermodynamic parameters of the operating process by applying design of experiments (DoE).

2. Materials and Methods

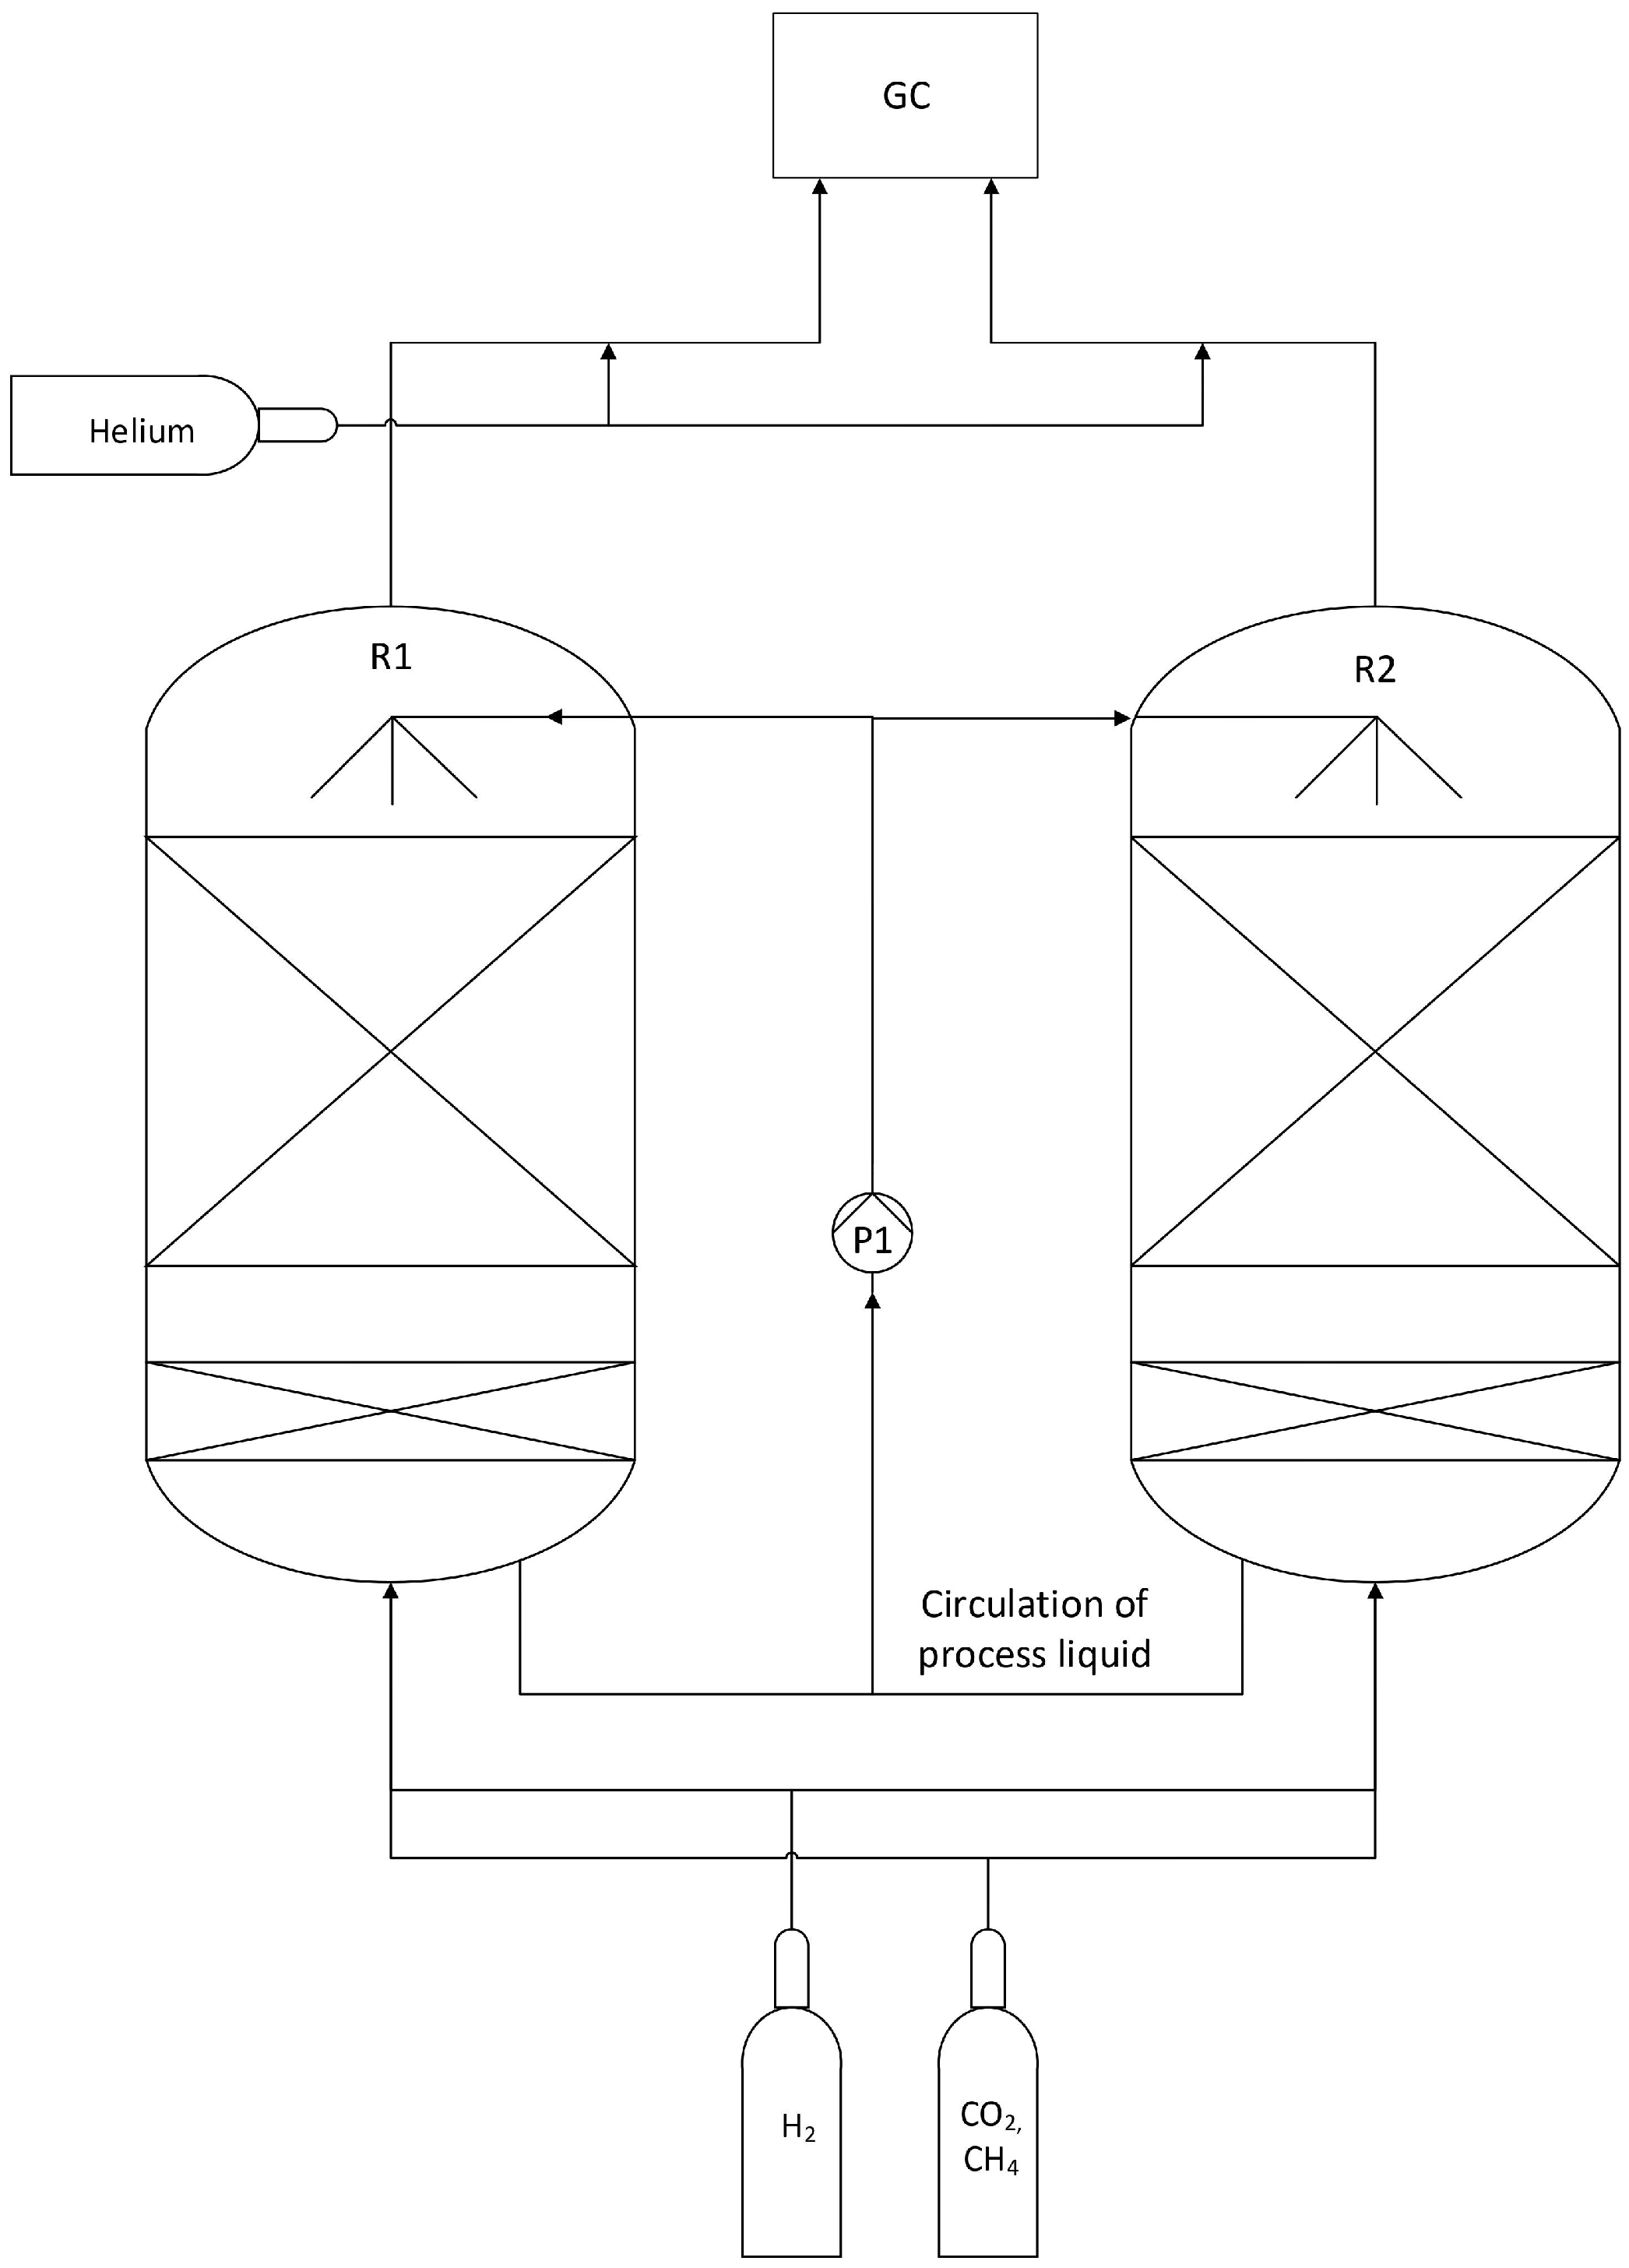
2.1. Experimental Setup

The experiments were carried out in the laboratory of the State Institute of Agricultural Engineering and Bioenergy at the University of Hohenheim. The methanation plant was described in detail in [7] and a simplified process schematic of the experimental plant is shown in Figure 1. The plant consists of identical TBRs sharing a single circulation pump that moves the process liquid from the bottom of the reactor to the sprayer at the top. Instead of the mono-methanation of CO2 and H2, co-methanation of a standard biogas mixture consisting of 45% CO2 and 55% CH4 together with H2 was used (Quality 3.0, Westfalen AG, Münster, Germany). The incoming gases were fed to the reactors via mass flow controllers (MFC Type 8742, Buerkert, Triembach-au-Val, France) at flow rates of 11.25 L/h for H2 and 6.25 L/h for the biogas, which met the stoichiometric ratio of 4:1 according to the Sabatier reaction. The flow rates of the educts were adjusted so that the total hourly flow rate of the reacting gases H2 (11.25 L/h) and CO2 (2.81 L/h) was comparable to the total volume of the reactors (14.5 L), which consist of 13 L of gaseous main body and 1.5 L of liquid sump together with the periphery. In this case, the gas production at varying operating parameters became clear, since the measurement of the product gas quality was performed once per hour and per reactor. During the experiments, the main thermodynamic parameters, namely temperature and pressure, were varied in the range of 50 to 60 °C and 2 to 9 bar to find the optimal operating point.
As a feed liquid, the effluent from the methanogenic stage of a two-stage anaerobic digestion (AD) plant, as described in [12], was introduced into the periphery of the experimental plant to regularly trickle onto the plastic supports with immobilized biofilm inside the methanation column. According to [13], the composition of nutrients required for the BHM is similar to that required for the AD process, allowing liquid transfer between the two plants. Beyond the microbial nutrient removal, the process liquid was constantly diluted by water formation in accordance with the Sabatier reaction. Thus, at the beginning of each experimental phase, the liquid collected in the sump (about 1.3 L)—the lowest point of the experimental plant—was replaced by the fresh feed liquid containing planktonic microorganisms, nutrients and trace elements [14]. Trickling of the carrier bodies occurred once per hour for three minutes.
The product gases leaving the reactors were cooled to remove water vapor. In addition, helium gas (Quality 3.0, Westfalen AG, Münster, Germany) was supplied as a tracer gas at a flow rate of 1 L/h and the percentage of each gas component in the gas mixture was measured using a gas chromatograph (micro-GC FUSION Gas Analyzer (Inficon, East Syracuse, NY, USA)). Measurements were performed continuously, once per hour for each reactor, resulting in 24 gas quality measurements per day per reactor. Based on the measured content of the tracer gas supplied at a known flow rate, it was possible to calculate the flow rates of all gas components (H2, CO2, CH4, O2, N2, H2S) potentially present in the produced gas mixture.

2.2. Design of Experiment

A DoE was prepared for the study of co-methanation of biogas and H2 to optimize the thermodynamic parameters using JMP Pro 15 software (SAS Institute, Cary, NC, USA). Since [8] recommended experiments at higher temperatures, a temperature in the range of 50 to 60 °C was set as the first predictor variable. Then, a pressure in the range of 2 to 9 bar was chosen. The maximum values are limited by the reactor design. Therefore, the optimal production point can be estimated using a second-order response surface model. Since methanogens are slow to adapt to a changing temperature [15,16], the parameter was set as a “hard-to-change factor”, resulting in a split-plot design that can be seen in the temperature blocks in Table 1. The different series of experiments are abbreviated as T and the corresponding temperature and P with the corresponding pressure. The minimum number of runs for the given specifications in the custom design is six. However, to minimize the probability of error, the number of runs was set to the number of possible combinations: 3 2 = 9 . I-optimality was chosen as the optimality criterion which aims to minimize the variance of the predictions over the relevant range of predictor variables, offering significant advantages in terms of improved prediction compared to the commonly used D-optimality criterion [17]. The odd pressure in the sixth run is dictated by the experimental design, which attempts to minimize prediction errors.
The duration of each experimental phase was set at 144 h (six complete days), including an adjustment period of 48 h. After 48 h, pH and CH4 production were stabilized, and the above measurements were considered for further analysis.

2.3. Analytical Section

During each experimental phase, samples of the process liquid were taken three times and further analyzed in the local laboratory of the state institute. The samples were analyzed for volatile fatty acid (VFA) content (acetic acid, n-butyric acid, iso-butyric acid, propionic acid, n-valeric acid, iso-valeric acid, and caproic acid) in the analytical laboratory to exclude or confirm the activity of acetoclastic microorganisms in the methanation process. At the same time, the measurement of chemical oxygen demand (COD) was carried out to determine the percentage of organic degradable material. In practice, the COD of the BHM effluent should ideally be as low as possible so that it can be discharged into nature without any problems. Total carbon (TC) and total organic carbon (TOC) analysis of the process fluid was performed to balance the amount of carbon involved in the BHM reaction.
VFA concentration was measured using gas chromatography (GC 2100Plus, Shimadzu with an FID-detector and a capillary column WCOT Fused Silica, Varian, Palo Alto, CA, USA). COD content was measured using a sensor array photometer (Hach Lange Type LASA 20). A TOC/TNb analyzer (Analytik Jena AG Type multi N/C®, Jena, Germany) was used to measure TC and TOC.
The pH level was measured separately in the sump of each reactor using combined pH and Redox sensors (Endress and Hauser AG, Reinach, Switzerland). Pressure in each reactor was measured using an absolute pressure transmitter (ABB Ltd., Minden, Germany). Temperature was determined using compact thermometers (Endress and Hauser AG, Reinach, Switzerland). All sensor data were recorded once per minute and logged in the database.

2.4. Calculations

The sensor data logged during the experiment and stored in the database, as well as results of gas measurement, were evaluated and processed with the help of MATLAB R2022b software package. The statistical analysis of the gas measurement data and lab analysis data was performed with Tukey’s test (p < 0.05).
Both analog sensor data and gas quality measurements were evaluated for the analysis. Since no significant difference in reactor performance was found, average and median values of the process parameters are reported in this study. To evaluate the performance of the reactors, the following key values were determined based on the collected data:
  • Methane formation rate (MFR);
  • Gas hourly space velocity (GHSV);
  • Retention time (RT);
  • The conversion rates of H2 and CO2.
As defined in [18,19], the GHSV represents the ratio between the flow rate of the incoming gases at STP and the volume of the reactor or its catalyst content. In the experimental conditions studied, only the reactant gas components fed into the reactor were considered:
GHSV = F C O 2 + F H 2 V r [ 1 / h ] ,
where FCO2 and FH2 are the flow rates of CO2 and H2 at STP in m3/h and Vr is the reaction volume, Vr = 0.013 m3. RT refers to the time required for the incoming gases to pass through the reactor volume from the inlet at the bottom of the reactor to the outlet at the top [7]:
RT = V r F C O 2 + F H 2 + F C H 4 h ,
where FCO2, FH2, and FCH4 are the flow rates of CO2, H2, and inert CH4 supplied to the reactor in m3/h at the reactor temperature and pressure [20]. One of the most important parameters related to the performance of the reactor is the MFR, which is determined by the daily flow rate of the product gas and the volume of the reactor [7,20]:
MFR = F C H 4 o u t F C H 4 i n V r [ m 3 / ( m 3 · d ) ] ,
where FCH4in is the daily flow rate of CH4 entering the reactor and FCH4out is the daily flow rate of CH4 leaving the reactor in m3/d. Compared to [7], in the present study, the daily flow rate of microbially produced CH4 was defined as the difference between the measured volumetric flow rate of CH4 in the product gas and the volumetric flow rate of CH4 injected into the reactors.

3. Results and Discussion

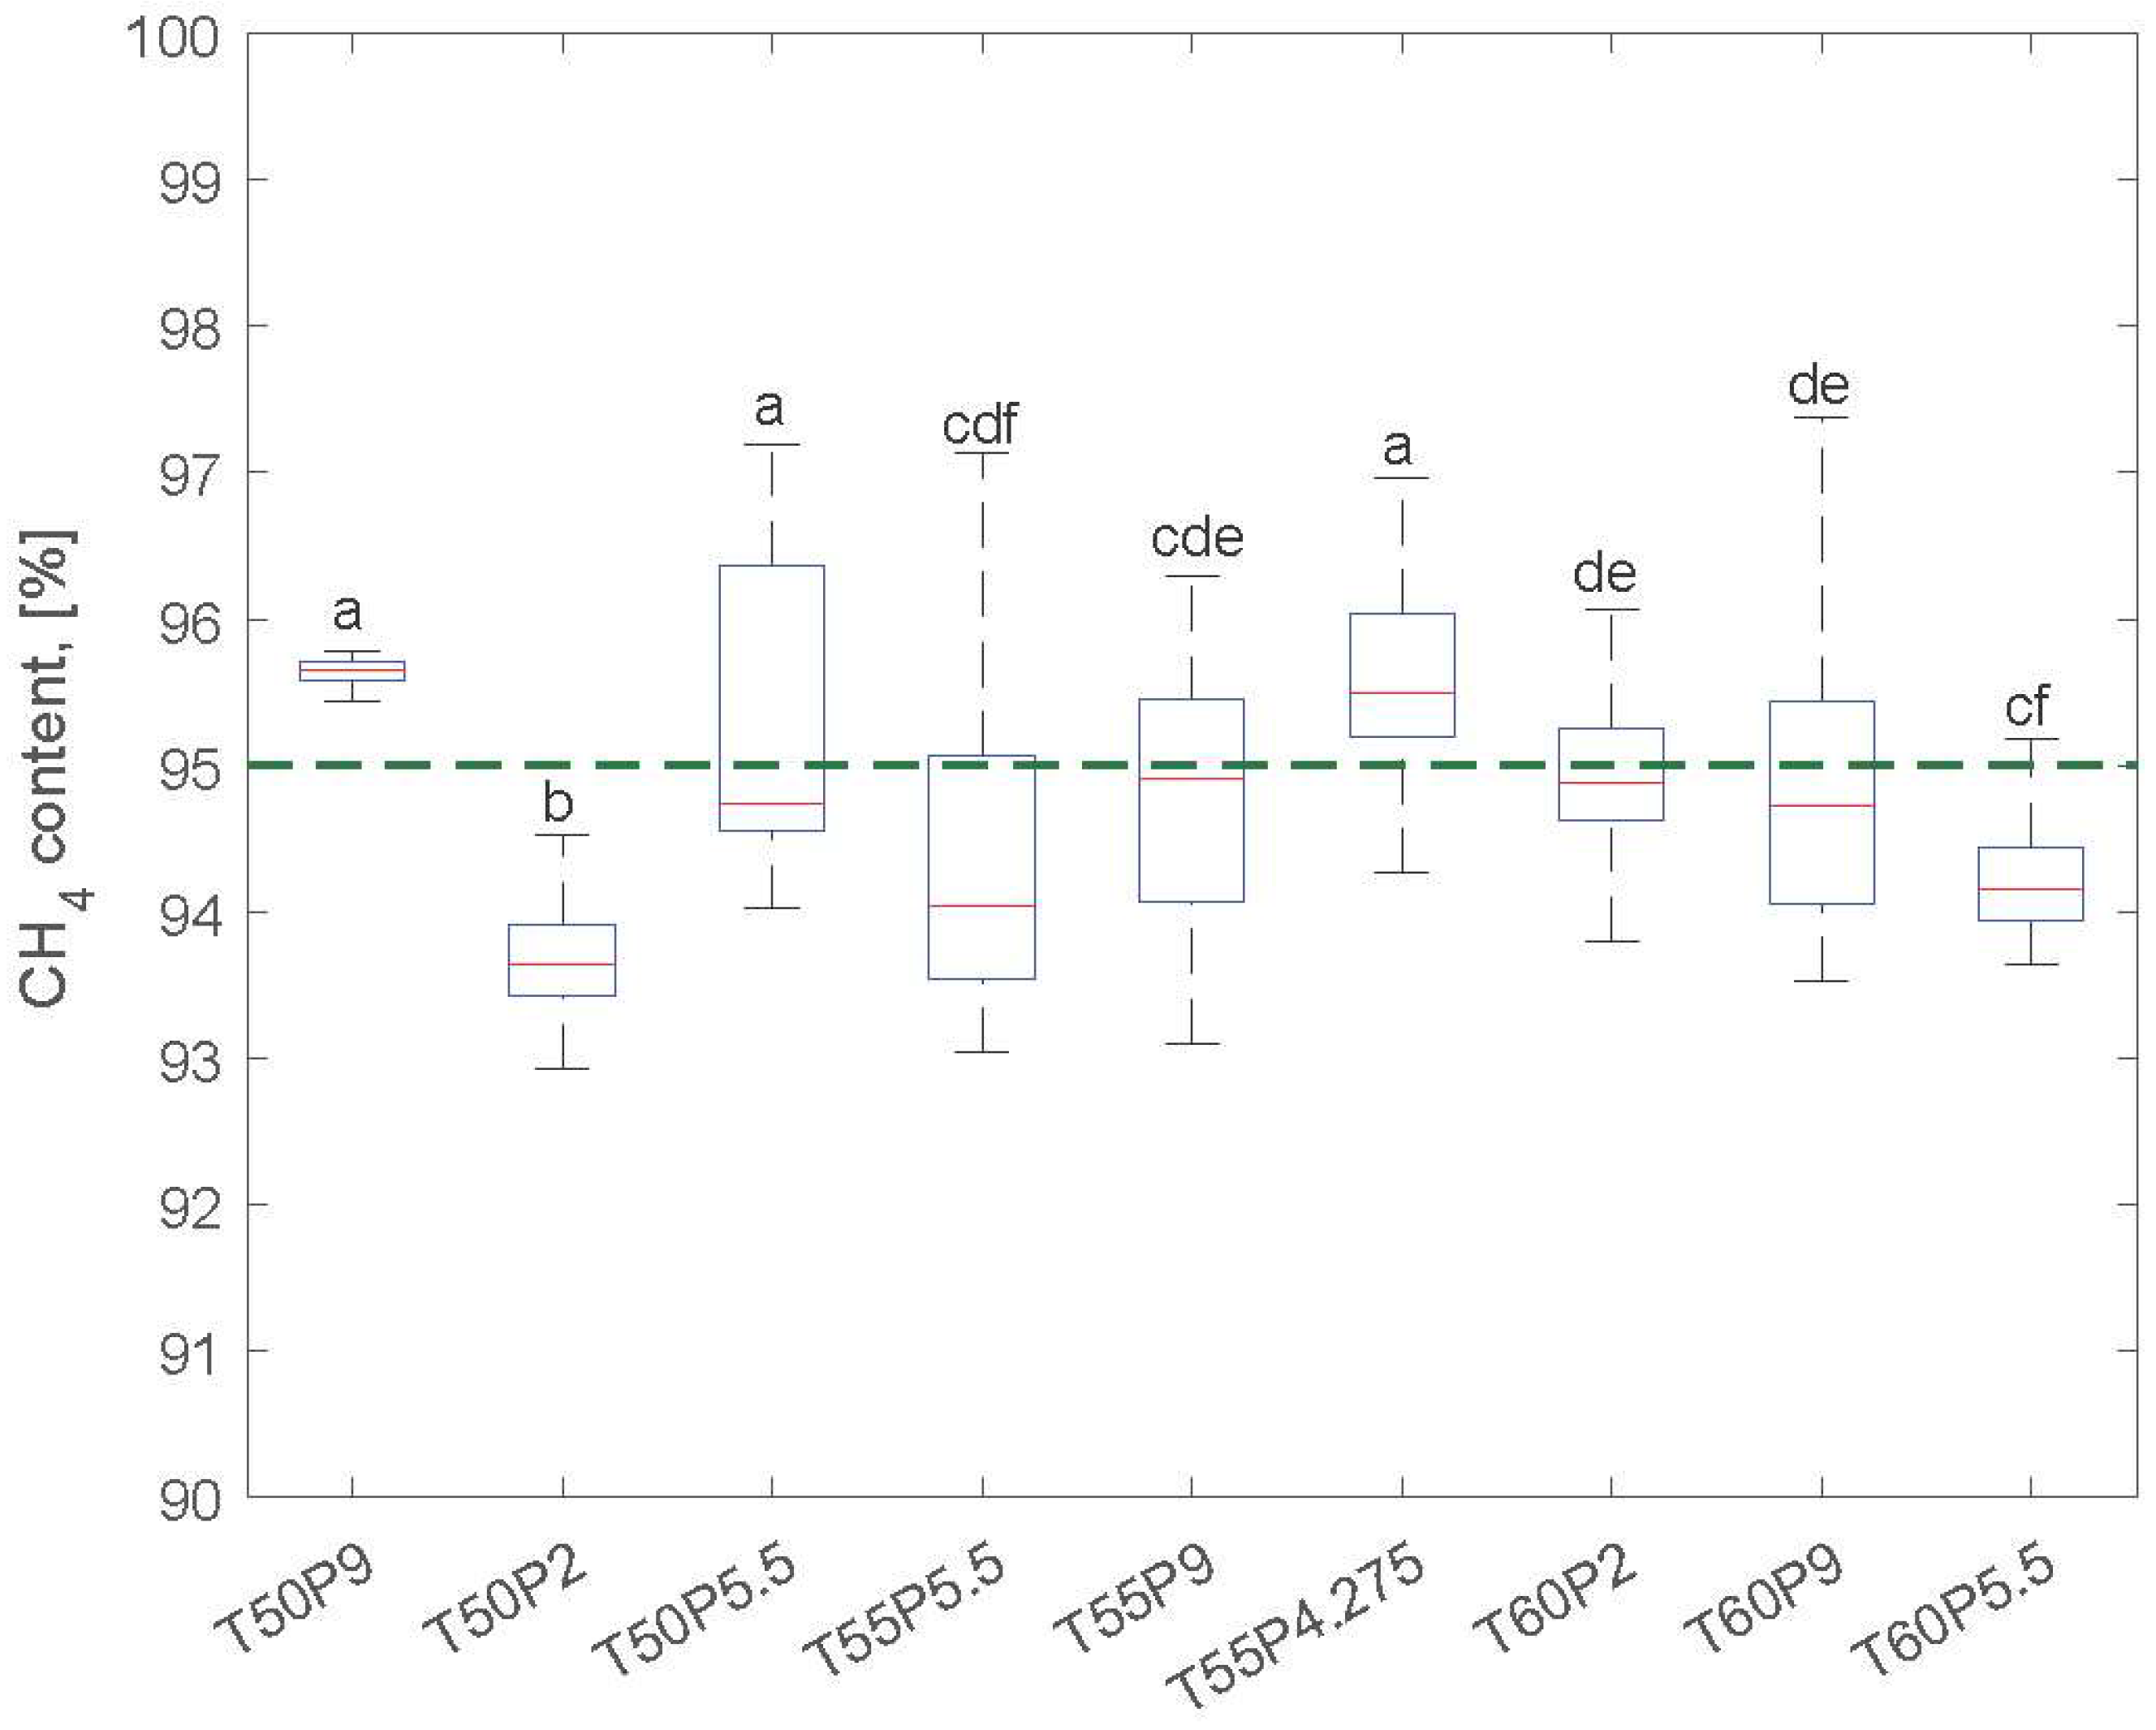
3.1. Operation and Performance Parameters

The data on the measured parameters as well as the key parameters related to the performance of the reactors during all experimental phases are shown in Table 2. Both temperature and pressure were stable in each experimental phase and did not vary significantly during the experiments. Since the GHSV is related to the fixed parameters of the experimental procedure, its value was kept constant throughout the experiment: GHSV = 1.082 h−1.
The analysis of the flow rates of the incoming and outgoing gases showed some deviation of the H2:CO2 ratio from the set stoichiometric value: during all experimental phases, there was a slight overshoot of H2 content. This could be due either to the inaccuracy of the instruments, as reported in [7], or to the fluctuating ratio between CO2 and CH4 in the gas mixture supplied to the reactors from the same cylinder. This over-stoichiometric ratio resulted in a better conversion rate of CO2 compared to the conversion of H2. On average, the conversion rate of H2 was 97.124 ± 0.176% and the conversion rate of CO2 was 99.941 ± 0.011% throughout the experiment.
The results of the experiments showed a clear correlation between the quality of biomethane and the H2:CO2 ratio (Figure 2). Thus, the purity of the biomethane is determined by the ratio of feed gases, resulting in higher quality the closer the ratio is to 4.
In the experiments where the H2:CO2 ratio was 4.123, the content of CH4 in the product gas was the lowest. This result indicates a threshold value for the ratio of the reaction gases for their successful conversion into biomethane: The H2:CO2 ratio should not exceed 4.083 to achieve a biomethane quality of at least 95%. On the other hand, the conversion of H2 shows an obvious linear correlation with the purity of biomethane, with higher conversion rates of H2 leading to higher purity of biomethane (R2 = 0.925, see Supplementary Materials, Figure S1). At the same time, no obvious correlation was found between the purity of biomethane and the conversion of CO2 (see Supplementary Materials, Figure S2). Since the coefficient of determination of the correlation between the H2:CO2 ratio is higher than that of the H2 conversion, in practice, the dosage of the reaction gases should be controlled and kept as close as possible to the stoichiometric ratio in order to achieve optimal conversion rates of the reactants and maximally reduce the fraction of their residues in the product gas.
The MFR exhibited a relatively constant trend during the experiments confirming the stability of the process and a robust BHM of the injected gases in the presence of inert CH4 gas. It is worth noting that the MFR increases slightly with increasing pressure and temperature in the reactors, and the obtained results are comparable to the results of [7]. At a H2 gas feed rate of 22.77 m3/(m3·d) (at a flow rate of 11.25 L/h based on the trickle-bed volume Vr = 13 L), the MFR obtained in our study was comparable to the results of [9] for a similar H2 feed rate. However, the median CH4 concentration at a temperature of 55 °C was sufficiently higher in our experiments than in results shown by D. Strübing et al. [9]: it was above 94% for all experimental setups and reached 95.494% at a pressure of 4.275 bar. These results underline the importance of pressure for biogas upgrading in TBRs. Overall, the increase in MFR and the percentage of bacterially converted methane CH4conv demonstrate the higher bacterial activity with increasing temperature and pressure, with the temperature effect being more significant than the pressure increase (see Supplementary Materials, Figure S3).
Regarding the quality of the upgraded biogas, the highest biomethane purity was obtained at a pressure of 4.275 bar and a temperature of 55 °C, and at a pressure of 9 bar and a temperature of 50 °C (Figure 3). In all experimental setups, the lowest biomethane quality for “low-standard” gas grid was achieved, and in the two cases mentioned, the median value of the quality for “high-standard” gas grid was achieved.

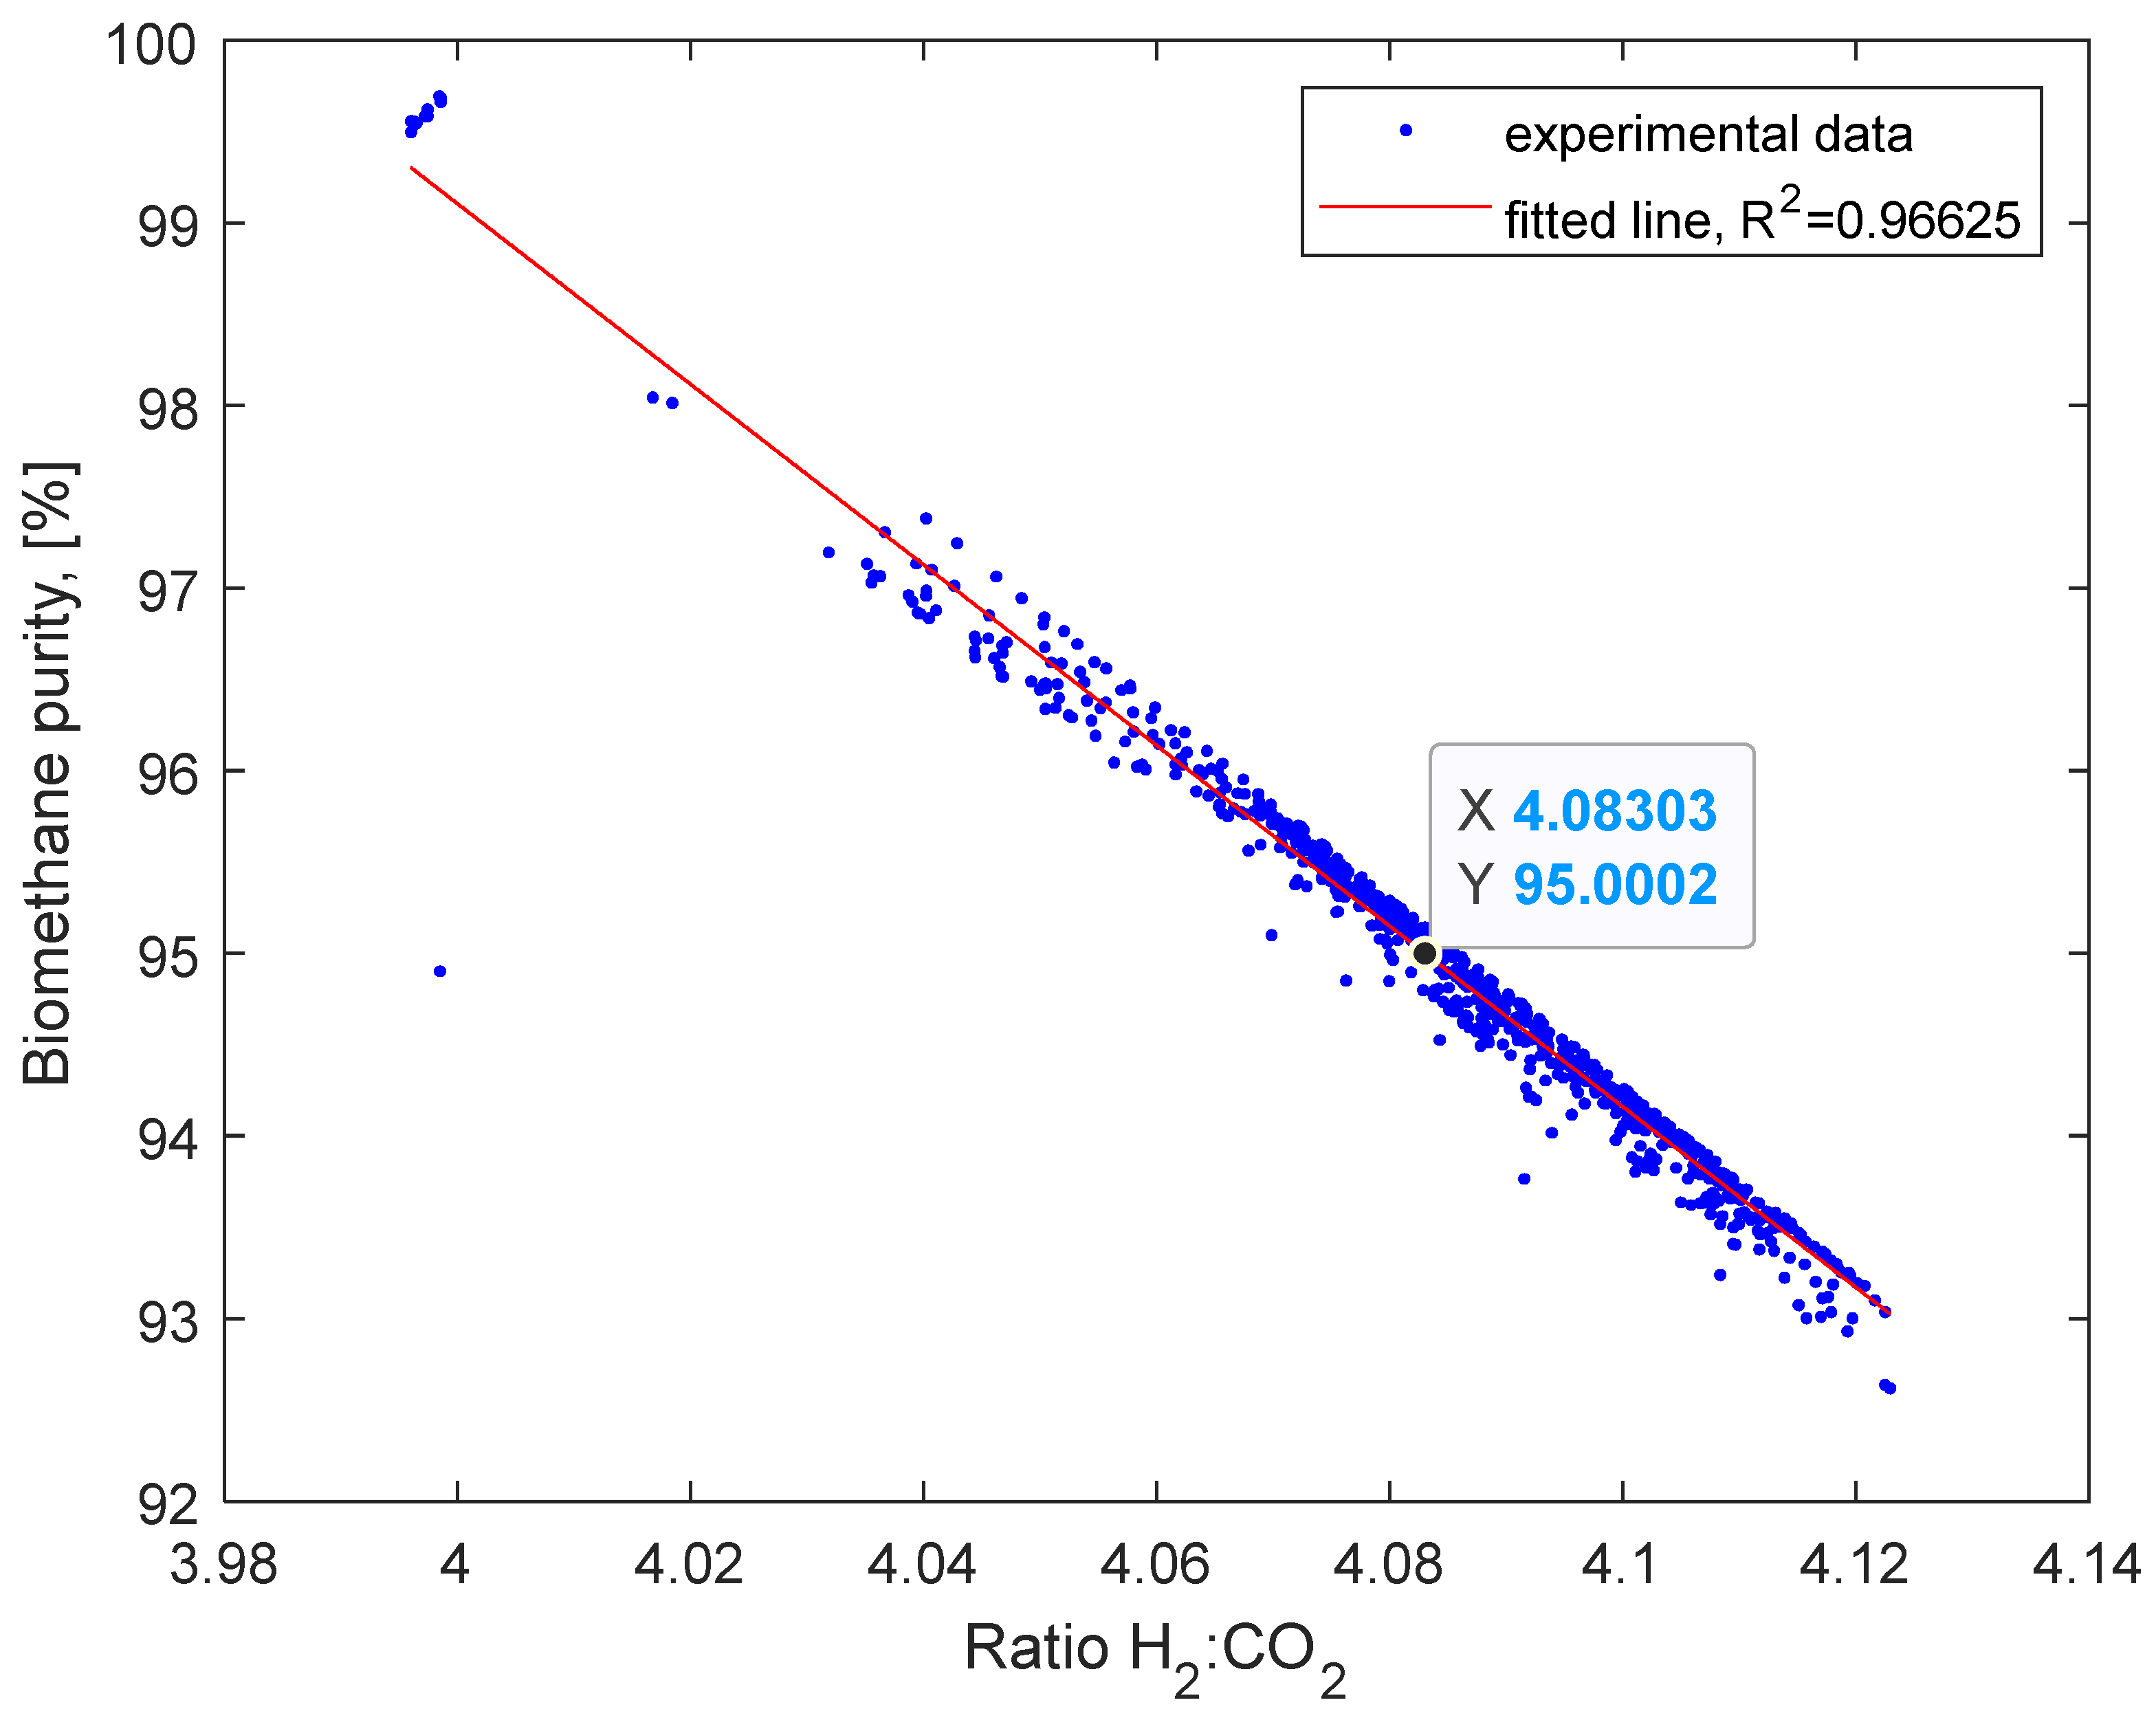
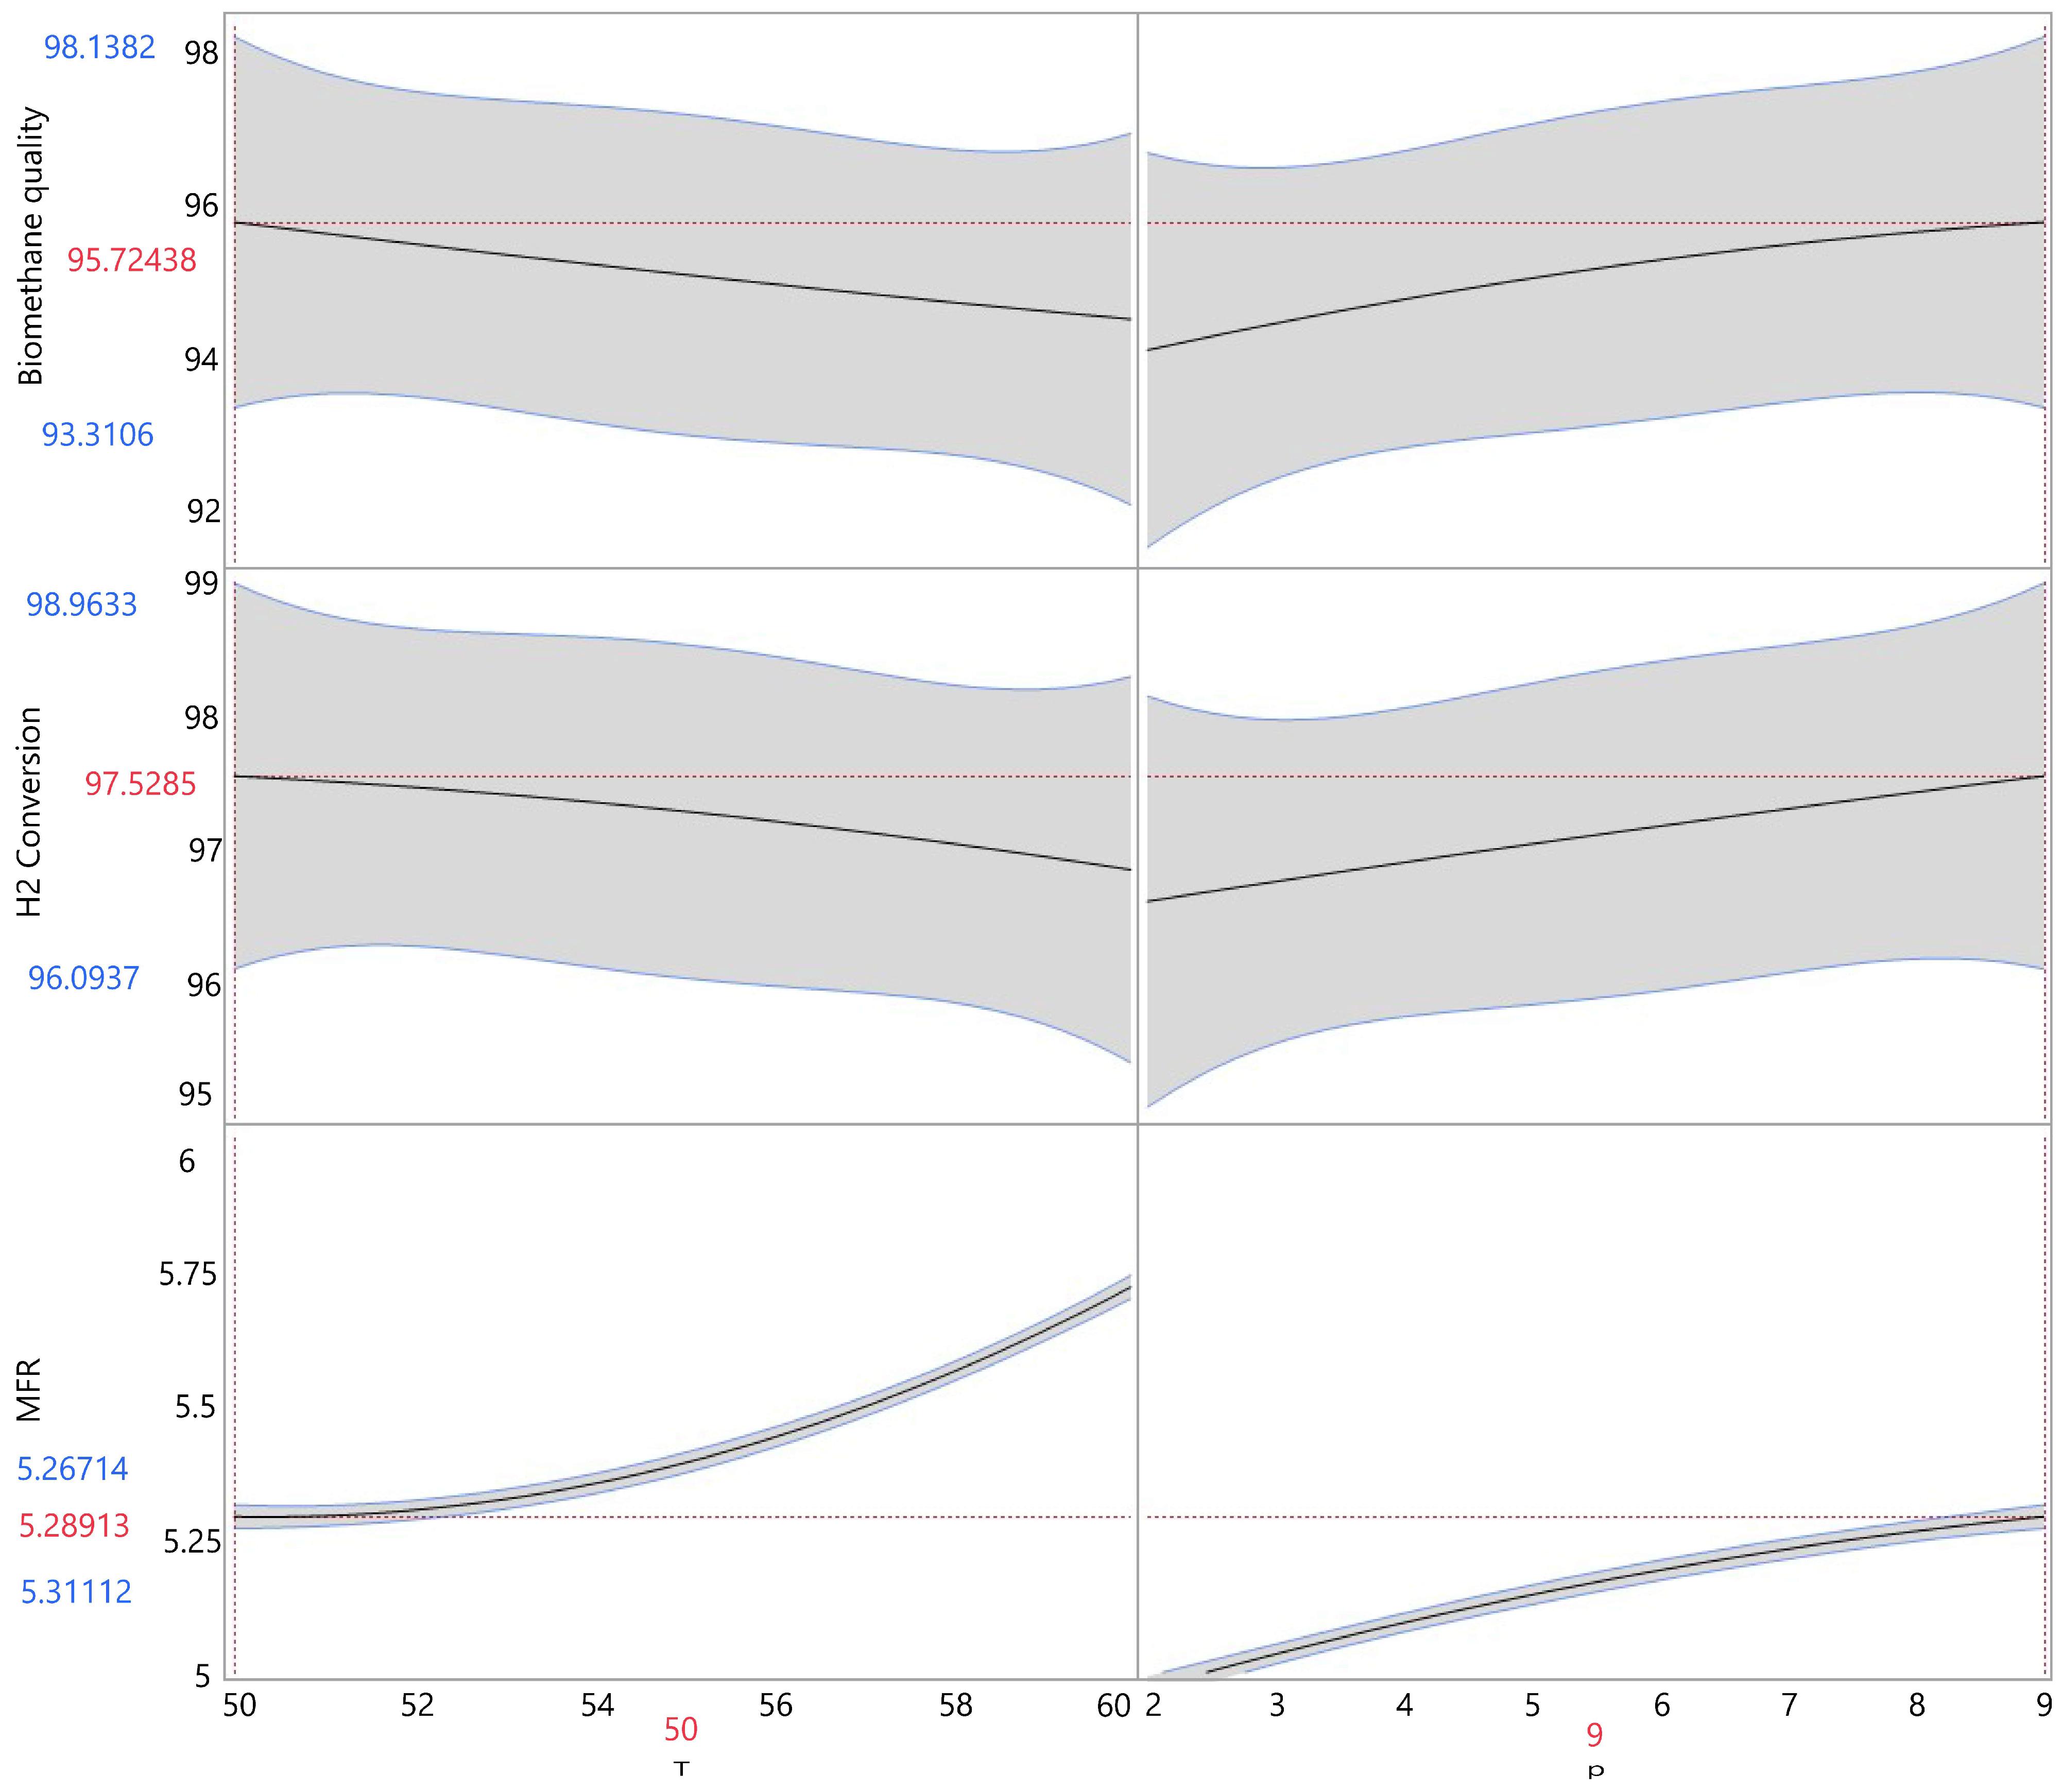
3.2. Optimizing Operating Parameters

To evaluate the optimal operating parameters in JMP Pro, three key process performance values were added to the custom design. Biomethane quality, H2 conversion and MFR were set as equally weighted variables. The standard least square model was chosen to analyze the DoE and the desirability function was optimized over all responses. The maximum desirability was obtained at 50 °C and 9 bar. However, Figure 4 shows no maximum of a key value in the specified intervals of temperature and pressure. The prediction formula shows a negative correlation between biomethane quality, H2 conversion and increasing temperature, which contradicts the conclusion of [8]. On the other hand, there is a positive correlation between increasing pressure and both variables. As for MFR, both temperature and pressure show a parabolic correlation with this performance parameter. This indicates that further experiments with higher pressure and wider temperature interval are needed to validate the prediction formula found. Furthermore, when the fluctuating ratio of H2:CO2 in the reactants is included in the prediction formula, an effect on the biomethane quality and H2 conversion rate but not on the MFR can be seen. This shifts the optimal process temperature to 60 °C, which underlines the previous conclusion to use a wider temperature interval in further experiments. On the other hand, ensuring a constant H2:CO2 ratio must be considered when planning future experiments.

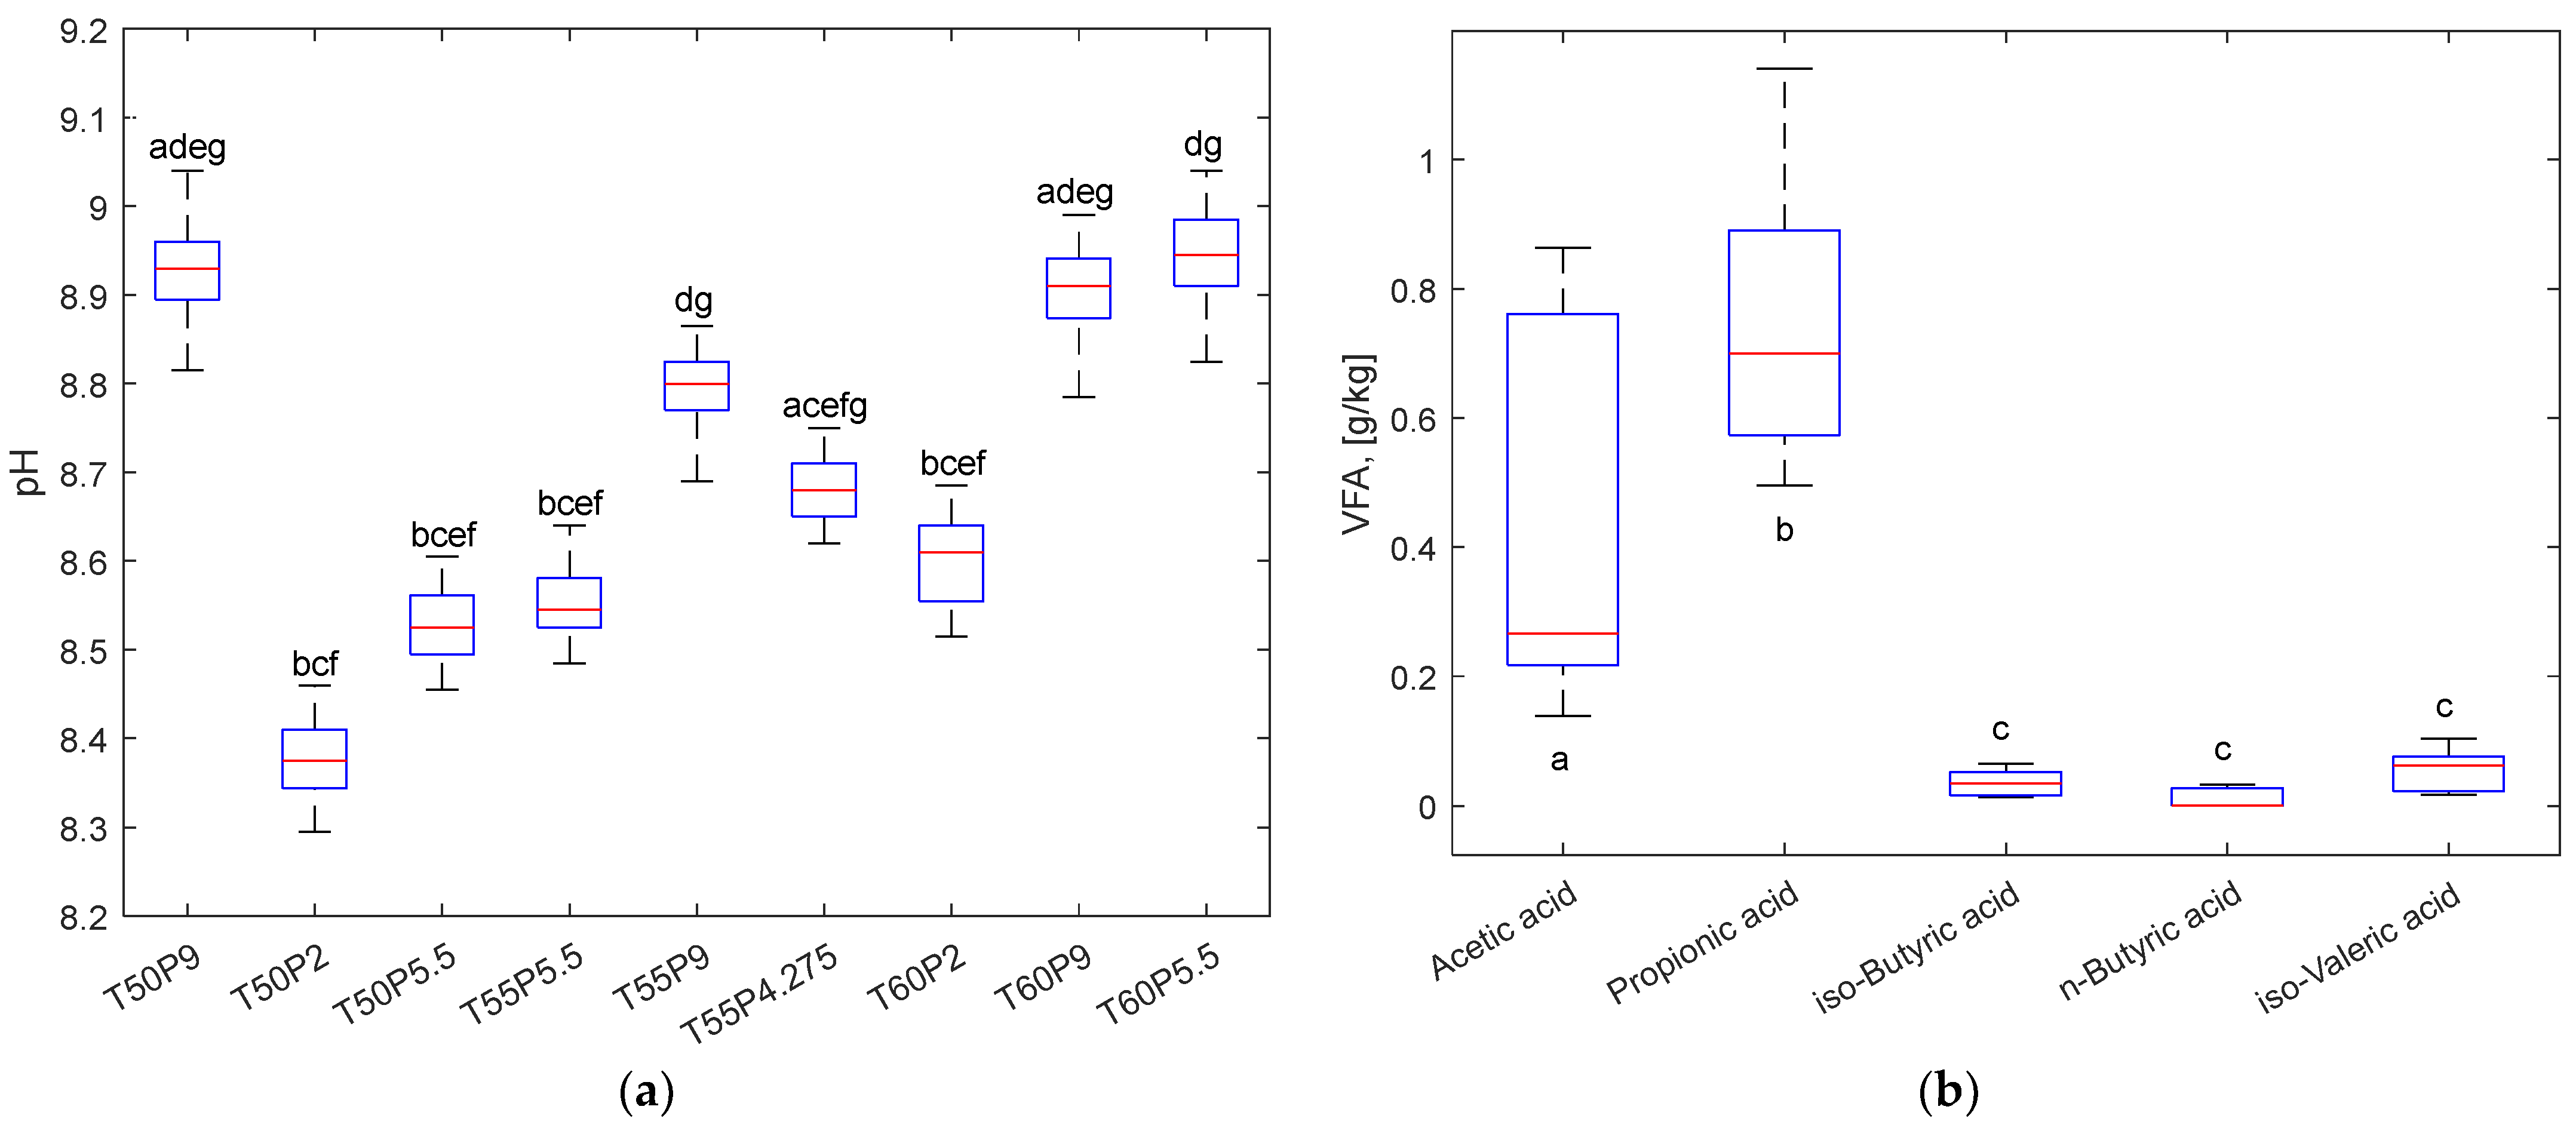
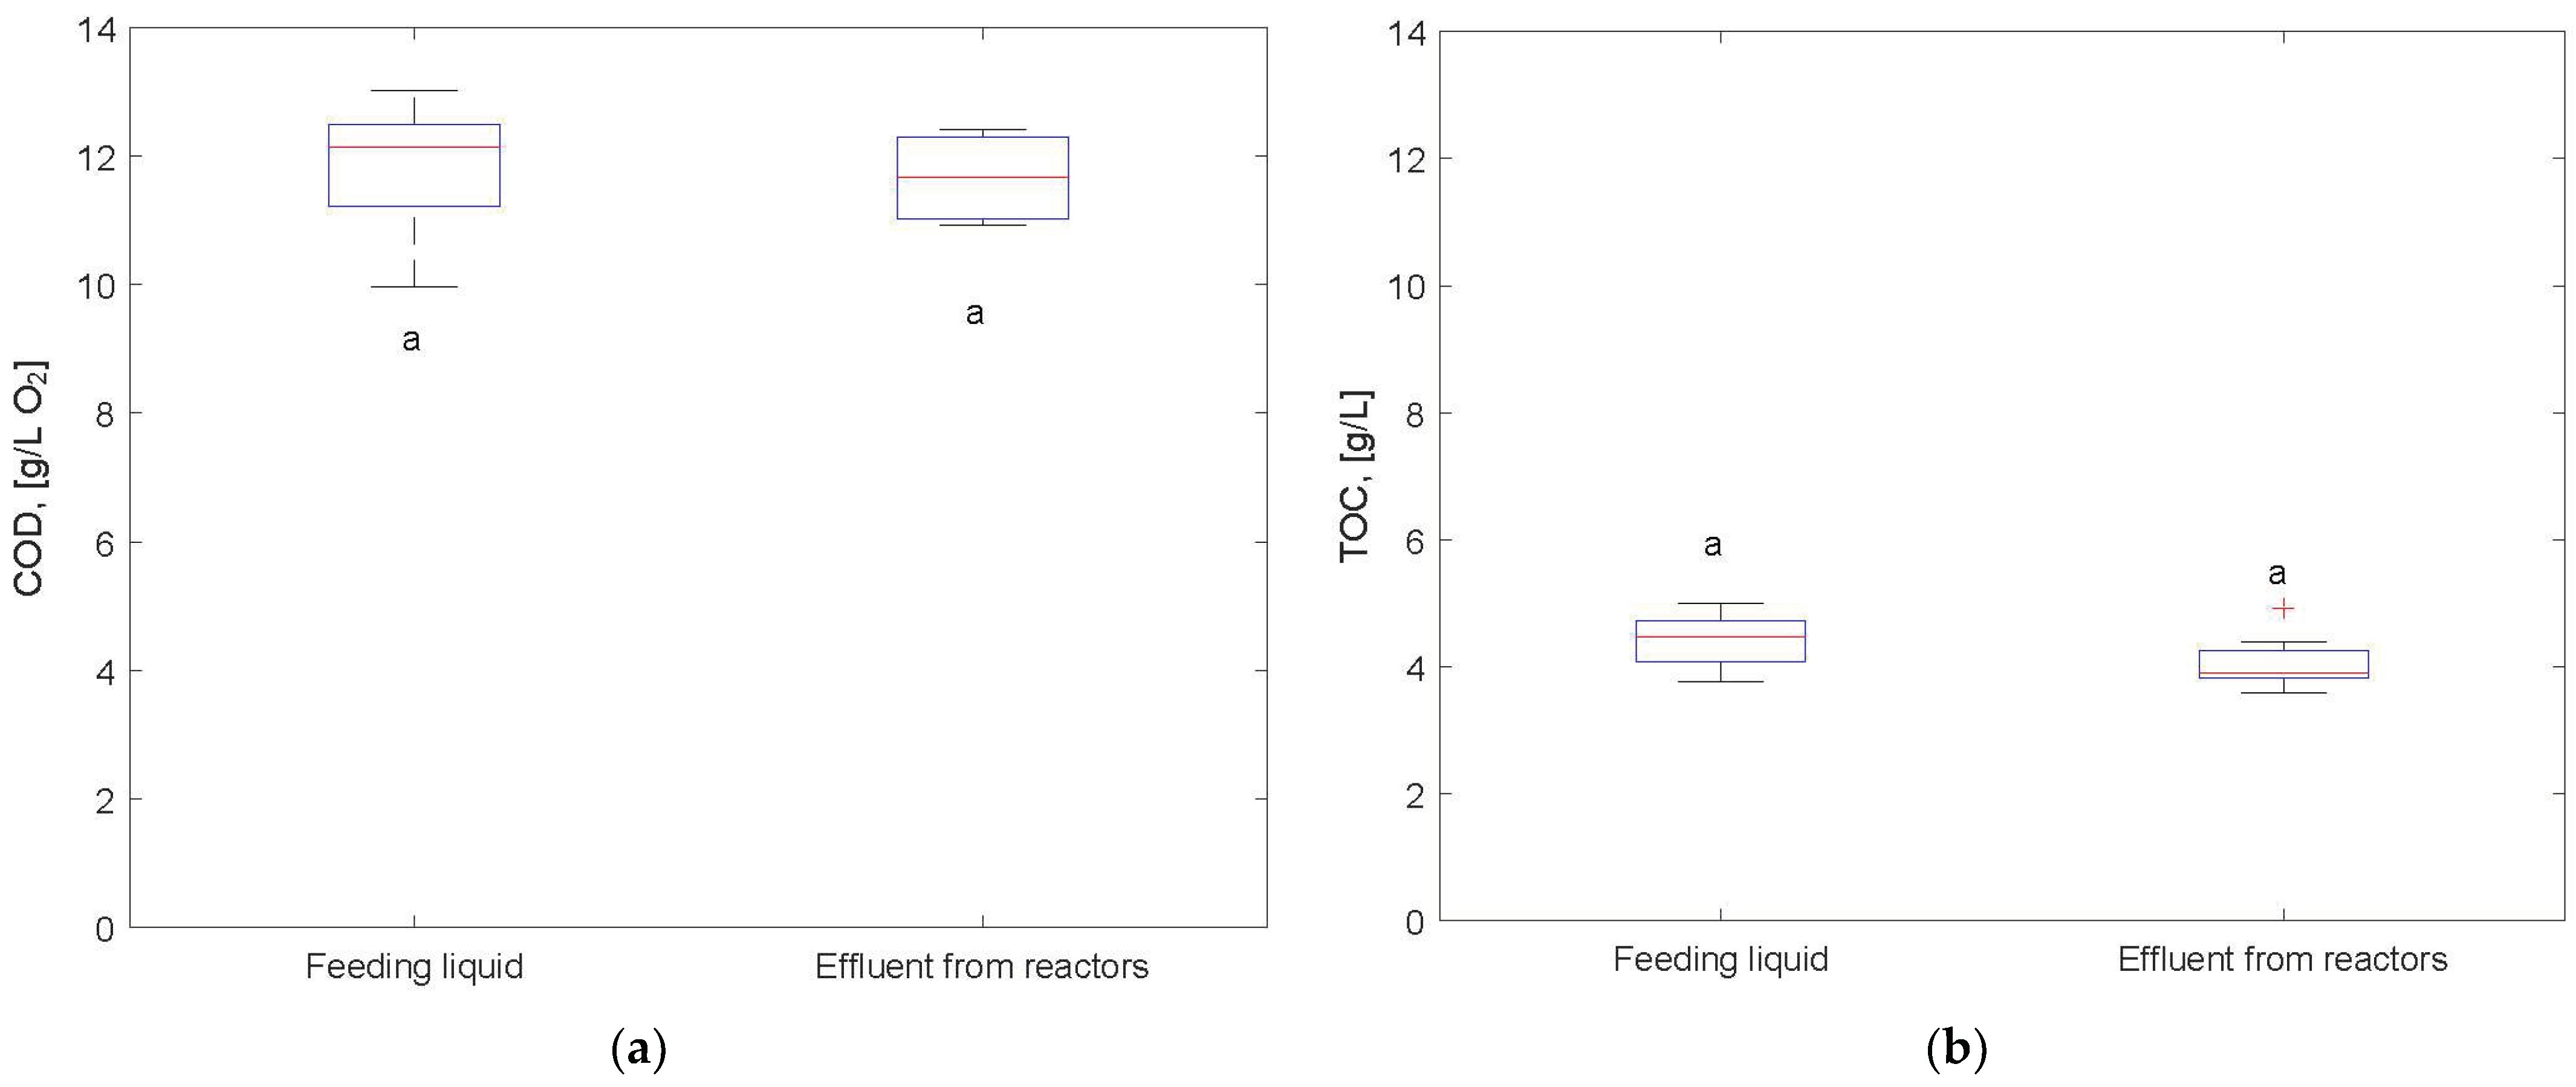
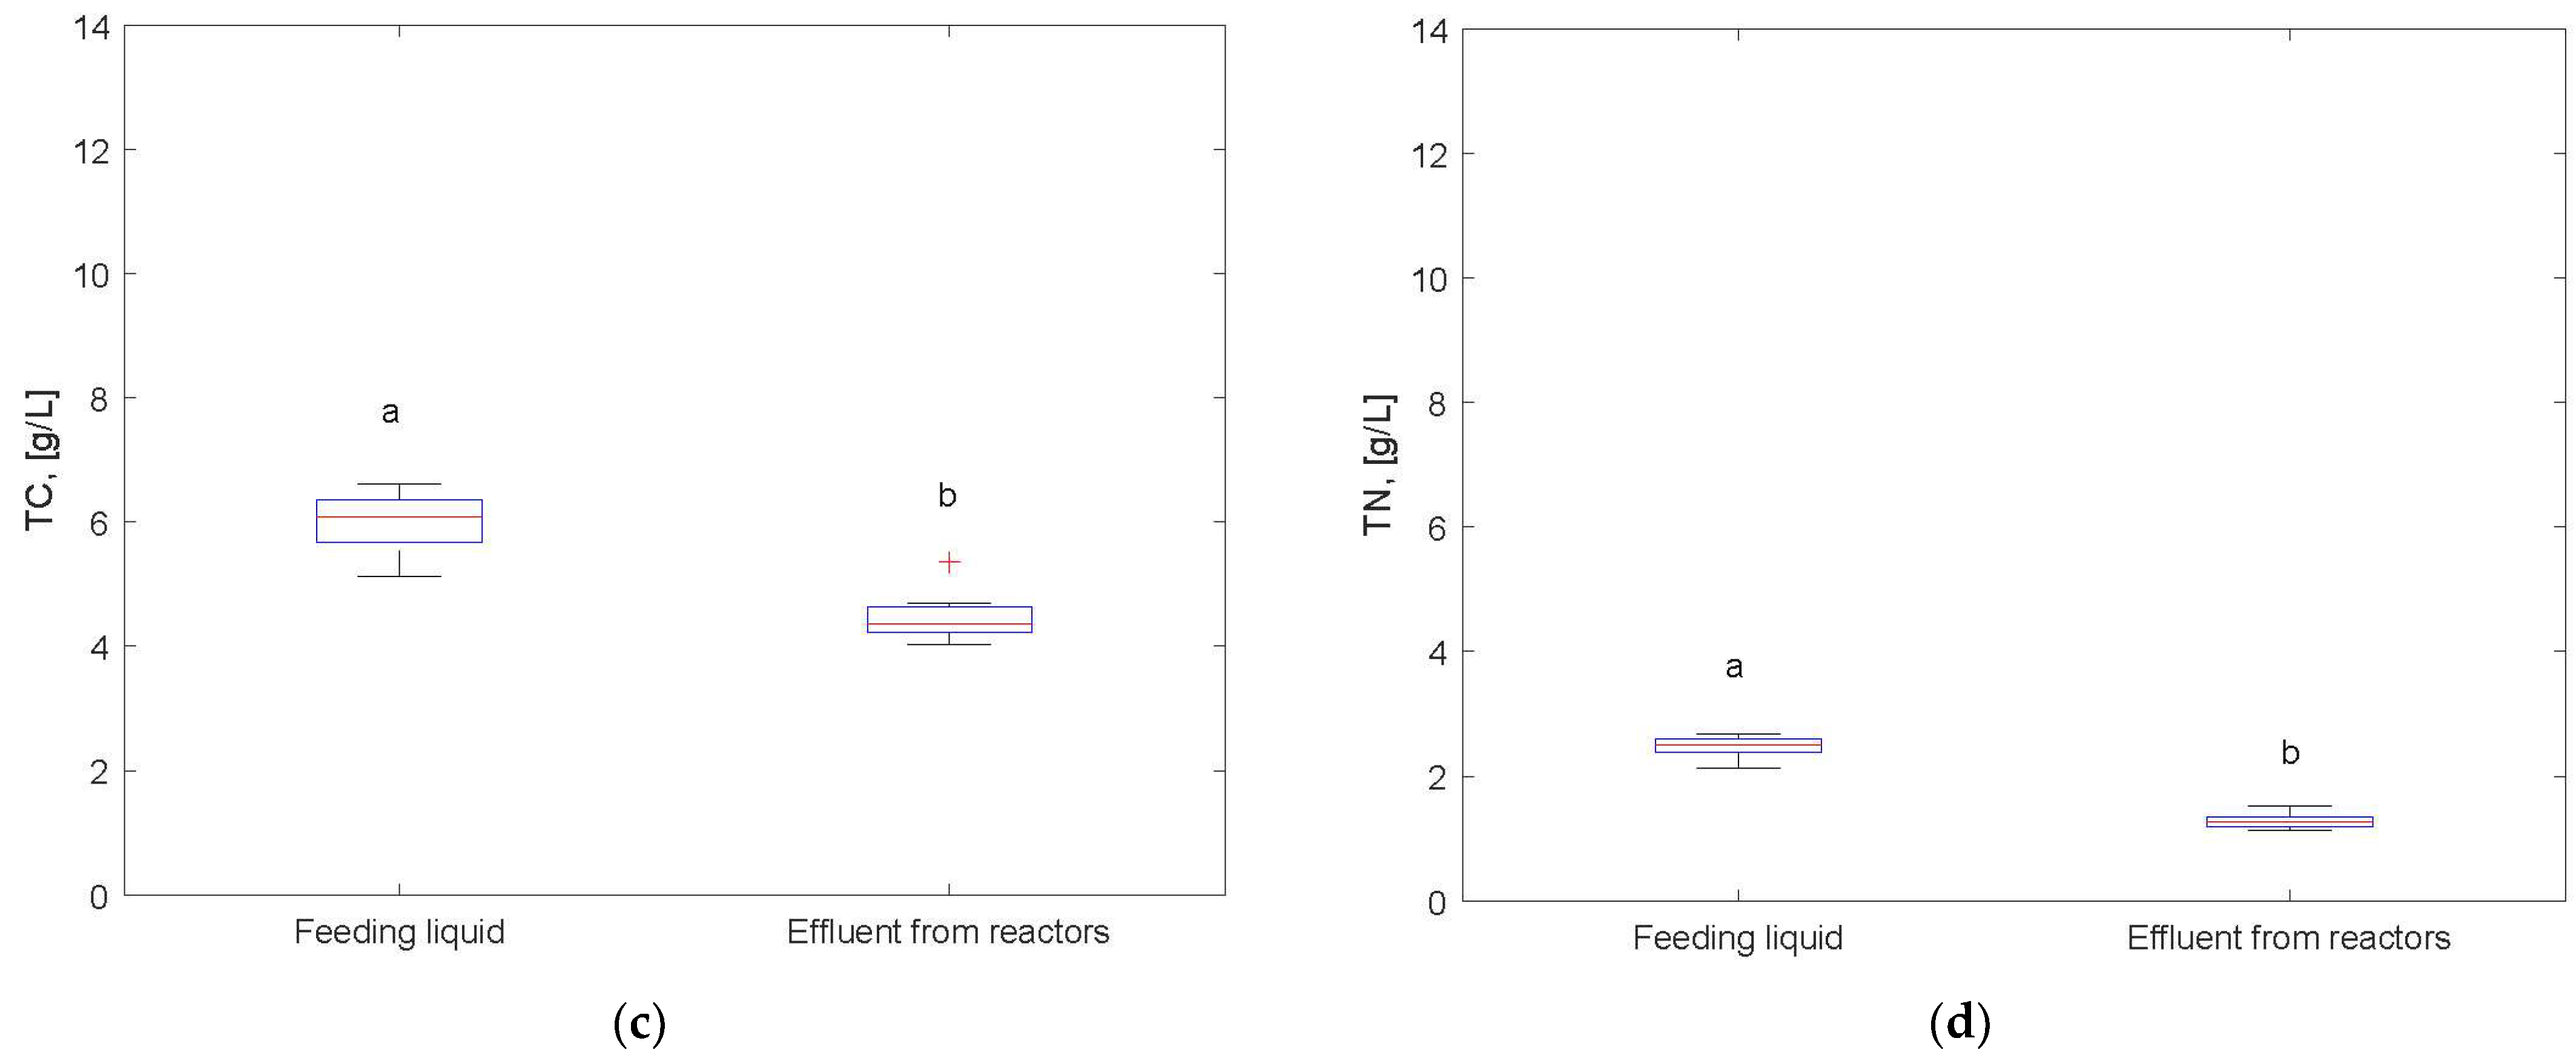
3.3. Analysis of the Process Liquid

Laboratory analyses of the process liquid show an increase in pH with increasing temperature and pressure (Figure 5a). These results are in contrast to the results of [7], where the pH decreased with increased pressure due to the formation of carbonic acid. This may be due to the amount of inert CH4 in the reactor, which leads to a lower partial pressure of CO2. The results of [21] also show the importance of pH for process stability, including microbial growth. Since the solubility of CO2 increases not only with pressure but also with increasing pH, an over stochiometric feed could lead to process disturbances and inhibition of methanogenesis [22].
Since the formation of VFAs occurred in all reactors, the activity of acetoclastic methanogens could not be excluded. The predominant acids found in the reactors were acetic and propionic acids (Figure 5b). In addition, both COD and TOC analyses show no significant difference between the effluents from the reactors and the feed liquid (Figure 6a,b). The TC and TN analyses also show that the inorganic carbon and TN content in the reactor effluent is significantly lower compared to the feed liquid (Figure 6c,d). The depletion of both nutrients from the process liquid over time may indicate biomass growth, as carbon serves as an energy source and nitrogen compounds are required for protein synthesis [23]. At the same time, the relatively low C/N ratio (below 30, as mentioned by [23]) could also be related to VFA formation within the reactors.

4. Conclusions and Outlook

The present study shows that biogas can be upgraded to biomethane quality by using BHM. By applying DoE, the optimum process parameters in terms of pressure and temperature were determined with the given experimental setup. At 50 °C and 9 bar, the MFR was 5.295 ± 0.216 m3/(m3·d), the CH4 content was 95.614 ± 0.151% and the H2 conversion was 97.535 ± 0.166%. However, no maximum value was obtained in the prediction formula for the key values, suggesting that further experiments with longer intervals are needed. In addition, a quality of over 93% CH4 in the product gas was achieved in all experimental runs, which is sufficient for injection into the “low” gas grid. However, under real industrial conditions, the ratio between CO2 and CH4 in the biogas may vary, depending on the type of substrates fed or the conditions in the digester. In order to maintain the quality of biomethane fed into the gas grid, the H2:CO2 ratio in the educts should be controlled. According to the results of the present study, the H2:CO2 ratio should not exceed 4.083:1. At the same time, in the works of [7,9,10] for mono-methanation of CO2, the lower limits for this parameter were 3.75:1. Therefore, an optimal H2:CO2 ratio must be ensured in practice. In addition, an economic analysis weighing the benefits of higher temperature and pressure against manufacturing and operating costs could improve process optimization.

Supplementary Materials

The following supporting information can be downloaded at: https://www.mdpi.com/article/10.3390/en16124720/s1, Figure S1: Interrelation between conversion of H2 and purity of biomethane; Figure S2: Interrelation between conversion of CO2 and purity of biomethane; Figure S3: Methane formation rate (MFR) depending on pressure and temperature (grouped by pressure).

Author Contributions

Conceptualization, E.H., A.O., U.B. and A.L.; Data curation, E.H. and A.O.; Formal analysis, E.H. and A.O.; Funding acquisition, A.L.; Investigation, E.H. and A.O.; Methodology, E.H., A.O., U.B. and A.L.; Project administration, E.H. and A.L.; Resources, E.H. and A.O.; Software, E.H. and A.O.; Supervision, E.H. and A.L.; Validation, E.H., A.O., U.B. and A.L.; Visualization, E.H.; Writing—original draft, E.H. and A.O.; Writing—review and editing, E.H., A.O., U.B. and A.L. All authors have read and agreed to the published version of the manuscript.

Funding

This research was founded by the federal ministry of education and research (BMBF, German research foundation)—grant number 03SF0578A (joint project ProBioLNG).

Data Availability Statement

The data presented in this study are available on request from the corresponding author.

Acknowledgments

The authors acknowledge the support of Jörg Steinbrenner, Muhammad Tahir Khan, Robin Rink and David Michel in the experimental work for this manuscript.

Conflicts of Interest

The authors declare no conflict of interest. The funders had no role in the design of the study; in the collection, analyses, or interpretation of data; in the writing of the manuscript; or in the decision to publish the results.

Abbreviations

Anaerobic digestionAD
Biological hydrogen methanationBHM
Chemical oxygen demandCOD
Combined heat and power unitsCHP
Design of experimentDoE
Gas hourly space velocityGHSV
High-calorific gasH-gas
Methane formation rateMFR
Low-calorific gasL-gas
Power-to-gasPtG
Retention timeRT
Total carbonTC
Total nitrogenTN
Total organic carbonTOC
Trickling-bed reactorTBR
Volatile fatty acidVFA

References

  1. Wellinger, A.; Murphy, J.; Baxter, D. The Biogas Handbook: Science, Production and Applications; Wellinger, A., Murphy, J., Baxter, D., Eds.; Woodhead Publishing Limited: Oxford, UK, 2013; ISBN 9780857097415. [Google Scholar]
  2. Miltner, M.; Makaruk, A.; Harasek, M. Review on available biogas upgrading technologies and innovations towards advanced solutions. J. Clean. Prod. 2017, 161, 1329–1337. [Google Scholar] [CrossRef]
  3. Pelkmans, L. Implementation of Bioenergy in Germany 2021; Country Reports; IEA Bioenergy: Paris, France, 2021. [Google Scholar]
  4. Germand Technical and Scientific Associarion for Gas and Water. Technical Rule—Standard: Gas Quality, A; (G 260); Economic and Publishing Company Gas and Water: Bonn, Germany, 2021; Available online: https://shop.wvgw.de/G-260-Technical-Rule-09-2021/511831 (accessed on 3 April 2023).
  5. Adnan, A.I.; Ong, M.Y.; Nomanbhay, S.; Chew, K.W.; Show, P.L. Technologies for Biogas Upgrading to Biomethane: A Review. Bioengineering 2019, 6, 92. [Google Scholar] [CrossRef] [PubMed] [Green Version]
  6. Burkhardt, M.; Busch, G. Methanation of hydrogen and carbon dioxide. Appl. Energy 2013, 111, 74–79. [Google Scholar] [CrossRef]
  7. Ullrich, T.; Lindner, J.; Bär, K.; Mörs, F.; Graf, F.; Lemmer, A. Influence of operating pressure on the biological hydrogen methanation in trickle-bed reactors. Bioresour. Technol. 2018, 247, 7–13. [Google Scholar] [CrossRef] [PubMed]
  8. Lemmer, A.; Ullrich, T. Effect of Different Operating Temperatures on the Biological Hydrogen Methanation in Trickle Bed Reactors. Energies 2018, 11, 1344. [Google Scholar] [CrossRef] [Green Version]
  9. Strübing, D.; Huber, B.; Lebuhn, M.; Drewes, J.E.; Koch, K. High performance biological methanation in a thermophilic anaerobic trickle bed reactor. Bioresour. Technol. 2017, 245, 1176–1183. [Google Scholar] [CrossRef] [PubMed]
  10. Burkhardt, M.; Koschack, T.; Busch, G. Biocatalytic methanation of hydrogen and carbon dioxide in an anaerobic three-phase system. Bioresour. Technol. 2015, 178, 330–333. [Google Scholar] [CrossRef] [PubMed]
  11. Thema, M.; Weidlich, T.; Kaul, A.; Böllmann, A.; Huber, H.; Bellack, A.; Karl, J.; Sterner, M. Optimized biological CO2-methanation with a pure culture of thermophilic methanogenic archaea in a trickle-bed reactor. Bioresour. Technol. 2021, 333, 125135. [Google Scholar] [CrossRef] [PubMed]
  12. Ravi, P.P.; Lindner, J.; Oechsner, H.; Lemmer, A. Effects of target pH-value on organic acids and methane production in two-stage anaerobic digestion of vegetable waste. Bioresour. Technol. 2018, 247, 96–102. [Google Scholar] [CrossRef] [PubMed]
  13. Rusmanis, D.; O’Shea, R.; Wall, D.M.; Murphy, J.D. Biological hydrogen methanation systems—An overview of design and efficiency. Bioengineered 2019, 10, 604–634. [Google Scholar] [CrossRef] [PubMed] [Green Version]
  14. Jarrell, K.F.; Kalmokoff, M.L. Nutritional requirements of the methanogenic archaebacteria. Can. J. Microbiol. 1988, 34, 557–576. [Google Scholar] [CrossRef]
  15. Westerholm, M.; Isaksson, S.; Karlsson Lindsjö, O.; Schnürer, A. Microbial community adaptability to altered temperature conditions determines the potential for process optimisation in biogas production. Appl. Energy 2018, 226, 838–848. [Google Scholar] [CrossRef]
  16. Chen, H.; Chang, S. Dissecting methanogenesis for temperature-phased anaerobic digestion: Impact of temperature on community structure, correlation, and fate of methanogens. Bioresour. Technol. 2020, 306, 123104. [Google Scholar] [CrossRef] [PubMed]
  17. Jones, B.; Goos, P. I-Optimal Versus D-Optimal Split-Plot Response Surface Designs. J. Qual. Technol. 2012, 44, 85–101. [Google Scholar] [CrossRef] [Green Version]
  18. Götz, M.; Lefebvre, J.; Mörs, F.; McDaniel Koch, A.; Graf, F.; Bajohr, S.; Reimert, R.; Kolb, T. Renewable Power-to-Gas: A technological and economic review. Renew. Energy 2016, 85, 1371–1390. [Google Scholar] [CrossRef] [Green Version]
  19. Froment, G.F.; Bischoff, K.B.; De Wilde, J. Chemical Reactor Analysis and Design; Wiley: New York, NY, USA, 1979. [Google Scholar]
  20. Thema, M.; Weidlich, T.; Hörl, M.; Bellack, A.; Mörs, F.; Hackl, F.; Kohlmayer, M.; Gleich, J.; Stabenau, C.; Trabold, T.; et al. Biological CO2-Methanation: An Approach to Standardization. Energies 2019, 12, 1670. [Google Scholar] [CrossRef] [Green Version]
  21. Sposob, M.; Wahid, R.; Fischer, K. Ex-Situ biological CO2 methanation using trickle bed reactor: Review and recent advances. Rev. Environ. Sci. Biotechnol. 2021, 20, 1087–1102. [Google Scholar] [CrossRef]
  22. Luo, G.; Angelidaki, I. Integrated biogas upgrading and hydrogen utilization in an anaerobic reactor containing enriched hydrogenotrophic methanogenic culture. Biotechnol. Bioeng. 2012, 109, 2729–2736. [Google Scholar] [CrossRef] [PubMed]
  23. Lin, L.; Xu, F.; Ge, X.; Li, Y. Biological Treatment of Organic Materials for Energy and Nutrients Production—Anaerobic Digestion and Composting; Elsevier: Amsterdam, The Netherlands, 2019; pp. 121–181. ISBN 9780128177105. [Google Scholar]
Figure 1. Simplified process scheme of the experimental plant.
Energies 16 04720 g001
Figure 2. Scatter plot demonstrating the correlation between the H2:CO2 ratio and the methane content of the product gas showing biomethane purity.
Energies 16 04720 g002
Figure 3. Methane content in the product gas at the different experimental setups, where the green line shows the threshold for high gas grid. The significant differences among methane content are marked with letters (p < 0.05, Tukey’s test).
Energies 16 04720 g003
Figure 4. Prediction profiler of JMP Pro showing the maximized desirability function for methane content (biomethane quality), hydrogen conversion and methane formation rate (MFR), where the red dotted lines indicate the calculated maximum (given as a red number on the y axis) at the optimum operating parameters (given as a red number on the x axis) and the blue lines indicate the confidence interval on the mean response (given as blue numbers on the y axis).
Energies 16 04720 g004
Figure 5. The parameters of the process liquid characterizing the homeostasis within reactors: (a) Boxplots of pH for each experimental phase; (b) graph reflecting fluctuations in the volatile fatty acid concentration in the reactors’ effluent during the experimental phases; letters mark significance according to Tukey’s test (p < 0.05).
Energies 16 04720 g005
Figure 6. Boxplots for different process parameters in the liquid: (a) Chemical oxygen demand, (b) total organic carbon, (c) total carbon, (d) total nitrogen; letters mark significance according to Tukey’s test (p < 0.05).
Energies 16 04720 g006aEnergies 16 04720 g006b
Table 1. Generated design of experiment by JMP Pro variating temperature and pressure.
Run IDTemperature (°C)Pressure (bar)
T50P9509
T50P2502
T50P5.5505.5
T55P5.5555.5
T55P9559
T55P4.275554.275
T60P2602
T60P9609
T60P5.5605.5
Table 2. Operation and performance parameters for all experimental phases.
ParametersT50P9T50P2T50P5.5T55P5.5T55P9T55P4.275T60P2T60P9T60P5.5
Temperature (°C)49.801 ± 0.28450.065 ± 0.23150.145 ± 0.20154.983 ± 0.25054.879 ± 0.26454.952 ± 0.25359.742 ± 0.29759.990 ± 0.059.99 ± 0.0
Pressure (bar)9.012 ± 0.0182.061 ± 0.0165.512 ± 0.0135.480 ± 0.0228.998 ± 0.0184.288 ± 0.0162.028 ± 0.0119.046 ± 0.0185.535 ± 0.013
pH8.921 ± 0.1288.458 ± 0.1018.689 ± 0.1318.745 ± 0.1068.837 ± 0.0828.762 ± 0.1118.673 ± 0.1069.013 ± 0.0888.949 ± 0.138
Flow rate H2 (L/h)11.25011.25011.25011.25011.25011.25011.25011.25011.250
Flow rate CO2 (L/h)2.8102.8102.8102.8102.8102.8102.8102.8102.810
Flow rate CH4 (L/h)3.4403.4403.4403.4403.4403.4403.4403.4403.440
MFR (m3/(m3·d))6.376 ± 0.3695.545 ± 0.2245.687 ± 0.2665.701 ± 0.1865.755 ± 0.3375.794 ± 0.3636.076 ± 0.2295.906 ± 0.2416.001 ± 0.386
CH4total 1 (%)95.614 ± 0.15193.675 ± 0.45295.614 ± 1.63294.386 ± 1.13794.784 ± 0.78195.626 ± 0.56395.015 ± 0.71494.929 ± 0.99294.214 ± 0.360
CH4conv 2 (%)48.102 ± 1.01746.574 ± 0.99647.425 ± 1.54347.584 ± 1.67048.483 ± 1.65747.285 ± 0.83447.203 ± 1.20150.000 ± 1.44348.873 ± 0.965
H2:CO24.072 ± 0.0034.106 ± 0.0094.068 ± 0.0314.095 ± 0.0244.089 ± 0.0154.070 ± 0.0134.083 ± 0.0144.087 ± 0.07194.100 ± 0.007
H2conv (%)97.535 ± 0.16696.394 ± 0.27497.288 ± 0.57996.790 ± 0.82797.042 ± 0.52597.608 ± 0.38297.127 ± 0.35497.115 ± 0.67996.616 ± 0.264
CO2conv (%)99.767 ± 0.02699.600 ± 0.13799.569 ± 0.16499.820 ± 0.08599.884 ± 0.03399.784 ± 0.08199.811 ± 0.03799.942 ± 0.00899.895 ± 0.021
RT (h)5.5791.2403.4093.3575.4942.6101.2035.4113.307
GHSV (h−1)1.0821.0821.0821.0821.0821.0821.0821.0821.082
1 CH4total is the share of methane in the product gas mixture. 2 CH4conv is the share of the microbiologically produced methane in the amount of total methane CH4total.
Disclaimer/Publisher’s Note: The statements, opinions and data contained in all publications are solely those of the individual author(s) and contributor(s) and not of MDPI and/or the editor(s). MDPI and/or the editor(s) disclaim responsibility for any injury to people or property resulting from any ideas, methods, instructions or products referred to in the content.

