Abstract
In the middle and late stages of gas field development, the establishment of a fine reservoir lithological model is an important basis for drilling well pattern adjustment and potential exploitation. The SU 36-11 area of the Ordos basin in China is developing braided channel sediment with rich gas resources. However, the success rate of drilling wells is low due to the complex reservoir heterogeneity and the lack of a fine reservoir lithological model. In this paper, the complex internal structure of the reservoir sand body is revealed using the architectural element analysis method. Three sand body models, that is, isolated channel, superimposed channel, and cut superimposed channel, can be recognized. The effective sand body is mainly the channel bar deposit with a thickness of 2–5 m, a width of 200–500 m, a length of 400–700 m, a width ratio of 50–120, and a length-to-width ratio of 1.5–2. The 2D maps of the lithofacies (architectural elements) were then digitized to create 2D training images (TI) for the construction of the 3D model. The 2D data template was selected to scan the TI to obtain the 2D multi-point probability. The 3D multi-point probability was then generated using the probability fusion theory. The Monte Carlo sampling was used to predict the lithological type between wells. Finally, the 3D reservoir lithological model was built directly using the 2D lithological profiles. From the model, the geometry of the braided channel, channel bar, and flood plain was well revealed, and the spatial distribution of effective reservoir sand bodies was accurately predicted. The cross-validation test shows that the error of the channel bar is 6.5% on average, which improves the accuracy of the prediction of lithology in the sub-surface and can be used to guide the subsequent development of residual gas.
1. Introduction
The Sulige gas field is located in central Ordos Basin, which is a typical representative of a tight sandstone gas field in China [1,2,3,4,5,6,7]. At present, the large-scale development of gas fields has been realized through several technologies, such as gas enrichment area forecasting and low-cost development technology, and gradually entered the stage of stable production from the upper production stage [8]. With the progress of gas field development, the coverage degree of the well pattern is becoming higher and higher, but the ratio of gas recovery is still lower. There are some difficult problems such as how to further characterize the distribution characteristics of residual gas, optimize well pattern deployment, and improve gas recovery [9,10,11,12]. It is urgent to reveal the complex mode of effective reservoir sand bodies and establish fine geological models to lay a foundation for the solution to the above-mentioned problems.
The SU 36-11 area is a typical gas reservoir of the Sulige gas field, which was put into development earlier. In this paper, taking the SU 36-11 area as an example, the sand body size is re-recognized through the fine hierarchical reservoir characterization in the local dense well area, and the effective reservoir sand body overlapping style and spatial distribution characteristics are revealed. On this basis, the complex internal architecture and superimposition mode of sand body in the whole area is forecasted. Given the wide range of the study area and the relatively small number of drilling wells, 2D geological profiles are taken as the direct constraints for modeling and reconstruction of 3D lithological model, which lays a solid foundation for future well pattern deployment and optimization.
Regional Overview
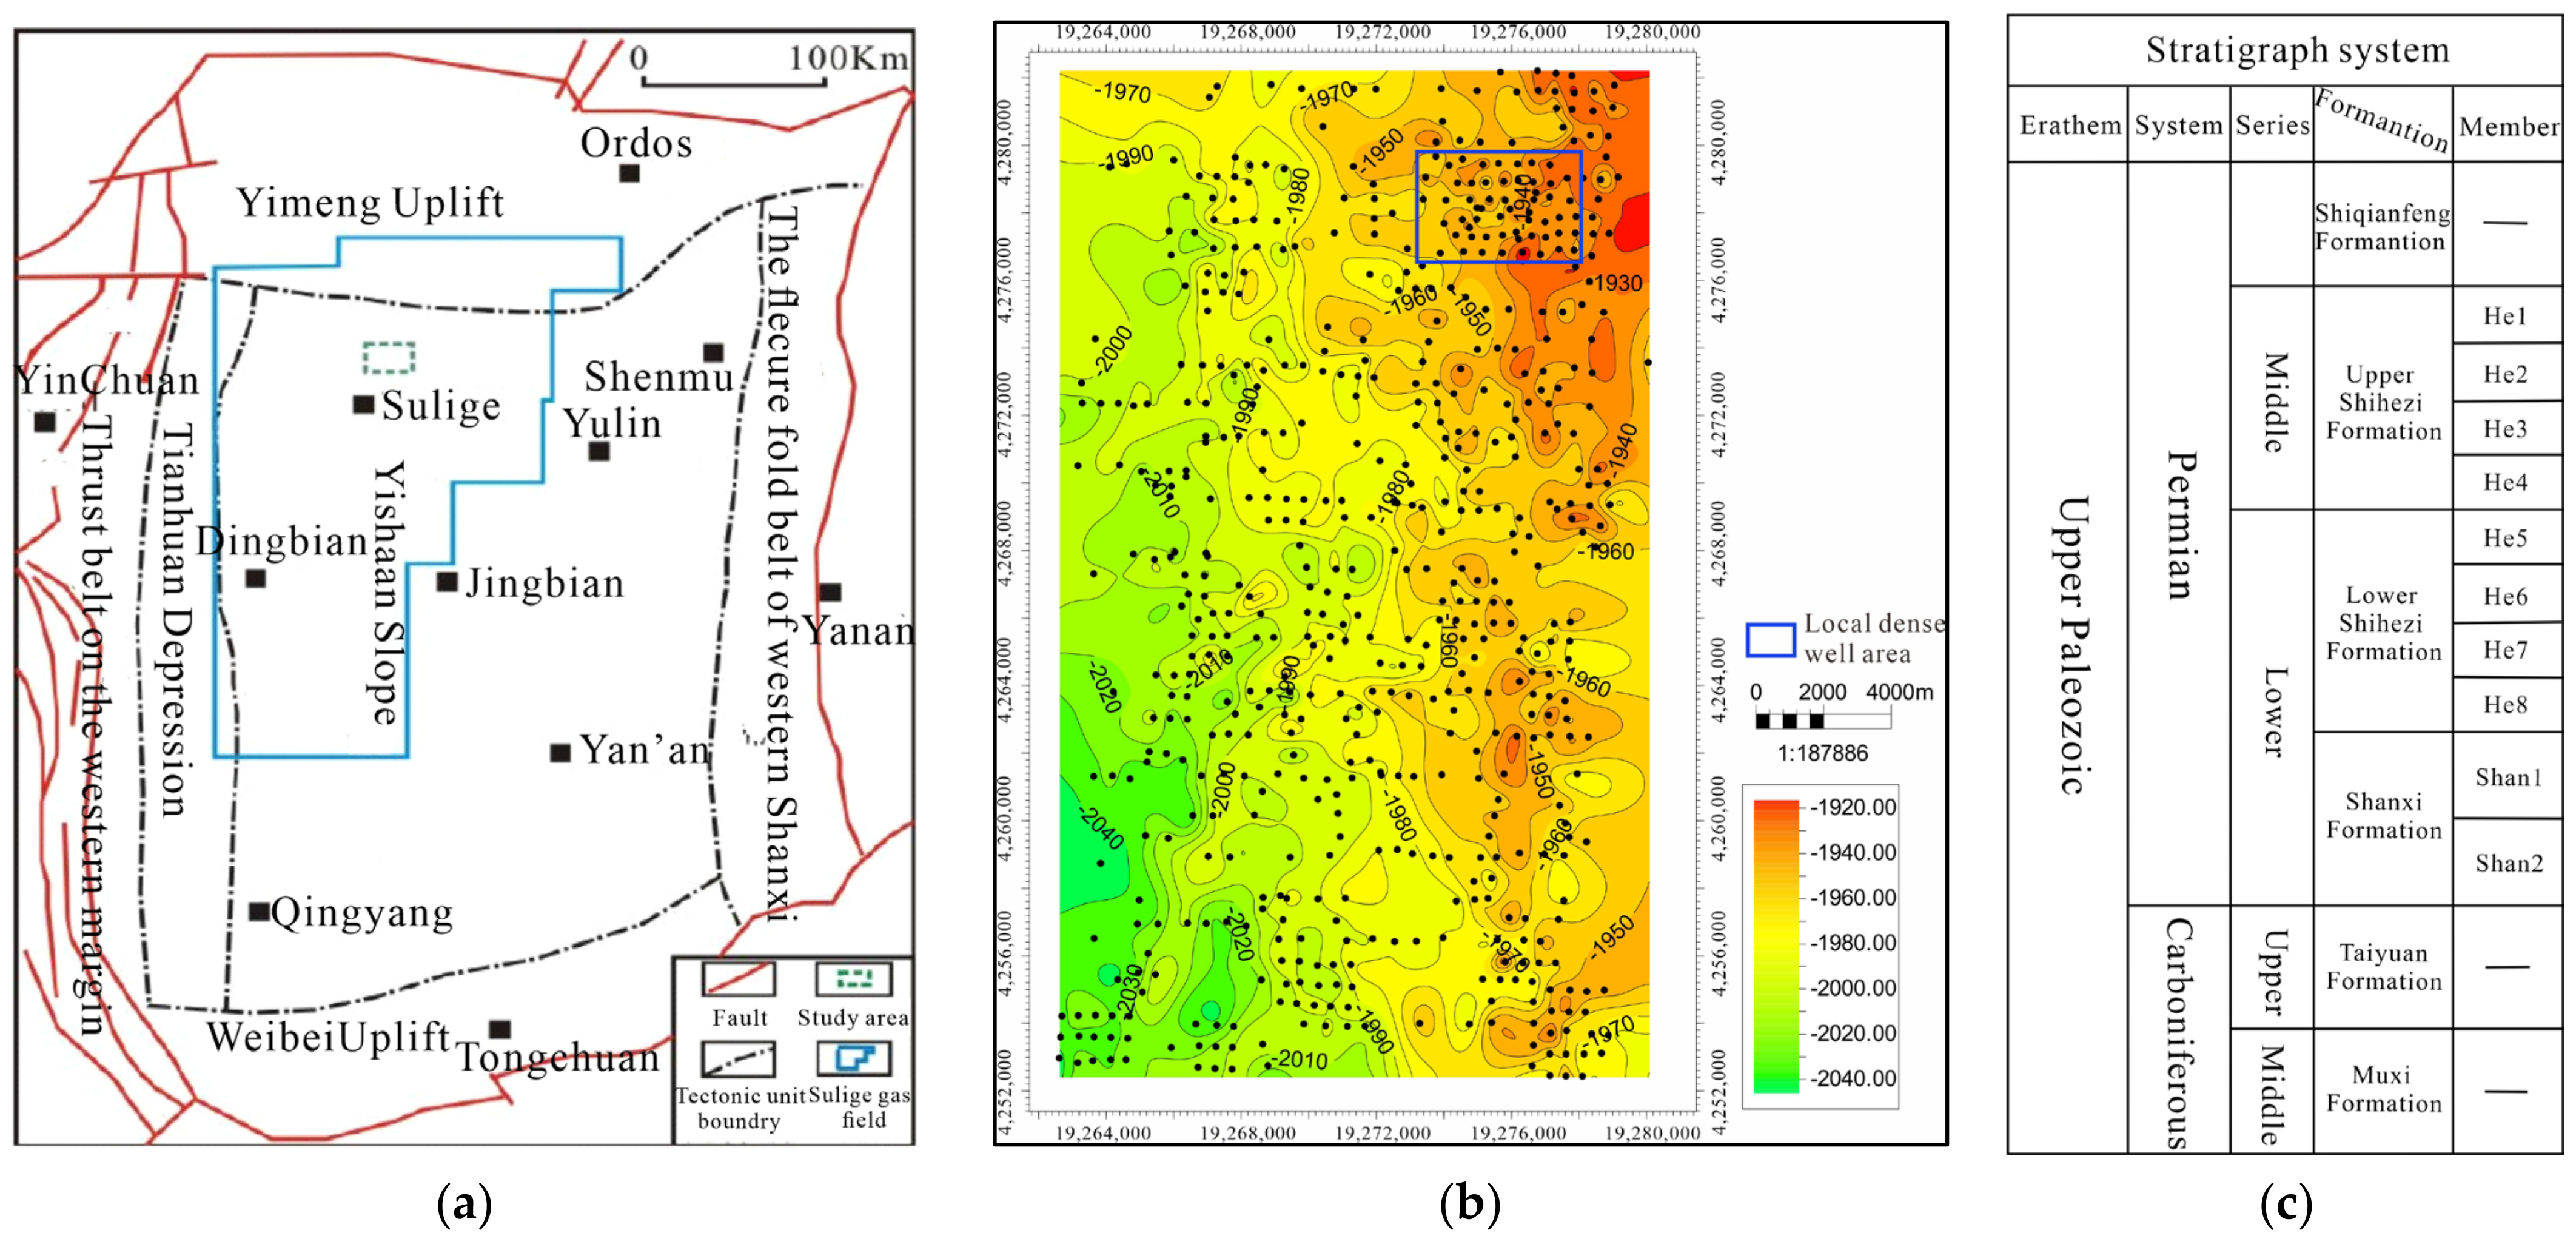
The SU 36-11 area is located in the territory of Otoke Front Banner, Inner Mongolia, in the middle of the Sulige gas field (Figure 1). The regional structure belongs to the northwest part of the Yishan slope of the Ordos Basin, showing a wide gentle slope with no fault development [13,14,15]. The total area of the area is 492 km2, and the whole area is gas-bearing. The gas-bearing strata are mainly H8 Member of Permian Lower Shihezi Formation and S1 Member of Shanxi Formation, which are typical tight sandstone gas reservoirs [16,17,18]. The drilling data reveal that the sandstone in the area is well developed and located in the same braided river depositional system. Controlled by multi-phase spatial migration of braided river and cutting and overlaying, vertical sand bodies are overlaid in multi-phase and distributed in contiguous patches in the whole area [19]. The sandstone area ratio is 30–50% and the drilling rate of the sand body is 70–90%.
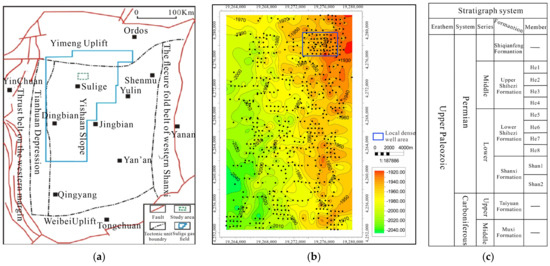
Figure 1.
Well location and structure superposition of the SU 36-11 area in the Sulige gas field of the Ordos Basin. (a) Ordos regional map. (b) Structure diagram of the SU 36-11 area. (c) Stratigraphic characteristics of the Ordos Basin.
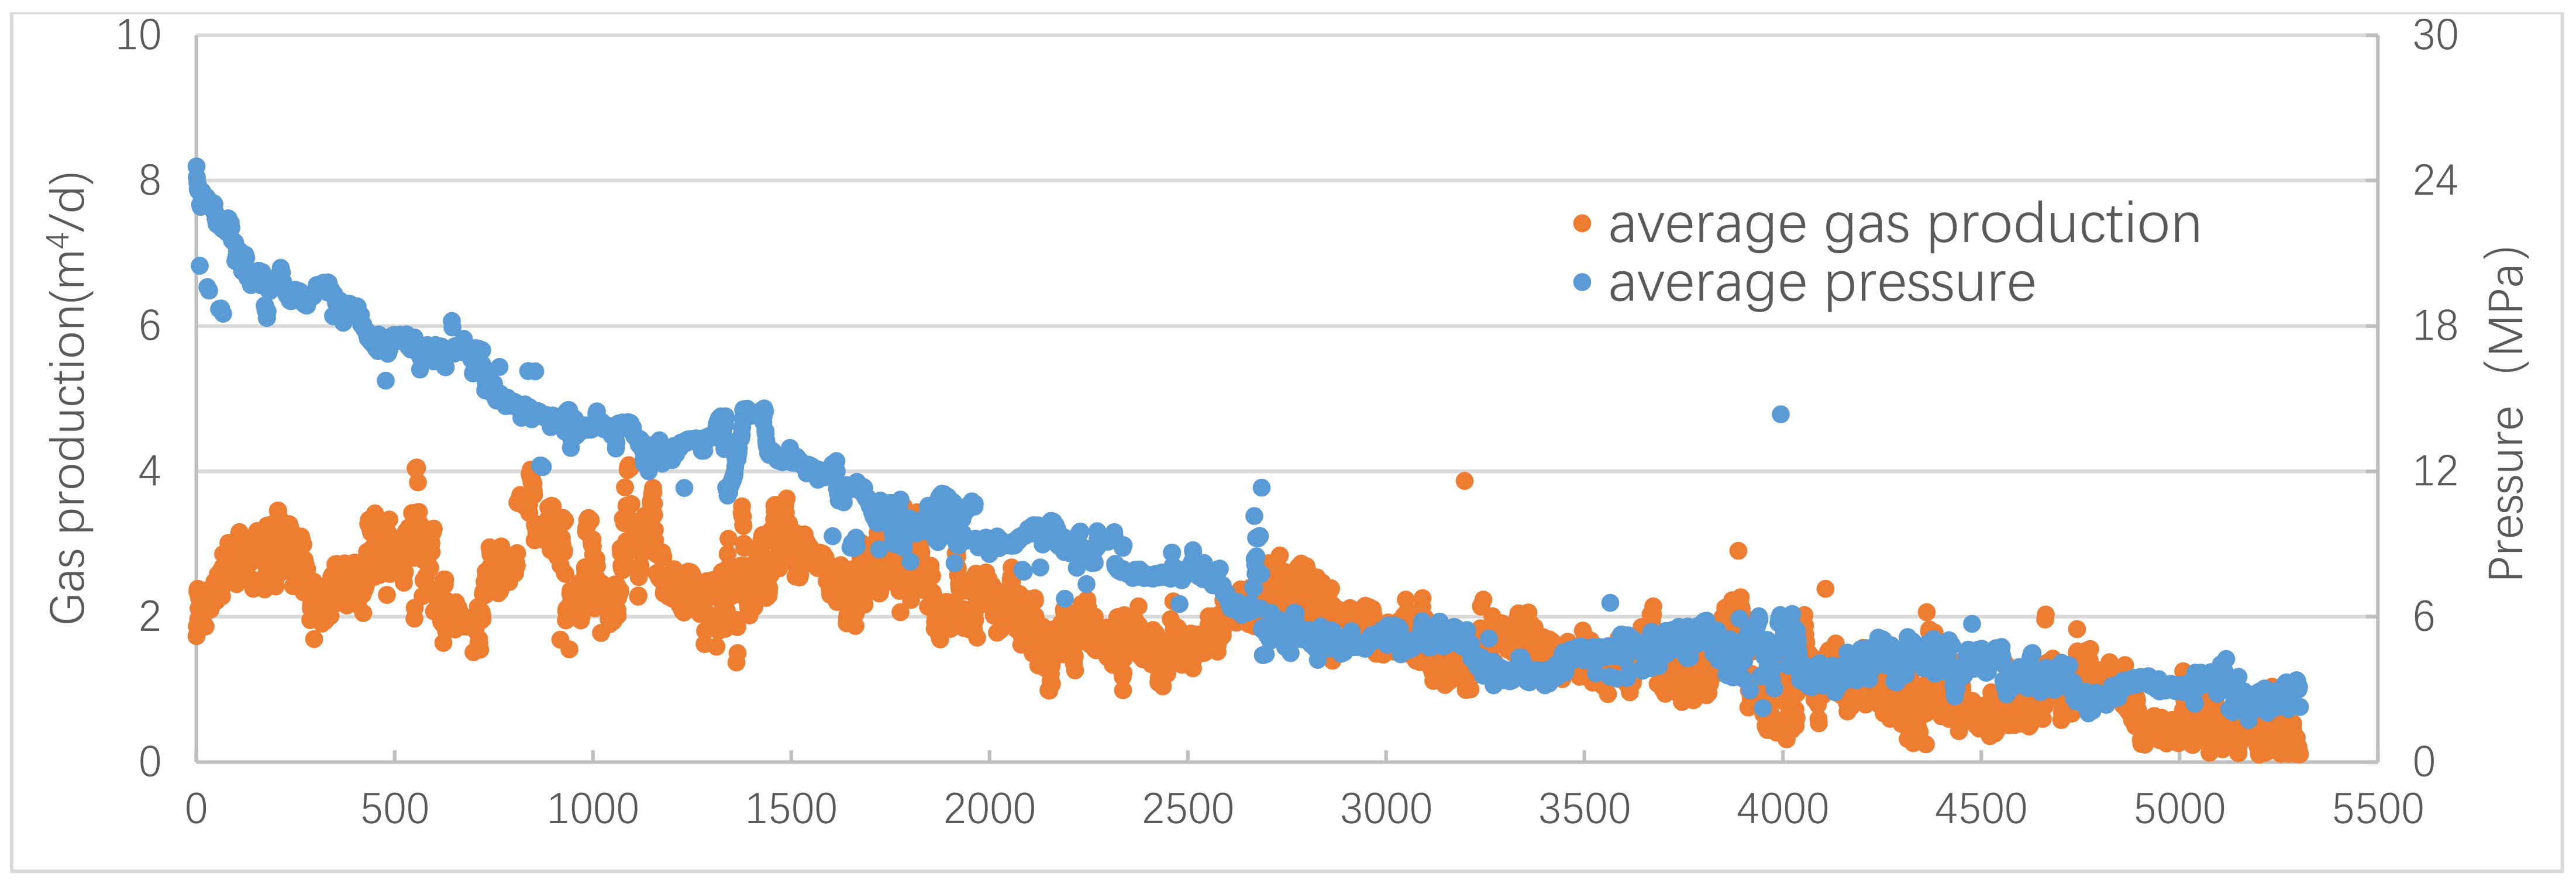
At present, the well density is close to three wells per square kilometer, relatively large for detailed characterization of the complex distribution of the effective sand bodies. Thus, gas production is declining due to the low success of the drilling wells (Figure 2). However, there are dense wells in the local area, which provides a base for reservoir hierarchical element analysis to reveal the internal structure, dimension, and superimposition mode of the sand bodies. The results of the anatomy provide a reliable 3D lithology model for fine reservoir characterization, residual gas distribution prediction, and well pattern optimization deployment.
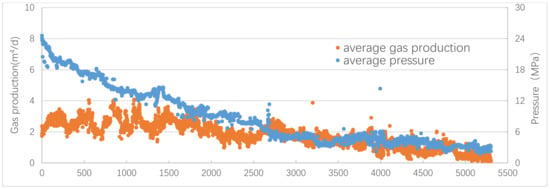
Figure 2.
Gas production data in the SU 36-11 area.
2. Reservoir Sand Body Architecture
2.1. Sedimentary Facies
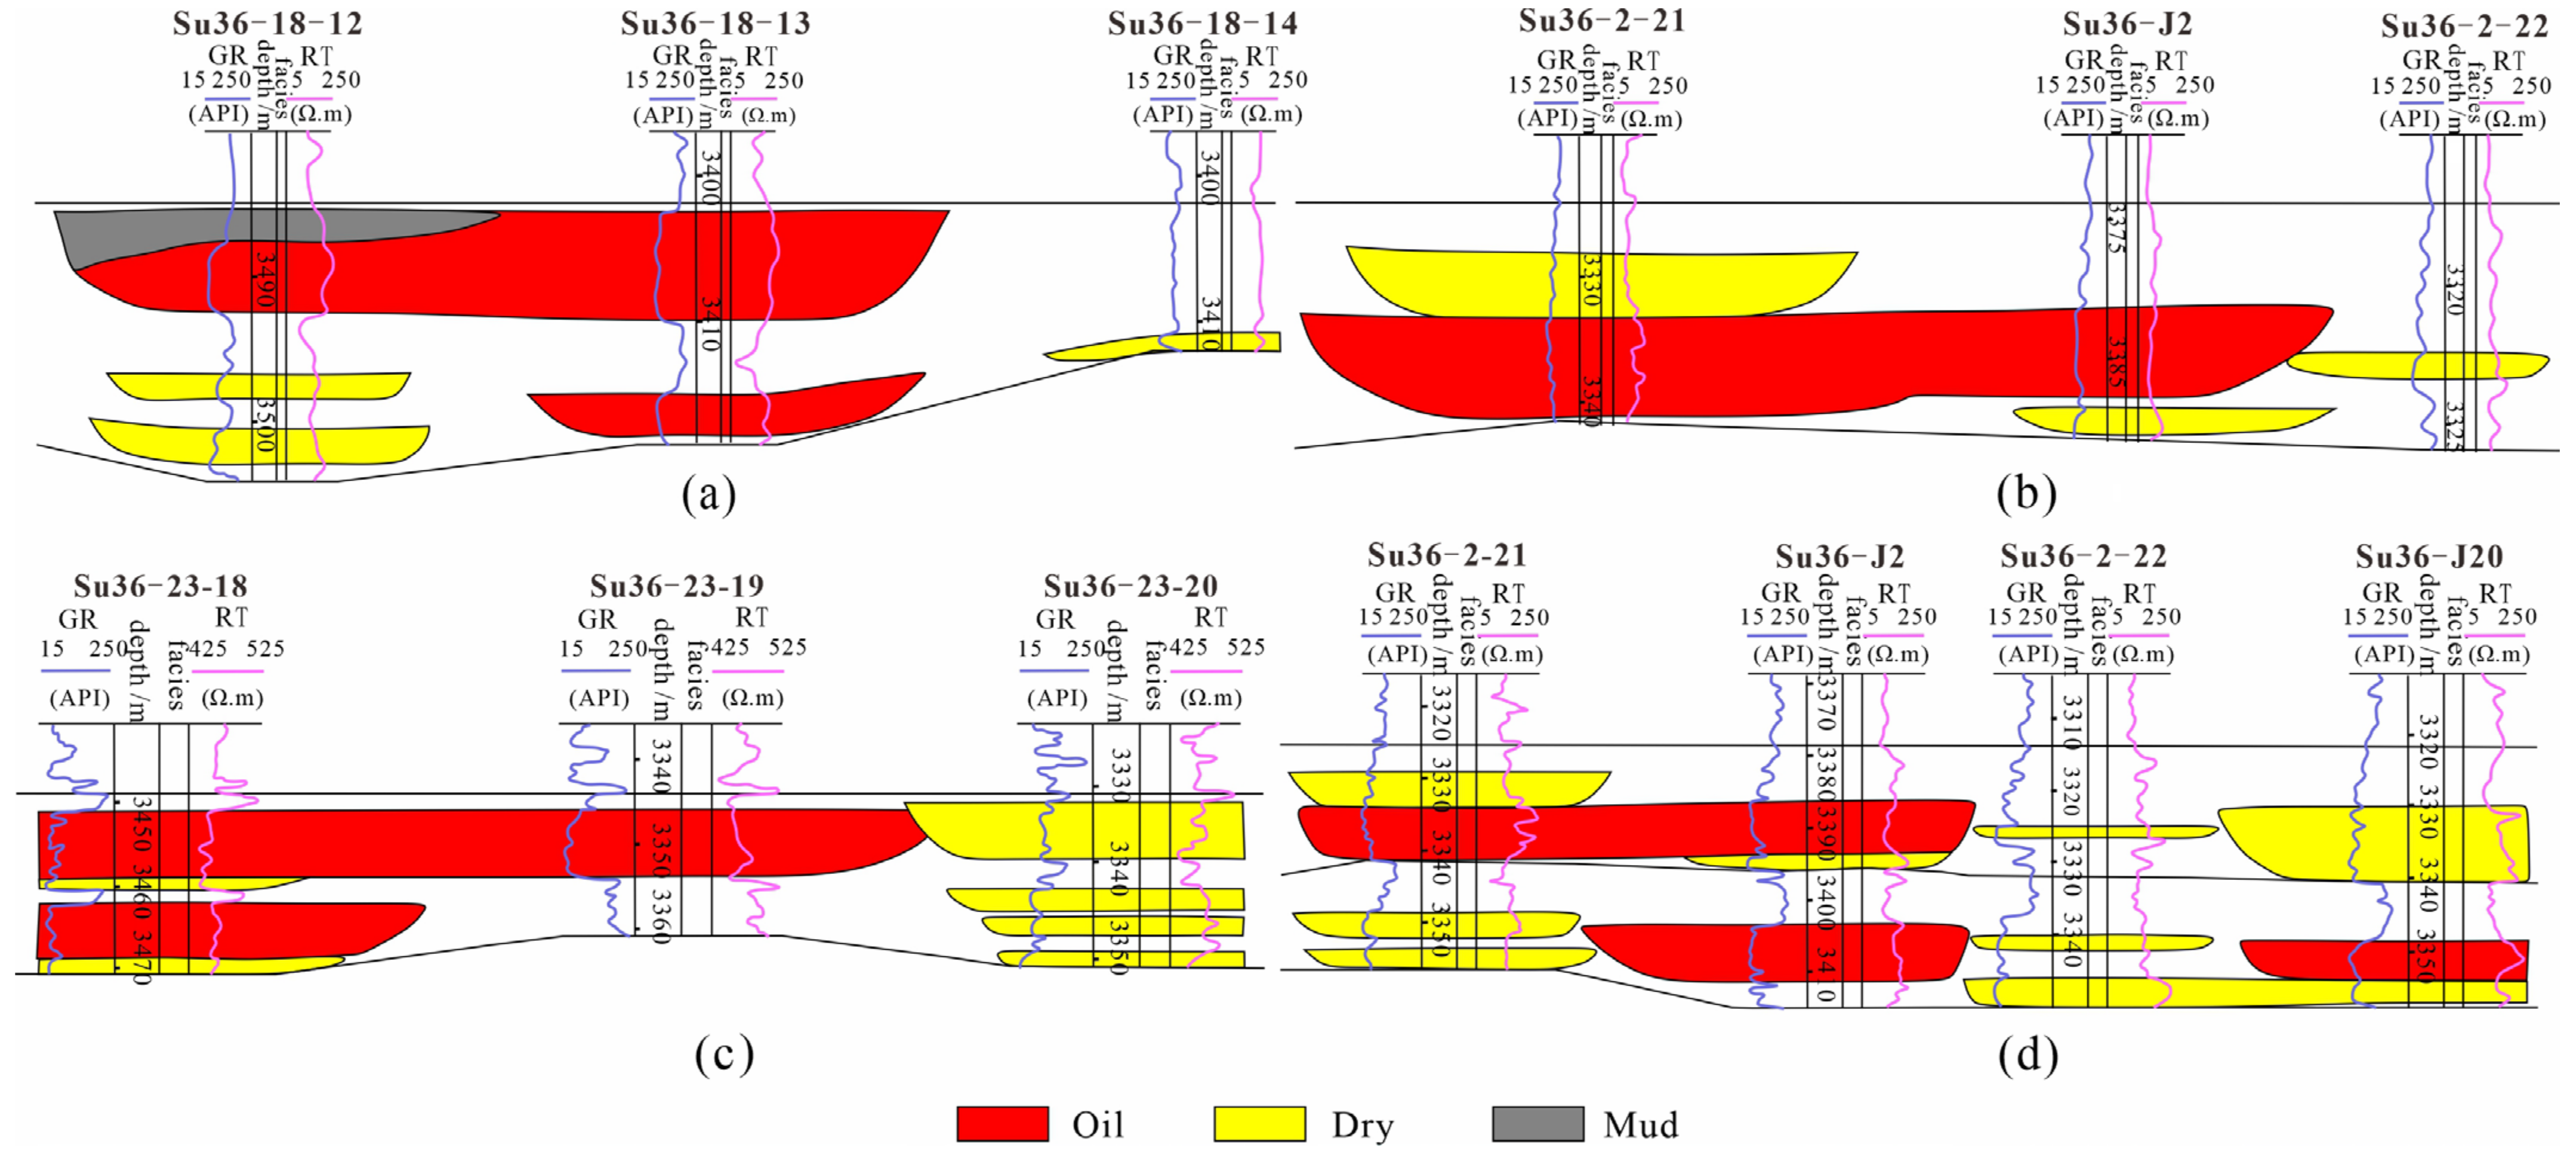
Previous studies and regional depositional background determined that H8 Member and S1 Member in the study area were braided river deposits [14,20,21,22,23]. The drilling wells of the SU 36-11 area shows that the sand body is very developed, the average thickness of each small layer is about 6.2 m, and the average drilling ratio of the sand body is 76.8%, which reveals that the area has strong hydrodynamic conditions, active channel deposition, frequent migration and swing, and typical braided river deposition characteristics (Figure 3 and Figure 4). According to the braided river sedimentary model, combined with the core and logging analysis results, the SU 36-11 area is divided into three micro-facies types, including braided channel, channel bar, and floodplain (Table 1). There is a small amount of overbank deposit, but the sand body thickness is small, and it is not an effective reservoir, so it is considered the same as the floodplain.
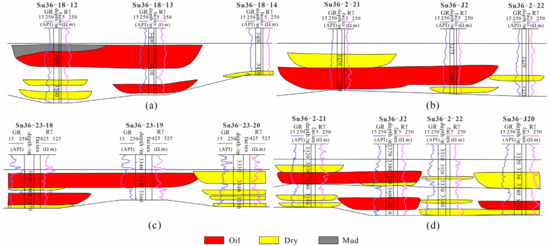
Figure 3.
Channel sand body comparison mode diagram. (a) Equal-elevation comparison mode. (b) Subdivision and correlation mode of superimposed sand body. (c) Comparison mode of channel down cut. (d) Transverse facies transition mode.
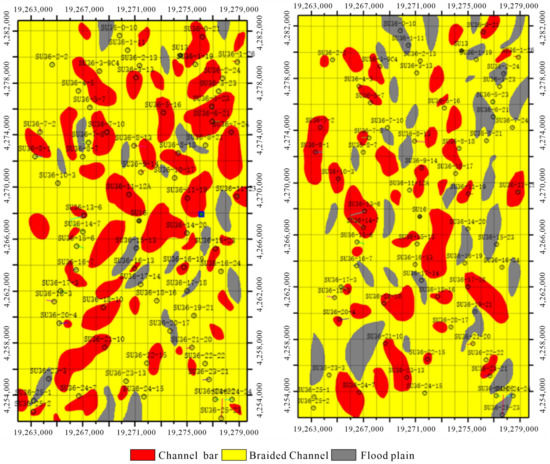
Figure 4.
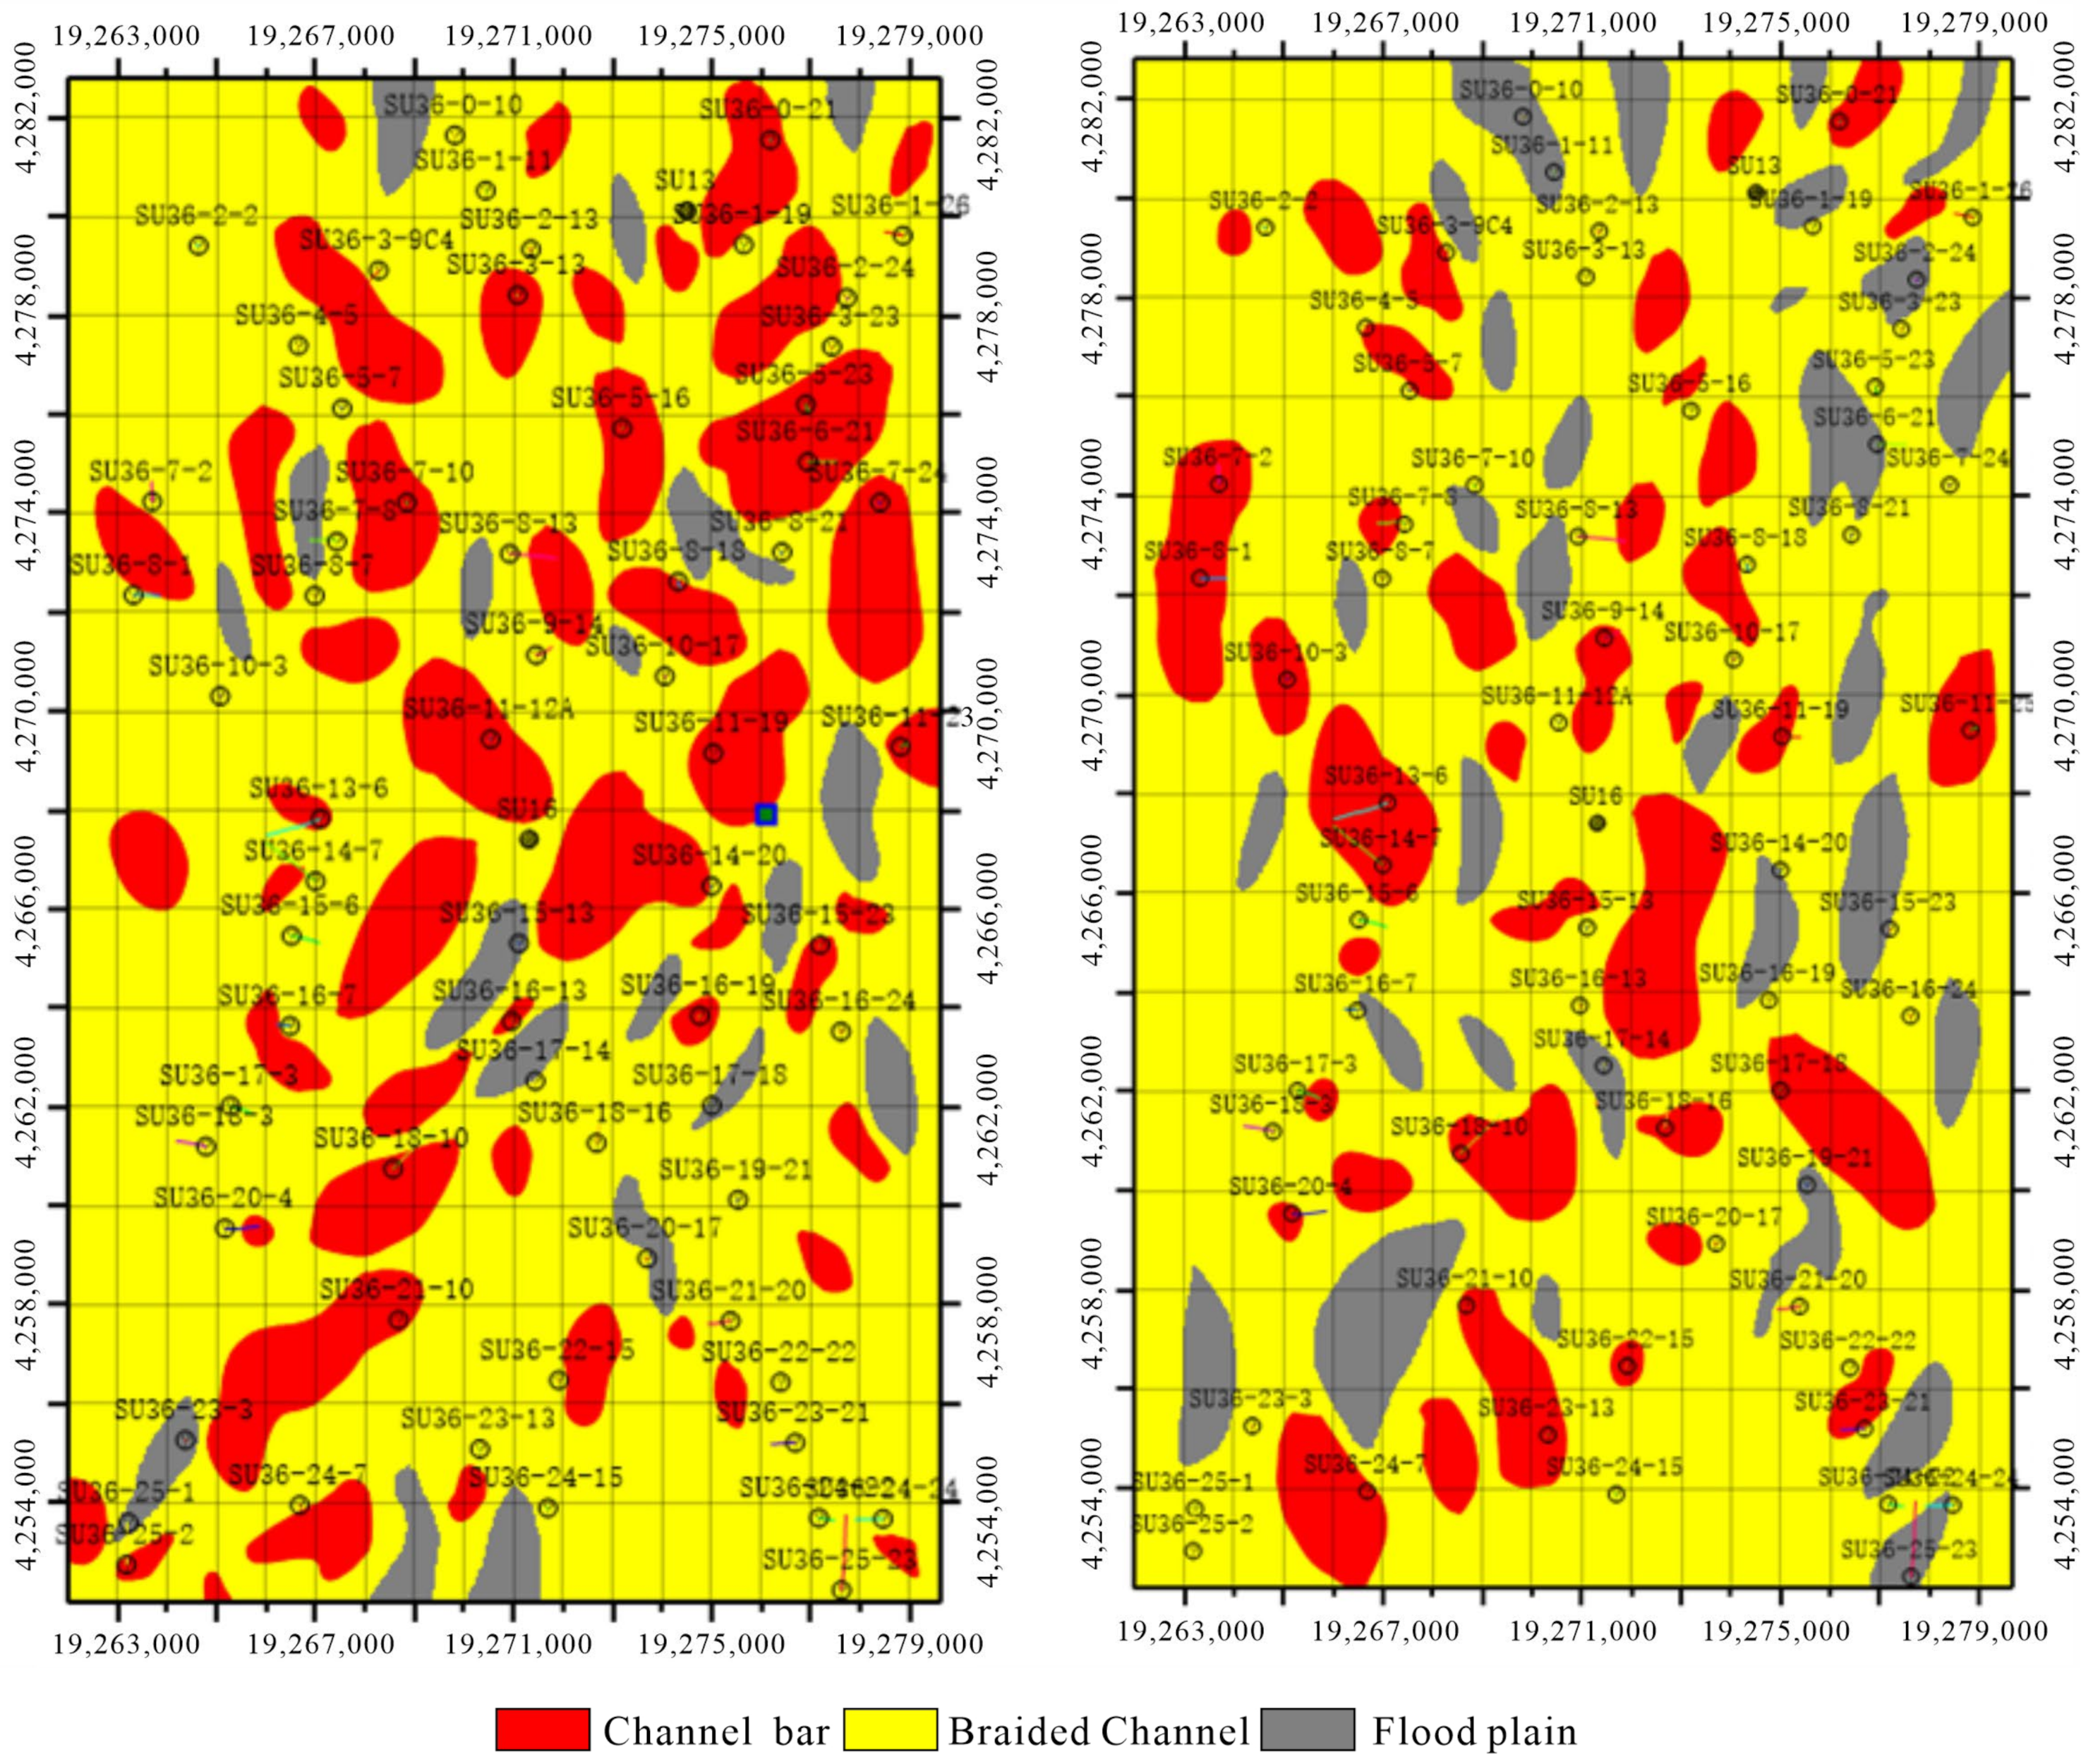
Sedimentary facies distribution of braided river in the study area (H82_1 on the left, S1–2 on the right).

Table 1.
Configuration element types and identification markers in the study area.
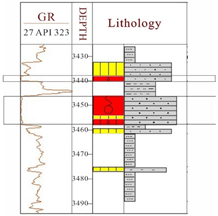
The channel bar is a micro-facies type with the largest sand body thickness and coarsest grain size in the area. It is distributed in the middle of the braided channel and is the most hydrodynamic sedimentary body. The thickness of a single sand body can reach more than 5 m (Table 1), and the thickness of a continuous superimposed sand body can reach more than 10 m. The Gamma Ray (GR) logging curve can reflect the lithological type and is mainly box type or tooth box type in sandstones.
The braided channel is the main channel of water flow, and the channel retention deposit is often developed at the bottom. Through the scouring surface, the channel contacts the underlying layer, forming a positive grain sequence with a coarse bottom and fine top. The filling lithology is mainly coarse and medium sandstone, the thickness is generally 3–5 m, and the overlay thickness can reach more than 10 m. The GR logging curve is bell-shaped or sawtooth box-shaped, and its amplitude is slightly smaller than that of the channel bar (Table 1).
The sediment of the flood plain was distributed among braided channels, and the sediment granularity was fine, siltstone, and mudstone. The GR logging curve was low amplitude and small sawtooth (Table 1).
Based on the results of the coring well analysis, the typical rock electricity relationship maps are established to guide the sedimentary facies analysis (Table 1). The facies profile is analyzed to reveal the characteristics of sand body distribution and frequent migration and dimension change of braided rivers. Four sand body correlation models were established (Figure 3).
- (1)
- Equal-elevation comparison mode
The total sediment thickness in the channel reflects the full bank depth of the ancient river, so the top surface of the channel sediment in the same river has the isochronous surface, and its top surface should have roughly equal elevation from the standard layer or an isochronous surface. For the channel sand body, because the channel of the same genetic unit is affected by sedimentary paleotopography, channel diversion, or abandonment, there are differences in the top and bottom levels of the channel sand body.
- (2)
- Subdivision and correlation mode of superimposed sand body
According to the curve, most of the returnees are developed mudstone or argillaceous sandstone, reflecting the characteristics of a superposition of the channel sand body. In the transverse direction, multi-stage superposition or a cut superposition channel can be identified through the division of channel sand bodies and the comparison of adjacent wells, and the comparison of channel sand body can be carried out.
- (3)
- Comparison mode of channel down cut
In the process of river development, adequate provenance and strong water flow often form channel down cut, resulting in changes in the thickness of a single layer of channel sand body. Therefore, the comparison cannot be made according to equal thickness.
- (4)
- Transverse facies transition mode
The lateral facies transformation of river sediment is fast, and the channel, overflow bank sand, and mudstone of flood plain interact with each other, all of which belong to the simultaneous deposition. Therefore, different log curve forms, such as box-shaped and finger-shaped, may be isochronous deposition.
On this basis, the sedimentary facies distribution model was completed (Figure 4). As can be seen from Figure 3, braided river sand bodies are scattered throughout the study area. The small-scale flood plain is distributed with an elliptical shape, which reflects the characteristics of frequent migration of braided rivers. The channel bar varies in size, with large ones more than 2000 m long and small ones less than 500 m long. The distribution of different scales of the channel bar is also relatively random, from north to south, and the frequency of development is very close. The extension direction of the long axis of the channel bar is mainly north–south, and the extension direction is slightly offset due to the influence of the flow direction of the river. The statistical stability of the channel bar distribution in the study area lays a foundation for the subsequent statistical prediction of sand bodies (Figure 4).
2.2. Effective Sand Body Distribution
Although sand bodies are widely distributed in the SU 36-11 area, the effective sand bodies are mainly formed by coarse lithofacies at the bottom of the channel bar and channel, and the rock types are medium and coarse sandstone. The thickness of the effective sand body only accounts for about 30% of the thickness of sandstone, which is lens-like and has poor continuity (Figure 5).

Figure 5.
Profile view of effective sand body correlation between SU36-2-5 and SU36-3-9C4.
In the early stage of field development, the number of wells is small, and well spacing is large, so it is difficult to describe the scale of the effective sand body. In recent years, the density of the well pattern has been increasing, and the well spacing has been narrowing. The dense well spacing grid provides more information for effective sand body characterization. The distance of most wells is 500 to 650 m laterally and 600 to 700 m longitudinal. Some dense well grids are about 400 to 550 m laterally and 500 to 650 m longitudinal. The densest area is between 300 to 500 m laterally and 350 to 600 m vertically, which lays the foundation for the characterization of the sand body to provide the scale and superimposition mode for further study.
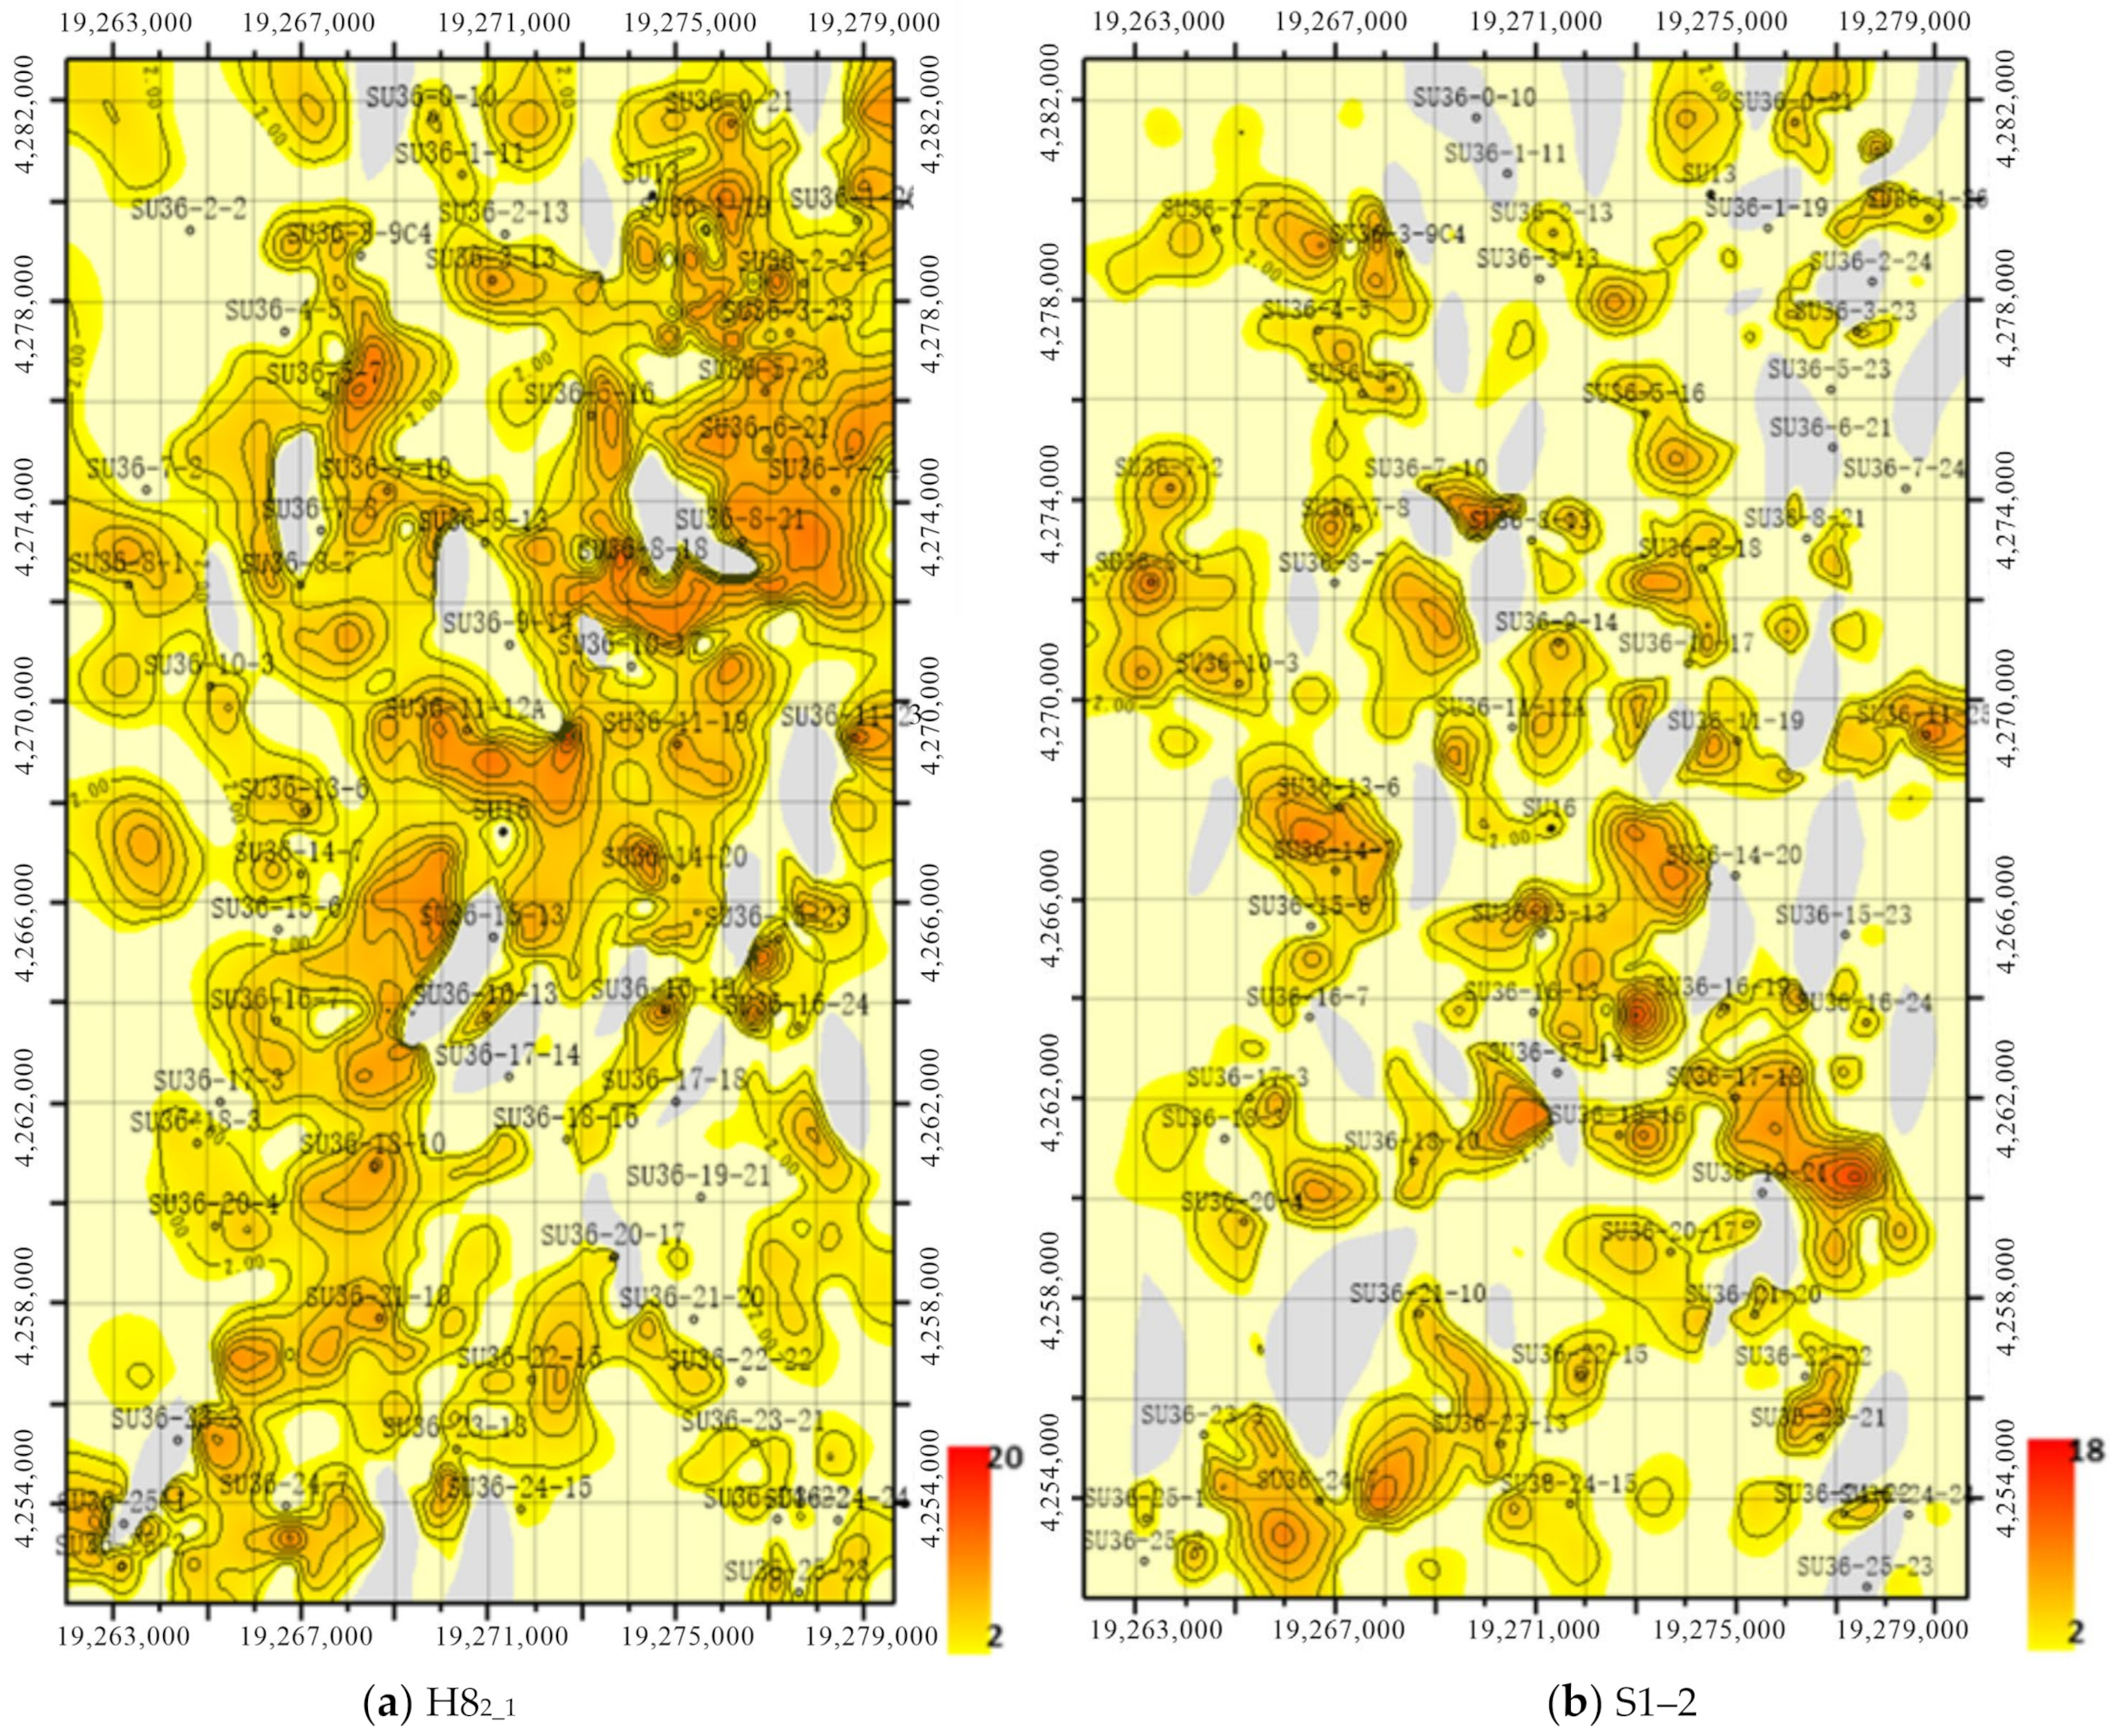
Based on the fine correlation of the profile in the dense well area, the connectivity between effective sand bodies was conducted (Figure 5). The results showed that the continuity between effective sand bodies was poor in most wells, generally no more than one well spacing. A single effective sand body has a thickness of 2–5 m, a width of 200–500 m, and a length of 400–700 m, with a width-to-thickness ratio of 50–120 and a length-to-width ratio of 1.5–3 (Figure 5 and Figure 6). Compared with the understanding of effective sand body size at the initial stage of development, the anatomization results based on the dense well area revealed that the overall effective sand body size was much smaller, which also indicated that the effective sand body heterogeneity is significantly complex.
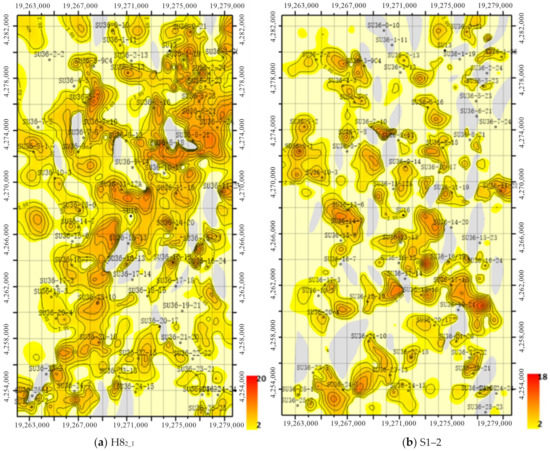
Figure 6.
Plane distribution of effective sand bodies in the study area. (a) Plane distribution characteristics of effective sand body in H82_1. (b) Plane distribution characteristics of effective sand body in S1–2.
2.3. Typical Sand Body Superimposition Styles
Sand bodies in the SU 36-11 area are developed in contiguous pieces, and effective sand bodies are distributed in the form of isolated or laminated lens bodies, which constitutes the binary structure of sandstone covering sandstone (Figure 7). The gas field has a vertical multi-layer system, and the effective sand body of small size is distributed in multiple layers, forming the vertically staggered superposition and the horizontal multi-layer continuous distribution. Meanwhile, the gas field is dominated by vertical well multi-stage fracturing and co-formation production, making the study on the characteristics of the vertical effective sand body combination particularly important and a significant basis for the optimization of well pattern deployment and the basis for determining the gas production capacity.

Figure 7.
Channel sand body distribution model.
Channel sand bodies are affected by autogenetic cycles (channel down cutting, channel migration, channel filling, etc.), and different channels can be combined according to the degree of the channel down cutting, which forms different effective sand body superimposition modes. Based on the previous geological anatomy, the structural styles of the sand bodies in the study area are divided into three categories, including isolated channels, superimposed channels, and cut and overlapping channels (Figure 7).
Isolated channel: The sub-channel is separated by an obvious continuous distribution of floodplain mudstone, channel cut, and river bottom retention deposit; the mudstone section log curve has an obvious return; and the sandstone section is box type or bell type. This type of effective sand body is small in thickness and typically has low production per well (Figure 7a).
Superposition channel: The sand bodies of different channels are connected at different times, and mudstone inter-layers are developed inside the sand body. The logging curves have an obvious peaking return. With large effective sand body thickness and high single well production, it is a favorable well placement area (Figure 7b).
Cut and overlapping channel: The channel is cut and overlapped with each other at different times. There are scour surfaces at the bottom of the channel, rarely mudstone inter-layers, and the logging curve is slightly returned. It has the characteristics of multi-stage channel development for adjacent wells. Large effective thickness and wide distribution range, suitable for the deployment of horizontal well development (Figure 7c).
3. 3D Lithological Modeling
Conventional 3D geological modeling is mainly based on well data analysis, using sequential indicator modeling or object-based modeling to construct the model (See Clayton, 1992). Because object-based modeling is difficult to apply to the dense well area for the conditioning problem, the two-point statistics are insufficient in the reconstruction of reservoir continuity. Therefore, the multi-point geo-statistics methods, which describe the reservoir configuration through the 3D training image, extract the reservoir mode through the data template, and establish the model by matching the well point, are the priority for model construction. However, 3D training image (TI) acquisition is a nutshell in using multi-point geo-statistics methods for real reservoir forecasting. Many scholars provided solutions such as an unconditional object-based stochastic simulation method, interpretation from the high-resolution seismic record, and digitizing the facies map. However, the process is time-consuming, and the representative of the TI needs to be evaluated. A suitable TI is very difficult to acquire. In contrast, the rich geological anatomical results using the dense well constraint are not put into use in reservoir stochastic modeling. Thus, the relationship between the facies profiles made by geologists and the lithological model by geo-modelers is separated, and finally the models are doubted to have any geological meanings. Therefore, how to reconstruct 3D model directly from geological profiles has become a research hotspot.
The method of reconstruction of the 3D geological model from 2D profiles was first proposed by Okabe [24], which was mainly applied to the establishment of the pore-throat model. According to the probability fusion of different pore-throat slices, 3D distribution probability was obtained, but the heterogeneity of the micro-pore–throat structure was not considered in the process. Zhang [25] and Comunian et al. [26] improved the method of reconstruction of 3D geological models from 2D profiles. Based on multiple orthogonal 2D profiles, the probability fusion method was adopted to finally realize the reconstruction of the 3D model. However, this method still needs further research in terms of macroscopic sand body continuity and non-stationary statistics. Chen [27] proposed local stability based on natural section segmentation to better solve the problem of non-stationarity. However, compared with the rich reservoir structure information provided by 3D training images, the structure information provided by 2D profiles is relatively insufficient, which leads to the difficulty of the reproduction of reservoir continuity. To solve this problem, Wang et al. [28] proposed adaptive spatial sampling to add conditional constraints for the enhancement of continuity. Through a strategy similar to multi-grid simulation, the simulation results are resampled, and the number of conditional points is increased as a constraint to improve the continuity. Moreover, the abundant plane and profile data are considered conditional data, which ensures the anatomization results are included in the model construction. This method is used to build and evaluate the model of Su36-11.
3.1. Modeling Method
The core content of the reconstruction of the 3D geological model from the 2D profile includes probability fusion, 2D conditional probability, and simulation based on adaptive spatial sampling [21].
3.1.1. Probabilistic Fusion
Probability fusion is a method based on 2D orthogonal profile probability fusion to form 3D probability [29,30]. Generally speaking, the linear pooling addition formula is adopted to realize probability fusion in the same direction. The multiplication formula of log-linear pooling is adopted to realize probability fusion in different directions. Specifically, for any point to be estimated, the number of directional profiles in the fusion process is m(1 ≤ m ≤3), and the number of adjacent profiles in each direction is n(1 ≤ n ≤2). At the unstimulated point x, matching data events should be retained first, then the probabilities of data events on different profiles should be extracted, and the fusion probability in this direction can be obtained based on the addition formula:
where Z(x) represents the desired value of the point to be evaluated, represents the distance from the evaluated point x to the adjacent profile in the same direction, and represents the relative weight value when the adjacent profile is fused in the same direction.
After the fusion probability in the corresponding direction is obtained, the conditional probability in each orthogonal direction can be fused based on the multiplication formula to obtain the final conditional probability density function :
represents the prior probability, and w represents the relative weight value of each orthogonal direction profile fusion.
Note that when , the prior probability distribution does not influence fusion probability. The values of weights in different directions can be the same or different. In general, to highlight the heterogeneity of deposition, inverse distance weighting is used as the basis of weight value:
3.1.2. 2D Conditional Probability
Before probability fusion, it is necessary to obtain the probability of the data event composed of the surrounding condition data. This probability is obtained by scanning the adjacent 2D profiles. The search tree method in the Snesim method is adopted to obtain the conditional probability. The basic steps are as follows:
- (1)
- For any direction, the conditional data points in that direction are obtained by the 2D data template, which constitutes 2D data events.
- (2)
- Scan 2D training images in any direction to determine the matching data event.
- (3)
- The occurrence times of different sedimentary facies at the estimated point are counted.
- (4)
- The occurrence frequency of different sedimentary facies approximates the 2D conditional probability of the estimated point:
3.1.3. Simulation Based on Adaptive Spatial Sampling
Compared to the fully 3D training image, the reservoir model predicted by the profile-based local scanning strategy is limited. Moreover, in a local scope, there are fewer conditional data points, which leads to fewer optional data events in the process of simulation and affects the subsequent simulation. To avoid its influence, Wang [28] et al. put forward the adaptive spatial iterative sampling strategy. The method first evaluates the simulation results, then determines the trusted region to decide the portion of the simulated grid to be transferred as conditional data for the next simulation, and finally repeats the modeling process until the termination criteria are achieved.
To realize iterative resampling, the sampling part of the trusted region in the previous simulation results can be taken as the additional conditional data in the iterative process. Taking any point as an example, the trust region of the point is
where d is the mode distance, is the fusion probability, and r is the number of candidate phases.
The above formula represents that when the distance of a certain point in the simulation results is less than 10%, the fusion probability of a facies is greater than 85%, and its credibility C is 1. Otherwise, C is 0. All point sets with a confidence of 1 can be taken as the confidence region and retained as conditional data to provide constraints and guidance for the next iteration. This time, the model distance error is set to a relatively large 10% for the case of the sparse well pattern. However, for the fusion probability, a higher threshold of 85% is set to ensure that the points with higher probability are retained to reduce the impact of untrustworthy prediction points on the accuracy of the model.
3.1.4. Simulation Process
The simulation process of 3D geological model reconstruction from the 2D profile is as follows:
- (1)
- Simulation parameters such as the 2D data template, maximum search radius, the maximum number of conditional points, the iteration termination threshold, and the iteration sampling data upper limit are determined.
- (2)
- Conditional data events in the direction of I, J, and K at the simulation point are obtained by scanning the 2D data template. Then we search the matching mode of each corresponding profile and then update the probability density function of data events satisfying the conditions in each direction according to the mode distance.
- (3)
- The fusion probability of two adjacent profiles in the same direction of the simulated point is obtained by the linear pooling addition formula, and the fusion probability of profiles in all directions is obtained by the linear pooling multiplication formula; the simulated values are determined by Monte Carlo sampling.
- (4)
- Go to the next simulation node and repeat the above process. If all nodes are simulated, the 3D model is obtained.
- (5)
- The 3D model is analyzed based on the adaptive spatial iterative sampling method. If the simulation error is less than the threshold of termination iteration, the geological model is output. Otherwise, iterative sampling is carried out, random sampling is carried out for points in the model based on the trust threshold, and simulation points larger than the trust threshold are added to the conditional data. Then the simulation goes back to step (2), and the above process is repeated until the condition is met, the simulation ends, and the result is output. A higher trust threshold improves the precision of the model but may cause much more iteration and be time-consuming. A lower trust threshold will decrease the precision with rapid computation. Thus, the balance between the precision and iteration time is state-of-the-art.
3.2. Model Construction
The study area covers a large area, about 16.3 km in the X direction and 30 km in the Y direction. The average vertical thickness of each layer is about 15 m. The sedimentary body size is relatively large. The modeling focuses on the fine modeling of the middle and upper sand body development horizons of the H8 and S1 formations. The meshes are divided according to the scale of 50 × 50 m in the plane and 0.5 m in the vertical main horizon. The total number of grids is 325 × 607 × 210, a total of 41,427,750 grids.
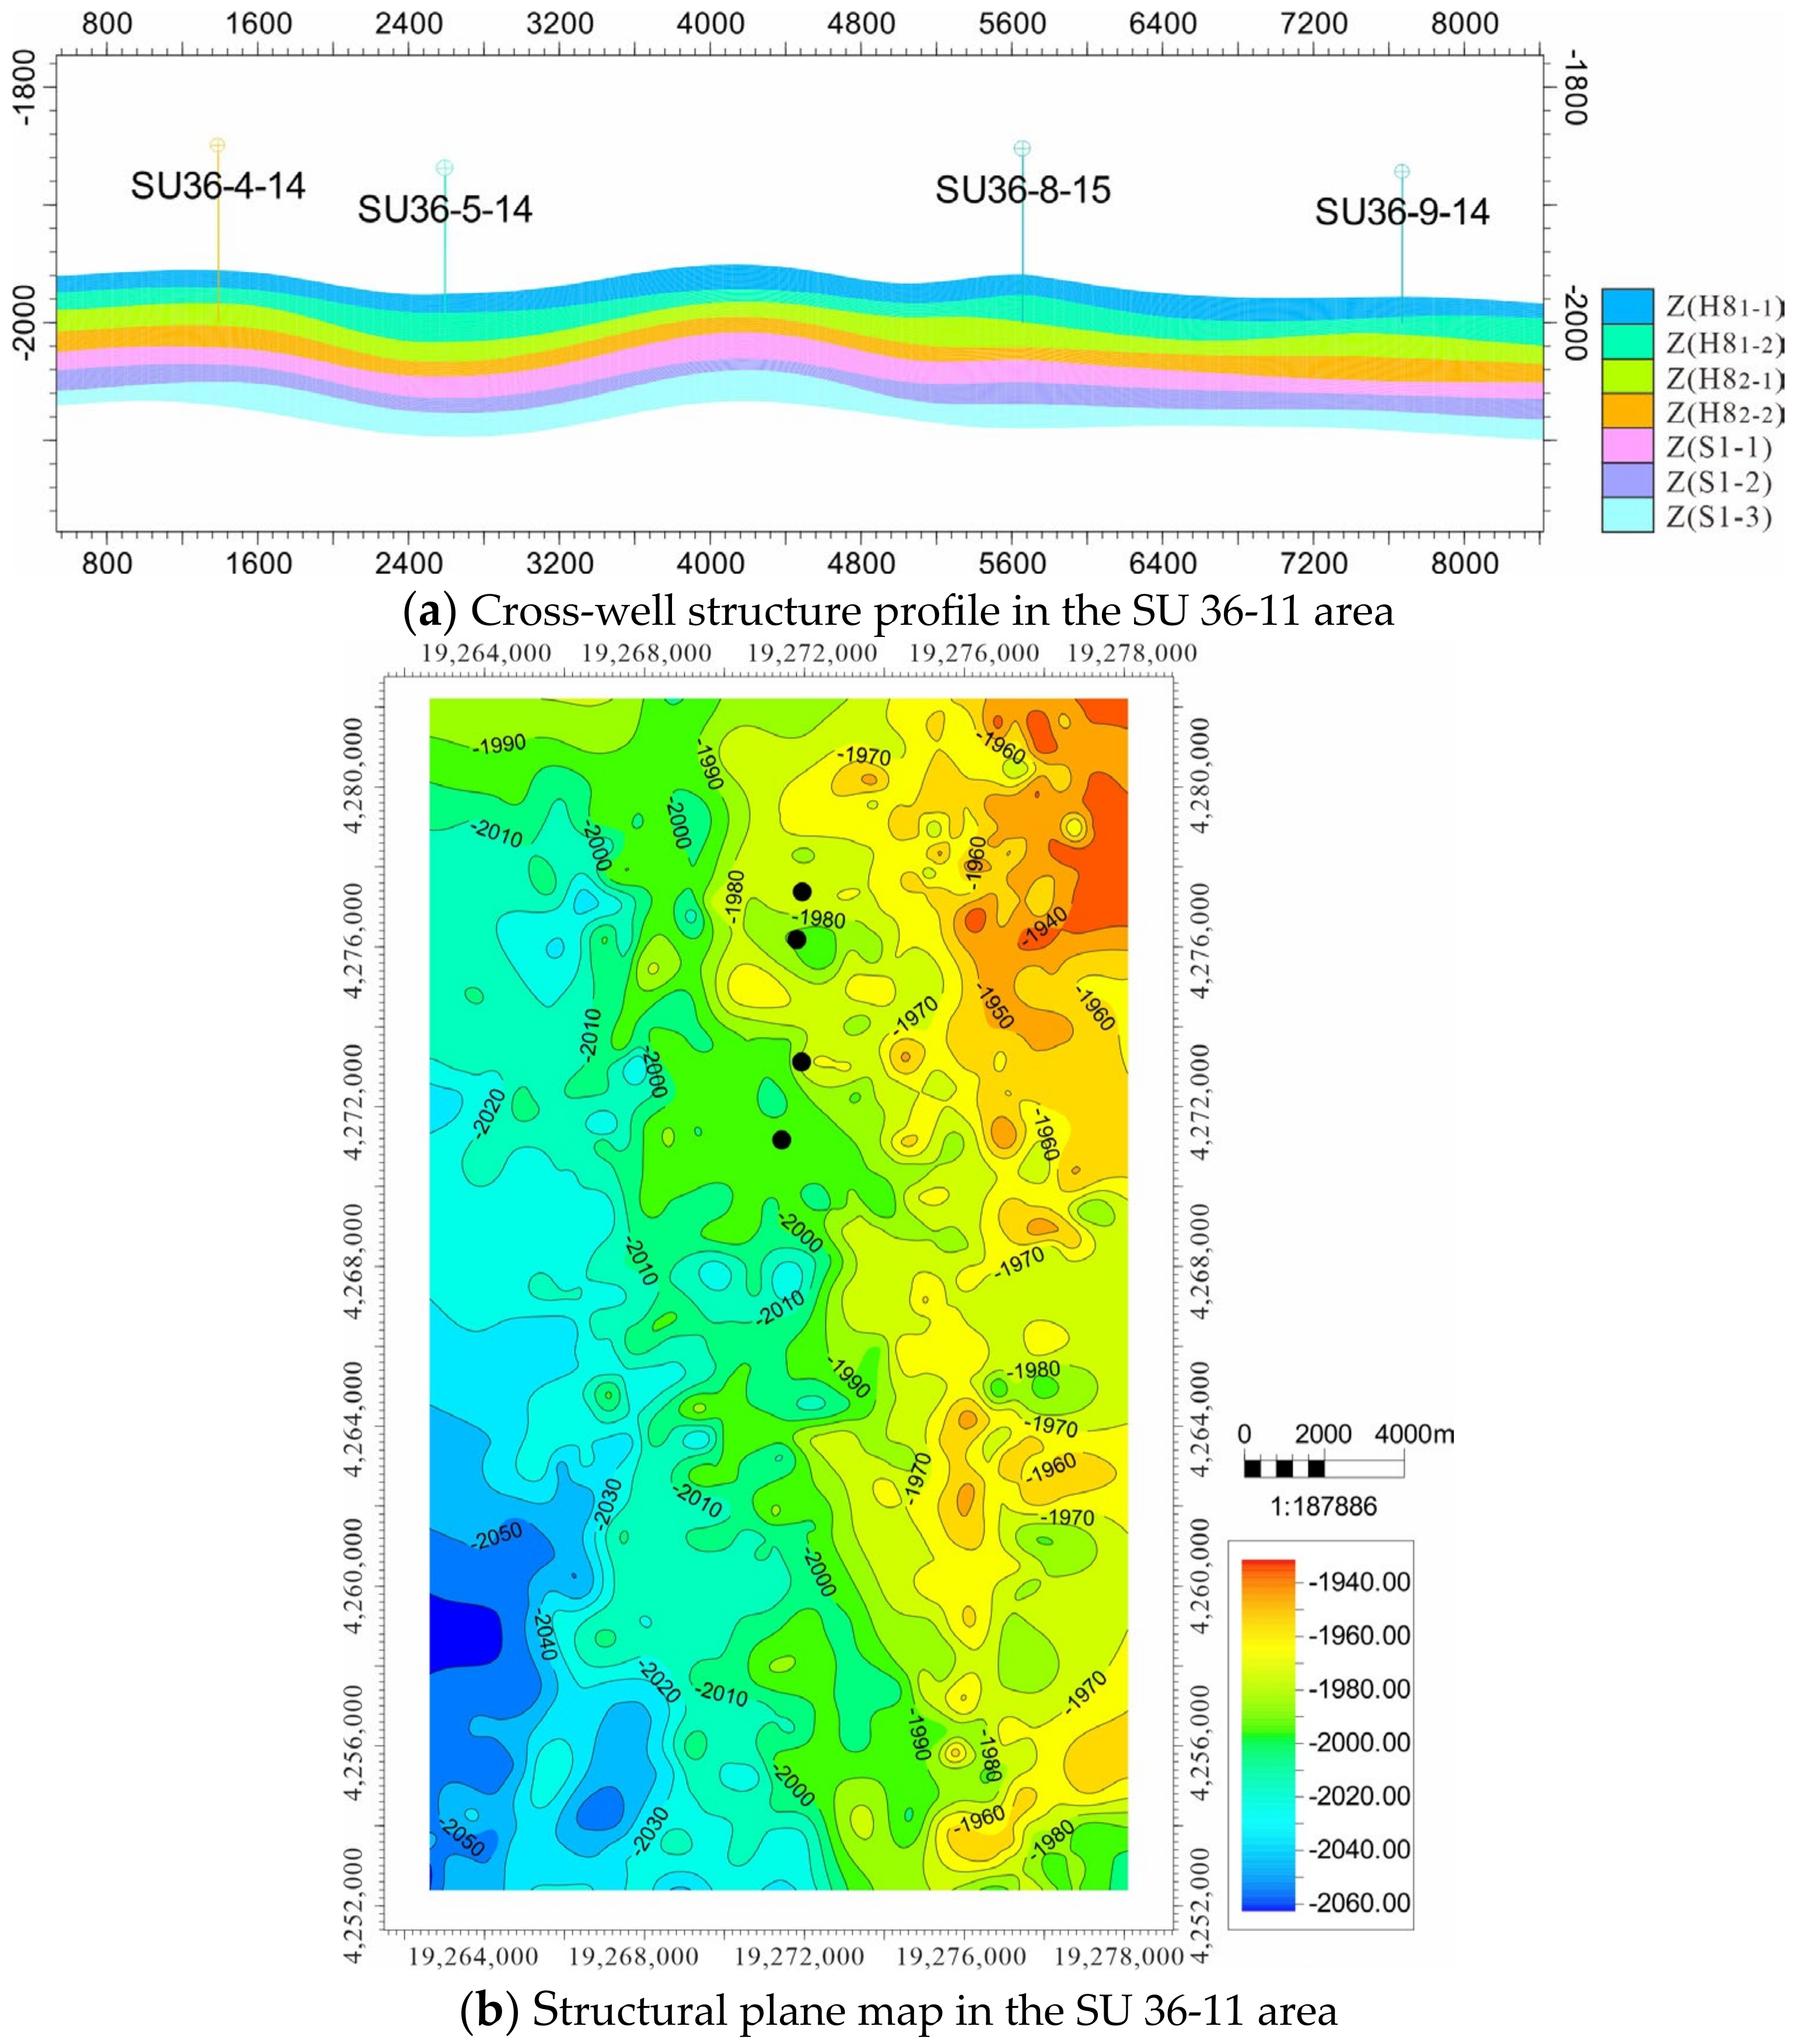
The structural model reflects the spatial framework of the reservoir, and its accuracy determines the reliability of the geological model, which is a very key step in 3D geological modeling. According to the established structural model, the study area is wide and has a gentle western dip, a monocline with a gradient of 3–10 m/km [31]. On the monoclinic background, there are several rows of low-grade nasal protuberances with a range of about 10–20 m, which are mostly very gentle. From the well profile, the formation thickness is relatively average, reflecting the braided channel sedimentary characteristics (Figure 8a). The established structural model reflects the monocline characteristics of strata reasonably (Figure 8b) and can be used as a framework for subsequent sedimentary facies modeling.
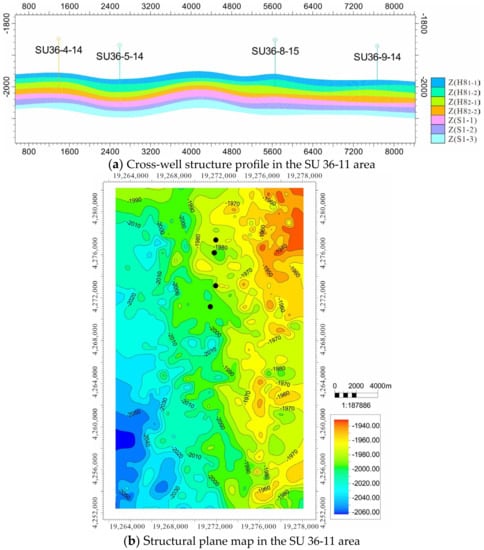
Figure 8.
Structural feature study in the SU 36-11 area.
3.3. Establishment of Reservoir Model
The modeling mainly adopts the new method of the reconstruction of the 3D geological model using 2D profiles to complete the establishment of the sedimentary facies model in the SU 36-11 area. By comparing the geological well profiles with the model, the modeling effect is analyzed, and the geological model is optimized.
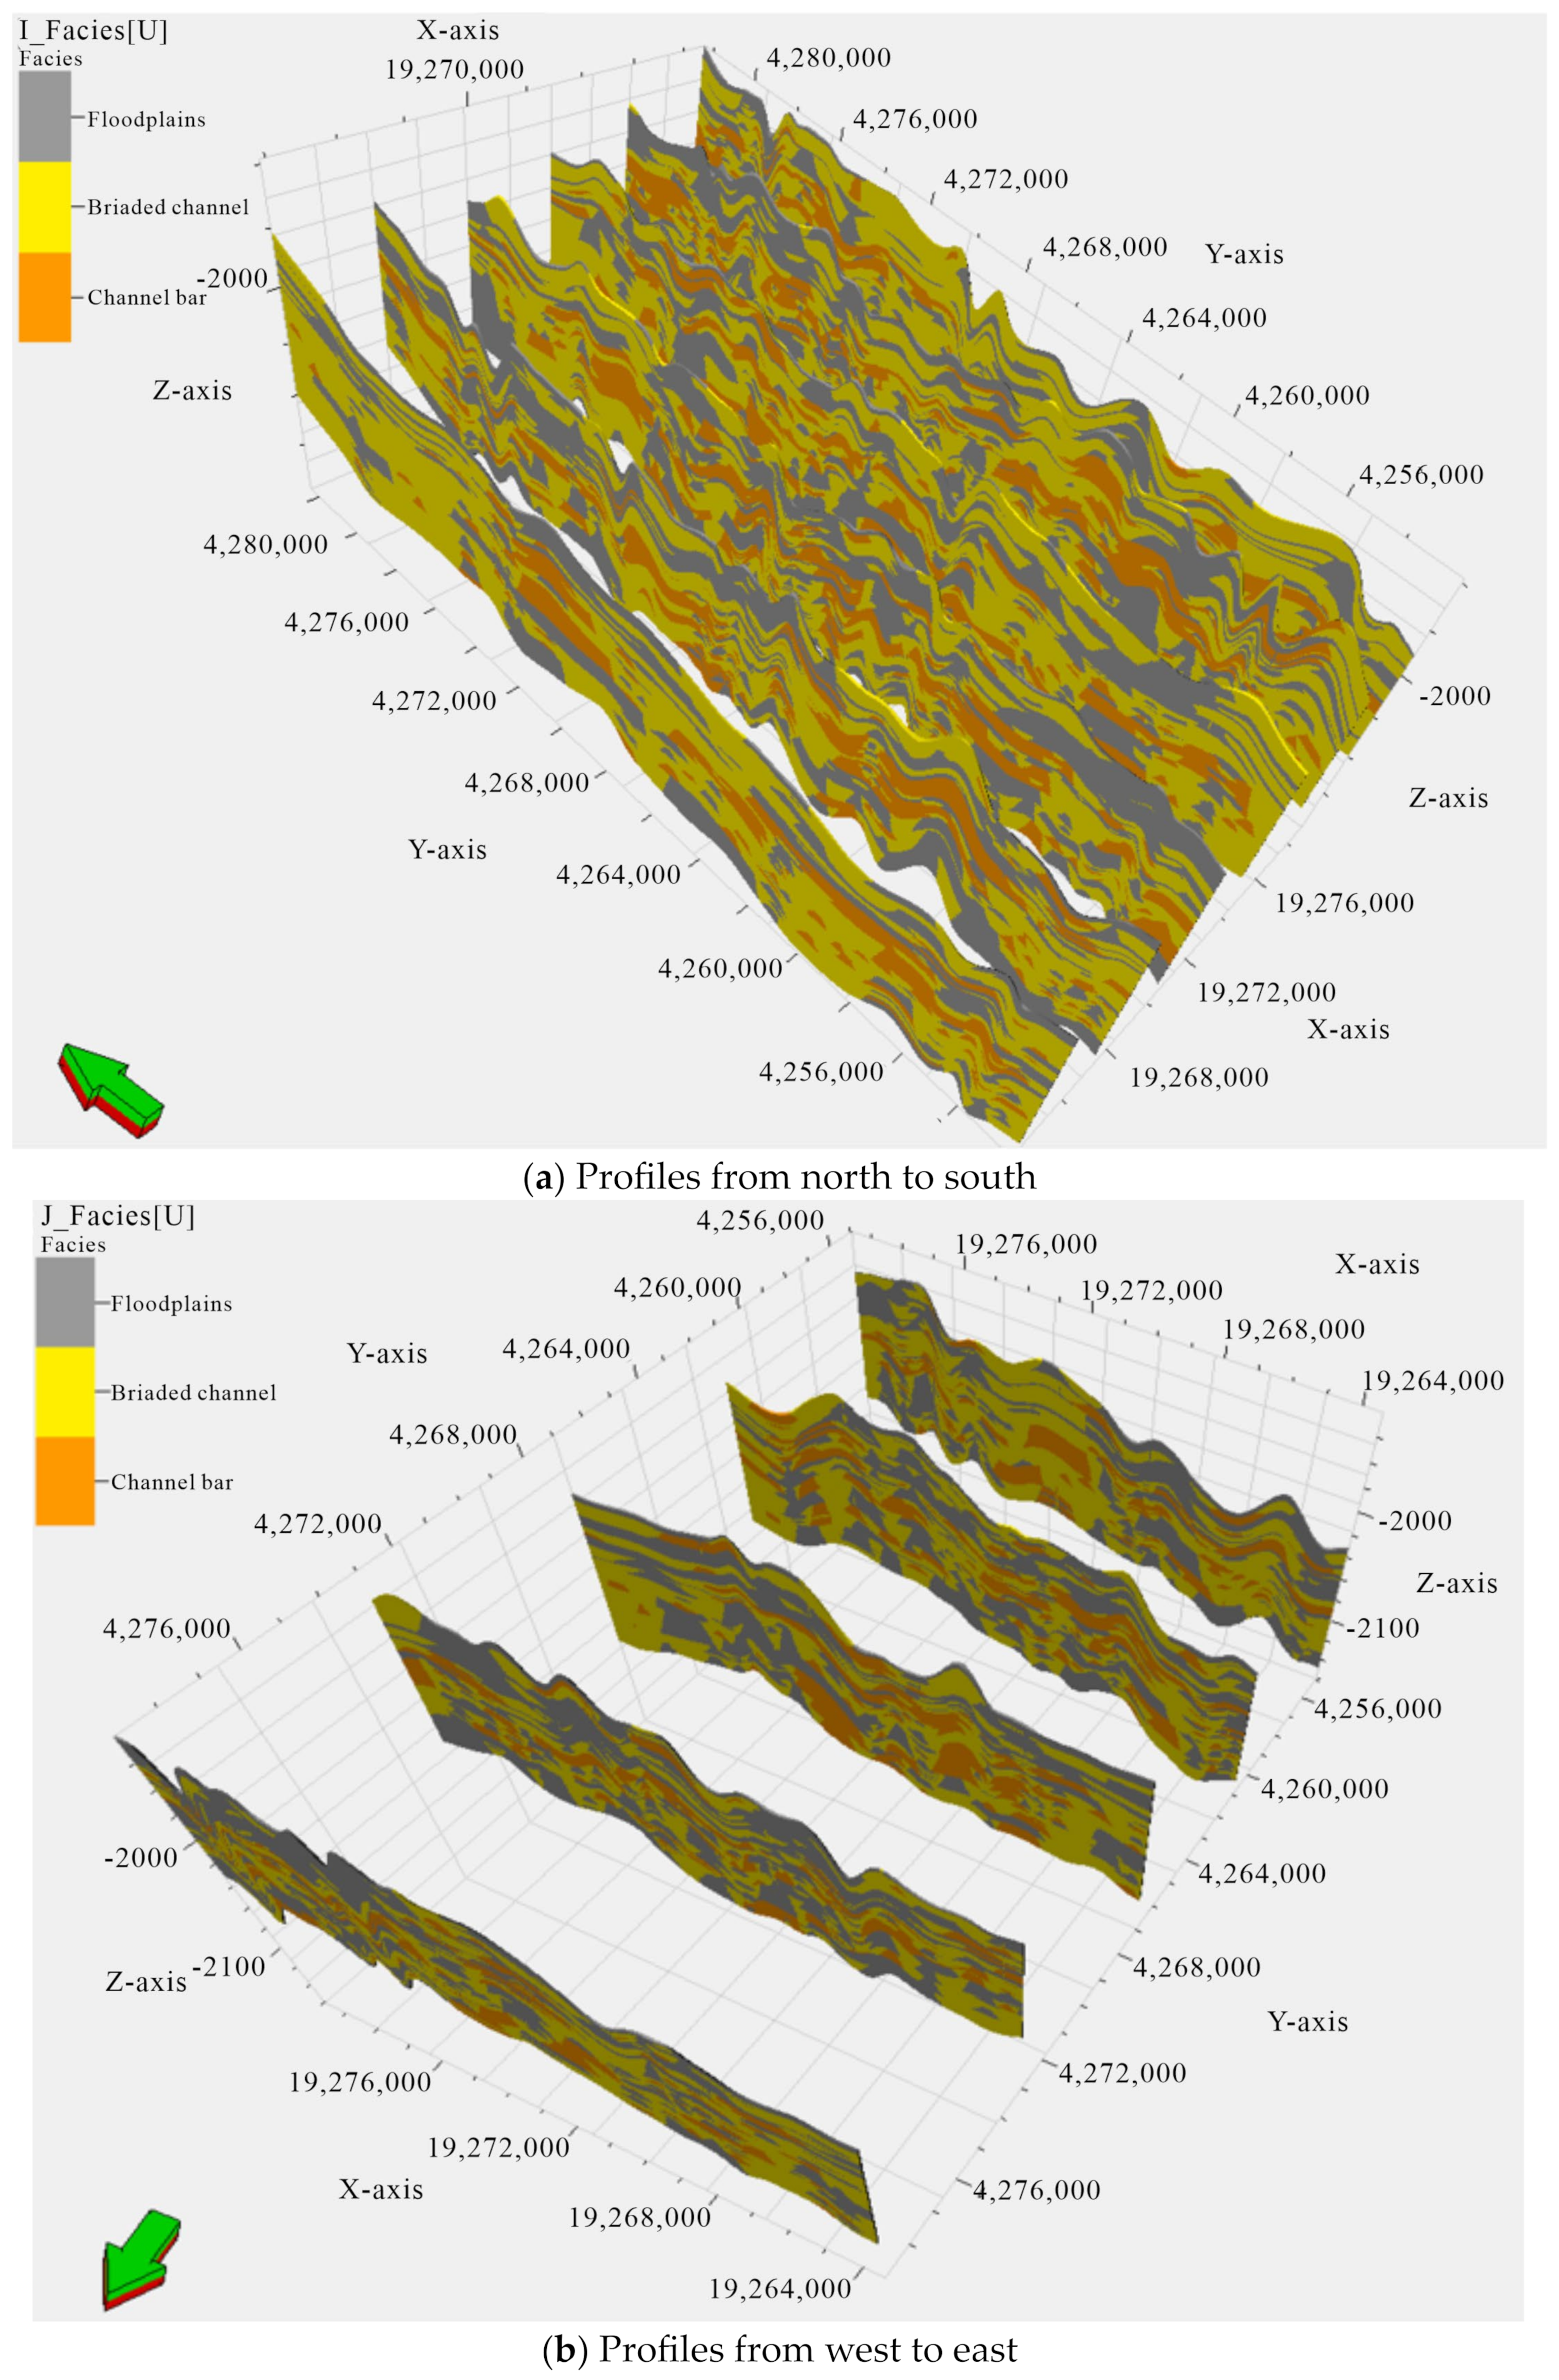
The key to the reconstruction of the 3D geological model using 2D profiles is the input of parameters, namely the acquisition of 2D training images. In this study, six profiles from north to south and five vertical profiles from west to east were selected and digitized to form the 2D training images. Each profile was controlled by the drilled well to maximize the validity and representativeness of the well data. On the plane, seven monolayer sedimentary micro-facies were used as 2D training images. Thus, the 2D training images required for modeling were created (Figure 9).
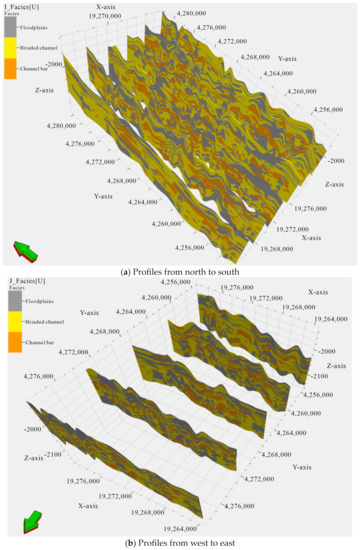
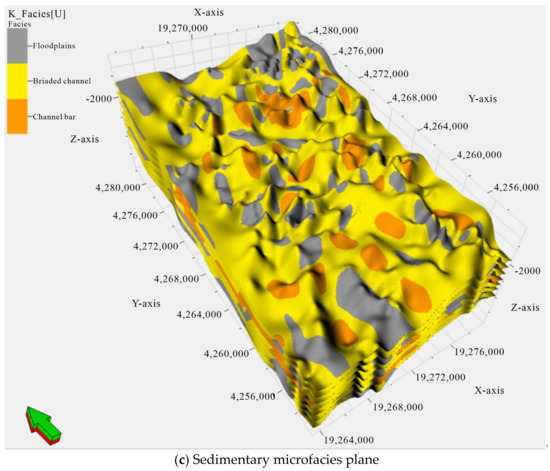
Figure 9.
Digitized 2D training image of the SU 36-11 area.
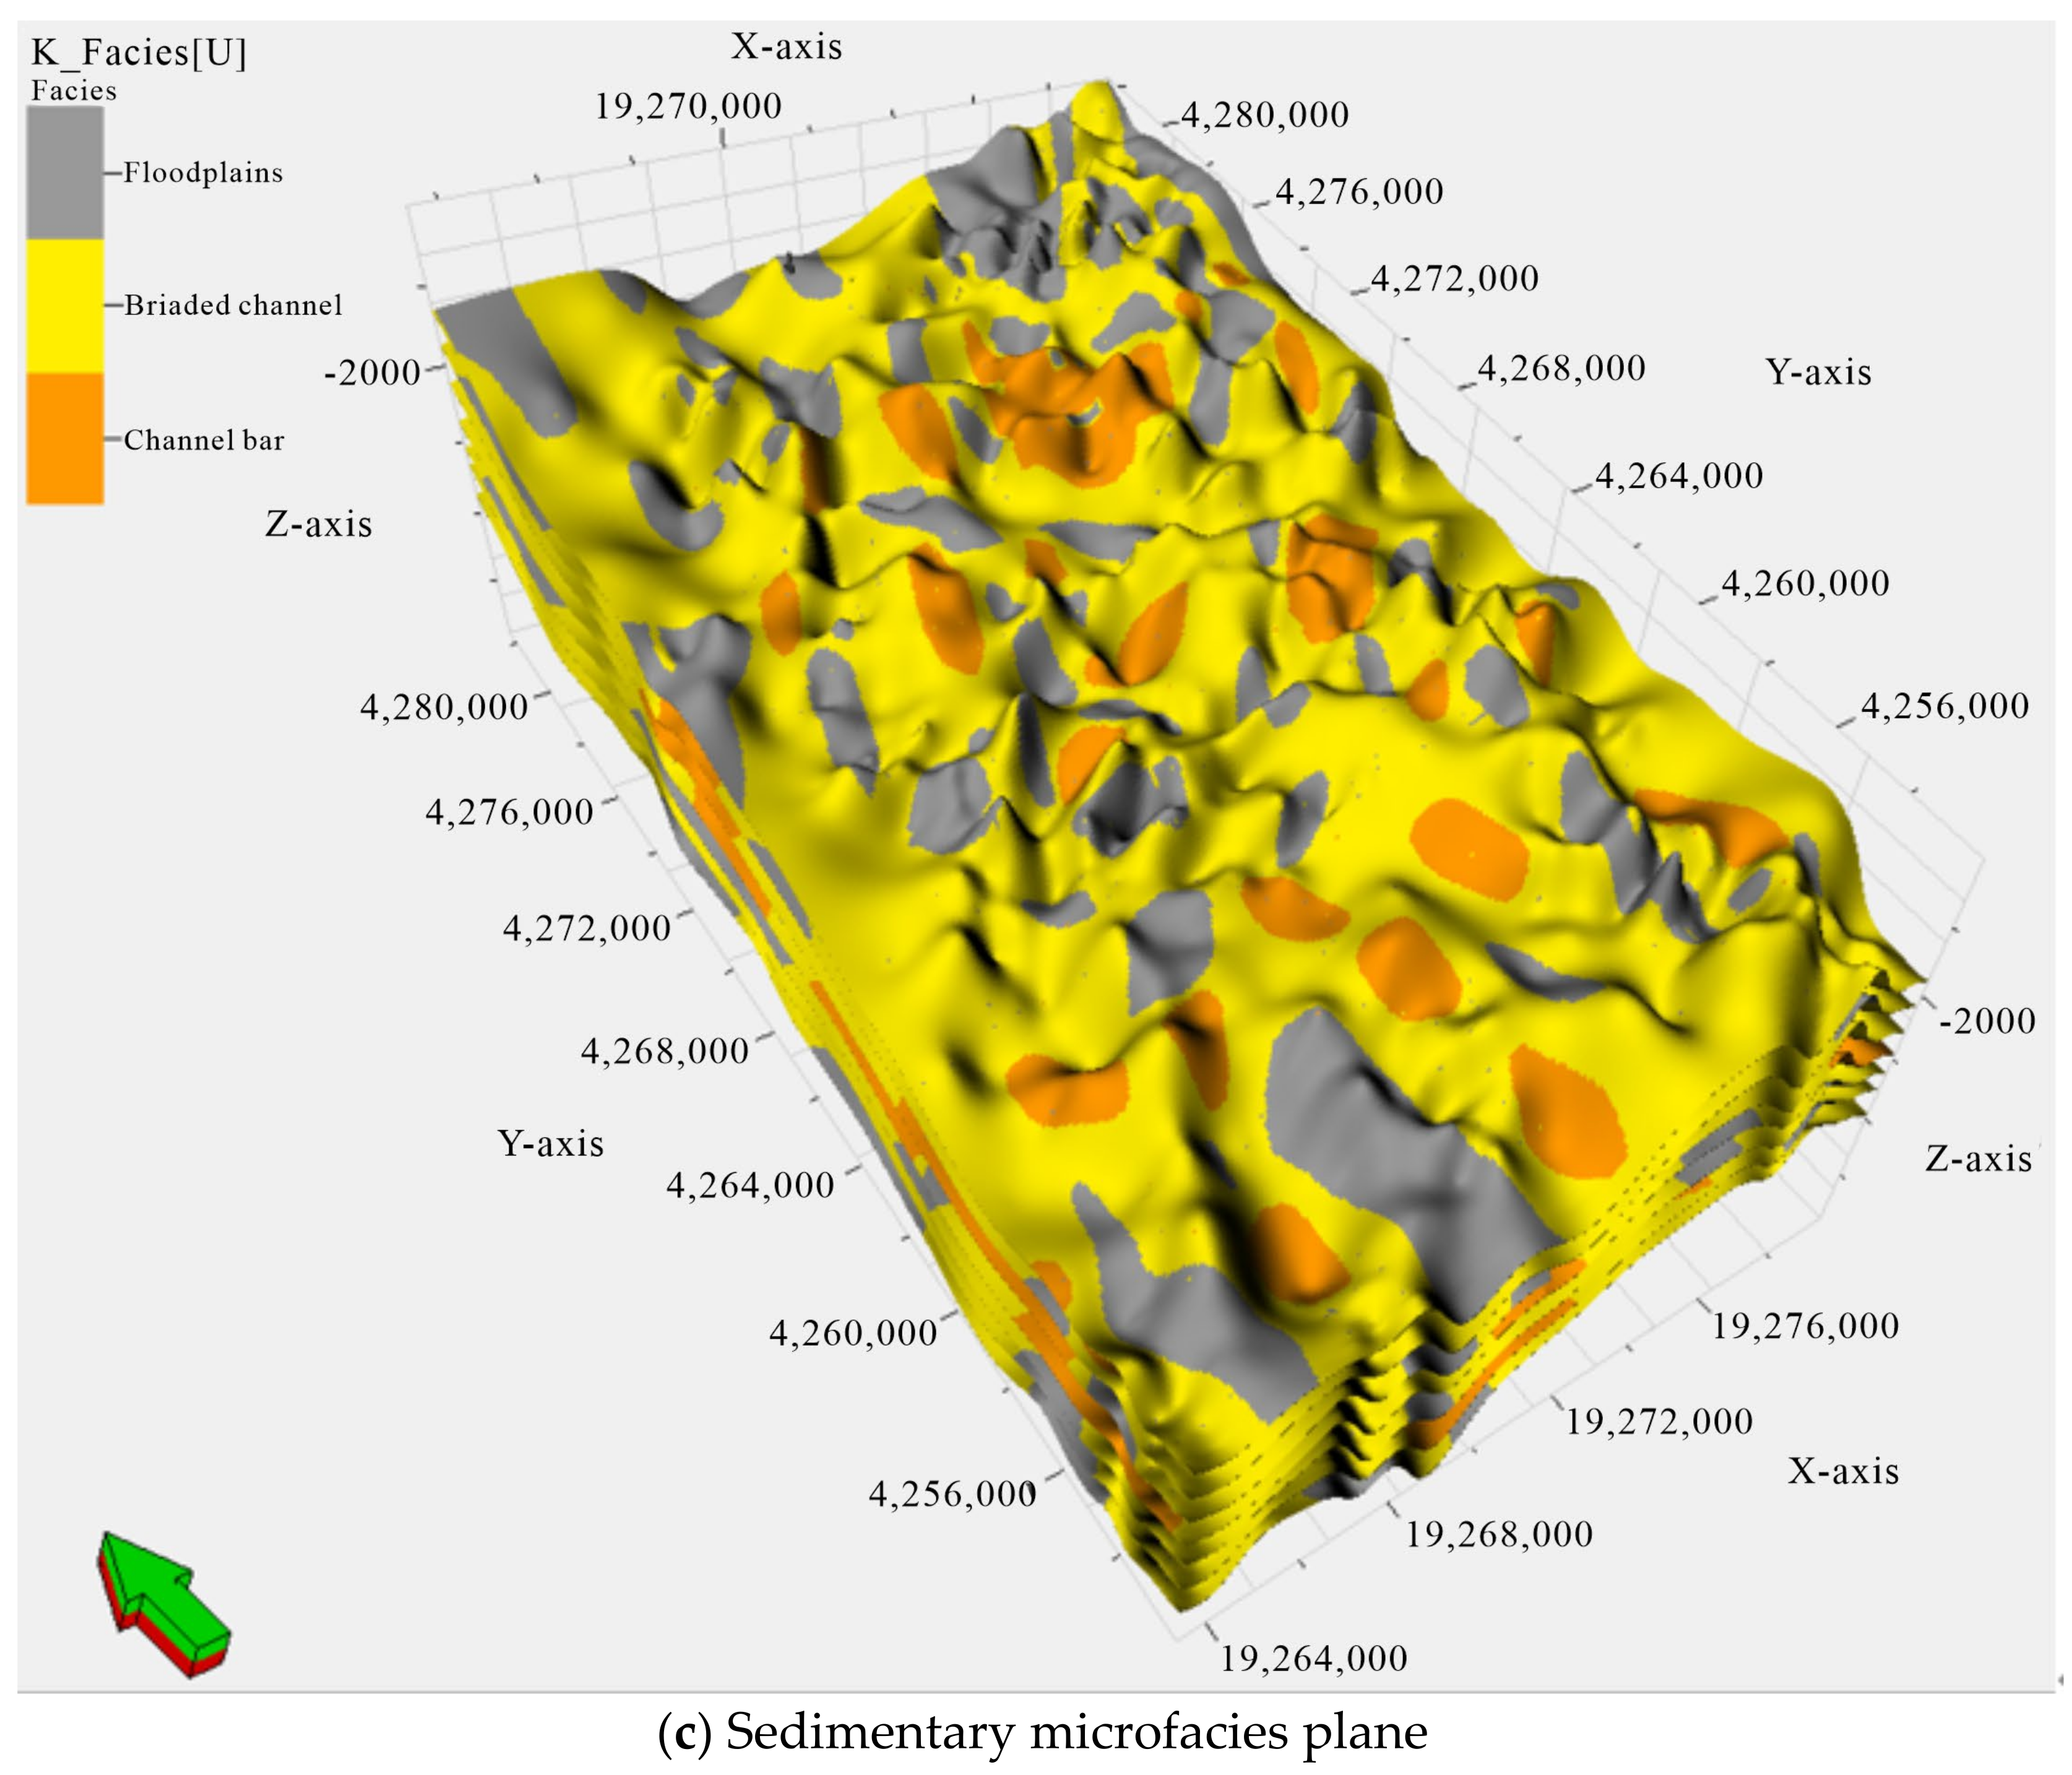
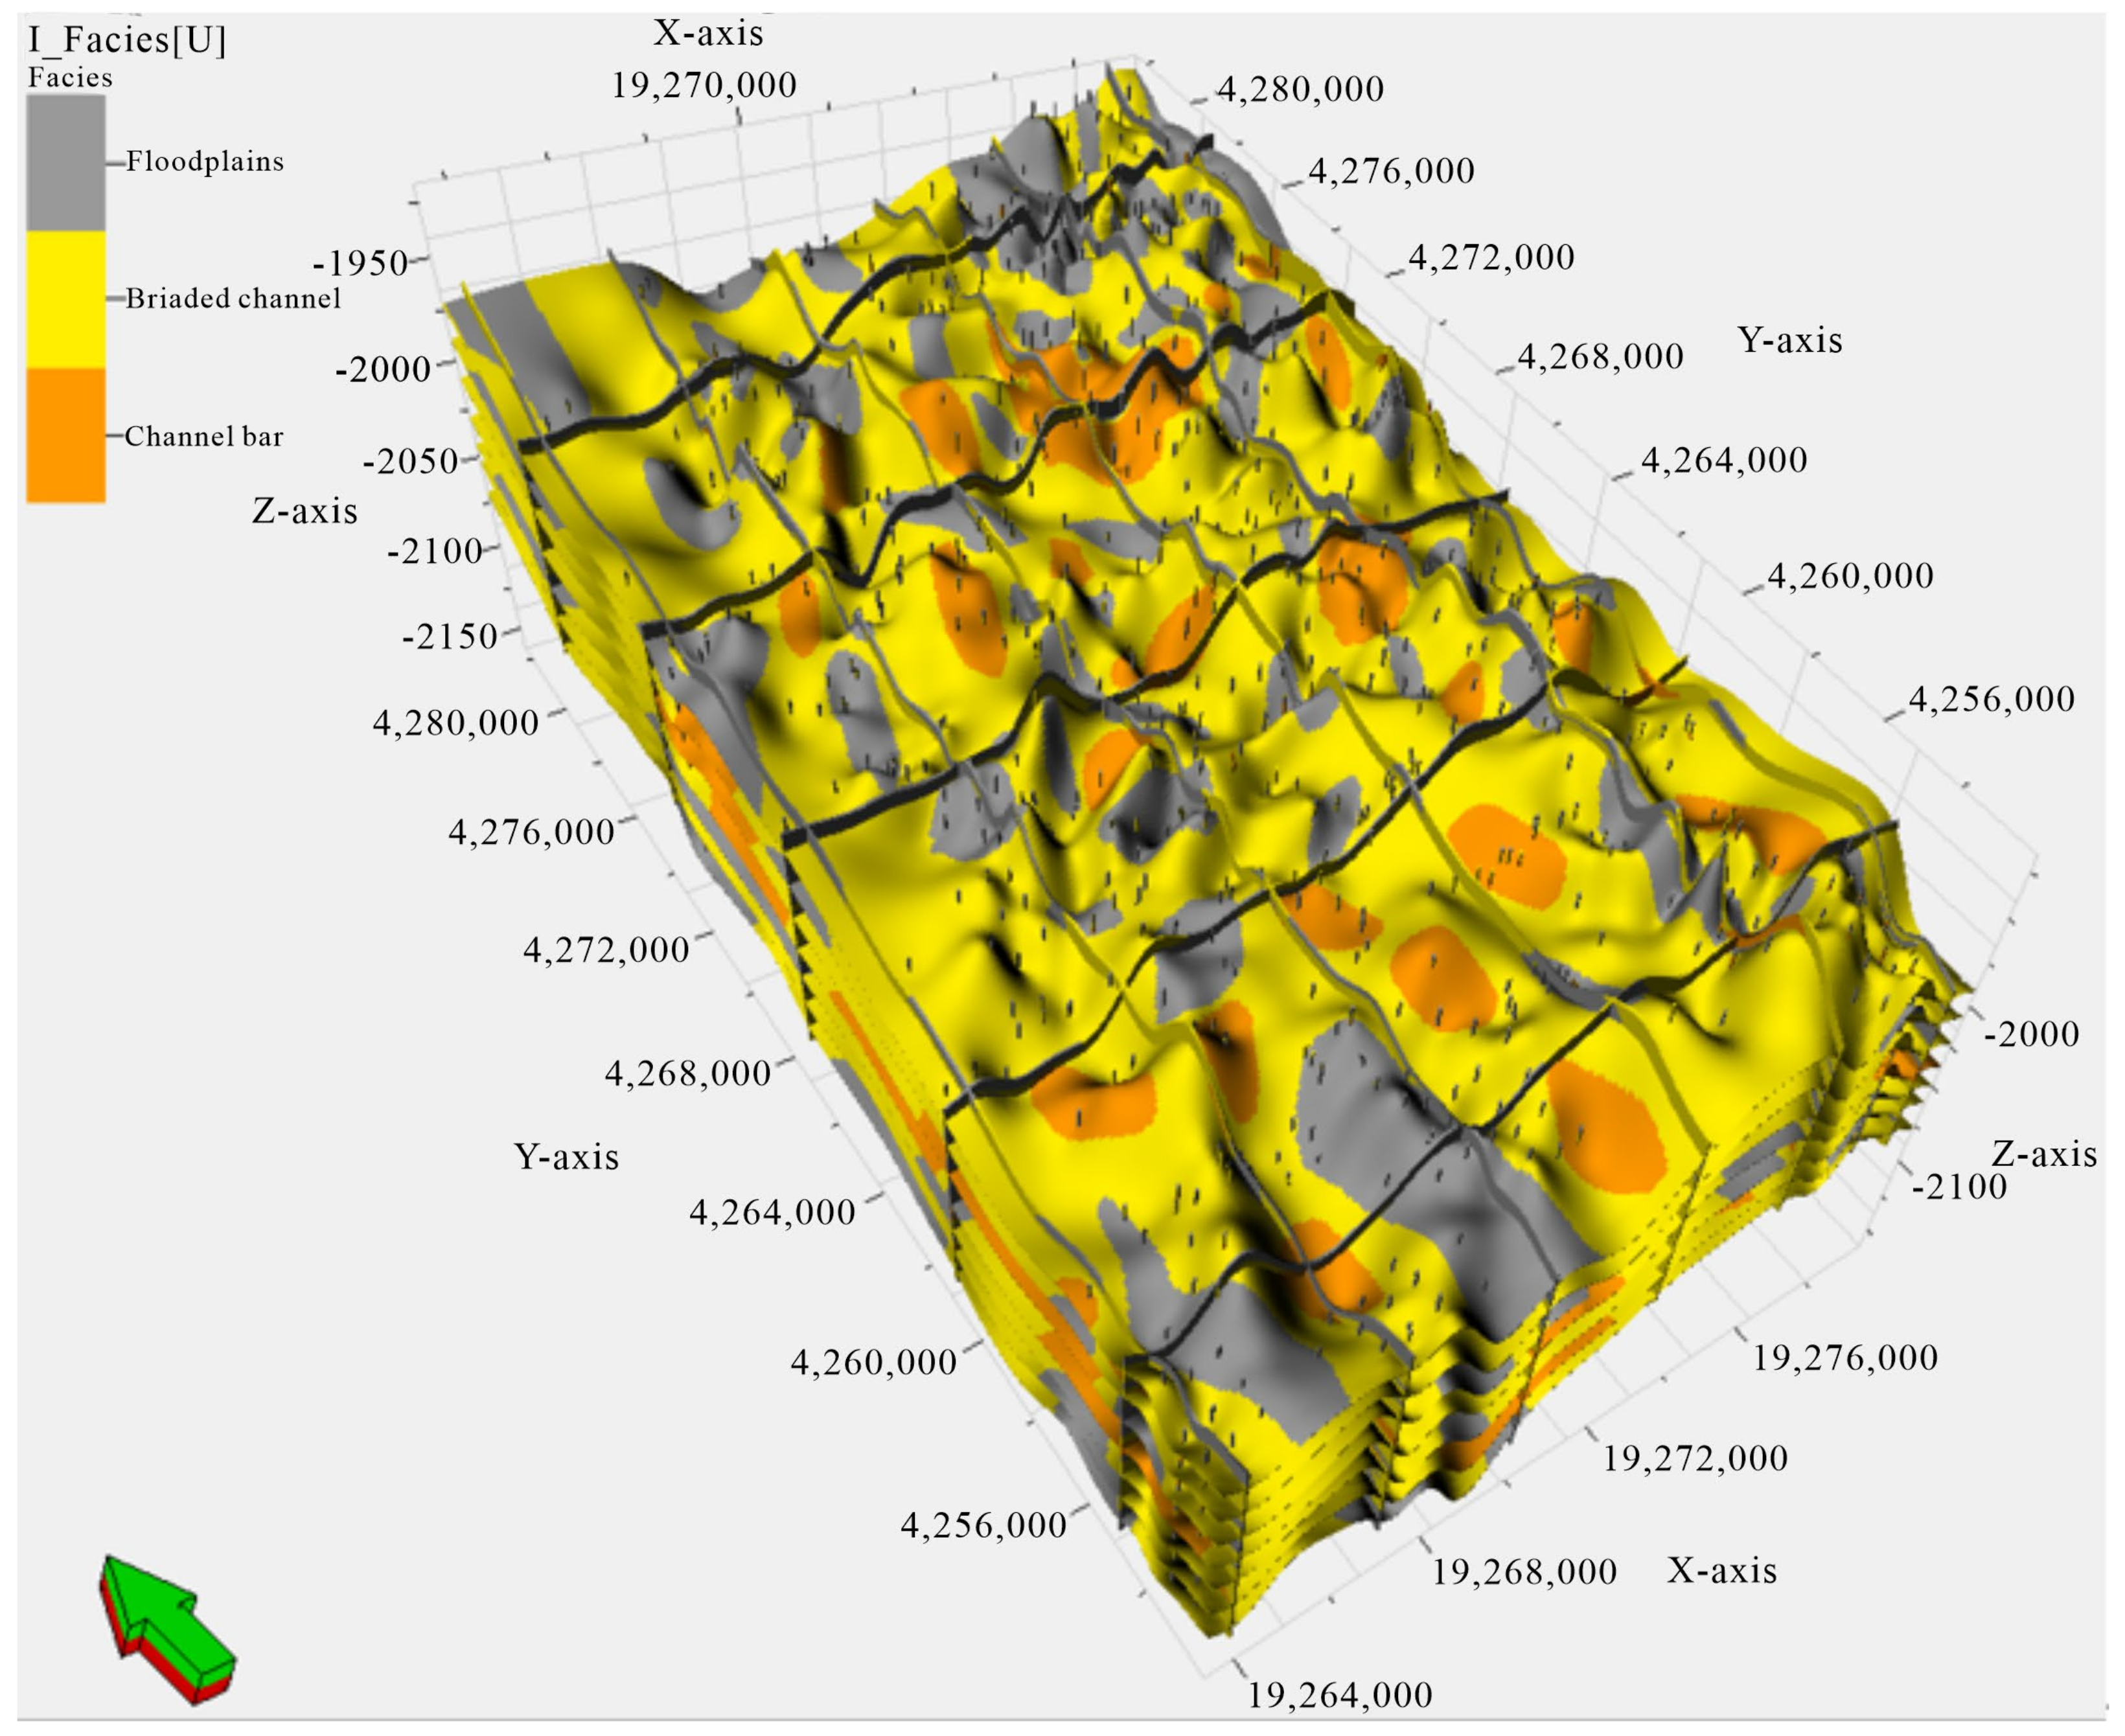
After 2D training images were obtained, 3D geological models could be reconstructed using 2D profiles. Based on the geological analysis, the simulation conditions were set as follows: the maximum number of conditional points was 400, the number of facies categories was 3, the number of random seeds was 23,568, the search radius of 2D training images was a 30 × 60 × 10 grid, and the profile scanning ratio was 1.0. The simulation results were shown in Figure 10. The channel and the channel bar were distributed throughout the modeling region, and the floodplain deposits were locally developed. In the braid flow zone, the channel bar has an oval shape and embeds in the river channel. The scale of channel bars is small, and the degree of development is limited. The model clearly described the superimposed pattern and spatial distribution of the channel and channel bars.
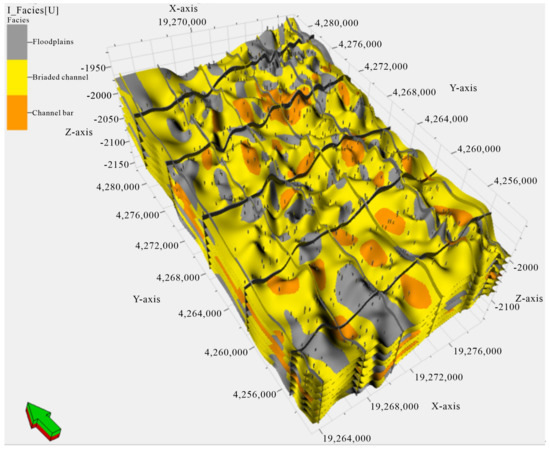
Figure 10.
Modeling result of the 3D lithological model by 2D profile constraints.
3.4. Model Evaluation
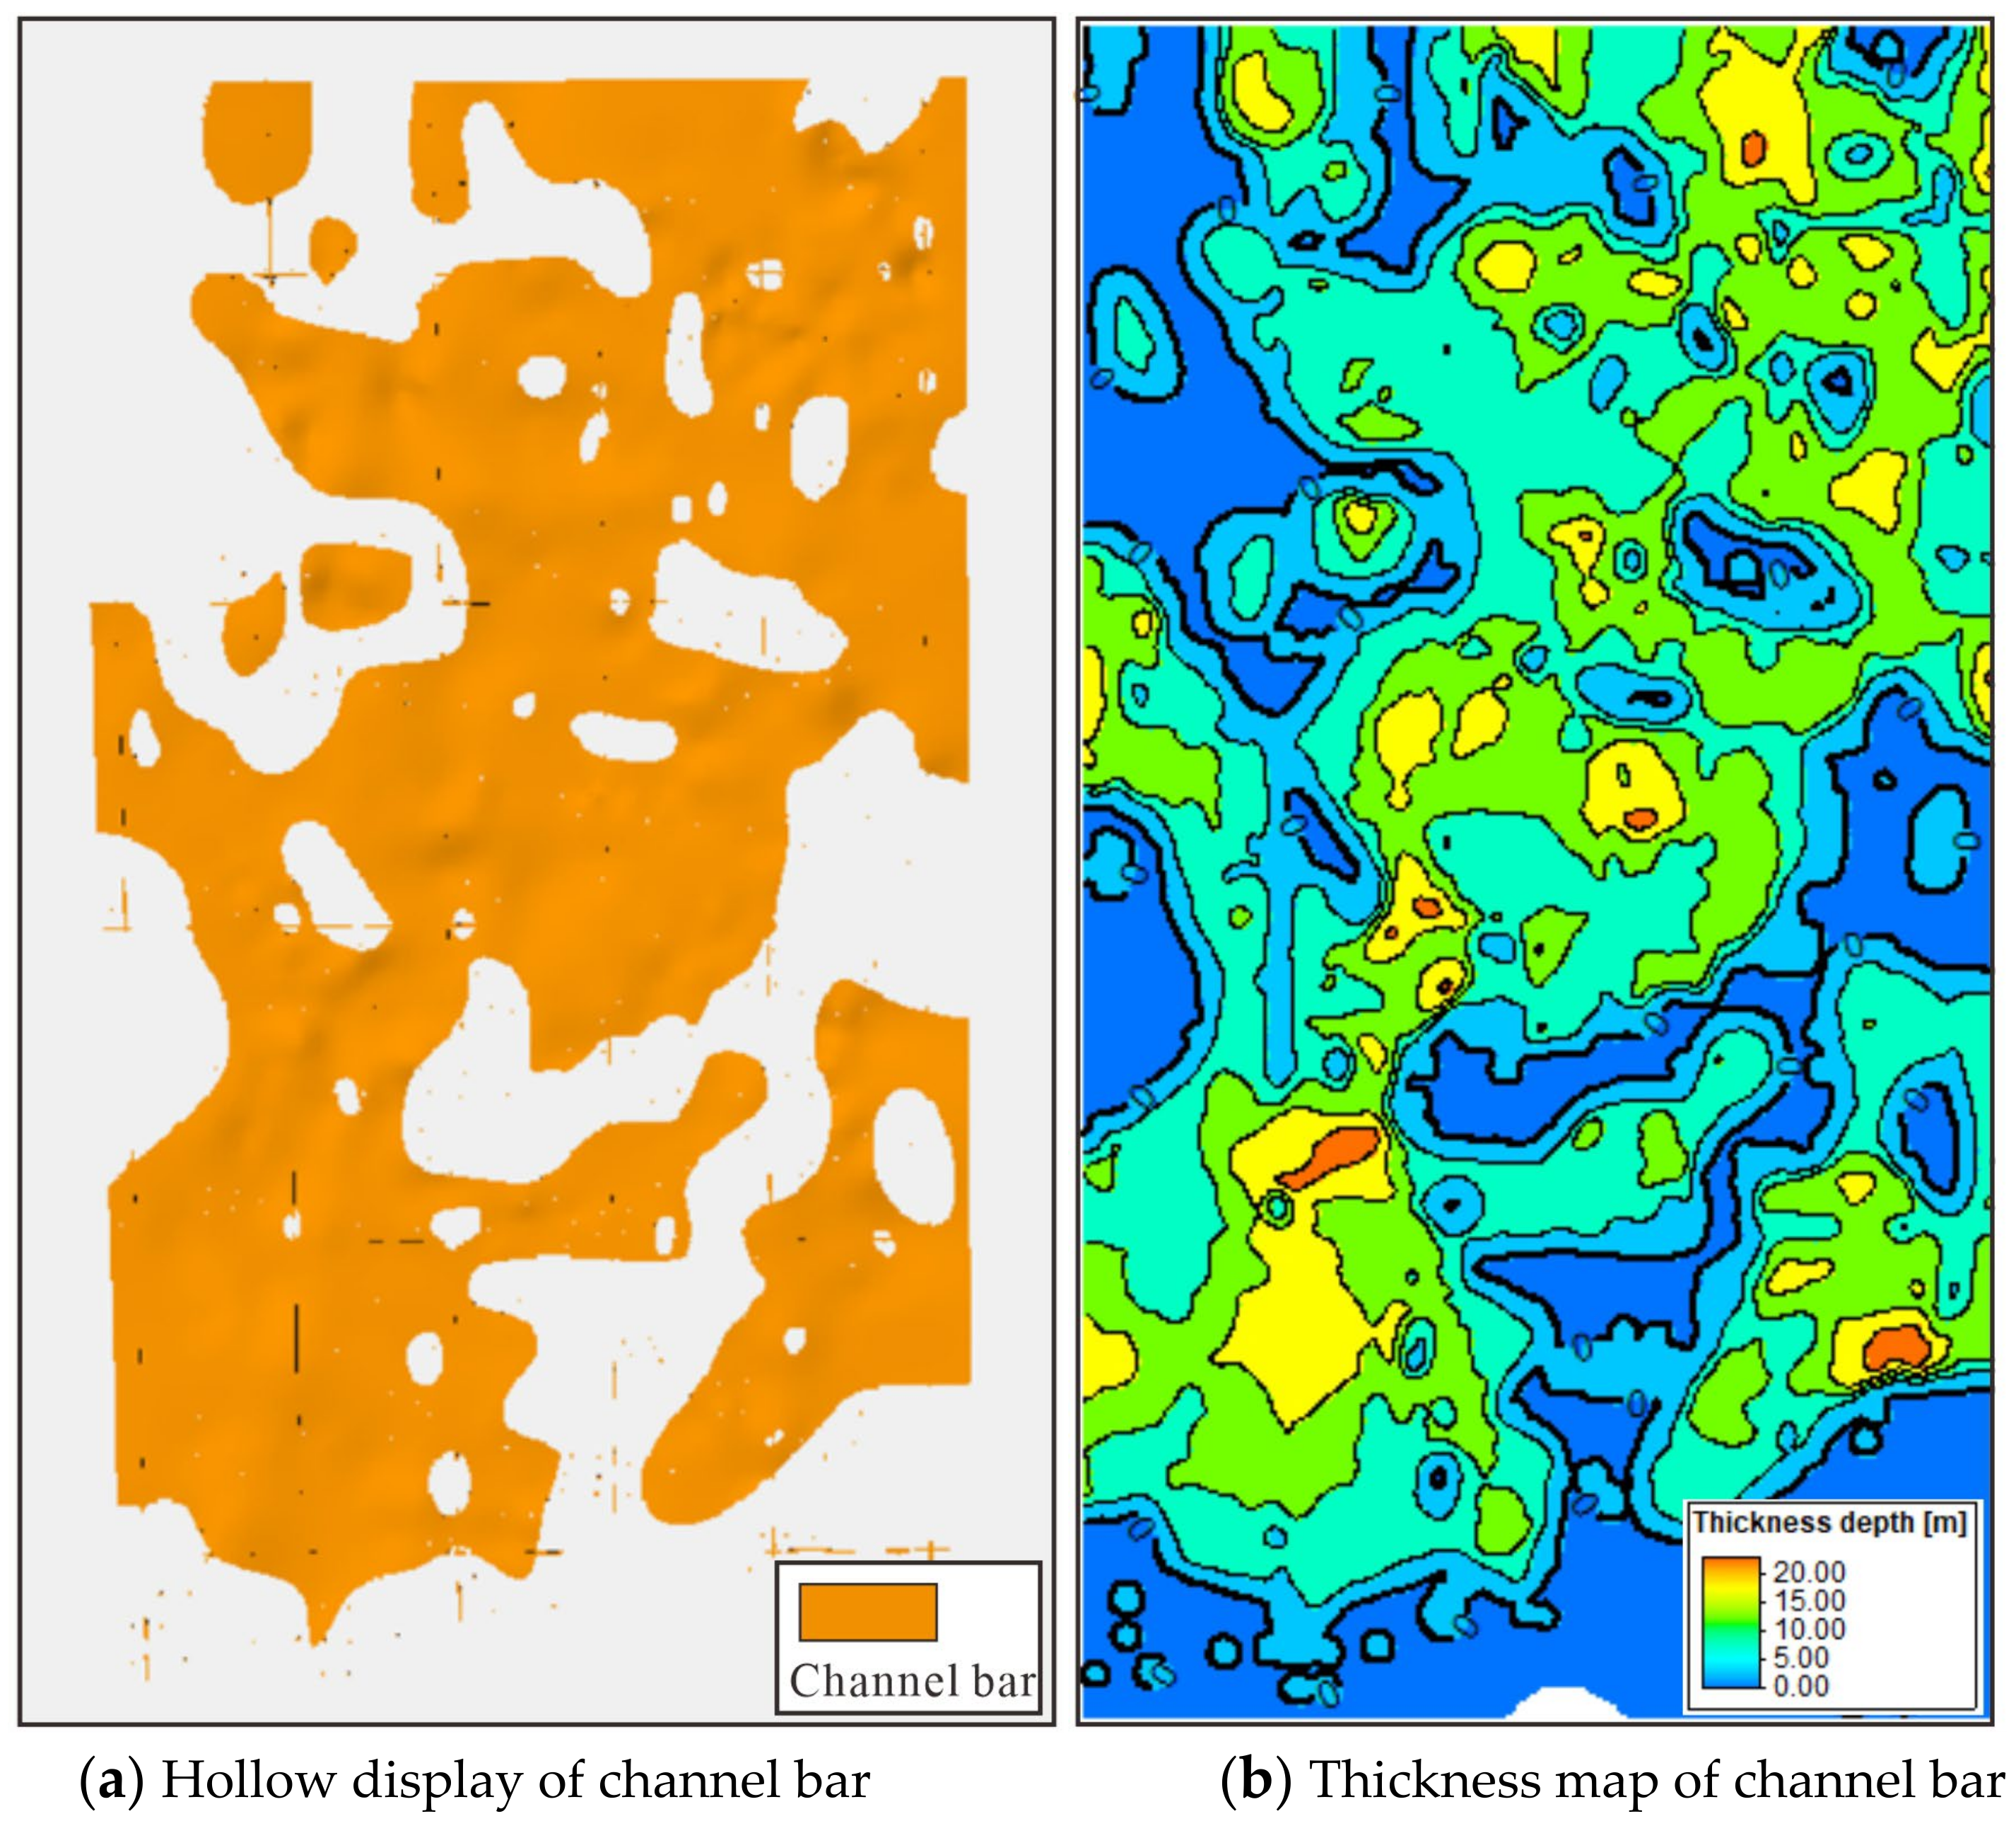
To test the quality of the model, the thickness of the simulated channel bar was extracted and displayed. As can be seen from the figure below (Figure 10), the channel bars are widely developed in the study area, showing a typical ellipsoid, and local channel bars are contiguous to form a complex channel bar system. Channel deposits are developed between two channel bars, which are relatively small in width and scale. It can also be seen from the thickness map of the channel bar (Figure 11a) that the middle of the channel bar is thick, and the two wings are thin, which shows that the lithological model established is reasonable and reliable (Figure 11b).
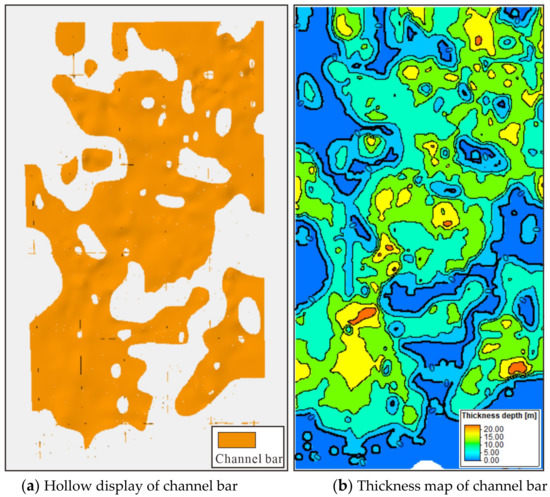
Figure 11.
Hollow out display and thickness map of H82_1 channel bar in the SU 36-11 area.
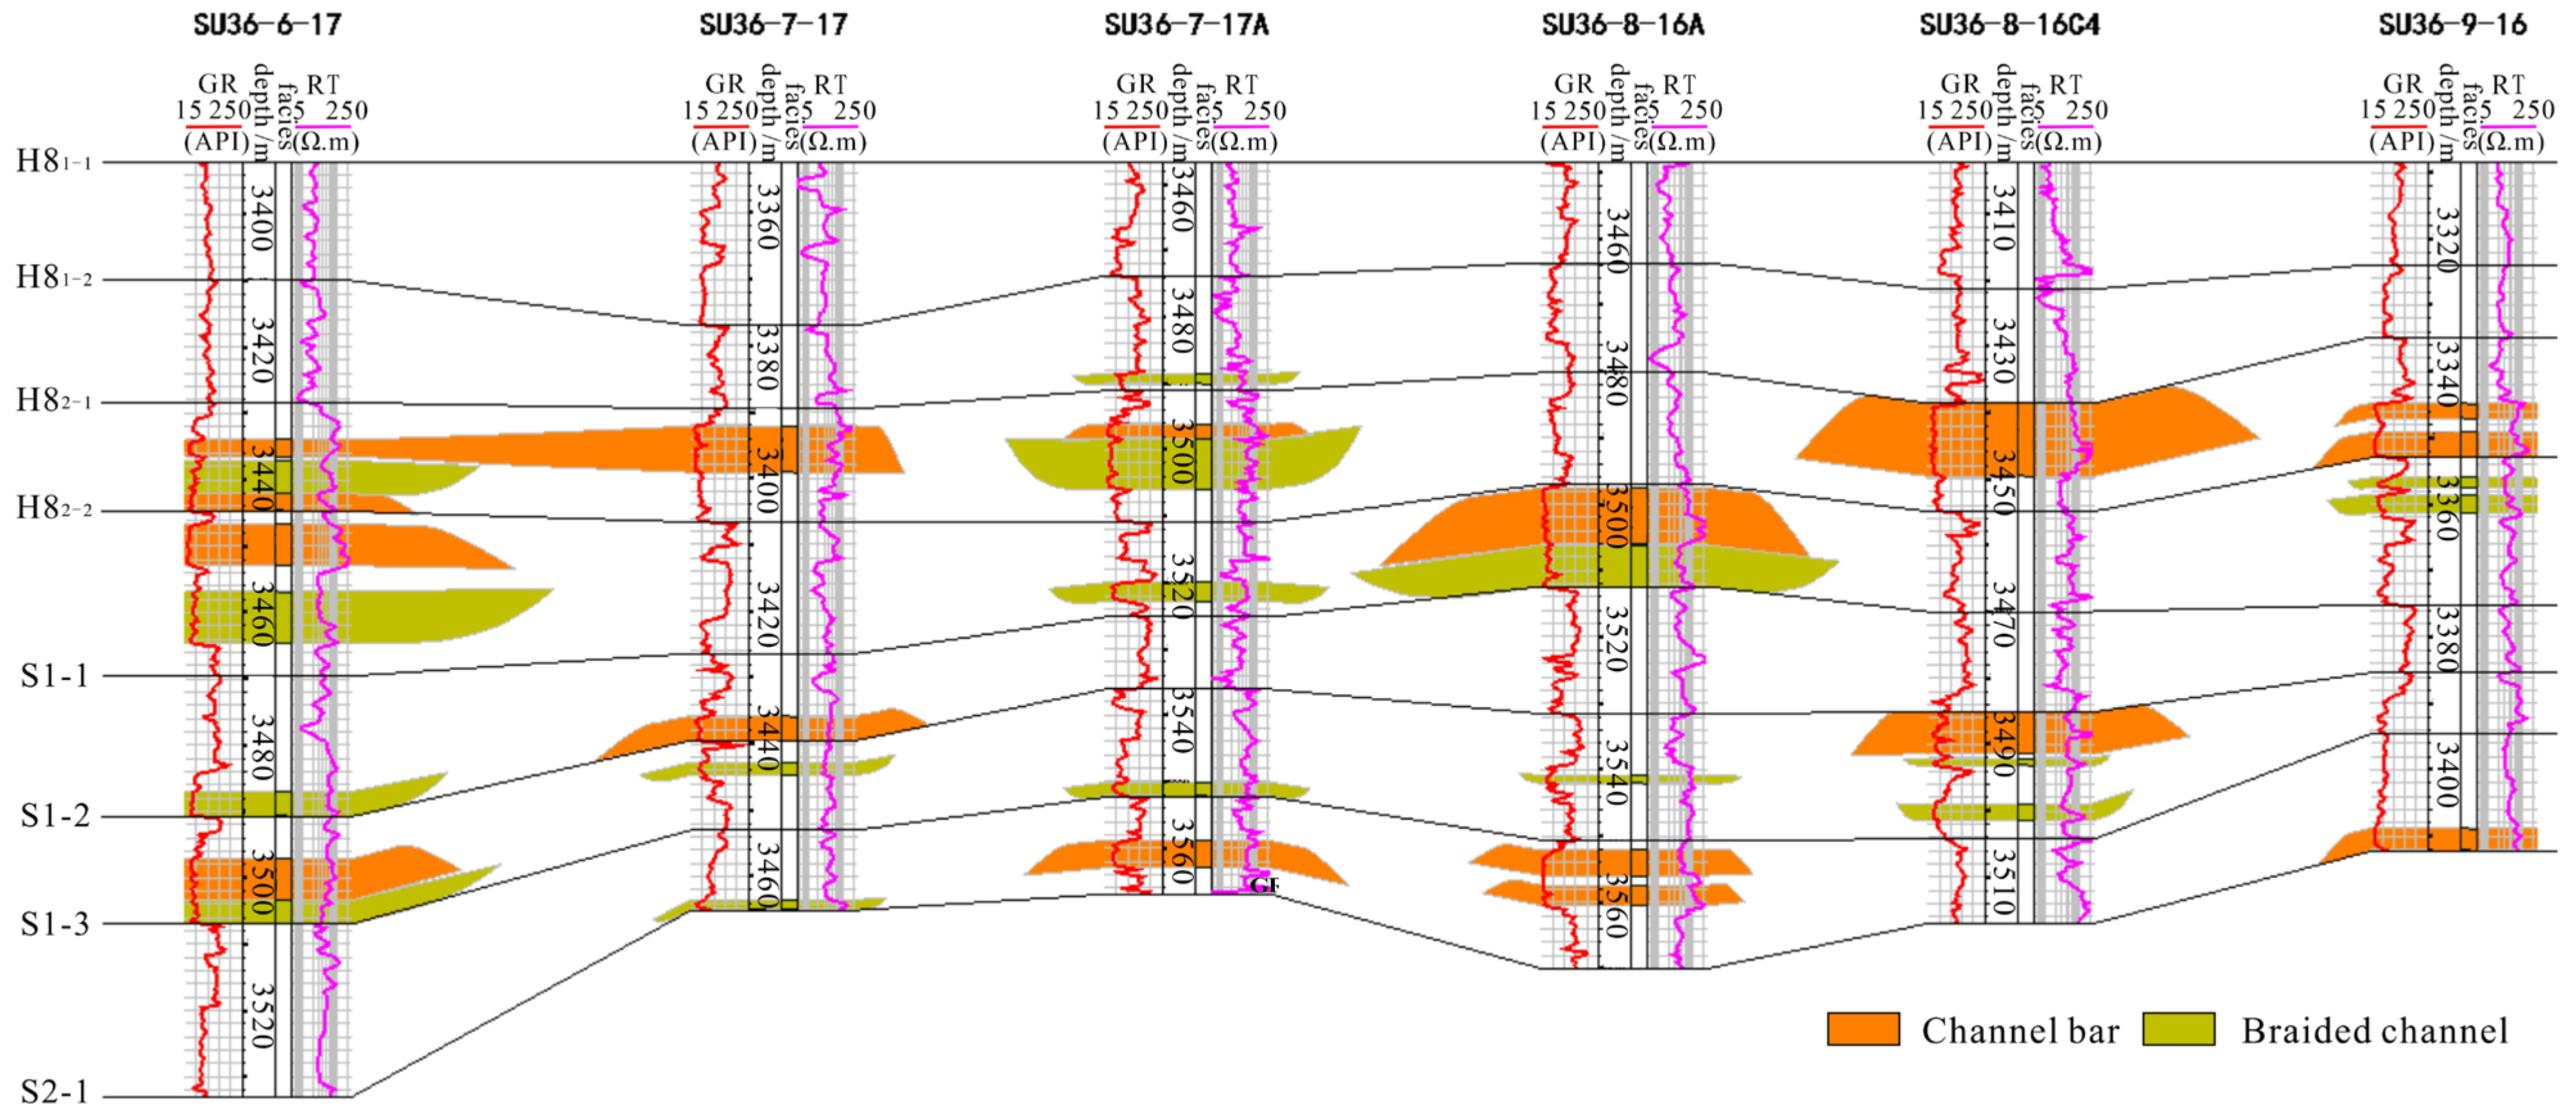
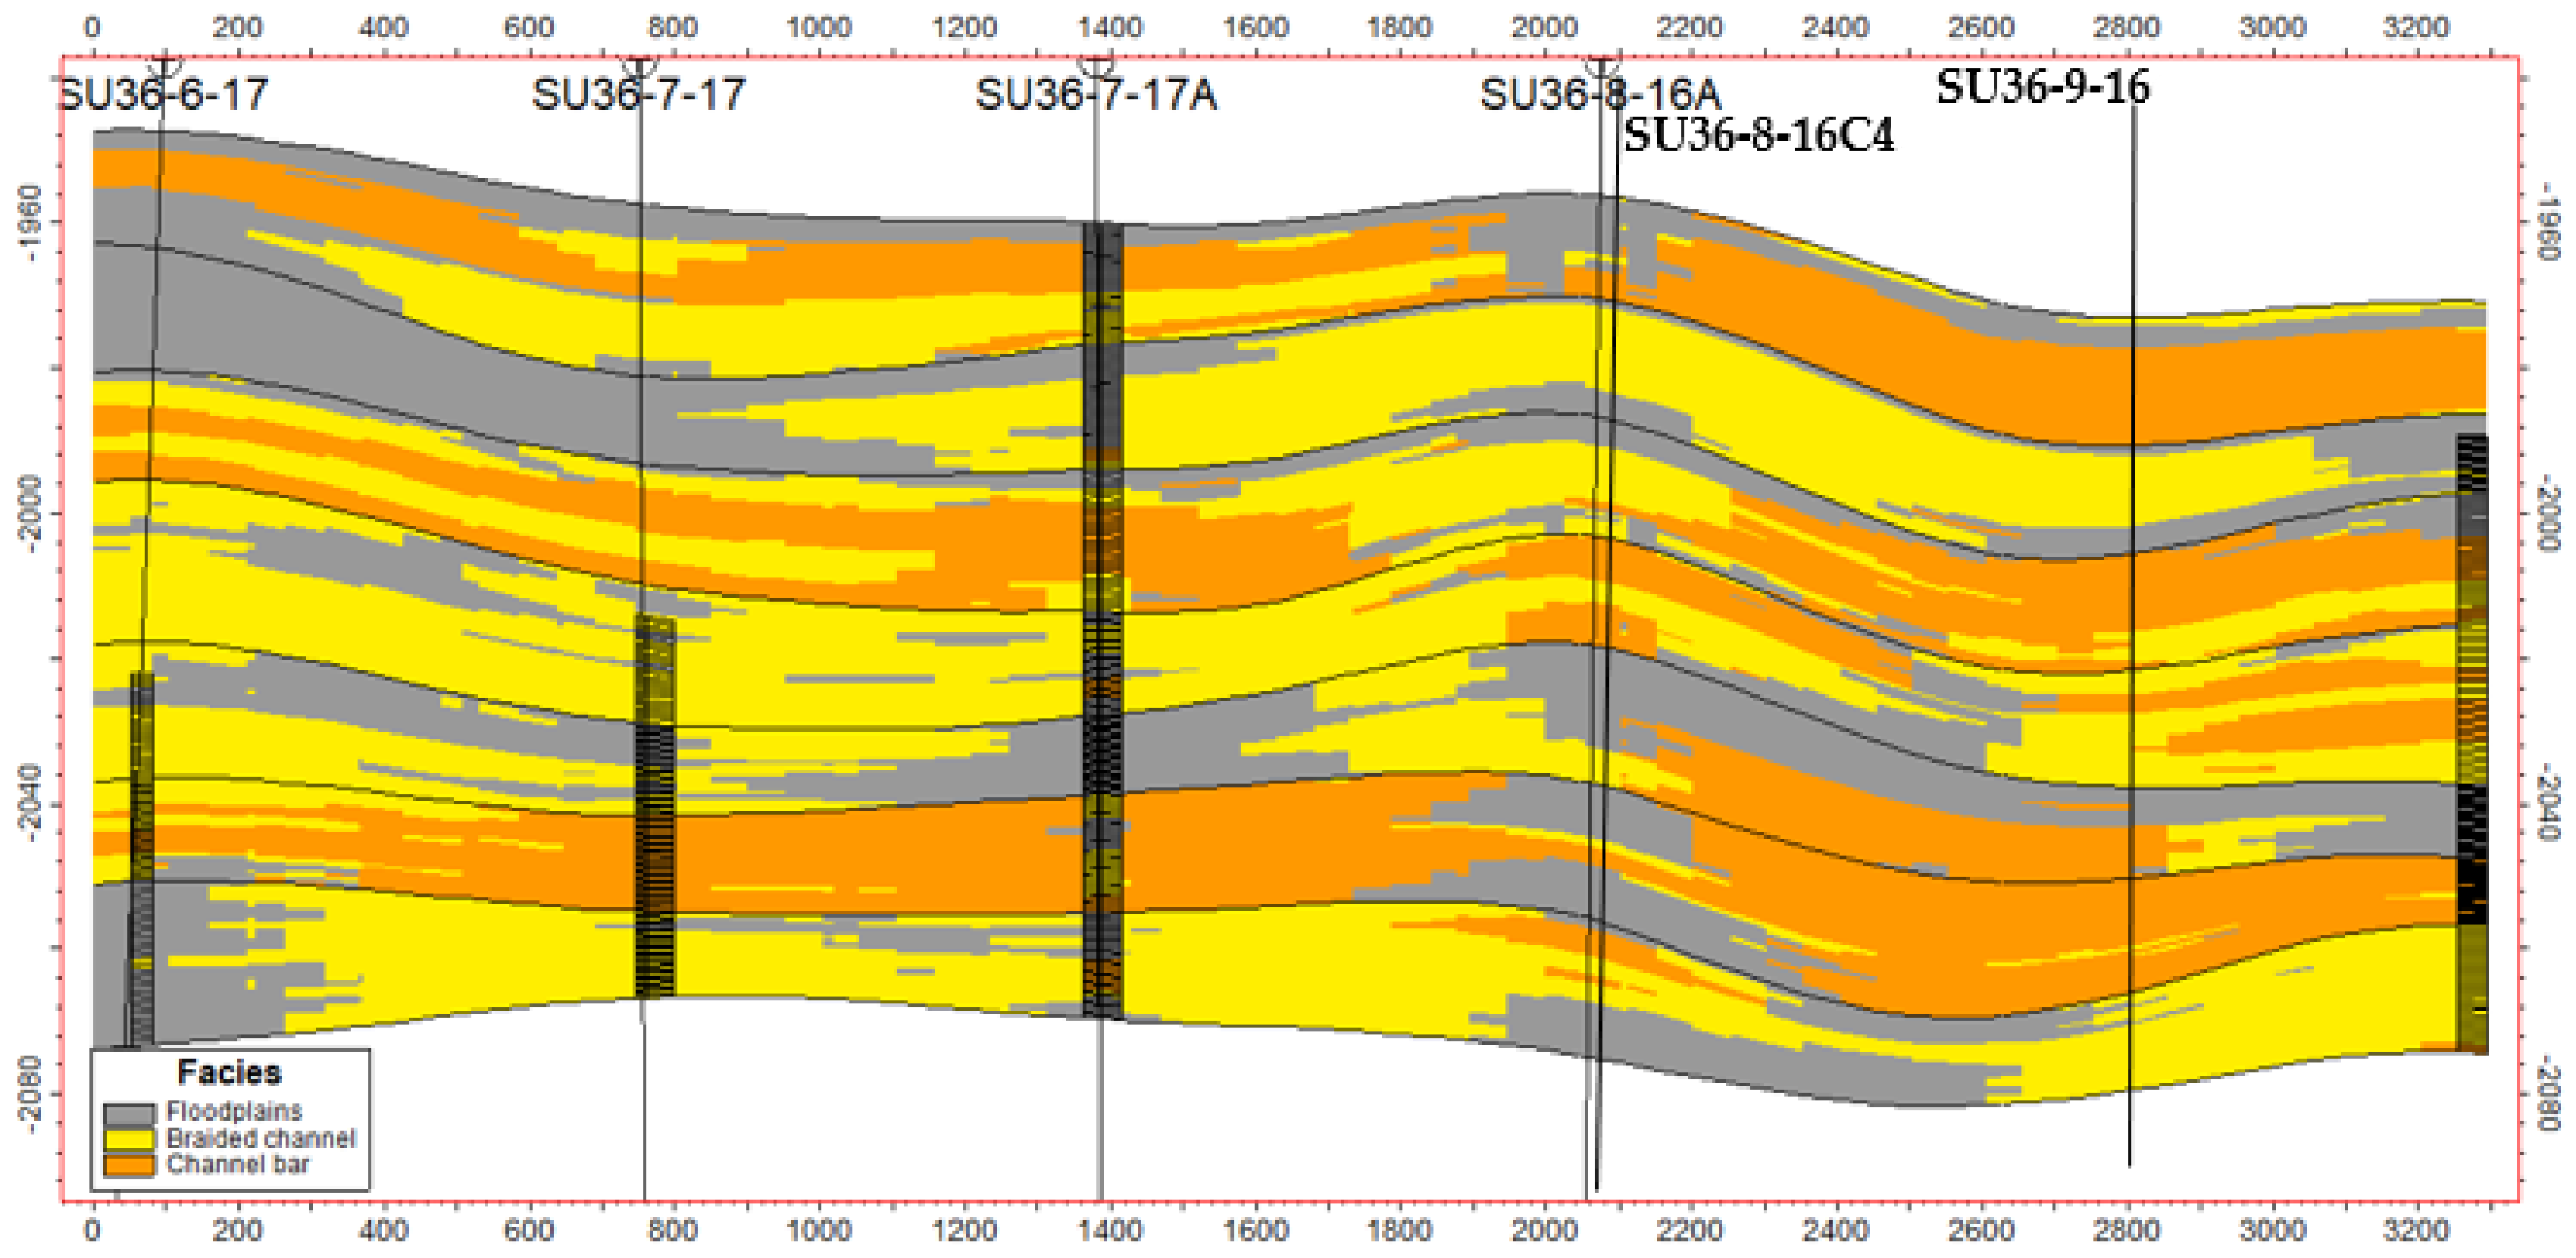
Furthermore, the modeling result was analyzed by comparing the geological well profile with the model profile (Figure 12 and Figure 13). As can be seen from the profile of wells SU36-6-17, SU36-7-17, SU36-7-17A, SU36-8-16A, SU36-8-16C4, and SU36-9-16, the simulation has well reproduced the distribution of the channel bar and channel. The channel bar is mainly embedded in the river; part of the channel bar is completely cut into the river, and part of the channel bar is local cut, a sandwich cake Mosaic. Morphologically, the feature of the convex top and flat bottom of the channel bar is well reproduced. The results of the simulation are in good agreement with the results of the geological facies profile. It shows that the model has high accuracy.
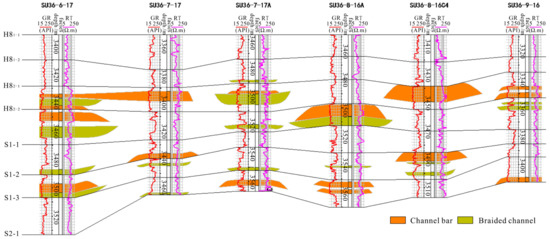
Figure 12.
Profile map of geological crossing well.
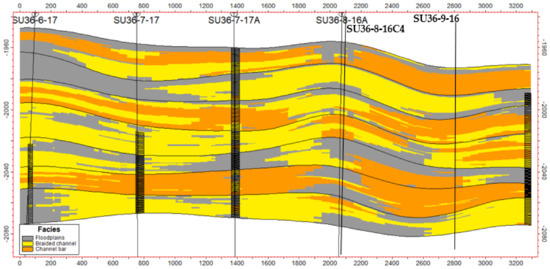
Figure 13.
Comparison of 3D geological model reconstructed from 2D section and geological anatomical results.
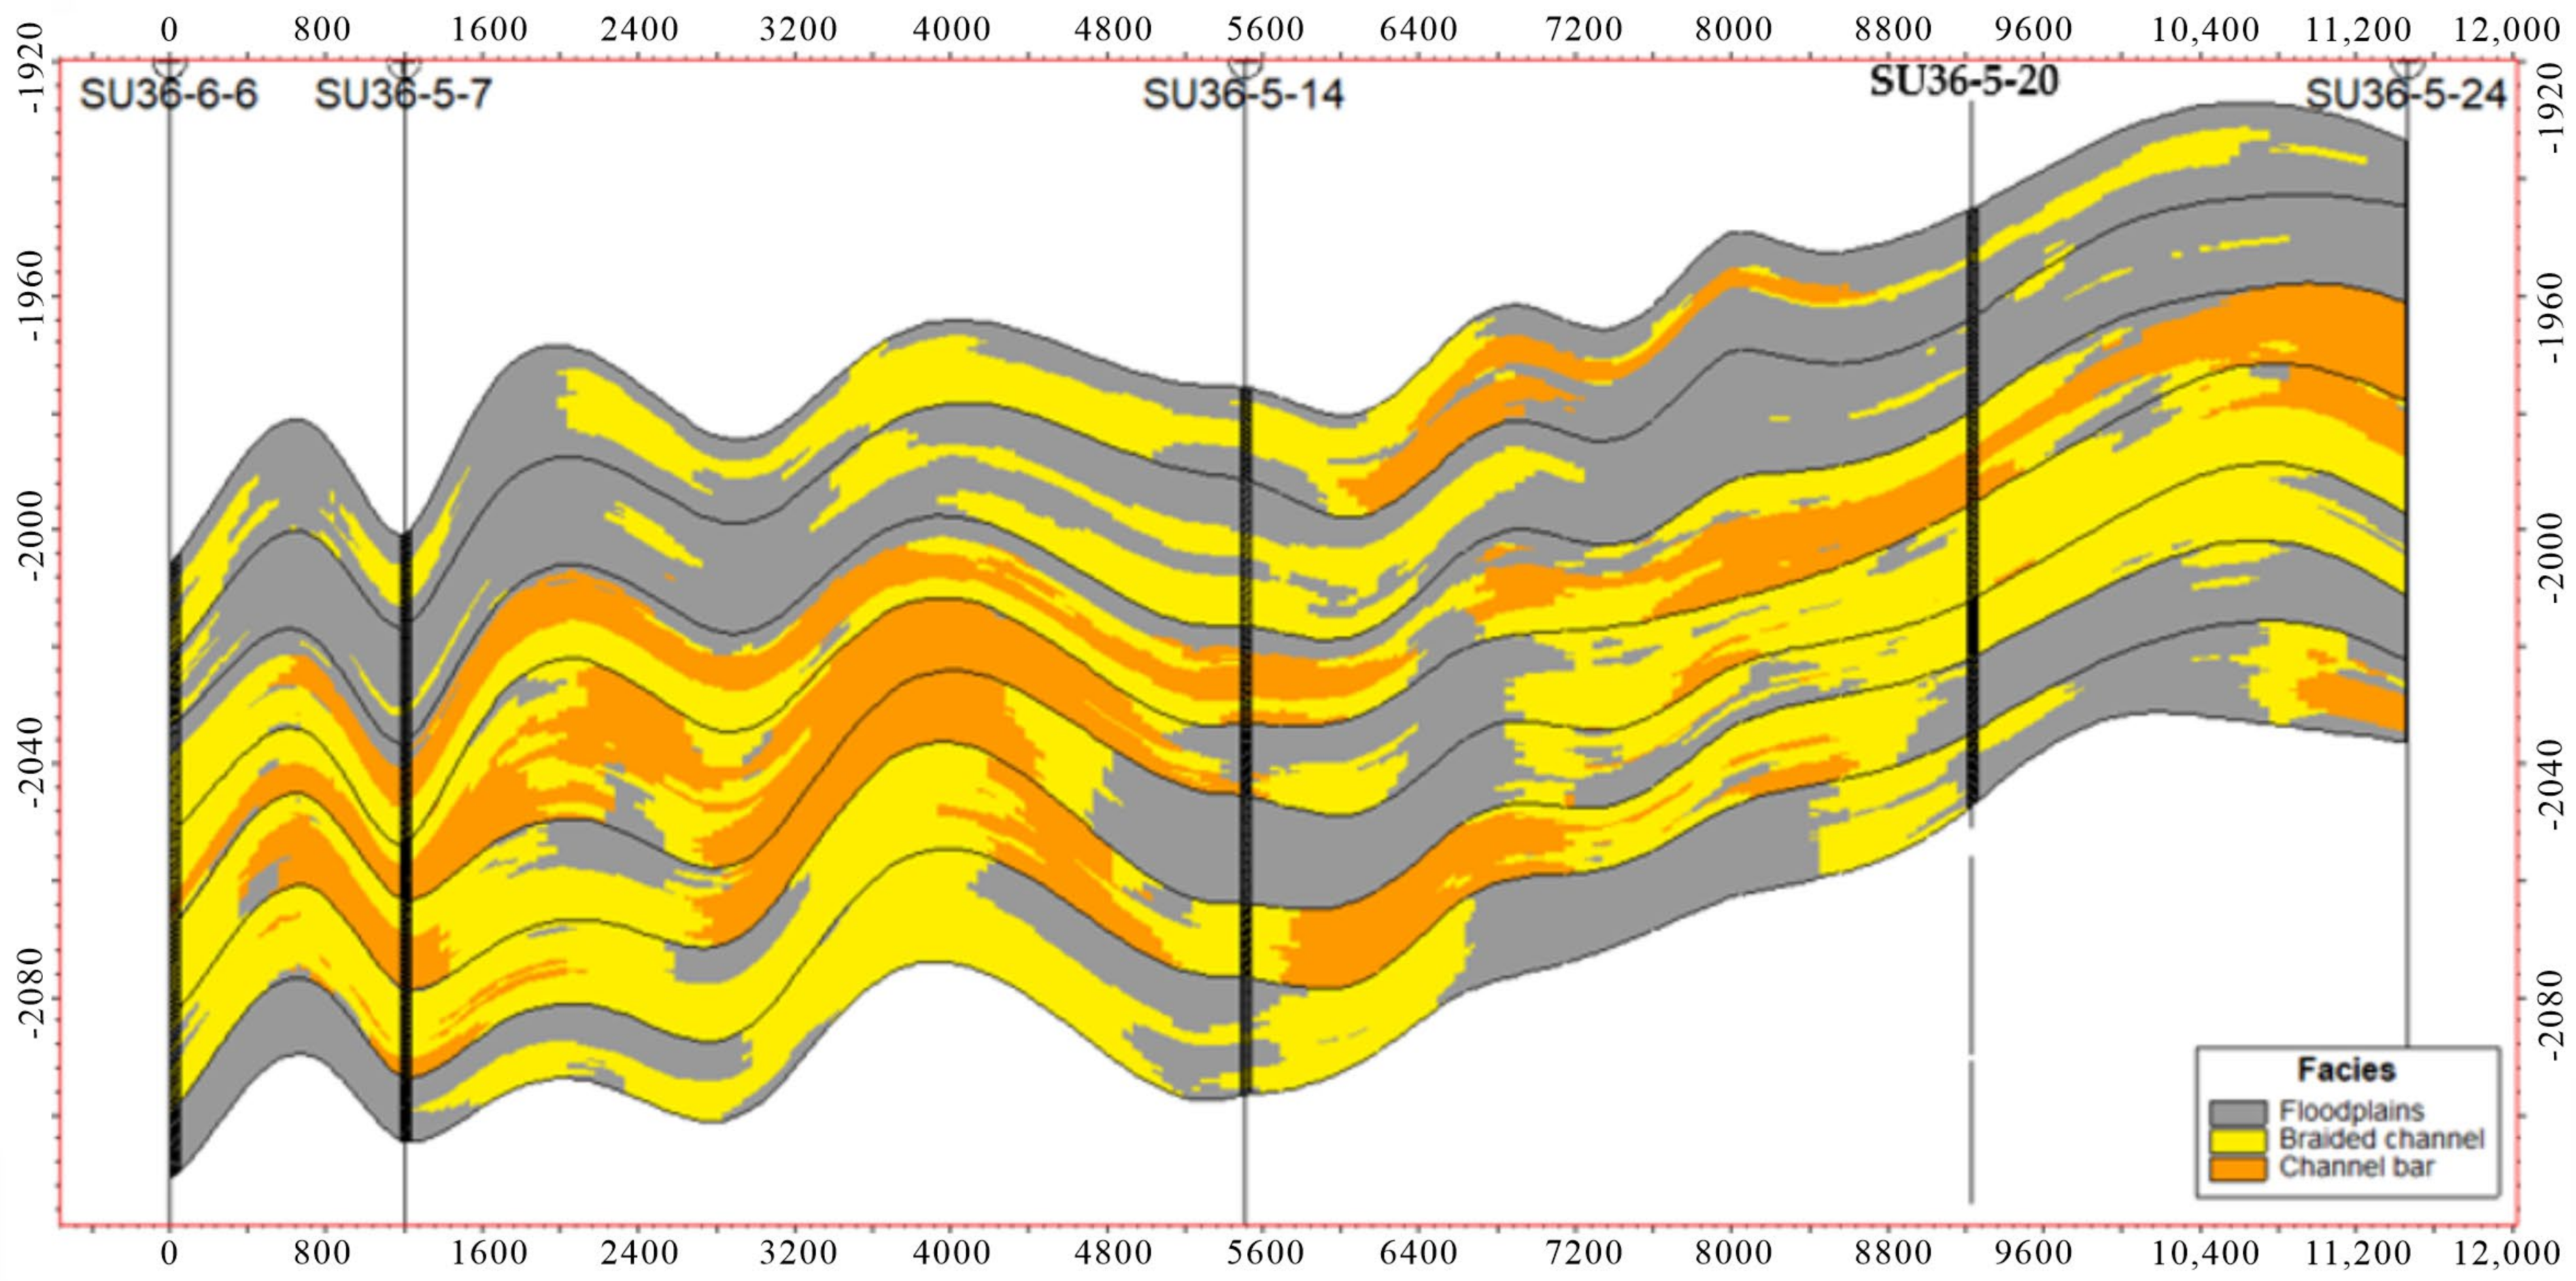
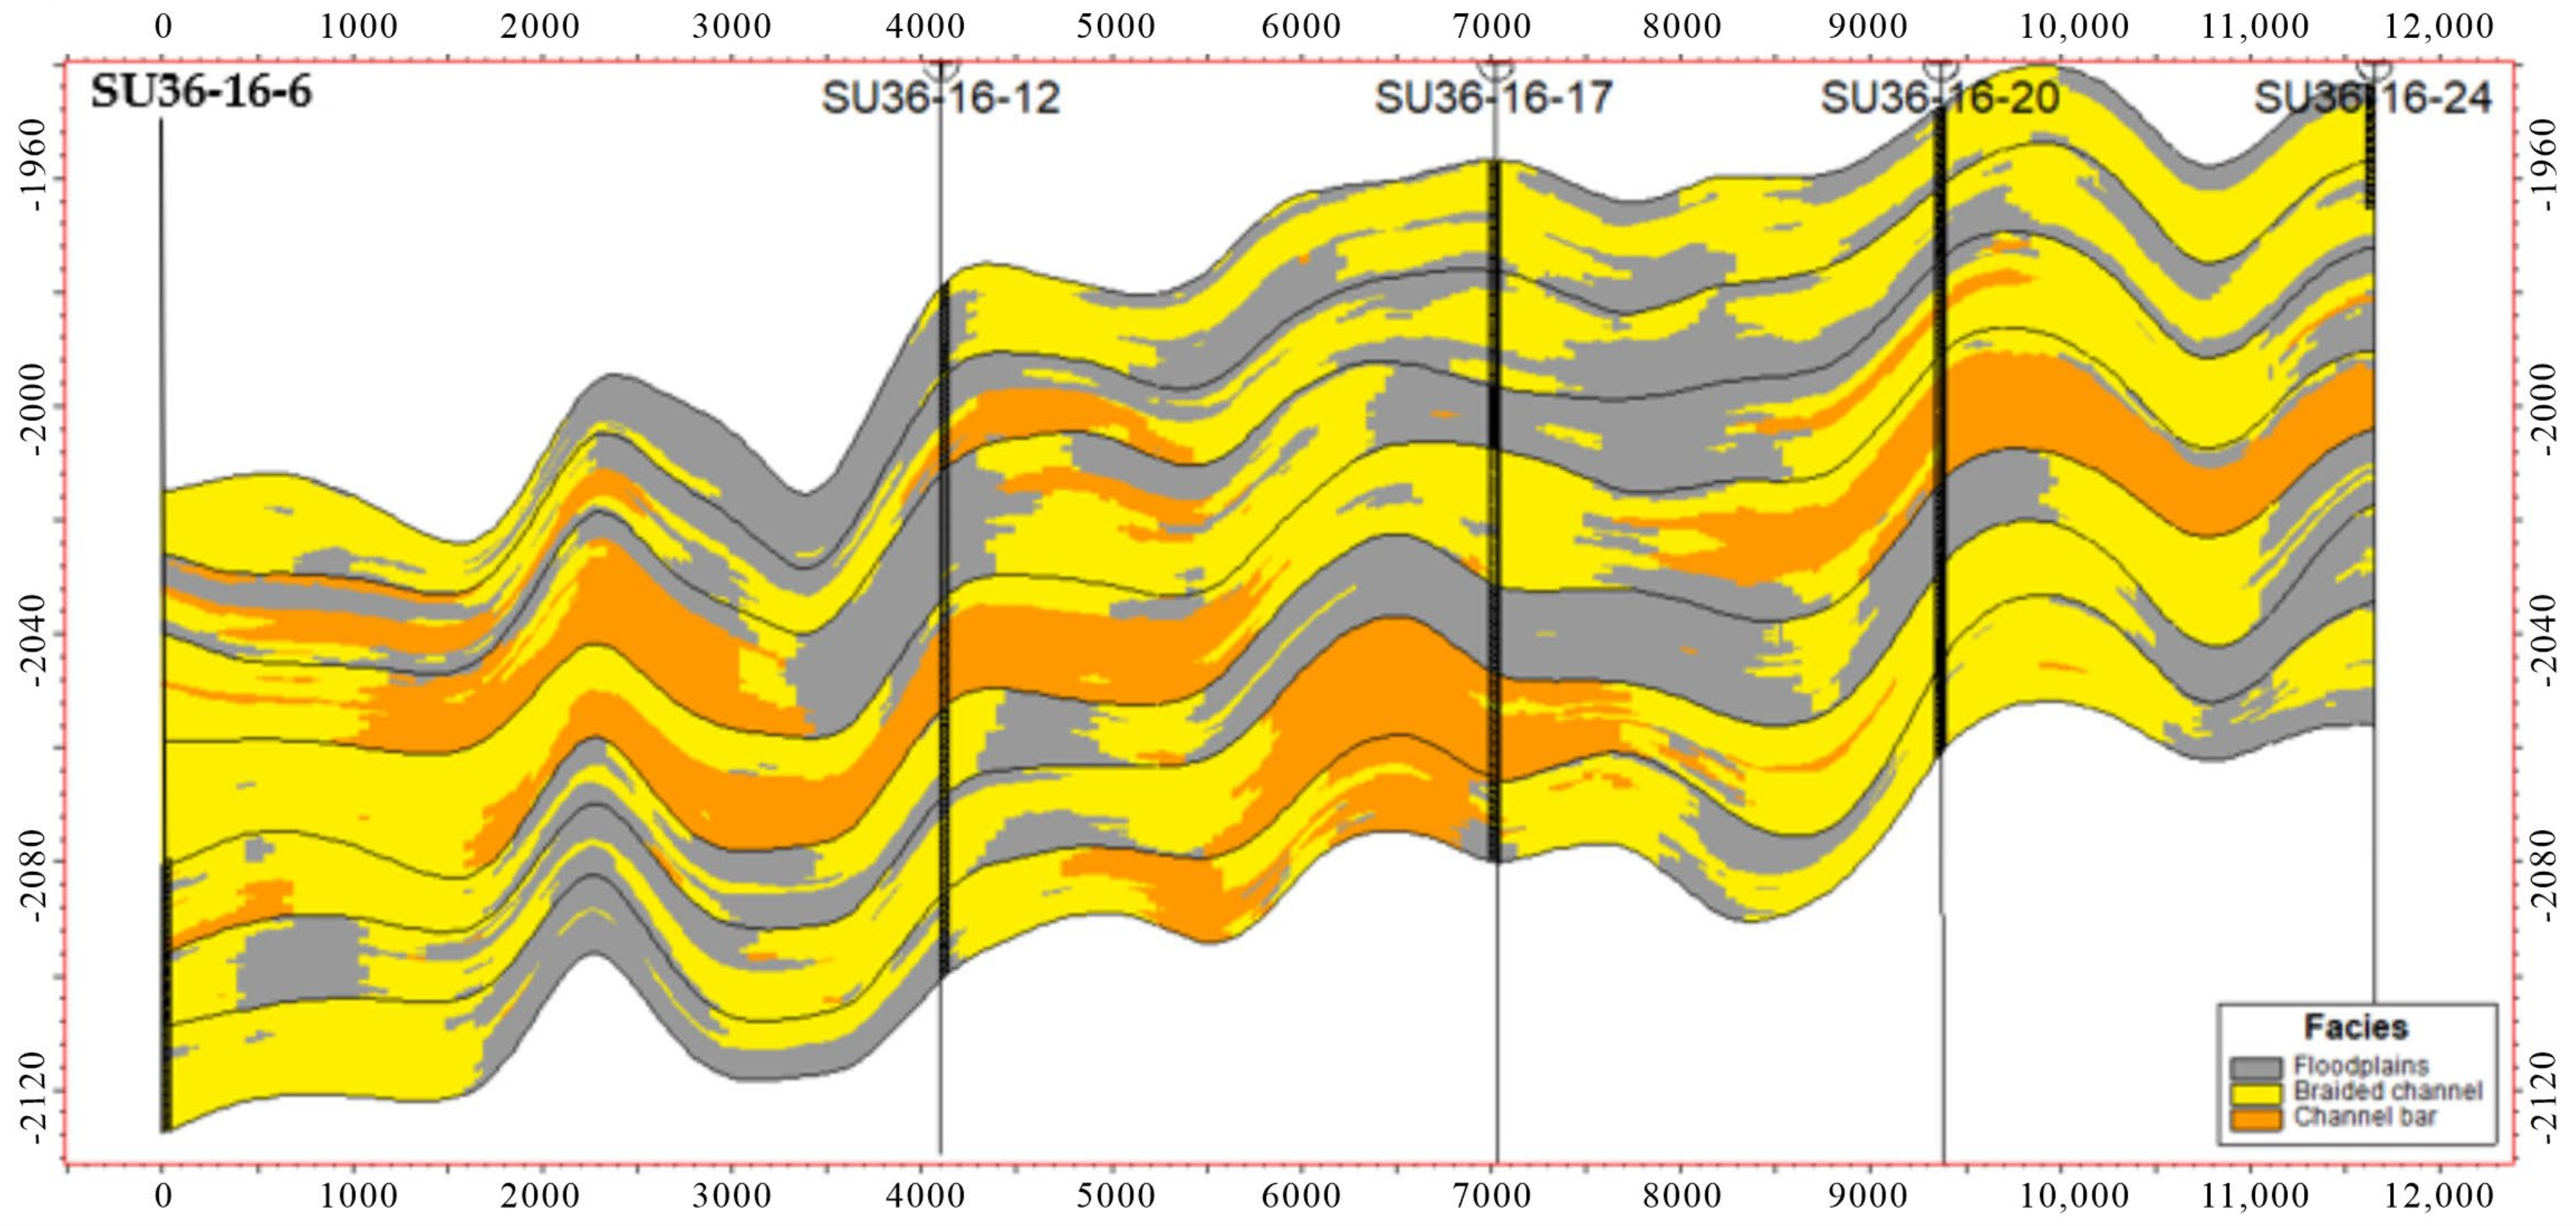
The model effect of reconstruction of the 3D geological model from the 2D profile was evaluated quantitatively by the method of cross-validation. In the study area, 10 wells were randomly excluded from modeling, and the predicted results were compared to verify the rationality of the geological model. It can be seen that the sedimentary micro-facies predicted by the remaining wells were in good match with the interpreting results. It could be seen from the statistical table that the maximum error of the channel bar was 13.8, which is located in well SU 36-5-7 (Table 2). It is located in well SU 36-6-6 with a minimum error of 2.4. The average is 6.5. This indicated that the model had relatively high precision (Figure 14 and Figure 15). It could be used to guide subsequent facies-controlled property modeling.

Table 2.
Comparison of errors in extracting wells.
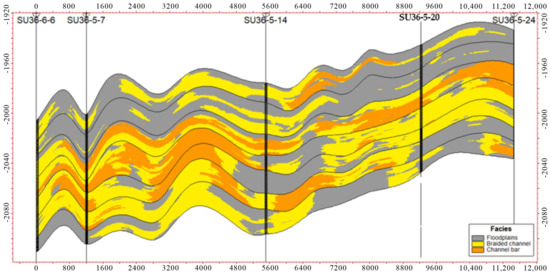
Figure 14.
Cross validation profile of wells SU36-6-6, SU36-5-7, SU36-5-14, SU36-5-20, and SU36-5-24.
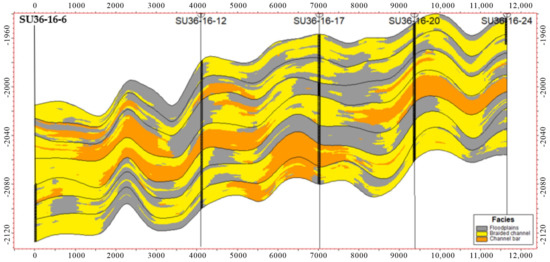
Figure 15.
Cross validation profile of wells SU36-16-6, SU36-16-12, SU36-16-17, SU36-16-20, and SU36-16-24.
4. Petrophysical Property Modeling
The spatial distribution of sedimentary facies is the key factor affecting the distribution of reservoir physical property parameters. Adopting the idea of facies-controlled modeling is conducive to better playing the geological constraint role. Facies-controlled modeling is to first establish the reservoir facies model and then carry out inter-well interpolation of petrophysical parameters according to the quantitative distribution of different reservoir facies. Overall, the facies-controlled sequential Gaussian modeling method was adopted to simulate the physical properties.
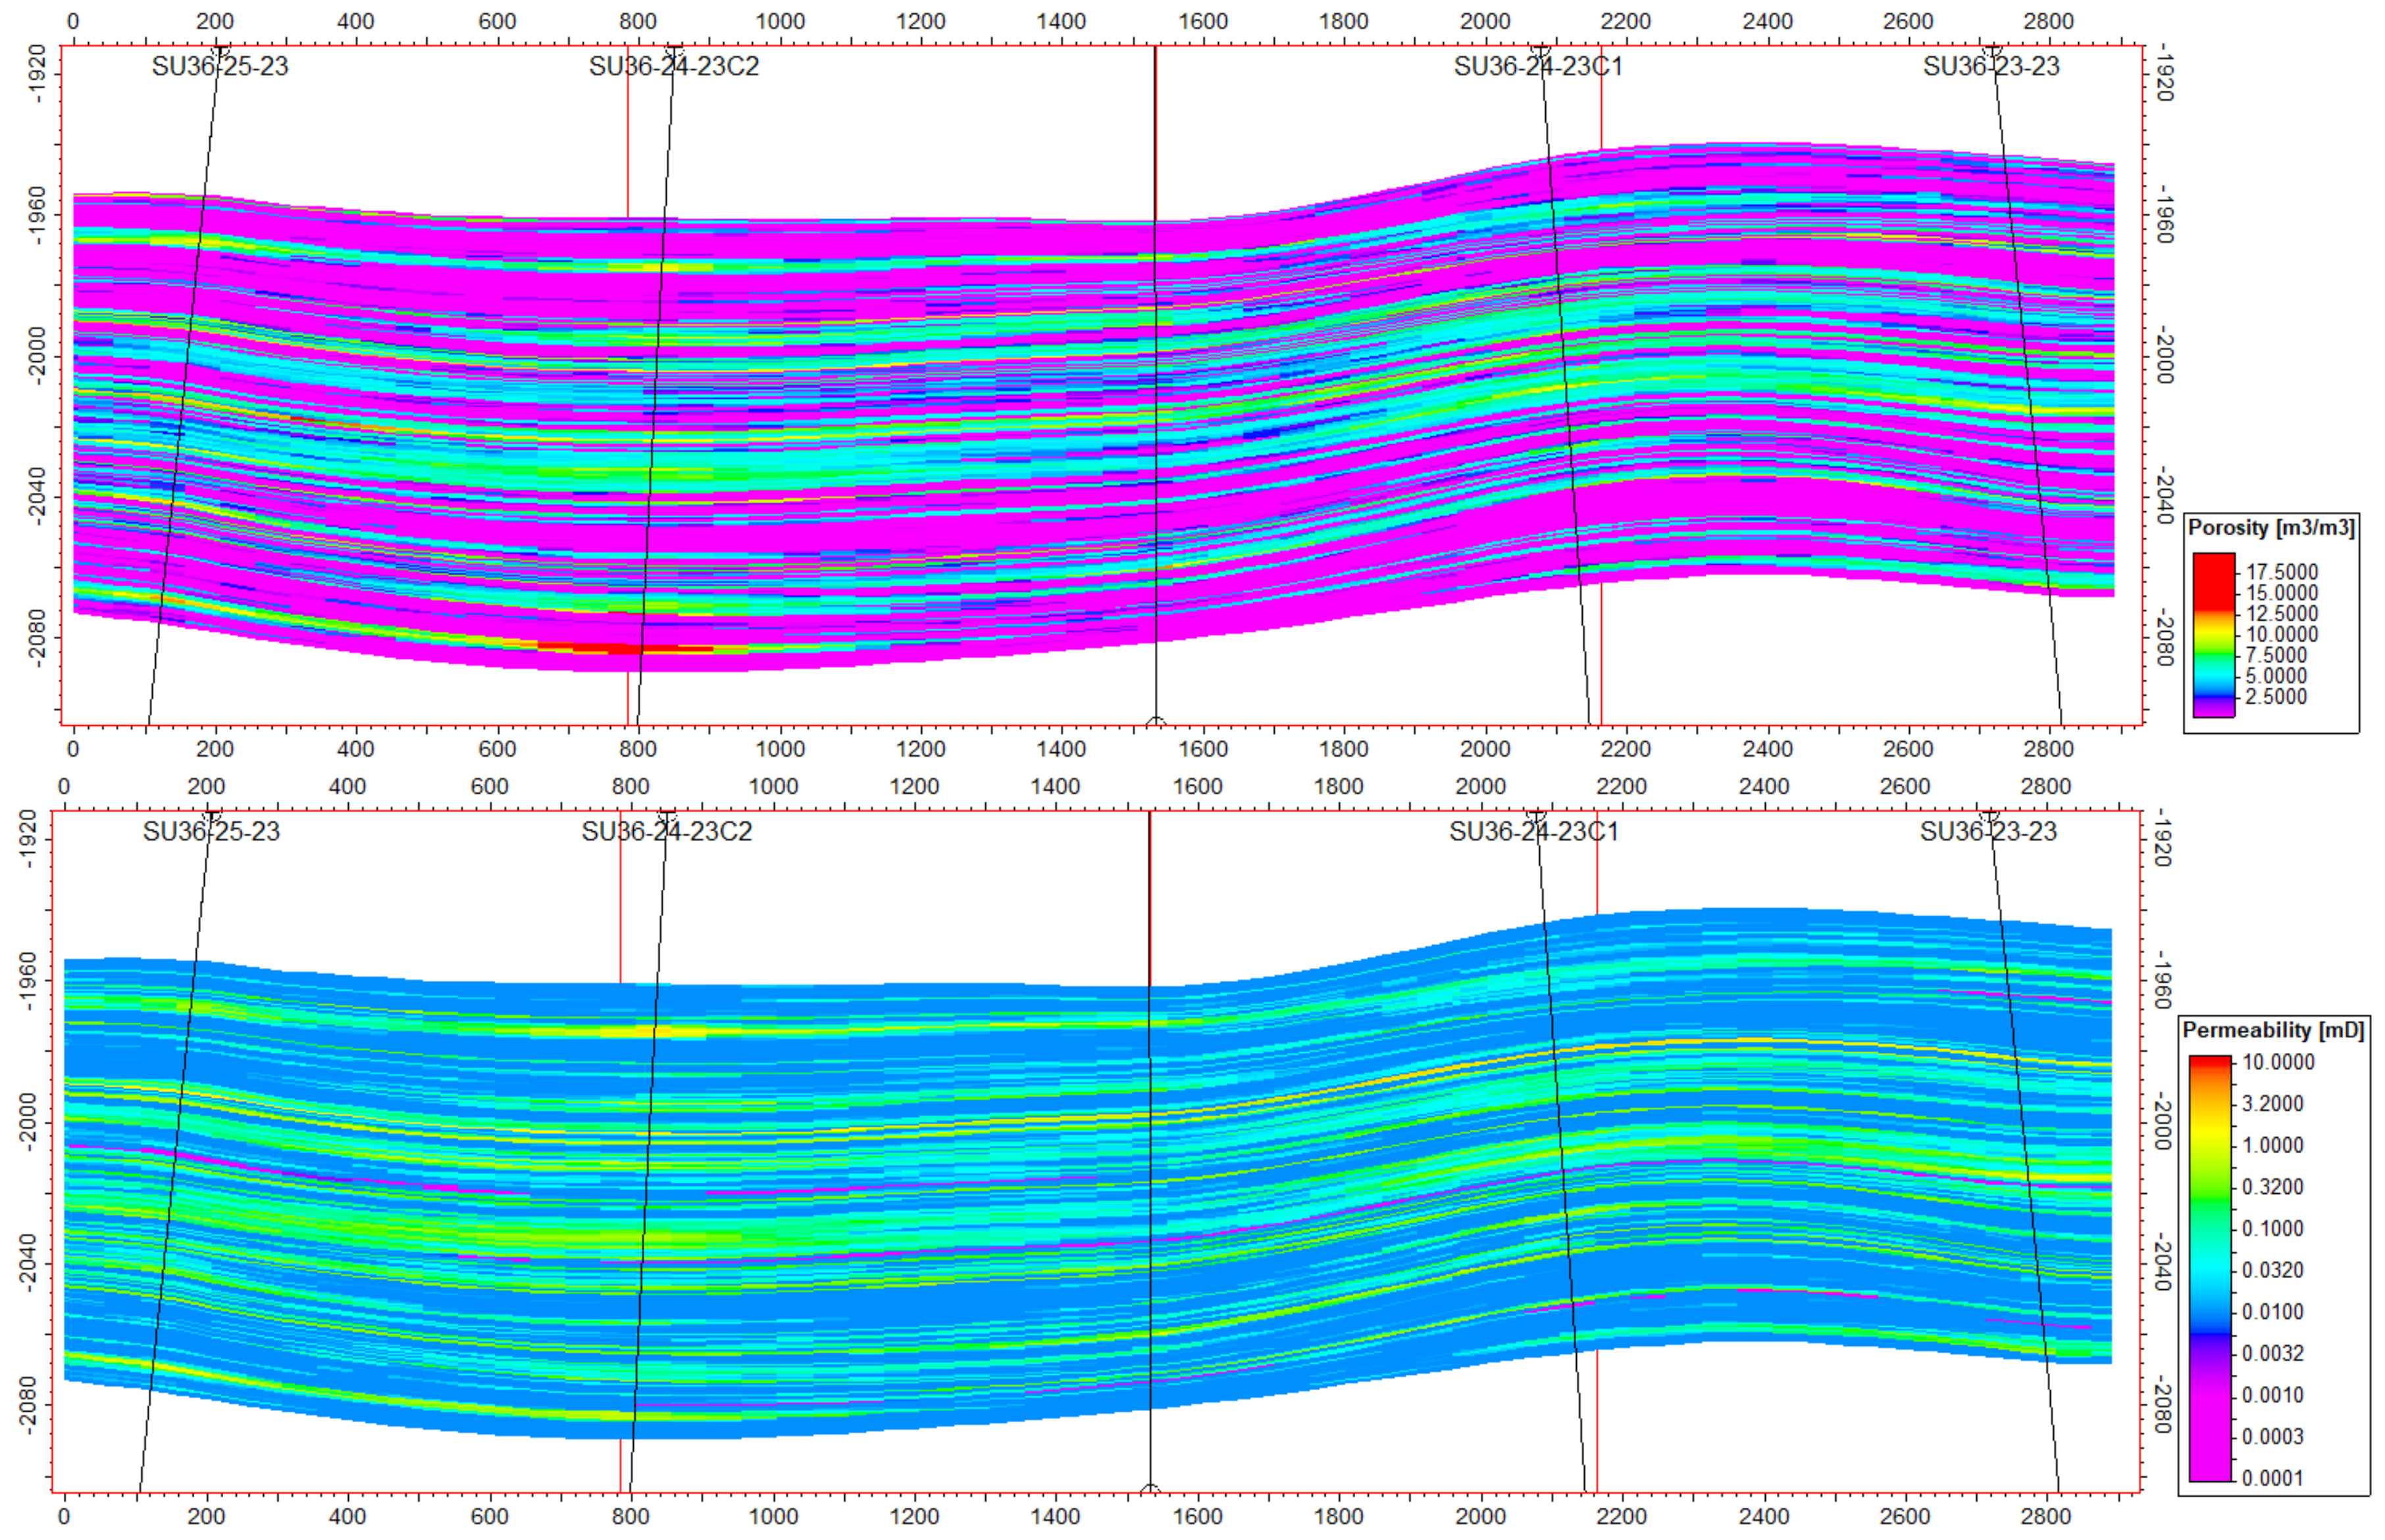
The distribution model of reservoir physical properties in the SU 36-11 area was established by the facies-controlled sequential Gaussian modeling method (Figure 16). As can be seen, the reservoir porosity is generally between 0.1 and 13%, and the channel porosity is smaller than that of the channel bar on the whole. The permeability is generally 0.001–0.01 mD, accounting for about 95.8%. It reflects that the initial permeability has a large distribution range and heterogeneity. The porosity and permeability gradually decreased from the center to the two sides of the channel zone.
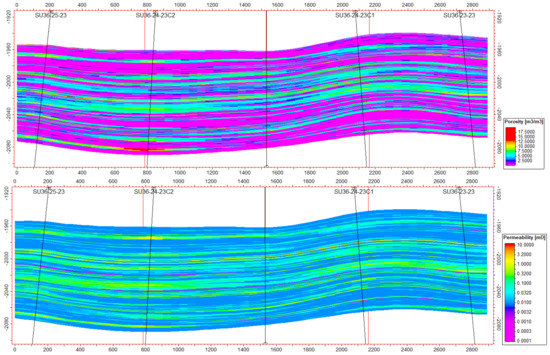
Figure 16.
The profiles of the porosity and permeability model in the SU 36-11 area.
5. Discussion
The sand body structure and sedimentary model obtained from the relatively dense well area could be used as a constraint and reference for reservoir prediction in sparse well areas, which improved the accuracy of geological understanding. Based on the well data of the relatively dense well area, the sand body anatomy and superimposed pattern were carried out, and three modes of the isolated channel, superimposed channel, and cut-superimposed channel with the independent distribution of the sand body were determined, which guided the prediction of sand body distribution in the whole area.
However, the result information of plane and profile sand bodies obtained by geological anatomy was only combined by two-point statistical modeling as a trend or boundary truncation method. As for the difficulty to embody the important information about sedimentary superimposition style in the two-point statistical algorithm, the lithological model shows poor continuity of sand bodies and unclear geological significance. In this study, lithological profiles were directly used as conditional data and TIs. The sand body superimposition style was obtained by scanning the 2D profiles using the 2D data templates. Then the probability fusion method was combined to generate 3D sand body probability. Since the probability was acquired from geological profiles and planes, the geological meaning was clear, and the superimposition mode was reproduced. The accurate characterization of sand body distribution is realized in the simulation result. The cross-validation test also showed that the prediction accuracy by using the method of 3D geological model reconstructed from 2D profiles is higher. It is a new stochastic reservoir modeling method worth popularizing.
From the perspective of modeling input, the model depends on the input TIs. The more 2D TIs, the better the geological models. Theoretically, 3D training images can provide more information. However, 3D representative training image is difficult to acquire, while 2D training images can avoid this problem. Secondly, profile separation allows the simulation to be carried out in local areas, and the local small areas have little reservoir variation, so it is easy to satisfy the hypothesis of stationary. The number of profiles can be analyzed from a statistical point of view. If the reservoir continuity is good, the use of far-apart sections can ensure stability. On the contrary, if the continuity is poor, the profile density needs to be increased to satisfy the assumption of stationarity and improve the accuracy of the model. In this study, we use the 2 × 2 × 7, 3 × 4 × 7, 5 × 6 × 7, and 7 × 9 × 7 profiles to construct the models and compare the model result in continuities. We found that the 5 × 6 × 7 profile improved the continuities compared with the 2 × 2 × 7 and 3 × 4 × 7 models. However, the improvements of the 7 × 9 × 7 model were not obvious. The digitized work of the profiles became increasingly time-consuming, so finally we used the 5 × 6 × 7 profile for model construction.
The bigger the 2D template with more wells in conditional data, the better the models. However, the data template cannot be infinitely big for the greater number of replicates in the data events and the complex change in the sediment superimposition mode. In 3D modeling using TIs, the data template 7 × 7 × 3 is often the best [32]. In this study, we compared the 5 × 5 × 1, 5 × 7 × 1, 7 × 9 × 1, 9 × 11 × 1,11 × 13 × 1, and 13 × 15 × 1 templates and compared the continuity of the sand body. We found that the 11 × 13 × 1 data template is the best for model construction.
Finally, model precision is often evaluated by new drilling wells, the reservoir performance, or other quantitative indexes. Unfortunately, due to the development strategy of the Changqing oilfield, CNPC, the scheduled new wells have not been drilled. The 2D seismic data is not provided due to low resolution, and the 3D high-resolution seismic data collection is now being conducted. Perhaps we can test the precision of the model with the new seismic and drilling data in the future.
6. Conclusions
From the core and sand body distribution, the deposit in the SU 36-11 area is considered to be a braided river reservoir deposit. The sedimentary micro-facies comprises mainly channel, channel bar, and floodplain, among which the channel and channel bar are the main reservoirs. Using the hierarchical architecture element analysis method, the internal architecture of the sand body was anatomized. The effective sand body thickness was determined to be 1–5 m, 200–500 m in width, 400–700 m in length, 50–120 in the ratio between width and thickness, and 1.5–3 in the ratio between length and width.
A 3D geological model of the braided river in the SU 36-11 area was established by reconstructing a 3D geological model from 2D profiles. Two-dimensional training images for modeling were obtained by the digitization of sedimentary plane and profile maps. Three-dimensional multi-point probability was obtained by the fusion of multi-point statistical probability from the two-dimensional training image. To ensure the accuracy of the model, the adaptive spatial iterative sampling method was used to add more reliable simulation points, to better reflect the sand body shape, and to overlay style. The sedimentary micro-facies model of the SU 36-11 area was established, which better reflected the spatial distribution characteristics of the channel bar and channel. The cross-validation test showed that the model error was less than 10%, which indicated that the established model had high prediction accuracy and could be used to guide the efficient development of subsequent gas reservoirs.
Author Contributions
Conceptualization, L.C. and Y.Y.; methodology, Y.Y.; formal analysis, X.P.; investigation, X.P.; resources, L.C.; writing—original draft preparation, X.P. and L.C. writing—review and editing, L.C. and Y.Y. All authors have read and agreed to the published version of the manuscript.
Funding
This research was funded by [Research on improving gas recovery with water invasion and development technology of low abundance complex gas reservoir] grant number [2021DJ1705].
Data Availability Statement
All data can be accessed from the corresponding author.
Conflicts of Interest
The authors declare no conflict of interest.
References
- Zhang, D.; Chu, L.; Li, X.; Wang, X. Comprehensive sweet point evaluation and exploration results of tight glutenite reservoir in fault basin: A case study of the Lower Cretaceous Shahezi Formation in Xujiaweizi Fault Depression in the northern Songliao Basin. China Pet. Explor. 2022, 27, 73–82. [Google Scholar]
- Li, I.-Z.; Guo, B.-C.; Zheng, M.; Yang, T. Main Types, Geological Features and Resource Potential of Tight Sandstone Gas in China. Nat. Gas Geosci. 2012, 23, 607–615. [Google Scholar]
- Yang, C.; Su, N.; Rui, Y.; Zheng, Y.; Wang, X.; Zhang, Y.; Jin, H. Gas accumulation conditions and exploration potential of tight gas reservoir of the Middle urassic Shaximiao Formation in Sichuan Basin. China Pet. Explor. 2021, 26, 98–109. [Google Scholar]
- Tang, Y.G.; Yang, X.Z.; Xie, H.W.; Xu, Z.P.; Wei, H.X.; Xie, Y.N. Tight gas reservoir characteristics and exploration potential of urassic Ahe Formation in Kuqa Depression, Tarim Basin. China Pet. Explor. 2021, 26, 113–124. [Google Scholar]
- Lijun, M.; Guanghui, Z. Geological characteristics and exploration breakthrough in Linxing-Shenfu tight gas field, northeastern Ordos Basin. China Pet. Explor. 2021, 26, 53–67. [Google Scholar]
- Hua, Y.; Jinhua, F.; Xinshe, L.; Peilong, M. Accumulation conditions and exploration and development of tight gas in the Upper Paleozoic of the Ordos Basin. Pet. Explor. Dev. 2012, 39, 295–303. [Google Scholar]
- Hua, Y.; Xinshan, W. New progress achieved by natural gas exploration in Sulige area. Nat. Ind. 2007, 27, 6–11. [Google Scholar]
- Guo, Z.; Wang, G.; Xia, Y.; Yang, B.; Han, J.C. Technical countermeasure of well pattern optimization in multi-layer lenticular tight sandstone gas field. Nat. Gas Geosci. 2022, 33, 1883–1894. [Google Scholar]
- Tan, Z.; Lu, T.; Liu, Y.; Wu, L.; Yang, Y. Technical ideas of recovery enhancement in the Sulige Gasfield during the 13th FiveYear Plan. Nat. Gas Ind. 2016, 36, 30–40. [Google Scholar]
- He, D.; Wang, L.; Ji, G.; Wei, Y.; Jia, C. Well spacing optimization for Sulige tight sand gas field, NW China. Pet. Explor. Dev. 2012, 39, 458–464. [Google Scholar] [CrossRef]
- Jia, A.; Wang, G.; Meng, D.; Guo, Z.; Ji, G.; Chen, L. Well pattern infilling strategy to enhance oil recovery of giant low-permeability tight gasfield: A case study of Sulige gasfield, Ordos Basin. Acta Pet. Sin. 2018, 39, 802–813. [Google Scholar]
- Li, Q.; Gao, S.-s.; Wu, H.-h.; Zhang, J.; Yang, Y.; Yang, M.-h. Well network densification and recovery evaluation of tight sandstone gas reservoirs. Nat. Gas Geosci. 2020, 31, 865–876. [Google Scholar]
- Dai, J.; Li, J.; Wang, B.; Pan, R. Distribution regularity and formation mechanism of gas and water in the western area of Sulige gas field, NW China. Pet. Explor. Dev. 2012, 39, 560–566. [Google Scholar] [CrossRef]
- He, S.-L.; Lan, C.-L.; Men, C. New braided river model in Sulige Gas Field of Ordos Basin. Acta Pet. Sin. 2005, 26, 25–29. [Google Scholar]
- Zhang, W.; Yang, H.; Xie, L.; Yang, Y. Lake-bottom hydrothermal activities and their influences on the high-quality source rock development: A case from Chang 7 source rocks in Ordos Basin. Pet. Explor. Dev. 2010, 37, 424–429. [Google Scholar]
- Lu, T.; Liu, Y.; Wu, L.; Wang, X. Challenges to and countermeasures for the production stabilization of tight sandstone gas reservoirs of the Sulige Gasfield, Ordos Basin. Nat. Gas Ind. B 2015, 2, 323–333. [Google Scholar] [CrossRef]
- He, D.; Jia, A.; Ji, G.; Wei, Y.; Tang, H. Well type and pattern optimization technology for large scale tight sand gas, Sulige gas field, NW China. Pet. Explor. Dev. 2013, 40, 84–95. [Google Scholar] [CrossRef]
- Yang, H.; Fu, J.; Liu, X.; Fan, L. Formation conditions and exploration technology of large-scale tight sandstone gas reservoir in Sulige. Acta Pet. Sin. 2012, 33 (Suppl. S1), 27–36. [Google Scholar]
- Zhao, Z.; Li, J.; Ma, Z.; Wu, X.; Fu, B.; Wang, W. Quantitative Characterization of Architecture Units for Braided River Reservoir in Su36–11 EOR Test Area. Xiniang Pet. Geol. 2017, 38, 31–55. [Google Scholar]
- Zhai, Y.; Ma, U.; Ma, X.; Yang, Y.; Zhang, S. Sand Body Description from Seismic Inversion based on the Control of Braided River Reservoir Characteristics: Taking the lower of H8 formation in Sulige gas field as an example. Acta Sedimentol. Sin. 2022, 1–17. [Google Scholar]
- Wang, Y.; Leng, S.-Y.; Deng, I.; Lu, Y.; Chen, J.-W. The characteristics of sand-body architecture of Lower He8 Member in western Sulige Gas Field. Inn. Mong. Petrochem. Ind. 2022, 48, 108–113. [Google Scholar]
- Liu, X.; Zhao, X.; Kang, R.; Qi, Y.-L. Formation mechanism of sand bodies of the eighth member of Shihezi Formation in northern Ordos Basin. Lithol. Reserv. 2015, 27, 196–203. [Google Scholar]
- He, Z.-X.; Fu, J.-H.; Xi, S.-l.; Fu, S.-T.; Bao, H.-P. Geological features of reservoir formation of Sulige gas field. Acta Pet. Sin. 2003, 24, 6–12. [Google Scholar]
- Okabe, H.; Blunt, M. Pore space reconstruction using multiple-point statistics. J. Pet. Sci. Eng. 2005, 46, 121–137. [Google Scholar] [CrossRef]
- Zhang, T.; Lu, D.; Li, D. A method of reconstruction of porous media using a 2D image and multiple-point statistics. J. Univ. Sci. Technol. China 2010, 40, 271–277. [Google Scholar]
- Comunian, A.; Renard, P.; Straubhaar, J. 3D multiple-point statistics simulation using 2D training images. Comput. Geosci. 2012, 40, 49–65. [Google Scholar] [CrossRef]
- Chen, Q.; Mariethoz, G.; Liu, G.; Comunian, A.; Ma, X. Locality-based 3-D multiple-point statistics reconstruction using 2-D geological cross-sections. Hydrol. Earth Syst. Sci. Discuss. 2018, 22, 6547–6566. [Google Scholar] [CrossRef]
- Wang, L.; Yin, Y.; Wang, H.; Zhang, C.; Feng, W.; Liu, Z.; Wang, P.; Cheng, L.; Liu, J. A method of reconstructing 3D model from 2D geological cross-section based on self-adaptive spatial sampling: A case study of Cretaceous McMurray reservoirs in a block of Canada. Pet. Explor. Dev. 2021, 48, 347–359. [Google Scholar] [CrossRef]
- Allard, D.; Comunian, A.; Renard, P. Probability Aggregation Methods in Geoscience. Math. Geosci. 2012, 44, 545–581. [Google Scholar] [CrossRef]
- Jeong, C.; Mukerji, T.; Mariethoz, G. A fast approximation for seismic inverse modeling: Adaptive spatial resampling. Math. Geosci. 2017, 49, 845–869. [Google Scholar] [CrossRef]
- Xu, D. The Research and Application of 3D Reservoir Configuration Modeling in Braided River: A Case Study of 36–11 Well Pattern Area of Sulige Gasfield. Ph.D. Thesis, China University of Petroleum (East China), Dongying, China, 2018. [Google Scholar]
- Mariethoz, G.; Renard, P.; Straubhaar, J. The direct sampling method to perform multiple-point geostatistical simulations. Water Resour. Res. 2010, 46, 1–24. [Google Scholar] [CrossRef]
Disclaimer/Publisher’s Note: The statements, opinions and data contained in all publications are solely those of the individual author(s) and contributor(s) and not of MDPI and/or the editor(s). MDPI and/or the editor(s) disclaim responsibility for any injury to people or property resulting from any ideas, methods, instructions or products referred to in the content. |
© 2023 by the authors. Licensee MDPI, Basel, Switzerland. This article is an open access article distributed under the terms and conditions of the Creative Commons Attribution (CC BY) license (https://creativecommons.org/licenses/by/4.0/).

