Review

Review of Biofuel Effect on Emissions of Various Types of Marine Propulsion and Auxiliary Engines

by
Theofanis D. Chountalas
1,
Maria Founti
1 and
Dimitrios T. Hountalas
2,*
1
Laboratory of Heterogeneous Mixtures, National Technical University of Athens, 15772 Athens, Greece
2
Internal Combustion Engines Laboratory, National Technical University of Athens, 15772 Athens, Greece
*
Author to whom correspondence should be addressed.
Energies 2023, 16(12), 4647; https://doi.org/10.3390/en16124647
Submission received: 29 April 2023 / Revised: 6 June 2023 / Accepted: 9 June 2023 / Published: 11 June 2023
(This article belongs to the Special Issue Advances in Bioenergy)

Abstract

:
The International Maritime Organization aims to reduce the maritime industry’s carbon emissions by 40% in the next two decades and has introduced measures to control CO2 emissions. These have significantly increased interest regarding biofuels, which can be used immediately on existing vessels, reducing their carbon footprint. The most common variant is B30, a blend of 70% crude oil and 30% biodiesel. Concerns exist for the potential effect on engine performance and NOx emissions. Scientific works on the subject are limited for two-stroke marine engines, while some studies are available for four-stroke ones, usually auxiliaries. To increase information availability on the subject, in this work, we review the results of testing on multiple marine engine types, two-stroke propulsion and four-stroke auxiliary units using B30 and conventional fuels. The effect on emissions and fuel efficiency is examined and cross-referenced with the available literature. A small increase in specific fuel consumption was observed for B30 use that varied with engine type. The increase was on average 1% for two-stroke and 2.5% for four-stroke engines. The effect of B30 on NOx emissions was low but varied between engines. For low-speed two-stroke engines, NOx increase was on average 4% compared to crude oil, and 2.4% for four-stroke auxiliary units, albeit with higher variance. For some four-stroke units, a decrease in emissions was found. All previous results were in line with other published studies. Overall, it was found that while biofuel effect can vary considerably between applications, 30% biodiesel blends can be used with no concerns regarding emissions and fuel efficiency.

1. Introduction

The control of carbon emissions is of major importance for the future of the transportation industry. In the maritime sector, GHG emissions were predicted to rise between 50 and 250% by 2050 in a 2014 study [1] by the IMO, unless measures are implemented. In 2018, the IMO adopted an initial strategy to reduce vessel carbon footprint, aiming towards a 40% CO2 emissions reduction by 2030 and 70% by 2050 compared to 2008 levels [2]. A number of measures have recently been implemented in the form of indexes that introduce design requirements for new vessels and operational requirements for existing ones [3]. To achieve favorable rating, for existing vessels, corrective measures concerning their operation may be required, imposing limitations on engine power and vessel speed [4,5] and limiting maximum operational capability. One option for the industry to lower the carbon footprint of vessels without resorting to such restrictions is the use of biofuels, which is officially among the methods under evaluation by the IMO (International Maritime Organization) to achieve its 2030 target [2,6,7]. The main benefit of biofuels is the ability to use them on current marine engines without modifications [8], while handling and storage requirements are manageable [9]. The main downsides, which are common for most alternative low-carbon fuels, are limited production capability and bunkering locations [10,11]. Regarding production, further challenges arise, as the end carbon footprint of the biofuels must be validated [2,12] and the impact of their production on other sectors, mainly agriculture [13], must be assessed. Currently, biofuels are classified under four main generations [14], with the first two commercially available and the other two at the early development stage [14]. The biodiesel type used as of now in the maritime sector is second generation, as the first-generation biodiesels have been met with scrutiny regarding sustainability and land use due to them being sourced from edible feedstock [13]. Second-generation biodiesel is most commonly the product of non-edible feedstock such as waste oil and palm fatty acid distillate [15], alleviating such concerns. Marine biofuels are provided in the form of blends of VLFSO (very-low-sulfur fuel oil) and biodiesel to increase availability, as marine engines require substantial fuel amounts daily, and to limit the potential impact on engine performance and emissions. The main concern stems from the increased oxygen content of biodiesel [16], as oxygenated fuels tend to increase NOx formation [17], and this tendency is higher compared to the effect of richer air oxygen concentration [18]. In addition to emissions, the performance impact should be evaluated with emphasis on the fuel supply system. Due to the minor usage of biofuels in the marine sector [19], the number of studies regarding the effect on performance and emissions is currently very low. The lack of information is further enhanced by the fact that marine biofuel is a blend of biodiesel and crude oil, while typically diesel-grade fuel is used in studied blends. In the present work, the review of findings of an extended experimental campaign on marine engines is presented. The aim is to provide an assessment of the impact of biofuels on NOx emissions and performance by using measured data on various engine types at actual conditions, with an extensive literature review of publications examining biofuel effect primarily on marine engines. The studied engines are classified in two categories, low-speed two-stroke propulsion engines and constant-speed four-stroke auxiliary generators. In all cases, the fuel used for testing was B30 from various suppliers, and all variants were produced from waste oil feedstock. For the cases that the vessel schedule allowed extended trial periods, the B30 measurements were complemented with measurements with conventional fuels, high-quality marine gas oil referred as MGO (marine gas oil), and crude oils, HFO (heavy fuel oil), or VLSFO. The process involved emissions measurements according to official standards for a minimum of two loads. Engine operational data were collected, specifically fuel consumption and cylinder pressure data.

2. Overview of Biofuel Effect on Engine Fuel Consumption and NOx Emissions

The subject of biodiesel’s effect on engine performance has been extensively studied for fuels of various sources and in blends of different percentages for engines used in land transport. In the field of marine engines, information is limited compared to other sectors, especially in the case of large two-stroke propulsion engines [20] as most peer-reviewed works refer to medium-speed four-stroke units mainly used for auxiliary power generation. In this section, findings of relative research are presented mainly for marine engines and are complemented with studies conducted on heavy-duty CI (compression ignition) engines used for land transport and power generation. The findings focus on the mechanisms of NOx formation, the corresponding biofuel effect, on techniques used to control NOx emissions, and new generations of biofuel.
One of the few currently available sources regarding two-stroke engines is the work of [20]. It reports on an experimental investigation about the NOx emissions of a large two-stroke marine engine using B50, 50% FAME (Fatty Acid Methyl Ester) content, a second-generation biofuel, against typical MGO. NOx emissions were decreased compared to the typical marine diesel. The average fuel consumption was found to be lower for B50. This contrasts with expectations based on biofuels tests on other diesel engines that all showed increase regardless of type, as is summarized below. In a recently published study [21] of this research group, detailed comparison was made between B30, MGO, and HFO on two-stroke main propulsion engine performance and emissions, with emphasis on fuel effect on the combustion mechanism. The overall effect of the biofuel was found to be minimal regarding performance, with an almost identical rate of heat release for B30 and HFO. Despite this, both engine thermal efficiency and NOx emissions were increased for B30 operation. For four-stroke heavy-duty engines including marine variants, a significant volume of research work is available. In [22], various percentages of biodiesel sourced from waste cooking oil were tested, and fuel consumption was found to increase with biofuel percentage mostly due to its low energy content. The same was observed in multiple other studies [23,24,25] that cover various engine types and biofuels of a wide source range. The main factor affecting FC was the lower calorific value of pure and blended biofuels. In [22,23,25,26,27,28], the effect of biodiesel on ignition and combustion was investigated. In most cases, the difference in the combustion process was clear even for tests with only 10% biodiesel content. The main findings were lower ignition delay, also reported in [29], which is expected due to higher cetane index, and faster combustion but with a lower peak heat release value, which is to be expected due to the lower ignition delay and heating value of the biofuel blend. In some outlier cases, however, the initial burn rate was found to be slower when the biofuel content in the tested blends increased [27]. The main factors affecting combustion according to these researchers were LCV (lower calorific value), ignition characteristics, and O2 content of each fuel blend.
In all studies, NOx emissions were affected by biofuel even when examining blends of low percentage; both increase [30,31] and decrease [29,32] were observed. A common conclusion of experimental and computational investigations [25,27,33] that is also mentioned in the extensive review of [34] is that the effect of biofuel use on NOx emissions cannot be predetermined due to a number of mechanisms influencing formation. This is also the conclusion of [35], in which the decisive factor is considered to be how close to stoichiometric the air–gas mixture is at ignition and in the standing premixed autoignition zone near the flame lift-off length. The combination of multiple factors affecting the final NOx emissions is also mentioned in the review conducted by [36,37], where on average, NOx emission increase was confirmed, despite the variation between study findings. As mentioned in Section 1, the increased presence of O2 in the flame front due to its relatively high concentration in biofuels has a greater effect than elevated O2 concentration in the cylinder charge [18,38]. This is considered one of the main factors of NOx emissions increase when using biofuels [30,39]. In [22], NOx emissions were found to increase with biofuel percentage despite the lower peak combustion rate, which is expected to lead to NOx formation reduction. The increase, despite the unfavorable conditions for higher emissions, was attributed to the fuel elevated O2 content. In [36], both pure biodiesel and blends with normal diesel were tested with very high NOx emission increase for the pure biofuel and marginal reduction for the blended fuel. Other factors can affect NOx formation such as lower heating value, cetane number, and physical properties, mainly bulk modulus, and viscosity. Studies using multiple biofuel blend percentages and comparing them to typical diesel fuel revealed a correlation between O2 content, CN number, and NOx emissions [30,33]. Biofuels with a higher CN than typical diesel presented similar NOx emissions to diesel fuel tests, while for cases with a similar CN number and, consequently, ignition delay, emissions during biofuel use were increased [33]. Further effects can stem from physical properties that can affect the injection system performance, pump, and injector, as the increased bulk modulus and viscosity of biofuels can lead to advanced actual injection event when the same static timing is used. This can result in increased NOx emissions [40]. In the case of engines supplied with preheated fuel, which is the case for marine engines due to their design for crude oil use, these effects are mostly eliminated [40]. The only concern when applying such measures is the possibility of biofuels’ oxidization, which can alter the fuels’ physical and chemical properties [39] and lead to different fuel treatment requirements, such as heating to a higher temperature. In the extensive study of [30], biofuel blends from various sources were compared. It was found that for fuels sourced by waste oil, LCV values were on par with diesel. This is in agreement with [15]. Additionally, an increased tendency for higher NOx formation due to elevated oxygen content was reported. These fuels’ CN number was increased compared to typical diesel but lower than the other biodiesel variants which further contribute to higher NOx emissions compared to the other biodiesel types tested in the study. Utilizing such findings, combustion analysis, and NOx formation models, researchers propose optimal strategies for minimizing biofuel effect. In [36], 20% biodiesel blends were found optimal and EGR (exhaust gas recirculation) use was tested to control tailpipe emissions with good results, as is also reported in the experimental work of [41]. Another emission control method currently studied by researchers is hydrogenation of biofuels, which is found to result in lower NOx formation [41,42]. Recently published works examine the use of new-generation algae-based biofuel blends in CI engines. Since this is a state-of-the-art biofuel, these tests are mostly constrained in automotive-sector engines, such as in [43], with promising results regarding NOx and soot formation. Despite the promising results, at its current state, the technology is facing scaling issues regarding production considering both scaling capabilities and regulatory concerns [44], especially in the case of the fourth-generation biodiesel produced by genetically modified algae strains [45]. In addition, production costs make commercial use of both third- and fourth-generation biodiesel prohibitive compared to the previous two biodiesel generations [46] that are sourced from feedstock biomass. Thus, the use of such fuels in the marine industry is not expected in the foreseeable future.
In the past two years, experimental campaigns were conducted by shipowners in cooperation with institutional bodies [47] to study biodiesel effect on marine engine NOx emissions. The consensus was that a tendency for increased but not excessive NOx emissions exists, confirming prior expectations [15] based on other applications. The level of emission increase, however, was heavily dependent on engine type again for this study. Performance in these tests was usually not evaluated beyond fuel consumption, which was found to increase with biofuel use. Biofuels with up to 30% FAME content have been recently granted permission for use in marine vessels [48], making B30 the most common variant commercially available.

3. Measurement Particulars

As already mentioned, in the present work, we also provide a review of data acquired from onboard testing conducted by the present research group on a significant number of vessels. For the testing, the same measurement procedure was followed for all applications. Measurements were conducted on board for the two-stroke propulsion main engine and the four-stroke auxiliary generators of each vessel. The fuels evaluated were B30 from waste oil biofuel, HFO, VLSFO, which are crude oil variants, and MGO. The number of tested fuels was subject to each vessel’s schedule constraints. For most cases, measurements were conducted at three fixed engine loads 25%, 50%, and 75%, unless time restrictions allowed only tests at two load points. In each case, all relevant performance data were collected by the engine control room and engine room instrumentation. All engine settings available were also recorded. Emissions measurements were performed at a sampling point downstream of the turbine using the testo 350 Maritime analyzer that is type-approved for marine applications [49], and ambient air conditions were also recorded. The methodology followed and the equipment used was in accordance with the 2008 NOx Technical Code of the IMO, [44]. Emission measurements were conducted for a total of five repetitions at each load until value stabilization. The averaged result was estimated for each case. The instrument specifications are provided in Table 1. For the measurement of power, fuel consumption, air and exhaust gas pressure and temperature, the onboard instrumentation was used. In Table 1, we provide the specifications of the instrumentation of one vessel. For the remaining vessels, the instrumentation was similar with only minimal differences. The specifications of the emissions measurement system are provided in Table 2. A list of the engines tested along with the fuel properties for each test is given in Table 3, Table 4 and Table 5. For each case, a total weighted NOx emission value was calculated according to official guidelines [50].

4. Results

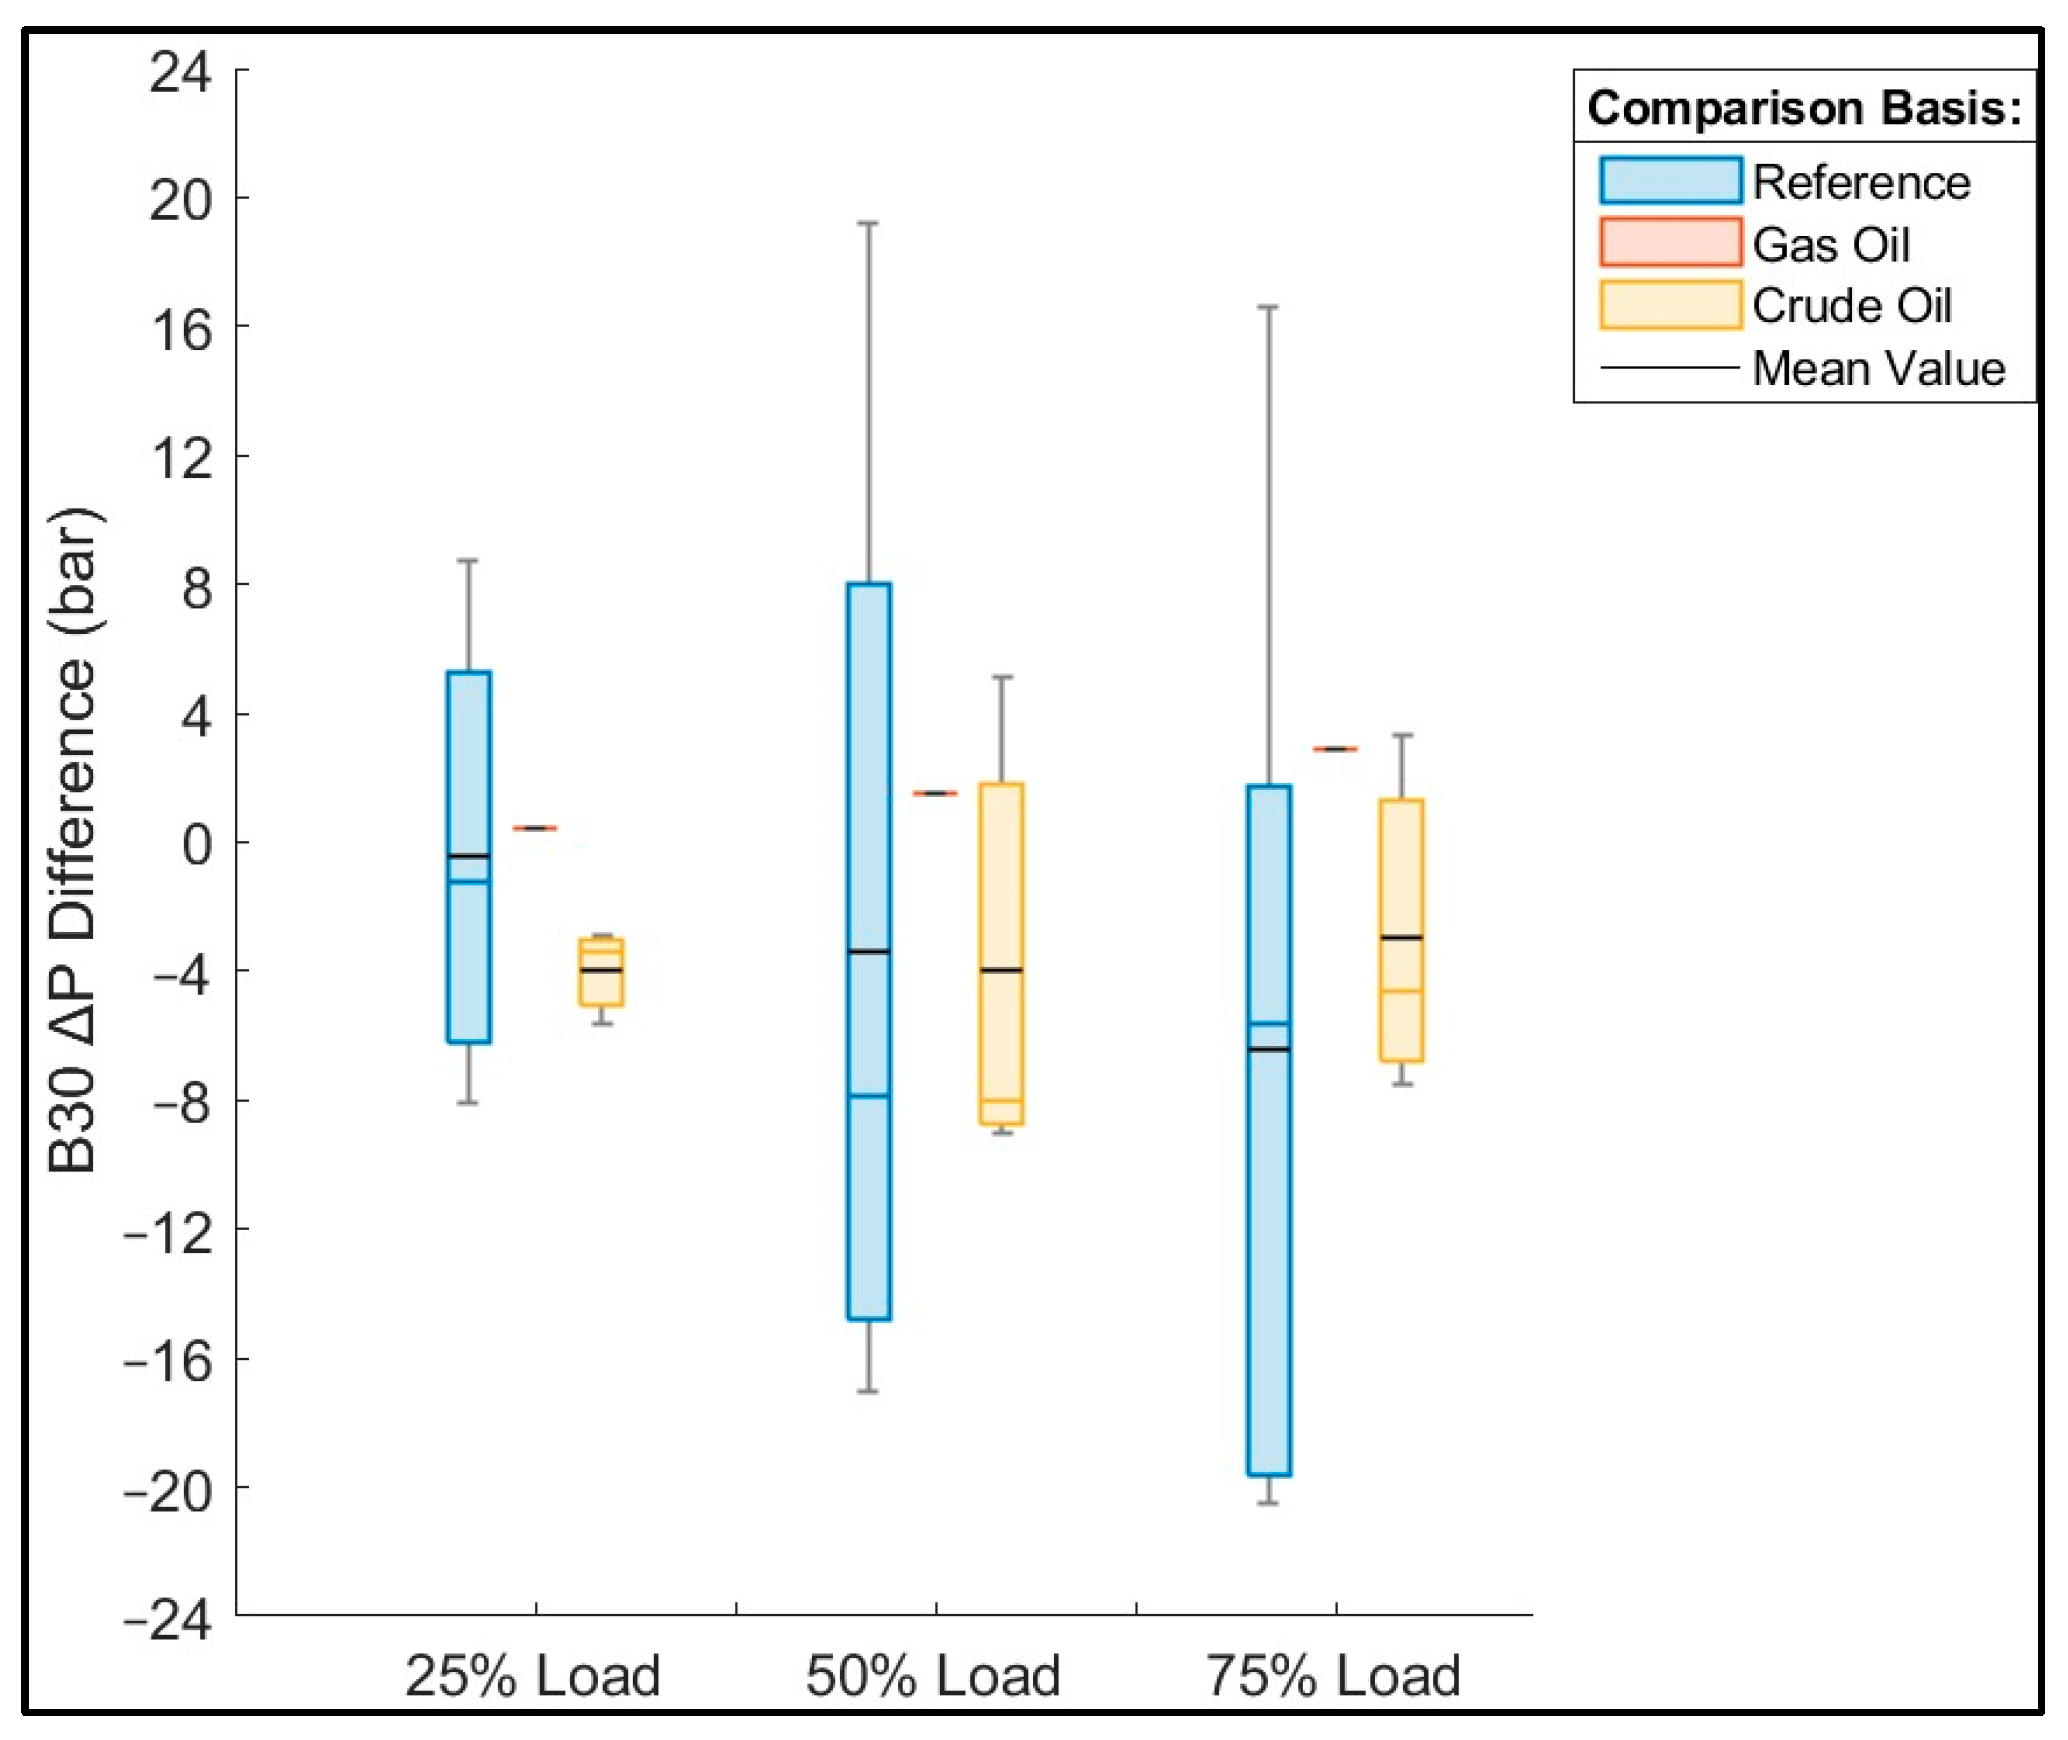
This section is divided into a sub-section for two-stroke low-speed propulsion engines and a sub-section for auxiliary generators to present the total impact of biofuel use on the emissions of a typical commercial vessel. The results are provided in the form of statistical summary boxplots, displaying for a given dataset the median, the 25% lower and 75% upper quartiles, any outliers, and minimum and maximum non-outlier values. The outlier values are separately depicted in the form of circles. In addition, the mean values are given separately in the same plot. For the convenience of readers unfamiliar with the conventions of this plot type, in the first Figure of this type, explanation points are added. In addition, since the boxplot figures provide only a statistical review, tables with specific NOx emissions, Pmax (maximum combustion pressure), and ΔP (pressure increase due to combustion) values on an engine basis are provided at the end of each section, to depict the relation between performance and emissions that was quite evident for some engines tested.

4.1. Propulsion Two-Stroke Low-Speed Engines

As mentioned, the available literature entries for this engine type are severely limited, with only one published peer-reviewed work containing data from actual-scale engine measurements [20]. Recently, results from tests conducted by vessel operators with the cooperation of industry bodies were published in [47], containing biofuel tests on two-stroke engines. The results of testing on five two-stroke propulsion engines are included in this section. All the studied engines were state-of-the-art with electronic control for fuel injection and exhaust valve timing. Since engines equipped with electronic control systems can automatically alter settings such as injection angle to compensate for fuel effect on the injection system and combustion mechanism, the degree of the biofuel effect on NOx emissions and performance was initially expected to be low. The last is to be expected especially for peak combustion pressure, which is one of the baselines values the engine control system uses. As mentioned in Section 1, the analysis is based on the comparison of test data acquired using B30 against reference data obtained from the official shop tests and/or NOx files. During the last, in all cases, MGO was used and in only one case crude oil. For the evaluation of actual B30 effect on performance and NOx emissions, the “correct” comparison is the one against results obtained at the present engine condition using MGO and HFO or VLSFO, referred to as crude oil hereon since engine settings and operating conditions were the same during these and the B30 trials. The comparison to the reference is also important when considering compliance with IMO regulations for the NOx emissions.

4.1.1. Performance Effect on Two-Stroke Low-Speed Engines

The results of the B30 tests were compared against the reference data of the engine NOx emissions certification (NOx file) and against the other fuels tested in parallel to the biofuel. The common finding for most engines was increased BSFC (brake specific fuel consumption) following ISO (International Organization for Standardization) correction, Figure 1, as depicted by the mean values. It is noted that the ISO correction standard used for marine engine fuel consumption includes correction to a standard LCV value. In the studies mentioned in Section 2, researchers usually compared either total FC values or BSFC without ISO correction. Since fuel economy penalty is to be expected due to the LCV of B30, the ISO-corrected values were used for comparison in this study which are normalized to the same fuel energy content and can be used as a metric of engine thermal efficiency. This provides a clearer insight on how engine efficiency is affected by the biofuel beyond the lower LCV. On average, B30 use was found to increase ISO-corrected BSFC by 1–2% when comparing against the reference, and a similar increase was found when comparing to the trials conducted using MGO. The increase and variation between the tested engines were low, which is attributed to their electronic control. The highest deviations were observed for the comparisons against reference data as is seen by the maximum and minimum values in Figure 1. This is most probably the result of the current engine operational parameters’ difference compared to the time of reference tests. For one case, Engine 5, ISO BSFC values for all tested fuels were below the reference, which is uncommon. This difference was attributed to the use of a low-quality fuel during certification tests. The comparison of ISO-corrected BSFC for B30 against that of crude oil revealed minimal difference and, in some cases, mainly at the higher load tested, a small BSFC improvement for B30 operation. Comparison cannot be made against other studies regarding this finding as all researchers used high-quality diesel as the benchmark for “normal” engine operation. The very low level of variance seen in Figure 1 indicates that ISO-corrected BSFC of B30 should be practically identical to crude oil. Total actual fuel consumption, however, will be slightly higher for B30 due to its LCV, which is in most cases marginally lower than crude oil, as seen in Table 3.
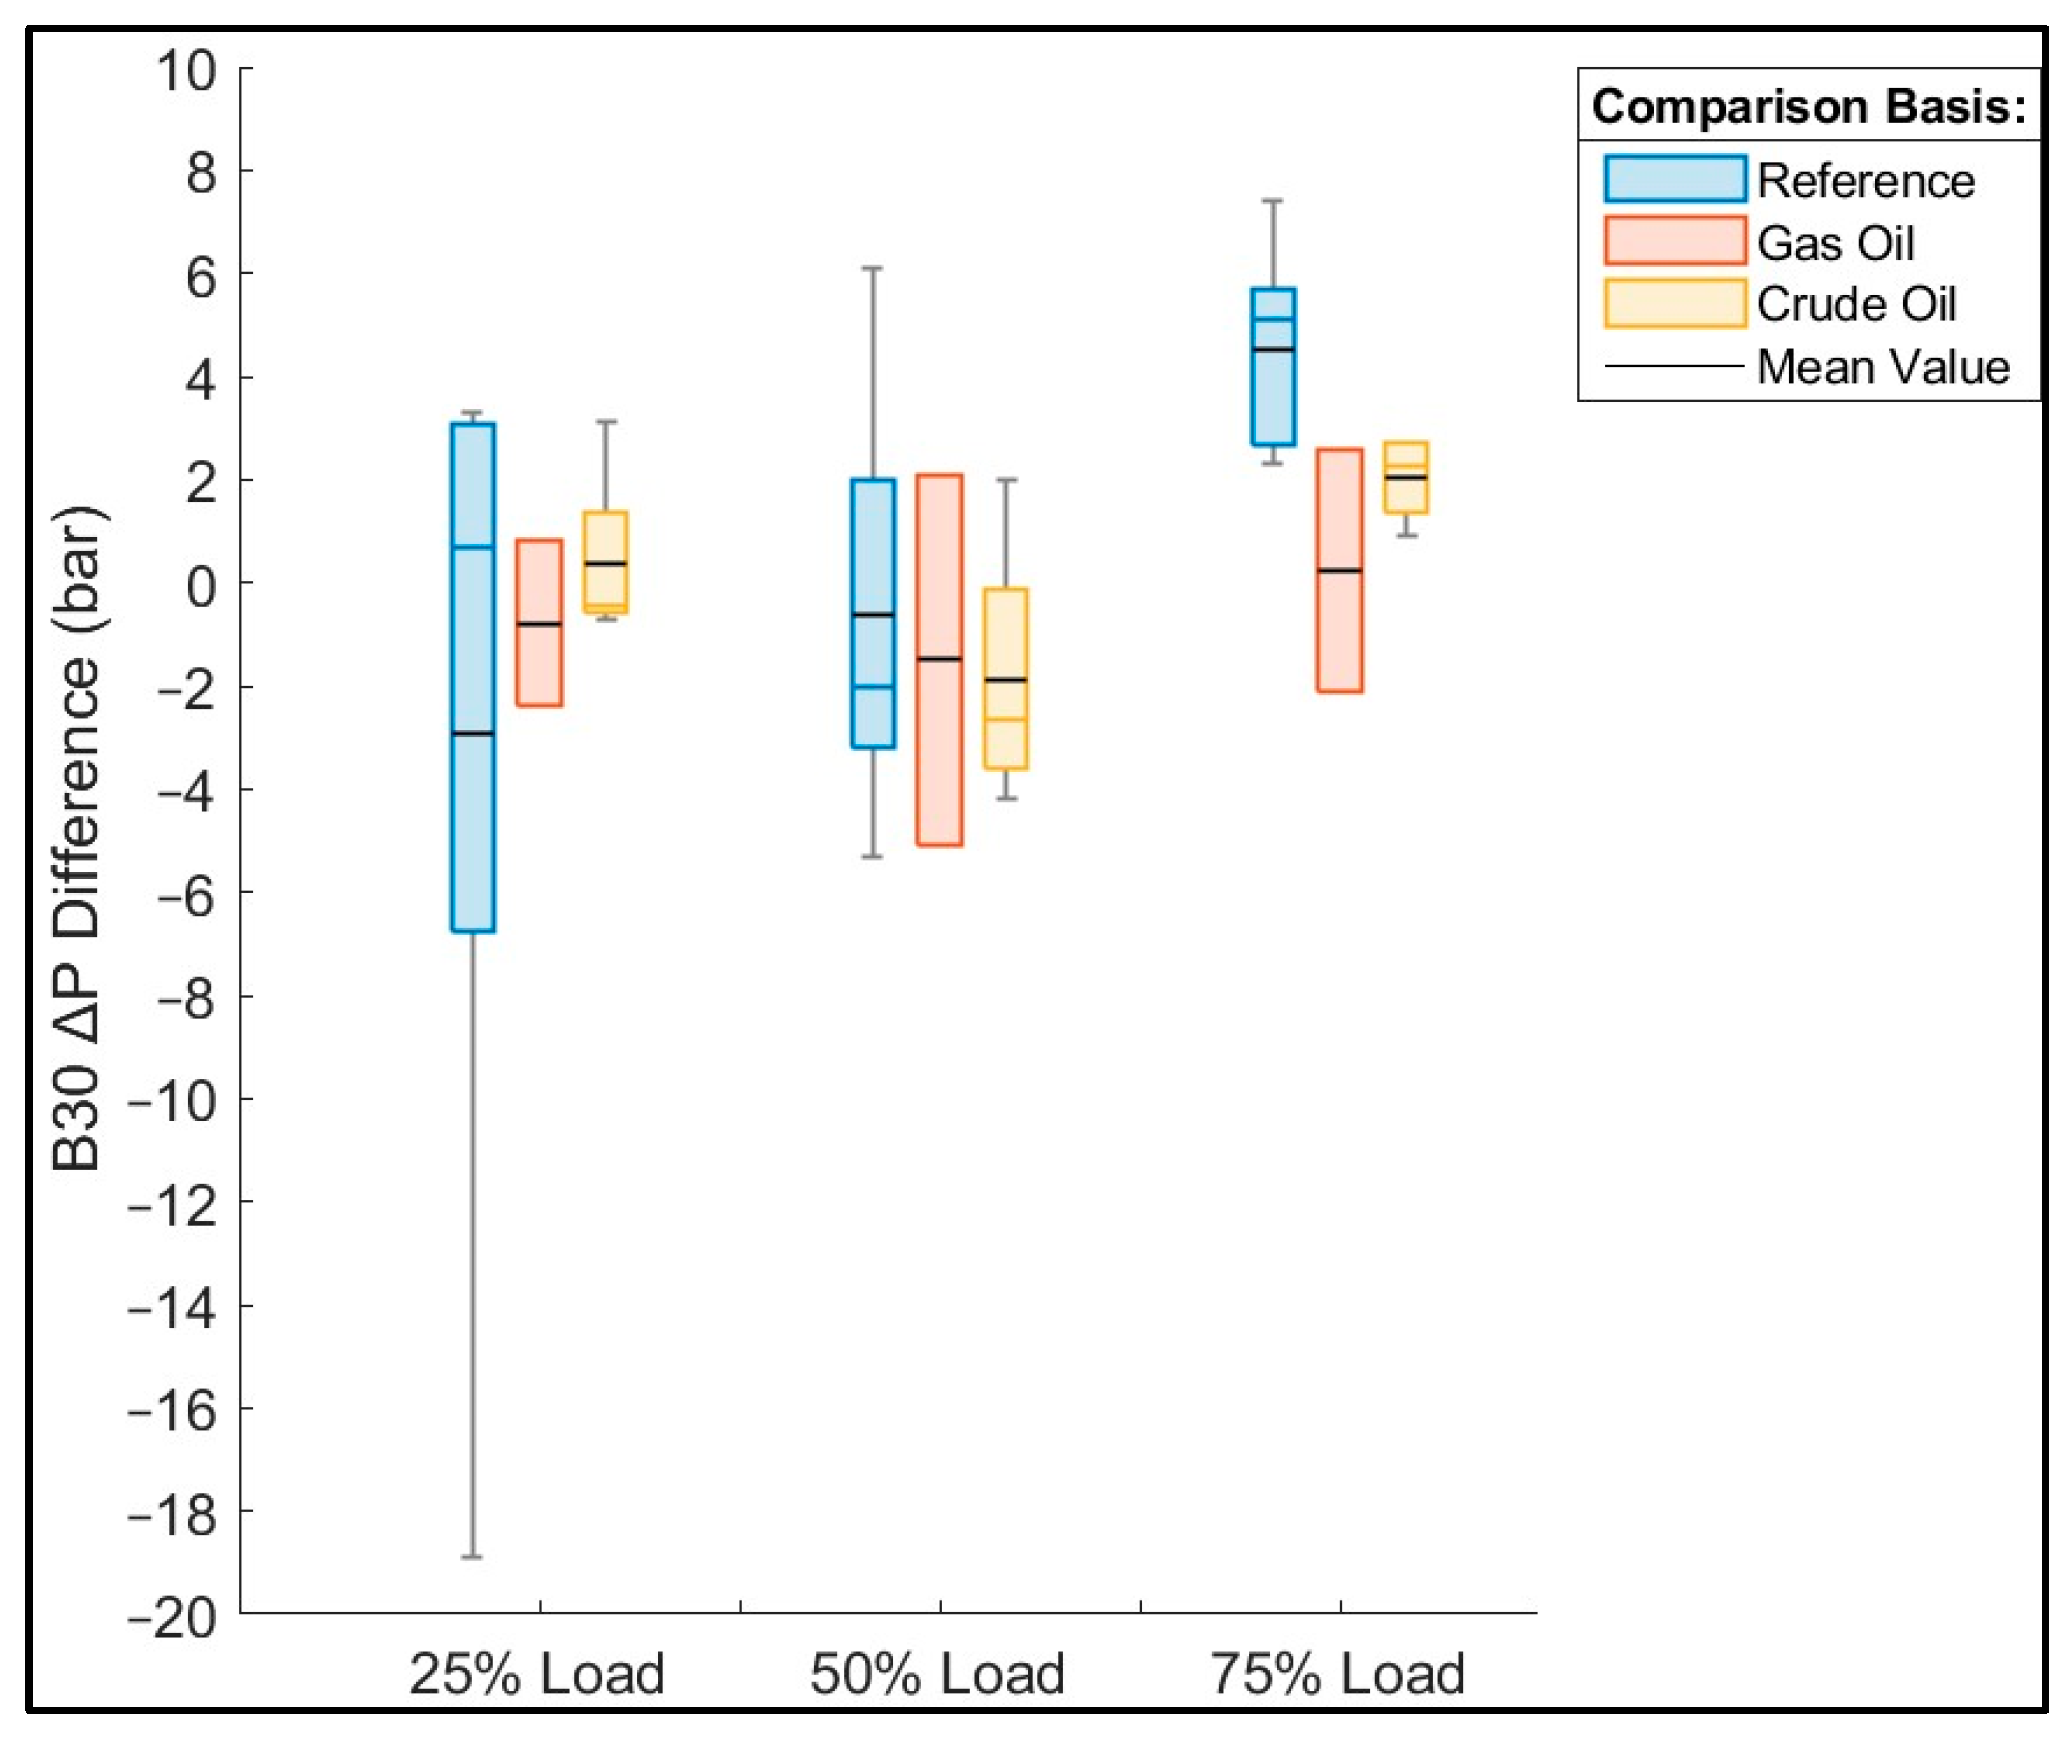
In Figure 2 and Figure 3, we provide the difference in Pmax and ΔP, respectively, for B30 operation compared to the reference and the conventional fuels (crude oil) tested. The effect of the biofuel on engine performance presented significant deviations between the engines regarding both Pmax and ΔP. From Figure 2, a clear tendency for Pmax to decrease is revealed when using B30, as seen from the mean values, but results vary considerably between the tested engines. The highest reduction of Pmax when using B30 was observed when comparing against reference and the trials conducted with MGO. Compared to crude oil, Pmax values were the least affected. As far as ΔP is concerned, Figure 3 presents significantly lower variance, but the tendency for reduction during B30 operation remains present for 25% and 50% load. The decrease in ΔP is low for B30 use, as in most cases both the average and median values were at or below 2 bar for most comparisons. The main reason for the lower scatter of most values is that variation in cylinder pressure at the fuel ignition point was present between the tests, especially when comparing against reference data. Since the absolute Pmax values affect maximum in-cylinder temperature, they can be used when reviewing performance and NOx emissions in tandem, but only in conjunction with ΔP. Both Pmax and ΔP are affected by a fuel’s properties, typically increasing with higher LCV values. The other factors affecting Pmax and ΔP are injection angle and fuel ignition delay. The latter differs due to the tested fuels’ CN number, Table 5. The rather low decrease in ΔP for B30 compared to MGO, which has roughly 6% higher LCV, shows that the slight ignition advance makes up for the lower LCV in regard to pressure increase. The biofuel ignition point effect making up for other deficiencies compared to conventional fuels was reported in multiple studies and was the conclusion of reviews on the subject [37]. Lastly, B30 and crude oil results were quite similar, especially viewed against the other two comparisons. The effect of biodiesel on engine performance and emissions results from the combination of LCV, ignition delay, premixed combustion intensity, and total combustion duration. Further insight can be provided via conducting heat release rate analysis, as in [19], to assess the complete impact of biofuel on the combustion mechanism using measurement data as a basis for analysis. The variation in Pmax, ΔP and BSFC is an indication of the degree that these vary between engines and fuels evaluated and their results are evident regarding NOx formation as shown in Section 4.1.2.

4.1.2. Emissions of Two-Stroke Low-Speed Engines

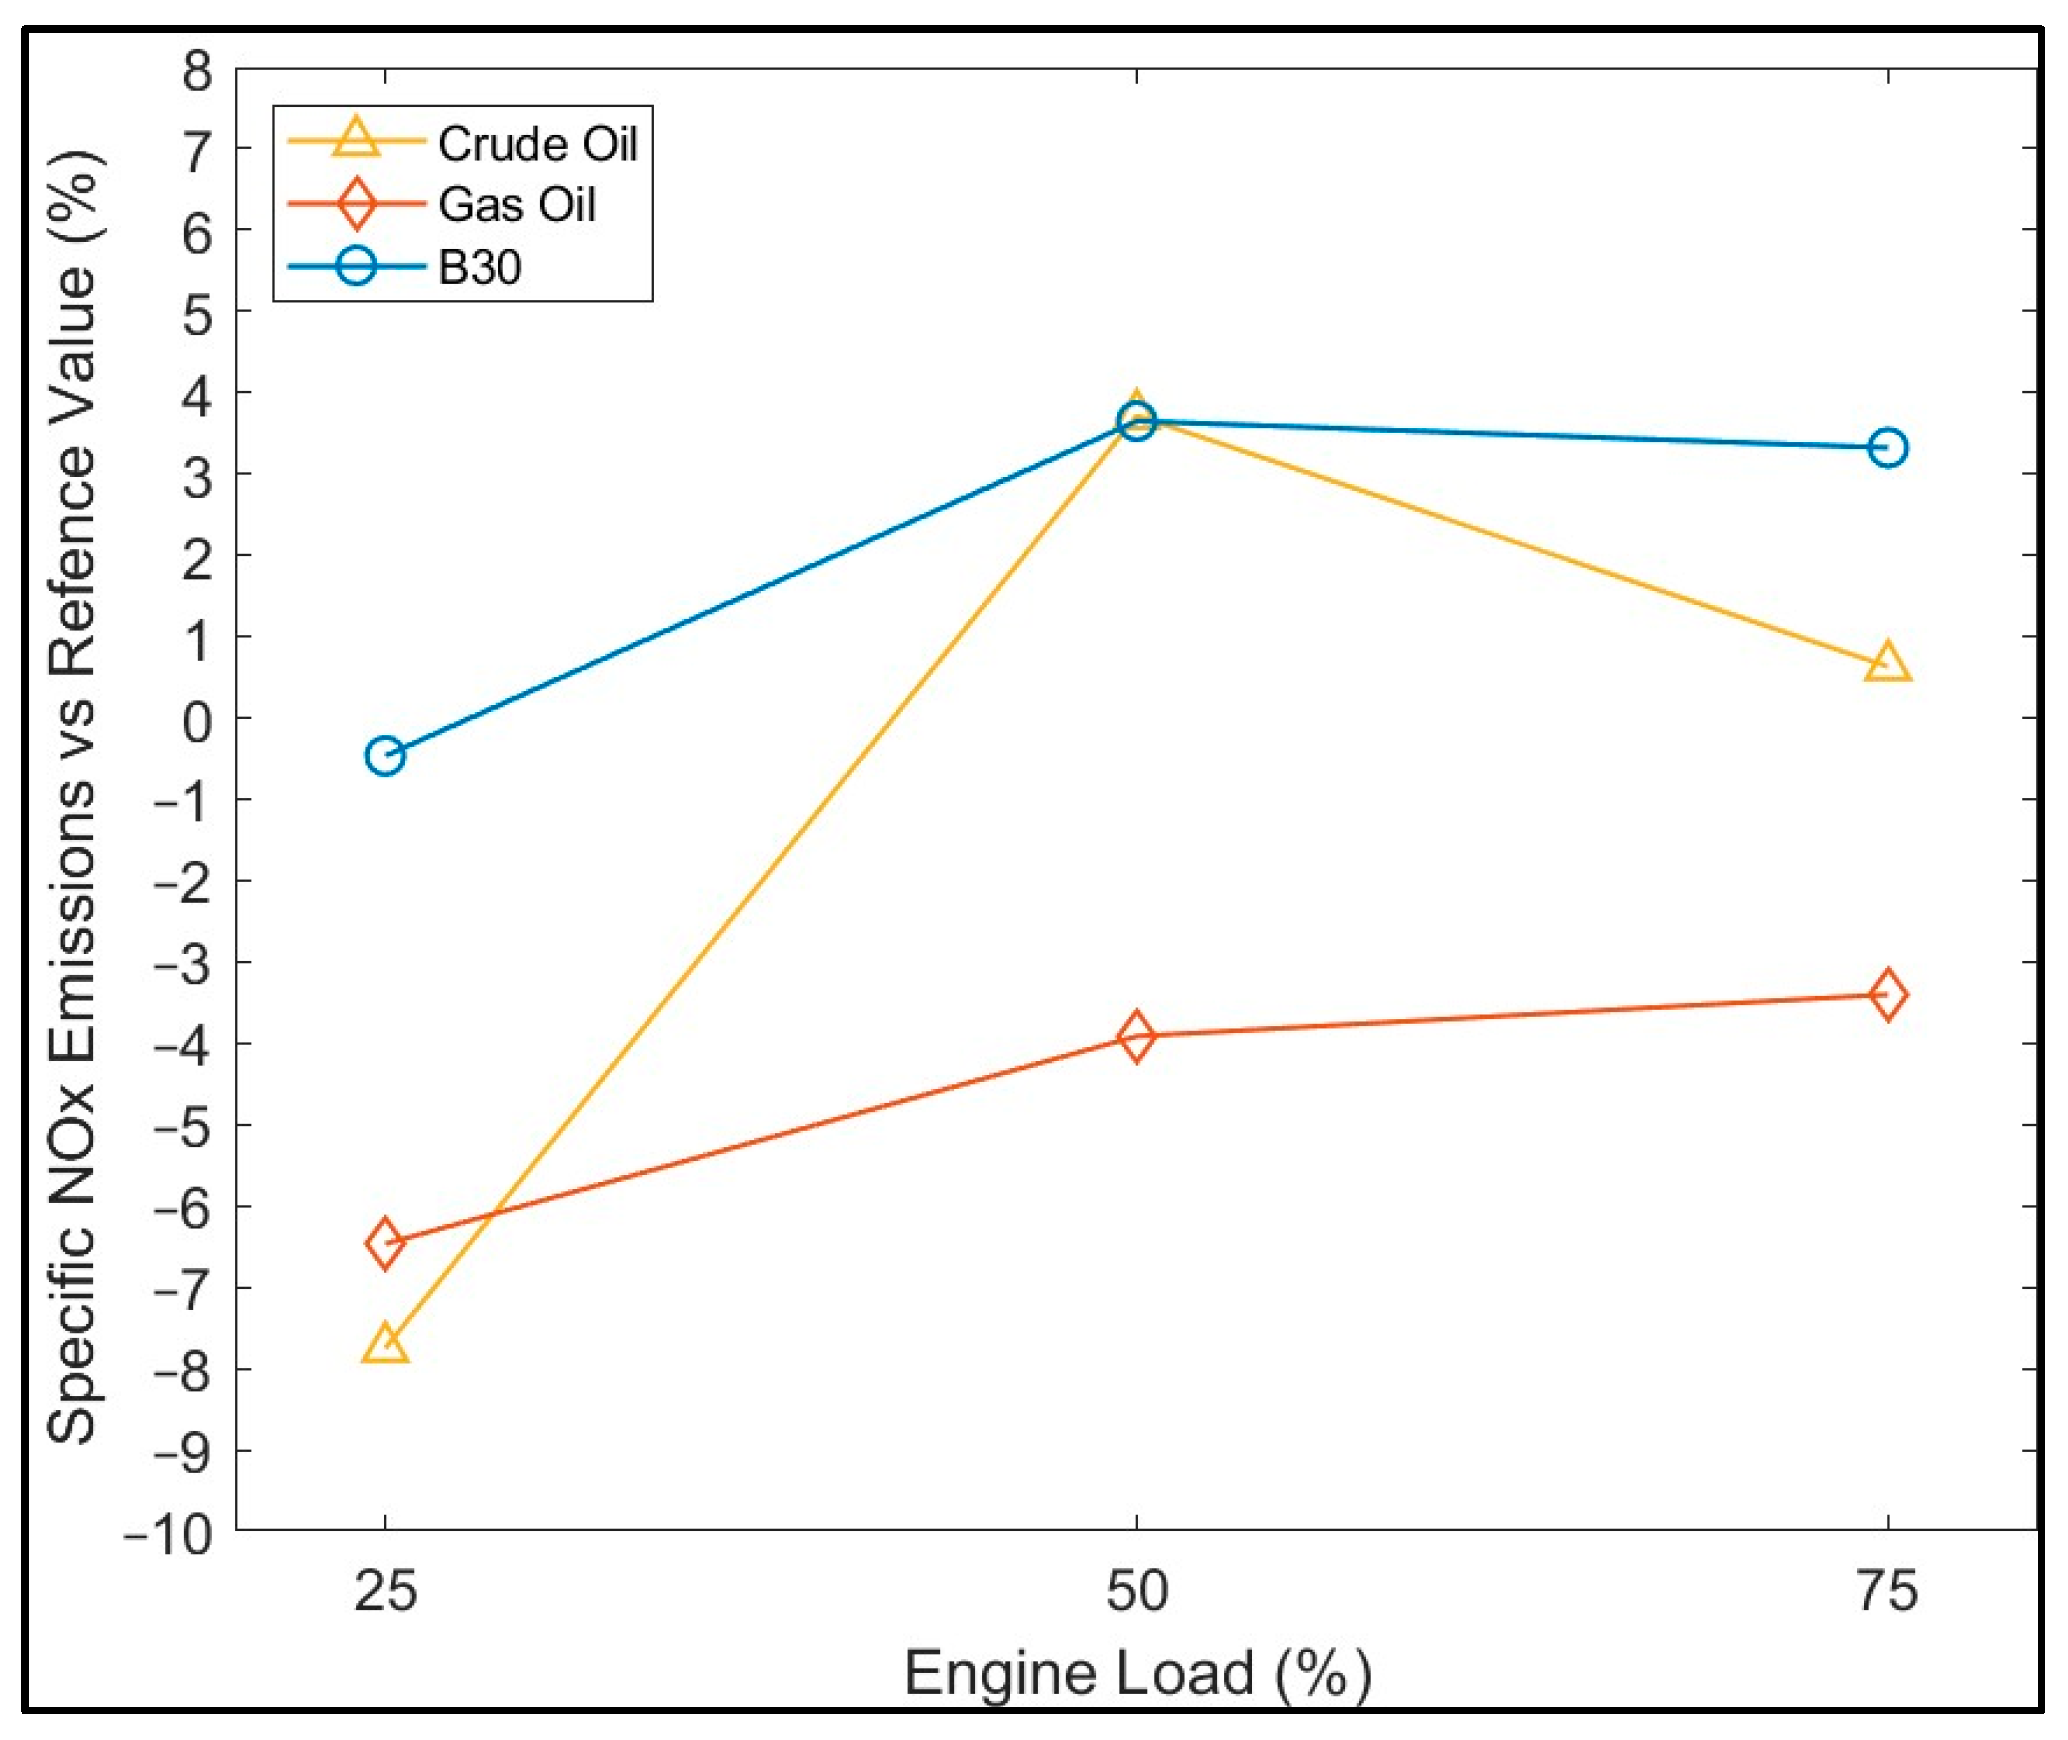
In Figure 4, the deviation of the weighted NOx emissions during B30 operation compared to reference and other fuels tested is provided. An important finding was that for all cases, the total weighted NOx emissions were above the reference value regardless of the tested fuel. In most cases, the total weighted NOx emission values for B30 were increased compared to the reference and to crude oil trials at the present state as is shown by the median values. This has been the finding of most two-stroke engines studied by vessel operators in [47]. Variation was observed, which was expected, as it is mentioned in studies such as [36] and extended reviews [37]. These works referred to engines of different types than the ones tested; however, the mechanism of NOx formation and factors affecting combustion are common in CI engines. It must be stated however that the degree of effect will differ. For one application, Engine 2, consistent NOx emissions decrease, was observed for B30 operation, with the MGO NOx emissions being considerably higher. This coincides with the highest decrease in Pmax as identified in Table 6 and is similar to the results reported of [20], albeit with a higher-FAME-content fuel. Due to the high difference between the results of the two engines tested with MGO, Figure 2, Figure 3 and Figure 4, no estimate is made regarding the difference between MGO and B30 emissions on a wider basis. However, these results clearly show the degree that NOx emissions using any fuel type can be engine-specific. The variation for each load point differed, with the highest range of differences observed at 25% load. Review of the results on a load basis also makes clear that emissions at low load are the most affected as was found in most of the engines tested in [47]. This again coincides with the high degree of difference in Pmax values, as shown in Figure 2. The mean increase in total weighted emissions for B30 compared to reference values was 10%. Considering the fact that the IMO provides allowance for 10% emission increase over the official limit for tests conducted on board vessels [50], this result is promising. Trials comparing B30 and MGO showed almost equal difference upwards and downwards for B30 NOx emissions, with the results being highly engine-dependent, as was also found in the previous section. Compared to crude oil, for B30, the increase of NOx emissions was low, with the increase in total emissions values normal range between 1 and 8%. The average value was 4% and the median slightly lower. An example of a single unit is provided in Figure 5, displaying the difference of all measured data from reference values of the engine’s NOx file. Considering that similar performance was observed for tests using B30 and crude oil, the NOx emissions increase is attributed to the higher O2 content of the biofuel, which has been established to enhance NOx formation in multiple studies such as [17]. The O2 concentration was similar for most B30 variants evaluated, except for Engine 3, on which higher-O2-content biofuel was used. The increase did not result in higher NOx emissions than for other applications; thus, it was not possible to correlate between fuel O2 content and NOx emissions increase. Overall, for NOx emissions, B30 use was found to result in elevated pollutant formation in most cases, on average 10% compared to the reference and 4% compared to crude oil; thus, its effect is considered moderate, especially considering that these engines usually operate using crude oil. In Table 6 a summary of all data in Figure 1, Figure 2, Figure 3, Figure 4 and Figure 5 is provided.

4.2. Auxiliary Four-Stroke Medium-Speed Generators

For auxiliary generators designed for marine use, a considerable number of peer-reviewed works are available addressing biodiesel use and its effect on emissions, part of them discussed in Section 2, such as [22,24]. In the section below, the results of measurements conducted on seven four-stroke electrical power generators are included. The same parameters as the ones reviewed for the two-stroke engines are evaluated.

4.2.1. Performance Effect on Four-Stroke Medium-Speed Generators

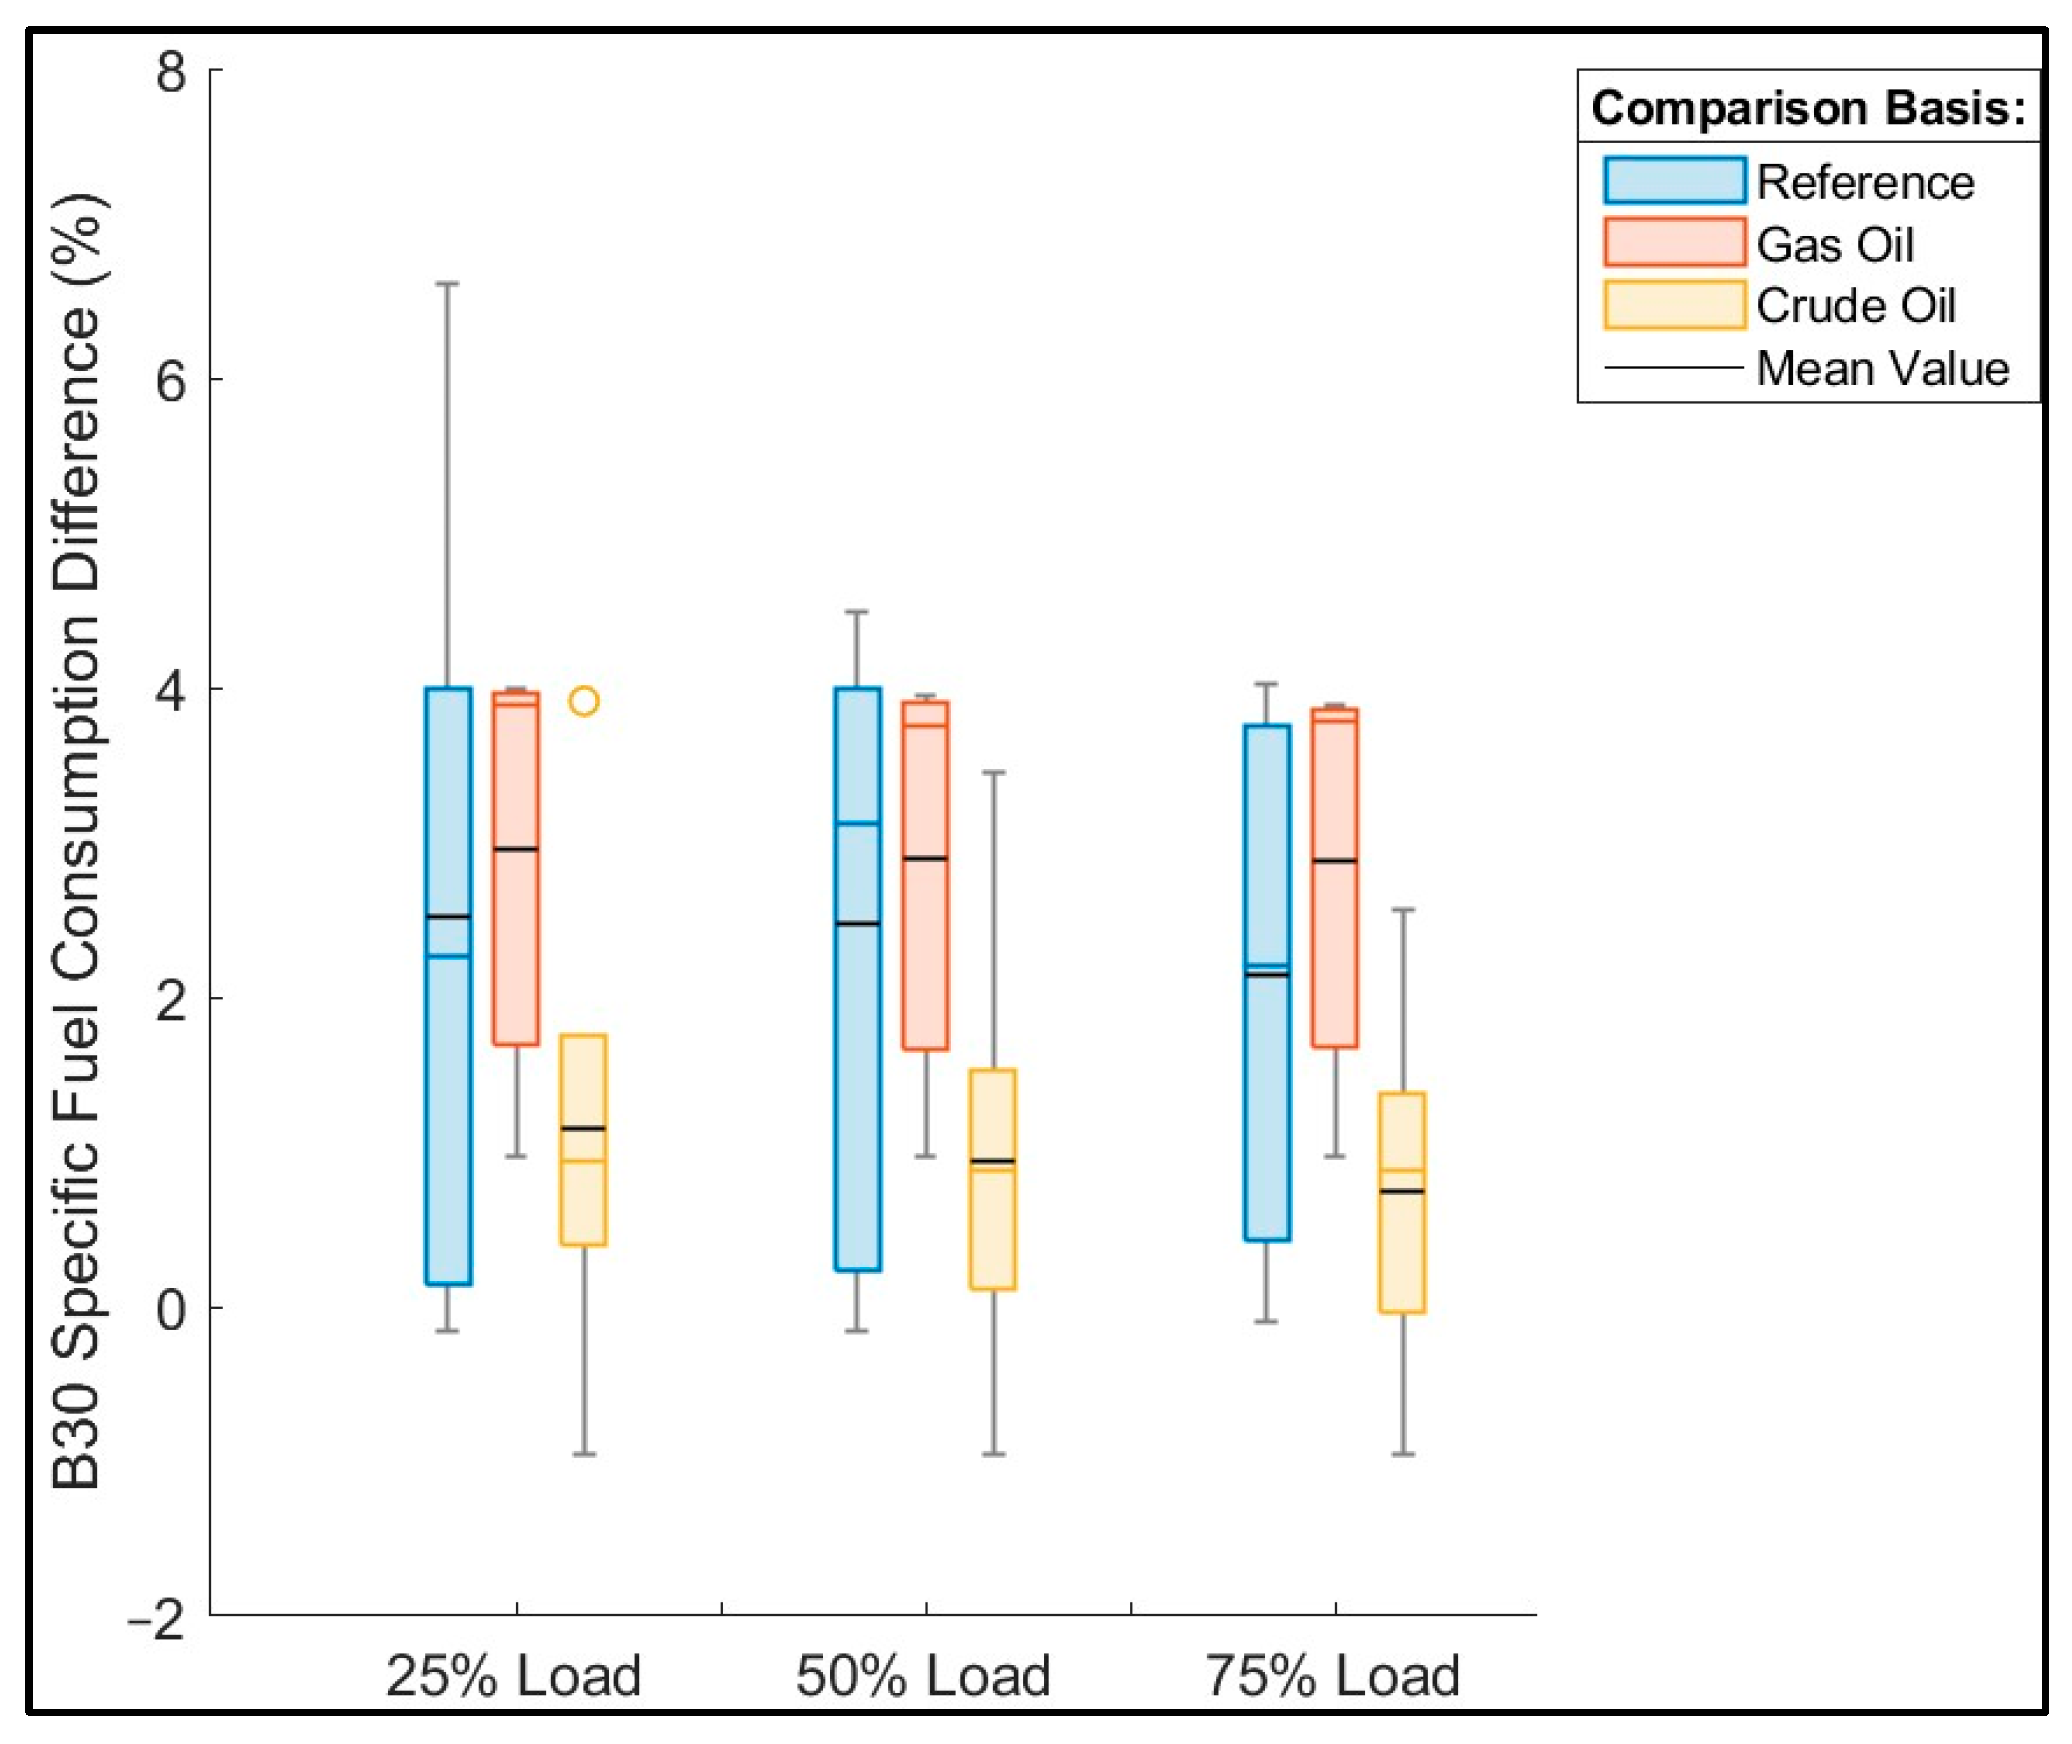
Fuel effect on combustion characteristics such as ignition angle is more pronounced in four-stroke generators [51] compared to large two-stroke engines due to their higher operating speed; thus, an expectation existed for higher differentiation in performance during B30 operation. As mentioned in Section 2, agreement can be found in the literature [22,24] that fuel consumption increases for these engines when using biofuel. ISO-corrected BSFC was compared against the reference value and any additional trials conducted with MGO and crude oil, as shown in Figure 6. ISO BSFC was found to be higher for most engines, with few marginal outliers having similar consumption values. The increase in ISO-corrected BSFC for B30 operation compared to the reference was on average 2.5%. Compared to MGO values, a 3% increase was found at the present state, which remained almost steady with the engine load. As in the case of the two-stroke engines, crude oil BSFC values were close to B30, with a slight increase of 1% found for all loads. Thus, for four-stroke auxiliary generators, a clearer effect of B30 on BSFC compared to two-stroke engines is observed when considering all fuels tested. The level of difference remains within the acceptable limits regarding fuel economy concerns, even after factoring in the LCV value. Pmax and ΔP, Figure 7 and Figure 8 respectively, were found to significantly differ from reference for all fuels examined. The values for B30 were similar to the other fuels and both considerably lower and higher compared to reference. The similarity between the different fuel trials’ Pmax and ΔP values revealed that the observed differences compared to reference were the result of engine tuning and not the fuel used. The previous results also show that for four-stroke auxiliary units, engine tuning can vary considerably compared to the reference state due to lack of electronic control.
The sample of MGO measurements was small, only for one engine, for which lower Pmax and ΔP compared to B30 were measured. The difference in Pmax was within 2–6 bar, and the difference in ΔP was below 4 bar. Thus, as in the case of the two-stroke engines, the higher ignitability of B30 made up for the difference in LCV between the two fuels. Comparison to measurements using crude oil shows increase and decrease for both parameters depending on the engine tested. The median values show that the general tendency is lower Pmax and ΔP for B30 operation. Based on the results with MGO and the findings of other works discussed in Section 2 [34], this trend is attributed to the degree of fuel and air mixing before fuel ignition that can result in more intense premixed early combustion, enhancing pressure rise to the maximum value.
Based on the results presented in Figure 6, Figure 7 and Figure 8, the performance differences for B30 in the case of four-stroke generators were overall higher than two-stroke engines. For this reason, when considering the variation compared to reference, a wider range of effects on NOx formation should be expected, especially compared to the reference.

4.2.2. Emissions of Four-Stroke Medium-Speed Generators

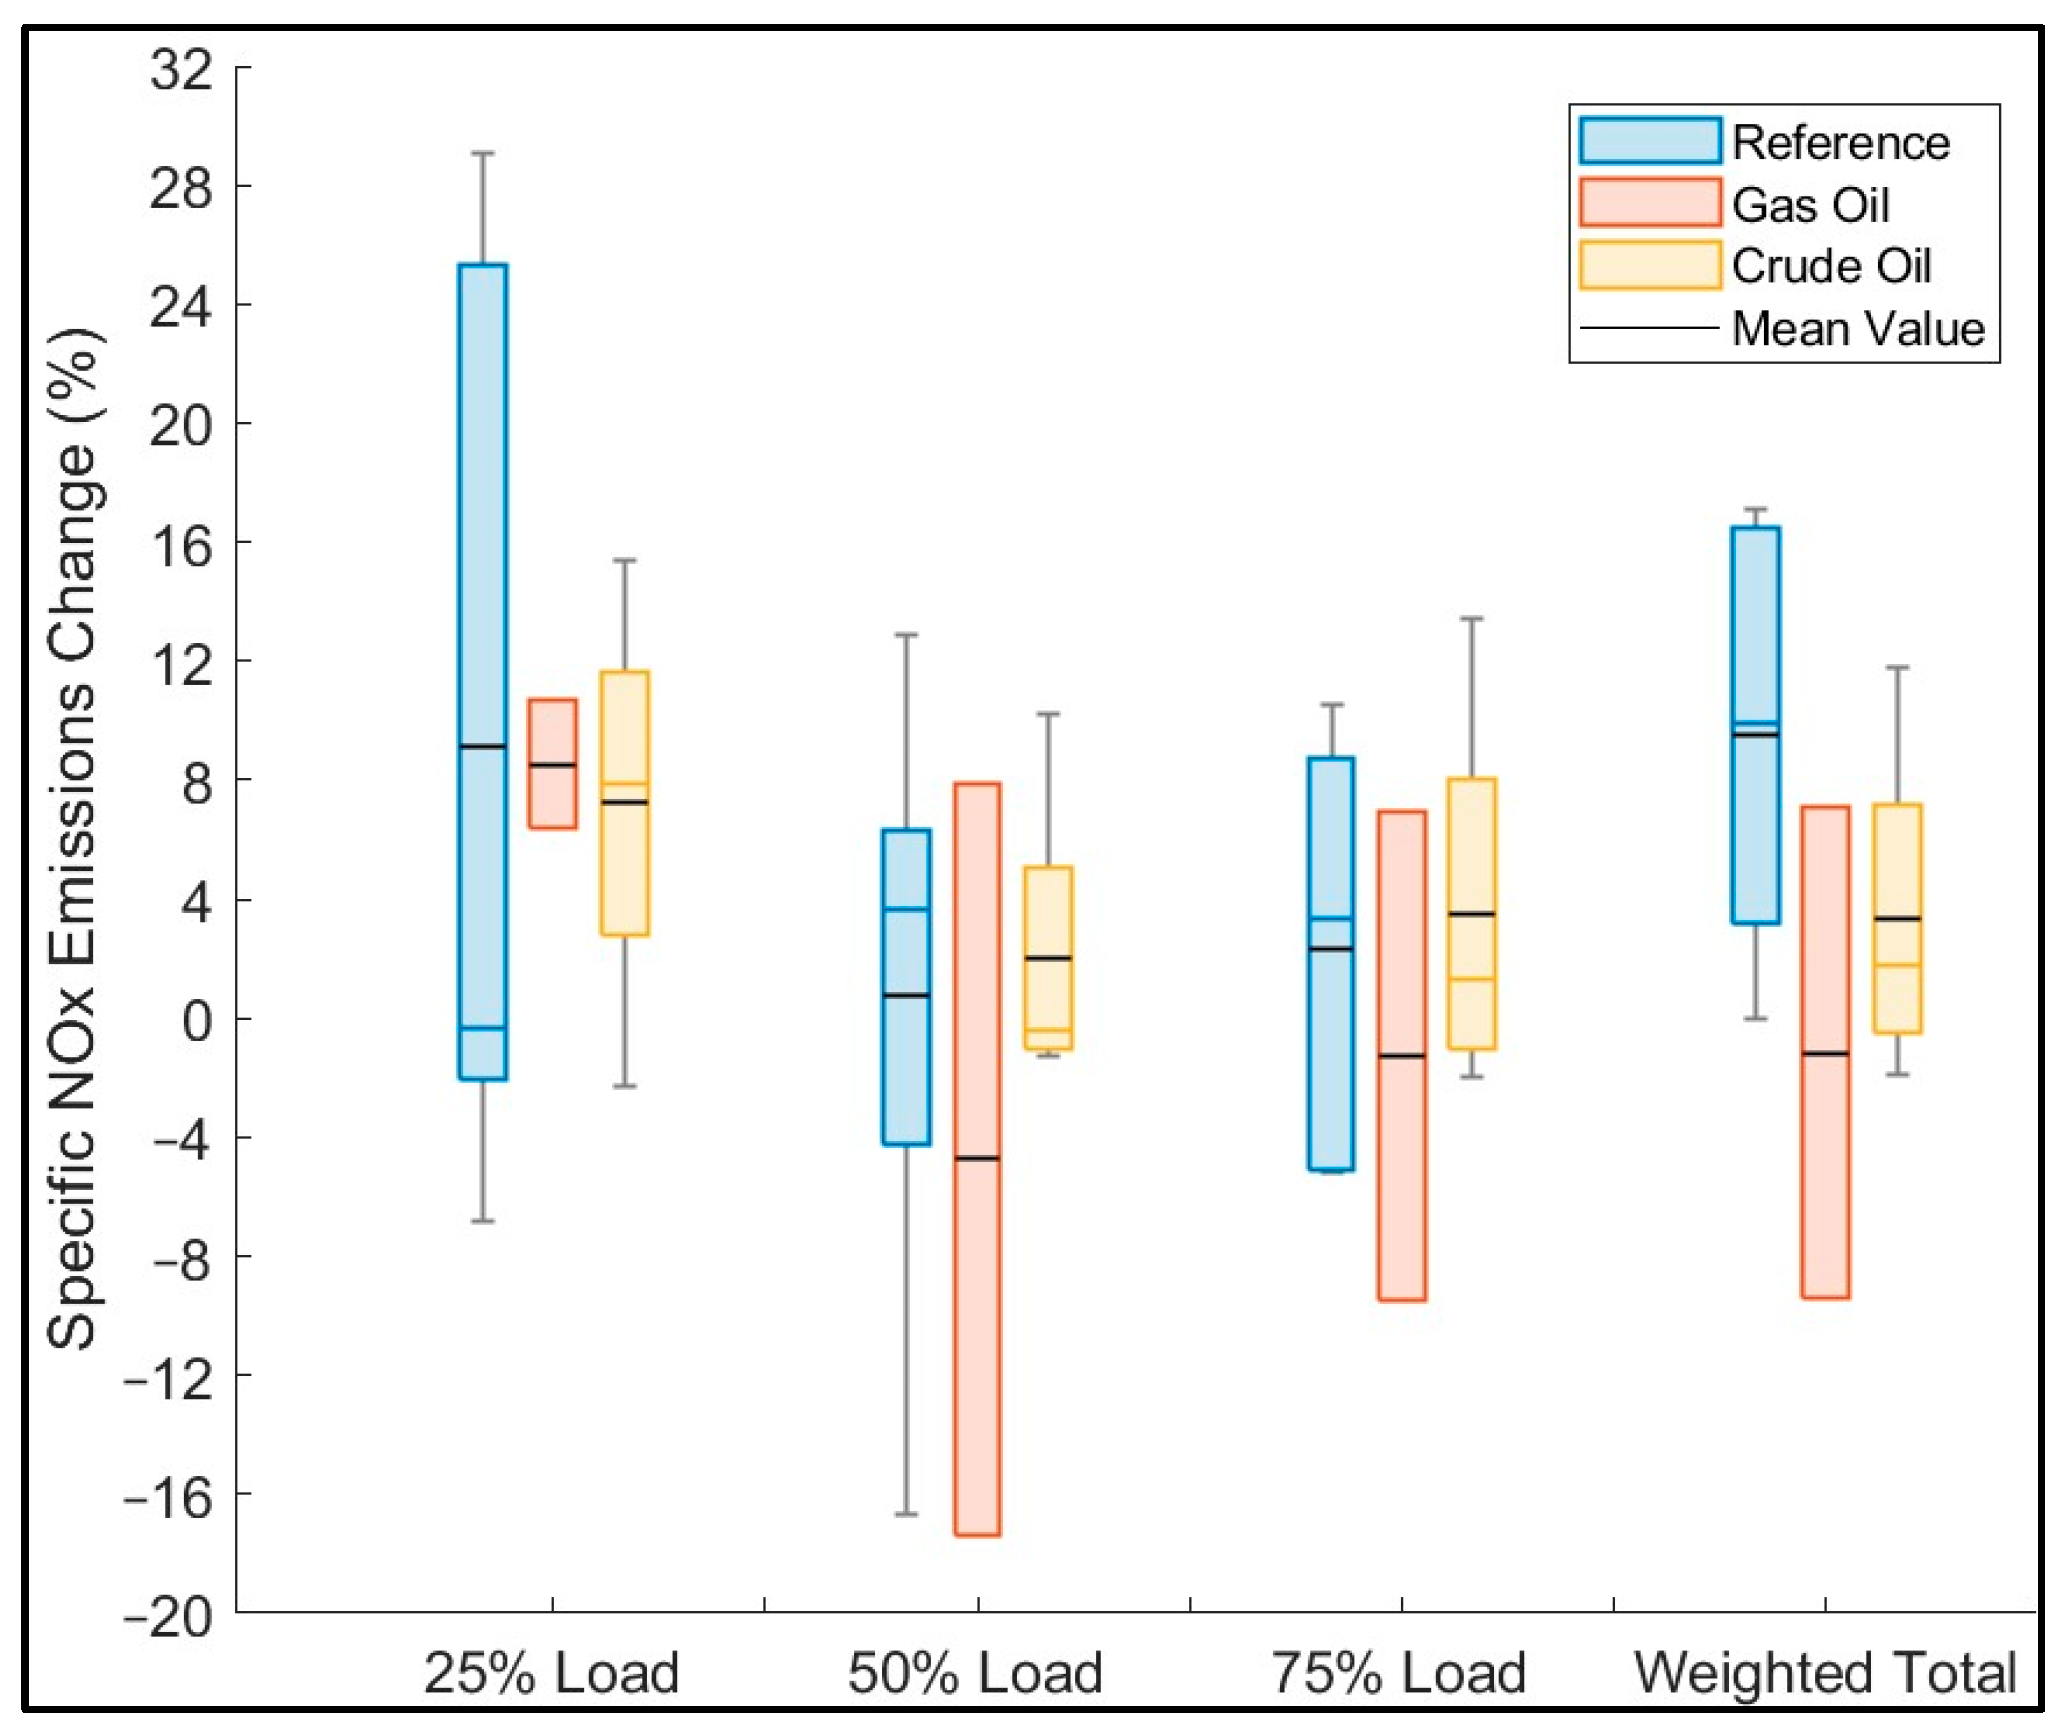
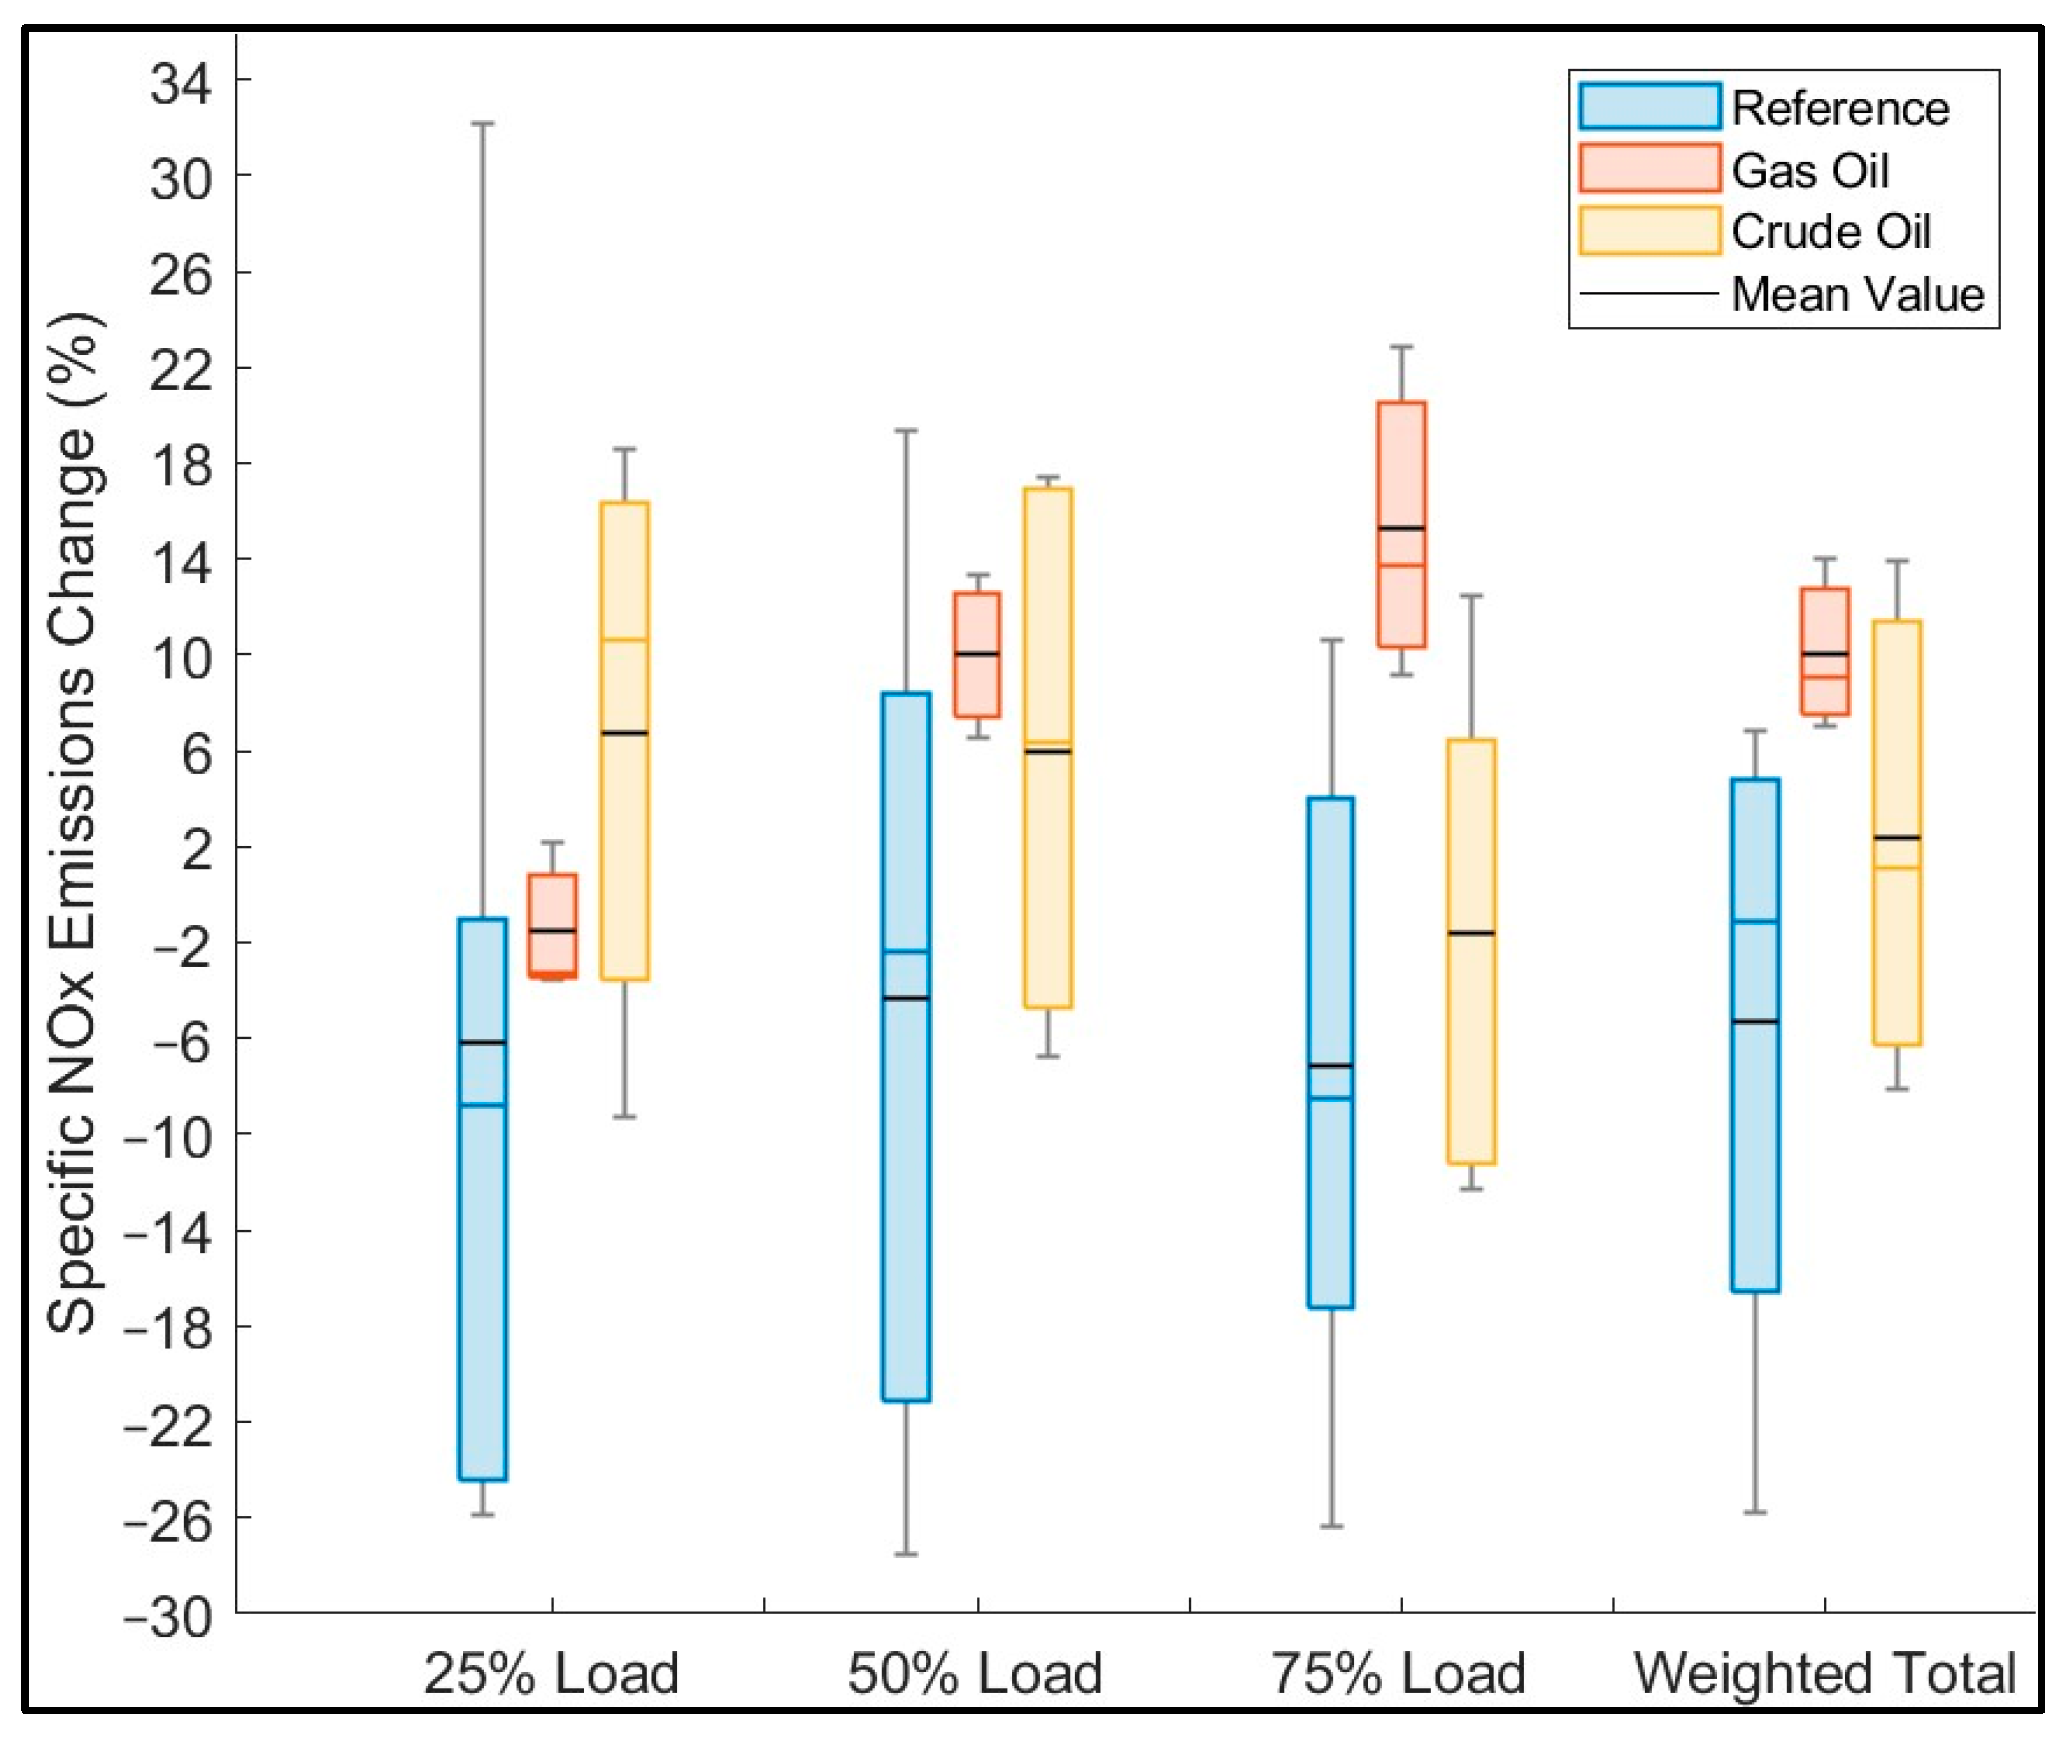
Performance analysis results indicated NOx emissions both below and above reference for the four-stroke auxiliary generators tested, as Pmax and ΔP, which are major contributors to NOx formations, varied significantly against the reference. In Figure 9, the NOx emissions comparison statistical summary is provided. Lower specific NOx emissions values were found compared to the reference for most of the engines examined. In contrast, comparison with trials using MGO and crude oil showed higher NOx emissions for B30 operation, Figure 9 and Table 7. The total weighted emission value was on average 5% lower than reference for B30 tests. The median was close to 0%, showing that for most generators, NOx emissions using B30 were similar to the reference. The variation between the median and average was mostly the result of the lower and minimum values of Figure 9. Examining Table 7, these coincide with the engines that reported some of the lowest Pmax values depicted in Figure 7. This finding makes clear the importance of engine tuning regarding NOx emissions, which can be more important than fuel effect as is also established in [35]. Tests at present conditions, however, showed that for B30, total NOx emissions were increased by 6–15%, on average 10%, compared to MGO and were mainly affected by the high NOx formation at 75% load. This increase is above the findings of the two-stroke engine tests and is close to values reported in other studies for these engines [15,47]. Comparison to the crude oil tests presented a rather even distribution of B30 effect, with the mean and median values being practically identical except for 25% load. The average total NOx emissions increase for B30 was 2.4% compared to crude oil operation, albeit with high variance as values in the range of ±10% were recorded. The upper values of NOx increase were generally higher than those for two-stroke engines, Figure 4 and Figure 9. Overall, a tendency for increased NOx formation during B30 use was confirmed despite the Pmax and ΔP values being generally lower. An example of a single unit is provided in Figure 10, displaying the difference of all measured data from reference values of the engine’s NOx file. The enhanced NOx formation is consequently attributed to the higher O2 content of the biofuels used. Considering the results of this and other experimental works’ results, especially [47] that focuses on marine engines, for auxiliary four-stroke generators, B30 use will only moderately affect NOx emissions, allowing compliance with emission limits. In addition, it is confirmed that engine tuning can be used to further decrease the impact, possibly allowing use of even higher percentages of biodiesel. In Table 7 a summary of all data in Figure 6, Figure 7, Figure 8, Figure 9 and Figure 10 is provided.

5. Conclusions and Future Work

In the present work, the effect of biofuel blends on marine two-stroke propulsion and four-stroke power generation engines was reviewed and assessed using results of various studies and the main findings from an extended experimental campaign conducted aboard marine vessels using B30 by the present research group. The literature review revealed that for two-stroke low-speed propulsion engines, limited experimental data are available from full-scale applications. Specifically, [20] from early 2022 states to be the only peer-reviewed study to contain such information at the time of writing. Following this, [47], containing results of tests conducted by various vessel operators, was published, which contained data for both two-stroke and four-stroke marine engines. A study recently published by the present research group [21] provided detailed information on the B30 effect on the combustion mechanism of a two-stroke large propulsion marine engine. The review revealed that in the literature, results mainly from lab tests conducted for heavy-duty diesel engines used for automotive applications are available. Furthermore, in most evaluations, the basis for comparison was distillate diesel fuel, while in the marine sector, crude oil variants such as HFO and VLSFO are commonly used [52]. The main common findings of published studies were increased fuel consumption, attributed to the biodiesel blends lower LCV, decreased fuel ignition delay, and less intense premixed combustion because of the earlier ignition. These resulted in either increased or decreased NOx emissions during biofuel use on a case-by-case basis, with the end effect being the result of several factors. The published studies provide a conclusion that O2 content of biofuels enhances NOx formation, and the combination of injection angle, ignition delay, and fuel LCV, either contributes to or works against this increase.
The experimental review showed that B30 use had measurable impact on the tested engines regarding fuel consumption and efficiency as well as peak pressure values and their increase due to combustion. ISO-corrected BSFC was increased for both the two-stroke and the four-stroke engines when comparing to the trials conducted with MGO and crude oil. For the two-stroke engines, the average efficiency penalty was slightly over 1% compared to MGO, while no increase was found compared to crude oil. The respective differences for four-stroke engines were 3% and 1%, revealing slightly higher biofuel effect. In the case of Pmax and ΔP, high variance was found when conducting comparisons of B30 operation against the reference, as the reference tests were not conducted under same conditions and probably engine state. For the trials conducted with B30 and crude oil or MGO at the present state, variance was significantly lower. Overall, a tendency for lower Pmax and ΔP values when using B30 was found for both the two-stroke and the four-stroke engines.
The emission measurements revealed NOx increase for B30 compared to MGO and crude oil for most engines, both two-stroke and four-stroke ones. For the two-stroke engines, B30 total NOx emissions compared to crude oil and MGO are increased, mostly in the range of 1–8%, with a 4% average value. Comparison between MGO and crude oil could not be safely made as only two engines were tested using MGO and provided significantly varied results. For the four-stroke engines, the total B30 emissions were considerably higher compared to MGO and only slightly increased compared to crude oil, the average values being 10% and 2.4%, respectively. In addition, for the four-stroke engines, tests with B30 and crude oil also resulted in one case with NOx emissions reduction close to 8.1% in favor of the biofuel. It is noted that the differences found compared to the MGO tests were also partly the result of the crude oil used in the B30 blending, as high difference was also observed between the MGO and crude oil tests.
Compared to published studies [20,47], for two-stroke propulsion marine engines, the reported results all fall within the range of values produced by the current experimental campaign. This also applies to the high NOx emissions increase at 25% load for most engines which is also reported in these works. Due to the high variance between tested engines, safe conclusions regarding biofuel effect and load cannot be made with the current dataset. The four-stroke generator tests also showed considerable deviation between units tested even for same-type engines, when comparing against the reference. The values were in the range of those reported in other works [47]. It was verified that the cases presenting the highest change in emissions showed similarly high deviation in terms of peak pressure and pressure increase. This proved that engine performance is of utmost importance for emissions.
Overall, the multiple engines studied along with the investigations published provide sufficient support to conclude that in cases of similar operation, the particularities of biofuel, mainly O2 content, tend to enhance NOx formation. The level of NOx increase for normally operating two-stroke marine engines using B30 is 2–4% compared to crude oil, and slightly higher for four-stroke auxiliary units. Thus, only a small to moderate NOx increase should be expected when using B30.
The analysis highlighted aspects for further research, especially when factoring in the need for wider biofuel adoption, possibly of higher FAME content. It is noted that such studies would require a substantial level of preparation and cooperation with ship owners if to be conducted on board. The process would be easier in the case of auxiliary generators that can also be found on land installations and are easier to test during vessel operation. The need for further research is more prevalent for two-stroke engines, for which studies are limited. Minimal data are also available for older engine designs that lack electronic control systems, so the level of variance in performance and emissions should be investigated. Another important aspect for future research is the long-term effect of biofuel blends on engine components and especially the engine injection system. This is currently underway as ship owners are using B30 fuel blends for longer periods in their vessels. The results of the study will be presented in a future communication.

Author Contributions

Conceptualization, T.D.C. and D.T.H.; methodology, T.D.C. and M.F.; validation, T.D.C. and M.F.; investigation, T.D.C. and D.T.H.; writing—review and editing, T.D.C. and M.F.; supervision, D.T.H. All authors have read and agreed to the published version of the manuscript.

Funding

This research received no external funding.

Data Availability Statement

Data used in the specific study are not publicly archived. The measurement data used for analysis are the property of the owner of the vessels equipped with the tested engines and are confidential.

Conflicts of Interest

The authors declare no conflict of interest.

Nomenclature

CICompression ignition
CNCetane number
FAMEFatty acid methyl ester
FCFuel consumption
GHGGreenhouse gas
HFOHeavy fuel oil
IMOInternational Maritime Organization
ISOInternational Organization for Standardization
LCVLower calorific value
MGOMarine gas oil
PcompCompression pressure
PmaxMaximum combustion pressure
PscavScavenging pressure
BSFCBrake specific diesel fuel consumption
SOIStart of injection
VLSFOVery-low-sulfur fuel oil
ΔPPressure increase due to combustion

References

  1. Lloyd’s Register. IMO GHG Strategy–What Does It Mean? 2018. Available online: https://www.lr.org/en/insights/articles/imo-ghg-strategy-what-does-it-mean/ (accessed on 20 March 2023).
  2. IMO. Initial IMO GHG Strategy. International Maritime Organization. 2022. Available online: https://www.imo.org/en/MediaCentre/HotTopics/Pages/Reducing-greenhouse-gas-emissions-from-ships.aspx (accessed on 20 March 2023).
  3. Sou, W.S.; Goh, T.; Lee, X.N.; Ng, S.H.; Chai, K.H. Reducing the carbon intensity of international shipping–The impact of energy efficiency measures. Energy Policy 2022, 170, 113239. [Google Scholar] [CrossRef]
  4. IMO. Rules on Ship Carbon Intensity and Rating System Enter into Force. IMO. 2022. Available online: https://www.imo.org/en/MediaCentre/PressBriefings/pages/CII-and-EEXI-entry-into-force.aspx (accessed on 20 March 2023).
  5. Chuah, L.F.; Mokhtar, K.; Ruslan, S.M.M.; Abu Bakar, A.; Abdullah, M.A.; Osman, N.H.; Bokhari, A.; Mubashir, M.; Show, P.L. Implementation of the energy efficiency existing ship index and carbon intensity indicator on domestic ship for marine environmental protection. Environ. Res. 2023, 222, 115348. [Google Scholar] [CrossRef]
  6. Comer, B.; Chen, C.; Rutherford, D. Relating Short-Term Measures to IMO’ s Minimum 2050 Emissions Reduction Target. ICCT Working Paper 2018-13. 2018. Available online: https://theicct.org/wp-content/uploads/2021/06/IMO_Short_term_potential_20181011.pdf%0Ahttps://www.theicct.org/sites/default/files/publications/IMO_Short_term_potential_20181011.pdf (accessed on 20 March 2023).
  7. IMO Symposium on Alternative Low- and Zero-Carbon Fuels for Shipping. Available online: https://www.imo.org/en/About/Events/Pages/IMO-Symposium-on-alternative-low--and-zero-carbon-fuels-for-shipping-2022.aspx (accessed on 20 March 2023).
  8. Kass, M.D.; Abdullah, Z.; Biddy, M.J.; Drennan, C.; Haq, Z.; Hawkins, T.; Jones, S.; Holliday, J.; Longman, D.E.; Menter, S.; et al. Understanding the Opportunities of Biofuels for Marine Shipping. 2018. Available online: www.osti.gov (accessed on 20 March 2023).
  9. Li, S.; Tan, E.C.D.; Dutta, A.; Snowden-Swan, L.J.; Thorson, M.R.; Ramasamy, K.K. Techno-economic Analysis of Sustainable Biofuels for Marine Transportation. Environ. Sci. Technol. 2022, 56, 17206–17214. Available online: https://pubs.acs.org/doi/full/10.1021/acs.est.2c03960 (accessed on 20 March 2023). [CrossRef]
  10. Tan, E.C.D.; Harris, K.; Tifft, S.M.; Steward, D.; Kinchin, C.; Thompson, T.N. Adoption of biofuels for marine shipping decarbonization: A long-term price and scalability assessment. Biofuels Bioprod. Biorefining 2022, 16, 942–961. Available online: https://onlinelibrary.wiley.com/doi/full/10.1002/bbb.2350 (accessed on 20 March 2023). [CrossRef]
  11. Mukherjee, A.; Bruijnincx, P.; Junginger, M. A Perspective on Biofuels Use and CCS for GHG Mitigation in the Marine Sector. iScience 2020, 23, 101758. [Google Scholar] [CrossRef]
  12. Mat Aron, N.S.; Khoo, K.S.; Chew, K.W.; Show, P.L.; Chen, W.; Nguyen, T.H.P. Sustainability of the four generations of biofuels–A review. Int. J. Energy Res. 2020, 44, 9266–9282. Available online: https://onlinelibrary.wiley.com/doi/full/10.1002/er.5557 (accessed on 20 March 2023). [CrossRef]
  13. Mohr, A.; Raman, S. Lessons from first generation biofuels and implications for the sustainability appraisal of second generation biofuels. Energy Policy 2015, 63, 281–310. [Google Scholar] [CrossRef]
  14. Alalwan, H.A.; Alminshid, A.H.; Aljaafari, H.A.S. Promising evolution of biofuel generations. Subject review. Renew Energy Focus 2019, 28, 127–139. Available online: https://linkinghub.elsevier.com/retrieve/pii/S1755008418303259 (accessed on 20 March 2023). [CrossRef]
  15. Noor, C.M.; Noor, M.M.; Mamat, R. Biodiesel as alternative fuel for marine diesel engine applications: A review. Renew. Sustain. Energy Rev. Pergamon 2018, 94, 127–142. [Google Scholar] [CrossRef]
  16. Lin, C.Y. Effects of biodiesel blend on marine fuel characteristics for marine vessels. Energies 2013, 6, 4945–4955. Available online: https://www.mdpi.com/1996-1073/6/9/4945/htm (accessed on 20 March 2023). [CrossRef] [Green Version]
  17. Rakopoulos, C.D.; Hountalas, D.T.; Zannis, T.C.; Levendis, Y.A. Operational and Environmental Evaluation of Diesel Engines Burning Oxygen-Enriched Intake Air or Oxygen-Enriched Fuels: A Review. SAE Trans. 2004, 113, 1723–1743. Available online: http://www.jstor.org/stable/44740884 (accessed on 20 March 2023).
  18. Aydin, H.; Bayindir, H. Performance and emission analysis of cottonseed oil methyl ester in a diesel engine. Renew Energy 2010, 35, 588–592. [Google Scholar] [CrossRef]
  19. Panoutsou, C.; Germer, S.; Karka, P.; Papadokostantakis, S.; Kroyan, Y.; Wojcieszyk, M.; Maniatis, K.; Marchand, P.; Landalv, I. Advanced biofuels to decarbonise European transport by 2030: Markets, challenges, and policies that impact their successful market uptake. Energy Strateg. Rev. 2021, 34, 100633. [Google Scholar] [CrossRef]
  20. Stathatou, P.M.; Bergeron, S.; Fee, C.; Jeffrey, P.; Triantafyllou, M.; Gershenfeld, N. Towards decarbonization of shipping: Direct emissions & life cycle impacts from a biofuel trial aboard an ocean-going dry bulk vessel. Sustain. Energy Fuels 2022, 6, 1687–1697. Available online: https://pubs.rsc.org/en/content/articlehtml/2022/se/d1se01495a (accessed on 20 March 2023).
  21. Chountalas, T.D.; Founti, M.; Tsalavoutas, I. Evaluation of biofuel effect on performance & emissions of a 2-stroke marine diesel engine using on-board measurements. Energy 2023, 278, 127845. [Google Scholar] [CrossRef]
  22. Wei, L.; Cheng, R.; Mao, H.; Geng, P.; Zhang, Y.; You, K. Combustion process and NOx emissions of a marine auxiliary diesel engine fuelled with waste cooking oil biodiesel blends. Energy 2018, 144, 73–80. Available online: https://www.sciencedirect.com/science/article/pii/S0360544217320315 (accessed on 20 March 2023). [CrossRef]
  23. Aydın, S. Comprehensive analysis of combustion, performance and emissions of power generator diesel engine fueled with different source of biodiesel blends. Energy 2020, 205, 118074. Available online: https://linkinghub.elsevier.com/retrieve/pii/S0360544220311816 (accessed on 31 January 2023). [CrossRef]
  24. Wu, G.; Jiang, G.; Yang, Z.; Huang, Z. Emission characteristics for waste cooking oil biodiesel blend in a marine diesel propulsion engine. Pol. J. Environ. Stud. 2019, 28, 2911–2921. Available online: http://www.pjoes.com/Emission-Characteristics-for-Waste-Cooking-Oil-nBiodiesel-Blend-in-a-Marine-Diesel,92704,0,2.html (accessed on 30 March 2023). [CrossRef]
  25. Boubahri, C.; Ridha, E.; Rachid, S.; Jamel, B. Experimental study of a diesel engine performance running on waste vegetable oil biodiesel blend. J. Energy Resour. Technol. Trans. ASME 2012, 134, 032202. Available online: https://asmedigitalcollection.asme.org/energyresources/article/134/3/032202/465055/Experimental-Study-of-a-Diesel-Engine-Performance (accessed on 21 March 2023).
  26. Love, N.D.; Parthasarathy, R.N.; Gollahalli, S.R. Rapid characterization of radiation and pollutant emissions of biodiesel and hydrocarbon liquid fuels. J. Energy Resour. Technol. Trans. ASME 2009, 131, 012202. Available online: https://asmedigitalcollection.asme.org/energyresources/article/131/1/012202/455601/Rapid-Characterization-of-Radiation-and-Pollutant (accessed on 21 March 2023). [CrossRef]
  27. Puškár, M.; Kopas, M.; Sabadka, D.; Kliment, M.; Šoltésová, M. Reduction of the gaseous emissions in the marine diesel engine using biodiesel mixtures. J. Mar. Sci. Eng. 2020, 8, 330. Available online: https://www.mdpi.com/2077-1312/8/5/330/htm (accessed on 21 March 2023). [CrossRef]
  28. Nishio, S.; Fukuda, T.; Fathallah, A.Z.M.; Setiapraja, H. Influence of Palm Biofuel for Marine Diesel Engine on Combustion and Exhaust Emission Characteristics. Mar. Eng. 2018, 53, 441–446. [Google Scholar] [CrossRef] [Green Version]
  29. Kalligeros, S.; Zannikos, F.; Stournas, S.; Lois, E.; Anastopoulos, G.; Teas, C.; Sakellaropoulos, F. An investigation of using biodiesel/marine diesel blends on the performance of a stationary diesel engine. Biomass Bioenerg. 2003, 24, 141–149. [Google Scholar] [CrossRef]
  30. Wu, F.; Wang, J.; Chen, W.; Shuai, S. A study on emission performance of a diesel engine fueled with five typical methyl ester biodiesels. Atmos. Environ. 2009, 43, 1481–1485. [Google Scholar] [CrossRef]
  31. Mofijur, M.; Rasul, M.; Hassan, N.M.S.; Uddin, M.N. Investigation of exhaust emissions from a stationary diesel engine fuelled with biodiesel. In Energy Procedia; Elsevier: Amsterdam, The Netherlands, 2019; pp. 791–797. [Google Scholar]
  32. Sagin, S.; Karianskyi, S.; Madey, V.; Sagin, A.; Stoliaryk, T.; Tkachenko, I. Impact of Biofuel on the Environmental and Economic Performance of Marine Diesel Engines. J. Mar. Sci. Eng. 2023, 11, 120. Available online: https://www.mdpi.com/2077-1312/11/1/120/htm (accessed on 21 March 2023). [CrossRef]
  33. Zheng, M.; Mulenga, M.C.; Reader, G.T.; Wang, M.; Ting, D.S.K.; Tjong, J. Biodiesel engine performance and emissions in low temperature combustion. Fuel 2008, 87, 714–722. [Google Scholar] [CrossRef]
  34. Varatharajan, K.; Cheralathan, M. Influence of fuel properties and composition on NO x emissions from biodiesel powered diesel engines: A review. Renew. Sustain. Energy Rev. Pergamon 2012, 16, 3702–3710. [Google Scholar] [CrossRef]
  35. Mueller, C.J.; Boehman, A.L.; Martin, G.C. An Experimental Investigation of the Origin of Increased NOx Emissions When Fueling a Heavy-Duty Compression-Ignition Engine with Soy Biodiesel. SAE Int. J. Fuels Lubr. 2009, 2, 789–816. Available online: http://www.jstor.org/stable/26273427 (accessed on 20 March 2023). [CrossRef] [Green Version]
  36. Sun, J.; Caton, J.A.; Jacobs, T.J. Oxides of nitrogen emissions from biodiesel-fuelled diesel engines. Prog. Energy Combust Sci. 2010, 36, 677–695. Available online: https://www.sciencedirect.com/science/article/pii/S0360128510000237 (accessed on 20 March 2023). [CrossRef]
  37. Hoekman, S.K.; Robbins, C. Review of the effects of biodiesel on NOx emissions. Fuel Process Technol. 2012, 96, 237–249. Available online: https://www.sciencedirect.com/science/article/pii/S0378382012000021 (accessed on 20 March 2023). [CrossRef]
  38. Rickeard, D.J.; Thompson, N.D. A Review of the Potential for Bio-Fuels as Transportation Fuels. In SAE Technical Papers. SAE International. 1993. Available online: https://www.sae.org/publications/technical-papers/content/932778/ (accessed on 23 March 2023).
  39. Monyem, A.; van Gerpen, J.H.; Canakci, M. The effect of timing and oxidation on emissions from biodiesel-fueled engines. Trans. Am. Soc. Agric. Eng. 2001, 44, 35–42. Available online: https://elibrary.asabe.org/azdez.asp?JID=3&AID=2301&CID=t2001&v=44&i=1&T=1 (accessed on 22 March 2023). [CrossRef]
  40. Pandey, R.K.; Rehman, A.; Sarviya, R.M. Impact of alternative fuel properties on fuel spray behavior and atomization. Renew. Sustain. Energy Rev. Pergamon 2012, 16, 1762–1778. [Google Scholar] [CrossRef]
  41. Agarwal, D.; Sinha, S.; Agarwal, A.K. Experimental investigation of control of NOx emissions in biodiesel-fueled compression ignition engine. Renew Energy 2006, 31, 2356–2369. Available online: https://www.sciencedirect.com/science/article/pii/S0960148105003587 (accessed on 20 March 2023). [CrossRef]
  42. Rajkumar, S.; Thangaraja, J. Effect of biodiesel, biodiesel binary blends, hydrogenated biodiesel and injection parameters on NOx and soot emissions in a turbocharged diesel engine. Fuel 2019, 240, 101–118. Available online: https://www.sciencedirect.com/science/article/pii/S0016236118320350 (accessed on 20 March 2023). [CrossRef]
  43. Rajak, U.; Nashine, P.; Dasore, A.; Balijepalli, R.; Chaurasiya, P.K.; Verma, T.N. Numerical analysis of performance and emission behavior of CI engine fueled with microalgae biodiesel blend. Mater Today Proc. 2022, 49, 301–306. [Google Scholar] [CrossRef]
  44. Aro, E.M. From first generation biofuels to advanced solar biofuels. Ambio 2016, 45, 24–31. Available online: https://link.springer.com/article/10.1007/s13280-015-0730-0 (accessed on 20 March 2023). [CrossRef] [Green Version]
  45. Moravvej, Z.; Makarem, M.A.; Rahimpour, M.R. The fourth generation of biofuel. In Second and Third Generation of Feedstocks: The Evolution of Biofuels; Elsevier: Amsterdam, The Netherlands, 2019; pp. 557–597. [Google Scholar] [CrossRef]
  46. International Energy Agency. State of Technology Review-Algae Bioenergy an IEA Bioenergy Inter-Task Strategic Project. 2017. Available online: https://www.ieabioenergy.com/blog/publications/state-of-technology-review-algae-bioenergy/ (accessed on 20 March 2023).
  47. Lloyd’s Register. NOx from Marine Diesel Engines Using Biofuels NOx from Marine Diesel Engines Using Biofuels. 2022. Available online: https://www.lr.org/en/reports/nox-from-marine-diesel-engines-using-biofuels/ (accessed on 20 March 2023).
  48. International Maritime Organization. MEPC.1/Circ.795/Rev.7, London, 2022. Available online: https://www.classnk.or.jp/hp/pdf/activities/statutory/soxpm/mepc1circ795rev7.pdf (accessed on 8 June 2023).
  49. Testo Inc. Testo 350 Flue Gas Analyzer: Instruction Manual. 2020. Available online: https://static-int.testo.com/media/d1/56/d4836ea87dd7/testo-350-Instruction-Manual.pdf (accessed on 8 June 2023).
  50. International Maritime Organization. NOx Technical Code 2008, Technical Code on Control of Emission of Nitrogen Oxides from Marine Diesel Engines. 2008. Available online: https://www.imorules.com/NOX2008.html (accessed on 8 June 2023).
  51. Chountalas, T.; Founti, M. Effect of Low-Sulfur Fuel on Auxiliary Engine Combustion and Performance. In Proceedings of the SNAME 7th International Symposium on Ship Operations, Management and Economics, Virtual, 6–7 April 2021. [Google Scholar]
  52. Hsieh, C.-W.C.; Felby, C. Biofuels for the Marine Shipping Sector: An Overview and Analysis of Sector Infrastructure, Fuel Technologies and Regulations. 2017. Available online: https://www.ieabioenergy.com/wp-content/uploads/2018/02/Marine-biofuel-report-final-Oct-2017.pdf (accessed on 27 April 2023).
Figure 1. ISO specific fuel consumption comparison. B30—reference; gas oil; crude oil; main engines.
Energies 16 04647 g001
Figure 2. Peak combustion pressure comparison. B30—reference; gas oil; crude oil; main engines.
Energies 16 04647 g002
Figure 3. Pressure rise due to combustion comparison. B30—reference; gas oil; crude oil; main engines.
Energies 16 04647 g003
Figure 4. Specific NOx emissions comparison. B30—reference; gas oil; crude oil; main engines.
Energies 16 04647 g004
Figure 5. Deviation of specific NOx emissions from the reference—B30, gas oil, crude oil, Main Engine 1.
Energies 16 04647 g005
Figure 6. ISO specific fuel consumption comparison. B30—reference; gas oil; crude oil; auxiliary generators.
Energies 16 04647 g006
Figure 7. Peak combustion pressure comparison. B30—reference; gas oil; crude oil; auxiliary generators.
Energies 16 04647 g007
Figure 8. Pressure rise due to combustion comparison. B30—reference; gas oil; crude oil; auxiliary generators.
Energies 16 04647 g008
Figure 9. Specific NOx emissions comparison. B30—reference; gas oil; crude oil; auxiliary generators.
Energies 16 04647 g009
Figure 10. Deviation of specific NOx emissions from the reference—B30, gas oil, crude oil, Aux. Unit 1.
Energies 16 04647 g010
Table 1. Measuring instrument specifications.
InstrumentMeasured ParameterRangeAccuracy
TorquemeterTorque0–250 rpm<0.5%
Speed0.1 rpm
Power MeterElectrical Power 0.1 kW
Coriolis Mass FlowmeterFuel Consumption0–10,000 kg/h0.30%
Volumetric FlowmeterFuel Consumption0–2500 L/min1.50%
Cylinder Pressure SensorCylinder Pressure0–250 Bar0.50%
Scavenge Pressure SensorScavenging air Pressure0–10 Bar0.10%
Scavenge Temperature SensorScavenging air Temperature−10–80 °C0.2 °C
Exhaust Temperature SensorExhaust Gas Temperature−10–600 °C0.5 °C
Table 2. Flue gas analyzer specifications.
InstrumentMeasured ParameterRangeAccuracy
Testo 350 MaritimeCO20–25 %vol±0.3 %vol
O20–25 %vol±0.3 %vol
NOx<100–1999 ppm±5%
CO0–10,000 ppm±5%
SO20–5000 ppm±5%
Ambient pressure, absolute600–1150 hPa±10 hPa
Humidity MeterAmbient Humidity0–100 %RH±2%
Table 3. Two-stroke propulsion engines main specifications.
Engine No.12345
Cylinder No.66666
Rated Speed (rpm)757785.58989
Rated Power (kW)15,74810,21516,78096609660
Bore (mm)700600700600600
Stroke (mm)32562790280024002400
Electronic ControlYesYesYesYesYes
Fuels TestedB30, HFO, MGOB30, VLSFO, MGOB30, VLSFOB30, VLSFOB30
Table 4. Four-stroke auxiliary engines main specifications.
Engine No.12345
Cylinder No.66666
Rated Speed (rpm)900900900900900
Rated Power (kW)9709701710610610
Bore (mm)220220210185185
Stroke (mm)320320320280280
Fuels TestedB30, HFO, MGOB30, HFO, MGOB30, VLSFOB30B30
Units Tested (#)11, 32, 311
Table 5. Used-fuel specifications.
Vessel No.12345
Fuel TypeB30VLSFOMGOB30HFOMGOB30VLSFOB30VLSFOB30
LCV (kcal/kg)9563.39864.310,122.39575.239548.9510,172.499608.279790.249981.379904.929981.37
Density @ 15 °C (kg/m3)930.2970880.2930989.7863.1929.5979.6939.6956.1934.9
Viscosity @ 50 °C (cSt)38.37154.73.81238.66357.83.59137.737.76.7194.844.7
Sulfur (%m/m)360.450.0690.353.230.0780.360.470.340.470.48
CCAI821841-820851-818870867824823
Cetane No.--41--47-----
Carbon (%m/m)84.486.987.483.784.387.681.986.982.185.880.5
Hydrogen (%m/m)11.911.112.611.810.312.112.211.110.612.110.8
Nitrogen (%m/m)0.20.40.110.480.41<0.100.50.40.20.450.2
Oxygen (%m/m)3.22<0.2<0.23.671.760.224.690.21.6<0.23.1
FAME (%V/V)28.31<0.1<0.129.7<0.100.234.15<0.1025<0.1028.54
B30B30
9981.379981.37
934.9934.9
44.744.7
0.480.48
823823
--
80.580.5
10.810.8
0.20.2
3.13.1
28.5428.54
B30B30
Table 6. Main engine B30 comparison summary.
Engine 1Engine 2
Specific Emissions (%)25% Load 50% Load75% LoadTotal Weighted25% Load 50% Load75% LoadTotal Weighted
Reference−0.473.653.229.89−6.8512.85−5.064.20
Gas Oil6.427.876.967.07----
Crude Oil7.90−0.062.672.61−2.30−0.79−1.96−1.90
Pmax (bar)
Reference−4.50−3.30−3.10 5.001.602.50
Gas Oil−2.20−0.10−1.60 ---
Crude Oil−1.30−1.402.20 −0.50−0.30−1.10
ΔP (bar)
Reference−2.70−2.005.10 3.30−2.505.10
Gas Oil0.802.102.60 ---
Crude Oil−0.40−2.302.70 −0.50−3.001.80
Engine 3Engine 4
Specific Emissions (%)25% Load 50% Load75% LoadTotal Weighted25% Load 50% Load75% LoadTotal Weighted
Reference29.054.148.1016.2724.09−0.0710.5317.09
Crude Oil7.9010.2513.4511.77----
Pmax (bar)
Refrence3.10−8.80−2.50 −15.20−0.80−2.40
Crude Oil−4.90−3.30−1.10 ---
ΔP (bar)
Reference0.706.107.40 −18.90−5.302.80
Gas Oil3.102.002.70 ---
Engine 5
Specific Emissions (%)25% Load 50% Load75% LoadTotal Weighted
Reference−0.30−16.67−5.15−0.14
Gas Oil10.66−17.34−9.47−9.40
Crude Oil15.37−1.25−0.080.97
Pmax (bar)
Reference6.10−5.50−2.00
Gas Oil−8.50−14.90−8.30
Crude Oil−3.90−8.60−0.20
ΔP (bar)
Reference3.000.602.30
Gas Oil−2.40−5.10−2.10
Crude Oil−0.70−4.200.90
Table 7. Auxiliary generators B30 comparison summary.
Auxiliary Generator 1Auxiliary Generator 2
Specific Emissions (%)25% Load 50% Load75% LoadTotal Weighted25% Load 50% Load75% LoadTotal Weighted
Reference−13.121.4510.593.86−1.06−6.3−8.54−6.34
Gas Oil2.156.559.187.03----
Crude Oil10.6217.412.4413.97−9.23−3.99−10.8−8.11
Pmax
Reference−2.5−8.1−19.5 −2.6−11.3−16.6
Gas Oil0.92.94 ---
Crude Oil−5.43.83.8 −2.1−7.5−5.2
ΔP
Reference1.9−3.2−5.6 −4.4−12.6−19.4
Gas Oil0.41.52.9
Crude Oil−5.65.13.3 −3.4−8−4.6
Auxiliary Generator 3Auxiliary Generator 4
Specific Emissions (%)25% Load 50% Load75% LoadTotal Weighted25% Load 50% Load75% LoadTotal Weighted
Reference32.138.37−1.496.82−4.52-5.875.11
Crude Oil18.6−6.76−12.33−5.69----
Pmax (bar)
Reference1.7−1.1−1.7 8.7-14.3
Crude Oil−1−5.5−3.3 ---
ΔP (bar)
Reference−8.1−17−20.5 8.7-16.3
Crude Oil−2.9−9−7.5 ---
Auxiliary Generator 5
Specific Emissions (%)25% Load 50% Load75% LoadTotal Weighted
Reference-19.35−10.41−1.9
Pmax (bar)
Reference-18.78.6
ΔP (bar)
Reference-19.2−3.3
Auxiliary Generator 6Auxiliary Generator 7
Specific Emissions (%)25% Load 50% Load75% LoadTotal Weighted25% Load 50% Load75% LoadTotal Weighted
Reference−24.45−21.11−19.5−19.98−25.83−27.57−26.4−25.75
Gas Oil−3.5210.0813.79.08−3.2913.3622.8412.97
Crude Oil−1.646.34−1.581.1215.5616.754.4310.58
Disclaimer/Publisher’s Note: The statements, opinions and data contained in all publications are solely those of the individual author(s) and contributor(s) and not of MDPI and/or the editor(s). MDPI and/or the editor(s) disclaim responsibility for any injury to people or property resulting from any ideas, methods, instructions or products referred to in the content.