Article

Chemical Modeling of Constant-Volume Combustion of the Mixture of Methane and Hydrogen Used in Spark Ignition Otto Cycles

by
Michel Feidt
1,
Gheorghe Dumitrascu
2,* and
Ana-Georgiana Lupu
2
1
Laboratory of Energetics and of Theoretical and Applied Mechanics, UMR 7563, University of Lorraine, 54505 Vandoeuvre-lès-Nancy, France
2
Mechanical Engineering Faculty, “Gheorghe ASACHI” Technical University of Iasi, 700050 Iasi, Romania
*
Author to whom correspondence should be addressed.
Energies 2023, 16(12), 4578; https://doi.org/10.3390/en16124578
Submission received: 28 April 2023 / Revised: 26 May 2023 / Accepted: 2 June 2023 / Published: 7 June 2023
(This article belongs to the Topic Advanced Engines Technologies)

Abstract

:
This paper develops a chemical model for a closed constant-volume combustion of a gaseous mixture of methane and hydrogen. Since the combustion is strongly dependent on temperature, pressure and fuel composition, these had chosen the actual corresponding thermodynamic systems in this kind of combustion, i.e., spark ignition (SI) reciprocating engines, to assess combustion parameters and flue gas composition. The actual cycles impose extra restrictive operational conditions through the engine’s-volumetric-compression ratio, the geometry of the combustion volume, the preparation method of the mixture of methane and hydrogen, (e.g., one fueling way of a homogeneous mixture obtained in a specific device or by two separate fueling ways for components), the cooling system and the delivered power. The chemical model avoided the unknown influences in order to accurately explain the influence of hydrogen upon constant-volume combustion and flue gas composition. The model adopted hypotheses allowing to generalize evaluated results, i.e., the isentropic compression and expansion processes, in closed constant-volume combustion caused by two successive steps that obey the energy and mass conservation laws, and the flue gas exhaust, which is also described by two steps, i.e., isentropic expansion through the flow section of exhaust valves followed by a constant pressure stagnation (this process, in fact, corresponds to a direct throttling process). The chemical model assumed the homogeneous mixtures of gases with variable heat capacity functions of temperatures, the Mendeleev—Clapeyron ideal gas state equation, and the variable chemical equilibrium constants for the chosen chemical reactions. It was assumed that the flue gas chemistry prevails during isentropic expansion and during throttling of exhaust flue gas. The chemical model allowed for evaluation of flue gas composition and noxious emissions. The numerical results were compared with those recently reported in other parallel studies.

1. Introduction

The combustion of mixtures of fossil fuel with hydrogen showed firstly that harmful emissions, namely carbon oxide (CO) and nitrogen oxides (NOx), are directly proportional to the hydrogen ratio in the fuel and to the flame temperature, as lower excess oxygen and/or higher preheating of the air before combustion as larger flame temperature. Therefore, the actual theoretical/experimental studies are developing means to reduce these emissions through the design of new combustion zones (e.g., moderate and intense low-oxygen dilution (MILD) combustion, and combustion inside a porous material), new methods to mix different fossil fuels with hydrogen (e.g., dual fueling in engines), new ideas regarding the pre- and postcombustion processing of working fluids (e.g., mixing blended fuel with hydrogen, and postcombustion catalytic treatment). The combustion of a fossil fuel and hydrogen mixture in spark ignition engines has led to basic studies regarding the adaptation of actual spark ignition engines, and an increasing number are tackling specific research targets.
Ref. [1] simulated the laminar combustion rates of a mixture of hydrogen/methane/air with CHEMKIN PREMIX/GRI kinetic mechanism in NTP conditions. The authors considered large ranges for the equivalence ratio (Φ) and the fuel constituents, and obtained smaller laminar combustion reaction rates for mixtures than those averaged from the molecular composition. The simulation suggested that the chemical reactivity from lean to rich combustion is changing, very possibly caused by the fact that hydrogen radicals are initiating extra chemical reactions. The simulation of combustion velocities were transposed in a formula similar to Le Chatelier’s Rule, with sound accuracy for lean mixtures, ranges of pressures up to 10 atm and of temperatures up to 400 K.
Ref. [2] involved distinguishing PIV (particle image velocimetry) events to study the transient reactive combustion flow of mixtures of hydrogen/methane/air through toroidal vortex structures with a fuel mixture range of 0–0.5. The results emphasized that the reactive flow had increased flow turbulence proportional to the hydrogen fraction and that the study captured the timing flame area and burning rate.
Ref. [3] used an analytical model for combustion in an Otto engine that uses hydrogen-enriched fuels combustion modeling, correlated multi-zone combustion with an unique combustion model. While considering unburned fuel, the laminar flame speed was evaluated, and additionally, an improved flame shape was adopted.
Ref. [4] developed a prototype methanol–syngas engine that used dual fuel (gasoline and dissociated methanol) and found that the presence of hydrogen obtained by dissociation improved the efficiency, and increased the maximum pressure on the cycle and amplified the released heat in the recycling of exhaust heat.
Ref. [5] simulated the combustion of pure hydrogen using AVL Boost and compared it to the combustion of a water microemulsion (gasoline 90% + ethanol 8% + H2O 2%) and of pure gasoline, inside a stationary SI engine. These simulations comparatively revealed the characteristics regarding the pollutants and energy efficiency for all chosen fuels.
Ref. [6] experimentally explored the combustion of water-diluted ethanol/hydrogen in an SI engine. The injection of the water diluted ethanol during the intake process was combined with direct hydrogen injection during the compression stroke. The addition of hydrogen increases the maximum pressure and temperature of the cycle, reduces CO and hydrocarbons (HC), but increases NOx emissions.
Ref. [7], based on AVL Boost program and some selected experiments, concluded that changing from a liquid fuel to a gaseous one assured complete combustion, the reduction in HC and CO emissions, the modification of the brake power, and improved efficiency with lean mixtures, but with an increase in NOx.
Ref. [8] aimed to find the optimal fuel blend for the combustion of ethanol/gasoline/hydrogen mix in a SI engine. It was found that the presence of hydrogen led to a significant improvement in power and energy efficiency and combustion process, and reduced hydrocarbon emissions.
Ref. [9] studied the impact of dual fuel mixtures. They examined the combustion of mixed additional fuels (hydrogen, methane, butane, propane) with basic fuels (gasoline, iso-octane, benzene, toluene, hexane, ethanol, methanol) and evaluated the theoretical performance of an SI engine; the results emphasized that the additional fuels significantly modified the energy and exergy characteristics of the engine.
Ref. [10] defined the optimal fuel composition of a syngas/biogas/hydrogen mixture, for the control parameters of a spark-ignited engine, and thus, it was designed a flexible electronic control unit for the engine included in a solar-biomass hybrid renewable energy system, which is controlling the relation between the engine load, fuel rate, and air rate.
Ref. [11] investigated the consequences of the addition of hydrogen on gasoline-based SI engine performance with a volumetric compression ratio of 15; The best hydrogen addition was for an equilibrium between the good burning efficiency and the increased heat loss.
Ref. [12] evaluated the use of CH4 and H2/CH4 dual fuel in a turbocharged common-rail diesel engine at four loads and three compression ratios. The results showed that presence of H2 usually produced a larger in-cylinder pressure peak, extra noise, significant variations in ignition interval and combustion time, and earlier heat release, while dual-fuel operations produced higher total hydrocarbon (THC) and NOx but lower CO2.
Ref. [13] used a well-stirred reactor (WSR) to simulate the perfect MILD combustion under normal pressure/extended residence time. Chemkin Pro software and GRI Mech 2.11 were used for the comparison. The hydrogen addition enhanced the NNH route, decreased the prompt route and nitrous oxide intermediate route and reduced nitrogen oxide reburning, but the thermal NOx route was irrelevant due to the smaller O2 mass ratio of 3% and 6%.
Ref. [14] used CFD-modeling and a chemical kinetics PDF model of turbulent combustion of the hydrogen-rich synthetic fuel for the simulations that were related to experimental data. For all synfuel mixtures, they obtained very low NOx emissions.
Ref. [15] studied the combustion (parameters, emissions) of a mixed gasoline/hydrogen fuel and its influence upon the lubricating process in a SI engine. They were considered four loads (25%, 50%, 75%, 100%) and three hydrogen concentrations (3%, 6%, and 9%). The injection of hydrogen slightly increased the combustion pressure and heat released. The hydrogen reduced CO and HC emissions, while smoke opacity worsened lubrication through oil kinematic viscosity, and increases the friction.
Ref. [16] studied the influence of hydrogen on the NOx formation during combustion in industrial furnaces. Experiments on a perfect stirred reactor (PSR) and a burner with laminar flame were compared to NOx evaluation accuracy through the known GRI and PG2018 mechanisms. The PG2018 mechanism is more accurate than the GRI 2.11 and GRI 3.0 mechanisms, especially when evaluating N2O-intermediate and NNH pathways. The experiments showed that the burner stabilized laminar flame and growth of hydrogen ratio, at a given temperature, induces a prompt NOx radical decrease and, an amplified NOx production via NNH and, a suppressed thermal NOx. Increased hydrogen ratio led suppressed N2O-intermediate pathway in the flame volume but enhanced one in the flue gas caused by the incremented H2O.
Ref. [17] is a review of the understanding of the relationship between composition/premixed fuel gas turbine combustion, stability/emissions systems, and hydrogen-enriched syngas/natural gas. A comparison between syngas/conventional hydrocarbon chemicals, a survey of available technologies adaptable to syngas and hydrogen-rich fuels in large scale applications, and a review of numerical simulations for hydrogen enriched fuels combustion is also included.
Ref. [18] experimented and numerically evaluated the combustion of premixed propane/hydrogen/air (C3H8/H2/air) in porous media. The results showed that porous media based combustion of H2 assures stability and wide-ranging burning limits, while C3H8 inhibit them, i.e., flame shape and location and temperature field. The combustion of H2 in porous media robustly improves the mean radiation temperature, but the C3H8 fraction decreases it. The flue gas temperature in porous media combustion is lower than in free fires.
Ref. [19] includes correlated experiments on a heavy-duty single-cylinder SI engine fueled with H2, and 3D-CFD-RANS based on ECFM and sub-models simulations, to optimize the combustion process.; Direct injection and port fuel injection were selected to provide recommendations for homogeneous cylinder filling. The correlated studies emphasized the characteristics of NOx emissions and heat losses for selected experiments.
Ref. [20] used unsteady Reynolds averaged Navier–Stokes (URANS) for six simulations (various spark and injection timings) of flow through a large bore for direct hydrogen injection in an SI engine; the numerical simulations were compared to experimental data. The relationship between autoignition and spark timing and in-cylinder pressure and unburned fuel were revealed; zero-dimensional chemical simulations were used to accurately predict autoignition timing.
Ref. [21] tested gaseous fuels, including methane, carbon monoxide, hydrogen and their mixture, in a Volkswagen 1.4 L/SI engine. The engine has similar performances for constant λ = air/fuel ratio. The composition of the gaseous fuel significantly influence the optimum λ values; a simple zero-dimensional combustion model has been developed to explain qualitatively the trends induced by fuels.
Ref. [22] developed an one-dimensional combustion model of hydrogen-enriched natural gas (NG) in a SI engine. The viability of the model was proven by experiments. Combustion control strategies were verified by using various exhaust gas recirculation ratios (EGR) and hydrogen injection timings. The results revealed correlations between in-cylinder pressure peak and heat release rate, and average temperature of the hydrogen-enriched natural gas and port fuel injection and early or late direct injection. These correlations were used to find better possible volumetric efficiency, combustion efficiency, reduced NOx emissions, and identify the reciprocal influence ignition delay/EGR.
Ref. [23] utilized the response surface methodology (RSM) to find a gasohol/hydrogen mix and an engine rpm that would provide more efficient operation and reduced emissions. The analysis using a variance-assisted RSM model was used to evaluate specific fuel consumption, thermal efficiency and harmful emissions.
Ref. [24] experimentally studied the influences of spark timings, of compression ratios, of EGR values on the combustion of hydrogen and gasoline in an SI engine. Empirical correlations were found for ignition lag and combustion period as functions of compression ratio, equivalence ratio, and exhaust gas recirculation.
Ref. [25] used an in-house CFD code to produce accurate values of the indicated mean effective pressure, in a fraction of operational time, for the combustion of methane/hydrogen mixtures in an SI engine. The methodology of processing the results used numerical values from five successive cycles and transposed them in suitable relationships for main parameters as functions of a normalized distance, the distance within the computational cell, to the spark plug region. The methodology gave a smooth transition from the laminar to the fully turbulent burning regime.
Ref. [26] focused on SI dual-fuel combustion with an acetone–butanol–ethanol port injection and hydrogen direct injection, giving a stratified zone of the hydrogen-rich mixture around the spark plug. Various blends and spark timings were used to observe the effects of combustion and emissions on the test engine.
Ref. [27] used experiments and CFD simulations (developed in Converge CFD software) to observe the effect of enriching biogas with hydrogen on the combustion and on the emission for a single-cylinder, four-stroke, spark-ignition engine operated at the compression ratio of 10:1 and 1500 rpm. The results included peaks of in-cylinder pressure, COVIMEP, flame initiation, combustion durations, hydrocarbon, and NOx emissions.
Because all actual studies following the use of hydrogen in reciprocating engines were organized for limited experiments with imposed operational restrictive conditions, such as constant revolution per minute, constant power, specific cooling, accurate instrumentation, the research results are at this time somewhat poor and sometimes contradictory. This paper develops a pure chemical model for a closed constant-volume combustion of gaseous mixtures of methane and hydrogen used in Otto cycles for adopted simplifying hypotheses, actual volumetric compression ratio, isentropic compression and expansion processes, closed constant-volume combustion developed by two successive steps obeying the energy and mass conservation laws and, flue gas exhaust described also by two steps, i.e., an isentropic expansion through the flow section of exhaust valves followed by a constant pressure stagnation (this succession in fact corresponds to a throttling direct process). These simulations’ restrictive conditions allowed for the generalized evaluation of all state parameters along the cycle, i.e., temperatures, pressures, and working fluid composition/pollutants. The numerical results were compared with those recently reported in other parallel studies.

2. The Approach of the Closed Constant-Volume Combustion in Otto Engine Cycles

2.1. The Assumptions for the Otto Cycle

Let us suppose that the general basic Otto cycle, interacting with the environment by heat, mass and power transfers, see Figure 1. The engine cycle, used to realistically describe the constant-volume combustion of a homogeneous mixture of CH4 and H2 and to evaluate the flue gas composition and harmful emissions, consists of the following processes:
  • 1–2: isentropic compression of homogeneous mixture CH4/H2/air prepared by a specific device;
  • 2–3: closed constant-volume combustion;
  • 3–4: isentropic expansion of flue gas;
  • 4–5: exhaust of flue gas, assimilated via a throttling process (succession of 4−4t isentropic expansion through flow section of exhaust valves and 4t–5 constant pressure stagnation);
  • 5–1: final constant-pressure exhaust of flue gas.

2.2. The Isentropic Compression of Homogeneous Mixture of CH4/H2/Air

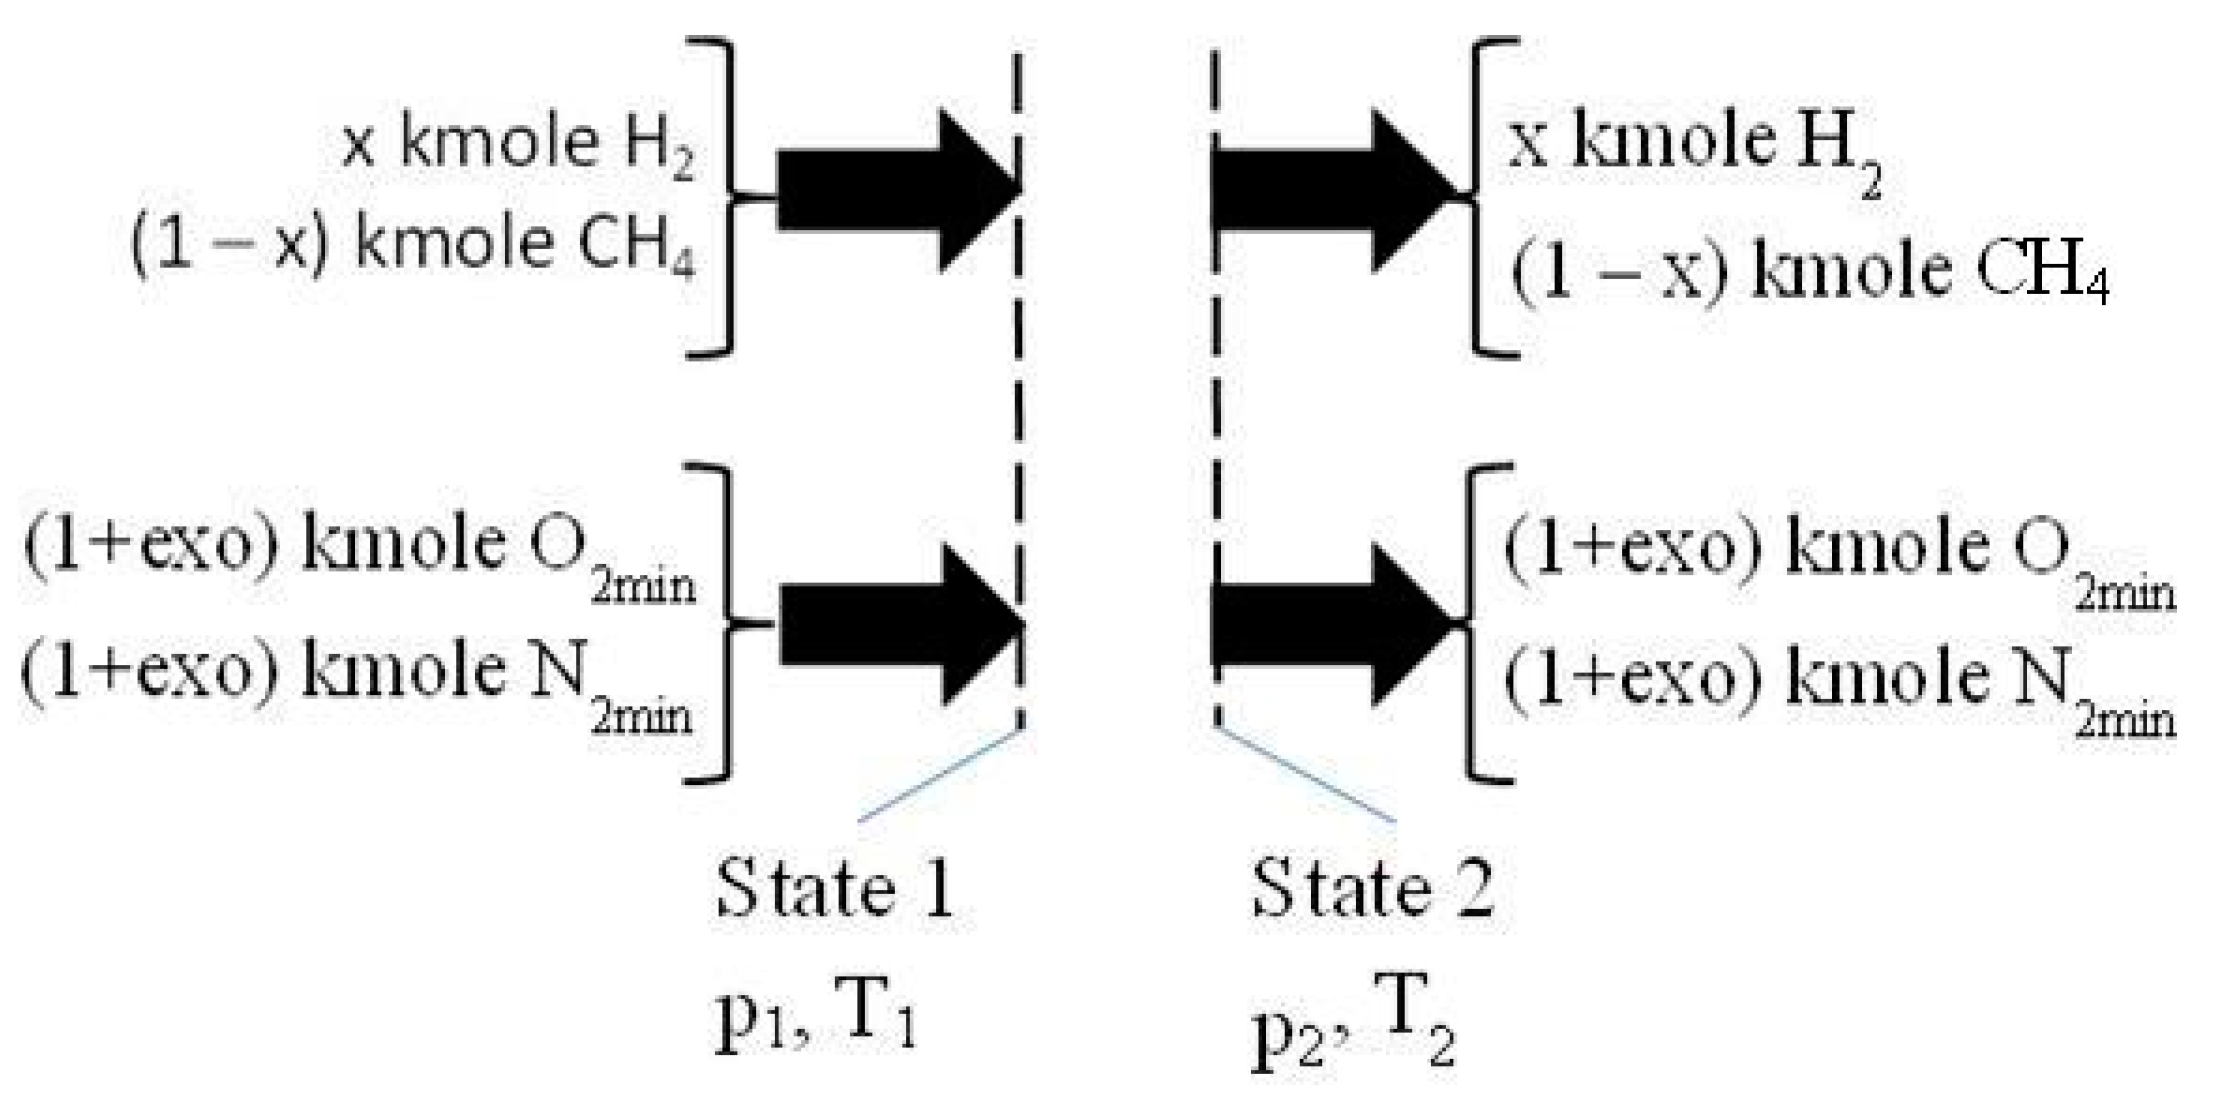
Assumptions were made relating to the 1 kmole fuel that had a different mole composition and was mixed with air, causing different values of excess oxygen, see Figure 2:
one kmole fuel with x kmole H2 and (1 − x) kmole CH4 was considered;
the air required for combustion was evaluated using the imposed hydrogen ratio in one kmole fuel, x, and excess oxygen, exo, respectively: (1 + exo)·(2 − 1.5·x) kmole O2 and 3.7619·(1 + exo)·(2 − 1.5·x) kmole N2;
the imposed x and exo: x = (0, 0.25, 0.5, 0.75, 1), and exo = (0, 0.25, 0.5, 0.75, 1, 1.5, 2);
the volumetric compression ratio: π12 = V2/V1 = 10.
The parameters for the state 2 were evaluated using Equations (1)–(3).
Isentropic exponent: k 12 = r C H 4 · ( h 2 , C H 4 h 1 , C H 4 ) + r H 2 · ( h 2 , H 2 h 1 , H 2 ) + r O 2 · ( h 2 , O 2 h 1 , O 2 ) + r N 2 · ( h 2 , N 2 h 1 , N 2 ) r C H 4 · ( u 2 , C H 4 u 1 , C H 4 ) + r H 2 · ( u 2 , H 2 u 1 , H 2 ) + r O 2 · ( u 2 , O 2 u 1 , O 2 ) + r N 2 · ( u 2 , N 2 u 1 , N 2 )
Isentropic compression with ending temperatures ,   T 2   and   T 1 : T 2 = T 1 · π 12 k 12 1 ,       T 1 = 298   K
Isentropic compression with ending pressures ,   p 2   and   p 1 : p 2 = p 1 · π 12 k 12 ,           p 1 = 1   bar
where r is a mole fraction in the mixture CH4/H2/air (kmole/kmole); h = h(T) − h(298K) is a relative physical enthalpy in the mixture, see Table 1; and u = h − R·(T − 298), (kJ/kmole) is a relative internal energy in the mixture; R = 8.3145 kJ/kmole·K, is the universal constant of ideal gas.

2.3. The Closed Constant-Volume Combustion

The closed constant-volume combustion involves in two successive steps, see Figure 3 and Figure 4.
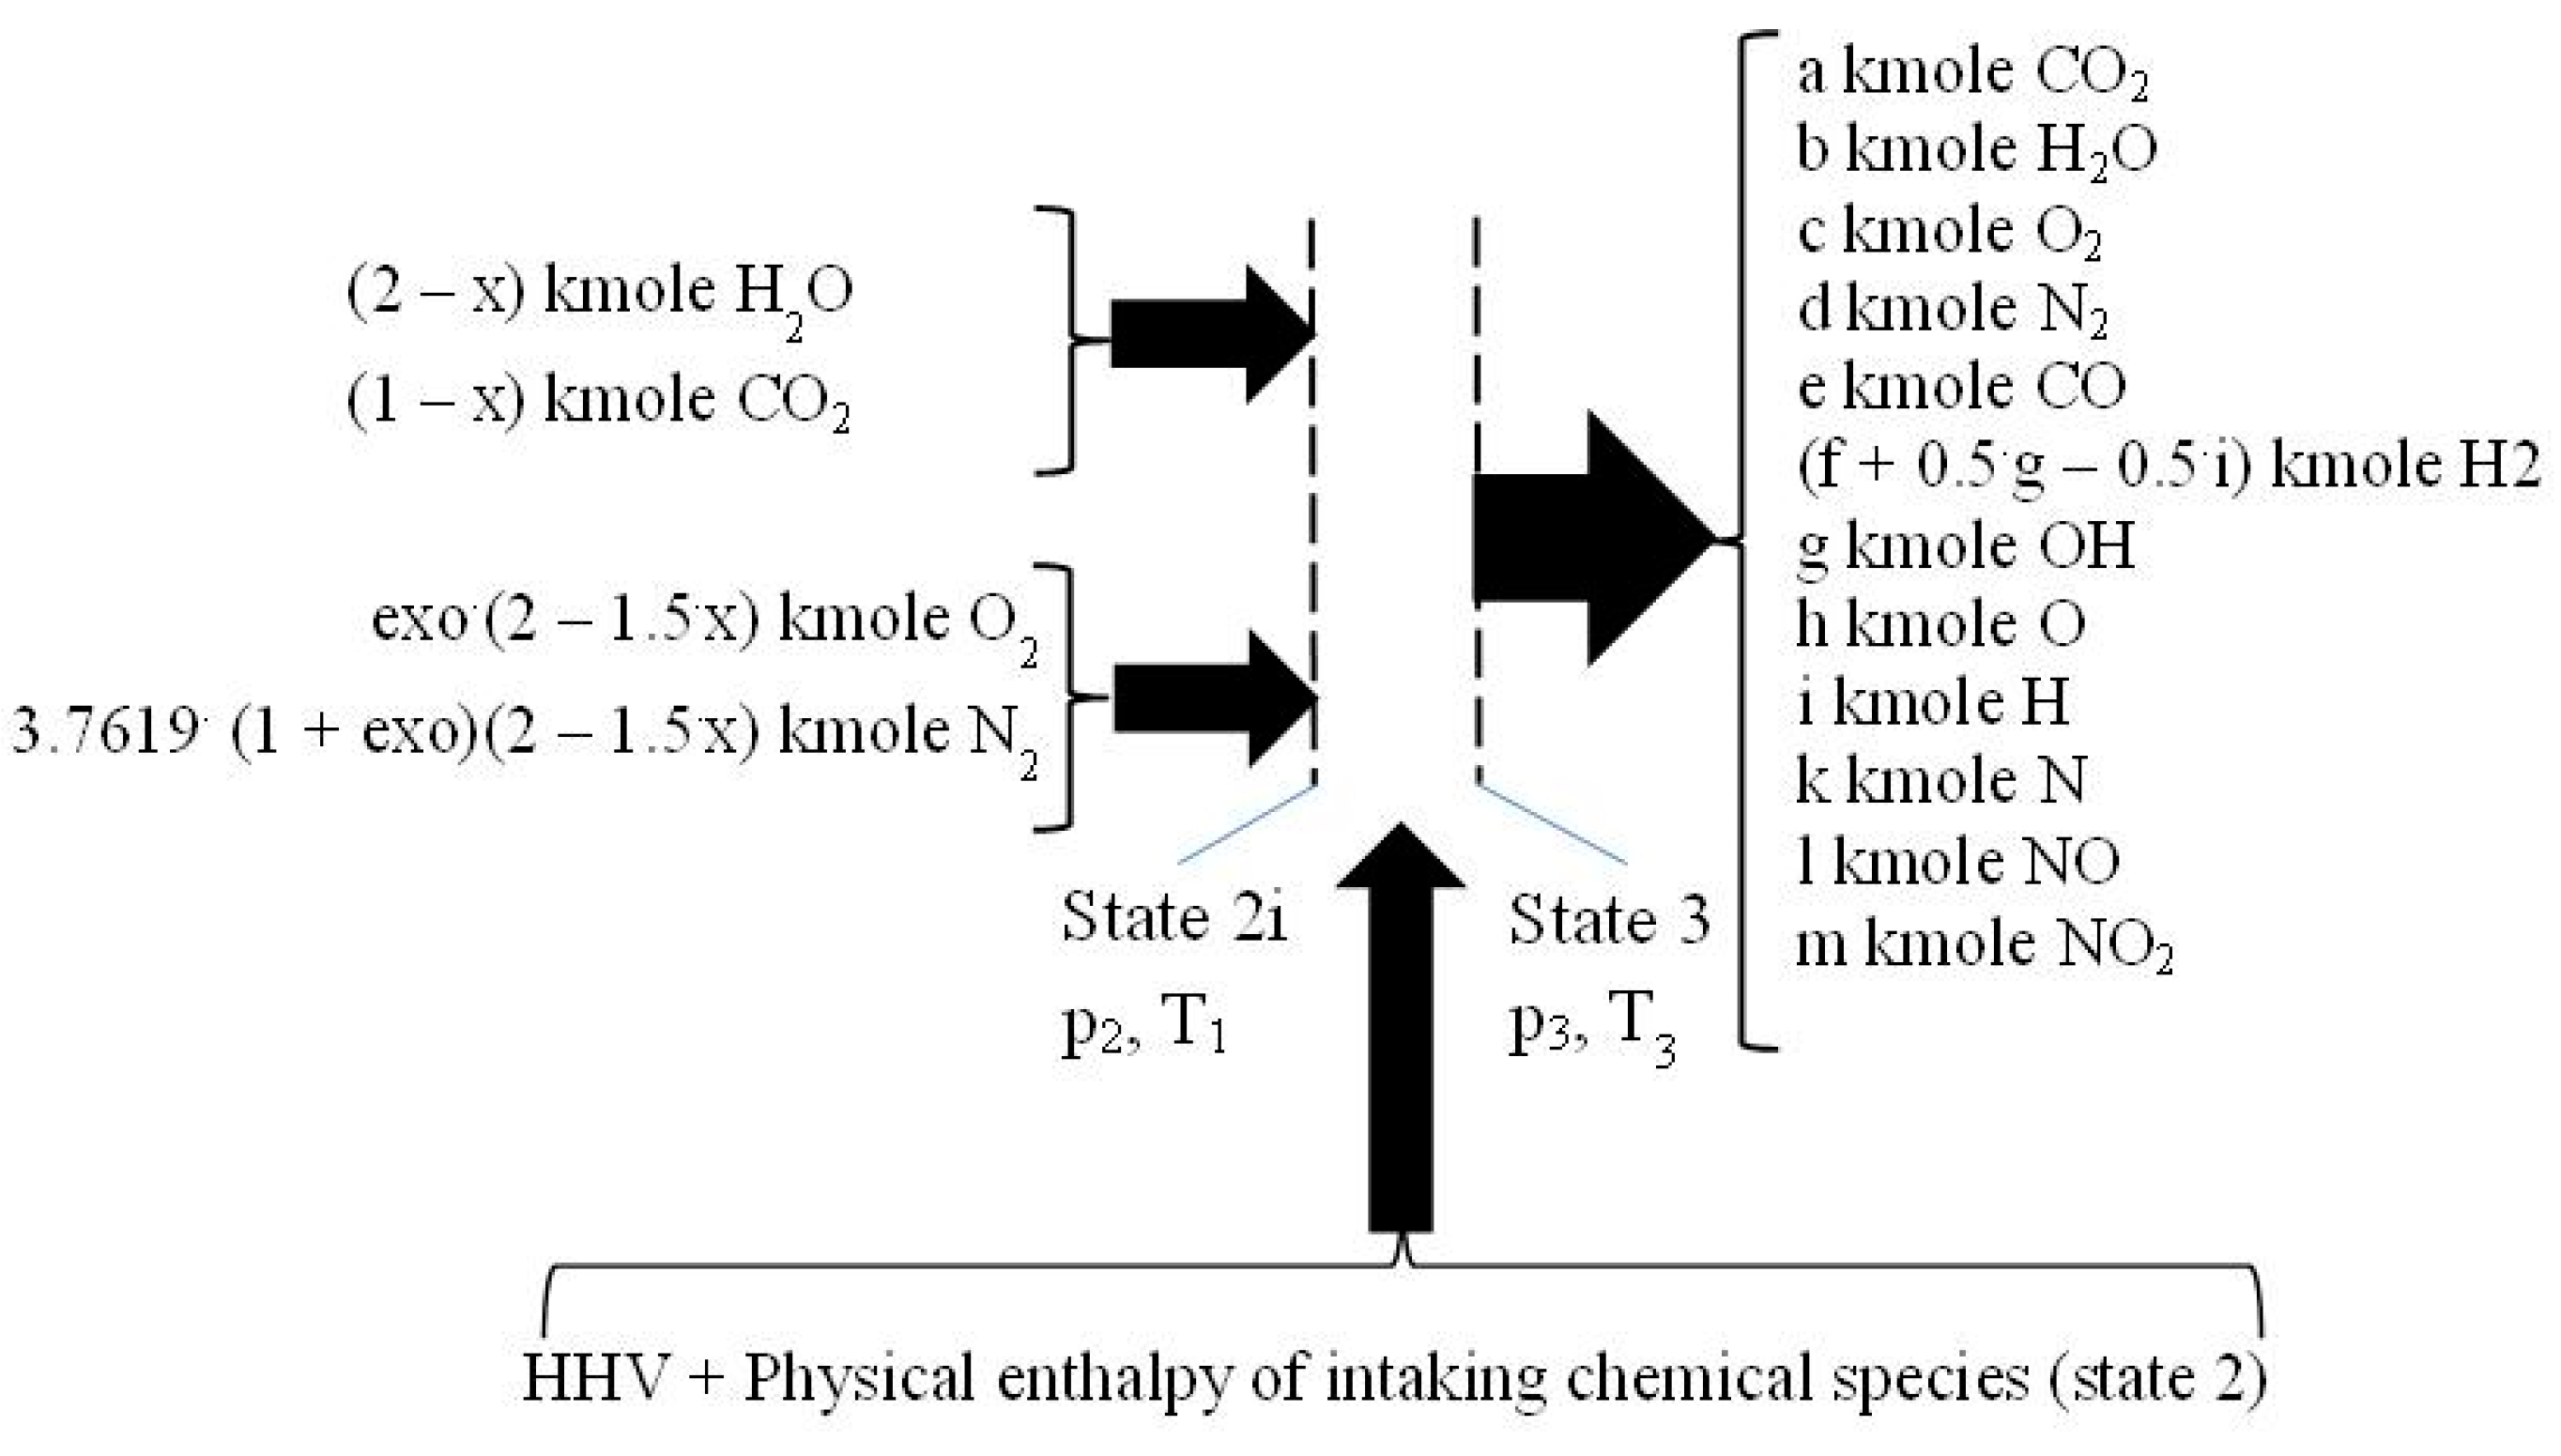
The first step is conceived as a constant pressure cooling from T2 to reference temperature of 298 K followed by a combustion without dissociation, at constant pressure, p2, and constant temperature, T1, giving as a result the energy input for the second step, respectively the higher heating value (HHV), and the physical enthalpy of intaking chemical species (ph), see Figure 3.
The chemical reactions pertaining to this first step are those of the direct oxidation of the fuel:
(1 − x)CH4 + 2·(1 − x)O2 → (1 − x)CO2 +2·(1 − x)H2O
xH2 + 0.5·xO2xH2O
The HHV was evaluated by the enthalpies of formation of involved chemical species, hf0, see Table 2.
H H V = ( 1 x ) · h f 0 , C H 4 ( 1 x ) · h f 0 , C O 2 ( 2 x ) · h f 0 , H 2 O ( kJ / kmole   fuel )
The physical enthalpy, ph, of intaking chemical species was given by fictitious constant pressure cooling of the intaking gases up to reference temperature T1 = 298 K.
ph = x·h2,H2 + (1 − xh2,CH4 + (1 + exo)·(2 − 1.5xh2,O2 + 3.6719·(1 + exo)·(2 − 1.5xh2,N2 (kJ/kmole fuel)
where the physical enthalpies of intaking gases correspond to T2.
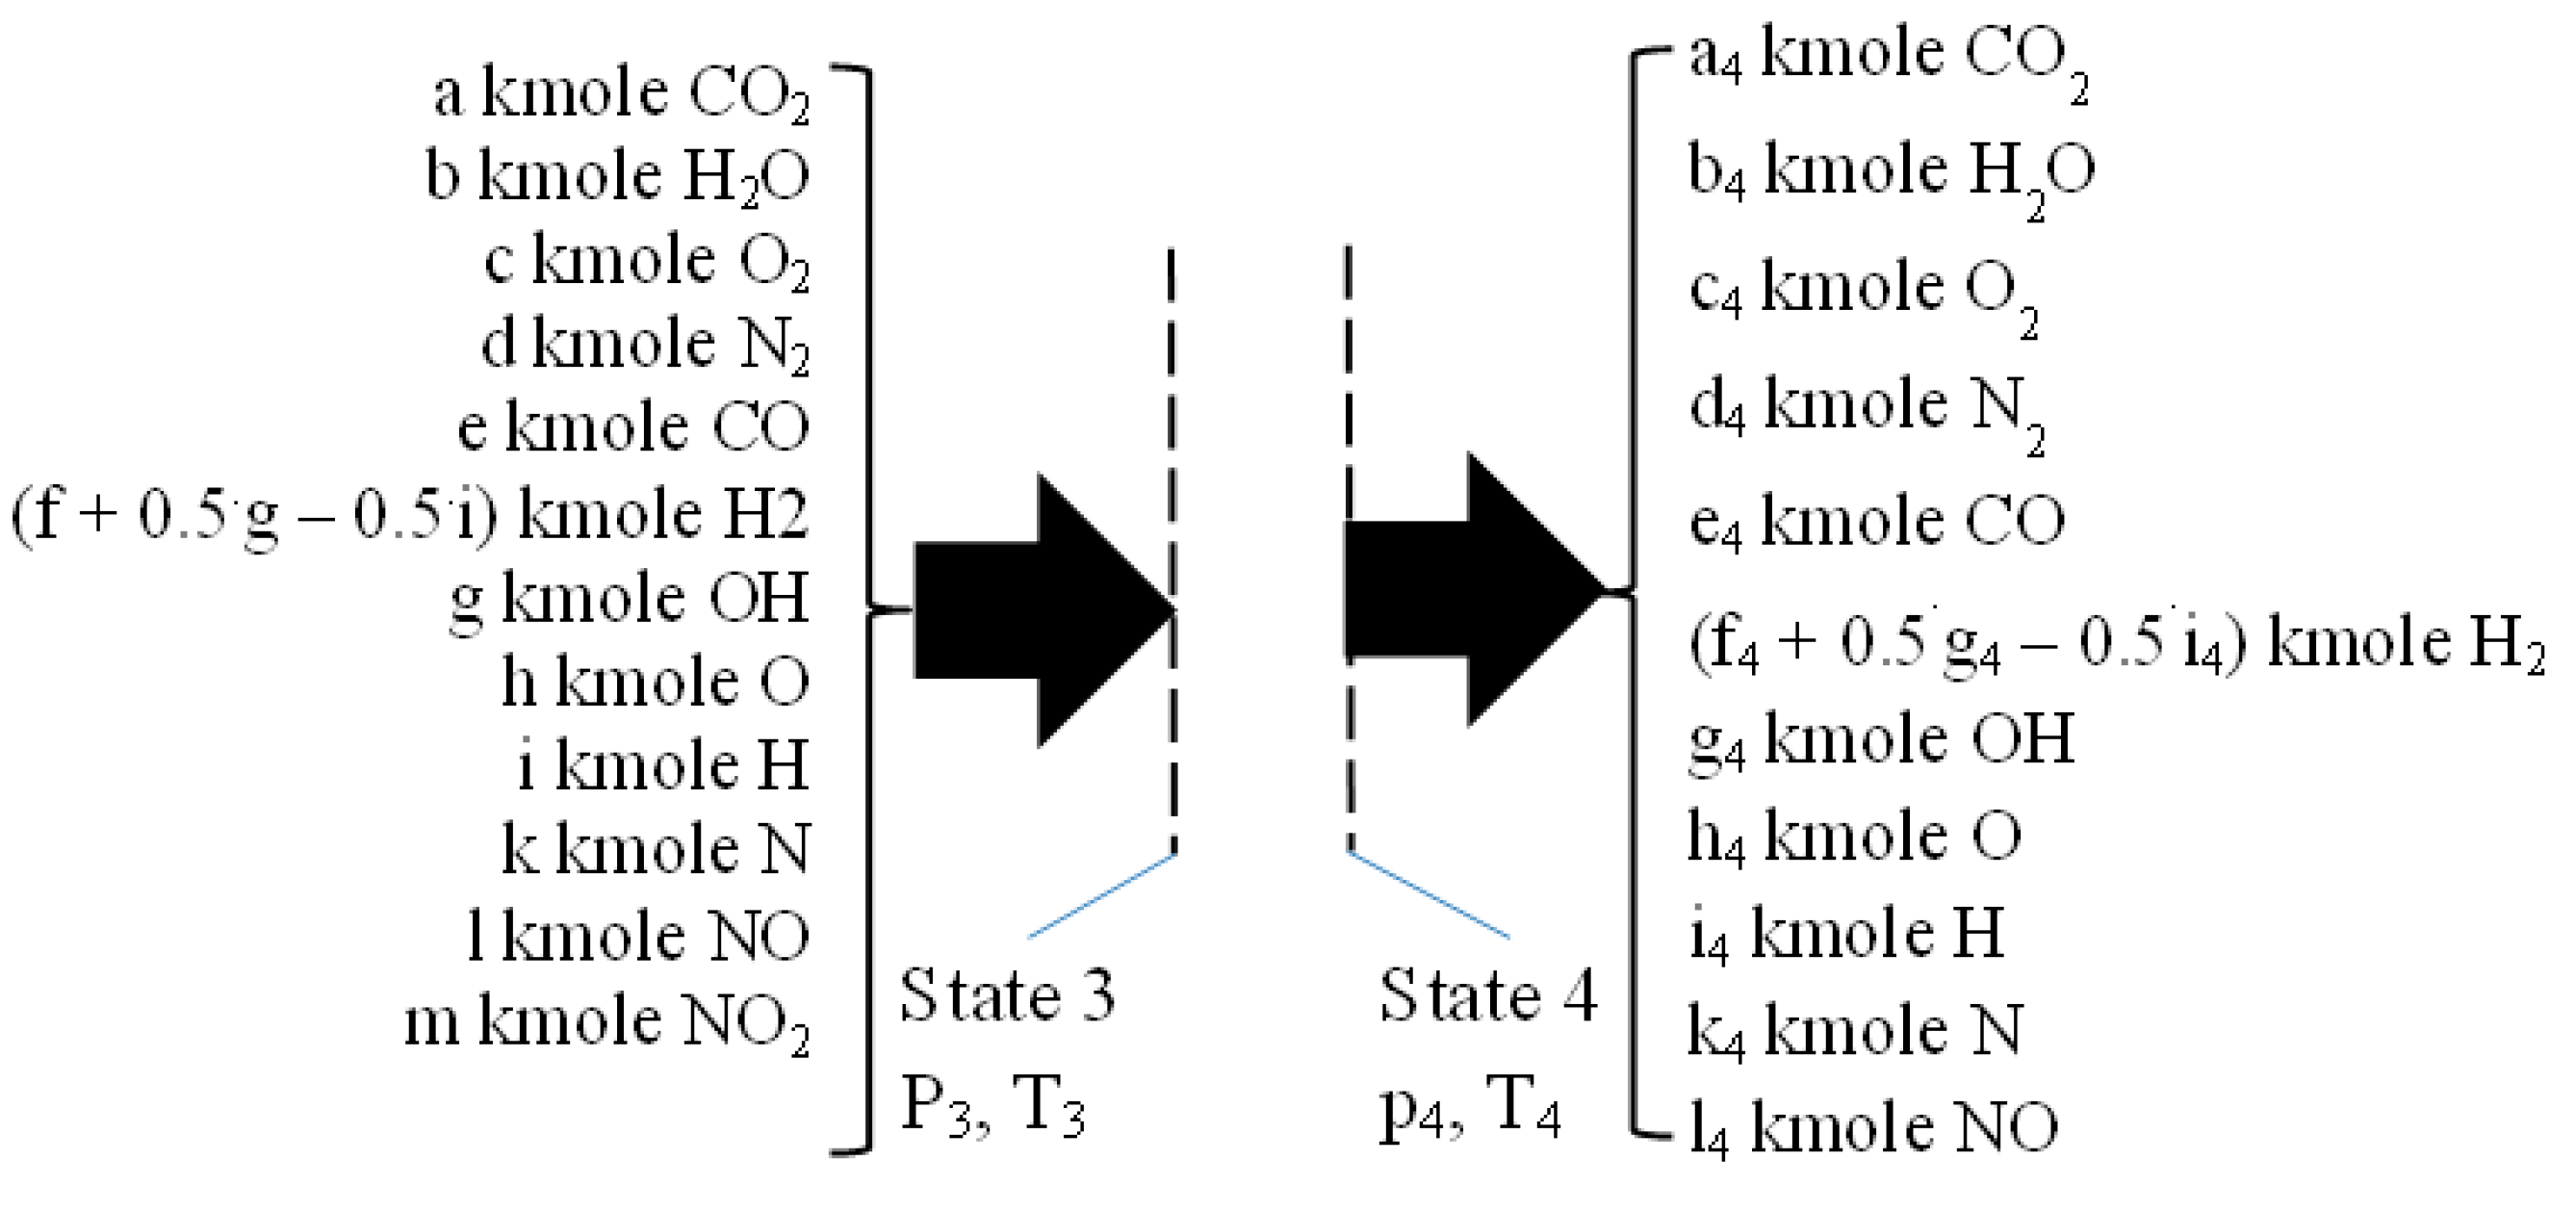
The second step of constant-volume combustion, 2i–3, consumes the energy released in the first step, HHV an ph, to finish the constant-volume combustion by a complex process of heating with dissociation of initial flue gas resulting from the first step, see Figure 4. The inlet chemical species have the temperature T1 and pressure p2. The outlet temperature and pressure, T3 and p3, were computed using the mass and energy conservation laws, and the Mendeleev–Clapeyron state equation.
The second step of combustion comprises the following dissociation and of recombination reactions of:
e CO2 → e CO + 0.5 e O2
0.5g H2O → 0.5g H2 + g OH
f H2O → f H2 + 0.5f O2
0.5h O2 → h O
0.5k N2 → k N
0.5i H2 → i H
0.5l N2 + 0.5 O2 → i NO
0.5m N2 + m O2 → m NO2
The mass balance equations include the below explained ones:
four equations related to the balance of the kmole numbers of major chemical species, such as CO2, H2O, O2, and N2;
eight equations interrelating all chemical species through chemical equilibrium relations;
one mass balance for the whole process 2i − 3.
The balance of the kmole numbers of major chemical species are given as:
a = (1 − x) − e (kmole CO2)
b = (2 − x) − g − f (kmole H2O)
c = exo·(2 − 1.5·x) + 0.5·e + 0.5·f − 0.5·h − 0.5·l − m (kmole O2)
d = 3.7619·(1 + exo)·(2 − 1.5·x) − 0.5·k − 0.5·l − 0.5·m (kmole N2)
where e, f, g, h, i, k, l, m are the kmole involved in chemical reactions (8) to (15).
For the chemical reaction νAA + νBB → νCC + νDD, the equilibrium constant is
K = y C ν C · y D ν D y A ν A · y B ν B · P ν C + ν D ν A ν B ,   where   P = r e a c t i o n   p r e s s u r e n o r m a l   p r e s s u r e   ( 0.1   MPa )
The natural logarithms of chemical equilibrium constants for P = 1 were interpolated by polynomials of seventh order, see Table 3, using values from [28] (p. 773).
The following are the equations interrelating all chemical species through chemical equilibrium relations:
exp ( ln ( K 1 ) ) = e 2 c a 2 P for   Equation   ( 8 )
exp ( ln ( K 2 ) ) = ( f + 0.5 g 0.5 i ) g 2 b 2 P for   Equation   ( 9 )
exp ( ln ( K 3 ) ) = ( f + 0.5 g 0.5 i ) 2 c b 2 P for   Equation   ( 10 )
exp ( ln ( K 4 ) ) = h 2 c P for   Equation   ( 11 )
exp ( ln ( K 5 ) ) = k 2 d P for   Equation   ( 12 )
exp ( ln ( K 6 ) ) = i 2 ( f + 0.5 g 0.5 i ) P for   Equation   ( 13 )
exp ( ln ( K 7 ) ) = l 2 d c for   Equation   ( 14 )
exp ( ln K 8 ) ) = m 2 d c 2 1 P for   Equation   ( 15 )
The mass balance for the combustion step 2 full process of 2i − 3:
2 · x + 16 · ( 1 x ) + 32 · ( 1 + e x o ) · ( 2 1.5 · x ) + 120.3808 · ( 1 + e x o ) · ( 2 1.5 · x ) = 44 · a + 16 · b + 32 · c + 28 · d + 28 · e + 2 · ( f + 0.5 · g 0.5 · i ) + 17 · g + 14 · k + h + 30 · l + 46 · m
The energy balance equation:
H H V + p h = [ a · ( u f 0 , C O 2 + u 3 , C O 2 ) ( 1 x ) · u f 0 , C O 2 ] + [ b · ( u f 0 , H 2 O + u 3 , H 2 O ) ( 2 x ) · u f 0 , H 2 O ] + c · u 3 , O 2 + d · u 3 , N 2 + e · ( u f 0 , C O + u 3 , C O ) + ( f + 0.5 · g 0.5 · i ) · u 3 , H 2 + g · ( u f 0 , O H + u 3 , O H ) + h · ( u f 0 , O + u 3 , O ) + i · ( u f 0 , H + u 3 , H ) + k · ( u f 0 , N + u 3 , N ) + l · ( u f 0 , N O + u 3 , N O ) + m · ( u f 0 , N O 2 + u 3 , N O 2 )
The Mendeleev–Clapeyron state equation for gaseous mixtures:
p · V = ( n i ) · R · T V = c o n s t .   p 3 p 2 = T 3 T 2 · ( n i ) 3 ( n i ) 2 = T 3 T 2 · a + b + c + d + e + ( f + 0.5 · g 0.5 · i ) + g + h + k + l + m x + ( 1 x ) + ( 1 + e x o ) · ( 2 1.5 · x ) + 3.8619 · ( 1 + e x o ) · ( 2 1.5 · x )

2.4. Isentropic Expansion 3–4

During isentropic expansion, see Figure 5, the chemistry of flue gas is also prevailing due to high temperatures and pressures, and therefore, the composition of flue gas is changing by variable temperature and pressure. This process was solved by defining a proper isentropic exponent quantifying the variable chemical composition of flue gas. The equations defining a reactive isentropic expansion allowed for the evaluation of the parameters of state 4. These parameters were evaluated through Equations (31)–(33) and examine the flue gas composition through two computational loops regarding the relationship composition of temperature and pressure, which are similar to those in the case of constant-volume combustion, step 2.
Isentropic   exponent   k 34 = H 34 U 34   where H 34 = [ a 4 · ( h f 0 , C O 2 + h 4 , C O 2 ) a · ( h f 0 , C O 2 + h 3 , C O 2 ) ] + [ b 4 · ( h f 0 , H 2 O + h 4 , H 2 O ) b · ( h f 0 , H 2 O + h 3 , H 2 O ) ] + ( c 4 · h 4 , O 2 c · h 3 , O 2 ) + ( d 4 · h 4 , N 2 d · h 3 , N 2 ) + [ e 4 · ( h f 0 , C O + h 4 , C O ) e · ( h f 0 , C O + h 3 , C O ) ] + [ ( f 4 + 0.5 · g 4 0.5 · i 4 ) · h 4 , H 2 ( f + 0.5 · g 0.5 · i ) · h 3 , H 2 ] + [ g 4 · ( h f 0 , O H + h 4 , O H ) a · ( h f 0 , O H + h 3 , O H ) ] + [ h 4 · ( h f 0 , C O 2 + h 4 , O ) h · ( h f 0 , O + h 3 , O ) ] + [ i 4 · ( h f 0 , H + h 4 , H ) i · ( h f 0 , H + h 3 , H ) ] + [ k 4 · ( h f 0 , N + h 4 , N ) k · ( h f 0 , N + h 3 , N ) ] + [ l 4 · ( h f 0 , N O + h 4 , N O ) l · ( h f 0 , N O + h 3 , N O ) ] + [ m 4 · ( h f 0 , N O 2 + h 4 , N O 2 ) m · ( h f 0 , N O 2 + h 3 , N O 2 ) ] U 34 = [ a 4 · ( u f 0 , C O 2 + u 4 , C O 2 ) a · ( u f 0 , C O 2 + u 3 , C O 2 ) ] + [ b 4 · ( u f 0 , H 2 O + u 4 , H 2 O ) b · ( u f 0 , H 2 O + u 3 , H 2 O ) ] + ( c 4 · u 4 , O 2 c · u 3 , O 2 ) + ( d 4 · u 4 , N 2 d · u 3 , N 2 ) + [ e 4 · ( u f 0 , C O + u 4 , C O ) e · ( u + u 3 , C O ) ] + [ ( f 4 + 0.5 · g 4 0.5 · i 4 ) · u 4 , H 2 ( f + 0.5 · g 0.5 · i ) · u 3 , H 2 ] + g 4 · u f 0 , O H + u 4 , O H g · u f 0 , O H + u 3 , O H + h 4 · u f 0 , C O 2 + u 4 , O h · u f 0 , O + u 3 , 0 + i 4 · u f 0 , H + u 4 , H i · u f 0 , H + u 3 , H + k 4 · u f 0 , N + u 4 , N k · u f 0 , N + u 3 , N + l 4 · u f 0 , N O + h 4 , N O l · u f 0 , N O + u 3 , N O + m 4 · u f 0 , N O 2 + u 4 , N O 2 m u f 0 , N O 2 + u 3 , N O 2
Isentropic compression ending temperatures ,   T 3   and   T 4 T 4 = T 3 · ( 1 π 12 ) k 34 1 ,       T 3   p r e v i o u s l y   c o m p u t e d ,   c o m b u s t i o n   s t e p   2  
Isentropic compression ending temperatures ,   p 3   and   p 4 p 4 = p 3 · ( 1 π 12 ) k 34 ,           p 3   p r e v i o u s l y   c o m p u t e d ,   c o m b u s t i o n   s t e p   2

2.5. The Flue Exhaust Process 4–5

This process, See Figure 6, is considered as a throttling one, i.e., described by constant enthalpy. The ideal gas model was used and thus it is supposed that the temperature is almost constant because the composition variation of flue gas is not significant.
This simplified approach allowed for the evaluation of the final composition of state 5 only on the basis of the mass conservation law given by known values of chemical equilibrium constants for T5 = T4 and p5 = 1 bar.

3. The Numerical Solving and Results

3.1. Numerical Solving

The isentropic compression can be solved through a proper mathematical procedure, the simplest of which is an iterative trial and error method and, is very easily resolved because the cylinder intaking fluid has a constant composition.
The closed constant-volume combustion, second step, must use two iterative loops, one for flue gas composition, and the other for final temperature and pressure. The first step considers the constant-volume heating of flue gas without dissociation in order to preliminarily determine the temperature and pressure of state 3 through the energy conservation law and the Mendeleev–Clapeyron state relation. These parameters allowed for the evaluation of the first computational composition of flue gas in state 3 by mass conservation law. This new flue gas composition in state 3 allowed for the re-evaluation of temperature and pressure of state 3 using the energy conservation law and Mendeleev-Clapeyron state equation. The iterative loops end when the difference between two successive steps causes an imposed error of computed parameters. The numerical results emphasized the behavior of variations in pollutants emissions (CO and NOx) and are in good qualitative agreement with other experiments that have been conducted
During expansion, the composition is changing, therefore, knowing the parameters of initial state 3, since they were previously computed, the parameters of state 4 were evaluated through Equations (31)–(33) by two computational loops regarding the relationship composition of temperature and pressure, similar procedure as in the case of constant-volume combustion, step 2.

3.2. Numerical Results

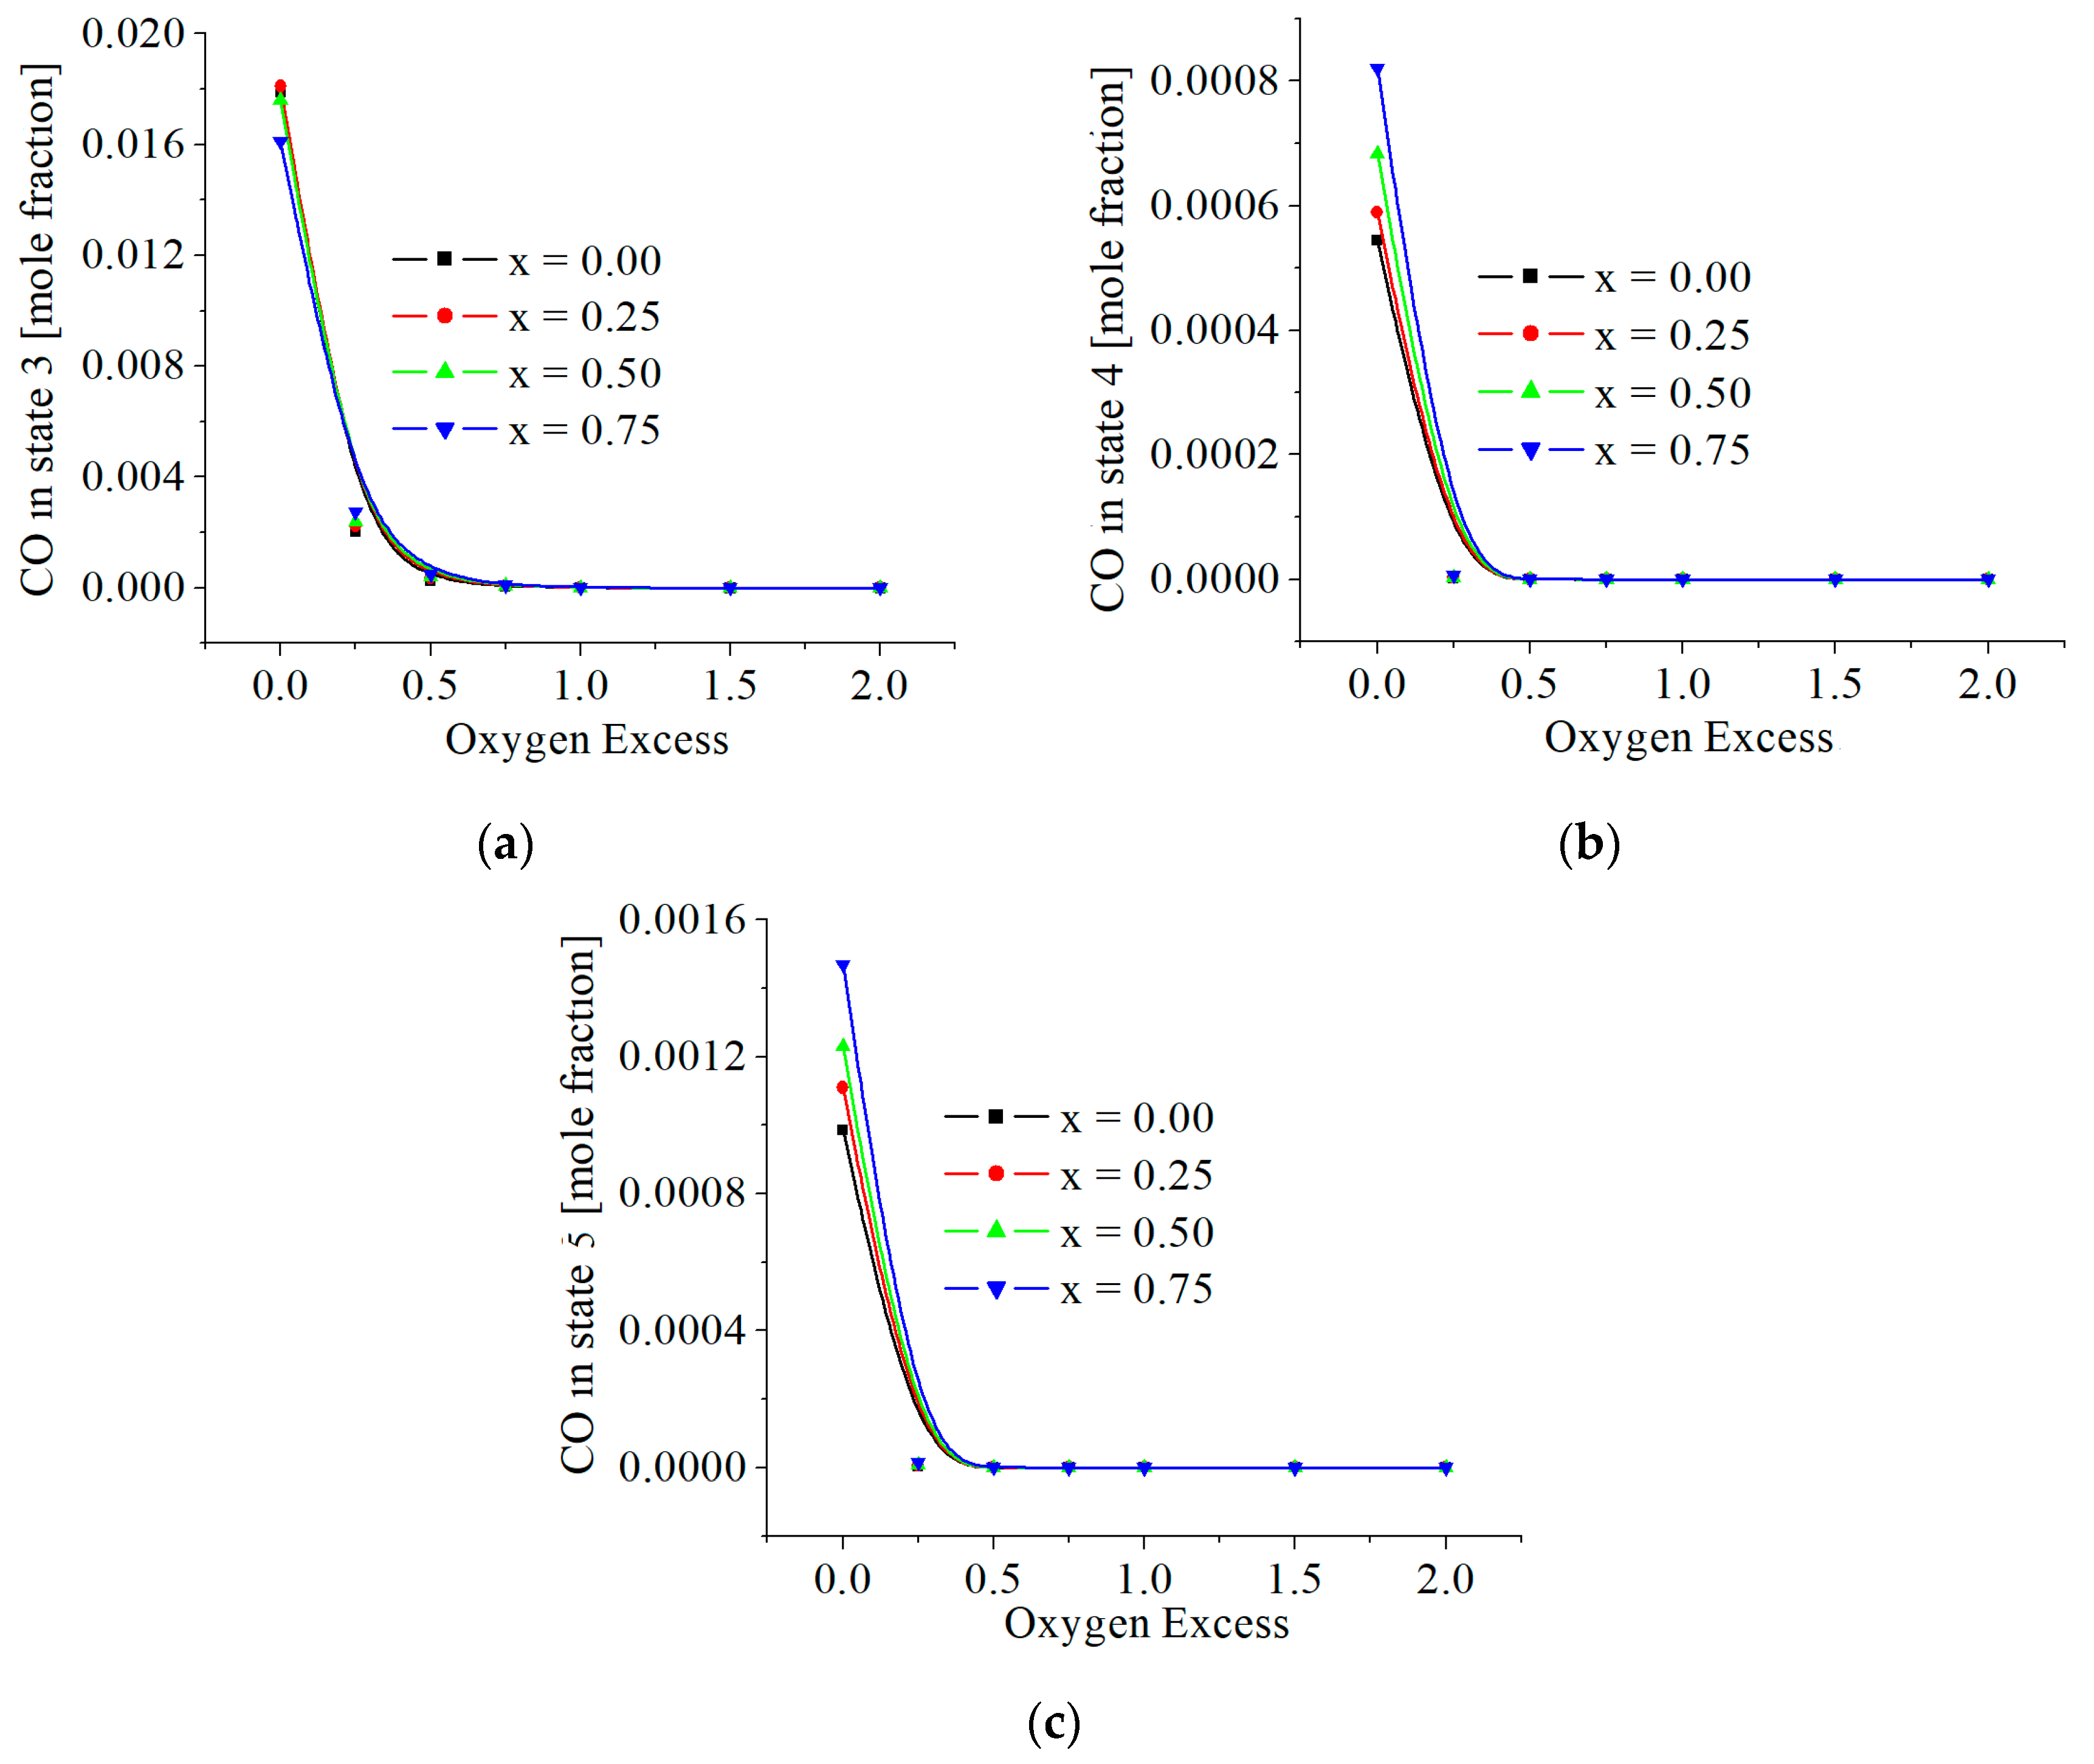
The values of CO mole fractions in flue gas are included in Figure 7. The maximum mass, ppm, found in state 5 is around 170 ppm (mg CO/kg flue gas) for exo = 0 and x = 0.75. The throttling, which decreases the pressure, almost doubles CO emissions for stoichiometric combustion (exo = 0). All numerical results showed that the presence of hydrogen very slightly increases CO emissions.
The values of NO are in Figure 8. The numerical results showed two influences of hydrogen. The first influence gives NO mole fractions proportional to the mole ratio of hydrogen in fuel. The second influence highlighted a peak in these emissions for 0 < exo < 0.5.
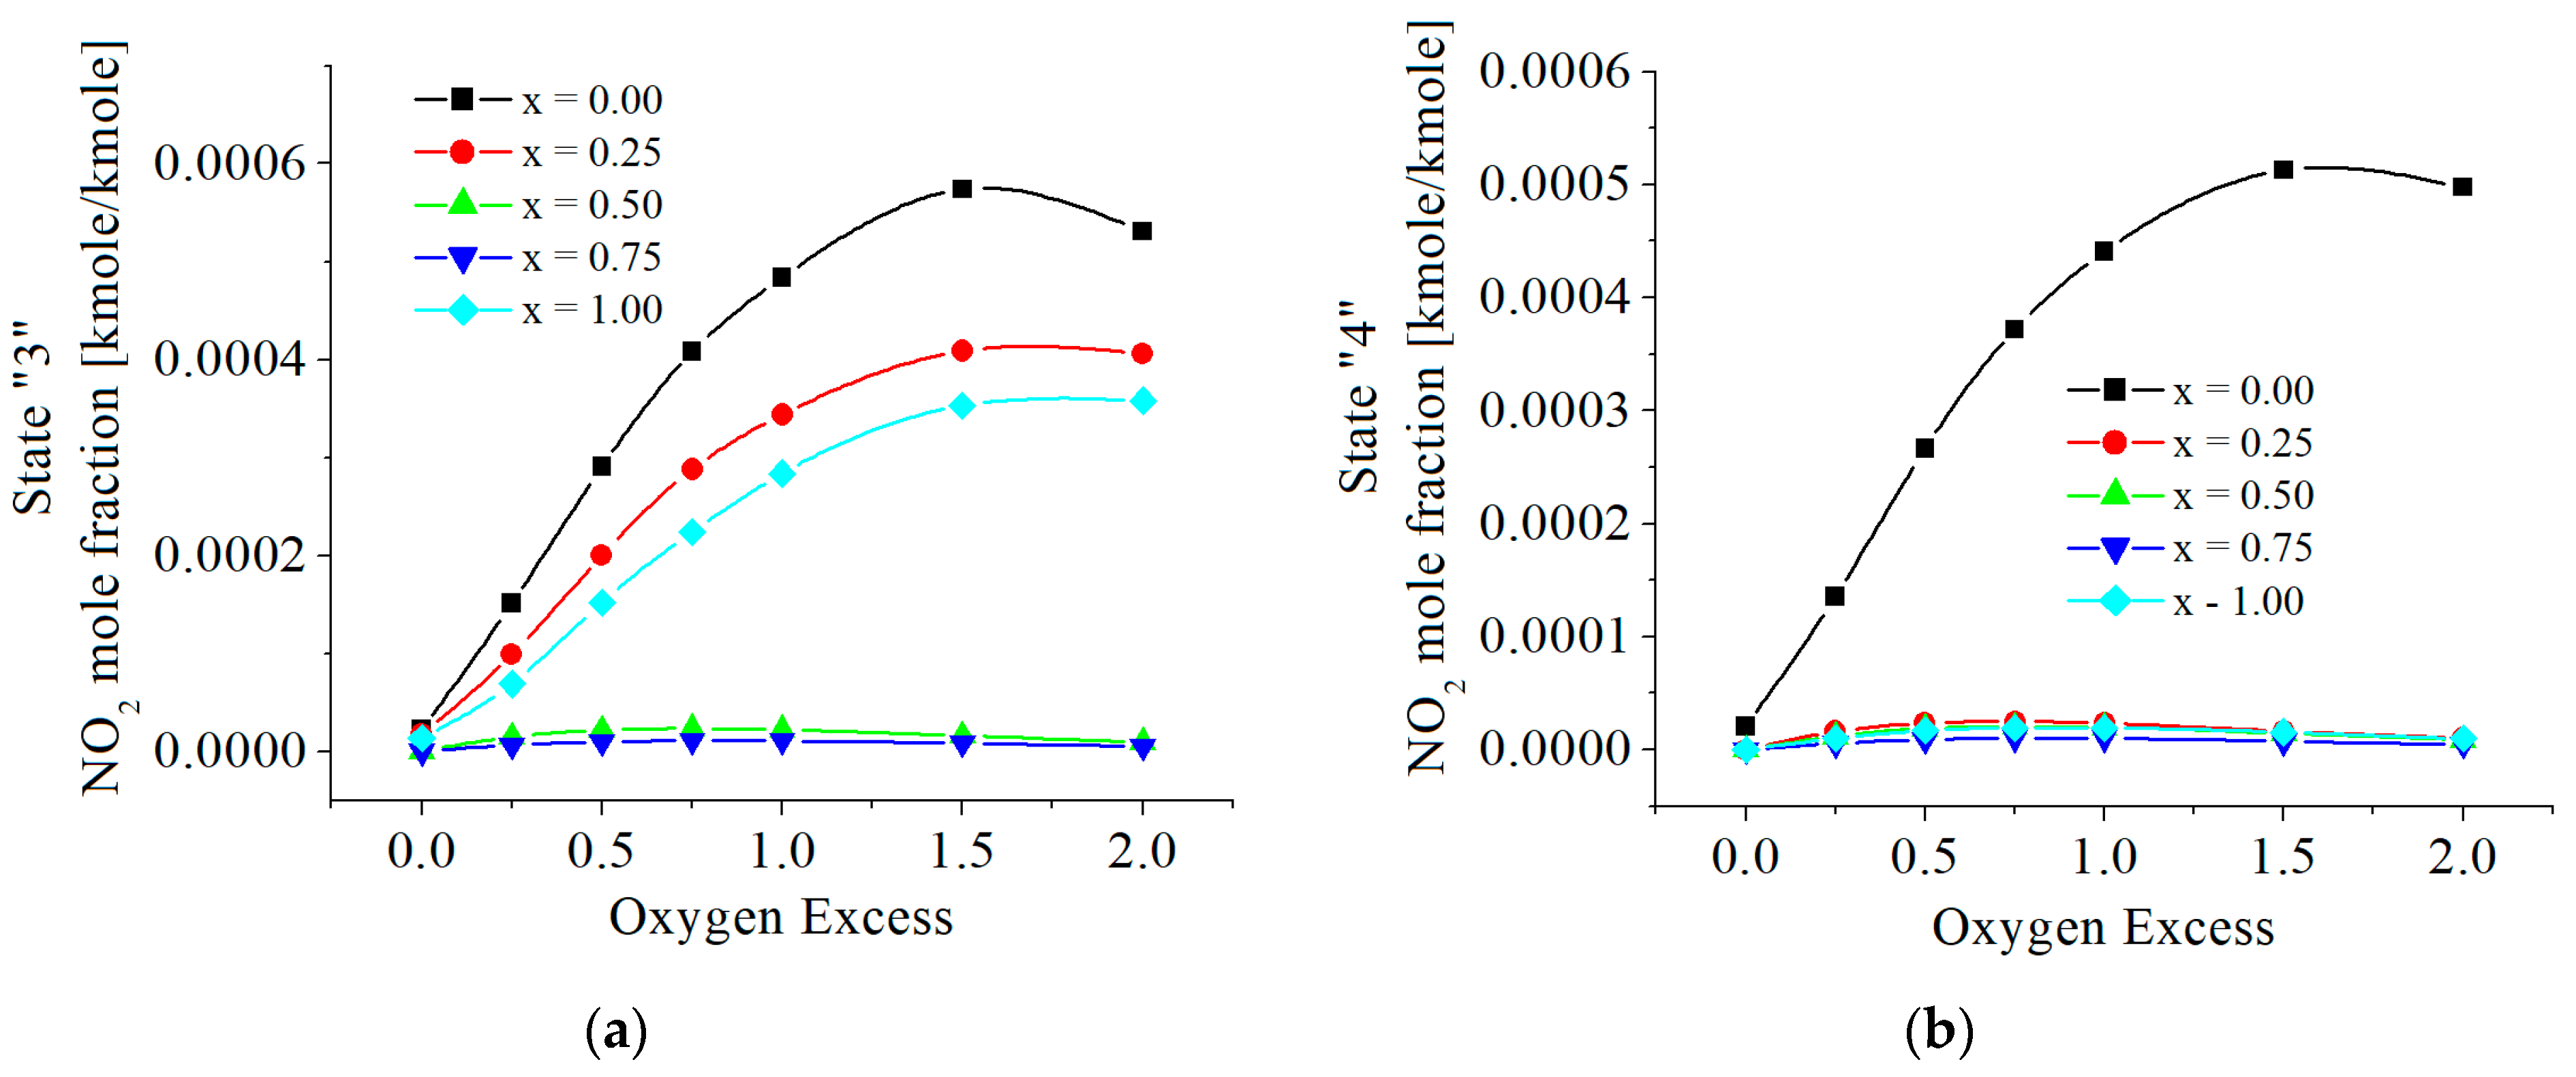
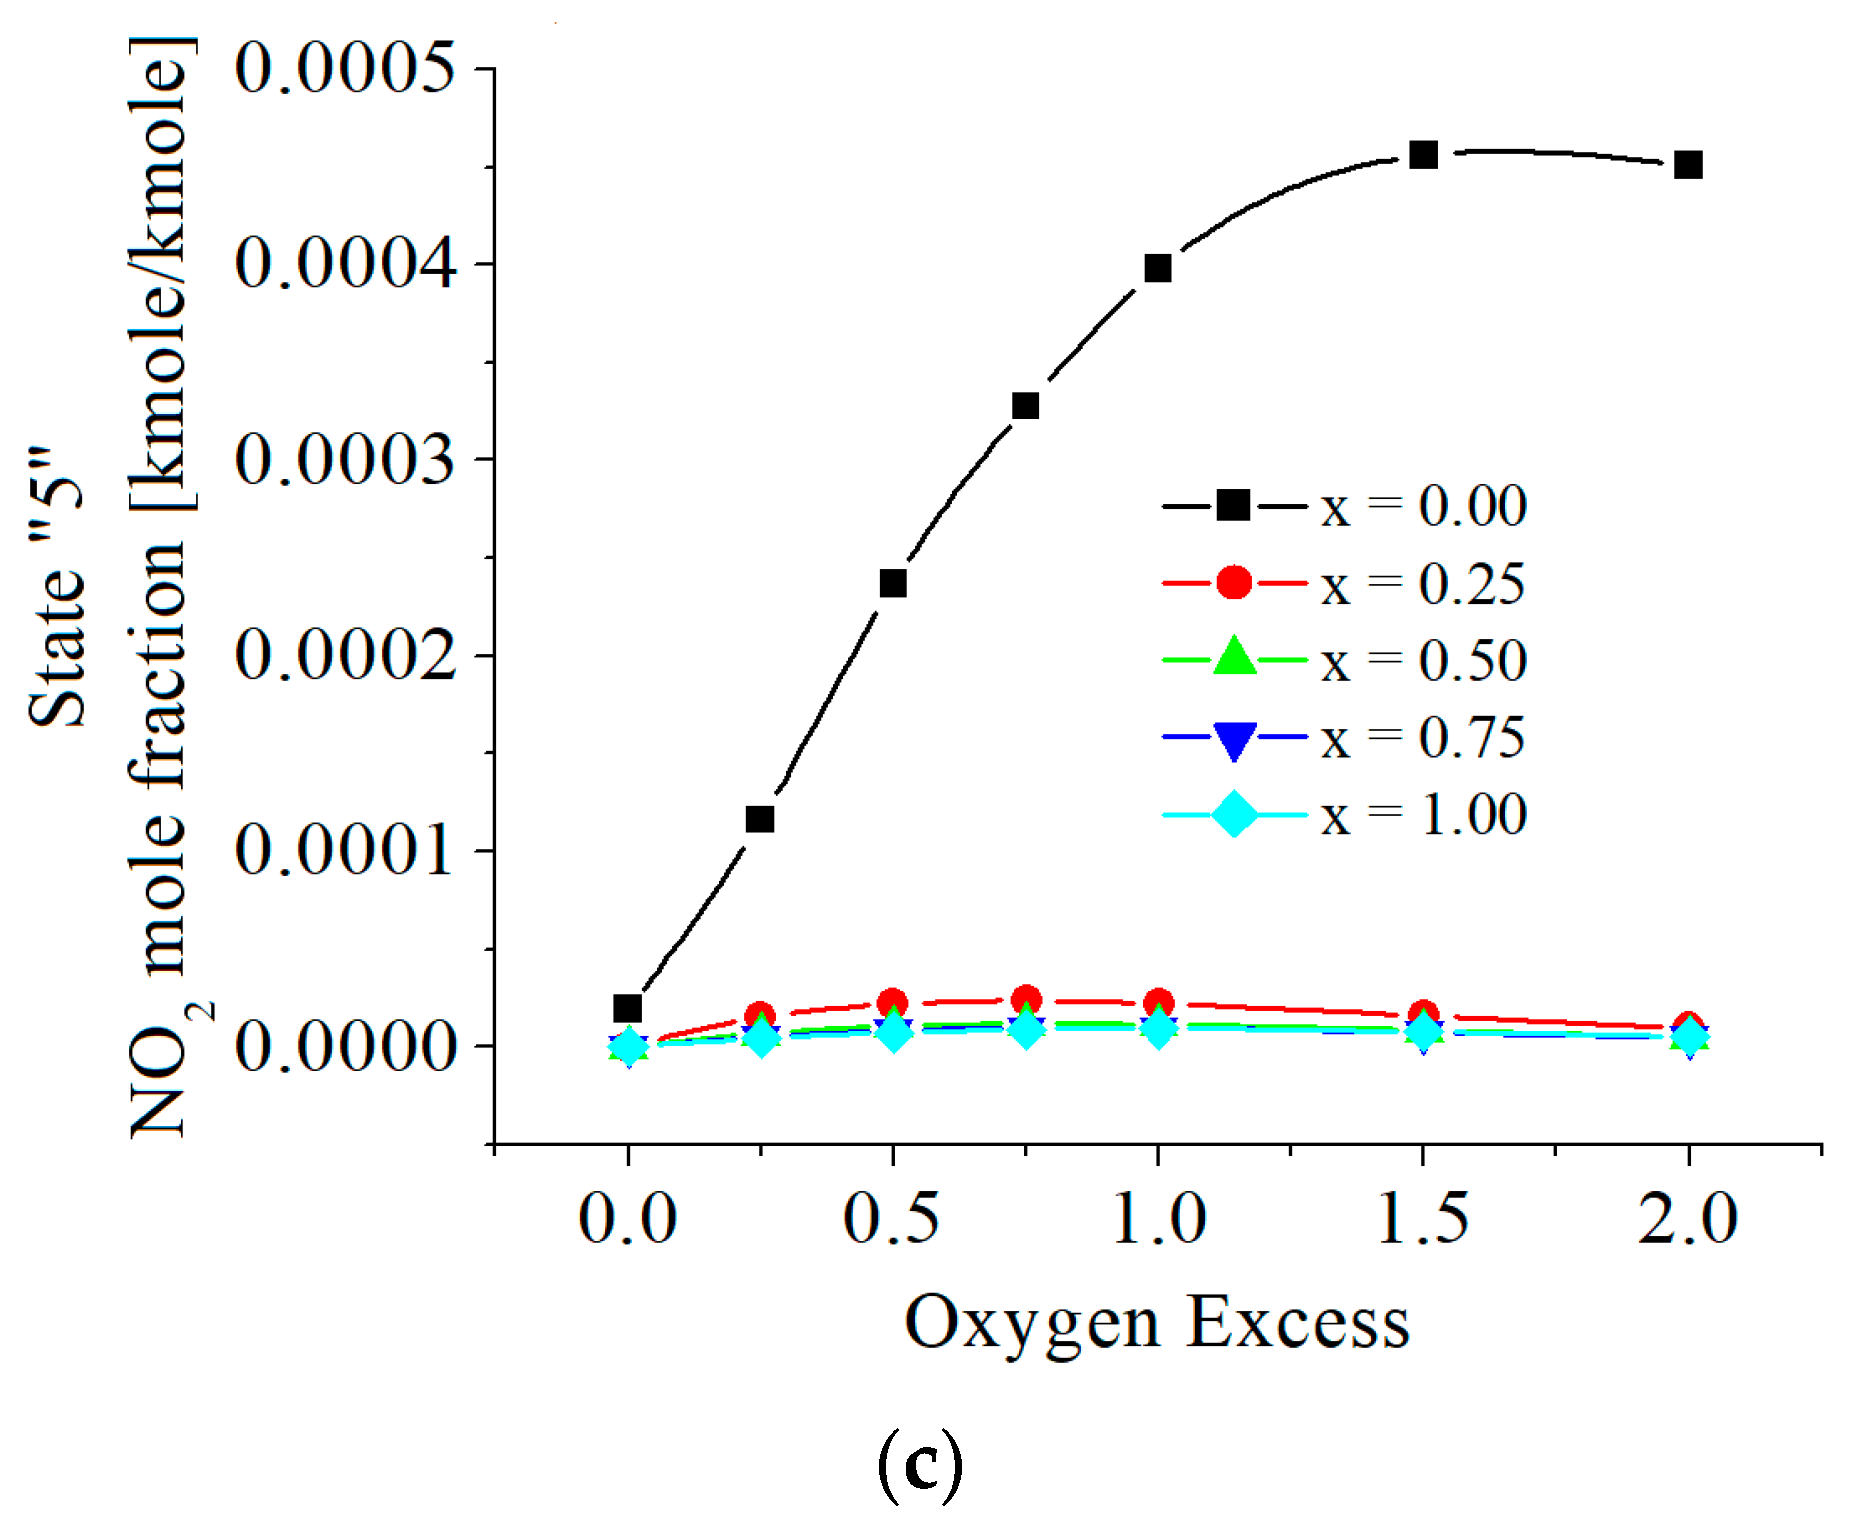
The values of NO2 are given in Figure 9. NO2 emissions decrease as the hydrogen mole fraction in the fuel increases, even more in the case of combustion without hydrogen. This is contrasting the emissions of NO. Similarly, NO2 emissions have a peak depending on the oxygen excess.
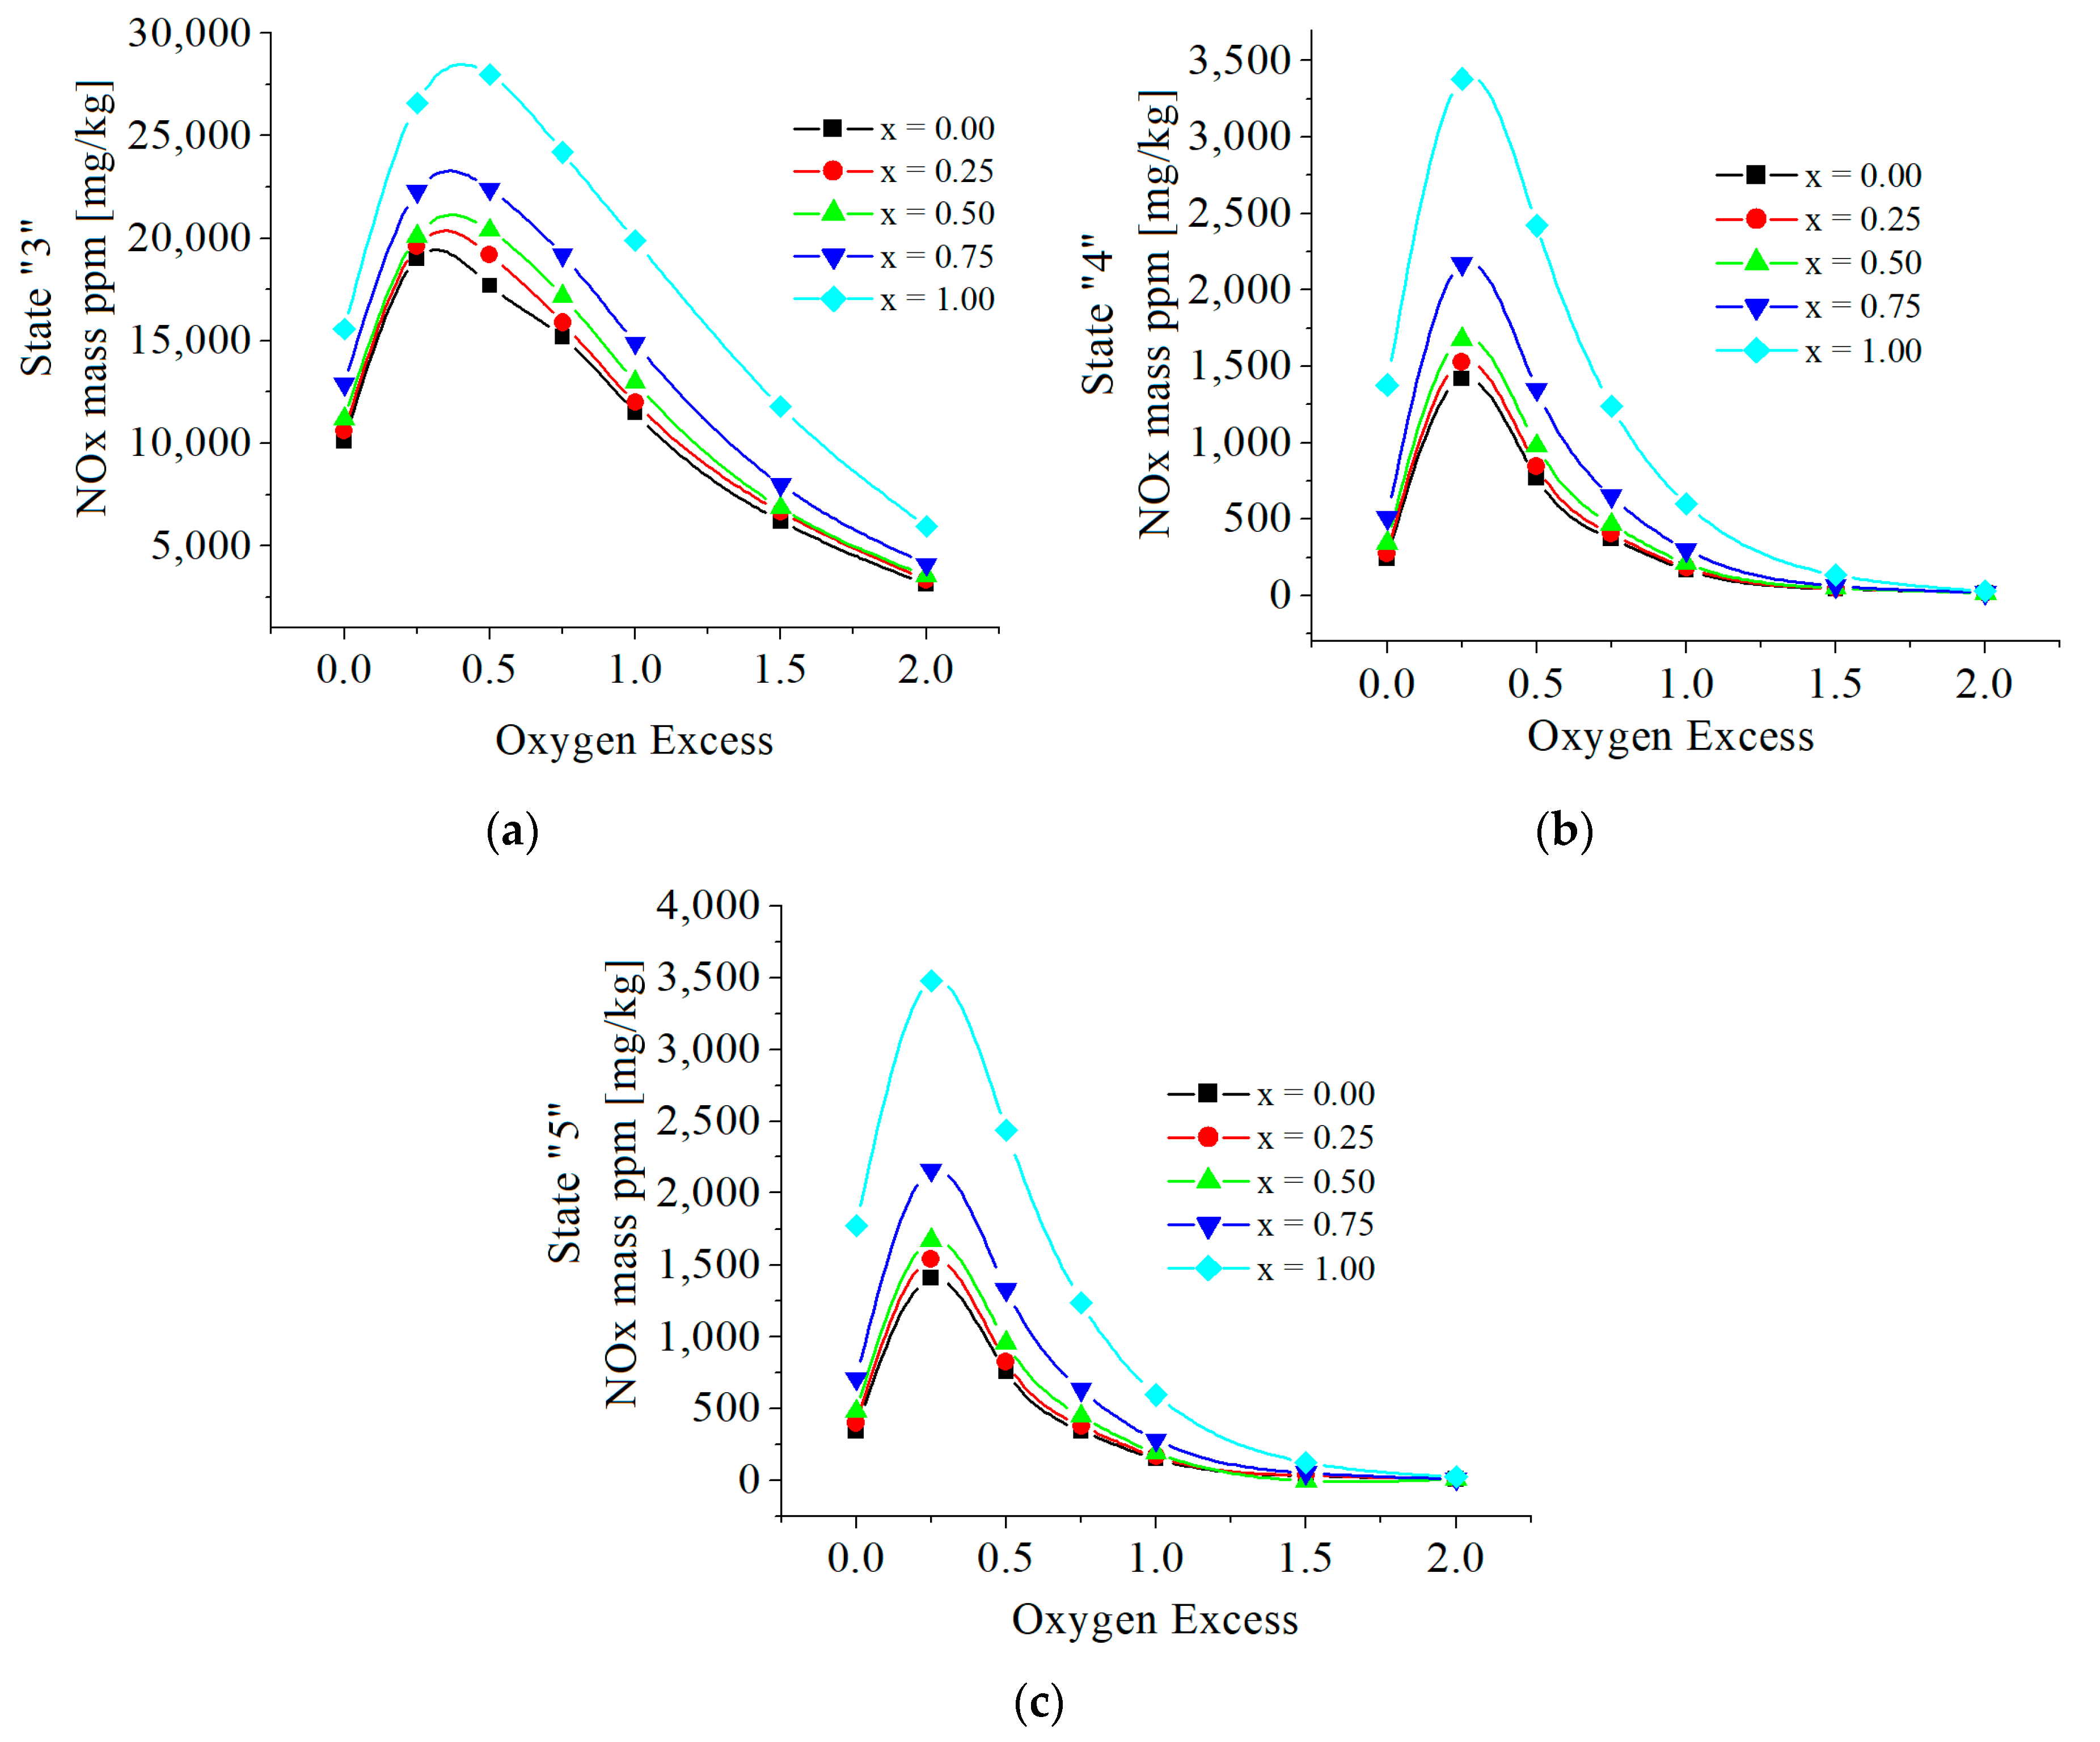
The cumulative values of NOx are given in Figure 10. The numerical results showed similar influences of hydrogen as is in the case of NO emissions because the values of NO are much bigger than those of NO2.
The chemical modeling revealed that all interrelated parameters have variable values depending on the hydrogen mole fraction in the fuel and, on the excess of oxygen, both imposed for a certain combustion process. The numerical results included also the temperatures and pressures in states 2, 3, 4, 5, and moreover the mole composition which refers to the so-called minor chemical species, such as H2, OH, H, O, and N.
The presence of hydrogen slightly modified the temperatures and pressures of states 2, 3 and 4; however, the values of x and exo notably modified the mole composition of minor chemical species, see Figure 11, Figure 12, Figure 13, Figure 14 and Figure 15.
The mole fractions of H2 in state 5 are significant for x = 0 and, by comparison, are more diminished when the fuel contains hydrogen and besides very marginally changed by the excess of oxygen, see Figure 11.
The mole fractions of OH in state 5 are relatively small, and they increase when x increases and decrease when exo decreases, see Figure 12.
The mole fractions of H are directly proportional to x and inversely proportional to exo, and shows a maximum when 0 < exo < 0.5, see Figure 13.
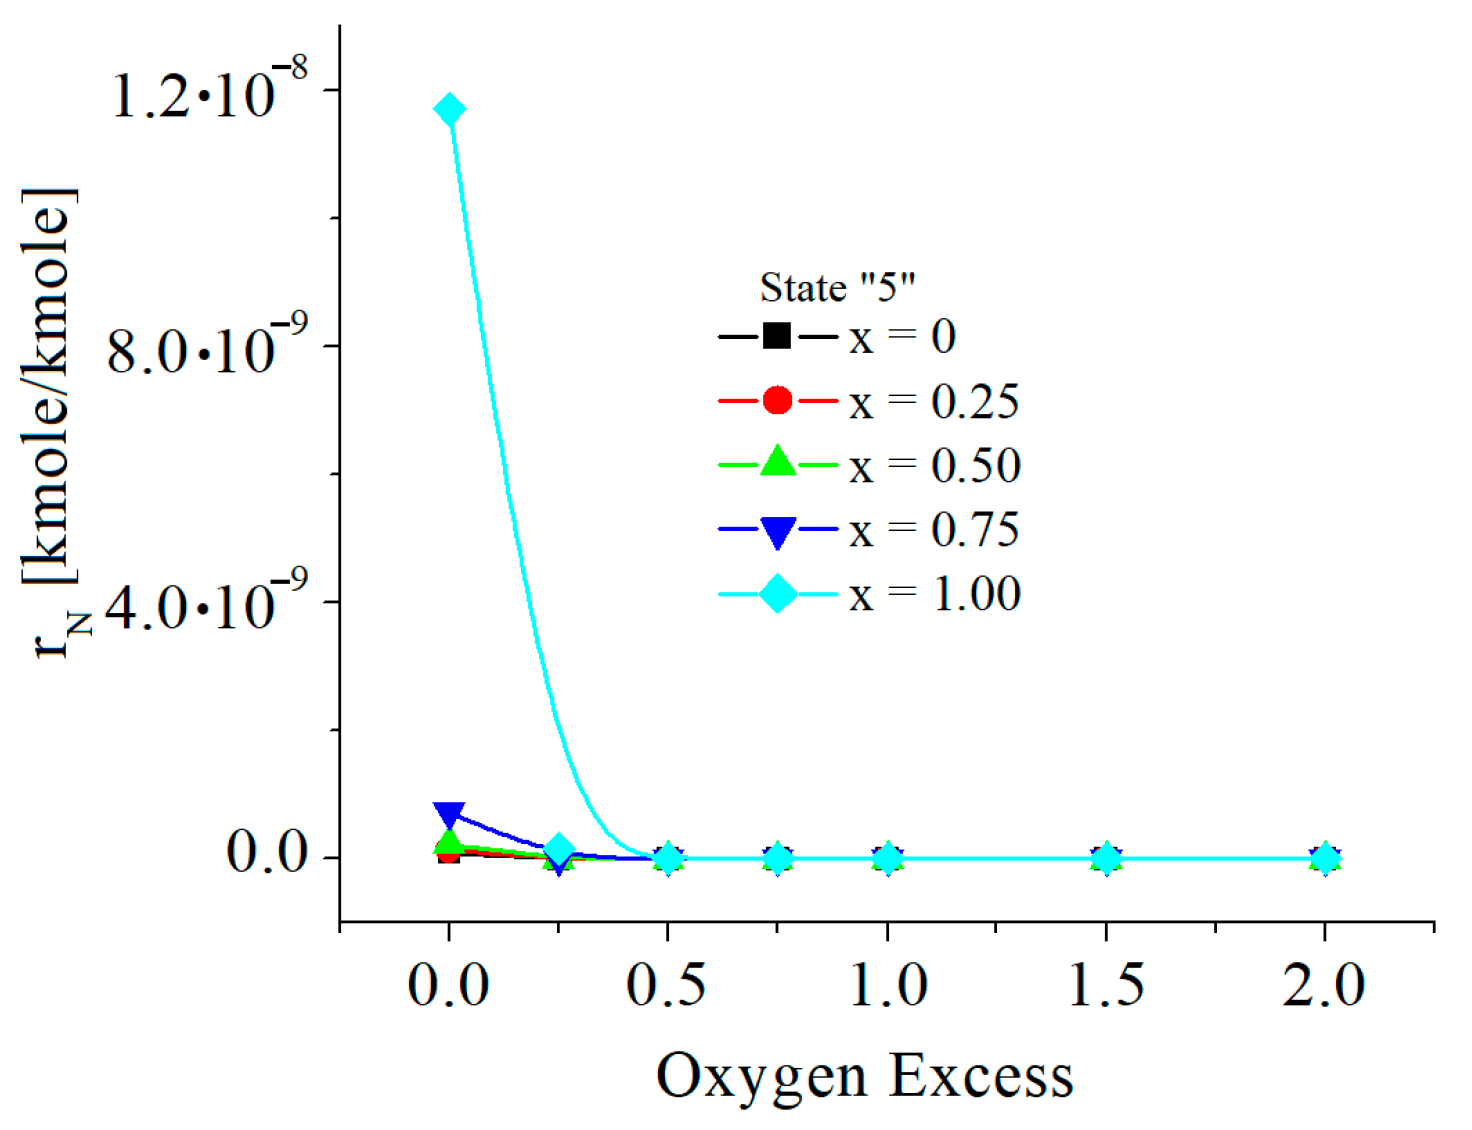
The mole fractions of O and N are directly proportional to x and inversely proportional to exo. The O mole fractions are at the level of mass ppm, but those of N are below mass ppb (parts per billion), see Figure 14 and Figure 15.

4. Critical Comparison with Results Reported Elsewhere

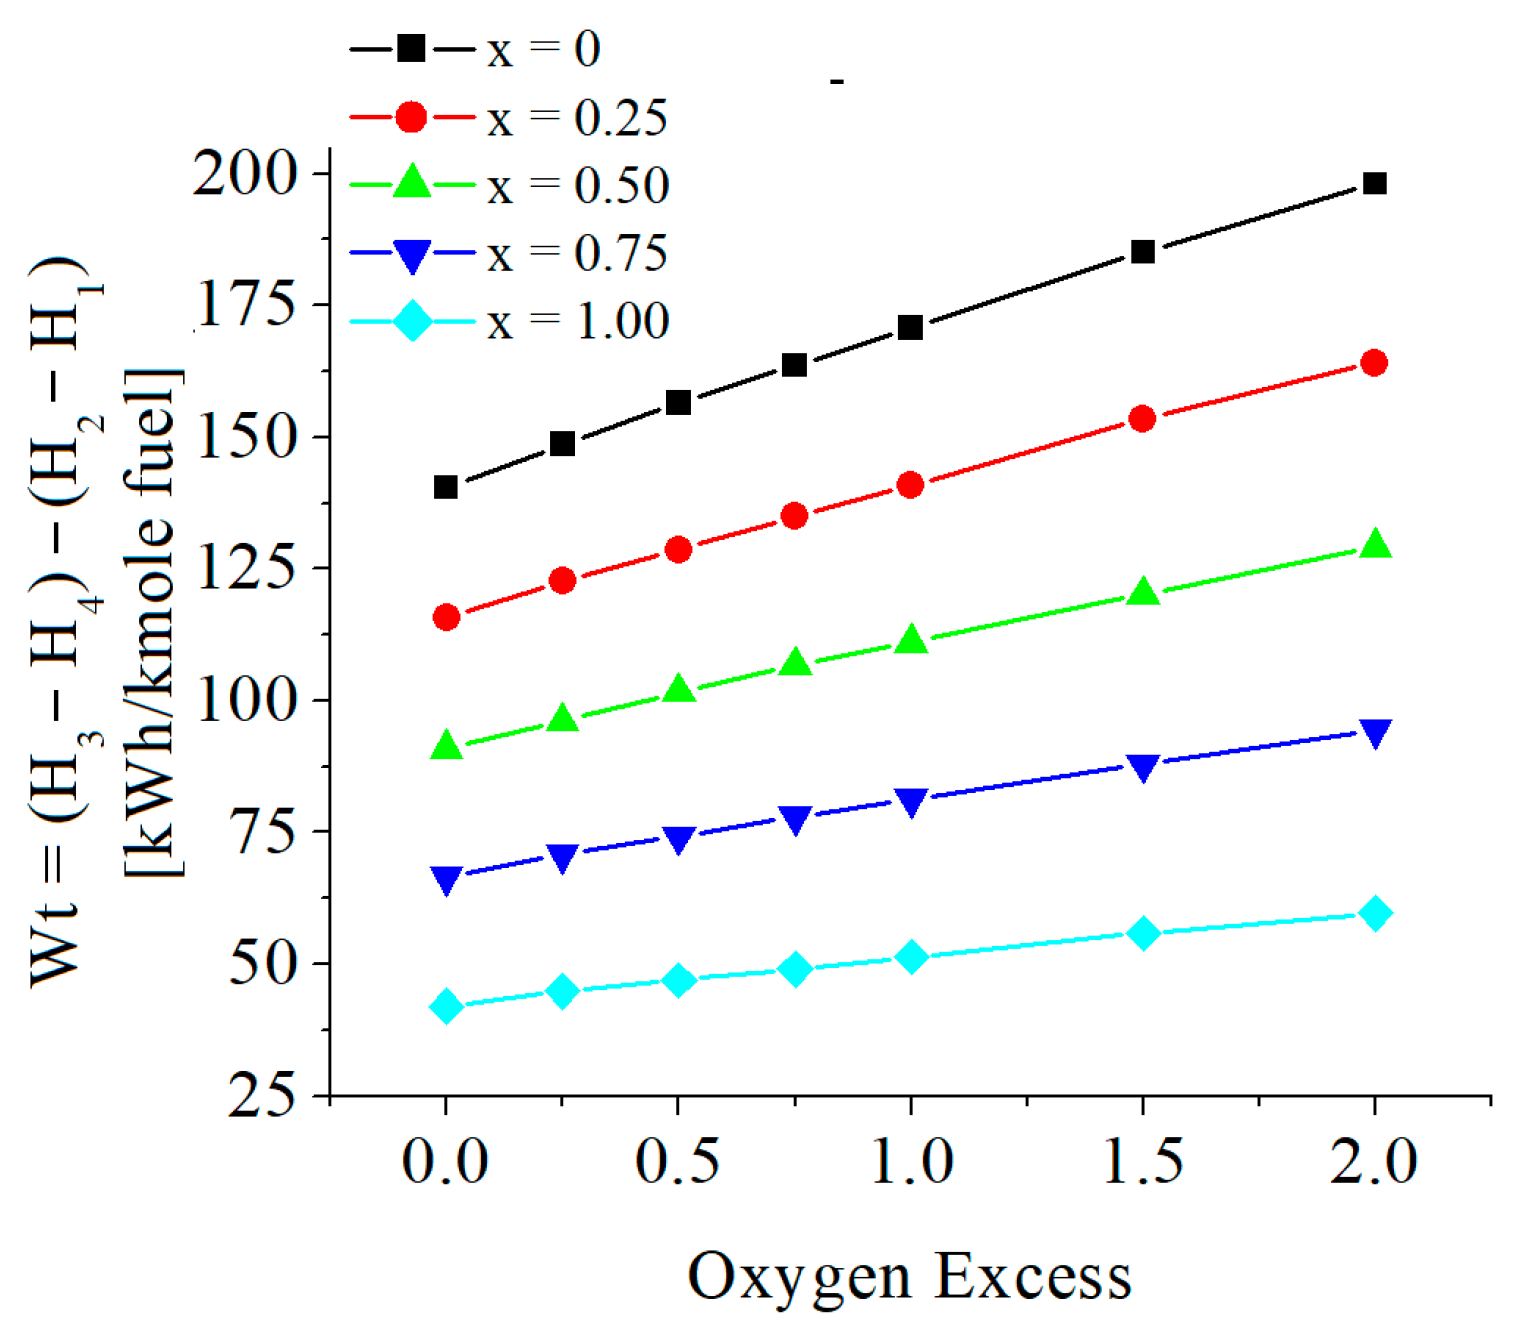
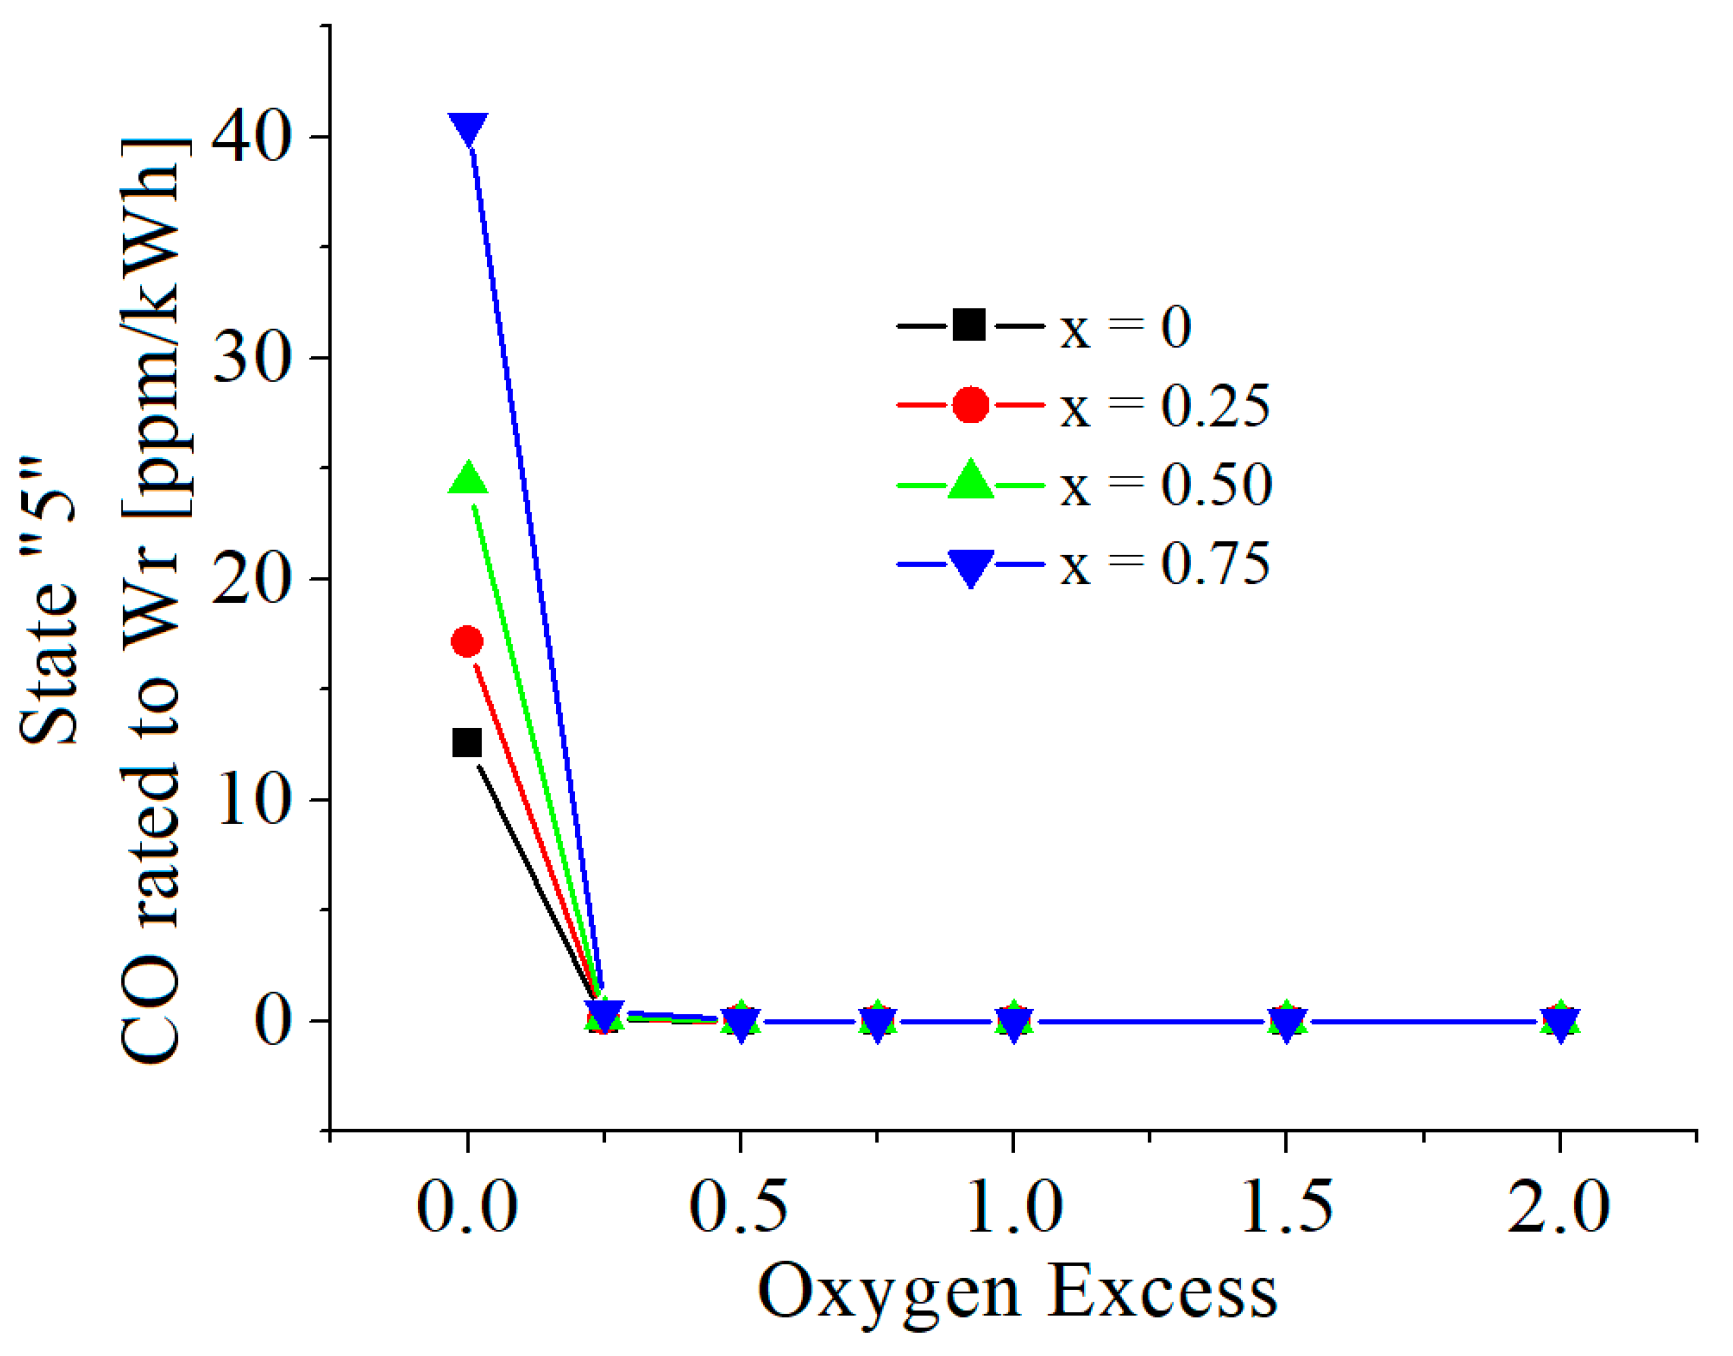
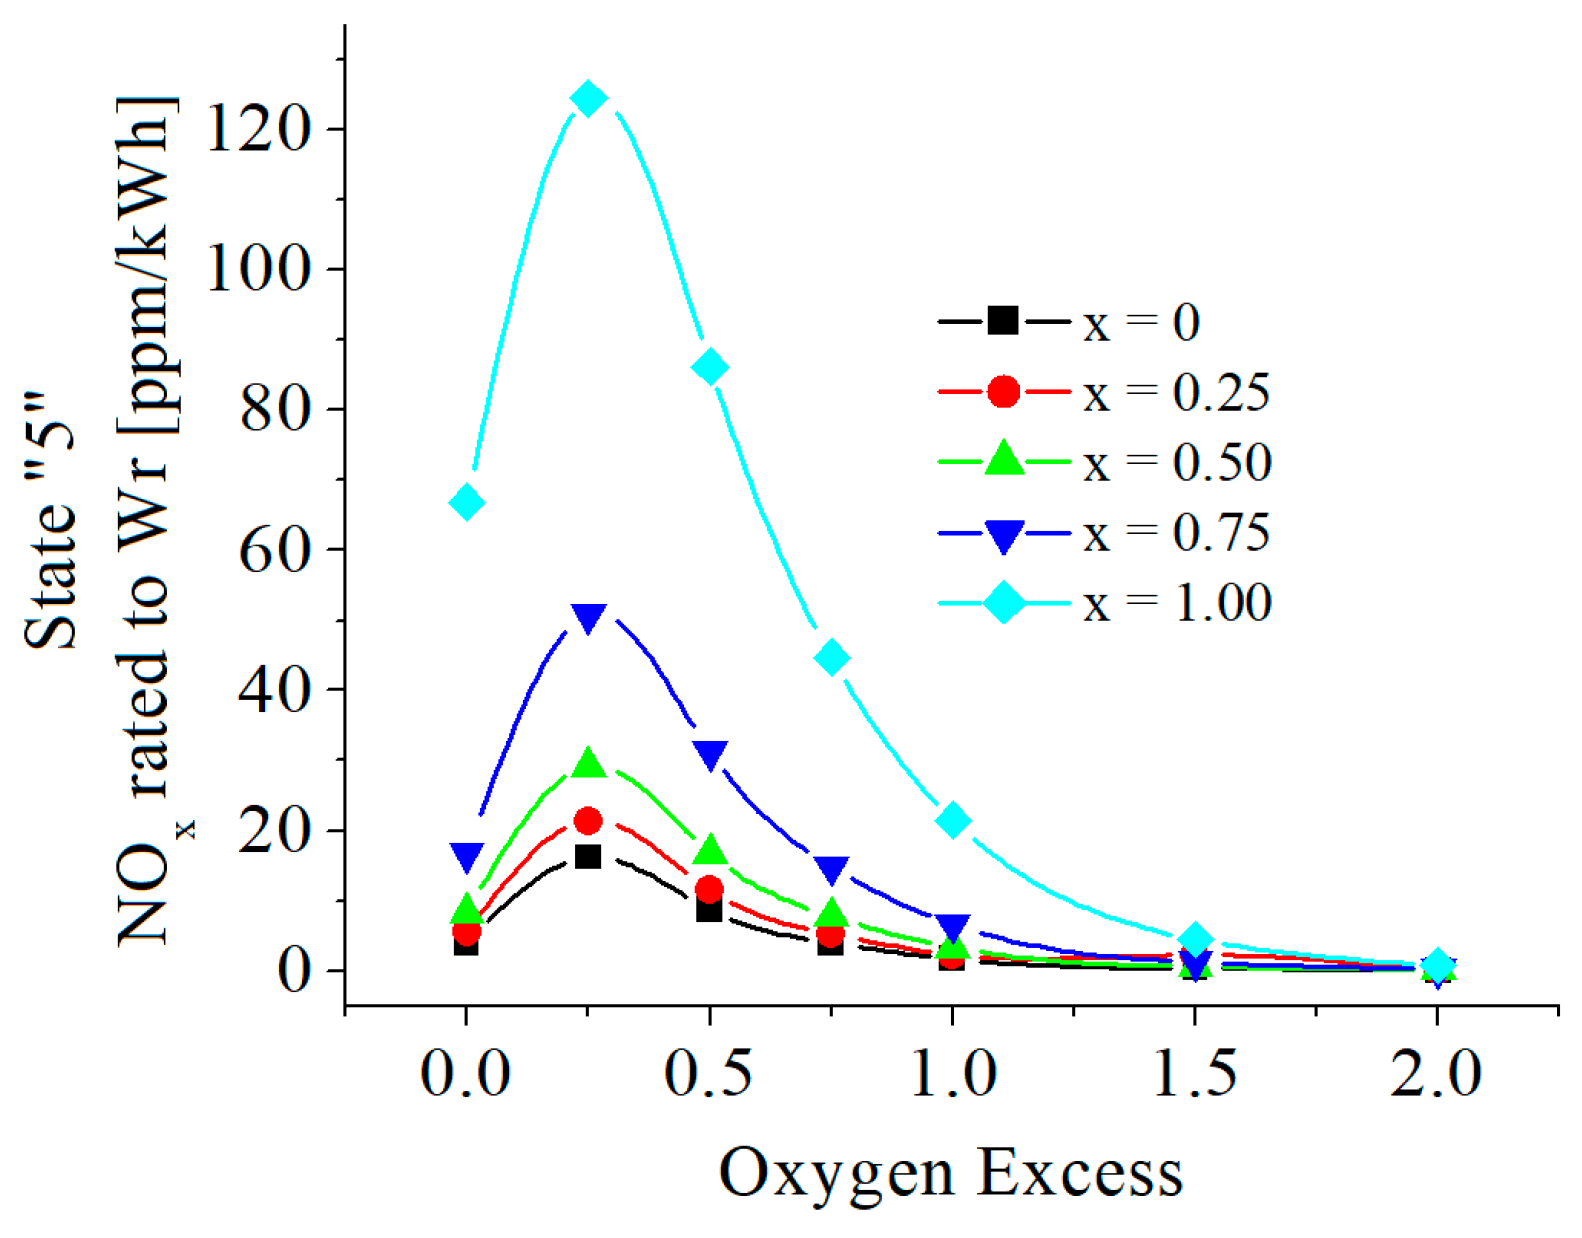
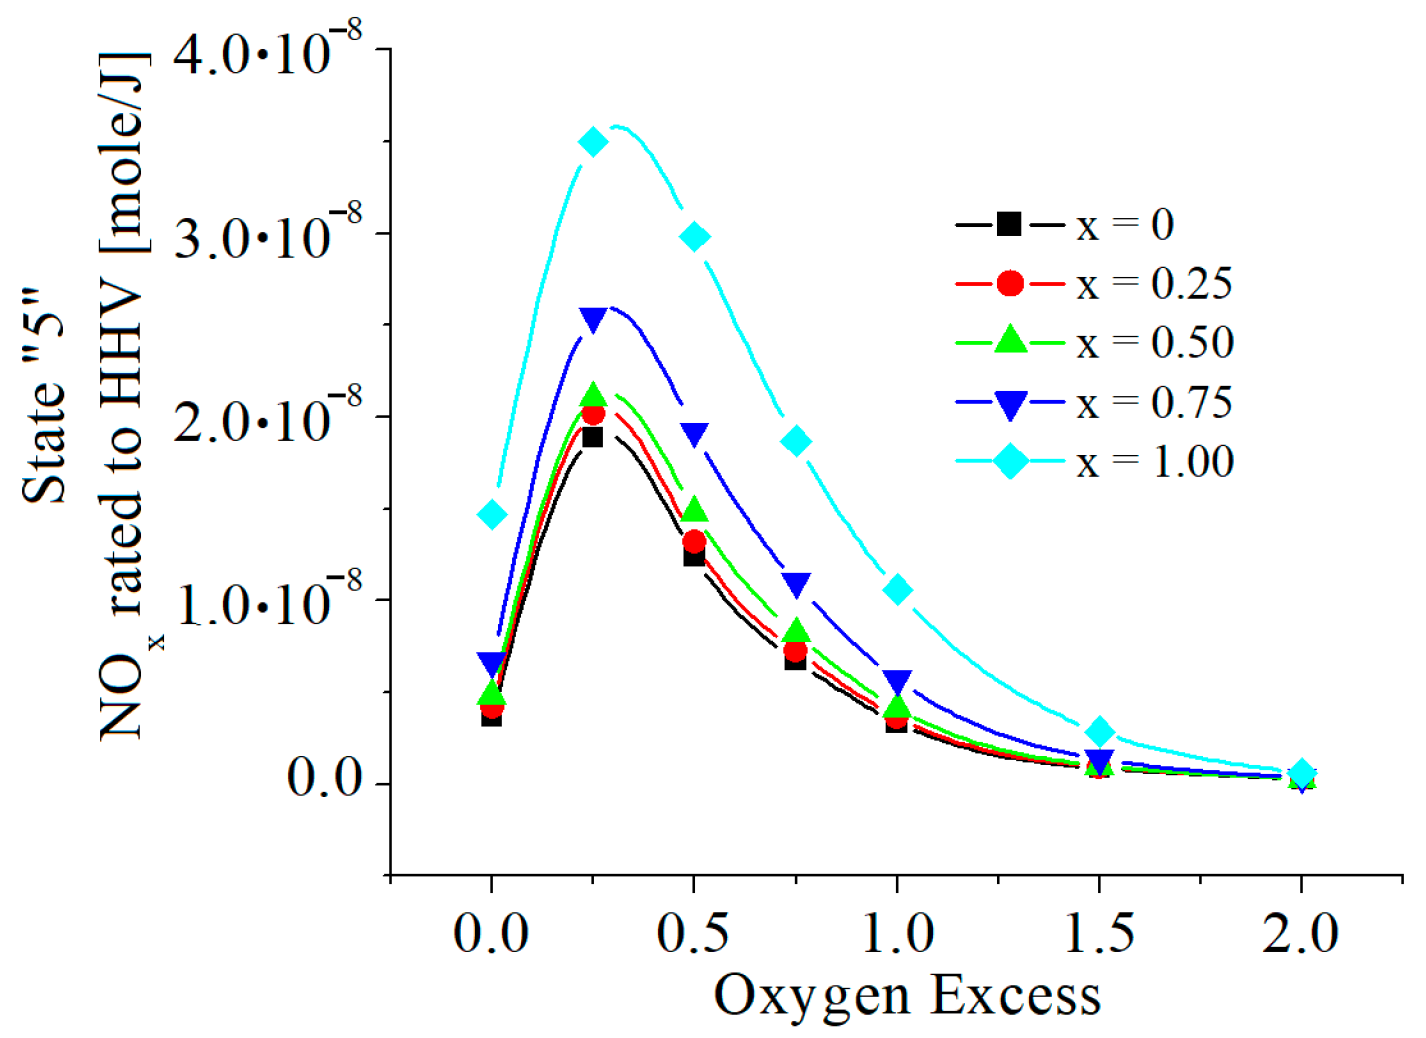
More reported numerically or experimentally obtained results were related to very specific restrictive conditions, e.g., power, HHV, imposed oxygen excess or equivalent ratio. Before any comparison, this paper’s numerical results were rated using the Otto cycle parameters, i.e., the work delivered by one kmole fuel and the HHV of a kmole fuel, and a chosen oxygen excess corresponding to an equivalent ratio found in other studies were evaluated, see following Figure 16, Figure 17, Figure 18, Figure 19, Figure 20, Figure 21 and Figure 22.
The chemical modeling developed in this paper can be applied to the known thermodynamic parameters defining the chemistry of a combustion process, including: temperature of gaseous mixtures; pressure of gaseous mixtures; oxygen excess or equivalent ratio; chemical composition of reactants (i.e., chemical species fractions in the fuel and in the oxidant, i.e., air); and therefore, the initial composition of gaseous mixtures resulting from a combustion without dissociation, which is based on the known chemical composition of reactants and imposed oxygen excess. The correlated equations of mass and conservation laws and extra Mendeleev-Clapeyron ideal gas state equation, give the final temperature, pressure and composition of flue gas. The numerical results obtained were compared to other published results for similar restrictive conditions.

4.1. Comparison 1

Reference [16] studied the chemistry of NOx resulting from a constant pressure combustion of a natural gas/hydrogen mixture inside a perfect stirred reactor (PSR), various compositions and equivalence ratios. Because natural gas mainly has methane (above 95%), we adapted our model to this study’s restrictive conditions, imposing identical equivalence ratio, temperature and pressure and considering methane as fuel, see Table 4.
The results reported by [16] are strongly influenced by the residence time, for a residence time up to 0.14 s, the numerical results of our chemical model are larger and for a residence time up to 3 s, our numerical results are smaller.

4.2. Comparison 2

Reference [10] presents the results from research on the optimal fuel compositions and the control parameters of a spark ignition engine fueled with a syngas–biogas–hydrogen mix and working in a solar hybrid renewable energy system. We adapted our chemical model to the restrictive conditions identified in Table 1 and Table 2, and Figure 6d from [10]. For a comparison, see Table 5.
The compared results have the same magnitude and are in very good agreement for Φ ≥ 0.87.

4.3. Comparison 3

Reference [14] performed CFD modeling of the combustion of hydrogen-enriched syngas fuel in a swirling flame, and a PDF combustion model with detailed chemical kinetics in a turbulent flames was used. The results of numerical simulations were compared with experimental data. This paper’s chemical model adopted similar restrictive conditions regarding fuel mole composition (0.04 CH4, 0.8 H2, 0.02 N2, 0.04 CO, 0.1 CO2) from Figure 3 of ref. [14], and the approximated temperature that was based on the legend from Figure 5 of ref. [14], and on the scale of flame temperature from Figure 6 of ref. [14]. The comparison is included in Table 6.
Although it is worth mentioning that Figure 5, Figure 6, Figure 7 and Figure 8 from [14] are ambiguous and contain contradictory values, they do not correlate.

4.4. Comparison 4

Reference [15] organized experimental investigations of a spark-ignition engine fueled by gasoline and hydrogen gas. Four engine load conditions (25%, 50%, 75%, and 100%) and three hydrogen gas mass concentration conditions (3%, 6%, and 9%) were defined for the study. On the basis of Figure 2d, Figure 4, Figure 7 and Figure 9 from [15], they were approximated comparisons for similar restrictive conditions considering 100% load, i.e., in-cylinder pressure of about 4 bar at CA of 400°, combustion temperature of 1850 K to 1550 K for CA from 400° to 450°, and approximated two phase fuel composition with gasoline (0.85 C and 0.15 H2 kg/kg) and with added extra 0.06 kg of H2 gas. The compared results are included in Table 7. The mean specific fuel consume values, of 225.4 g/kWh, gave a specific engine power of about 3.5 kWh. The comparison is included in Table 7. Because the equivalent ratio is unknown in ref. [15], they were adopted the equivalence ratios of 0.8 and 1 and 1.2 and, evaluated the specific power on the basis of HHV for two phase mixture gasoline/hydrogen and supposing an energy efficiency of 0.35.
The values of NOx are very similar for Φ = 1. The values of CO emissions in [15] are six times greater than those in the present paper’s model for Φ = 1.

4.5. Comparison 5

A modern Siemens SGT5-8000H gas turbine engine was chosen to evaluate its CO and NOx emissions through flue gas. The chosen gas turbine has a compression ratio of 19.2:1, the exhaust gas temperature and pressure of 627 °C and 1 bar and respectively, it is fueled by natural gas. Values of NOx ≤ 25 ppm at 15% O2 on fuel gas and CO ≤ 10 ppm at 15% O2 on fuel gas were reported. For comparison we considered, as fuel, the Romanian natural gas that have 98% CH4 and, it was imposed a very possible oxygen excess of x = 1.5. This paper’s chemical model evaluated NOx and CO emissions at 627 °C and 1 bar:
  • NOx 19.65 (mg/kg), 8.86 (ppmvd, 15% O2)
  • CO 1.4 × 10⁻⁷ (mg/kg), 7 × 10⁻⁸ (ppmvd, 15% O2)

5. Discussions

Chemical modeling of constant-volume combustion of mixtures of methane and hydrogen used in spark-ignition Otto cycles revealed all the features regarding flue gas parameters, as temperature, pressure, composition, and extra, the magnitude of pollutants. These features are dependent on the amount of excess oxygen, which quantifies the engine load, and on the hydrogen content in the fuel.
The chemical model used the mass and energy balance equations applied to some cycles, delivering different cyclic power specified indirectly by oxygen excess, in order to find trustworthy numerical results. The gaseous chemical species were considered ideal gases with variable heat capacities depending on the temperature and with enthalpies depending also on the gaseous mixture composition, which are functions of temperature and pressure.
The different power was simulated by adjusting the oxygen excess, as it is occurs when the cyclic fuel consumption changes. The temperature ratio, T3/T2, on the closed constant-volume combustion was in the range of 4.65 to 2.26, corresponding to an exo from 0 to 2.
The inlet temperature of reactants, T2, around 700 K ± 14 K, was slightly modified by the methane/hydrogen/air mixture composition. The energy contents of reactants, at this temperature, was quantified in the energy balance equation of combustion.
The numerical results have qualitative similarities to those of experimental studies regarding pollutants, such as CO and NOx; therefore, the reduction in these pollutants likely requires postcombustion devices/processes in order to decrease their levels; moreover, the chemical modeling revealed all constant-volume combustion’s features related to a large domains of x and exo.
All numerical results showed that the presence of hydrogen very slightly increases CO emissions, and a noticeable variation is observed only for 0 ≤ exo ≤ 0. For exo ≥ 0.25, the influence of oxygen excess is insignificant. The throttling in 4–5, which decreases the pressure, almost doubles CO emissions for stoichiometric combustion (exo = 0). The maximum mass ppm found in state 5 is around 170 ppm (mg CO/kg flue gas) for exo = 0 and x = 0.75.
The numerical results showed two influences of hydrogen on the NO mole fractions. The first showed values directly proportional to the mole ratio of hydrogen in the fuel. The second influence highlighted a peak in these emissions for 0 < exo <0.5. The influence of oxygen excess is following that of hydrogen.
NO2 emissions decrease as the hydrogen mole fraction in the fuel increases. This is unlike the emissions of NO; however, similarly, NO2 emissions have also a peak depending on oxygen excess.
The cumulative NOx showed similar influences of hydrogen and oxygen excess as was in the case of NO emissions because the values of NO are higher than those of NO2.
The presence of hydrogen very slightly modified the temperatures and pressures of states 2, 3 and 4.
The values of x and exo impressively modified the flue gas mole fractions of minor chemical species The mole fractions of H2 in state 5 are significant for x = 0 and most diminished when the fuel contains hydrogen, x > 0, and there are marginally influences by exo for all scrutinized domain.
The mole fractions of OH in state 5 are relatively small. They increase when x increases, and they decrease when exo increases.
The mole fractions of H are directly proportional to x, inversely proportional to exo, and have a maximum for 0 ≤ exo ≤ 0.5.
The mole fractions of O and N are directly proportional to x and inversely proportional to exo. The O mole fractions are at the level of mass ppm, but those of N are below mass ppb (parts per billion).
The numerical modeling showed that the chemical reaction 10 is redundant when x > 0, i.e., it was giving values that were either complex or below zero for chemical species H2 resulting from this dissociation reaction. This indicates that the main chemical reaction producing H2 by dissociation is given by Equation (9).
It can be stated that as larger the hydrogen ratio in the fuel as lower the CO2 dangerous emissions, not necessary any demonstration.

6. Conclusions

The paper presents a chemical model for the closed constant-volume combustion of gaseous mixtures of methane and hydrogen using spark-ignition reciprocating engines in order to evaluate the combustion parameters and exhaust flue gas composition. The chemical model avoided unknown influences in order to accurately explain the influence of hydrogen on constant-volume combustion and flue gas composition. The model adopted simplifying hypotheses, i.e., isentropic compression and expansion processes, in closed constant-volume combustion caused by two successive steps obeying the energy and mass conservation laws, and flue gas exhaust, which was also described by two steps, i.e., isentropic expansion through the flow section of exhaust valves followed by constant pressure stagnation (this process, in fact, corresponds to a direct throttling process).
The chemical model assumed the homogeneous mixtures of gases have variable heat capacity functions of temperatures, the Mendeleev–Clapeyron ideal gas state equation, and the variable chemical equilibrium constants for the chosen chemical reactions.
It was assumed that the flue gas chemistry prevails during isentropic expansion and flue gas exhaust.
The chemical model allowed for the evaluation of flue gas composition and for noxious chemical species magnitude after combustion, i.e., states 3, 4, and 5. The chemical modeling developed in this paper can be applied to the known thermodynamic parameters defining the chemistry of a combustion process, including: temperature of gaseous mixtures; pressure of gaseous mixtures; oxygen excess or equivalent ratio; chemical composition of reactants (i.e., chemical species fractions in the fuel and in the oxidant); initial composition of gaseous mixture resulting from a combustion without dissociation which are based on the known chemical composition of reactants and imposed oxygen excess.
This model might have one dimension (known T, p, and exo/Φ, unknown composition) solved only on the basis of the mass conservation law, two dimensions (known either T, p, unknown x/Φ and composition; known T, x/Φ unknown p and composition; or known p, x/Φ, unknown T and composition) solved by uniting the mass and energy conservation laws, and three dimensions (known x/Φ, unknown T, p and composition, as is in this paper) solved by uniting the mass and energy conservation laws in successive computing loops.
It might be applied either for steady-state processes (e.g., constant pressure combustion) or non-steady-state processes, as it was developed in this paper, on the basis of the appropriate energy and mass conservation laws. In last case, the chemical modeling offers a “time or space based film” of the process.
Mixtures of liquid and gaseous fuels might also be involved if the first step (see Section 2.3) of combustion can be solved, i.e., if HHV and ph and chemical species resulting from a combustion without dissociation were to be evaluated.
The chemical model might be improved by taking into consideration new chemical reactions, with known chemical equilibrium constants, in NOx and CO production, and, it might be modified based on the “residence” time in a known “state” (given T and p and initial composition). If the residence time is shorter than the chemistry time, then the results of a pure chemical model might be larger or smaller than those that are experimentally found, depending on the variation speed of temperature and pressure, e.g., the quenching of chemical reactions. If the residence time is longer than the chemistry time, it is very possible that the pure chemical model might give reliable results. The influence of residence time is not well known because there are not many congruent studies. For instance, in SI engines, the revolution per minute might affect the noxious emissions even if other restrictive constant conditions are imposed. In spite of its assumed limitations, a pure chemical model is very useful in offering, at least primarily, qualitative images and/or films regarding combustion processes.

Author Contributions

Conceptualization, G.D. and M.F.; methodology, G.D. and M.F.; software, G.D. and A.-G.L.; validation, G.D. and A.-G.L.; formal analysis, M.F. and G.D.; writing—original draft preparation, G.D.; writing—review and editing, G.D and M.F.. All authors have read and agreed to the published version of the manuscript.

Funding

This research received no external funding.

Data Availability Statement

Data are available via a publicly accessible repository.

Conflicts of Interest

The authors declare no conflict of interest.

References

  1. Di Sarli, V.; Di Benedetto, A. Laminar burning velocity of hydrogen–methane/air premixed flames. Int. J. Hydrogen Energy 2007, 32, 637–646. [Google Scholar] [CrossRef]
  2. Di Sarli, V.; Di Benedetto, A.; Long, E.; Hargrave, G. Time-Resolved Particle Image Velocimetry of dynamic interactions between hydrogen-enriched methane/air premixed flames and toroidal vortex structures. Int. J. Hydrogen Energy 2012, 37, 16201–16213. [Google Scholar] [CrossRef] [Green Version]
  3. Krebs, S.; Biet, C. Predictive model of a premixed, lean hydrogen combustion for internal combustion engines. Transp. Eng. 2021, 5, 100086. [Google Scholar] [CrossRef]
  4. Jiang, Y.; Chen, Y.; Wang, R.; Lu, W.; Liu, W.; Zhang, Y. Investigation on the effects of blending hydrogen-rich gas in the spark-ignition engine. Energy Rep. 2022, 8, 797–803. [Google Scholar] [CrossRef]
  5. Qadiri, U.; AlFantazi, A. Numerical 1-D simulations on Single-Cylinder stationary spark ignition engine using Micro-Emulsions, gasoline, and hydrogen in dual fuel mode. Clean. Chem. Eng. 2022, 2, 100009. [Google Scholar] [CrossRef]
  6. Yu, X.; Hu, Z.; Guo, Z.; Li, D.; Wang, T.; Li, Y.; Zhang, J.; Gong, T.; Li, Y. Research on combustion and emission characteristics of a hydrous ethanol/hydrogen combined injection spark ignition engine under lean-burn conditions. Int. J. Hydrogen Energy 2022, 47, 27223–27236. [Google Scholar] [CrossRef]
  7. Barbu, M.C.; Birta, A.; Chiriac, R. On the improvement of performance and pollutant emissions of a spark ignition engine fuelled by compressed natural gas and hydrogen. Energy Rep. 2022, 8, 978–991. [Google Scholar] [CrossRef]
  8. Suresh, D.; Porpatham, E. Influence of high compression ratio and hydrogen addition on the performance and emissions of a lean burn spark ignition engine fueled by ethanolgasoline. Int. J. Hydrogen Energy 2023, 48, 14433–14448. [Google Scholar] [CrossRef]
  9. Gonca, G.; Sahin, B.; Hocaoglu, M.F. Influences of hydrogen and various gas fuel addition to different liquid fuels on the performance characteristics of a spark ignition engine. Int. J. Hydrogen Energy 2022, 47, 12421–12431. [Google Scholar] [CrossRef]
  10. Bui, V.G.; Bui, T.M.T.; Tran, V.N.; Huang, Z.; Hoang, A.T.; Tarelko, W.; Bui, V.H.; Pham, X.M.; Nguyen, P.Q.P. Flexible syngas-biogas-hydrogen fueling spark-ignition engine behaviors with optimized fuel compositions and control parameters. Int. J. Hydrogen Energy 2023, 18, 6722–6737. [Google Scholar] [CrossRef]
  11. Naruke, M.; Morie, K.; Sakaida, S.; Tanaka, K.; Konno, M. Effects of hydrogen addition on engine performance in a spark ignition engine with a high compression ratio under lean burn conditions. Int. J. Hydrogen Energy 2019, 44, 15565–15574. [Google Scholar] [CrossRef]
  12. Sanli, A.; Yılmaz, I.T.; Gümüs, M. Assessment of combustion and exhaust emissions in a common-rail diesel engine fueled with methane and hydrogen/methane mixtures under different compression ratio. Int. J. Hydrogen Energy 2020, 45, 3263–3283. [Google Scholar] [CrossRef]
  13. Ali, G.; Zhang, T.; Wu, W.; Zhou, Y. Effect of hydrogen addition on NOx formation mechanism and pathways in MILD combustion of H2-rich low calorific value fuels. Int. J. Hydrogen Energy 2020, 45, 9200–9210. [Google Scholar] [CrossRef]
  14. Pashchenko, D. Hydrogen-rich fuel combustion in a swirling flame: CFD-modeling with experimental verification. Int. J. Hydrogen Energy 2020, 45, 19996–20003. [Google Scholar] [CrossRef]
  15. García, C.P.; Abril, S.O.; León, J.P. Analysis of performance, emissions, and lubrication in a spark-ignition engine fueled with hydrogen gas mixtures. Heliyon 2022, 8, e11353. [Google Scholar] [CrossRef]
  16. Pan, H.; Geng, S.; Yang, H.; Zhang, G.; Bian, H.; Liu, Y. Influence of H2 blending on NOx production in natural gas combustion: Mechanism comparison and reaction routes. Int. J. Hydrogen Energy 2023, 48, 784–797. [Google Scholar] [CrossRef]
  17. Taamallah, S.; Vogiatzaki, K.; Alzahrani, F.M.; Mokheimer, E.M.A.; Habib, M.A.; Ghoniem, A.F. Fuel flexibility, stability and emissions in premixed hydrogen-rich gas turbine combustion: Technology, fundamentals, and numerical simulations. Appl. Energy 2015, 154, 1020–1047. [Google Scholar] [CrossRef]
  18. Peng, Q.; Ye, J.; Tu, Y.; Yang, W.; Jiaqiang, E.; Kang, Z.; Fu, G. Experimental and numerical investigation on premixed H2/C3H8/air combustion and thermal performance in a burner with partially filled porous media. Fuel 2022, 328, 125227. [Google Scholar] [CrossRef]
  19. Maio, G.; Boberic, A.; Giarracca, L.; Aubagnac-Karkar, D.; Colin, O.; Duffour, F.; Deppenkemper, K.; Virnich, L.; Pischinger, S. Experimental and numerical investigation of a direct injection spark ignition hydrogen engine for heavy-duty applications. Int. J. Hydrogen Energy 2022, 47, 29069–29084. [Google Scholar] [CrossRef]
  20. Yosri, M.; Palulli, R.; Talei, M.; Mortimer, J.; Poursadegh, F.; Yang, Y.; Brear, M. Numerical investigation of a large bore, direct injection, spark ignition, hydrogen-fuelled engine. Int. J. Hydrogen Energy 2023, 48, 17689–17702. [Google Scholar] [CrossRef]
  21. Urroz, J.C.; Diéguez, P.M.; Arzamendi, G.; Arana, M.; Gandía, L.M. Gaseous fueling of an adapted commercial automotive spark-ignition engine: Simplified thermodynamic modeling and experimental study running on hydrogen, methane, carbon monoxide and their mixtures. Fuel 2023, 337, 127178. [Google Scholar] [CrossRef]
  22. Xu, L.; Sun, X.; Ku, C.; Liu, J.; Lai, M.-C.; Duan, X. Effects of control strategies for mixture activity and chemical reaction pathway coupled with exhaust gas recirculation on the performance of hydrogen-enriched natural-gas fueled spark ignition engine. Fuel 2022, 322, 124153. [Google Scholar] [CrossRef]
  23. Ganesan, N.; Sahni, I.; Samuel, O.D.; Enweremadu, C.C.; Veza, I.; Chandran, D. Optimization and sustainability of gasohol/hydrogen blends for operative spark ignition engine utilization and green environment. Case Stud. Therm. Eng. 2022, 39, 102381. [Google Scholar] [CrossRef]
  24. Salvi, B.L.; Subramanian, K.A. A novel approach for experimental study and numerical modeling of combustion characteristics of a hydrogen fuelled spark ignition engine. Sustain. Energy Technol. Assess. 2022, 51, 101972. [Google Scholar] [CrossRef]
  25. Kosmadakis, G.M.; Rakopoulos, D.C.; Rakopoulos, C.D. Assessing the cyclic-variability of spark-ignition engine running on methane-hydrogen blends with high hydrogen contents of up to 50%. Int. J. Hydrogen Energy 2021, 46, 17955–17968. [Google Scholar] [CrossRef]
  26. Li, D.; Wang, H.; Yu, X.; Yang, H. Combustion and emission characteristics of an Acetone-Butanol-Ethanol (ABE) spark ignition engine with hydrogen direct injection. Int. J. Hydrogen Energy 2021, 46, 30145–30157. [Google Scholar] [CrossRef]
  27. Bundele, H.; Kurien, C.; Varma, P.S.; Mittal, M. Experimental and computational study on the enhancement of engine characteristics by hydrogen enrichment in a biogas fuelled spark ignition engine. Int. J. Hydrogen Energy 2022, 47, 30671–30686. [Google Scholar] [CrossRef]
  28. Borgnakke, C.; Sonntag, R.E. Fundamentals of Thermodynamics, 8th ed.; Wiley: Hoboken, NJ, USA, 2012; ISBN 978-1-118-13199-2. Available online: https://www.academia.edu/32941529/Fundamentals_of_Thermodynamics_8th_ed (accessed on 1 April 2023).
Figure 1. The basic Otto cycle.
Energies 16 04578 g001
Figure 2. The isentropic compression 1–2. O2min and N2min correspond to stoichiometric combustion.
Energies 16 04578 g002
Figure 3. The first step of combustion giving the heat input for the second one. O2min and N2min are values for stoichiometric combustion. HHV, higher heating value.
Energies 16 04578 g003
Figure 4. The second step of combustion consuming the heat released in the first one.
Energies 16 04578 g004
Figure 5. The isentropic reactive expansion 3–4.
Energies 16 04578 g005
Figure 6. The flue gas exhaust process 4–5.
Energies 16 04578 g006
Figure 7. (a) The CO mole fractions in state 3; function of excess of oxygen and x. (b) The CO mole fractions in state 4; function of excess of oxygen and x. (c) The CO mole fractions in state 5; function of excess of oxygen and x.
Energies 16 04578 g007
Figure 8. (a) The NO mole fractions in state 3; function of excess of oxygen and x. (b) The NO mole fractions in state 4; function of excess of oxygen and x. (c) The NO mole fractions in state 5; function of excess of oxygen and x.
Energies 16 04578 g008
Figure 9. (a) The NO2 mole fractions in state 3; function of excess of oxygen and x. (b) The NO2 mole fractions in state 4; function of excess of oxygen and x. (c) The NO2 mole fractions in state 5; function of excess of oxygen and x.
Energies 16 04578 g009aEnergies 16 04578 g009b
Figure 10. (a) The NOx mass ppm (mg/kg) in state 3; function of excess of oxygen and x. (b) The NOx mass ppm (mg/kg) in state 4; function of excess of oxygen and x. (c) The NOx mass ppm (mg/kg) in state 5; function of excess of oxygen and x.
Energies 16 04578 g010
Figure 11. The H2 mole fractions in state 5 (kmole/kmole).
Energies 16 04578 g011
Figure 12. The OH mole fractions in state 5 (kmole/kmole).
Energies 16 04578 g012
Figure 13. The H mole fractions in state 5 (kmole/kmole).
Energies 16 04578 g013
Figure 14. The O mole fractions in state 5 (kmole/kmole).
Energies 16 04578 g014
Figure 15. The N mole fractions in state 5 (kmole/kmole).
Energies 16 04578 g015
Figure 16. The useful power of Otto cycle. Wt = (H3 − H4) − (H2 − H1) (kWh/kmole fuel). H is the whole enthalpy of the working fluid related to 1 kmole fuel.
Energies 16 04578 g016
Figure 17. The possible power of Otto cycle supposing an energy efficiency of 0.35. Wr = 0.35·HHV (kWh/kmole fuel).
Energies 16 04578 g017
Figure 18. The CO mass ppm rated to Wt (mg/kWh).
Energies 16 04578 g018
Figure 19. The CO mass ppm rated to Wr (mg/kWh).
Energies 16 04578 g019
Figure 20. The NOx mass ppm rated to Wt (mg/kWh).
Energies 16 04578 g020
Figure 21. The NOx mass ppm rated to Wr (mg/kWh).
Energies 16 04578 g021
Figure 22. The NOx mass ppm rated to HHV (mole/J).
Energies 16 04578 g022
Table 1. Polynomials of physical enthalpy of chemical species participating in constant-volume combustion.
h = h ( T ) h ( 298 K ) ;   h   is   the   Relative   Physical   Enthalpy   of   Gaseous   Chemical   Species ;   ( kJ / kmole ) ;
h = c 0 + c 1 · T + c 2 · T 2 + c 3 · T 3 + c 4 · T 4 + c 5 · T 5   ( kJ / kmole )   for   298   K     T     5200   K ;
hCH4 for 298 K ≤ T ≤ 1500 K
c0c1c2c3c4c5
hCO2−10,295.73122+29.18222805+0.01976308361−0.000006164587807+9.718495272 × 10⁻¹⁰−5.984216612 × 10⁻¹⁴
hH2O−7820.523838+24.56140839+0.006095193576−0.000001576697822+2.155196747 × 10⁻¹⁰−1.189998347 × 10⁻¹⁴
hO2−8310.810038+26.11440421+0.006486554878−0.000001879231979+3.125634850 × 10⁻¹⁰−2.048055699 × 10⁻¹⁴
hN2−7820.523838+24.56140839+0.006095193576−0.000001576607822+2.155196747 × 10⁻¹⁰−1.189998347 × 10⁻¹⁴
hCO−77,895.9176124.23615845+0.006957194766−0.000002000452191+3.006868933 × 10⁻¹⁰−1.79961500 × 10⁻¹⁴
hH2−8523.602676+28.58874847−0.0002520099380+0.000001072813673−2.405013187 × 10⁻¹⁰+1.755178738 × 10⁻¹⁴
hOH−8479.625232+28.19400310+0.0006776079283+7.234592056 × 10⁻⁷−1.956721062 × 10⁻¹⁰+1.522710549 × 10⁻¹⁴
hO−6430.497036+21.74597694−0.0006119709133+1.784585133 × 10⁻⁷−2.341992360 × 10⁻¹¹+1.452421376 × 10⁻¹⁵
hH−6191.086828+20.77251773+0.00001104663432−4.160102635 × 10⁻⁹+7.310338752 × 10⁻¹³+4.846517103 × 10⁻¹⁷
hN−6167.889202+20.64973571+0.0001887590700−9.970607532 × 10⁻⁸+1.832411454 × 10⁻¹¹−2.236164634 × 10⁻¹⁶
hNO−8047.826762+25.12271666+0.006900181303−0.000002036851415+3.093429512 × 10⁻¹⁰−1.856273997 × 10⁻¹⁴
hNO210,209.25264+29.28985710+0.01839187998−0.000006044547788+9.772891559 × 10⁻¹⁰−6.122580161 × 10⁻¹⁴
hCH4−8143.263322+21.07695175+0.01570851794+0.00002221853471−1.604634302 × 10⁻⁸+3.367601937 × 10⁻¹²
Table 2. Enthalpy formation of chemical species involved in constant-volume combustion.
CH4CO2H2OH2O2N2COHONOHNONO2
hf0
(kJ/kmole)
−74,873−393,522−285,830000−110,527+217,999+249,170+472,680+38,897+90,921+33,100
Table 3. Polynomials of natural logarithms of chemical equilibrium constants.
l n ( K ) = a 0 + a 1 · T + a 2 · T 2 + a 3 · T 3 + a 4 · T 4 + a 5 · T 5 + a 6 · T 6 + a 7 · T 7   for   500   K     T     3400   K ,   P = 1
ln(K1)ln(K2)ln(K3)ln(K4)ln(K5)ln(K6)ln(K7)ln(K8)
a7+9.2326311289 × 10⁻²²+1.136595616 × 10⁻²¹+7.643759089 × 10⁻²²+8.166909930 × 10⁻²²+1.543529198 × 10⁻²¹+7.070194312 × 10⁻²²+2.948541681 × 10⁻²²+1.070424351 × 10⁻²²
a6−1.469466515 × 10⁻¹⁷−1.77695367 × 10⁻¹⁷−1.219664280 × 10⁻¹⁷−1.298258556 × 10⁻¹⁷−2.454651317 × 10⁻¹⁷−1.125159755 × 10⁻¹⁷−4.688934093 × 10⁻¹⁸−1.700672496 × 10⁻¹⁸
a5+9.908436246 × 10⁻¹⁴+1.173485363 × 10⁻¹³+8.256023802 × 10⁻¹⁴+8.743314794 × 10⁻¹⁴+1.653766691 × 10⁻¹³+7.586041432 × 10⁻¹⁴+3.159040657 × 10⁻¹⁴+1.144079969 × 10⁻¹⁴
a4−3.683648801 × 10⁻¹⁰−4.258599458 × 10⁻¹⁰−3.081726001 × 10⁻¹⁰−3.246702476 × 10⁻¹⁰−6.143247539 × 10⁻¹⁰−2.282012344 × 10⁻¹⁰−1.173468673 × 10⁻¹⁰−4.240167126 × 10⁻¹¹
a3+8.221477783 × 10⁻⁷+9.246236875 × 10⁻⁷+6.907189777 × 10⁻⁷+7.238919496 × 10⁻⁷+0.000001370114593+6.294886934 × 10⁻⁷+2.616956936 × 10⁻⁷+9.424074844 × 10⁻⁸
a2−0.001121518545−0.001223384239−0.0009467177073−0.0009868881509−0.001868142287−0.0008592308402−0.0003567351418−0.0001278633183
a1+0.9056894246+0.9575982855+0.7698066320+0.7977691487+1.509735517+0.695832294+0.2880804502+0.1027180385
a0−370.3187386−385.6441663−323.0833734−330.5159532−638.9027541−289.1945752−121.5994613−59.57996704
Table 4. Selected numerical results compared to those of Ref. [16].
This paperRef. [16]This PaperRef. [16]This PaperRef. [16]Ref. [16]
x1Figure 70.75Figure 70.5Figure 7Figure 10
exo1.5residence time 0.02 to 0.14 s0.428571residence time 0.02 to 0.14 s0residence time 0.02 to 0.14 sresidence time up to 3 s
T (K)1700170017001700170017001700
p (bar)1111111
Φ0.80.80.80.80.80.80.8
NOx (mole/J)7.97 × 10−82 × 10−10 to 1.35 × 10−92.77 × 10−83 × 10−10 to 1.6 × 10−97.99 × 10−103.5 × 10⁻¹⁰ to 1.7 × 10−91 × 10−7 to 4 × 10⁻⁷
Table 5. Selected numerical results compared to those of Ref. [10]. CA = 300°; blend 2; 40% syngas; 40% biogas; 20% hydrogen; and Figure 6a,b,d.
This ModelRef. [10]This ModelRef. [10]This ModelRef. [10]This ModelRef. [10]This ModelRef. [10]
exo0.952515 0.695605 0.481218 0.28866 0.171509
(°CA)-300-300-300-300-300
T (K) (approx.)1250125014001400155015501725172518001800
p (bar) (approx.)55555.55.5666.256.25
Φ0.660.660.760.760.870.87111.11.1
NOx (mg/kg)2995062228010818501688140016761650
Table 6. Selected numerical results compared to those of Ref. [14].
This PaperRef. [14]
T (K)10901100~1100 K, Figure 5 and Figure 6
p (bar)111
exo0.10.10.1
NOx (mg/kg)88.3895.6489 to 93
Table 7. Selected numerical results compared to those of Ref. [15].
This Paper (Specific Power = HHV·0.35/3600 (kWh))Ref. [15]
Φ0.811.2unknown
exo0.7820945950.4256760.188063unknown
T (K)1850185018501850
p (bar)4444
NOx (mole/J)4.91E–083.18E–087.73E–09unknown
NOx (mg/kg)3946.1257332253.72976.2172unknown
NOx (ppmvd 15%O2)2128.1719934058.3229521.072unknown
CO (mg/kg)28.4756484377.82024231.9931unknown
NOx (g/kWh)15.187328446.5594012.385153cca 6
CO (g/kWh)0.1095933210.2264940.56682cca 1.3
Disclaimer/Publisher’s Note: The statements, opinions and data contained in all publications are solely those of the individual author(s) and contributor(s) and not of MDPI and/or the editor(s). MDPI and/or the editor(s) disclaim responsibility for any injury to people or property resulting from any ideas, methods, instructions or products referred to in the content.