Article

Large-Scale Experimental Simulations of In Situ Coal Gasification in Terms of Process Efficiency and Physicochemical Properties of Process By-Products

by
Marian Wiatowski
1,
Krzysztof Kapusta
1,
Aleksandra Strugała-Wilczek
1,*,
Krzysztof Stańczyk
1,
Alberto Castro-Muñiz
2,
Fabián Suárez-García
2 and
Juan Ignacio Paredes
2
1
Central Mining Institute, Department of Energy Saving and Air Protection, Plac Gwarków 1, 40-166 Katowice, Poland
2
Instituto de Ciencia y Tecnología del Carbono, INCAR-CSIC, C/Francisco Pintado Fe 26, 33011 Oviedo, Spain
*
Author to whom correspondence should be addressed.
Energies 2023, 16(11), 4455; https://doi.org/10.3390/en16114455
Submission received: 19 April 2023 / Revised: 23 May 2023 / Accepted: 29 May 2023 / Published: 31 May 2023

Abstract

:
This paper presents a series of surface experiments simulating underground coal gasification (UCG). The main goal of the experiments was to investigate the influence of the gasification medium and the coal rank on the gasification process. Four multi-day trials were carried out using a laboratory gasification facility designed for the large-scale experimental simulations of UCG and located in the Experimental Mine “Barbara”, located at Mikołów, Poland. Two Polish bituminous coals were investigated: coal sourced from “Piast-Ziemowit” mine and coal sourced from “Wesoła” mine. Each of the two coals was gasified in two separate experiments using oxygen-enriched air (OEA) and pure oxygen as the respective gasifying agents. Gasification with oxygen resulted in significantly higher gas quality and higher process efficiency than gasification with OEA. Higher concentrations of hydrogen (23.2% and 25.5%) and carbon monoxide (31.8% and 33.4%) were obtained when oxygen was used as a gasifying reagent, while lower concentrations were obtained in the case of gasification with OEA (7.1% and 9.5% of hydrogen; 6.4% and 19.7% of carbon monoxide). Average gas calorific values were 7.96 MJ/Nm3 and 9.14 MJ/Nm3 for the oxygen experiments, compared to 2.25 MJ/Nm3 and 3.44 MJ/Nm3 for the OEA experiments (“Piast-Ziemowit” coal and “Wesoła” coal, respectively). The higher coalification degree of “Wesoła” coal (82.01% of carbon) compared to the “Piast-Ziemowit” coal (68.62% of carbon) definitely improves the gas quality and energy efficiency of the process. The rate of water condensate production was higher for the oxygen gasification process (5.01 kg/h and 3.63 kg/h) compared to the OEA gasification process (4.18 kg/h and 2.63 kg/h, respectively), regardless of the type of gasified coal. Additionally, the textural characteristics (porosity development) of the chars remaining after coal gasification experiments were analyzed. A noticeable development of pores larger than 0.7 nm was only observed for the less coalified “Piast-Ziemowit” coal when analyzed under the more reactive atmosphere of oxygen.

1. Introduction

The pursuit of net-zero CO2 emissions due to global environmental policies requires the constant search for cost-effective technologies and new technological models of coal mining. It is also a contributing factor to the reconsideration of the possibility of underground coal gasification, which was first devised over a hundred years ago [1,2].
Although the idea of underground coal gasification (UCG) has its opponents and protagonists, a technology that obtains gas directly from coal deposit in situ, without the need for coal extraction, and is characterized by high resource utilization rate, is still interesting and can bring some environmental and economic benefits [3]. UCG enables access to coal resources that are difficult to exploit due to their deep location, complex geological conditions or tectonic faults [4,5,6,7]. Most coal-based economy regions, e.g., the United States, China, South Africa, the United Kingdom, India, Poland, Canada, Australia, Slovakia and Hungary, recently renewed their interest and activity in the area of research and development of UCG projects [8,9,10,11]. Previously conducted research focused not only on the technological aspects of the process, but also on coupling UCG with other applicable technologies, e.g., carbon capture and storage (CCS) [12,13]. The use of post-mining voids left after the coal gasification process seems promising for geological storage of CO2 [14,15,16].
The in situ conversion of coal into process gas, which can then be used to produce heat, electricity or syngas, requires the use of a gasifying agent. The selection of gasifying agents depends on the prevailing conditions, coal seam and surrounding strata properties, as well as the intended use of the produced gas. The steam, CO2, oxygen or a mixture of air and oxygen may be applied as a feed gas in UCG [17,18]. Depending on the gasifying agent and other process conditions (such as temperature, pressure, addition of water, concentration and flow of pure oxygen), gases of various compositions are obtained, with the most valuable gas components (in terms of high calorific value) being methane, hydrogen and carbon monoxide.
Gasification in an atmosphere of pure oxygen, where carbon dioxide is present in high concentrations in the obtained gas, is also a beneficial solution in terms of the use of CCS technology. Pure oxygen is also suitable for a coal seam with high ash content and can assure the obtaining of high calorific product gas. However, it should be taken into account that this type of gasification agent requires the use of an air separation unit (ASU), which can significantly increase the operating costs of the entire process [18]. Cost reduction may be achieved using oxygen-enriched air (OEA) as a gasifying medium. Although the application of OEA will provide the flame stability during the UCG process, the generated product gas may contain a significant amount of nitrogen, which should be separated in the case of coupling UCG with CCS [18]. According to Yin et al. (2020) [19], who studied gasification with H2O and CO2, the type of gasifying agent has a great influence on the pore structure of the char obtained via gasification. Water participating in the gasification process can modify the physicochemical properties of char. Studies on this effect [20] showed that the reaction of water with coal disrupts the primary macromolecular structure of the coal surface. This disruption opens pores, which increase permeability, allowing the products of gasification to escape to the outside [21].
The composition and properties of the gasified coal also affect the overall UCG process. Coal seams consist of organic matter, mineral substances and moisture; however, the content of inorganic matter may have a significant impact on the gasification process course [22]. The increase in temperature, decomposition of volatile matter and intermolecular fracture lead to a change in the internal structure characteristics of coal, including the pore structure and permeability of coal [23,24,25]. Therefore, the study of the gasification by-products such as chars remaining after UCG is important not only for optimal UCG process management and the transportation of the gasifying agent, but also from the point of view of the quality of the produced gas. Studies on the pore structure change in the gasified coals of different ranks and under different gasifying agents allow us to determine the transport conductivity of gasification agents and gaseous products during the gasification process.

2. Problem Statement

The main purpose of the experiments described in this paper was to confirm the influence of the coal rank and the type of gasification medium on both the course of the gasification process and the physicochemical properties of the process by-products. Two coals differing in the coalification degree were gasified in the atmosphere of oxygen-enriched air (two experiments) and pure oxygen (two experiments). Experimental simulations of the UCG were carried out in an ex situ installation under ambient pressure. Detailed process characteristics, including process balance data, production of water condensate, gas composition and its calorific value and temperature distribution, allowed us to realize the purposes of the research. Characterization of chars potentially remaining in the cavity after UCG, including analysis of physical adsorption and porous texture, aimed to determine the reactivity of post-process char with respect to CO2. The research presented in the work may constitute a fundamental starting point for more advanced research and the development in implementing low carbon emission energy in UCG processes.

3. Experimental

Four large-scale surface experimental UCG simulations were carried out using two coals obtained from the Upper Silesian coal deposits and in the presence of different gasifying agents. The main aim of the gasification tests was to improve understanding of in situ coal gasification using different reagents (oxygen-enriched air and oxygen) in relation to the production of UCG wastewaters and physicochemical characteristics of post-gasification solid residues. In the first phase, two surface experimental UCG simulations were conducted with the use of a coal sample from “Piast-Ziemowit” coal mine. Within the second phase, two UCG gasification tests were carried out, both using the “Wesoła” coal sample. In each phase, the first experiment was carried out using oxygen-enriched air (OEA) (experiments No. 1 and No. 3), while for the second experiment, pure oxygen was used as the gasification reagent (experiments No. 2 and No. 4). The experimental simulations of UCG process involved the use of the large-scale laboratory facilities of GIG’s Clean Coal Technology Centre, which are located at Experimental Mine “Barbara” in Mikołów, Poland.

3.1. Materials and Methods

The bulk samples of coal used for the gasification experiments were obtained from the “Piast-Ziemowit” and “Wesoła” coal mines, which are both located in Poland. The “Piast-Ziemowit” coal was excavated from Seam No. 308, which was located at a depth of 360–400 m and a thickness of 1.8–2.0 m, with the angle of dip being between 2° and 8°. Interchangeable layers of mudstone, siltstone and sandstone exit above and below the seam. The “Wesoła” coal came from seam 510. The thickness of this seam varied from 9 to 12 m, and the depth of coal deposition was 850 m.
The basic properties of raw coals used for gasification are presented in Table 1. The proximate and ultimate analysis of coal was carried out in a certified laboratory at the Central Mining Institute (GIG, Katowice, Poland) according to appropriate standards.
The raw coal sample from “Wesoła” coal mine had a significantly lower content of moisture and ash than the coal sourced from “Piast-Ziemowit” mine. Much higher carbon content and calorific value could be noted in the case of “Wesoła” coal, which was also characterized by a higher reflectance of vitrinite value (0.83% vs. 0.57% in “Piast-Ziemowit” coal). Both analyzed coals had a relatively high content of volatile matter (approx. 30%) and, according to the UN-ECE [32], could be classified as medium-rank bituminous coals [33,34].

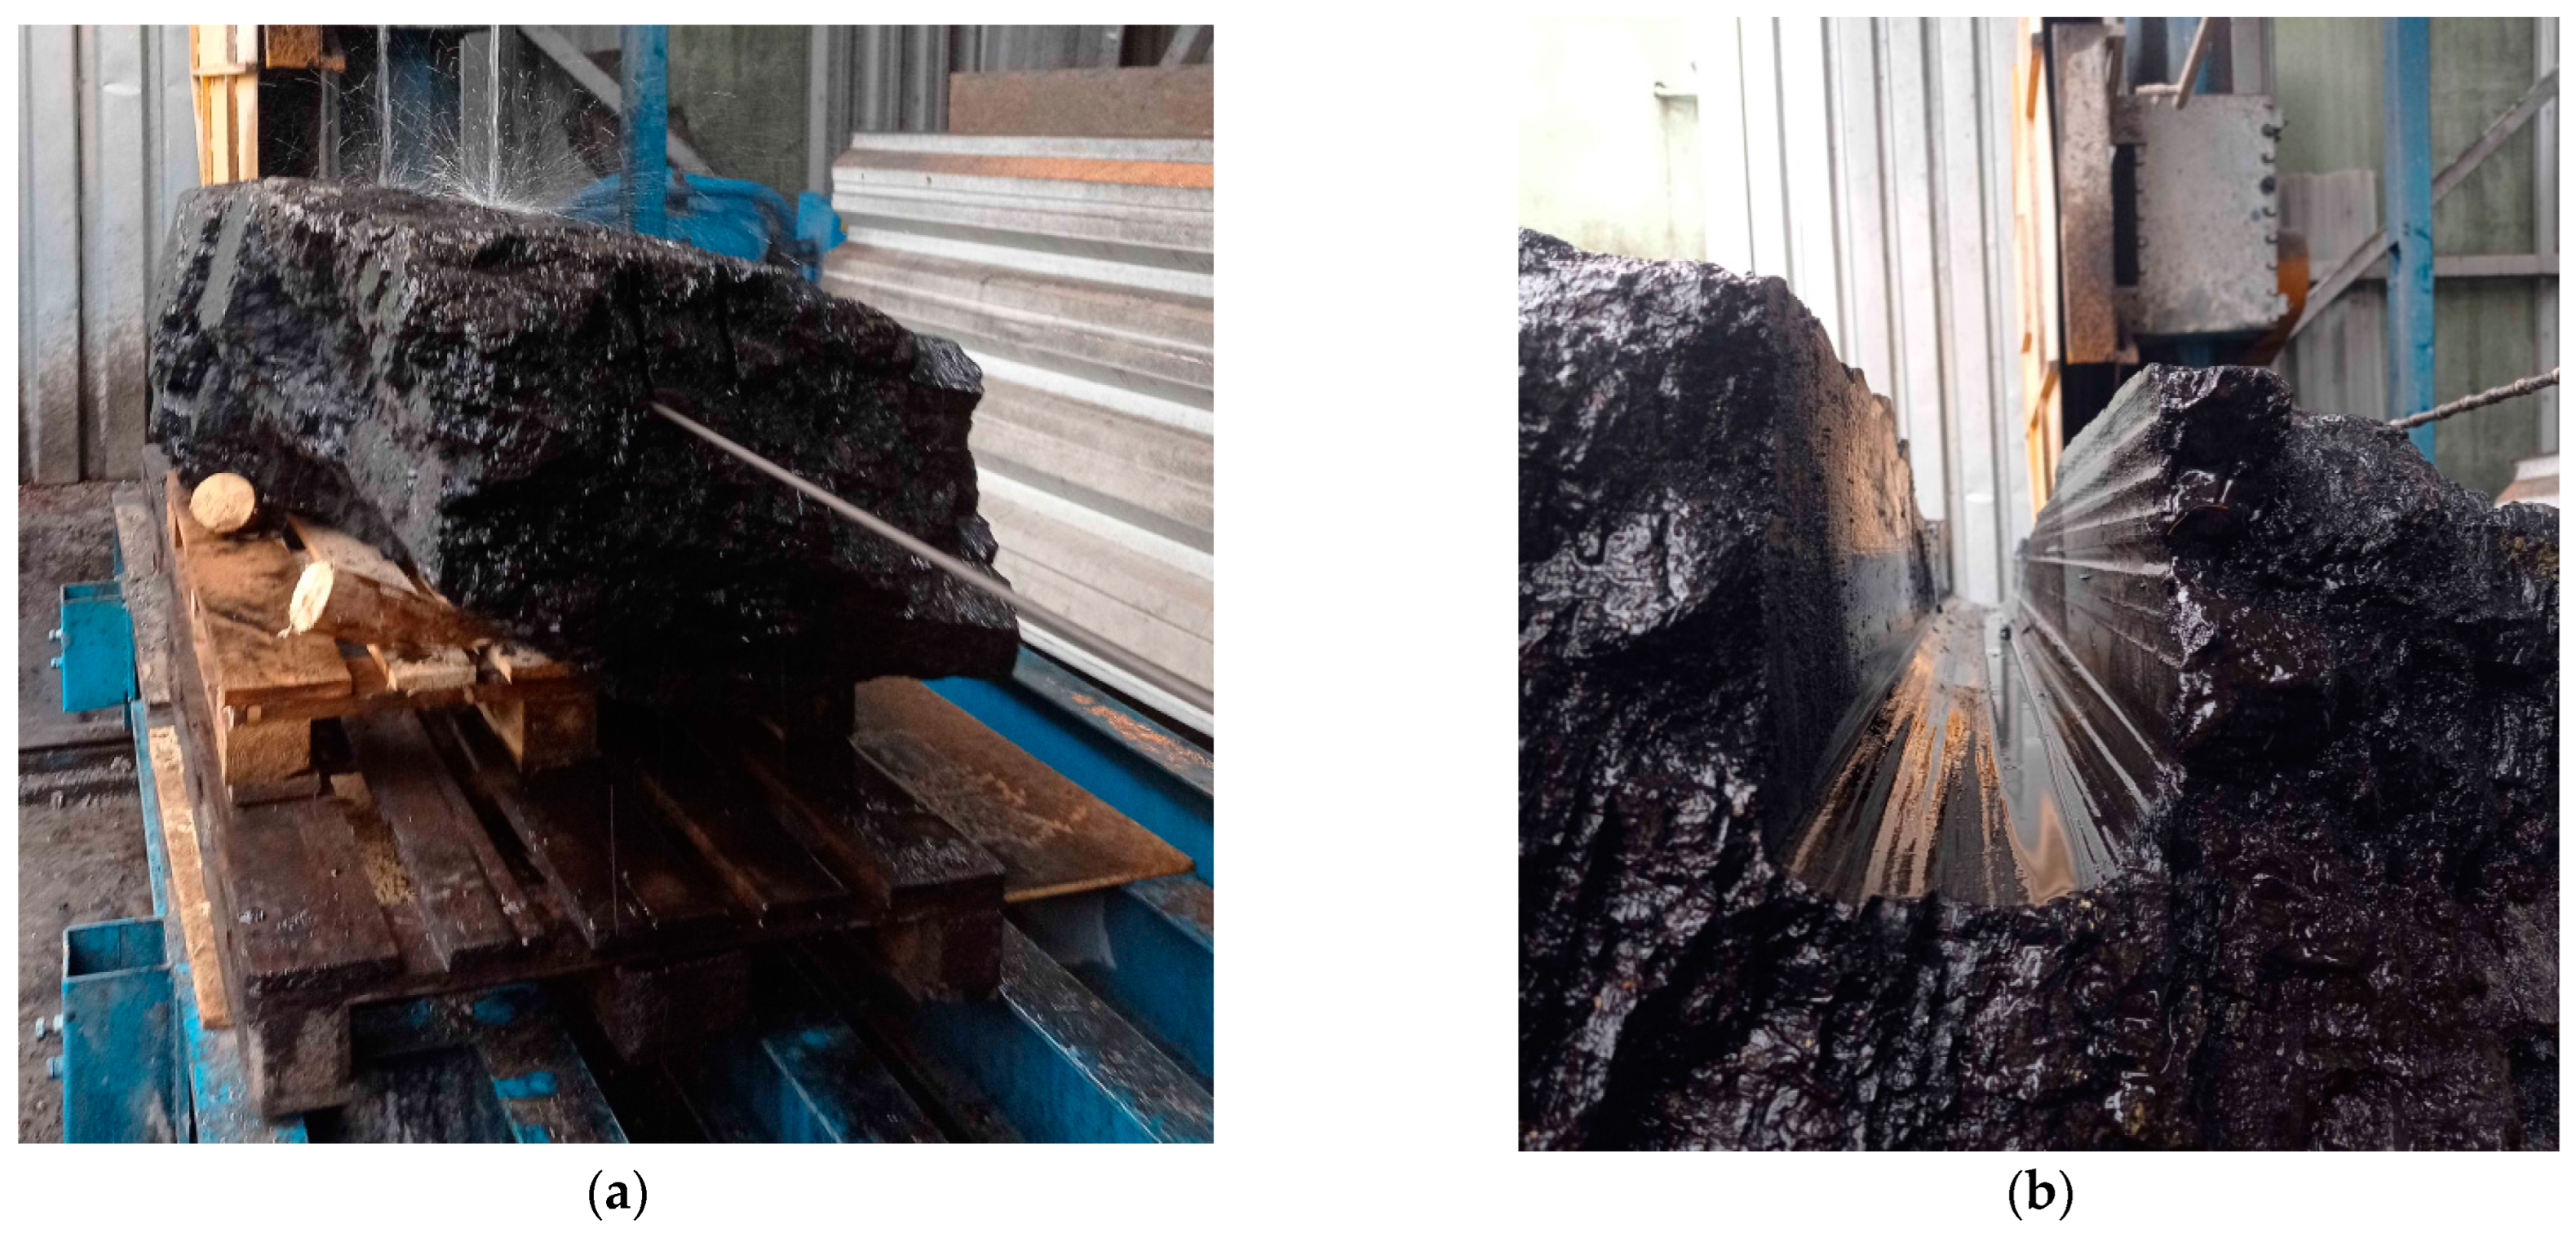
Preparation of Coal Blocks for Gasification

The coal blocks provided by PGG SA (a Polish mining company) were very irregular in shape and had to be adjusted to the geometry of the reactor through cutting using a line saw at a separate block-cutting station. For test No. 1, the cut coal block had approximate dimensions of 0.6 × 0.8 × 2.5 m, while for test No. 2, dimensions were roughly 0.5 × 0.7 × 2.0 m. For test No. 3, the cut coal block had approximate dimensions of 0.5 × 0.7 × 2 m, while for test No. 4, dimensions were roughly 0.6 × 0.8 × 2.5 m. A gasification channel with a cross-section of 0.1 × 0.1 m was cut in the lower part of the coal blocks along their entire length. This process enabled the gasifying reagents to be supplied to the reaction site and the gasification products to be discharged. Preparation of the coal block for gasification and a view of the reactor are shown in Figure 1a–d.
The empty spaces in the reactor were insulated by a wet sand layer, which simulated the moisture in the environment of the gasified coal. Wet sand was also used as a source of the water required for the UCG process. The weight of wet sand used for each experiment was approximately 7 t. The content of moisture in the sand in each experiment was about 9.0% by mass and was measured in accordance with the PN-G-04511:1980 standard [35]. The moisture in the sand was the result of outdoor storage, where it was exposed to the prevailing weather conditions.

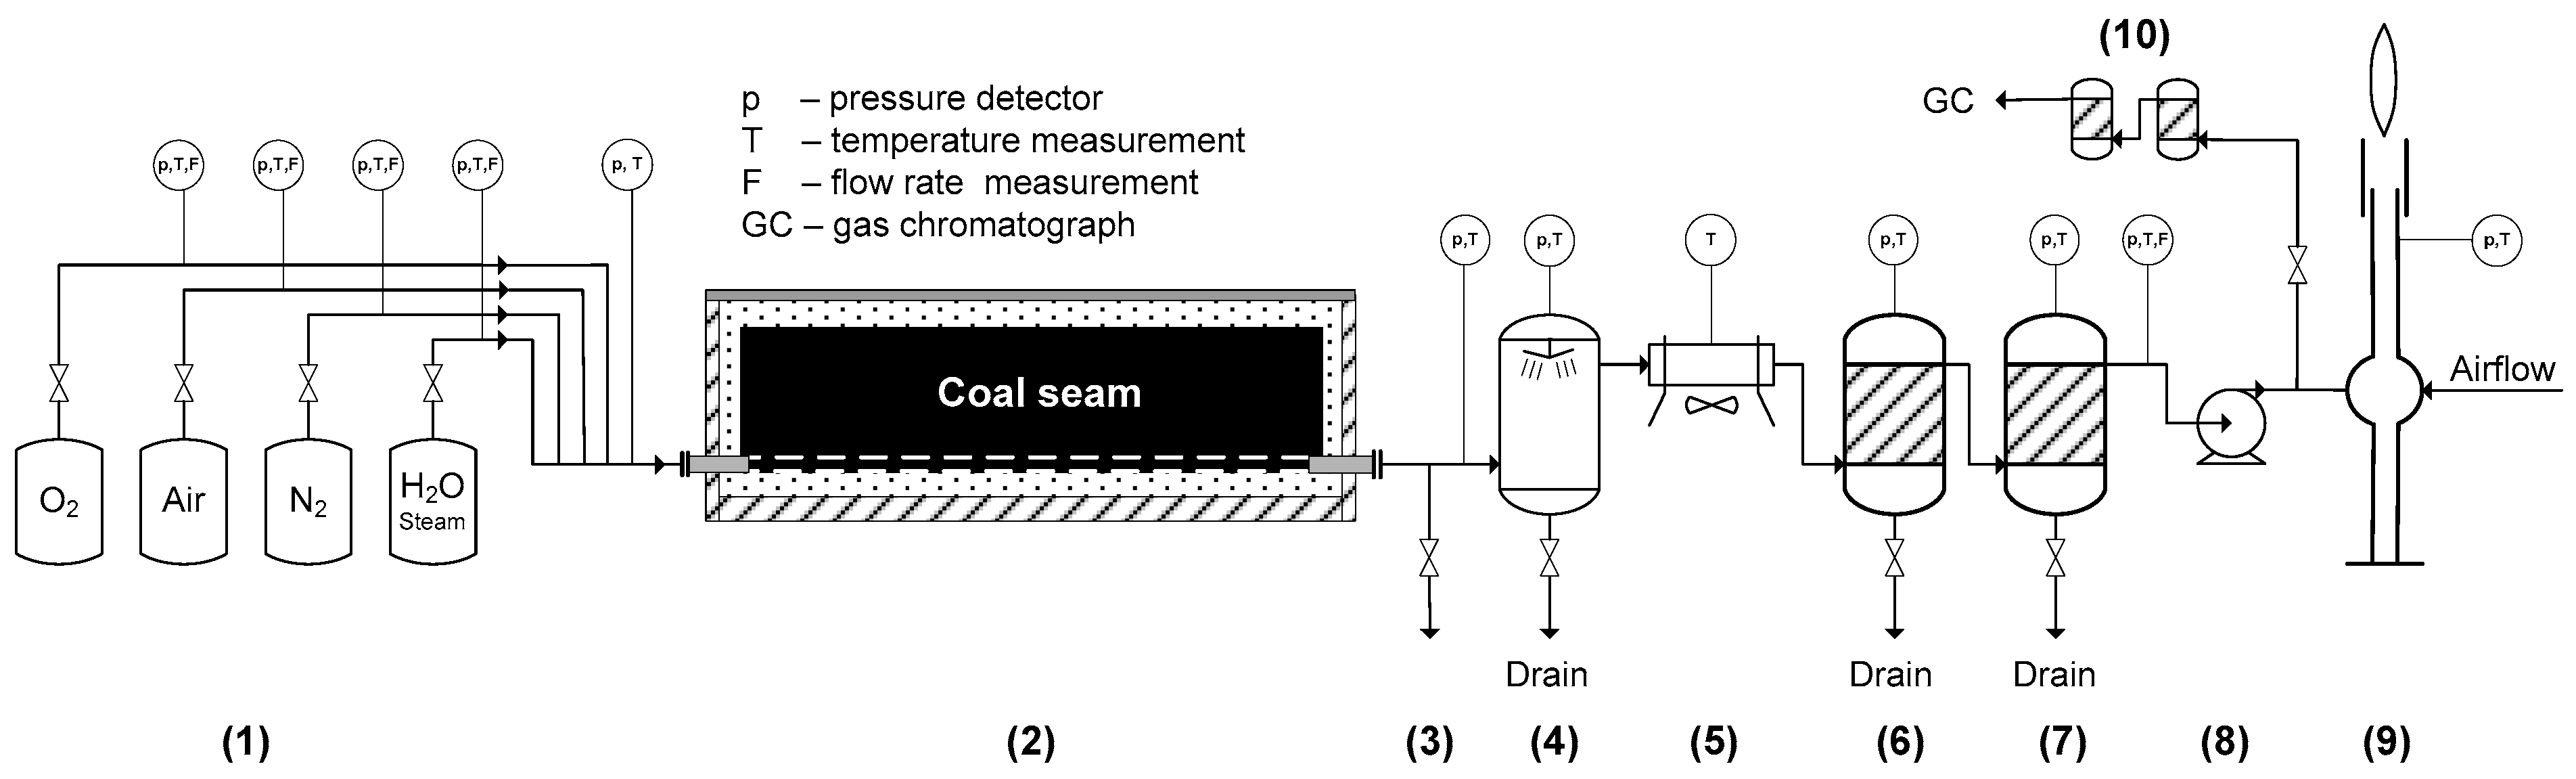
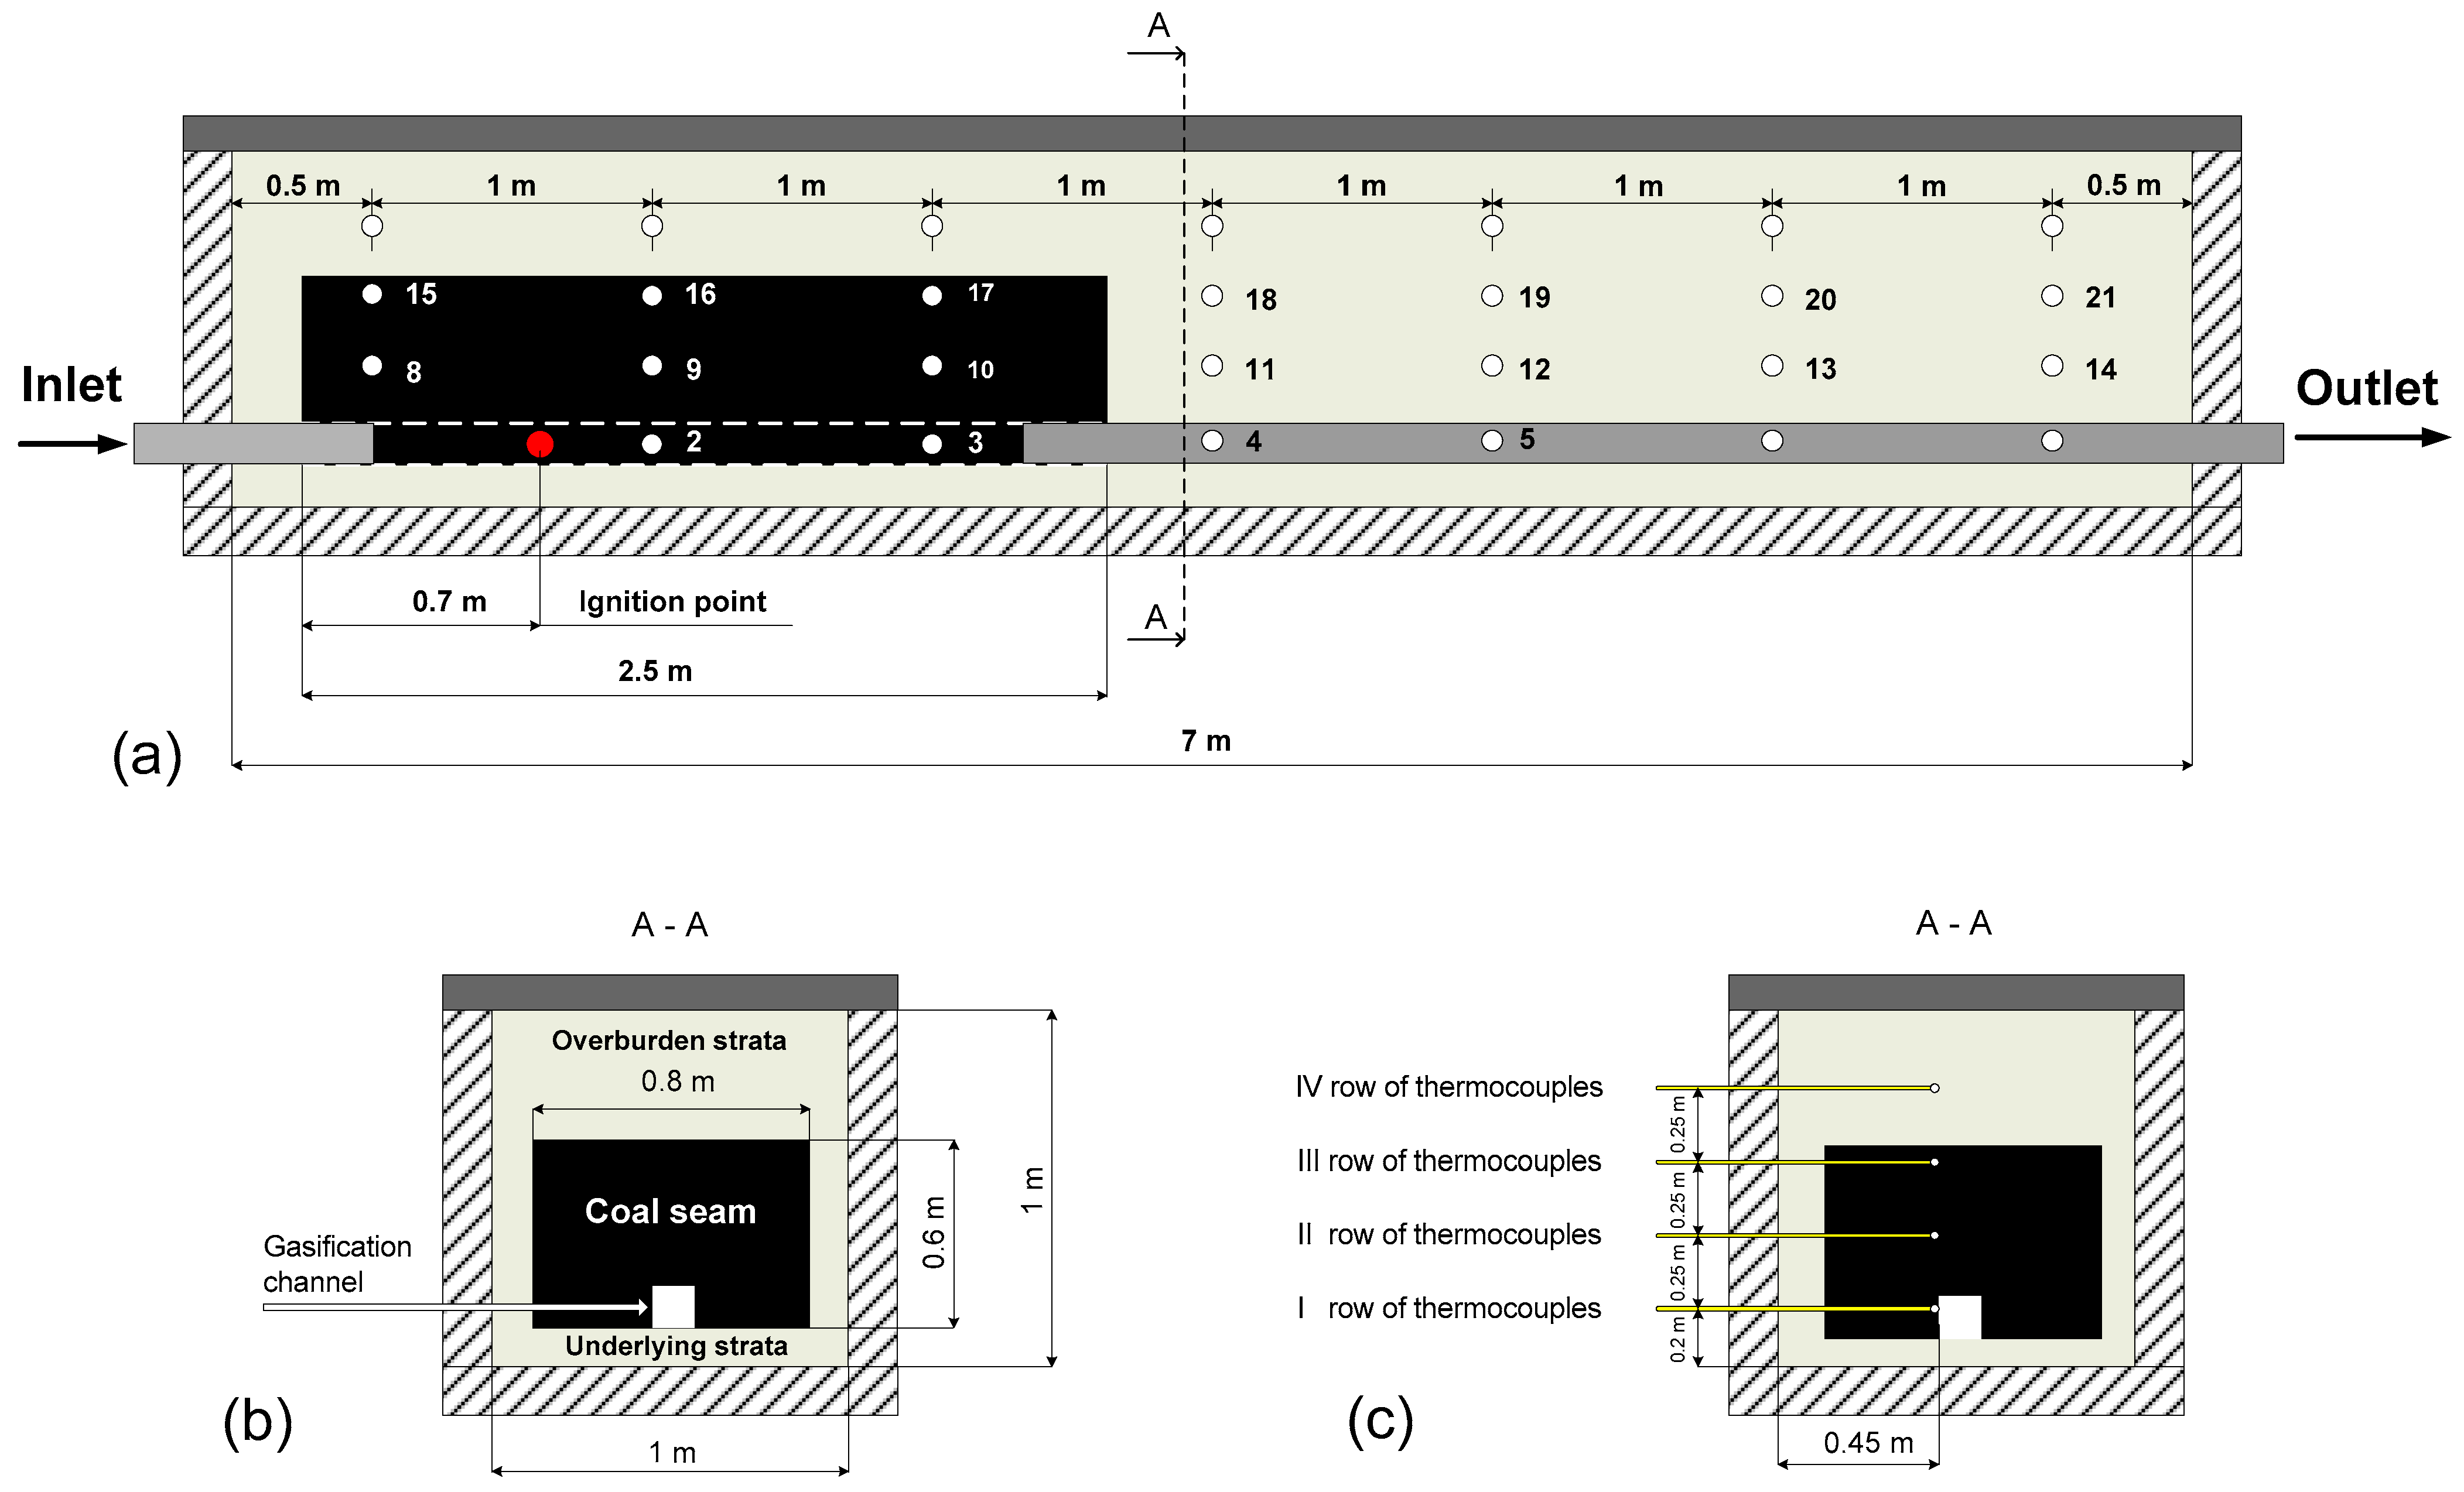
3.2. Installation for the Ex-Situ Coal Gasification

The ex situ UCG installation allowed gasification tests to be carried out in a simulated coal seam, with a maximum length of 7.0 m and a cross section of 1.0 × 1.0 m under atmospheric pressure. The maximum designed process temperature could be up to 1600 °C. The reactor was equipped with the necessary technical infrastructure to carry out the gasification process (dosing system of the gasifying agents, as well as collection, cleaning and utilization of the obtained process gas). Gasification could be carried out using oxygen, air and steam, either individually or in mixtures. Nitrogen was used to inert the installation and, in the final stage, to cool the reactor after the process. A schematic diagram of the installation is shown in Figure 2. The details of the reactor construction with arranged coal blocks are shown as an example for Experiment No. 1 in Figure 3.
The process gas was purified in a dedicated separation and cleaning module, the first element of which was a water scrubber (rapid gas cooling and condensation of process tars). The gas was then directed to the air cooler, separators for moisture, tar substances and solid particles. Part of the gas stream is directed to a separate gas path for chemical analysis, where concentrations of the main gas components, such as hydrogen, carbons monoxide and dioxide, methane, ethane and hydrogen sulphide, were determined via gas chromatography. The temperature profiles of the reacting system were measured using a 28-thermocouple setup placed at different heights in a simulated coal bed and overburden layer. The length of each thermocouple (0.45 m) was selected to ensure that the temperature could be measured as close as possible to the fire channel both inside and outside the gasified bed. The white circles in Figure 3a,c indicate the location of thermocouples, while the numbers next to the circles indicate the thermocouples actually used in the process. The first row of thermocouples (T2–T5) was placed at the level of the gasification channel at a distance of 0.2 m from the bottom of the reactor. The second and third rows of thermocouples (T8–T14 and T15–T21) were placed every 0.25 m higher. Thermocouple T1, which was closest to the oxygen inlet, was removed due to its unfavorable position relative to the supply pipeline. For tests No. 1, 3 and 4, thermocouples T2–T3, T8–T10 and T15–T17 measured temperatures in the gasified coal seam, and the other thermocouples measured temperatures in the sand layer. For test No. 2, the number of thermocouples measuring temperatures directly in the gasified coal seam was smaller (thermocouples T2–T3 and T8–T10), while the remaining thermocouples (T11–T21) measured temperatures in the sand layer. In all tests, thermocouples T4–T5 measured temperatures in the area of the output pipeline outside the coal block. The control apparatus recorded data every 10 s. All results were calculated based on normal conditions (T = 273.15K, p = 1013.25 hPa).

3.3. Measurements of Gaseous Media

The list of measuring equipment and methods used is shown in Table 2.

3.4. Experimental Procedure

The general process assumptions and a summary of basic information about the UCG experiments are presented in Table 3. The gasification agents, which were technical oxygen of 99.95% purity, were taken from a bundle of oxygen cylinders and air supplied via a compressor.
The tests were initiated by switching on the suction fan and igniting the coal seam with a pyrotechnic charge. The ignition charge was placed at a distance of 0.7 m from the front face of the coal block. The ignition process was initiated at an oxygen flow rate of 2 Nm3/h, and a few minutes after igniting the coal, the oxygen flow rate was increased to 3 Nm3/h. The initiation of the process was considered complete when the oxygen concentration in the process gas dropped to a value of less than 1%. At that point, depending on the type of test carried out, the administration of gasifying agents (OEA for test No. 1 and 3 or oxygen only for test No. 2 and 4) was initiated. As the flow rate of the feed gasifiers was variable depending on the process conditions in the reactor, accurate data on these quantities are presented in the experimental part of this report. In order to prevent fouling of the process gas discharge pipelines, the pump feeding water to the scrubber was switched on simultaneously (water injection 14 kg/h). Every 2 h, the scrubber was emptied and the amount of wastewater obtained was weighed. The composition of the resulting gas was analyzed at least once per hour. After 56 h for test No. 1 or 72 h for tests Nos. 2, 3 and 4, the feed of gasifying agents was turned off and nitrogen was fed at a rate of 2 Nm3/h until the bed cooled down (to internal temperatures below 100 °C). After gasification, the reactor was dismantled. The overburden of sand was then removed and its moisture content was examined.

3.5. UCG Char Characterization

After the completion of each gasification process, the reactor was emptied of solid post-process residues. From the obtained material, averaged char samples were taken for further analysis, in accordance with the international standard ISO 18283:2006 [36], to ensure that the samples were representative for the entire batch of material.
The char samples were analyzed at the Instituto de Ciencia y Tecnología del Carbono (Oviedo, Spain). The elemental analysis of the chars was carried out in a LECO CHNS-932 microanalyzer. The final values of C, H, N and S elemental content were the result of the average of four different measurements. The ash content and humidity were obtained following the UNE32111:1995 [37] and ISO 589:2008 [38] standards, respectively. Inductively coupled plasma mass spectrometry (ICP-MS) analysis was performed using an Agilent ICP-MS 7700x. For the chemical analysis, the ashes of each char that were obtained following the UNE32111:1995 standard [37] were digested in a hydrochloric acid, nitric acid and water solution (3:1:2 ratio). The porous texture of the chars was analyzed via physical adsorption of N2 at −196 °C and CO2 at 0 °C in volumetric apparatuses (ASAP2420 from micromeritics and NOVA800 from Anton Paar). Prior to the analysis, the samples were degasified under vacuum for 18 h at 150 °C. The Brunnauer–Emmet–Teller (BET) specific surface area (SBET) was obtained through applying the BET equation to the N2 adsorption data. The total pore volume, VT, was obtained from the amount of N2 adsorbed at relative pressure of 0.975 through applying the Gurvitsch Rule. The Dubinin–Radushkevich equation was fitted to the N2 and CO2 adsorption data to obtain the N2 and CO2 micropore volumes (VDR,N2 and VDR,CO2, respectively).

4. Results and Discussion

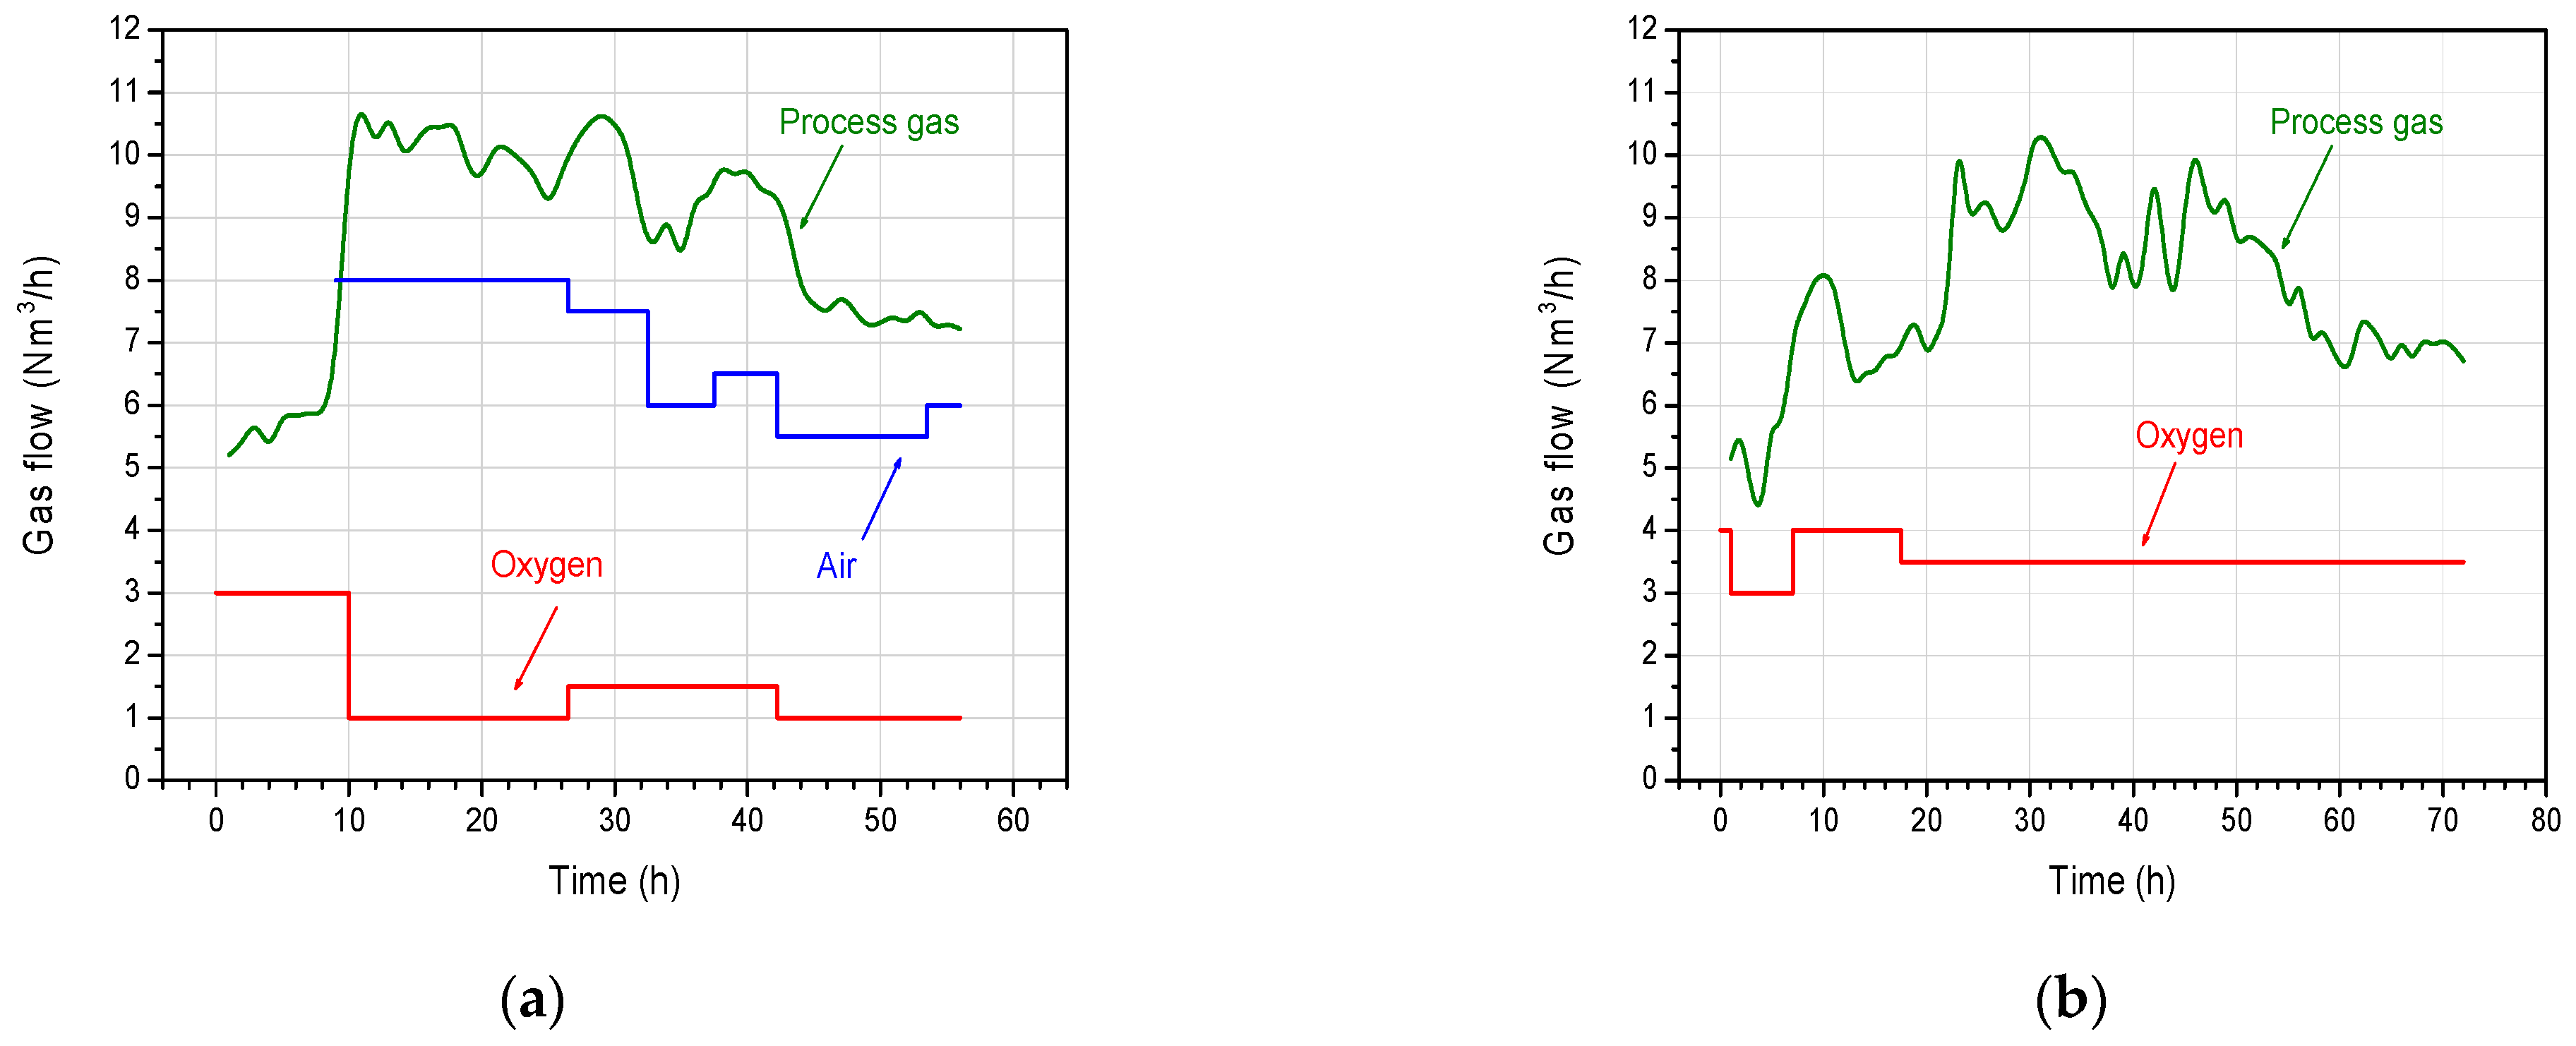
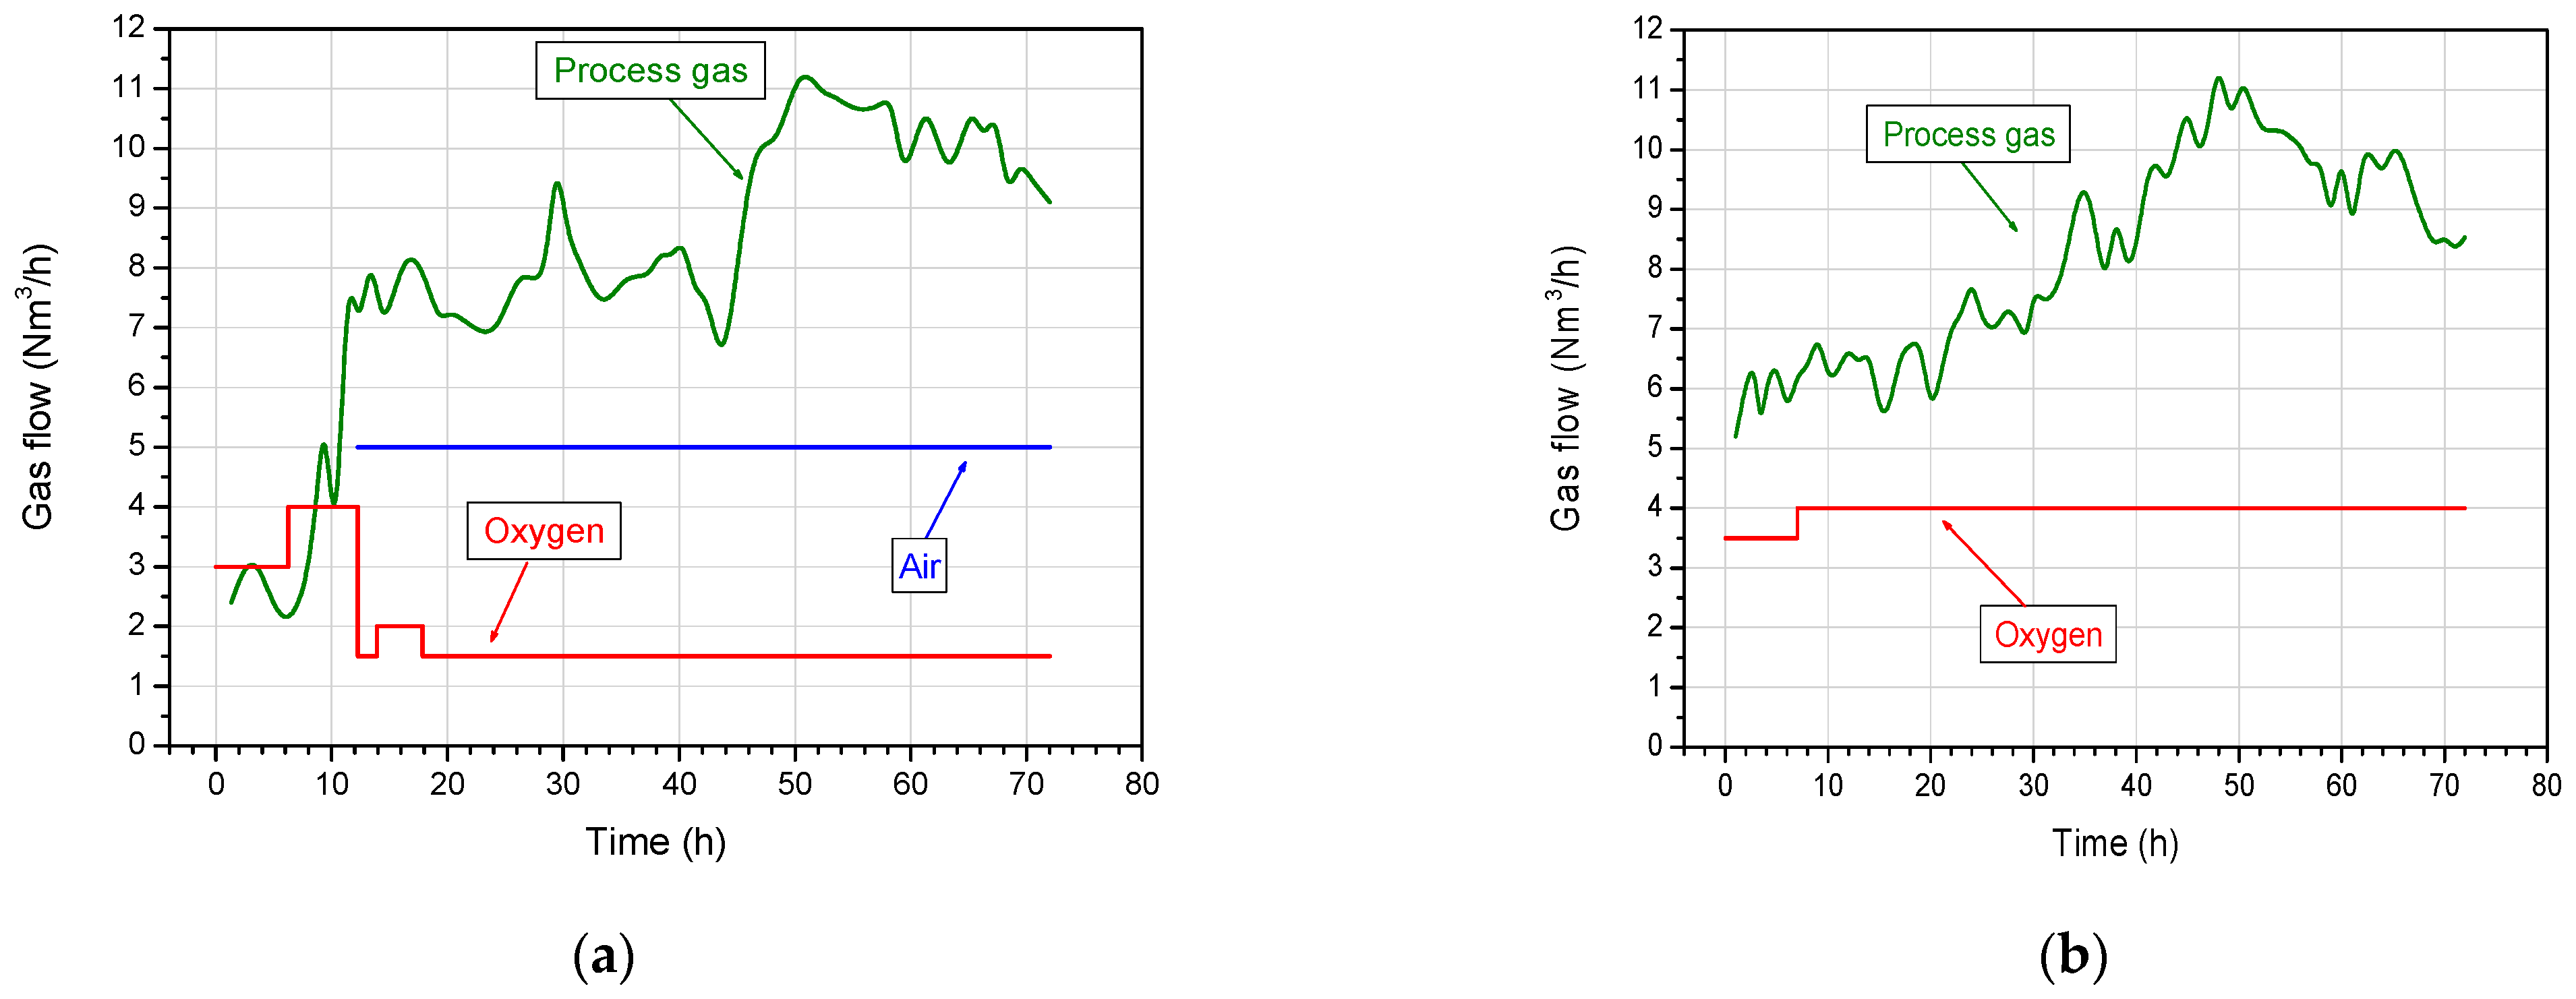
4.1. Oxidants Supply Rates and Gas Production

The gas production rates and the flow rates of the oxidising reagents are shown in Figure 4 and Figure 5. As can be seen from the graphs presented, the values of the gas production rate varied during the four experiments, with maximum values of about 10 Nm3/h in case of “Piast-Ziemowit” and about 11 Nm3/h for the “Wesoła” coal. The average oxygen concentration in the oxidising agents for test No. 1 was 37.2%, while for test No. 2, it was 100%. The average oxygen concentration in the oxidising agents for test No. 3 was 36.1%, while for test No. 4, it was 100%.
Experiment No. 1 produced 486.95 Nm3 of process gas, while experiment No. 2 produced 556.26 Nm3, with the experiments averaging 8.69 Nm3/h and 7.73 Nm3/h, respectively. It should be noted, however, that process No. 2 is much more efficient than process No 1. This relative efficiency is the result of inert nitrogen contained in the gasification agent. Experiment No. 3 produced 567.72 Nm3 of process gas, while experiment No. 4 produced 584.87 Nm3, with the experiments averaging 7.86 Nm3/h and 8.12 Nm3/h, respectively. The reason for this result is also the presence of inert nitrogen in gasification agent during process No. 3.

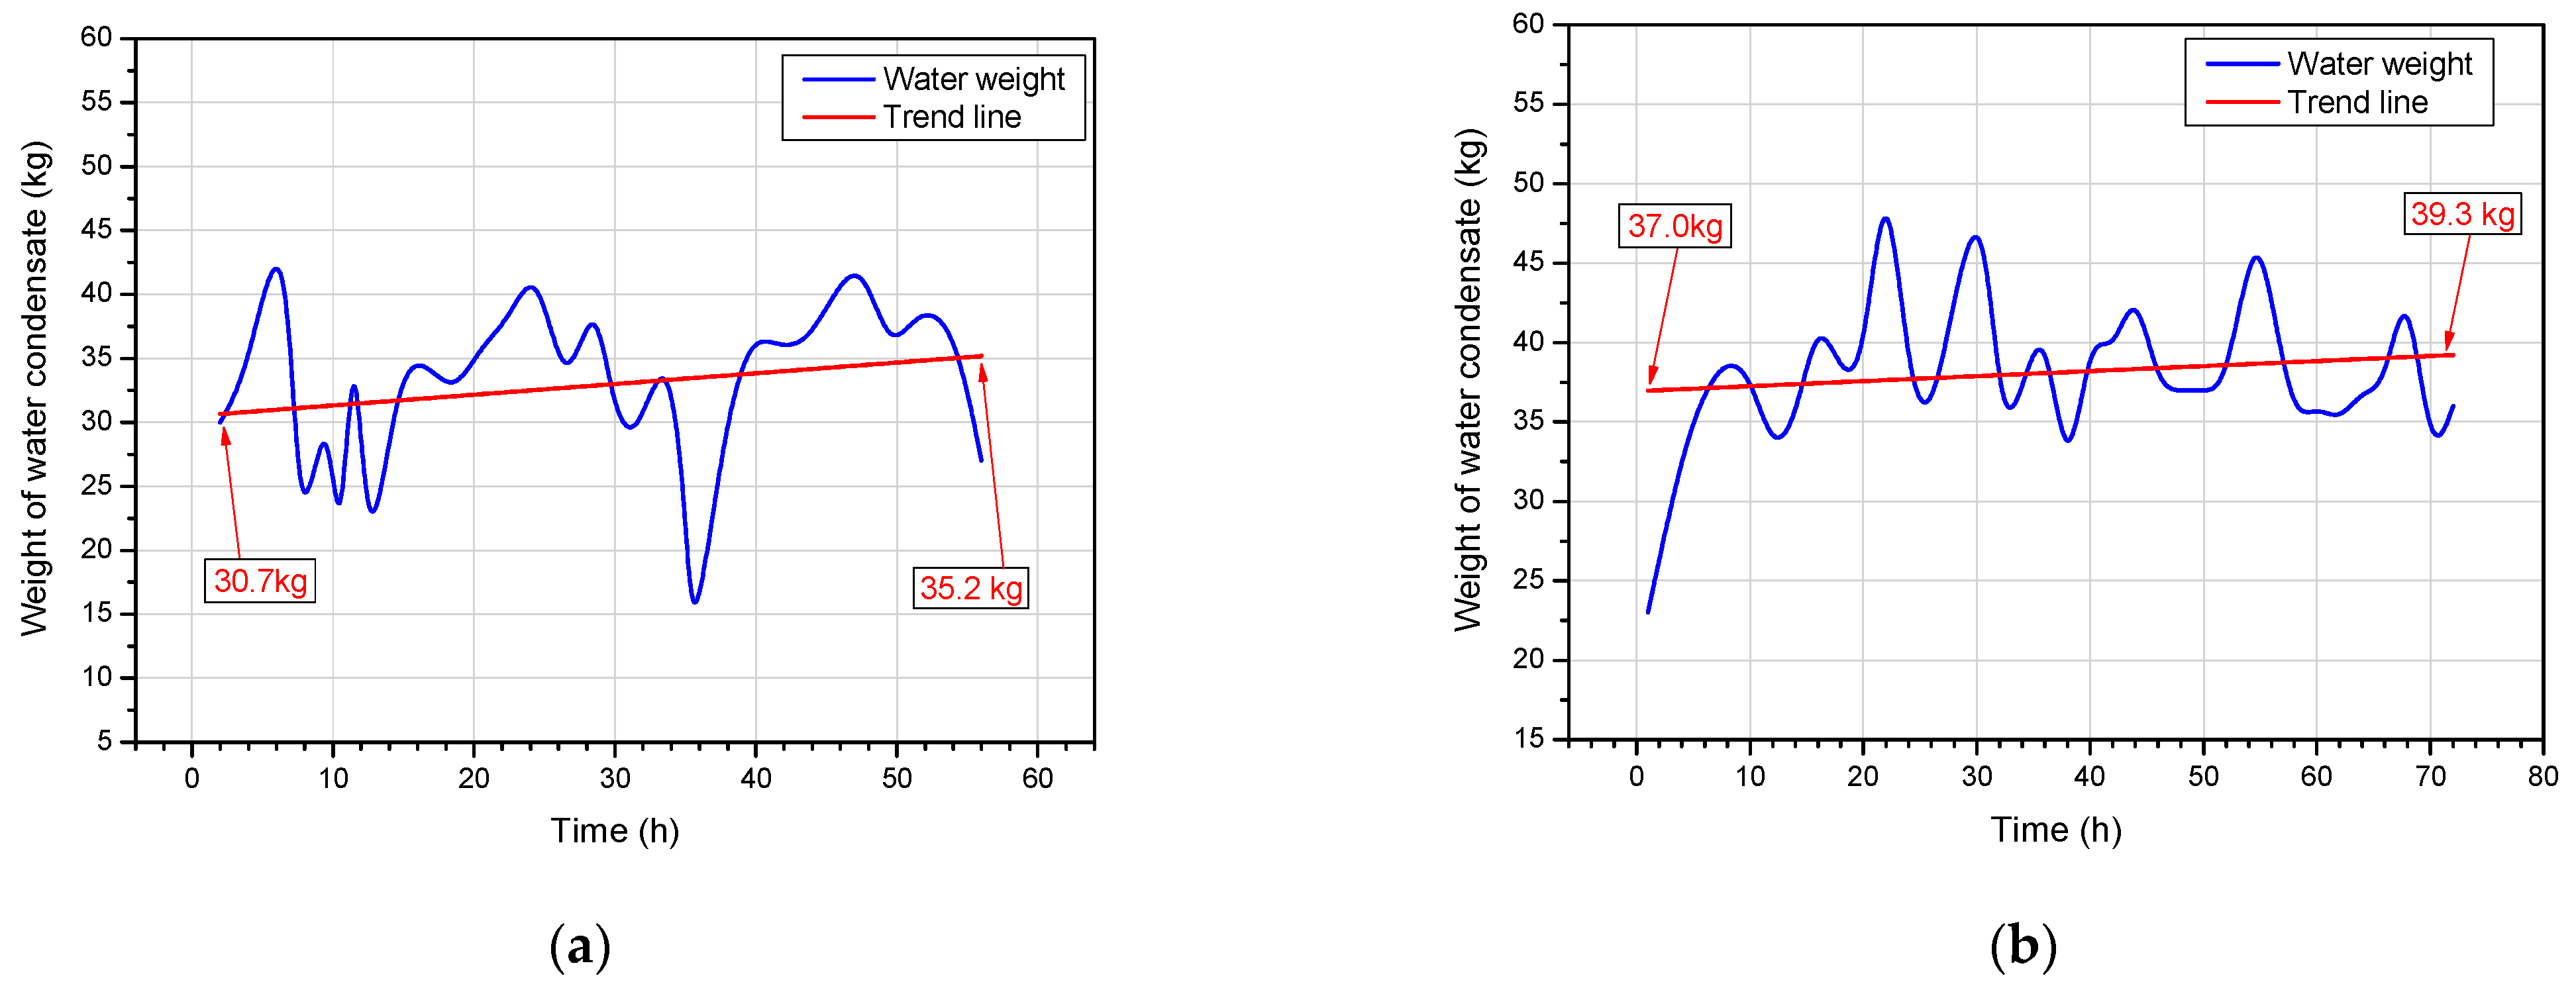
4.2. Weight of Water Condensate

The amounts of post-process water obtained were 1018 kg for test No. 1, 1372 kg for test No. 2, 1197 kg for test No. 3 and 1269 kg for test No. 4 (Table 3). The real quantity of water obtained from coal gasification was lower because the water added to the wet scrubber to cool the process gas must be subtracted. The flow rate of this water was 14 kg/h; thus, after its subtraction, the yield of process water was 234 kg and 364 kg for tests No. 1 and No. 2, respectively, and 189 kg and 261 kg for tests No. 3 and No. 4, respectively. In terms of production rate, these values are 4.18 kg/h and 5.01 kg/h for “Piast-Ziemowit” coal gasification and 2.63 kg/h and 3.63 kg/h in case of “Wesoła” coal. As the gasified blocks of coal contained only 70.2 and 45.5 kg of water for “Piast-Ziemowit”, as well as 34.1 and 37.1 kg of water for “Wesoła”, it is obvious that the separated water must have mainly originated from the evaporation of the moisture contained in the wet sand, while only some of it came from the water contained in the coal. For the experiments with pure oxygen (No. 2 and No. 4), when the gasification is more intense, the total amount of wastewater produced during UCG is higher. In the case of conducting the process in the presence of oxygen, a higher amount of coal is gasified; therefore, the amount of water per unit mass of coal is relatively lower than in the case of gasification in air. The wastewater production rate is higher in the case of gasification of “Piast-Ziemowit” coal (experiments No. 1 and 2), which can be connected to significantly higher moisture content than that contained in “Wesoła” coal (8.50% vs. 3.73%). The relatively high wastewater outflow during experiment No. 1 (with air as the gasifying agent) in reference to the coal consumption can result from high moisture in “Piast-Ziemowit” coal, unreacted steam, water evaporation or hydrogen combustion.
The production of the water condensate (without subtracting the water added to the scrubber) during the experiments is shown in Figure 6 and Figure 7.
The trend lines shown in the graphs (Figure 6 and Figure 7) indicate changes in the amounts of post-process water (water condensate) produced during all the conducted experiments. For both tests with “Piast Ziemowit” coal, the trend lines are ascending, and for the test using pure oxygen (test No. 2), the amount of water produced is higher. This result is most likely related to the high moisture content in the initial coal, which was released in greater amounts as the gasification process intensified. An inverse relationship in the course of the trend line was observed for coal sourced from the “Wesoła” mine. This trend is decreasing, which is the result of lower water content in coal subjected to gasification. However, it can be seen that the amount of water produced for the test with pure oxygen (test No. 4) is greater for test No. 3. This result, similarly to the previous coal, indicates that the intensity of gasification is greater in the presence of pure oxygen than when using an OEA mixture.

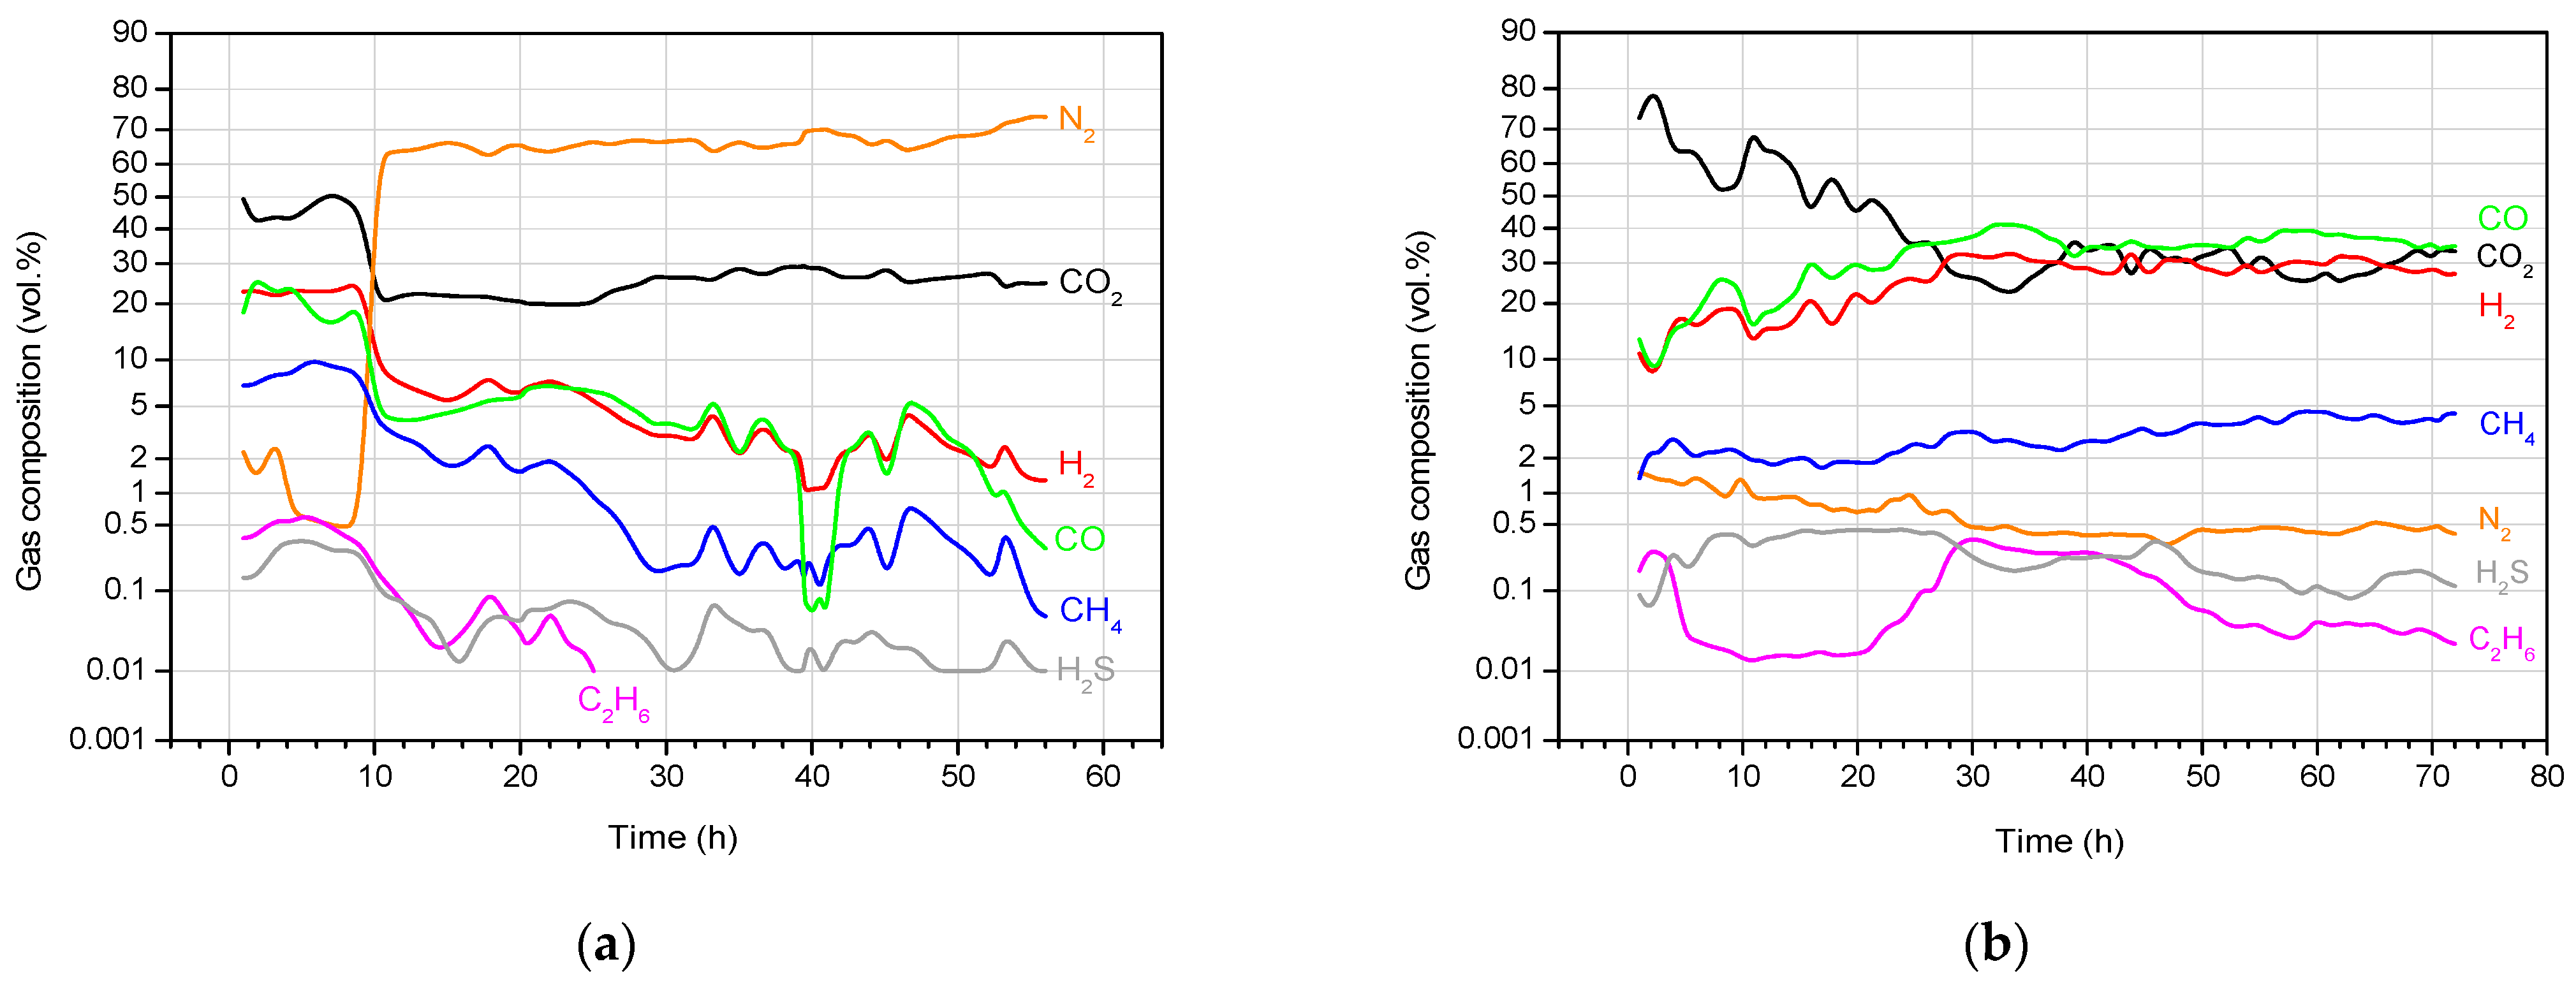
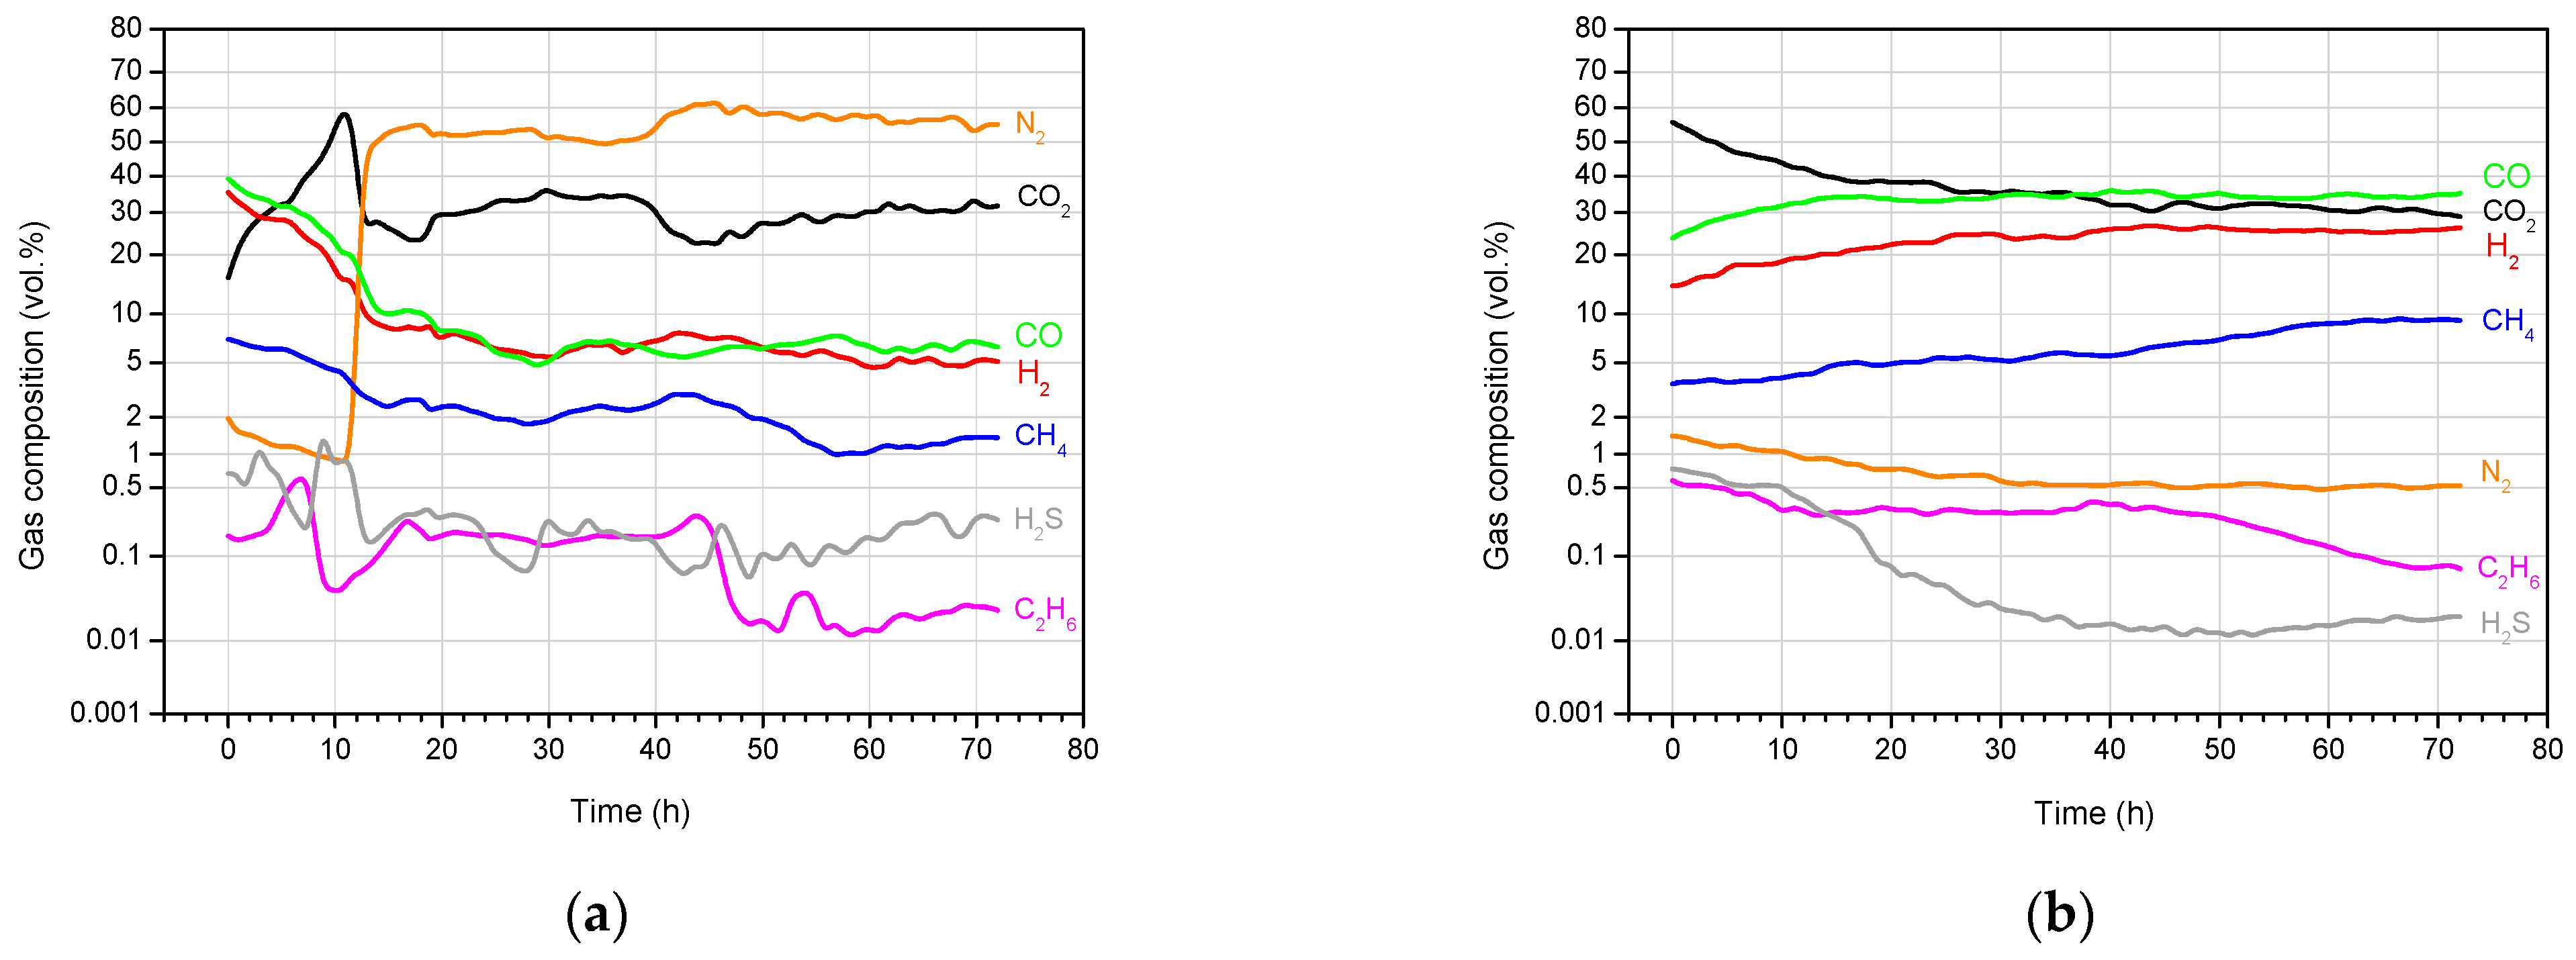
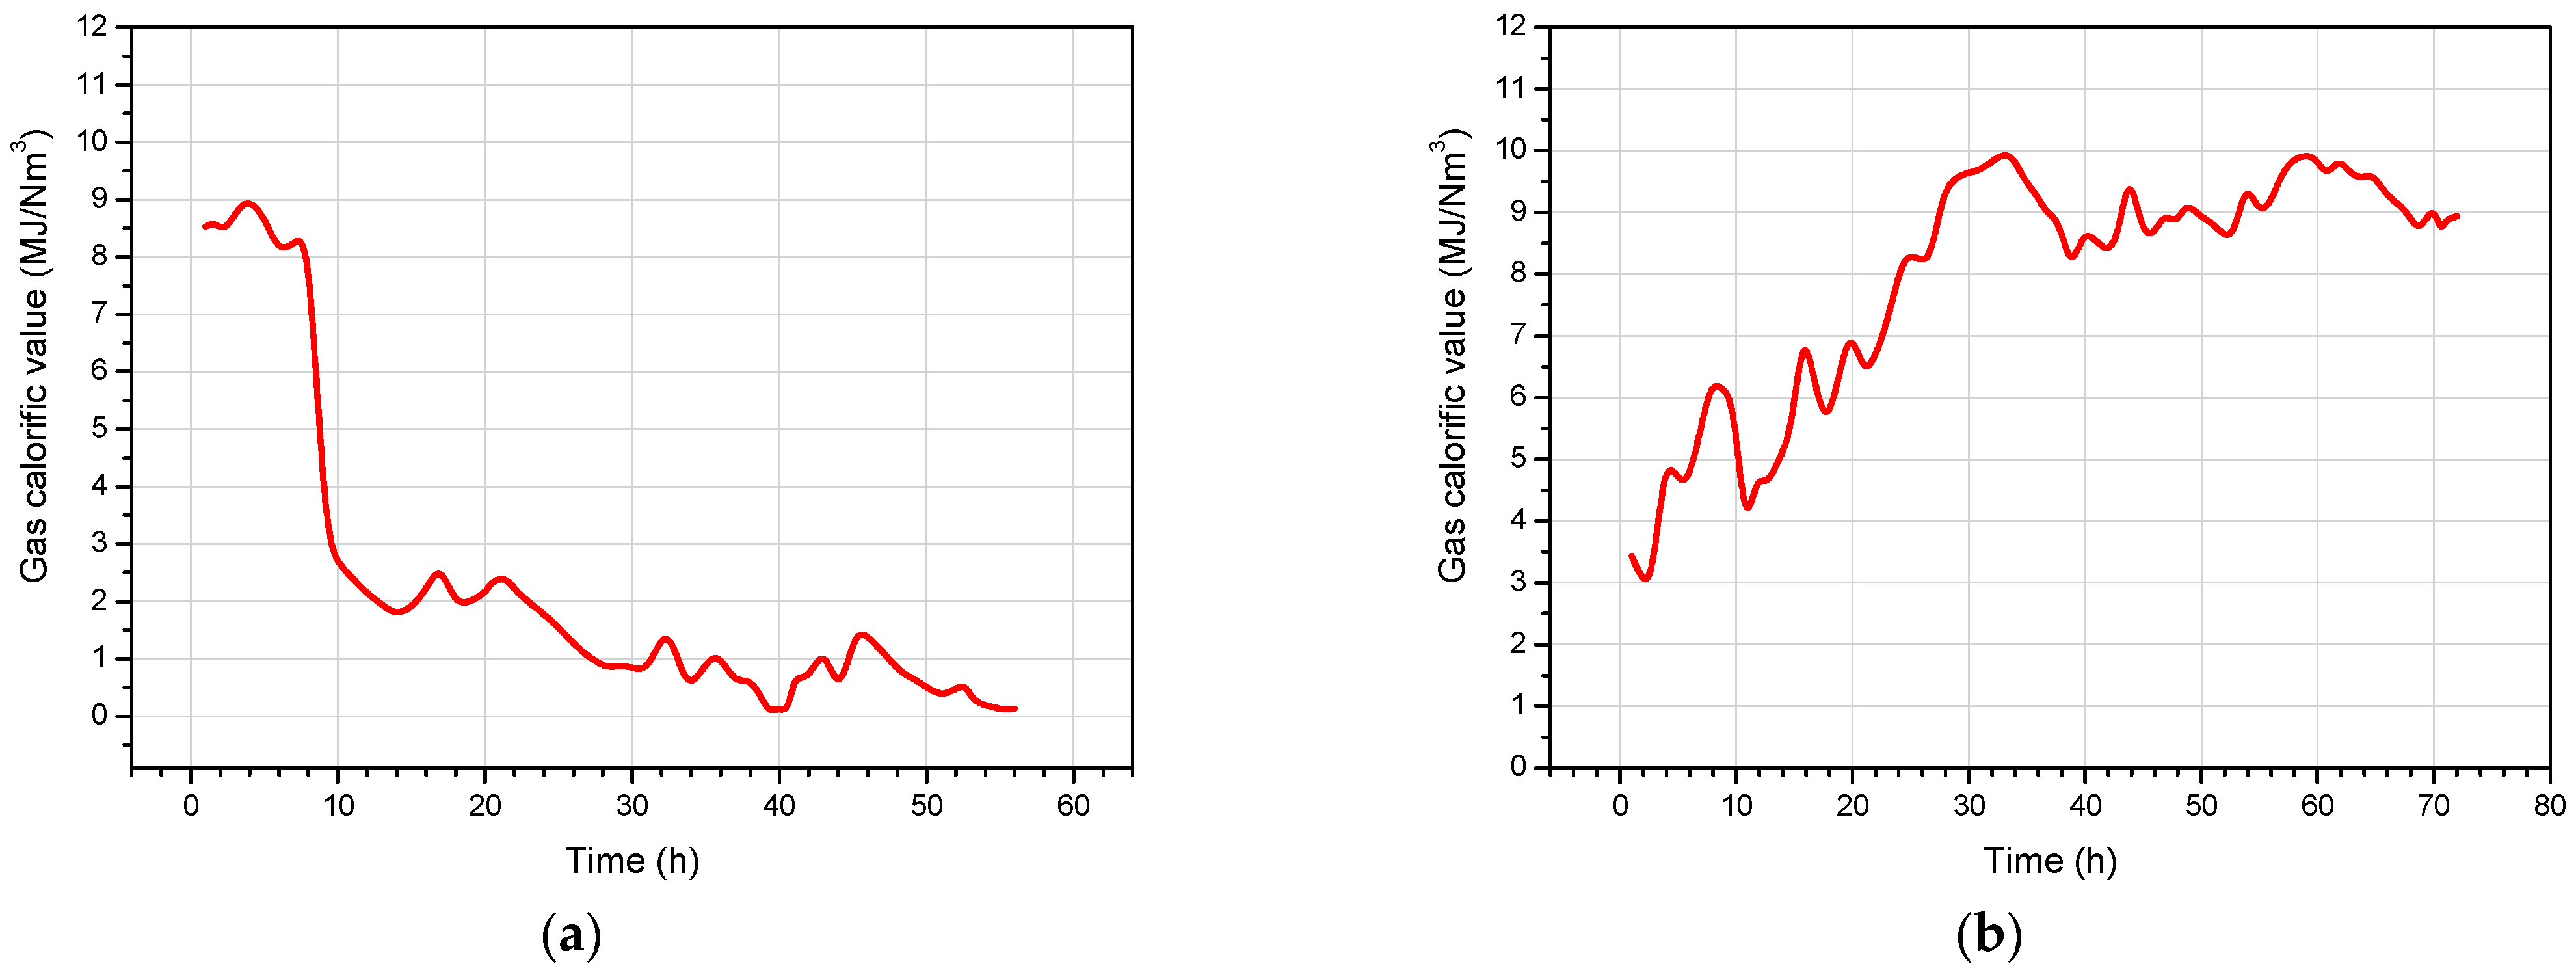
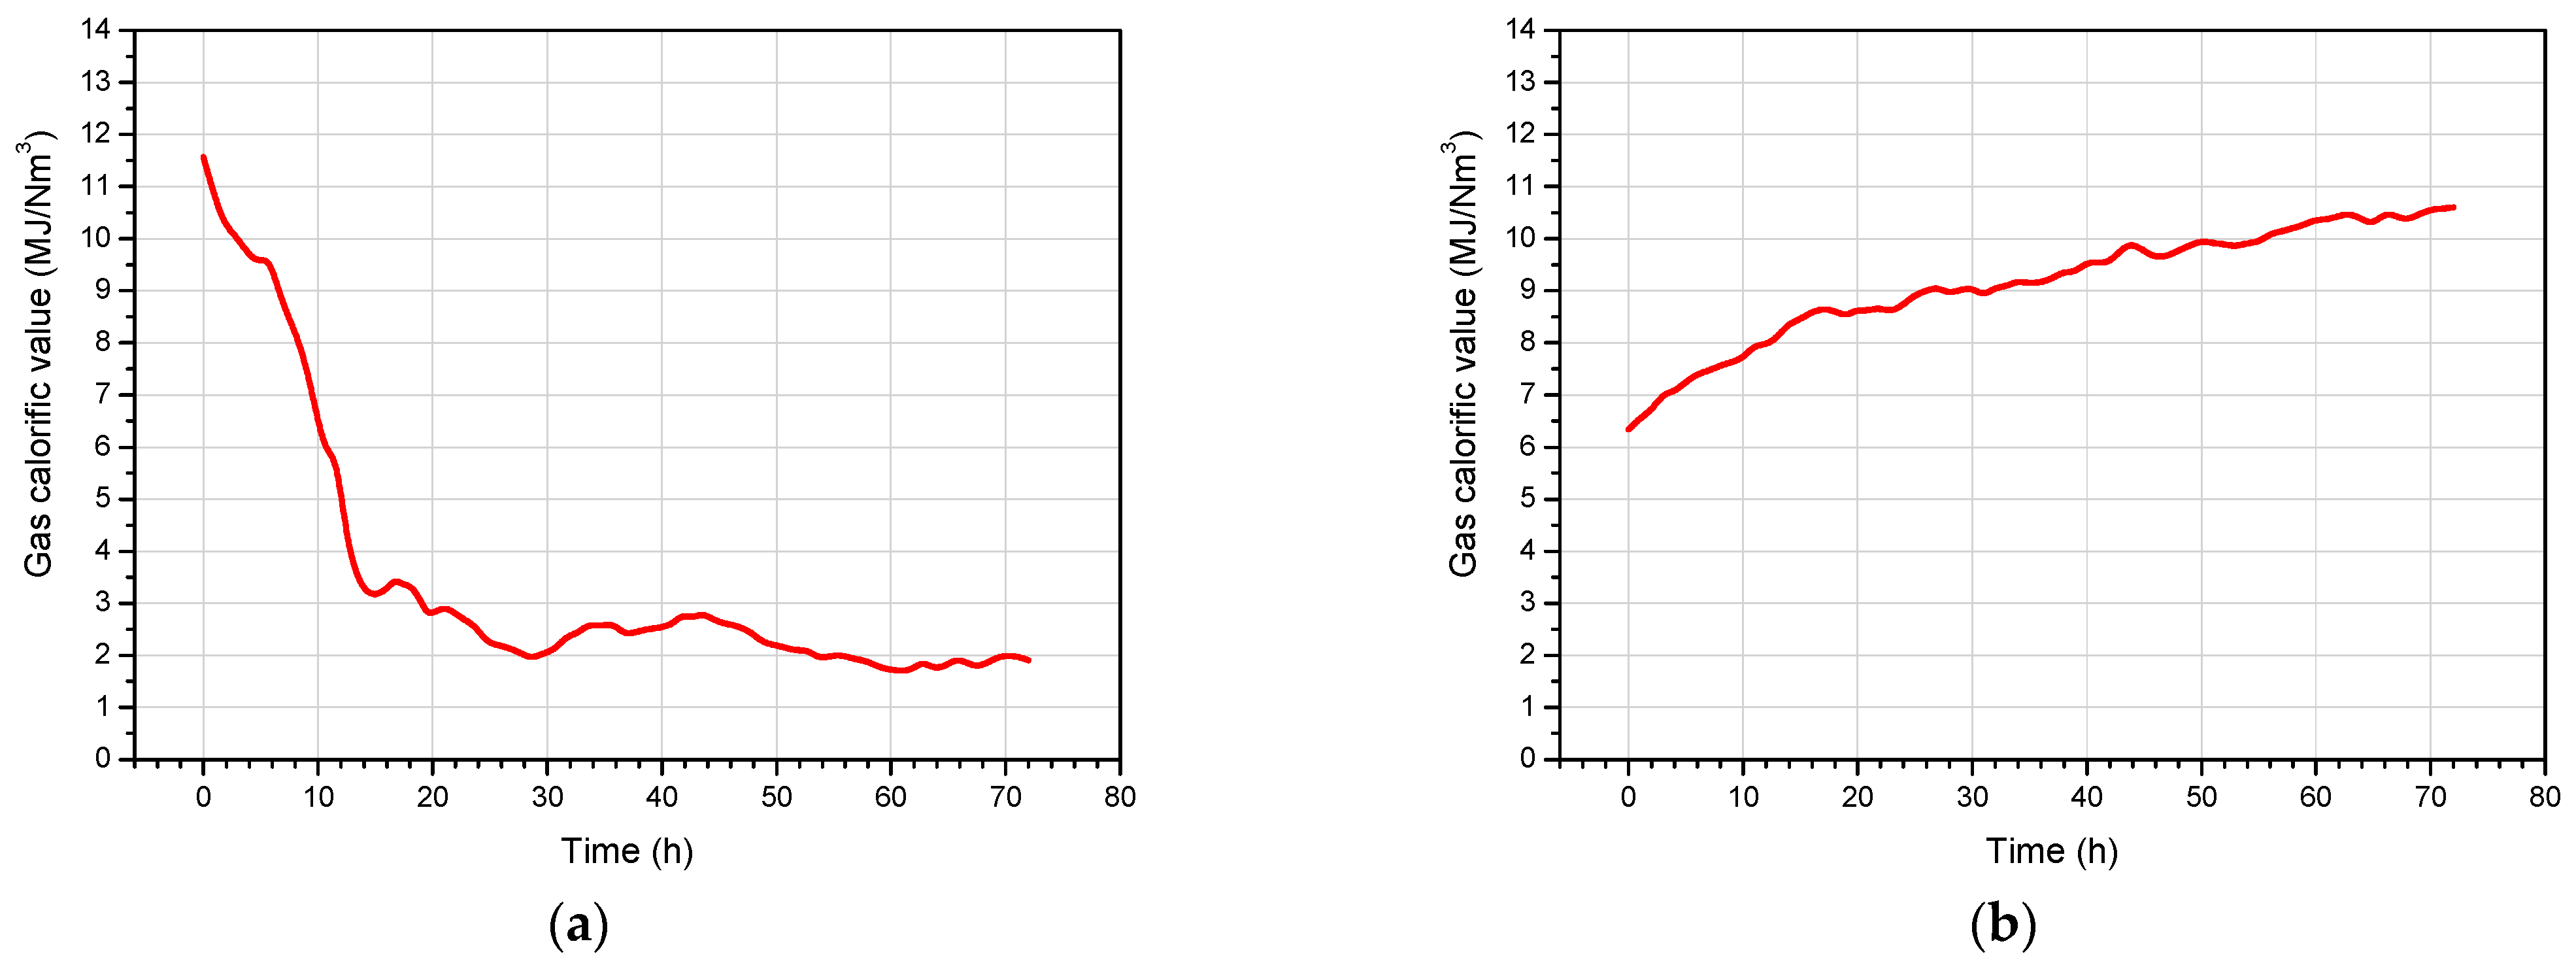
4.3. Product Gas Composition and Gas Calorific Value

Changes in the product gas composition and gas calorific value for the experiments carried out are presented in Figure 8 and Figure 9, while their calorific values are shown in Figure 10 and Figure 11. The average gas compositions from the experiments are shown in Table 4.
As can be seen from Figure 8a, the initiation of air supply (9th hour) to the reactor resulted in a rapid drop in the concentrations of all the combustible components of the gas and, consequently, a constant decrease in the calorific value of the obtained process gas (Figure 10a). The initial calorific value of the gas for test No. 1 was 8.8 MJ/Nm3 and the final value was 0.14 MJ/Nm3, while the average value was 2.25 MJ/Nm3. For test No. 2 using pure oxygen (Figure 8b), an increase in methane concentration was observed throughout the test, and, until the 35th hour, an increase in carbon monoxide and hydrogen was noticed. From the 35th hour until the end of the process, the concentrations of carbon monoxide and hydrogen were stabilised at the level of about 30%. For test No. 2, the calorific value of the gas obtained increased steadily from an initial value of 3.2 MJ/Nm3 up to a final value of about 9.1 MJ/Nm3 (Figure 10b); the average value was 7.96 MJ/Nm3, meaning that the calorific value is much higher for test No. 2 than for test No. 1 (2.25 MJ/Nm3) (Table 4). High concentrations of hydrogen and carbon monoxide were observed in the process gas for test No. 2 (Figure 8b), while for test No. 1 (Figure 8a), these values were much lower. The source of the vapor is water coming mainly from the evaporation of moisture contained in wet sand and water contained in gasified coal.
In the case of “Wesoła” coal gasification (Figure 9a), the initiation of air supply (12th hour) to the reactor resulted in a rapid drop in the concentrations of all the combustible components of the gas and, consequently, a constant decrease in the calorific value of the obtained process gas (Figure 11a). The initial calorific value of the gas for test No. 3 was 11.57 MJ/Nm3 and the final value was 1.91 MJ/Nm3, while the average value was 3.44 MJ/Nm3. For test No. 4, using pure oxygen (Figure 9b), a gradual increase in the methane concentration was observed throughout the whole test. The concentrations of carbon monoxide and hydrogen also increased up to the 45th hour, before stabilizing at levels of approximately 35% and 30%, respectively. For test No. 4 (Figure 11b), the calorific value of the gas obtained increased steadily from an initial value of 6.34 MJ/Nm3 up to a final value of about 10.60 MJ/Nm3, and the average value (9.14 MJ/Nm3) was much higher than that for test No. 3 (3.44 MJ/Nm3) (Table 4). High concentrations of hydrogen and carbon monoxide were observed in the process gas for test No. 4 (Figure 9b), while for test No. 3, these values were much lower (Figure 9a).
From Figure 8, it can be concluded that the fluctuations in the composition of gases from the coal gasification process obtained from the “Piast-Ziemowit” mine are slightly greater than those obtained from the “Wesoła” mine (Figure 9). The most likely reason for these differences is the lower homogeneity of coal sourced from the “Piast-Ziemowit” mine. The data presented in Table 2 indicate that this coal is characterized by nearly twice the moisture content and three times the ash content of coal sourced from the “Wesoła” mine. Consequently, the coal gasification process at the “Piast-Ziemowit” mine proceeded in a less stable manner, contributing to the observed changes in gas composition.
In all tests, the main source of these gases is reaction of water vapor with coal at high temperatures. Since the gasification processes with pure oxygen were more intensive, the hydrogen and carbon monoxide contents of the gases were much higher than in tests conducted with OEA. The presence of water in the UCG process as a main production source of hydrogen and carbon monoxide is necessary, although its excess lowers temperatures in the gasified bed due to the consumption of thermal energy to evaporate the excess water, which is not beneficial for the UCG process. The reaction with the essential role of water in the formation of hydrogen and carbon monoxide can be described via Equation (1) [39]:
C + H 2 O CO + H 2   Δ H = + 131   kJ / mol
In the case of excess water vapor, a slightly exothermic process takes place in parallel:
CO + H 2 O CO 2 + H 2   Δ H = 41   kJ / mol
From the data shown in Figure 8a,b, it can be seen that in tests No. 2 and 4, compared to tests No. 1 and 3, the carbon monoxide concentration is higher than the hydrogen concentration. This outcome is a result of the occurrence of the “Bouduard reaction”, resulting in an increase in CO concentration, which can be described using Equation (3) [40,41]:
C + CO 2 2 CO   Δ H = + 172   kJ / mol
This endothermic reaction (3) is reversible and occurs only at low pressures and temperatures above 700 °C. Therefore, higher temperatures favor the production of carbon monoxide.

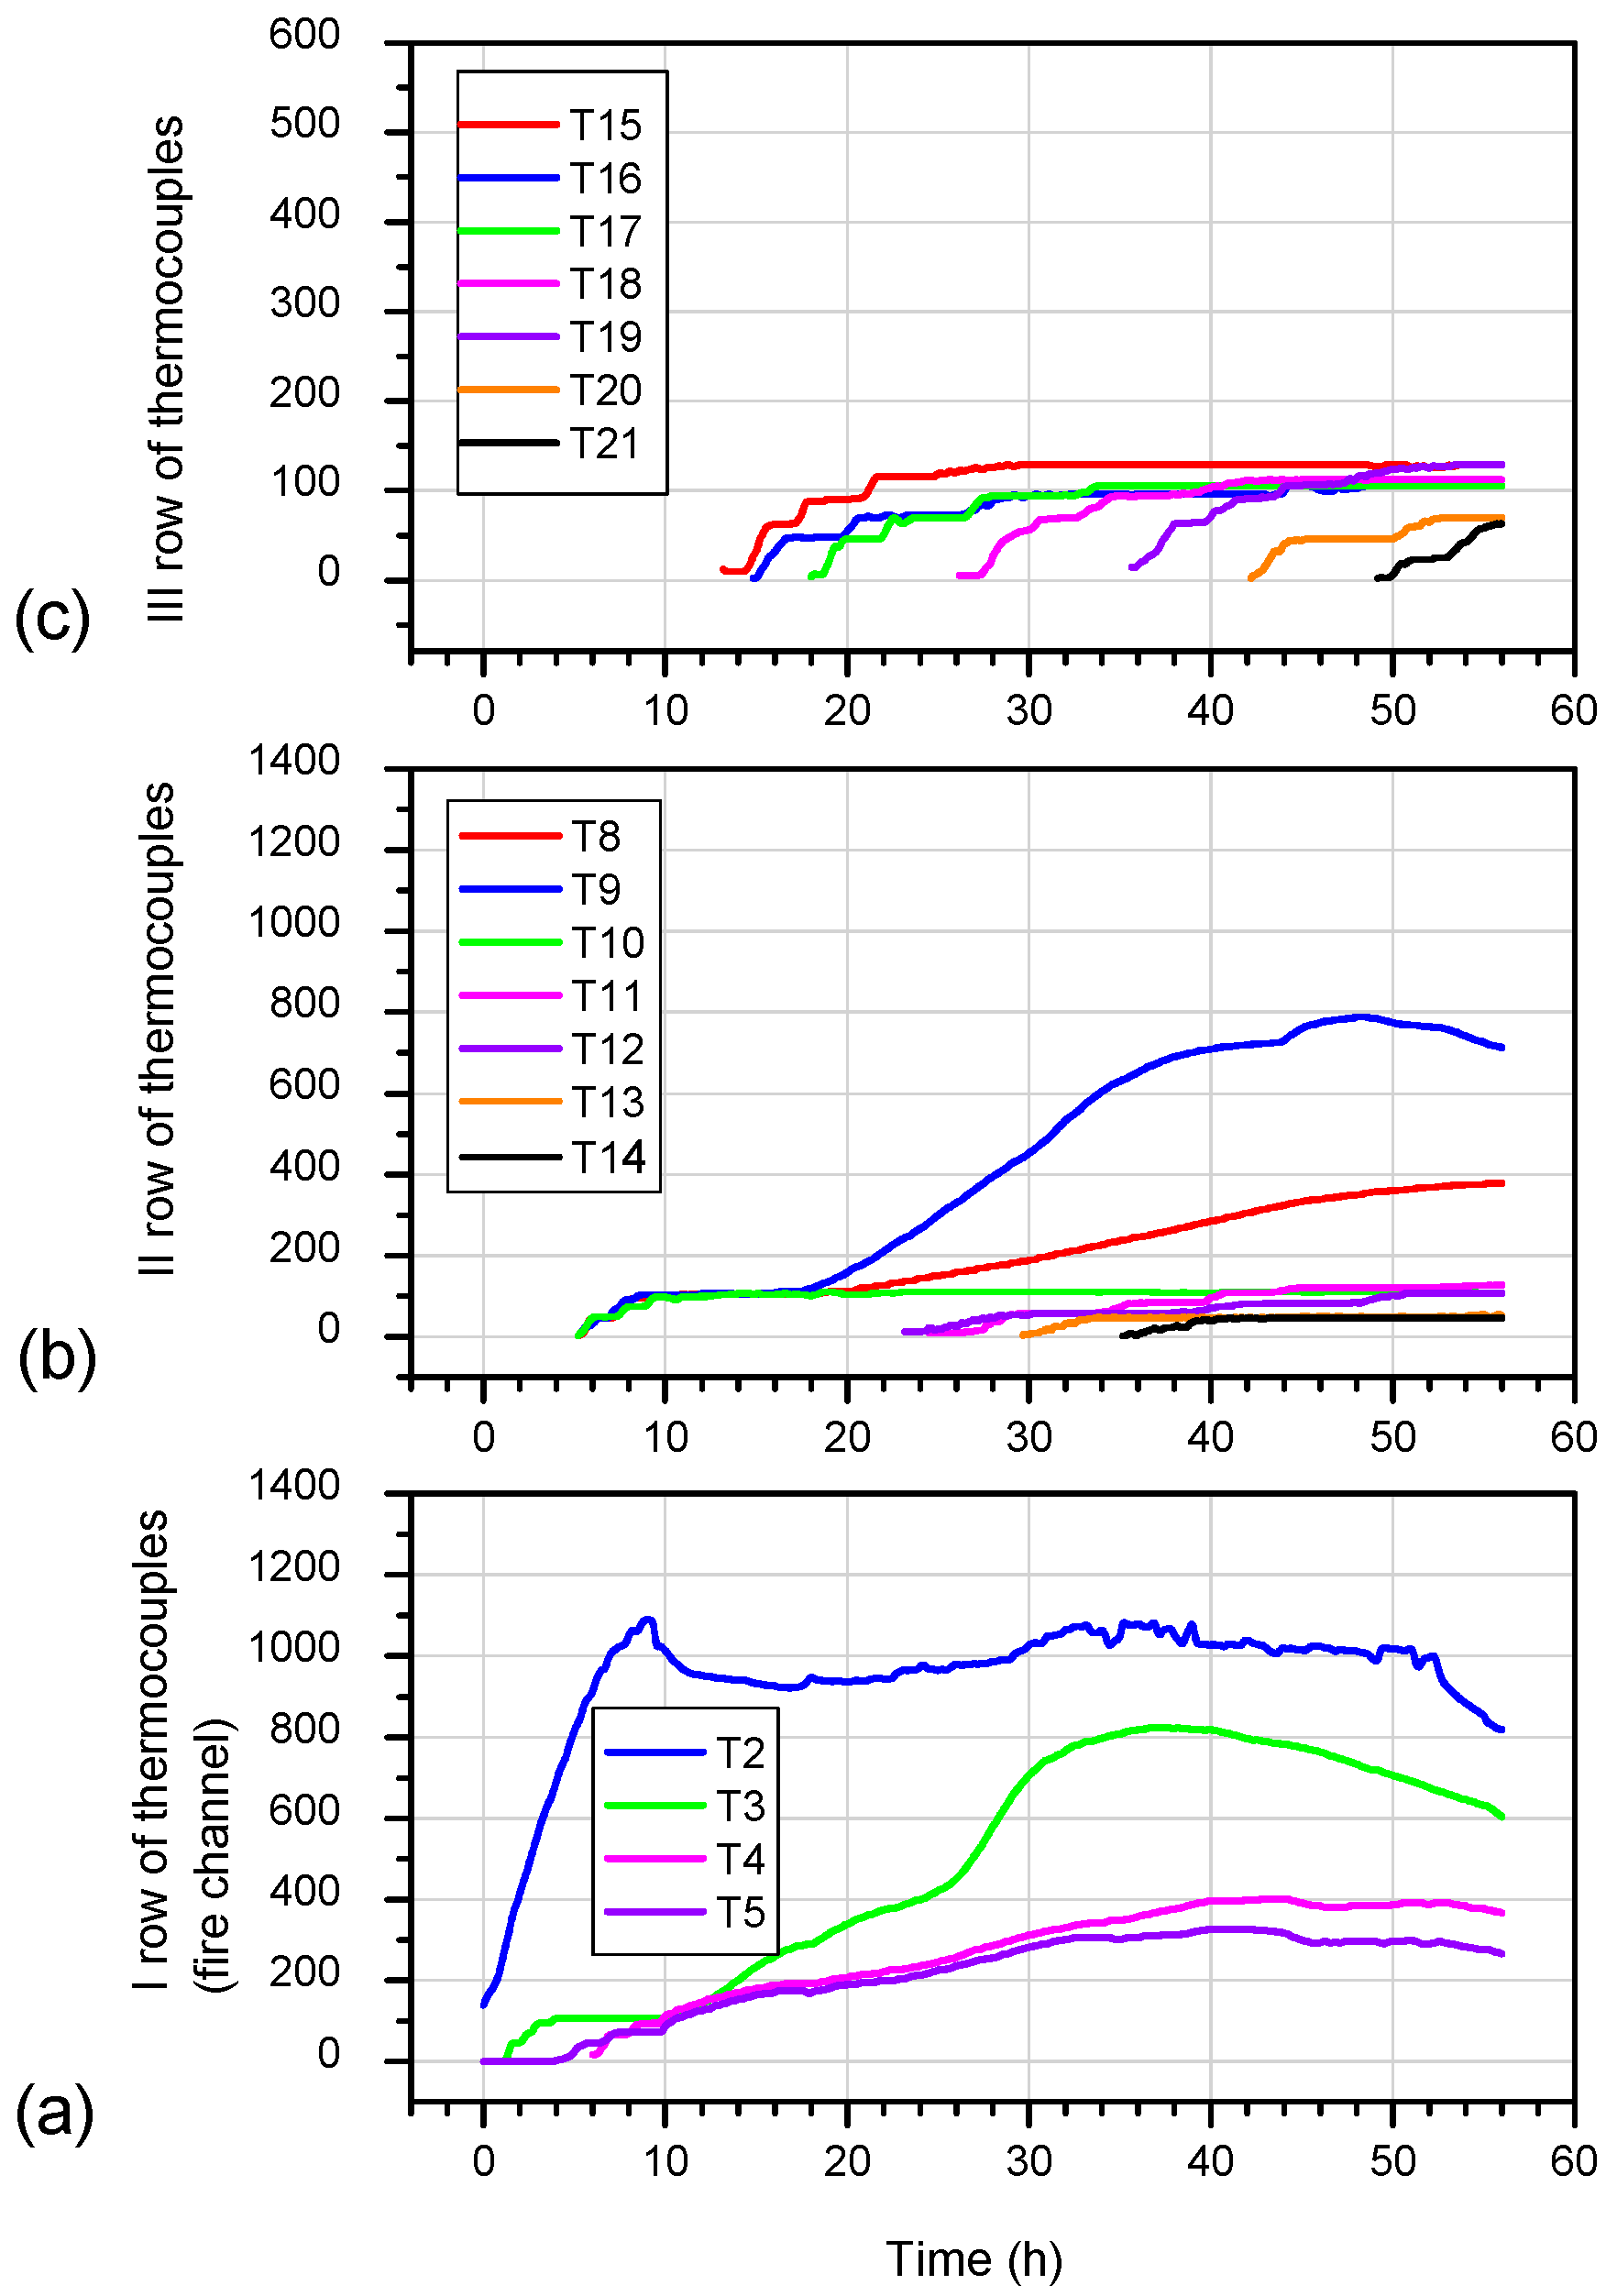
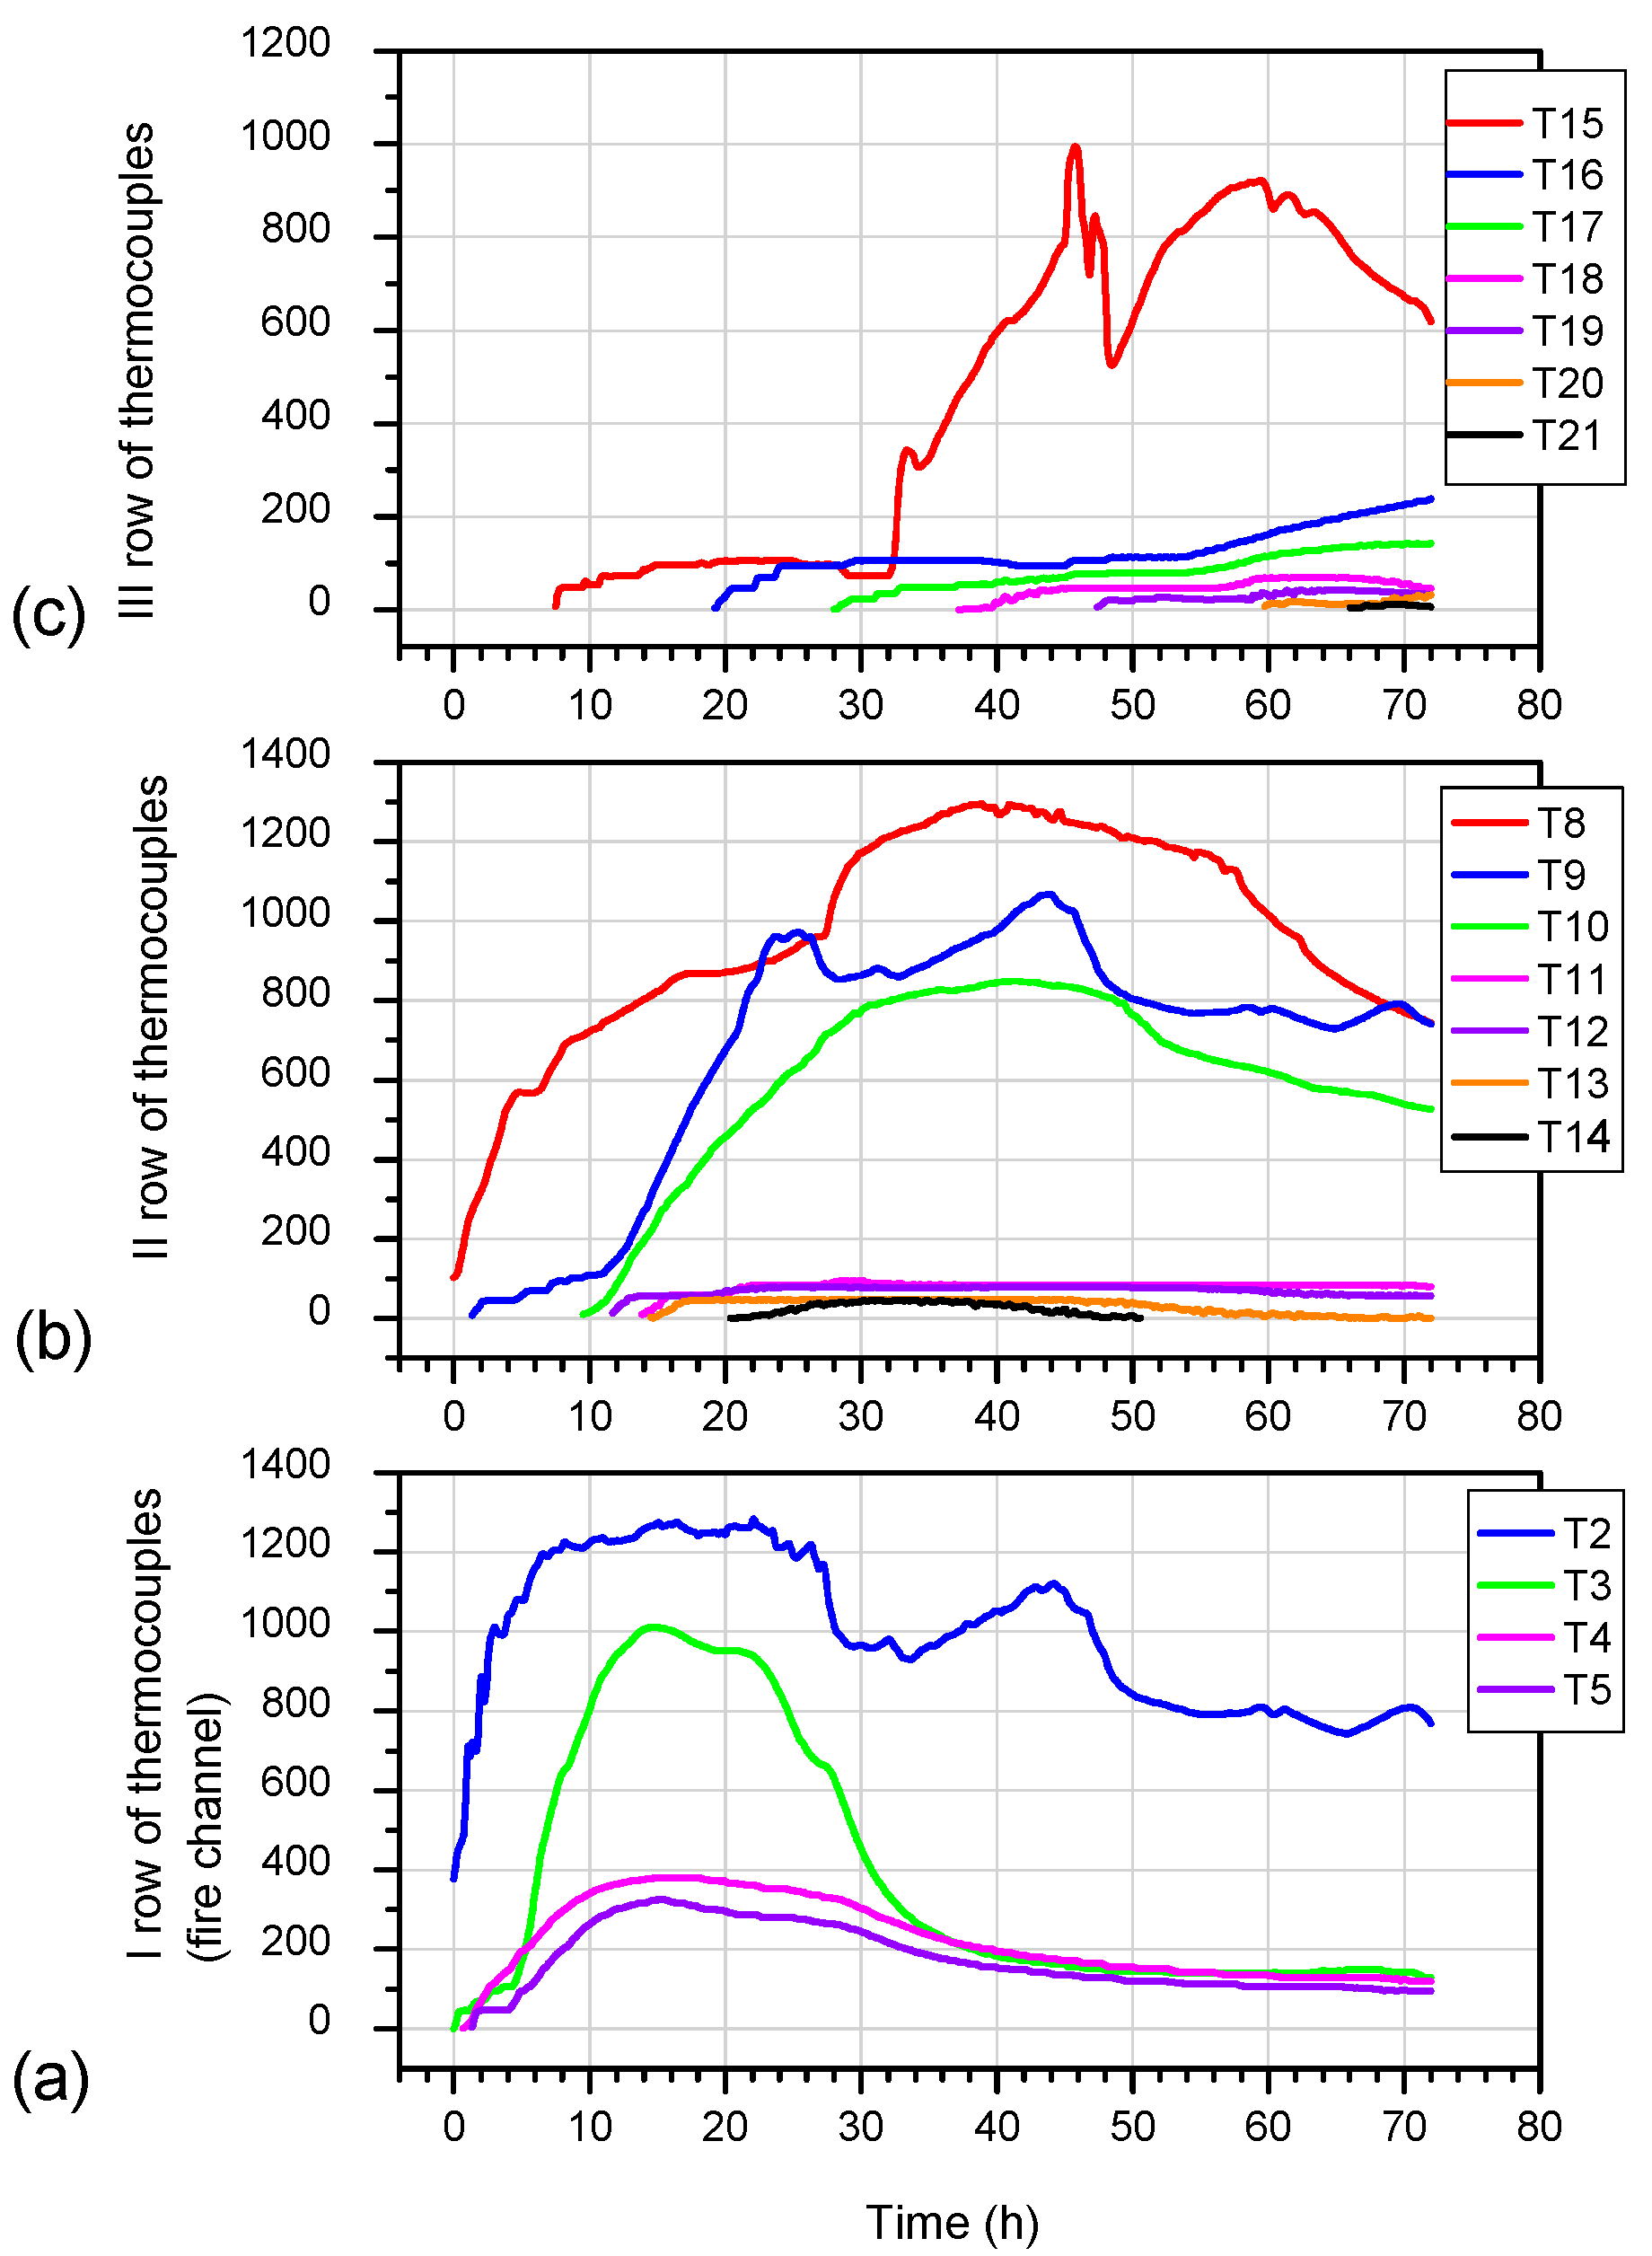
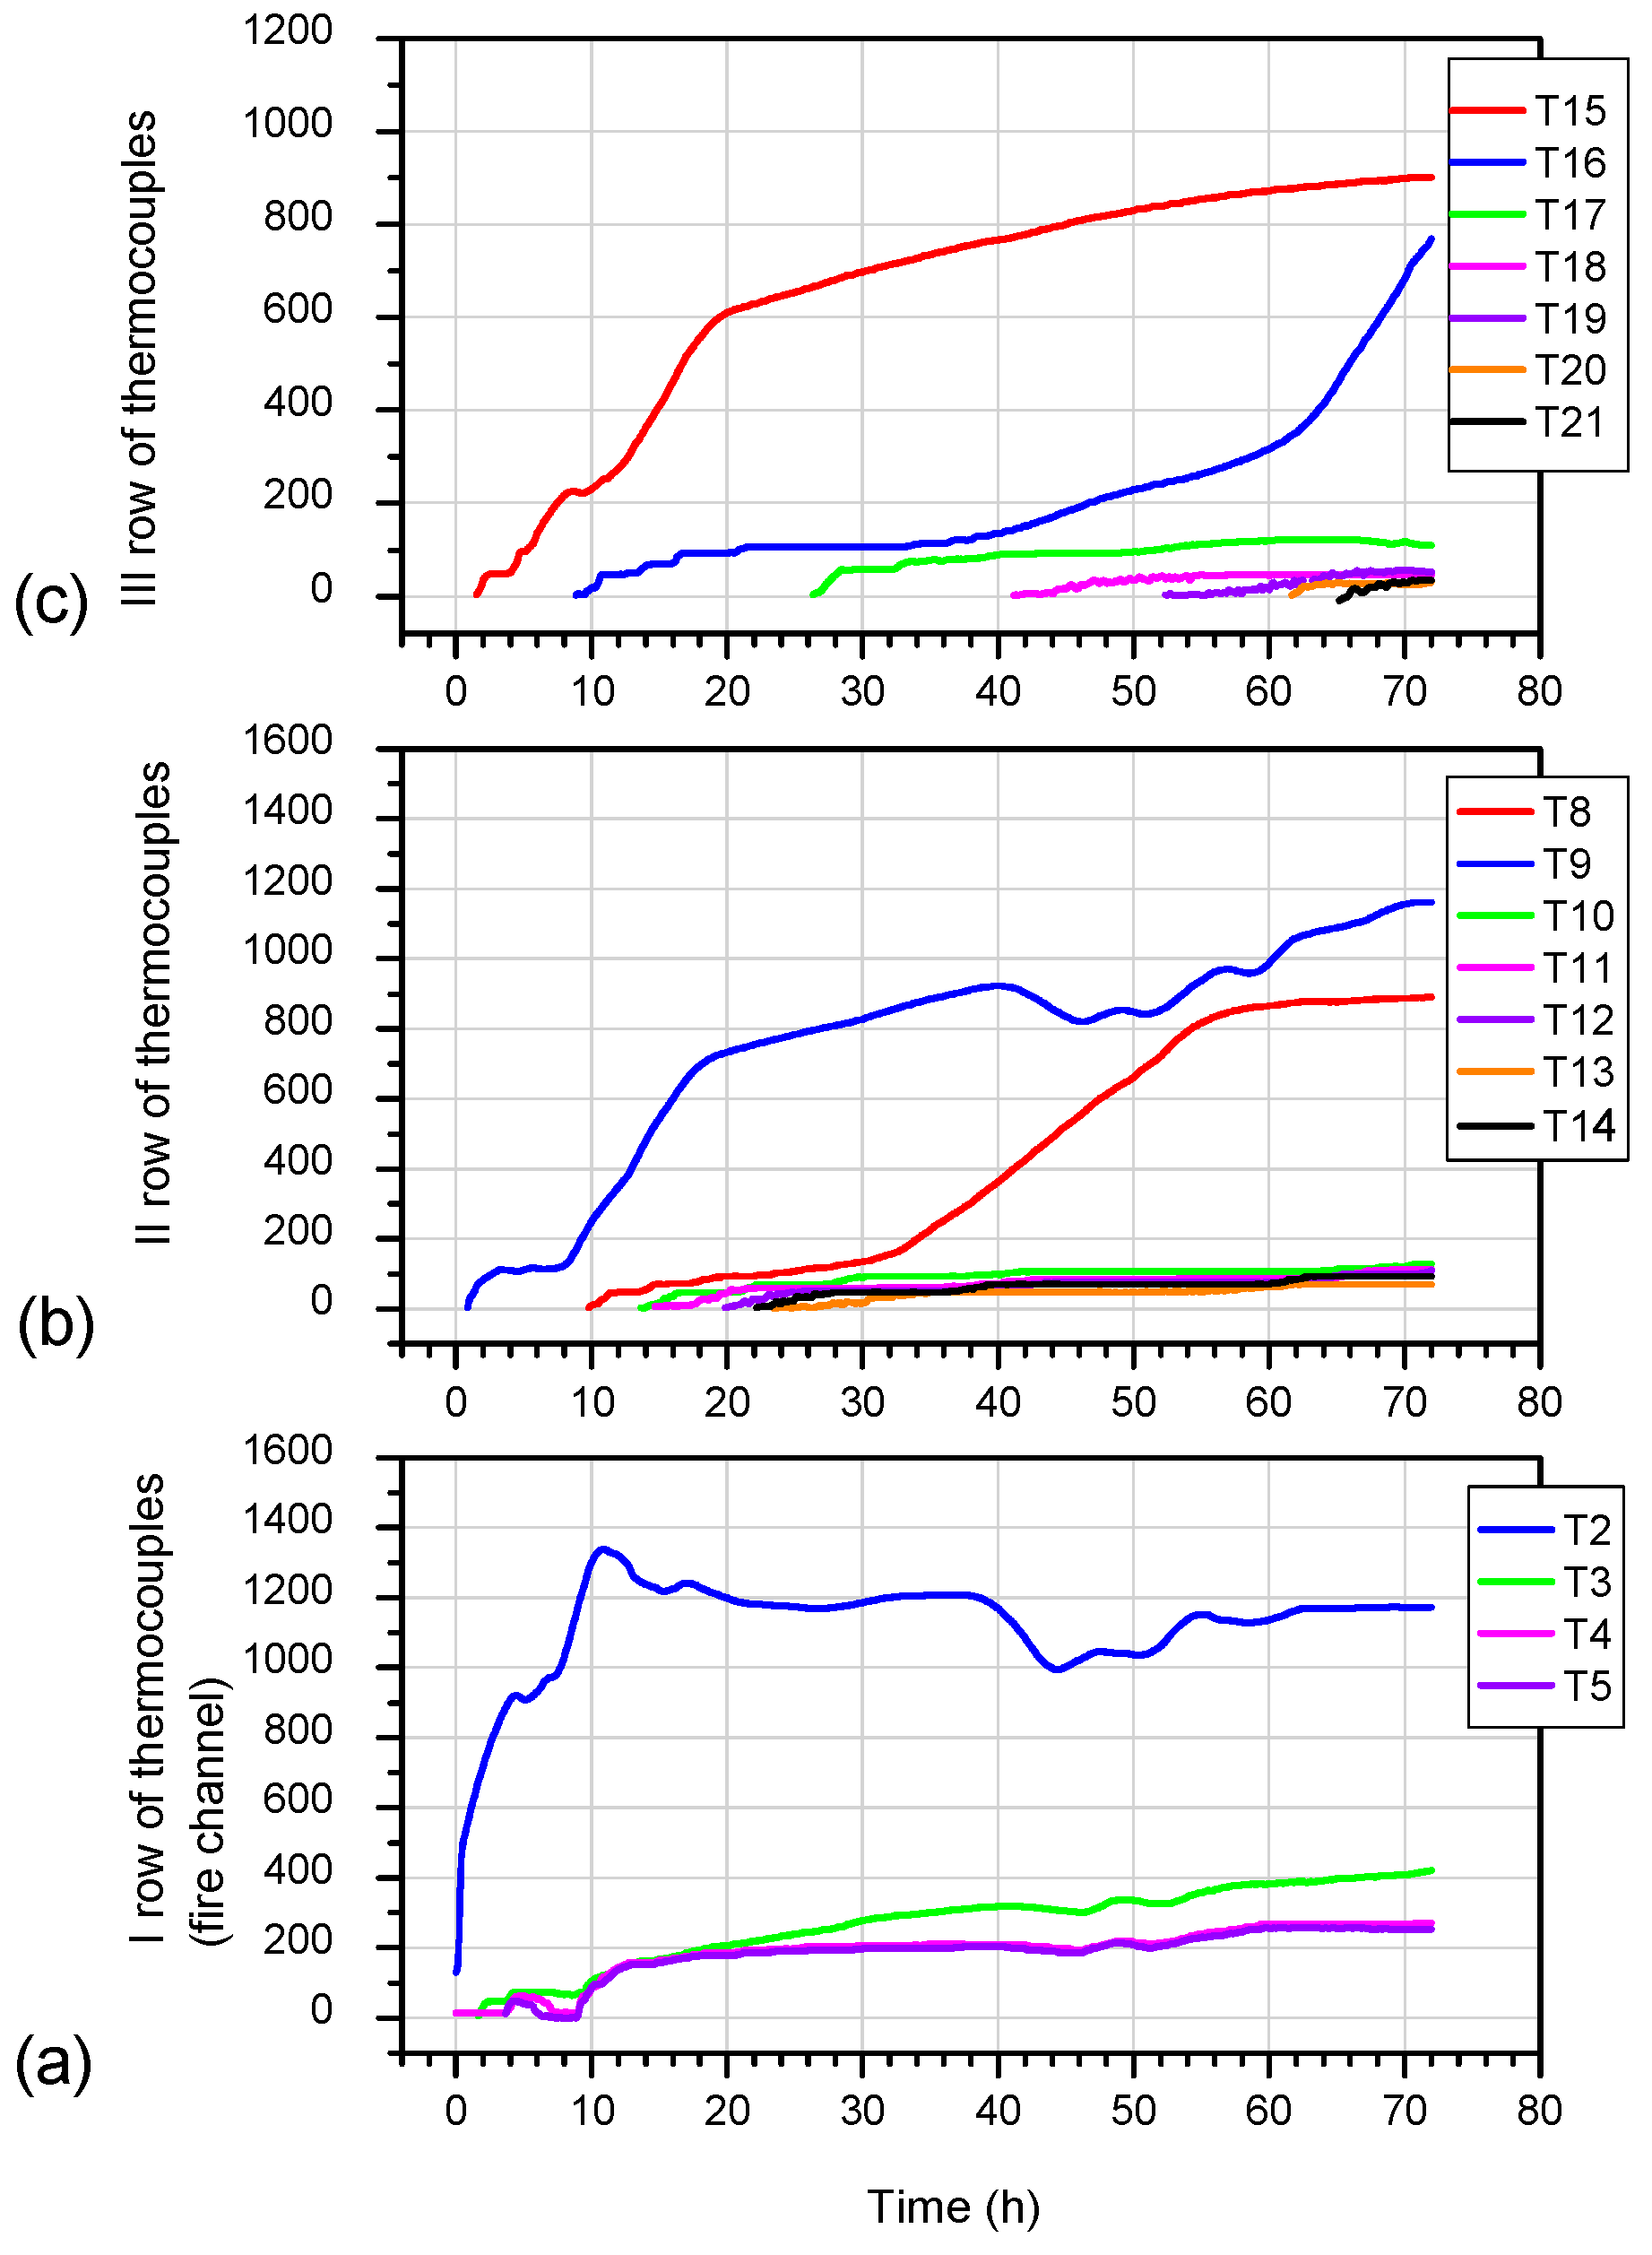
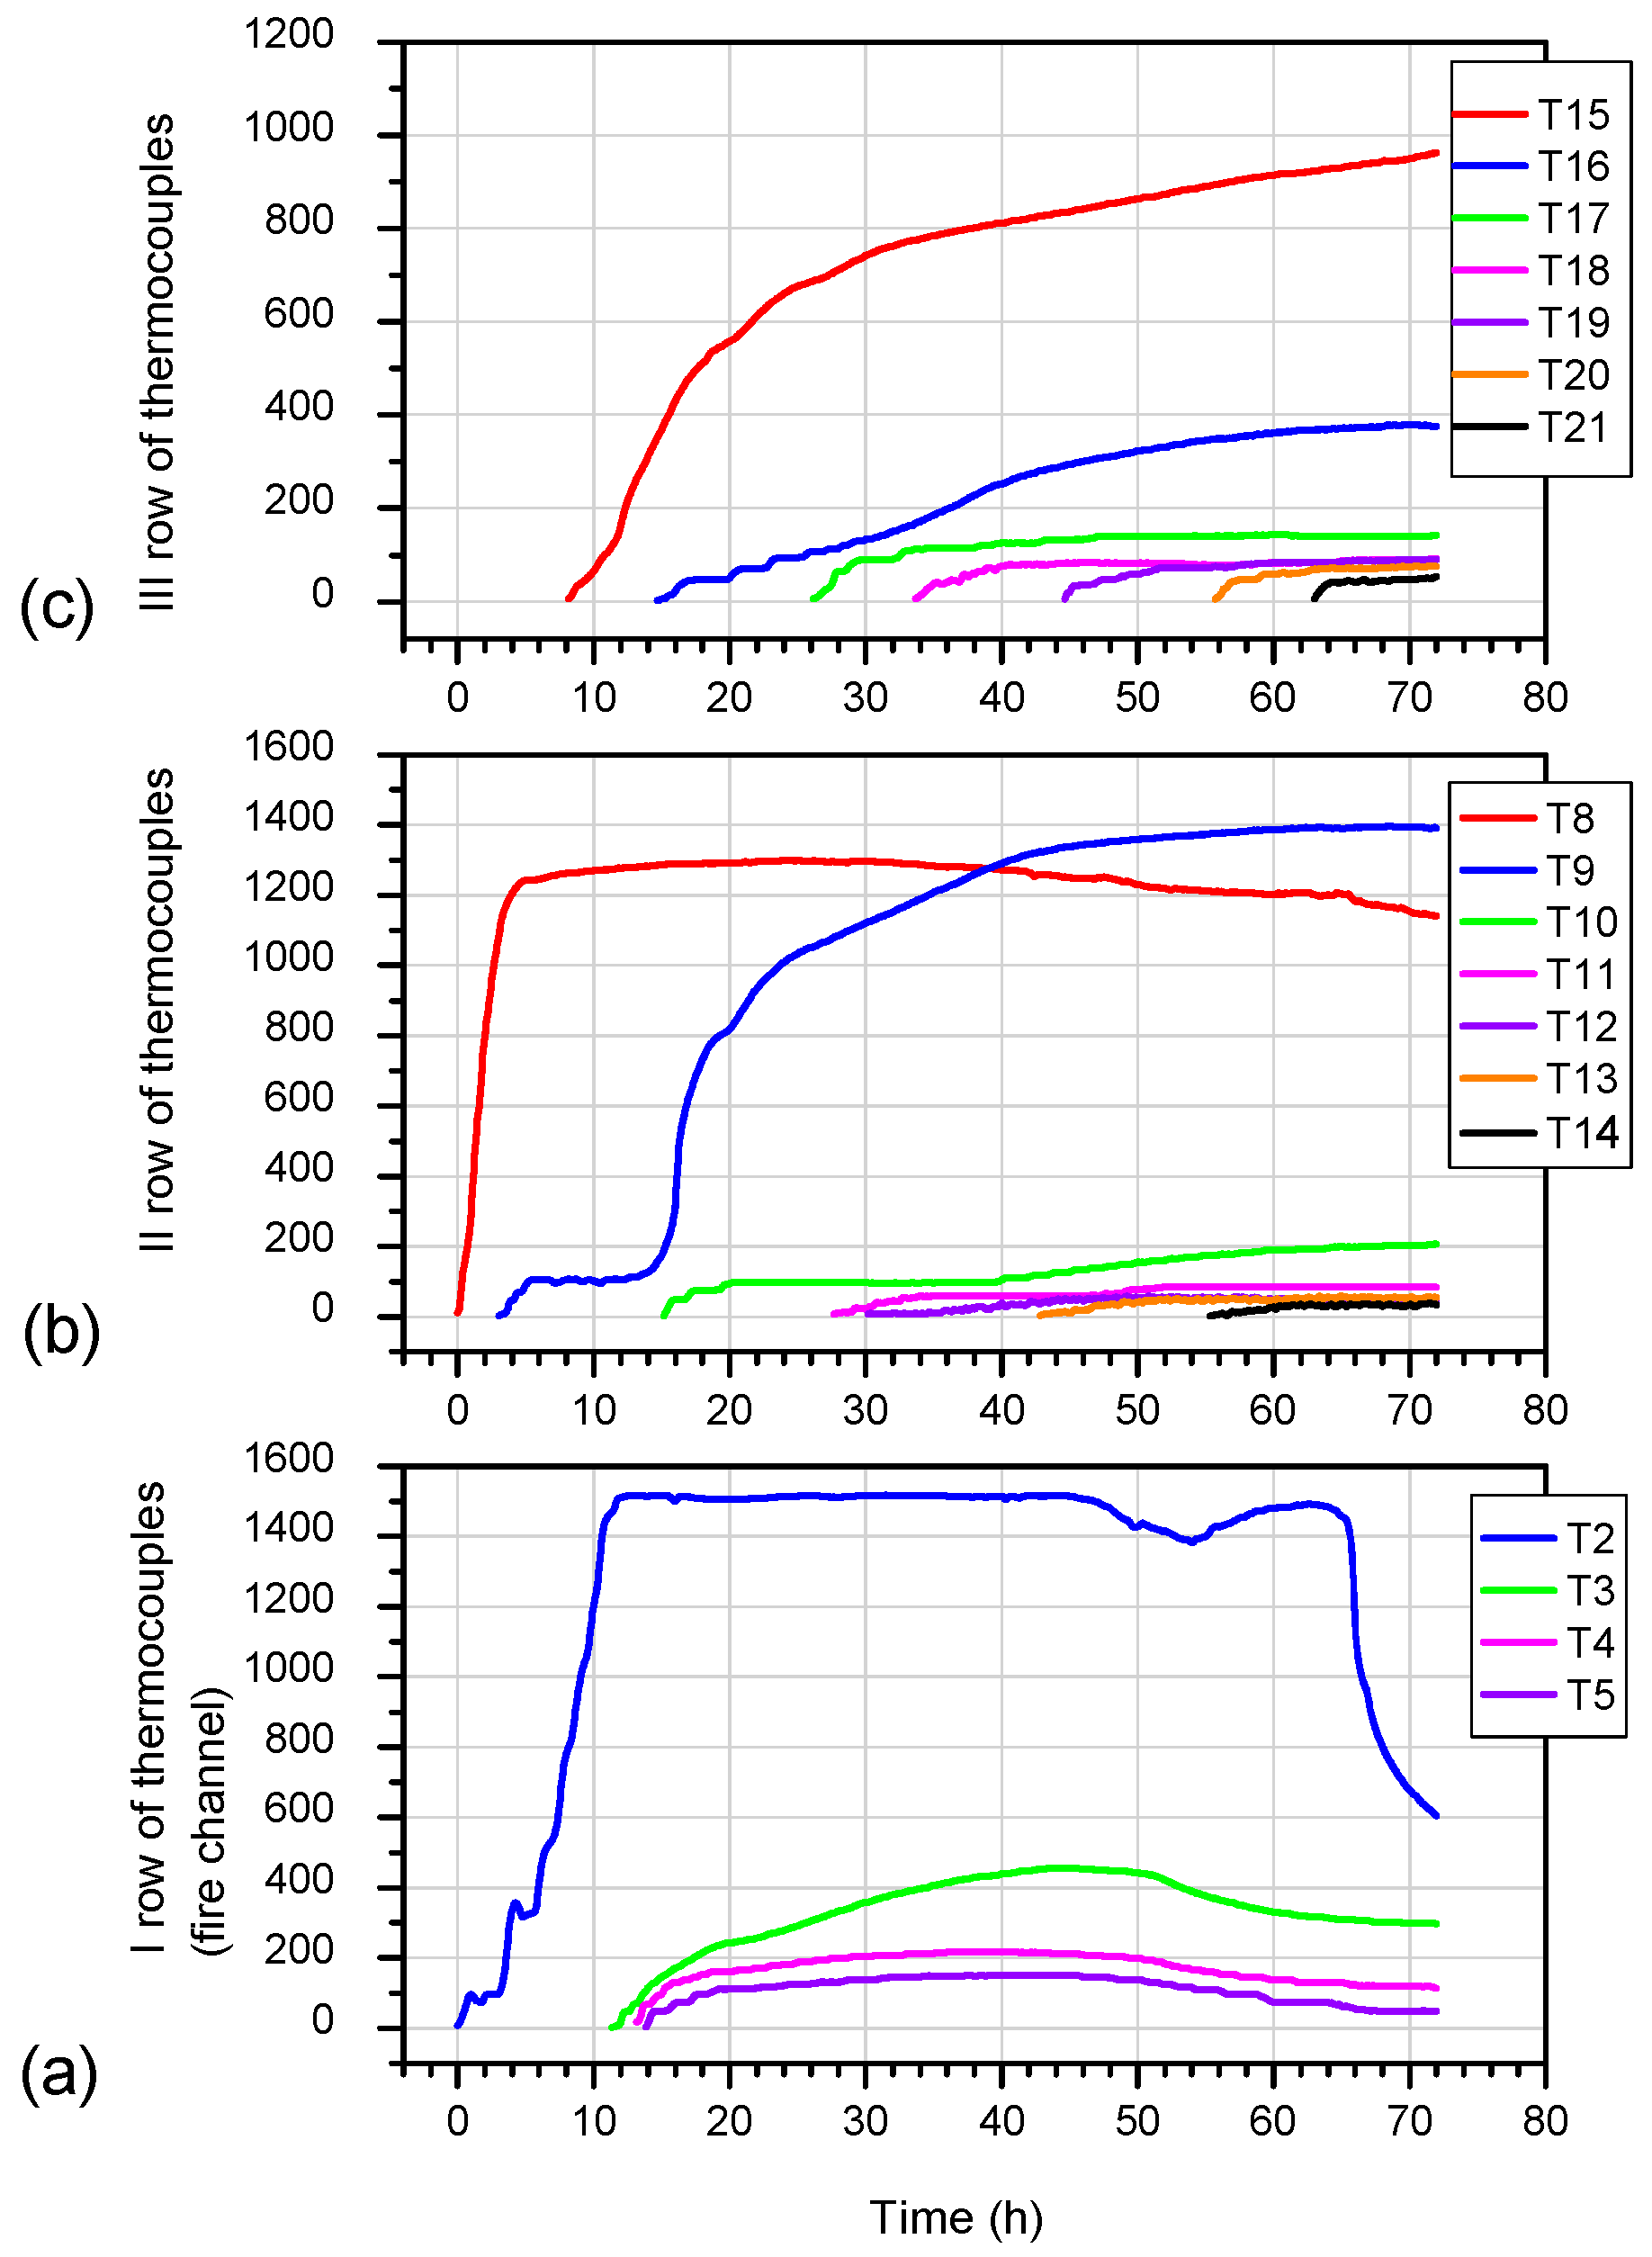
4.4. Temperature Distribution

Distributions of temperatures in the reactor over the course of the experiments are presented in Figure 12, Figure 13, Figure 14 and Figure 15.
The presented data show that the temperatures for tests No. 2 and No. 4 using pure oxygen were higher than the temperatures for the test with oxygen-enriched air (tests No. 1 and No. 3). For test No. 4, the highest temperatures at levels analogous to test No. 3 were much higher and ranged from 1200 to 1500 °C. The highest temperatures for test No. 2 were around 1200 °C (at the level of the fire channel and at a height of 0.3 m above the bottom of the coal seam), while for the tests Nos. 1 and 3, the highest temperatures did not exceed 1000 °C. For the UCG process, higher temperatures are advantageous as the gasification intensity increases.

4.5. Process Balance Data

Process balance calculations for both materials and energy for all UCG experiments are shown in Table 5.
Material balance calculations for the UCG of the “Piast-Ziemowit” coal show that approximately 141 kg and 324 kg of coal feed were consumed during tests No. 1 and No. 2, respectively. The rest of the coal feedstock remained as charcoal or partially dried coal. The average coal consumption of 2.5 kg/h in test No. 1 was considerably lower than the 4.5 kg/h value obtained in experiment No. 2. The coal consumption rate was proportional to the content of oxidizer in the gasifying agent, i.e., OEA vs. pure oxygen. Although the average gas production rate was higher for the OEA test, i.e., 8.69 compared to 7.72 Nm3/h for the test with pure oxygen, this difference was mostly due to gas volume expansion caused by inert nitrogen. According to energy balance estimates, process No. 2 using pure oxygen had a higher gross energy efficiency, i.e., 53.0% (calculated as the ratio of energy input to energy produced in gas), than process No. 1 using oxygen-enriched air (30.1%). This result can be explained through the formation of more favourable thermal conditions in the coal seam when pure oxygen is used for gasification. The presence of inert nitrogen in the OEA leads to energy losses due to the advective heat flux.
In the case of “Wesoła” UCG experiments, approximately 165 kg and 292 kg of coal feed were consumed during tests No. 3 and No. 4, respectively. Similar to the tests with “Piast-Ziemowit” coal, the average coal consumption of 2.29 kg/h in the test with OEA (No. 3) was considerably lower than 4.06 kg/h obtained in the experiment using pure oxygen (No. 4). Compared to the tests on “Piast-Ziemowit” coal, these values were lower for both gasifying agents. This result was due to the lower reactivity of Wesoła coal, which is characteristic for coals with a higher degree of coalification (higher rank).
According to energy balance estimates, the process with pure oxygen (No. 4) had a higher gross energy efficiency (58.2%) than experiment No. 3 using oxygen-enriched air (37.6%). The lower energy efficiency obtained in experiments No. 1 and 3 is the result of lower supply of oxygen as a gasifying reagent and, thus, formation of less favorable thermal conditions (energy losses) in the reactor when OEA is used. Both for experiments with OEA and oxygen, significantly higher energy efficiency values were observed for coal with a higher degree of coalification, i.e., for “Wesoła” sample. This result was due to its higher calorific value, i.e., higher energy content in the mass of coal. The effect of the coal rank (coalification degree) on the crucial performance parameters of UCG process, i.e., energy efficiency, coal consumption rate and gas yields, was also confirmed by previous experimental studies [22,42,43]. The unique research results are invaluable for modeling various aspects of the UCG process and designing the process in real conditions. A number of examples of the application of the results of experimental research for the implementation of model works, including designing automated control systems, are described in the literature [44,45,46].

4.6. Physico-Chemical Analysis of Chars

The elemental analysis and textural characterization, including N2 and CO2 physisorption of all the chars obtained from the four UCG experiments, was carried out. The chars are denoted as “UCG-X”, where “X” indicates the number of the gasification experiments described in Table 3.
The elemental analysis of the chars (Table 6) revealed a much higher ash content in the chars derived from the “Piast-Ziemowit” coal (UCG1- and UCG-2 chars) than that derived from the “Wesoła” coal (UCG-3 and UCG-4 chars), i.e., ~12–21 wt.% vs. ~4–6 wt.%. This result was consistent with (1) the different ash content of the corresponding starting coals (i.e., 7.64 vs. 2.15 wt.%), and (2) the higher overall gasification reactivity that can be expected for the “Piast-Ziemowit” coal due to its higher content of heteroatoms and lower carbon content (i.e., lower degree of coalification) compared to the “Wesoła” coal (see Table 1). Furthermore, for both coals, the ash content was higher in the char that was subjected to gasification under pure oxygen compared to gasification under oxygen-enriched air, which is consistent with a greater extent of etching (i.e., gasification) of the coals in the more reactive oxygen atmosphere. The presence of S and N heteroatoms in the chars was also consistent with the trends observed in the starting coals, i.e., a larger amount of S was found in the chars derived from the “Piast-Ziemowit” coal, while a somewhat larger amount of N was found in the chars derived from the “Wesoła” coal. The presence of metals and metalloids in the chars was probed via ICP-MS analysis, the results of which are also collected in Table 6. For the “Piast-Ziemowit” coal-derived chars, Al was by far the most abundant metal/metalloid, followed by Fe, Na, Ca and Mg. Trace amounts of Mn, Cu, V, Cr, Zn and Pb were also detected. For the “Wesoła” coal-derived chars, Ca and Fe were the most abundant elements, with significant contributions from Mg and Al, and to a lesser extent from Na. Among the trace metals, Cu, Zn and Cr were the most abundant. There was no apparent correlation between the amount of metals/metalloids in the chars and the gasification treatment to which they were subjected. Specifically, for the “Piast-Ziemowit” coal, the amount of metals/metalloids was generally lower in the char subjected to gasification under pure oxygen, relative to gasification under oxygen-enriched air; however, such a trend was not observed with the “Wesoła” coal.

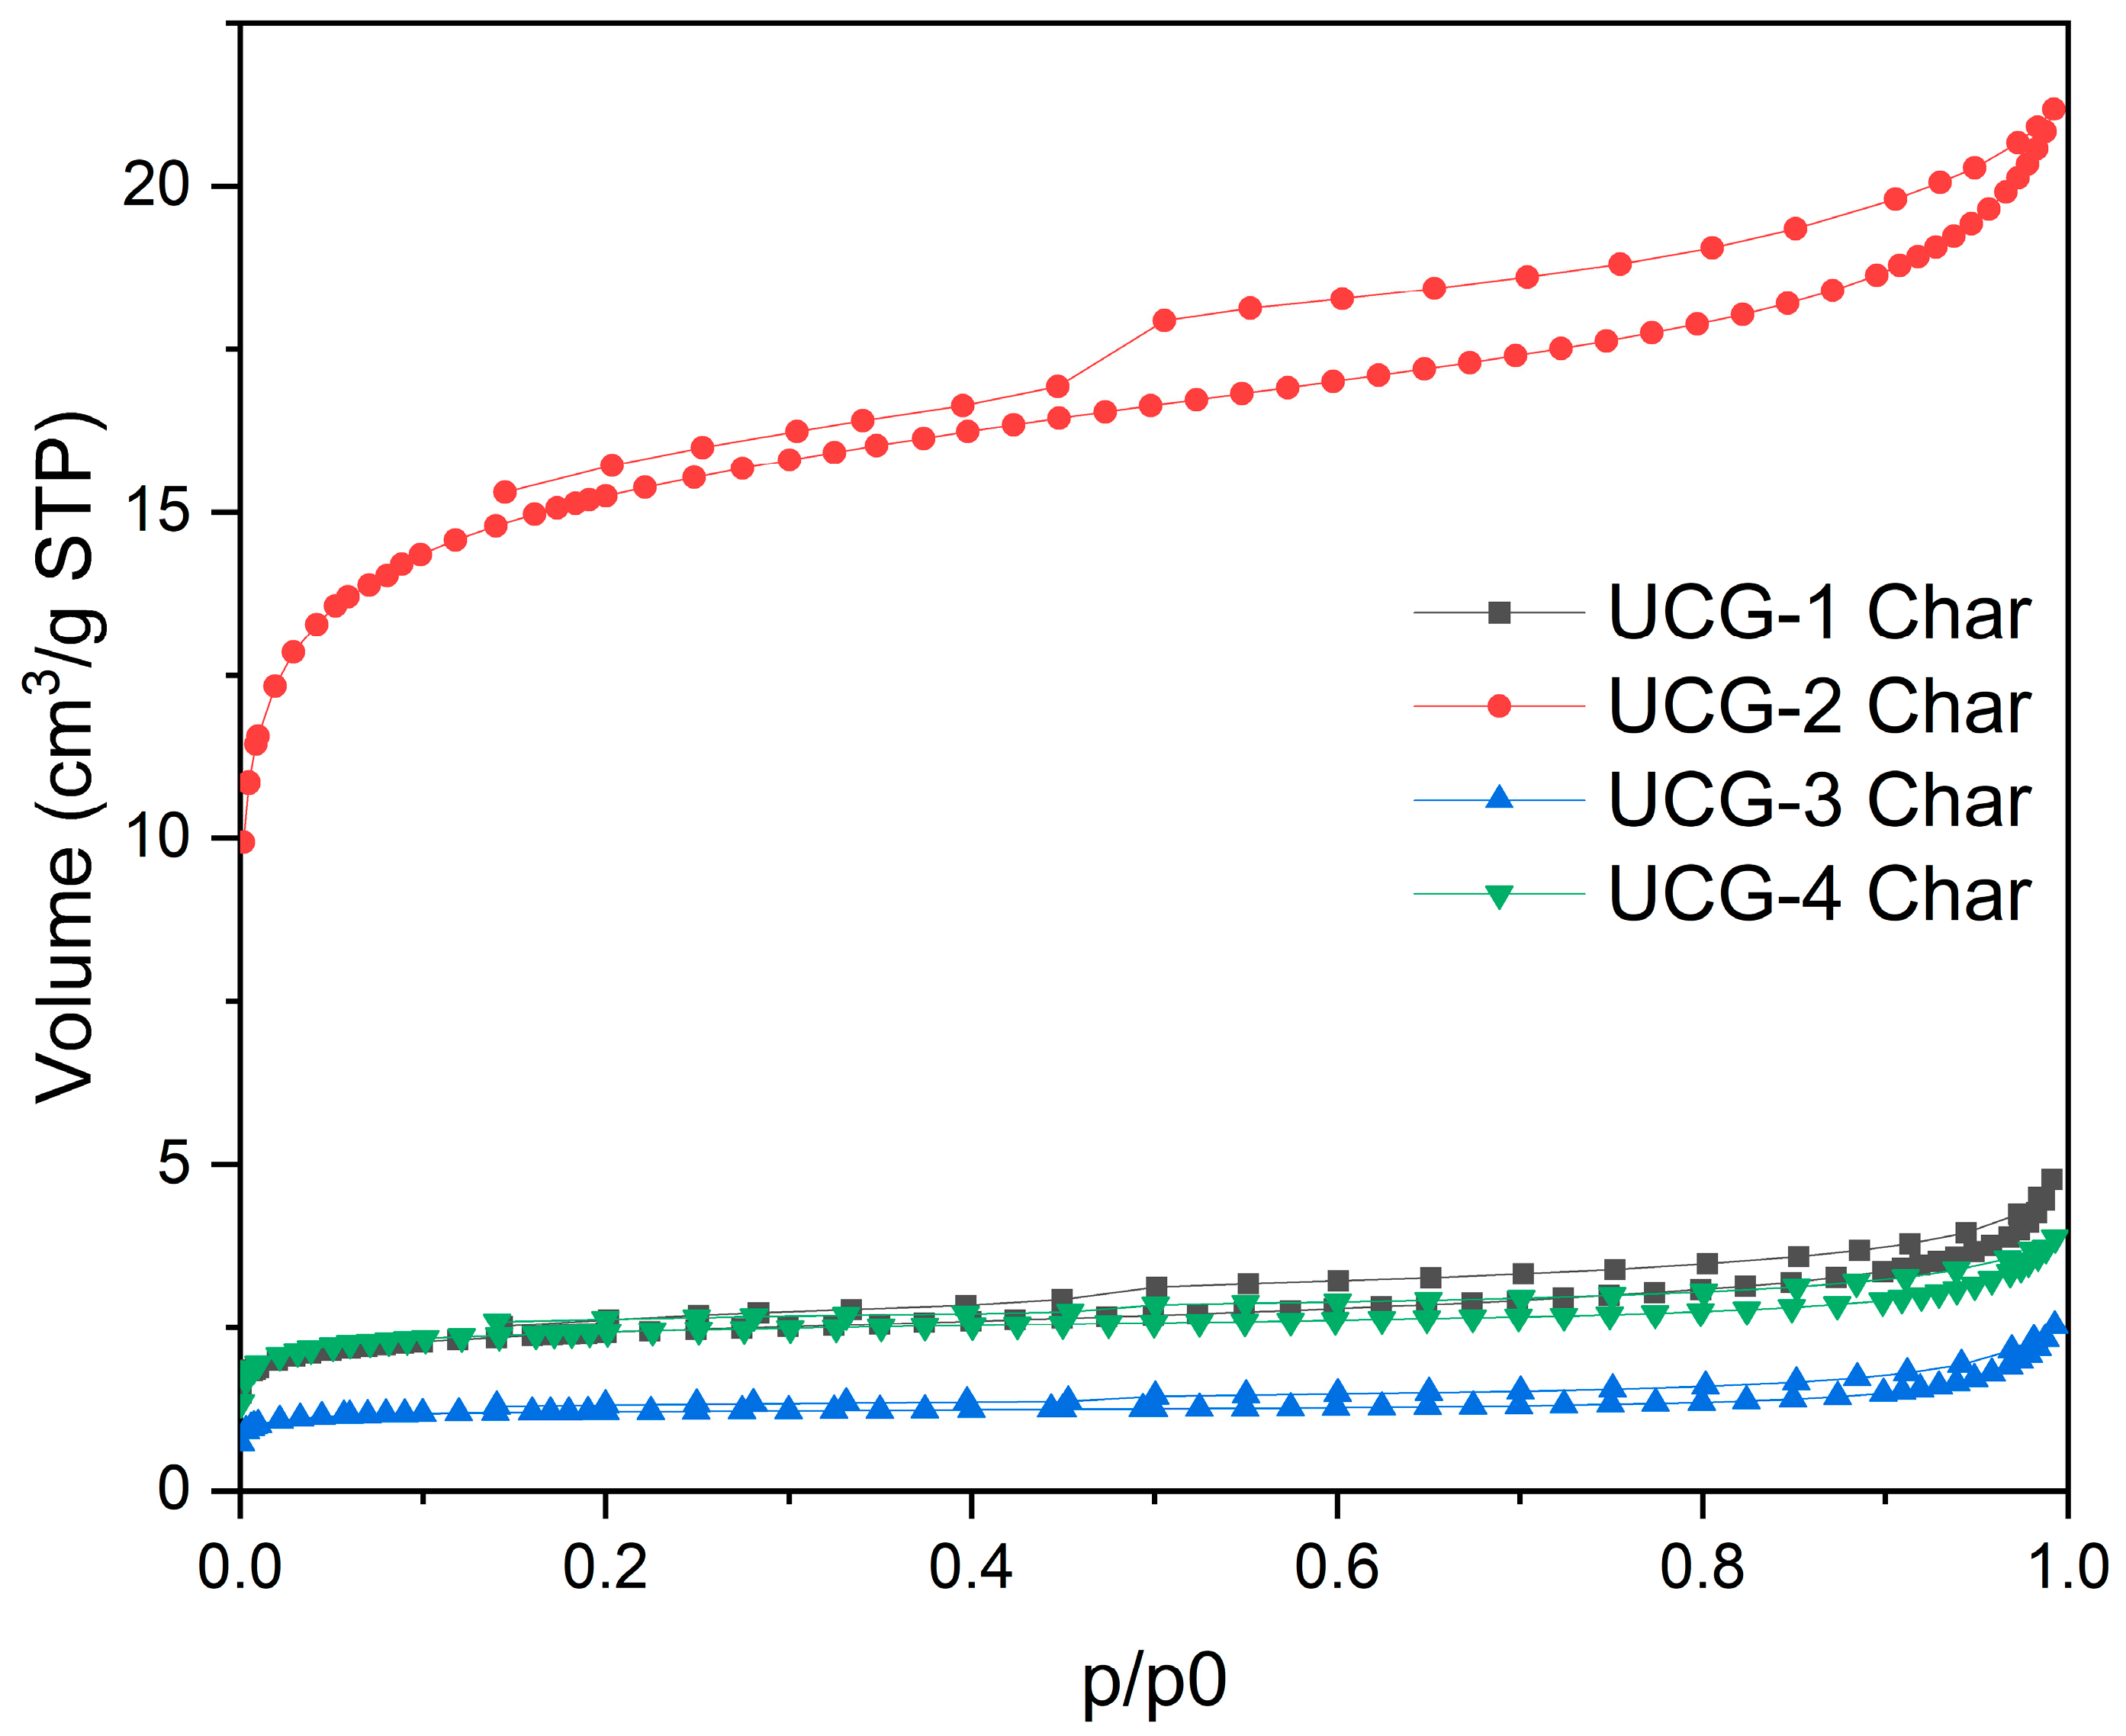
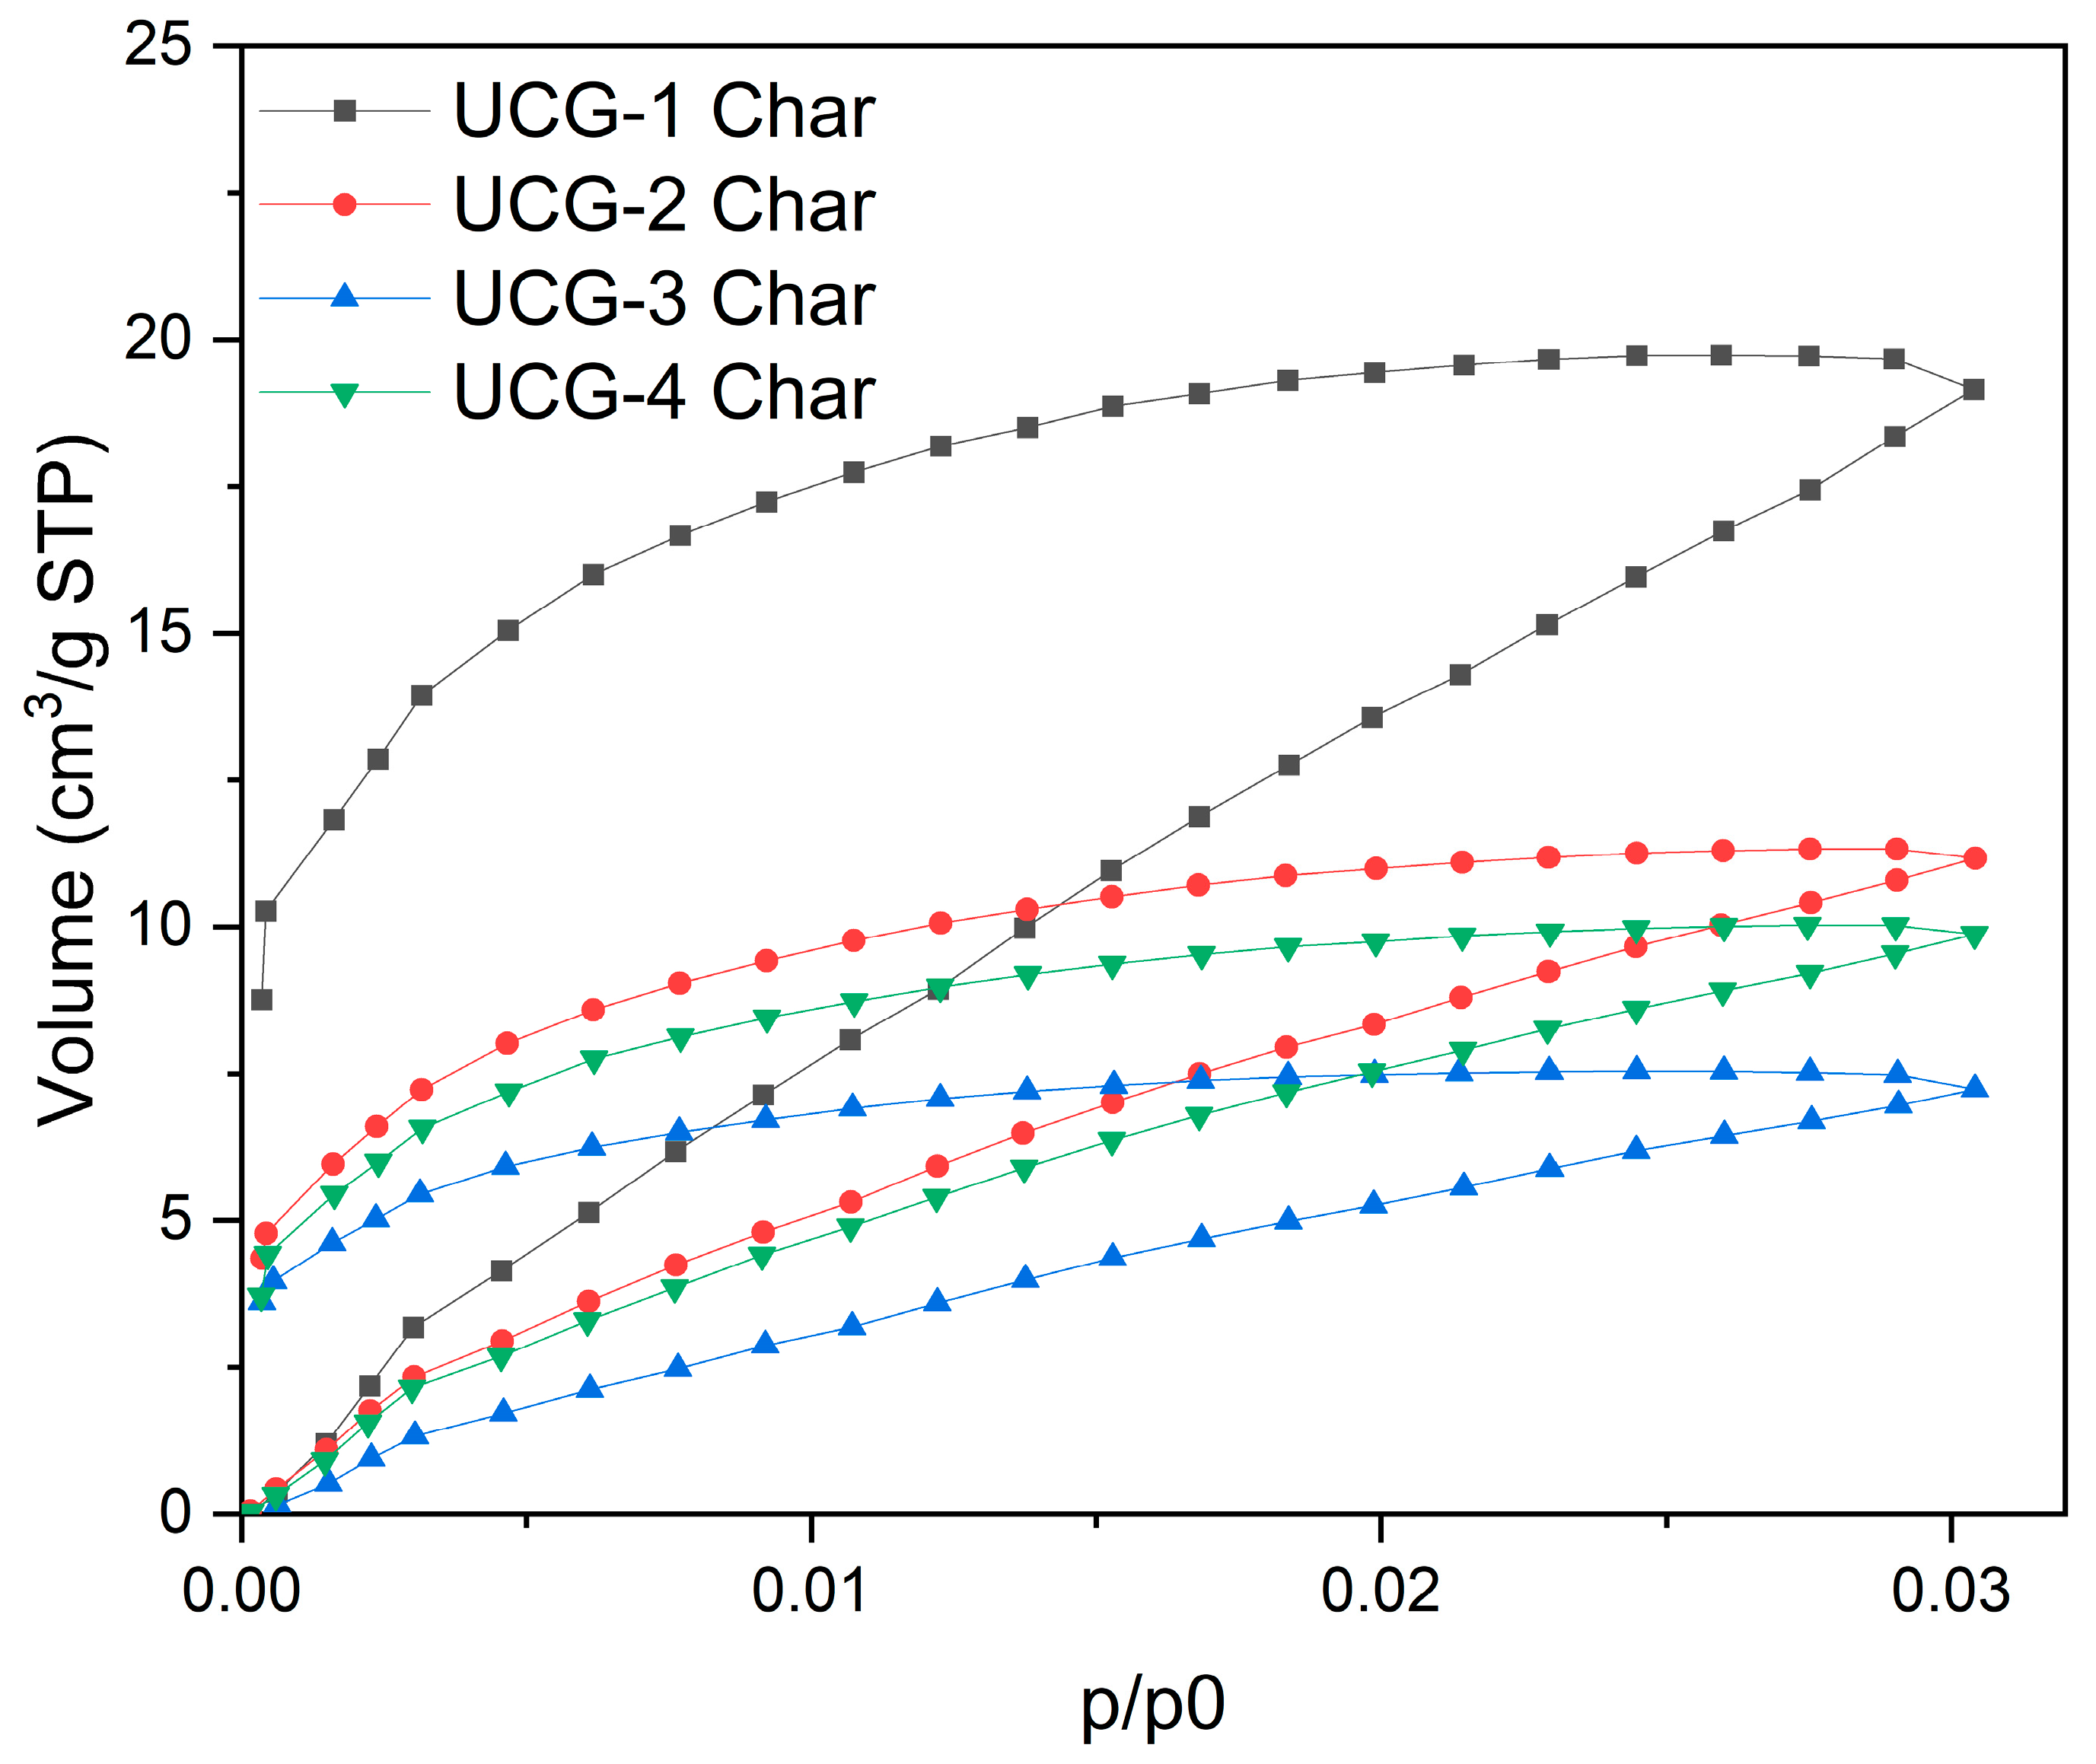
4.7. Textural Analysis

The porous texture of the different UCG chars was analyzed based on N2 and CO2 physisorption. Figure 16 and Figure 17 show the corresponding N2 and CO2 adsorption/desorption isotherms, where p is the pressure, p0 is the saturation pressure of the gas at the adsorption measurements temperatures (−196 °C for N2 and 0 °C for CO2) and V is the volume adsorbed in the conditions of Standard Temperature and Pressure (STP). Table 7 lists some textural parameters, i.e., specific surface areas and pore volumes, which were calculated from these isotherms. Overall, the amount of adsorbed N2 was very small for all the chars, indicating that the chars exhibited a poor development of porosity that was slightly larger than 0.7 nm [47]. The UCG-2 char was a relative exception in this regard, as it exhibited a BET surface area (SBET) and a total pore volume (VT) substantially larger than those of the other three chars (i.e., 57 vs. 5–9 m2/g and 0.03 cm3/g vs. 0.01 cm3/g). The somewhat distinct textural development of UCG-2 char was reasonable, considering that the “Piast-Ziemowit” coal was expected to be more reactive than its “Wesoła” counterpart (due to its lower proportion of carbon and higher overall amount of heteroatoms; see Table 1), while a more extensive gasification of the coal was also expected under the more reactive pure oxygen atmosphere. In consequence, the UCG-2 char should be the most extensively etched upon gasification, leading to more abundant and larger voids (i.e., pores) within its structure compared to the other chars. Indeed, the presence of relatively large pores [micropores in the 1–2 nm size range and mesopores (pore size > 2 nm)] in the UCG-2 sample was apparent from the observation of (1) a slightly sloped adsorption branch at relative pressures above ~0.05 and (2) a hysteresis loop in the adsorption/desorption branches at relative pressures above ~0.45 in the N2 isotherm (Figure 16, blue plot) [47]. Concerning CO2 isotherms, their most outstanding feature was the presence of a large hysteresis loop in the adsorption/desorption branches for all the samples, with the amount of CO2 adsorbed in the adsorption branch increasing roughly linearly with relative pressure. We note that the latter feature is indicative of the occurrence of diffusional problems in the CO2 molecules within the porosity of the chars, which, in turn, should be caused by the presence of pores of very small sizes [48]. Taking into account that (1) CO2 physisorption typically probes pore in the 0.4–1.2 nm size range [49], (2) no signs of diffusional problems were noticed at all with N2 (probing pore sizes ≥ 0.7 nm) and (3) the volumes of the chars derived from the CO2 measurements (VDR,CO2) were generally much larger than their VT values (see Table 7), we conclude that the porous texture of the chars was completely dominated by very small pores with sizes below 0.7 nm. The only exception was the UCG-2 char, which also possessed (in relative terms) a substantial number of larger pores (its VT and VDR,CO2 values were of a more similar magnitude, which was not true in the case of the other chars). Another noteworthy result was the fact that the largest VDR,CO2 value was not attained with the UCG-2 sample, but with its UCG-1 counterpart. This result was again reasonable: the higher extent of gasification expected for the “Piast-Ziemowit” coal under the more reactive pure oxygen atmosphere should have favored the enlargement of many initially very small pores. As a result, the UCG-2 char should possess fewer very small-sized pores (lower VDR,CO2 value) but more relatively large-sized pores (higher SBET value) than the UCG-1 char.

5. Conclusions

The experiments carried out showed that the oxygen content in the gasification medium and the degree of coalification significantly affects the gasification process. Gasification of coal with oxygen resulted in higher gas quality and higher process efficiency than gasification with oxygen-enriched air. Due to the higher degree of coalification, the gas quality and energy efficiency of the process were much higher in the case of coal sourced from the “Wesoła” mine than for the less coalified coal sourced from the “Piast-Ziemowit” mine.
The gasification temperatures achieved in the reactor for two pure oxygen processes were much higher than for the corresponding processes using air-oxygen mixtures, while the temperatures for more coalified “Wesoła” coal were higher than in the case of “Piast-Ziemowit” coal. Moreover, the overall energy efficiency, which was expressed as the ratio of the energy contained in the gas produced to the energy contained in the coal consumed, was significantly higher in the experiments using oxygen.
Regardless of the type of coal used, the rate of water condensate production was always higher for the oxygen test than for the OEA test. Despite the lower content of water in the coal sourced from the “Wesoła” mine, the rate of condensate production was higher than for the corresponding test from the “Piast-Ziemowit” mine.
Although underground gasification of coal in an oxygen atmosphere generates higher process costs, it nevertheless allows us to obtain gaseous products whose quality allows them to be used not only for direct combustion, but also for chemical syntheses.
As far as gas quality is concerned, the presence of water in the gasification process is essential, although an excess of water leads to a reduction in gasification efficiency due to the considerable loss of heat required for the evaporation of moisture.
The textural characteristics (porosity development) of the chars that resulted from the gasification experiments were consistent with the higher etching reactivity expected for the less coalified “Piast-Ziemowit” coal under the more reactive pure oxygen atmosphere. Solely in this case, a noticeable development of pores larger than 0.7 nm was detected. In the other cases, the porous texture of the resulting chars was almost exclusively dominated by smaller pores.

Author Contributions

Conceptualization, M.W., K.K., K.S., A.C.-M., F.S.-G. and J.I.P.; investigation, M.W., K.K., A.C.-M., F.S.-G. and J.I.P.; writing—original draft preparation, M.W., K.K., A.S.-W., K.S., A.C.-M., F.S.-G. and J.I.P.; writing—review and editing, M.W., A.S.-W. and K.S.; visualization, M.W. and A.C.-M.; supervision, K.K. and K.S.; project administration, K.S. and J.I.P. All authors have read and agreed to the published version of the manuscript.

Funding

The paper was supported by the UCGWATERplus project “Coal- and bio-based water remediation strategies for underground coal gasification and beyond”, which is supported by the EU Research Fund for Coal and Steel, under the Grant Agreement no. 101033964, and the Polish Ministry of Education and Science, under the contracts nos. 5198/FBWiS/2021/2 and 5211/FBWiS/2021/2.

Institutional Review Board Statement

Not applicable.

Informed Consent Statement

Not applicable.

Data Availability Statement

Not applicable.

Conflicts of Interest

The authors declare no conflict of interest.

References

  1. Olness, D.U.; Gregg, D.W. The Historical Development of Underground Coal Gasification; Technical Report UCRL-52283; California University, Lawrence Livermore Lab: Livermore, CA, USA, 1977. [Google Scholar]
  2. Klimenko, A.Y. Early Ideas in Underground Coal Gasification and Their Evolution. Energies 2009, 2, 456–476. [Google Scholar] [CrossRef]
  3. Bhutto, A.W.; Bazmi, A.A.; Zahedi, G. Underground coal gasification: From fundamentals to applications. Prog. Energy Combust. Sci. 2013, 39, 189–214. [Google Scholar] [CrossRef]
  4. Blinderman, M.S.; Anderson, B. Underground coal gasification for power generation: Efficiency and CO2-emissions. In Proceedings of the 12th International Conference on Coal Science, Cairns, Australia, 2–6 November 2003; p. 13. [Google Scholar]
  5. Green, M. Recent developments and current position of underground coal gasification. Proc. Inst. Mech. Eng. Part A J. Power Energy. 2018, 232, 39–46. [Google Scholar] [CrossRef]
  6. Feng, Y.; Yang, B.; Hou, Y.; Duan, T.-H.; Yang, L.; Wang, Y. Comparative environmental benefits of power generation from underground and surface coal gasification with carbon capture and storage. J. Clean. Prod. 2021, 310, 127383. [Google Scholar] [CrossRef]
  7. Kostúr, K.; Laciak, M.; Durdan, M. Some Influences of Underground Coal Gasification on the Environment. Sustainability 2018, 10, 1512. [Google Scholar] [CrossRef]
  8. Mokhahlane, L.S.; Wagner, N.J.; Vermeulen, D. Evidence of coal conversion in the Majuba underground coal gasification pilot plant, South Africa. Coal Combust. Gasif. J. 2022. [Google Scholar] [CrossRef]
  9. Perkins, G. Underground coal gasification—Part I: Field demonstrations and process performance. Prog. Energy Combust. Sci. 2018, 67, 158–187. [Google Scholar] [CrossRef]
  10. Perkins, G. Underground coal gasification—Part II: Fundamental phenomena and modeling. Prog. Energy Combust. Sci. 2018, 67, 234–274. [Google Scholar] [CrossRef]
  11. Pershad, S.; Pistorius, J.; van der Riet, M. Majuba underground coal gasification project. In Underground Coal Gasification and Combustion; Blinderman, M.S., Klimenko, A.Y., Eds.; Woodhead Publishing: Cambridge, UK, 2014; pp. 469–502. [Google Scholar]
  12. Takyi, S.A.; Zhang, Y.; Si, M.; Zeng, F.; Li, Y.; Tontiwachwuthikul, P. Current status and technology development in implementing low carbon emission energy on underground coal gasification (UCG). Front. Energy Res. 2023, 10, 1051417. [Google Scholar] [CrossRef]
  13. Sripada, P.; Khan, M.M.; Ramasamy, S.; Trivedi, J.; Gupta, R. Influence of coal properties on the CO2 adsorption capacity of coal gasification residues. Energy Sci. Eng. 2018, 6, 1–15. [Google Scholar] [CrossRef]
  14. Sarhosis, V.; Yang, D.; Sheng, Y.; Kempka, T. Coupled hydro-thermal analysis of underground coal gasification reactor cool down for subsequent CO2 storage. Energy Procedia 2013, 40, 428–436. [Google Scholar] [CrossRef]
  15. Jiang, L.; Chen, Z.; Ali, S.M.F. Feasibility of carbon dioxide storage in post-burn underground coal gasification cavities. Appl. Energy 2019, 252, 113479. [Google Scholar] [CrossRef]
  16. Jiang, L.; Chen, Z.; Ali, S.M.F.; Zhang, J.; Chen, Y.; Chen, S. Storing carbon dioxide in deep unmineable coal seams for centuries following underground coal gasification. J. Clean. Prod. 2022, 378, 134565. [Google Scholar] [CrossRef]
  17. Kapusta, K.; Wiatowski, M.; Thomas, H.R.; Zagorščak, R.; Sadasivam, S.; Masum, S.; Kempka, T.; Otto, C.; Basa, W.; Szyja, M.; et al. Experimental simulations of methane-oriented underground coal gasification using hydrogen–The effect of coal rank and gasification pressure on the hydrogasification process. Int. J. Hydrog. Energy 2023, 48, 921–932. [Google Scholar] [CrossRef]
  18. Kumari, G.; Vairakannu, P. Laboratory scale studies on CO2 oxy-fuel combustion in the context of underground coal gasification. J. CO2 Util. 2017, 21, 177–190. [Google Scholar] [CrossRef]
  19. Yin, Z.; Xu, H.; Chen, Y.; Zhao, T. Coal char characteristics variation in the gasification process and its influencing factors. Energy Explor. Exploit. 2020, 38, 1–15. [Google Scholar] [CrossRef]
  20. Wang, Z.; Liang, D.; Li, Y.; Tian, H.; Liang, J. Pyrolysis characteristics of large-scale bituminous coal. J. Anal. Appl. Pyrolysis 2021, 158, 105060. [Google Scholar] [CrossRef]
  21. Xi, J.; Linag, J.; Sheng, X.; Shi, L.; Li, S. Characteristics of lump lignite pyrolysis and the influence of temperature on lignite swelling in underground coal gasification. J. Anal. Appl. Pyrolysis 2016, 117, 228–235. [Google Scholar] [CrossRef]
  22. Wiatowski, M.; Kapusta, K.; Nowak, J.; Szyja, M.; Basa, W. An exsitu underground coal gasification experiment with a siderite interlayer: Course of the process, production gas, temperatures and energy efficiency. Int. J. Coal Sci. Technol. 2021, 8, 1447–1460. [Google Scholar] [CrossRef]
  23. Wang, D.; Peng, Z.; Wang, J.; Liang, L.; Tu, C.; Zhang, Q.; Huang, W. Study on pyrolysis behavior of the coal fractions based on macro maceral separation. Fuel 2021, 305, 121572. [Google Scholar] [CrossRef]
  24. Yu, G.; Fan, X.; Liang, P.; Zhao, G.M.; Hu, X. Online characterization of pyrolysis products and kinetics study for the pyrolysis of a coal. J. Anal. Appl. Pyrolysis 2021, 160, 105376. [Google Scholar] [CrossRef]
  25. Chen, Y.; Yin, Z.; Sun, F.; Xu, H.; Wu, J.; Fu, F. Pyrolysis characteristics and microstructure evolution of different coal types. Energy Explor. Exploit. 2023, 41, 154–169. [Google Scholar] [CrossRef]
  26. PN-G-04560:1998 Standard; Paliwa Stałe—Oznaczanie Zawartości Wilgoci, Części Lotnych Oraz Popiołu Analizatorem Automatycznym. Solid Fuels—Determination of Moisture, Volatile Matter and Ash by Automatic Analyzer. Polish Committee for Standardization: Warsaw, Poland, 1998. (In Polish)
  27. PN-G-04516:1998 Standard; Paliwa Stałe—Oznaczanie Zawartości Części Lotnych Metodą Wagową. Solid Fuels—Gravimetric Determination of Volatile Matter. Polish Committee for Standardization: Warsaw, Poland, 1998. (In Polish)
  28. PN-G-04584:2001 Standard; Paliwa Stałe—Oznaczanie Zawartości Siarki Całkowitej i Popiołowej Automatycznymi Analizatorami. Solid Fuels—Determination of Total and Ash Sulfur Content with Automatic Analyzers. Polish Committee for Standardization: Warsaw, Poland, 2001. (In Polish)
  29. PN-G-04513:1981 Standard; Paliwa Stałe—Oznaczanie Ciepła Spalania i Obliczanie Wartości Opałowej. Solid Fuels—Determination of the Calorific Value and Calorific Value Calculation. Polish Committee for Standardization: Warsaw, Poland, 1991. (In Polish)
  30. PN-ISO 7404-5:2002 Standard; Metody Analizy Petrograficznej Węgla Kamiennego (Bitumicznego) i Antracytu—Część 5: Metoda Mikroskopowa Oznaczania Refleksyjności Witrynitu. Methods of Petrographic Analysis of Bituminous Coal and Anthracite—Part 5: Microscopic Method for Determination of Vitrinite Reflectivity. Polish Committee for Standardization: Warsaw, Poland, 2002. (In Polish)
  31. PN-G-04571:1998 Standard; Paliwa Stałe—Oznaczanie Zawartości Węgla, Wodoru i Azotu Automatycznymi Analizatorami—Metoda Makro. Solid Fuels—Determination of Carbon, Hydrogen and Nitrogen Content with Automatic Analyzers—Macro Method. Polish Committee for Standardization: Warsaw, Poland, 1998. (In Polish)
  32. International Classification of In-Seam Coals. Available online: https://unece.org/fileadmin/DAM/energy/se/pdfs/coal/1998_International_Classification_of_In-Seam_Coals_-January_1998.pdf (accessed on 22 May 2023).
  33. Róg, L. Vitrinite reflectance as a measure of the range of influence of the temperature of a georeactor on rock mass during underground coal gasification. Fuel 2018, 224, 94–100. [Google Scholar] [CrossRef]
  34. Lett, R.G.; Ruppel, T.C. Coal, Chemical and Physical Properties in Encyclopedia of Energy; Elsevier: Amsterdam, The Netherlands, 2004; pp. 411–423. [Google Scholar]
  35. PN-G-04511:1980 Standard; Paliwa Stałe—Oznaczanie Zawartości Wilgoci. Solid Fuels—Determination of Moisture Content. Polish Committee for Standardization: Warsaw, Poland, 1980. (In Polish)
  36. PN-ISO 18283:2006+PN-ISO 18283:2006/AC1:2009 Standard; Hard Coal and Coke—Manual Sampling. Polish Committee for Standardization: Warsaw, Poland, 2006.
  37. UNE 32111:1995 Standard; Hard Coal and Anthracite. Determination of Ash Content with Automatic Programable Furnances. UNE: Madrid Spain, 1995.
  38. ISO 589:2008 Standard; Hard Coal—Determination of Total Moisture. ISO: Geneva, Switzerland, 2008.
  39. Kardaś, D. From biomass towards syngas. Trans. Inst. Fluid-Flow Mach. 2015, 127, 63–89. [Google Scholar]
  40. Lahijani, P.; Zainal, Z.A.; Mohammadi, M.; Mohamed, A.R. Conversion of the greenhouse gas CO2 to the fuel gas CO via the Boudouard reaction: A review. Renew. Sustain. Energy Rev. 2015, 41, 615–632. [Google Scholar] [CrossRef]
  41. Dai, H.; Zhao, H.; Chen, S.; Jiang, B. A Microwave-Assisted Boudouard Reaction: A Highly Effective Reduction of the Greenhouse Gas CO2 to Useful CO Feedstock with Semi-Coke. Molecules 2021, 26, 1507. [Google Scholar] [CrossRef]
  42. Sadasivam, S.; Zagorščak, R.; Thomas, H.R.; Kapusta, K.; Stańczyk, K. Experimental study of methane-oriented gasification of semi-anthracite and bituminous coals using oxygen and steam in the context of underground coal gasification (UCG): Effects of pressure, temperature, gasification reactant supply rates and coal rank. Fuel 2020, 268, 117330. [Google Scholar] [CrossRef]
  43. Kapusta, K.; Wiatowski, M.; Stańczyk, K.; Zagorščak, R.; Thomas, H.R. Large-scale Experimental Investigations to Evaluate the Feasibility of Producing Methane-Rich Gas (SNG) through Underground Coal Gasification Process. Effect of Coal Rank and Gasification. Energies 2020, 13, 1334. [Google Scholar] [CrossRef]
  44. Otto, C.; Steding, S.; Tranter, M.; Gorka, T.; Hámor-Vidó, M.; Basa, W.; Kapusta, K.; Kalmár, I.; Kempka, T. Numerical Analysis of Potential Contaminant Migration from Abandoned In Situ Coal Conversion Reactors. Adv. Geosci. 2022, 58, 55–66. [Google Scholar] [CrossRef]
  45. Otto, C.; Kempka, T. Synthesis gas composition prediction for underground coal gasification using a thermochemical equilibrium modeling approach. Energies 2020, 13, 1171. [Google Scholar] [CrossRef]
  46. Makarova, A.A.; Kaliberda, I.V.; Kovalev, D.A.; Pershin, I.M. Modeling a Production Well Flow Control System Using the Example of the Verkhneberezovskaya Area. In Proceedings of the Conference of Russian Young Researchers in Electrical and Electronic Engineering (ElConRus), Saint Petersburg, Russia, 25–28 January 2022; pp. 760–764. [Google Scholar] [CrossRef]
  47. Thommes, M.; Kaneko, K.; Neimark, A.V.; Olivier Rodriguez-Reinoso, J.P.F.; Rouquerol, J.; Sing, K.S.W. Physisorption of gases, with special reference to the evaluation of surface area and pore size distribution (IUPAC Technical Report). Pure Appl. Chem. 2015, 87, 1051–1069. [Google Scholar] [CrossRef]
  48. Lozano-Castelló, D.; Cazorla-Amorós, D.; Linares-Solano, A. Usefulness of CO2 adsorption at 273 K for the characterization of porous carbons. Carbon N. Y. 2004, 42, 1231–1236. [Google Scholar] [CrossRef]
  49. Thommes, M.; Cychosz, K.A. Physical adsorption characterization of nanoporous materials: Progress and challenges. Adsorption 2014, 20, 233–250. [Google Scholar] [CrossRef]
Figure 1. Preparation of coal block for gasification: (a) preparation of artificial coal seam for UCG test; (b) cutting of fire channel; (c) laying a coal block in reactor; (d) reactor ready for UCG tests.
Energies 16 04455 g001aEnergies 16 04455 g001b
Figure 2. Scheme of ex situ UCG installation: (1) reagent supply system; (2) gasification reactor; (3) connection for tar sampling; (4) water scrubber; (5) air cooler for process gas; (6,7) gas separators; (8) centrifugal suction fan; (9) thermal combustor; (10) gas purification module for GC analysis [22].
Energies 16 04455 g002
Figure 3. Details of reactor construction for test No. 1: (a) longitudinal cross section—arrangement of coal seam and thermocouple positions; (b) cross-section—dimensions of coal seam; (c) location of thermocouples.
Energies 16 04455 g003
Figure 4. Gas production rates and gasification reagent supply rates over course of experiments on UCG of “Piast-Ziemowit” coal: (a) Experiment No. 1, OEA; (b) Experiment No. 2, oxygen.
Energies 16 04455 g004
Figure 5. Gas production rates and gasification reagent supply rates over course of experiments on UCG of “Wesoła” coal: (a) Experiment No. 3, OEA; (b) Experiment No. 4, oxygen.
Energies 16 04455 g005
Figure 6. Mass of water condensate as a function of gasification time for “Piast-Ziemowit” coal: (a) Experiment No. 1, OEA; (b) Experiment No. 2, oxygen.
Energies 16 04455 g006
Figure 7. Mass of water condensate as a function of gasification time for “Wesoła” coal: (a) Experiment No. 3, OEA; (b) Experiment No. 4, oxygen.
Energies 16 04455 g007
Figure 8. Process gas composition as a function of gasification time for coal sourced from “Piast-Ziemowit” mine: (a) Experiment No. 1, OEA; (b) Experiment No. 2, oxygen.
Energies 16 04455 g008
Figure 9. Process gas composition as a function of gasification time for coal sourced from “Wesoła” mine: (a) Experiment No. 3, OEA; (b) Experiment No. 4, oxygen.
Energies 16 04455 g009
Figure 10. Changes in gas calorific value over course of “Piast-Ziemowit” coal gasification: (a) Experiment No. 1, OEA; (b) Experiment No. 2, oxygen.
Energies 16 04455 g010
Figure 11. Changes in gas calorific value over course of “Wesoła” coal gasification: (a) Experiment No. 3, OEA; (b) Experiment No. 4, oxygen.
Energies 16 04455 g011
Figure 12. Temperature distribution in reactor for test No. 1 (“Piast-Ziemowit” coal with OEA): (a) gasification channel: (b) 0.3 m above bottom of coal seam, (c) 0.6 m above bottom of coal seam.
Energies 16 04455 g012
Figure 13. Temperature distribution in reactor for test No. 2 (“Piast-Ziemowit” coal with oxygen): (a) gasification channel, (b) 0.3 m above bottom of coal seam; (c) 0.6 m above bottom of coal seam.
Energies 16 04455 g013
Figure 14. Temperature distribution in reactor for test No. 3 (“Wesoła” coal with OEA): (a) gasification channel; (b) 0.3 m above bottom of coal seam; (c) 0.6 m above bottom of coal seam.
Energies 16 04455 g014
Figure 15. Temperature distribution in reactor for test No. 4 (“Wesoła” coal with oxygen): (a) gasification channel; (b) 0.3 m above bottom of coal seam; (c) 0.6 m above bottom of coal seam.
Energies 16 04455 g015
Figure 16. N2 adsorption/desorption isotherms for chars from UCG experiments 1–4.
Energies 16 04455 g016
Figure 17. CO2 adsorption/desorption isotherms for chars from UCG experiments 1–4.
Energies 16 04455 g017
Table 1. Proximate and ultimate characteristics of gasified coals.
ParameterCoalMethodReference Document
“Piast-Ziemowit”“Wesoła”
As received
Total moisture Wtr (%)8.503.73ThermogravimetricPN-G-04560:1998 [26]
Ash Atr (%)7.562.14ThermogravimetricPN-G-04560:1998 [26]
Volatile matter content Vra (%)30.1530.40GravimetricPN-G-04516:1998 [27]
Total sulphur Str (%)0.980.21High temperature combustion
with IR detection
PN-G-04584:2001 [28]
Calorific value Qr (kJ/kg)25,78631,458CalculationsPN-G-04513:1981 [29]
Analytical
Moisture Wa (%)7.473.49ThermogravimetricPN-G-04560:1998 [26]
Ash Aa (%)7.642.15ThermogravimetricPN-G-04560:1998 [26]
Volatile matter content Va (%)30.4930.12GravimetricPN-G-04516:1998 [27]
Reflectance of vitrinite R (%)0.570.83MicroscopicPN-ISO 7404-5:2002 [30]
Lower heating value Qa (kJ/kg)26,10331,543CalorimetricPN-G-04513:1981 [29]
Total sulphur Sta (%)0.990.21High temperature combustion
with IR detection
PN-G-04584:2001 28]
Carbon Ca (%)68.6282.01High temperature combustion
with IR detection
PN-G-04571:1998 [31]
Hydrogen Ha (%)4.305.18High temperature combustion
with IR detection
PN-G-04571:1998 [31]
Nitrogen Na (%)1.082.24High temperature combustion
with thermal conductivity detection
PN-G-04571:1998 [31]
Oxygen Oa (%)10.204.83Oxygen calculated as: ( O a ) = 100 ( W a ) ( A a ) ( C a ) ( H a ) ( S t a ) ( N a )
Table 2. Specifications of measuring equipment and methods used.
Measured ValueControl Method
Gas temperature inside the reactorThermocouple Pt10Rh-Pt
Temperature at the reactor inlet, outlet and scrubberResistance sensor Pt100
PressureWIKA digital transmitter IS-20-S
Flow of process gasELSTER bellows gas meter BK-G10M
Composition of process gasesAgilent 3000 A gas chromatograph
Flow of oxygenBronkhorst EL-FLOW mass flow controller, model F-202AV-M20-RAD
Table 3. General characteristics of conducted UCG experiments 1–4.
Experiment Number1234
Coal origin“Piast-Ziemowit” mine (Poland)“Wesoła” mine (Poland)
Coal typeBituminousBituminous
Gasifying agentOEAOxygenOEAOxygen
Installation pressureAmbientAmbientAmbientAmbient
Coal block dimensions (m)0.6 × 0.8 × 2.50.5 × 0.7 × 2.00.5 × 0.7 × 2.00.6 × 0.8 × 2.5
Mass of coal inside the reactor (kg)12256878301365
Experiment duration (h)56727272
Amount of coal gasified (kg)140.9323.94165.3292.1
Gasification rate (kg/h)2.524.502.294.06
Wastewater produced * (kg)234 (1018)364 (1372)189 (1197)261 (1269)
Wastewater production rate (kg/h)4.185.012.633.63
Wastewater outflow
(kg/kg gasified coal)
1.661.121.140.89
Moisture content in the sand layer after UCG process (%)7.04.26.55.7
* real quantity of post-process water obtained from coal gasification after subtracting volume of water added to scrubber; total amount of water before correction is given in brackets.
Table 4. Average gas composition and calorific value.
Exp. No.Gasification ReagentProcess Gas Yield
(Nm3)
Average Gas Production Rate
(Nm3/h)
Concentration (vol, %)Average Calorific
Value (MJ/Nm3)
CO2H2CH4COC2H6H2SN2
1OEA487.08.6927.947.112.126.420.090.0756.252.25
2Oxygen556.37.7338.7525.472.9831.810.110.250.637.96
3OEA567.77.8630.879.502.5710.720.130.2745.943.44
4Oxygen584.98.1236.1023.246.1733.410.270.130.689.14
Table 5. Experiments balance calculations.
Exp. No.Gas Yield
(Nm3)
Average Gas Production Rate
(Nm3/h)
Energy in Gas
(MJ)
Amount
of Coal Gasified
(kg)
Gasification Rate
(kg/h)
Energy of Consumed Coal
(MJ)
Energy Efficiency
(%)
1486.958.691095.6140.92.523634.330.1
2556.267.734427.8323.94.508353.053.0
3567.77.861925.9165.32.295198.937.6
4584.98.125348.0292.14.069190.358.2
Table 6. Physico-chemical characterization of UCG chars derived from “Piast-Ziemowit” (UCG-1 and UCG-2 chars) and “Wesoła” (UCG-3 and UCG-4 chars) coals.
Parameter (Unit)Sample
UCG-1 CharUCG-2 CharUCG-3 CharUCG-4 Char
Elemental analysis
Moisture (wt.%)3.293.882.510.80
Ash (wt.%)12.3321.324.626.24
C (wt.%)83.5876.4192.5990.81
H (wt.%)1.090.241.200.77
N (wt.%)1.300.731.441.42
S (wt.%)1.252.060.210.21
ICP-MS analysis
Na (%)2.83.01.02.9
Mg (%)1.70.79.47.6
Al (%)17.012.53.48.6
K (%)0.60.30.20.9
Ca (%)5.50.917.013.7
V (ppm)3273885769
Cr (ppm)239117235450
Mn (ppm)1317243--
Mn (%)--0.30.2
Fe (%)3.72.512.011.2
Cu (ppm)587192475562
Zn (ppm)179133450494
As (ppm)53121111.9
P (%)1.20.0----
Ti (%)0.80.40.10.3
Pb (ppm)1018426102
Table 7. Textural characterization of raw UCG chars.
SampleN2 AdsorptionCO2 Adsorption
VT (cm3/g)SBET (m2/g)VDR,N2 (cm3/g)VDR,CO2 (cm3/g)
UCG-1 Char0.0190.000.11
UCG-2 Char0.03570.020.06
UCG-3 Char0.0050.000.04
UCG-4 Char0.0190.000.05
Disclaimer/Publisher’s Note: The statements, opinions and data contained in all publications are solely those of the individual author(s) and contributor(s) and not of MDPI and/or the editor(s). MDPI and/or the editor(s) disclaim responsibility for any injury to people or property resulting from any ideas, methods, instructions or products referred to in the content.

