Article

3D Solar Irradiance Model for Non-Uniform Shading Environments Using Shading (Aperture) Matrix Enhanced by Local Coordinate System

Faculty of Engineering, University of Miyazaki, Miyazaki 889-2192, Japan
*
Author to whom correspondence should be addressed.
Energies 2023, 16(11), 4414; https://doi.org/10.3390/en16114414
Submission received: 18 April 2023 / Revised: 20 May 2023 / Accepted: 27 May 2023 / Published: 30 May 2023
(This article belongs to the Special Issue Forecasting, Modeling, and Optimization of Photovoltaic Systems)

Abstract

:
Building-integrated photovoltaics (BIPVs) and vehicle-integrated photovoltaics (VIPVs) receive solar irradiance through non-uniform shading objects. Standard scalar calculations cannot accurately determine the solar irradiance of BIPV and VIPV systems. This study proposes a matrix model using an aperture matrix to accurately calculate the horizontal and vertical planes affected by non-uniform shading objects. This can be extended to the solar irradiance on a VIPV by applying a local coordinate system. The 3D model is validated by a simultaneous measurement of five orientations (roof and four sides, front, left, tail, and right) of solar irradiance on a car body. An accumulated logistic function can approximate the shading probability. Furthermore, the combined use of the 3D solar irradiance model is effective in assessing the energy performance of solar electric vehicles in various zones, including buildings, residential areas, and open spaces. Unlike standard solar energy systems, the energy yield of a VIPV is affected by the shading environment. This, in turn, is affected mainly by the location of vehicle travel or parking in the city rather than by the climate zones of the city.

1. Introduction

The solar electric vehicle (SEV) case study was conducted by experts [1,2,3] and car manufacturers [4]. Typical calculations on the impact of solar energy on electric vehicles (EVs) assumed a photovoltaic (PV) area of 3.23 m2 and a battery size of 40 kWh. Assuming a vehicle-integrated photovoltaic (VIPV) of a capacity of 1 kW, 70% of cars (traveling less than 30 km/day) are likely to operate on solar energy [4,5,6]. The likely sales would be 50 GW/year [7]. In these expectations, the solar cells are assumed to have been stabilized with little or no degradation. On the other hand, certain solar cells, such as amorphous Si [8], perovskite [9], crystalline Si [10], and Si modules [11], degrade over time. This aspect should be considered in the energy value in the lifetime of the product. These devices, when mounted or integrated with the car body, are commonly referred to as vehicle-integrated photovoltaics (VIPVs). Moreover, VIPV systems are effective in providing auxiliary power and extending the range of vehicles, including hybrid vehicles [12] and battery electric vehicles (BEVs) [13]. They also serve as a research area for innovation in the utilization of solar energy [14], particularly in auxiliary power applications [15]. Several renowned car manufacturers, including Ford [16], Toyota [17], Karma [18], Hanergy [19], and Nissan [20], have developed impressive demonstration cars showcasing the integration of vehicle-integrated photovoltaic (VIPV) technology. Several demonstration programs have validated the use of PV as an energy source for EVs. University educational programs have proposed several innovative designs for SEVs. Sierra and Reinders examined the integration of PV charging stations [21], and Kanz et al. designed lightweight cars [22]. Several authors have independently analyzed the impact of SEVs on society and environment, including the use of energy in disaster zones [23]. Several design advances have been achieved, such as the introduction of lightweight PV modules [24], interconnection designs [25], and vehicle patterns [26]. Kanz et al. analyzed the environmental impact [22], Mallon discussed the advantages of battery lifetime [27], and Pinto examined the range extension [13]. The overall state was reviewed by Conti [28]. Lightyear [29] and Sono Motors [30] are on the threshold of developing a new market for VIPVs.
The solar irradiance and response to VIPV performance are complex. These include curved surfaces and non-uniform shading objects [31], partial shadings and hotspots [32], and others [33]. They occur because of the following factors:
  • The curved surface [31];
  • Frequent variation in the orientation angle of a VIPV during driving [31];
  • Relatively higher probability for VIPVs to be shaded by objects [31];
  • Relatively small size of shading objects, such as street trees and signals, and the consequent high influence of partial shading loss on these [31];
  • Temperature variation (parking and driving) [31];
  • Dynamic fluctuation of the solar spectrum [31];
  • Rapid fluctuations in solar irradiance (in milliseconds) owing to dynamic partial shading [31].
The issue of a curved surface induces ambiguity, including the inherent mismatch loss owing to non-uniform irradiance [31], discrepancy in the aperture area [34], variation in the cosine loss [35], correction of the curved shape [34], and coverage constraints owing to excessive curvature [36].
This paper reports on the influence of these differences on the performance of VIPVs and the measurement of these differences. In particular, we investigate the solar irradiance on a VIPV using outdoor measurements.
  • Solar irradiance onto the VIPV (orthogonal five orientations-roof and four sides, front, left, tail, and right);
  • Distribution of shaded objects, estimation of solar irradiance, and irradiation on an arbitrary reference plane tangential to the curved surface of the VIPV.
Assuming these factors are independent, the VIPV power can be formulated as follows:
(VIPV Power) = (solar irradiance on the VIPV) × (rated power) × (impact of partial shading) × (spectrum correction) × (temperature correction) × (influence of curved surface, including self-shading loss) × (dynamic shading impact)
In the case of energy rating, the above factors are replaced with their expected values by integrating these factors weighted by their probability values.
Notably, the spectral impact is crucial for building-integrated photovoltaics (BIPVs) [37]. However, this may be significant for a VIPV only when multi-junction solar cells are used [38].
The following measurements are beyond the scope of this study, and they are not considered in the model measurement and calculations:
  • Partial shading impact;
  • Dynamic shading impact (only for the VIPV);
  • Testing the VIPV indoors or outdoors for rating;
  • I–V curve measurement during driving (only for the VIPV);
  • Influence of power on the curved surface;
  • Transient output of the modules, which is affected by the capacitance and other transient characteristics of the device (only for the VIPV);
  • Temperature measurements;
  • Spectrum correction.
The impact of partial shading includes the dynamic impact of the circuit conditions similar to the impact caused by a local temperature rise (hot-spot) and junction capacitance caused by reverse-bias voltage affecting the transient response of dynamic partial shading. These factors are not included in the modeling, measurement, and calculations.
In this study, we primarily focus on the VIPV. The model of this study is also applied to other solar applications affected by non-uniform shadings, such as building-integrated photovoltaics (BIPVs). The classical approach for designing and optimizing a BIPV installation is based on calculating direct, diffused, and diffused reflected solar irradiance using trigonometric functions [39,40,41,42,43]. These are the extension to the various building surfaces, but they do not fully consider the asymmetrical shading distribution. Furthermore, in the case of a VIPV, consideration of the non-uniform shading environment is too complicated to cover with the extension of the classical calculation method. To consider the impact of shading on adjacent buildings, there have been attempts to develop and integrate geographical approaches to calculate the solar irradiance onto the building walls [44,45,46]. More recently, advanced computational methods using neural networks [47], machine learning [48], and artificial intelligence (AI) [49] have been developed. These advanced methods are mainly for calculating the average and peak irradiance and are used for annual or seasonal and maximum energy yields. For extending the energy prediction to non-ideal situations, such as curved array surfaces and partial shading with small shading objects, numerical models may not be flexible, and physical models based on the extension of the classical model may be required. Although buildings do not move and the rotation of the coordinate system, as in the case of VIPV applications, is unnecessary, the approaches mentioned above for VIPVs will be helpful.
Because this work focuses on nonuniformly shaded objects, calculating the solar irradiance on a solar panel is beyond the classical formula based on the scalar arithmetic of trigonometric functions. This is based on the assumption that the hemispherical sky is uniform, which is valid for the fixed-tilt installation of solar panels on a sloped surface, thereby meticulously circumventing shading objects. Additionally, Brito studied the solar irradiance on a car roof (horizontal plane) while driving in a building zone [50]. However, this study does not consider the issues listed below. It addresses the remaining problems of consistency.
  • Solar irradiance in other zones such as residential and open zones;
  • Solar irradiance on car sides;
  • Simultaneous validation of the five orthogonal orientations (i.e., evidence on only one axis may not be substantial);
  • Pathway to the energy rating of the VIPV;
  • Consistency among different shading environments, car orientations, and car sides.
The models and measurements presented in this article rely on angles. It is assumed that the distance to the shading objects is substantially more than the size of the objects and measurement points.
The classical calculation in solar energy systems uses arithmetic with trigonometric functions. It works well for rooftop systems and solar powerplants that are selectively installed, avoiding shadows. The arithmetic model is too simplified for applications such as a VIPV and BIPV. This article presents equations for matrix calculations and validation.

2. Methods

2.1. Local Coordinate System

The orientation angle of VIPV is varied frequently during driving. Furthermore, the performance of a VIPV system is influenced by the curved shape of the car body. To calculate the impact of the curved surface, the irradiance influenced by the surrounding shading structure was estimated, and the angular distribution of solar irradiance, power, and energy were predicted. The coordinate system used to analyze the irradiance was extended to the curved module regardless of whether it was local or global, compatible or continuous with the coordinate system used for terrestrial irradiance on the PV module. Moreover, the coordinate system was maintained to have continuity and compatibility with the vehicle navigation and mapping systems.
In this case, a local coordinate system was used instead of a global or absolute coordinate system.
The local angular coordinate system of the VIPV used left-handed polar coordinates. The original axis of the orientation was in the front direction, and the directional angle increased clockwise from the top view. When the vehicle moved south, the west was positive, and the east was negative (Figure 1).
The local orientation angle was transformed into a global azimuthal angle using Equation (1):
ϕ = m o d φ + Φ 180 ° ,   360 °
where:
ϕ was the global azimuth angle (0° in the south), expressed in the global coordinate system.
φ was the orientation angle in the local coordinate system.
Φ was the direction angle of the vehicle; it was generally measured using GPS and expressed in the global coordinate system.
mod(x, y) was a function that returned the remainder when dividing x by y (x modulo y) and had the same sign as x.
Notably, the rotation in Equation (1) was not applied to BIPV, as the building did not move, and its orientation in the absolute coordinate system on the ground was unchanged. However, the concept of a local coordinate system was useful, especially when the BIPV was installed on a curved surface.
Because the vehicle roof generally used for PV panel mounting was a curved surface and the sides of vehicles were occasionally used for PV panel mounting, the local irradiance was acquired for at least five directions: the roof (z-direction), front (+x direction), tail (−x direction), left side (+y direction), and right side (−y direction) (Figure 2).
The coordinate system shown in Figure 2 is typically used for vehicle-sensing systems [51]. This differs from the car body [52] and the IEC’s standardization of VIPV technologies [53].

2.2. Solar Irradiance Measurement Influenced by Shading Objects

The orientation of the PV panel and shading objects in case of VIPV varied with time owing to the movement of vehicles. The sun’s angle was not on the absolute coordinates, but local to the vehicle orientation. Suppose that only the roof irradiance was the main focus; the redundant measurement of the other four directions helped validate the irradiance model.
The measurement data from the five orientations were the basis of the angular distribution of solar irradiance to the car, accurate modeling of the energy yield, and optimized design of the solar system. Multiple pyranometers could be installed conveniently on the car body such that the instrument assembly could shift to different measurements in different shading environments (Figure 3).
The pyranometer characteristics and mounting requirements are summarized in Table 1. In addition to the pyranometer array and its data-logging system, GPS data (possibly with gyro data (position of the vehicle, orientation of the car, and vehicle speed) synchronized to the clock of the pyranometer array) were collected. The irradiance was compared with the global horizontal irradiance (GHI) and direct normal irradiance (DNI) measurements at a fixed position with a synchronized clock for reference irradiance monitoring. The vehicle carrying the pyranometer array was located within a circle of 20 km radius and centered at the site of the reference irradiance measurement.
The time-based clock and triggering time were synchronized with the target measurements. The recording was started or truncated approximately 1 min after sunrise and terminated approximately 1 min before sunset.
The GPS was capable of measuring the position (latitude and longitude), time, orientation, velocity, and slope angle. The time base of the data sampling was less than 0.1 s considering the fact that a 60 km/h drive passed 1 m (typical VIPV module length in the driving direction) in approximately 0.06 s.
The glass that covered the irradiance sensors was cleaned before half of the working duration. Photographs of the reference measurement instrument were also obtained. The reference irradiance measurement was selected such that the grazing angle of the shaded object was less than 5°. The vehicle carrying the pyranometer array was located within a circle of radius 20 km and centered at the site of the reference irradiance measurement.

2.3. Measurement Methods of the Distribution of Shading Objects

The distribution of the shaded objects around a VIPV was essential for understanding its performance; this also assisted with energy rating. This section describes a measurement method using image processing for understanding the distribution.
Alternatively, the shading object distribution could be calculated using the 3D map data along the street. The drawbacks of this calculation method included a lack of updates and the omission of small shaded objects, such as street trees, which were crucial for partial shading losses.
  • A fisheye image of the sky was captured. Without blue-colored structures, such as blue signs and walls, the best capturing condition was a clear-sky day (no clouds) with certain shading objects shading the sun. In this case, a fisheye video or camera were used to generate the RGB images. The alternative timings were sunrise or sunset (Figure 4). The recommended fisheye video system is the model WV-S4550L made by Panasonic, Japan;
  • A median filter was applied to remove spot-like image noise;
  • If obtained under blue-sky conditions, decomposition into red, green, and blue images were effective. A differential image matrix (gray-scale matrix), such as 2B − (G + R), converted the sky into white and building walls into black regardless of whether these reflected sunlight (Figure 4). B, G, and R represented the image matrices decomposed from RGB images. A median image filter could erase spot-like noise by applying the median number of five adjacent elements. Note that differential image matrix calculations, such as 2B − (G + R), induced errors in the image, including bright-blue walls or signs. A typical mistake was considering bright-blue objects as part of the sky. In such cases, the image may have been replaced with the ones captured at low sun height (dark sky condition), as shown in Figure 4;
  • The filtered fisheye images were then binarized. The best threshold was determined conveniently using the median point of the two peaks of the brightness histogram (one peak corresponded to the open sky and the other corresponded to shading objects) (Figure 5);
  • The aperture matrix E was generated using a 2D histogram. The matrix elements ranged from zero to one (0: shaded, 1: unshaded). Shading implied shading a point in a hemispherical sky, instead of “shading the sun”. That is, the (i, j) elements, Ei,j, were the densities of the unshaded points in the 2D bin of the elevation angles [i°, (i + 1)°] (i = 0, 1, …. 89) and orientation angles [4j°, 4(j + 1)°] (j = 0, 1, …., 89). The image matrix could be conveniently converted from a polar coordinate system to an orthogonal coordinate system before the elements were counted in 2D bins (Figure 4). Occasionally, the reflection by a window was identified as the sky. However, it may have been filled in black (or zero in the matrix) manually, or erosion may have been applied using image processing.

2.4. Definition of the Aperture (Shading) Matrix

The aperture matrix E was a 90 × 90 matrix containing the unshaded probabilities. The matrix elements ranged from zero to one (0: shaded, 1: unshaded). Shading implied shading a point in a hemispherical sky instead of “shading the sun”. That is, the (i, j) elements, Ei,j, were the densities of the unshaded points in the 2D bin of the elevation angles [i°, (i + 1)°] (i = 0, 1, …., 89) and orientation angles [4j°, 4(j + 1)°] (j = 0, 1, …., 89). The values of the elements Ei,j ranged from zero to one. The structure of the aperture matrix E is shown in Figure 6. Furthermore, the orientation angle indicated the local orientation angle defined by φ in Equation (1) and Figure 1.
Occasionally, it is difficult to explain the aperture matrix. The term “aperture” may not be familiar. Alternatively, a shaded matrix could be effective. The conversion of aperture matrix to the shading matrix is convenient: (shading matrix) = 1 − (aperture matrix).
The fisheye image (polar coordinate system) of the orthogonal system (xi,j, yi,j) used in the aperture matrix E was converted using Equations (2)–(6):
I i = 2 · i 89 1 ,   i = 0 ,   1 ,     89
J j = 2 · j 89 1 ,   j = 0 ,   1 ,     89
y 0 i , j = 1 I i J j · 90 °
y i , j = y 0 i , j · y 0 i , j > 0
x i , j = a t a n 2 I i ,   J j
where i and j wree the index numbers of the matrix. The function atan2(x, y) returned the angle from the x-axis to a line containing the origin and the point (x, y). The results ranged between −180° and +180°, excluding −180°. The atan2 function was undefined at (0, 0).
Each element in the aperture matrix E was calculated using Equations (7)–(9):
f i i , j j = i = 0 89 j = 0 89 θ θ i i x i , j < θ θ i i + 1 · φ φ j j y i , j < φ φ j j + 1
f 2 i i , j j = i = 0 89 j = 0 89 θ θ i i x i , j < θ θ i i + 1 · φ φ j j y i , j < φ φ j j + 1 · B d e i , j
E i i , j j = f i i , j j 0 · f 2 i i , j j f i i , j j
where θθ and φφ were vectors of the bins of the local elevation angle and local orientation angle, respectively. Bde was a binarized image of the hemispherical sky (1: bright, 0: dark).
Using the aperture matrix E, the sky-view factor (SVF) was calculated using Equation (10):
S V F = mean E
where the function mean (M) calculated the arithmetic mean of all the elements in matrix M.
The diffused irradiance of the vehicle roof was expressed as the product of the reference diffused irradiance and SVF.

2.5. 3D Solar Irradiance Calculation Using the Aperture Matrix

The solar irradiance on a horizontal plane (car roof) influenced by substantial shading was expressed as follows (Equation (11)):
I z = S I z + D I z + R I z ,
where I z was the irradiance on the vehicle roof, S I z was the diffused irradiance on the vehicle roof, D I z was the direct irradiance on the vehicle roof, and R I z was the reflected irradiance on the vehicle roof.
The diffused irradiance on the car roof, influenced by substantial shading, was expressed using Equation (12):
S I z = S H I · S V F = S H I · mean E
where SHI was the diffused irradiance on the unshaded horizontal plane.
The direct irradiance was expressed using Equation (13):
D I z = D D · D N I · sin η
where DD was the discriminator of the unshaded condition (1: sun is unshaded, 0: sun is shaded) and η was the sun’s height. DD was identified conveniently using 1) the fisheye image and 2) the relationship between the azimuth angle and sun’s height with respect to the aperture matrix E.
The reflected irradiance R I z was calculated using Equations (14)–(18):
θ j = 0 ° + 90 ° · j M M ,   j = 0 , 1 M M
φ i = 0 ° + 360 ° · i N N ,   i = 0 , 1 , N N
α Φ = mod α Φ + 180 ° , 180 ° ,               α Φ 0 mod α Φ + 180 ° , 180 ° + 180 ° ,   α Φ < 0
R D i , j = θ j > η · D N I · cos η · cos φ i α Φ · cos φ i α Φ > 0
R I z = R v · i = 0 N N 1 j = 0 M M 1 1 E i , j · sin θ j + θ j + 1 2 · S I f + S I r + S I b + S I l 2 + R D i , j i = 0 N N 1 j = 0 M M 1 sin θ j + θ j + 1 2
where α was the azimuth angle of the sun; Φ was the car orientation (origin: north, clockwise); θ was the grazing angle from the car roof; φ was the orientation angle (origin: south, clockwise); MM and NN were the number of divisions including the edge side of elevation and orientation angles, respectively; α Φ was the local orientation angle of the car (origin: south, clockwise); RD was the vertical direct sunlight to the opposite side; S I f , S I r , S I b , and S I l were the solar irradiance of the front, right, back, and left sides, respectively, given by Equation (21); and R v was the reflectance of shading objects (=0.25).
The following equations showed the solar irradiance on four vertical planes (car sides) influenced by substantial shading:
I s i d e = S I s i d e + D I s i d e + R I s i d e + R I S s i d e
where Iside was the irradiance on the vehicle side, S I s i d e was the diffused irradiance on the vehicle side, D I s i d e was the direct irradiance on the vehicle side, R I s i d e was the reflected irradiance on the vehicle side from vertically shaded objects, and R I S s i d e was the reflected irradiance on the vehicle side from the street surface.
The rotation parameter ∆ was defined in Equation (20) to discriminate the four sides of the car:
Δ = 0 ° ,   F r o n t   s i d e 90 ° , r i g h t   s i d e 180 ° , B a c k   s i d e 270 ° ,   L e f t   s i d e
where ∆ was the rotational angle of the z-axis.
The diffused irradiance on the car roof was influenced by the substantial shading S I s i d e expressed in Equation (21):
S I s i d e = S H I ·   i = 0 N N 1 j = 0 M M 1 E i , j · cos φ i + φ i + 1 2 + Δ · cos φ i + φ i + 1 2 + Δ > 0 · cos 2 θ j + θ j + 1 2 i = 0 N N 1 j = 0 M M 1 cos φ i + φ i + 1 2 + Δ · cos φ i + φ i + 1 2 + Δ > 0 · cos 2 θ j + θ j + 1 2
The direct irradiance was expressed using Equation (22):
D I s i d e = D D · D N I · cos η · cos φ i α Φ + Δ · cos φ i α Φ + Δ > 0
The reflected irradiance from the shaded object R I s i d e was calculated using Equation (23):
R I s i d e = R v ·   i = 0 N N 1 j = 0 M M 1 1 E i , j · S I s i d e + 180 ° + R D i , j · cos φ i + φ i + 1 2 + 180 ° + Δ · cos φ i + φ i + 1 2 + 180 ° + Δ > 0 · cos 2 θ j + θ j + 1 2 i = 0 N N 1 j = 0 M M 1 cos φ i + φ i + 1 2 + 180 ° + Δ · cos φ i + φ i + 1 2 + 180 ° + Δ > 0 · cos 2 θ j + θ j + 1 2
where the suffix “side” referred to one of the four sides of the car (front, right, back, or left) and suffix “side + 180°” referred to the opposite side. For the front side, the opposite side was the backside.
The reflected irradiance from the street surface was expressed in Equation (24):
R I S s i d e = R s · I z 2 ,
where R s was the reflectance of the street surface to the vertical plane (=0.08).

3. Results

3.1. Shading Probability Distribution

The shading probability is a function of the grazing angle of the shading objects. It is assumed that the VIPV orientation is random and that these are installed only on the roofs of the vehicles. The probability distribution can be estimated by considering the mean of the rows of the elements of the aperture matrix E (Figure 7). Because the distribution of shaded objects is not axially symmetrical along the street (along the x-direction), the distribution curve varies in the x- and y-directions (Figure 7).
The distribution function is defined using Equation (25):
F x = 1 1 1 + e x p x μ s s
where F x is the shading probability, x is the grazing angle from the vehicle roof, μ s is the mean shading height (grazing angle that provides a shading probability of 50%), and s causes the curve to vary.
The results are summarized in Figure 8. Regardless of the shading environment, the shading probability is approximated using Equation (25), which is the accumulated logistic curve. However, the curve shape varies in the x- and y-directions because buildings, houses, and trees are distributed along the street.

3.2. Model Validation by Measurements

The solar irradiance on the five orthogonal orientations is measured and compared with the calculation results of Equations (2)–(24). The validation results are shown in Figure 9, Figure 10 and Figure 11. Figure 9 presents a representative chart of the comparison. Figure 10 compares the types of bar charts shown in Figure 9 for various shading environments and vehicle orientations. Figure 11 compares the measured and calculated values when distributed along the 45° line.
The image of the sun in the fisheye photographs in Figure 10 indicates that various orientations of the car perform the measurements and that the conversion to the local coordinate system is effective. In addition, regardless of the shading environment, the measured and calculated solar irradiances in each plane match well. These are distributed along the 45° line in Figure 11.

4. Discussion

4.1. Categorizing the Shading Environment

The energy rating of the VIPV (which is affected substantially by the shading environment) categorizes the zones where the vehicle parks and runs are effective. The shading probability is derived from Equation (25) using the parameters μ s and s . The sky view factor (SVF) is a standard parameter for characterizing the shading of the hemispherical sky. It is effective to allocate the representative values of μ s and s as functions of SVF.
Figure 12 compares μ s and the SVF, and Figure 13 compares s and SVF. As expected, μ s has a high correlation with the SVF, although the slope varies across orientations (between the front–rear and left–right directions). In contrast, the impact of s on the SVF is independent of the SVF. This is likely because the height variance of the shaded objects is independent of the orientation relative to the street.
Table 2 lists the values of μ s and s in three given categories of the surrounding environment, namely building, residential, and open zones (with representative SVFs of 0.55, 0.75, and 0.95, respectively). Typical sky images (fisheye cameras) of the three zones are shown in Figure 14. The probability functions of the three zones are plotted in Figure 15.

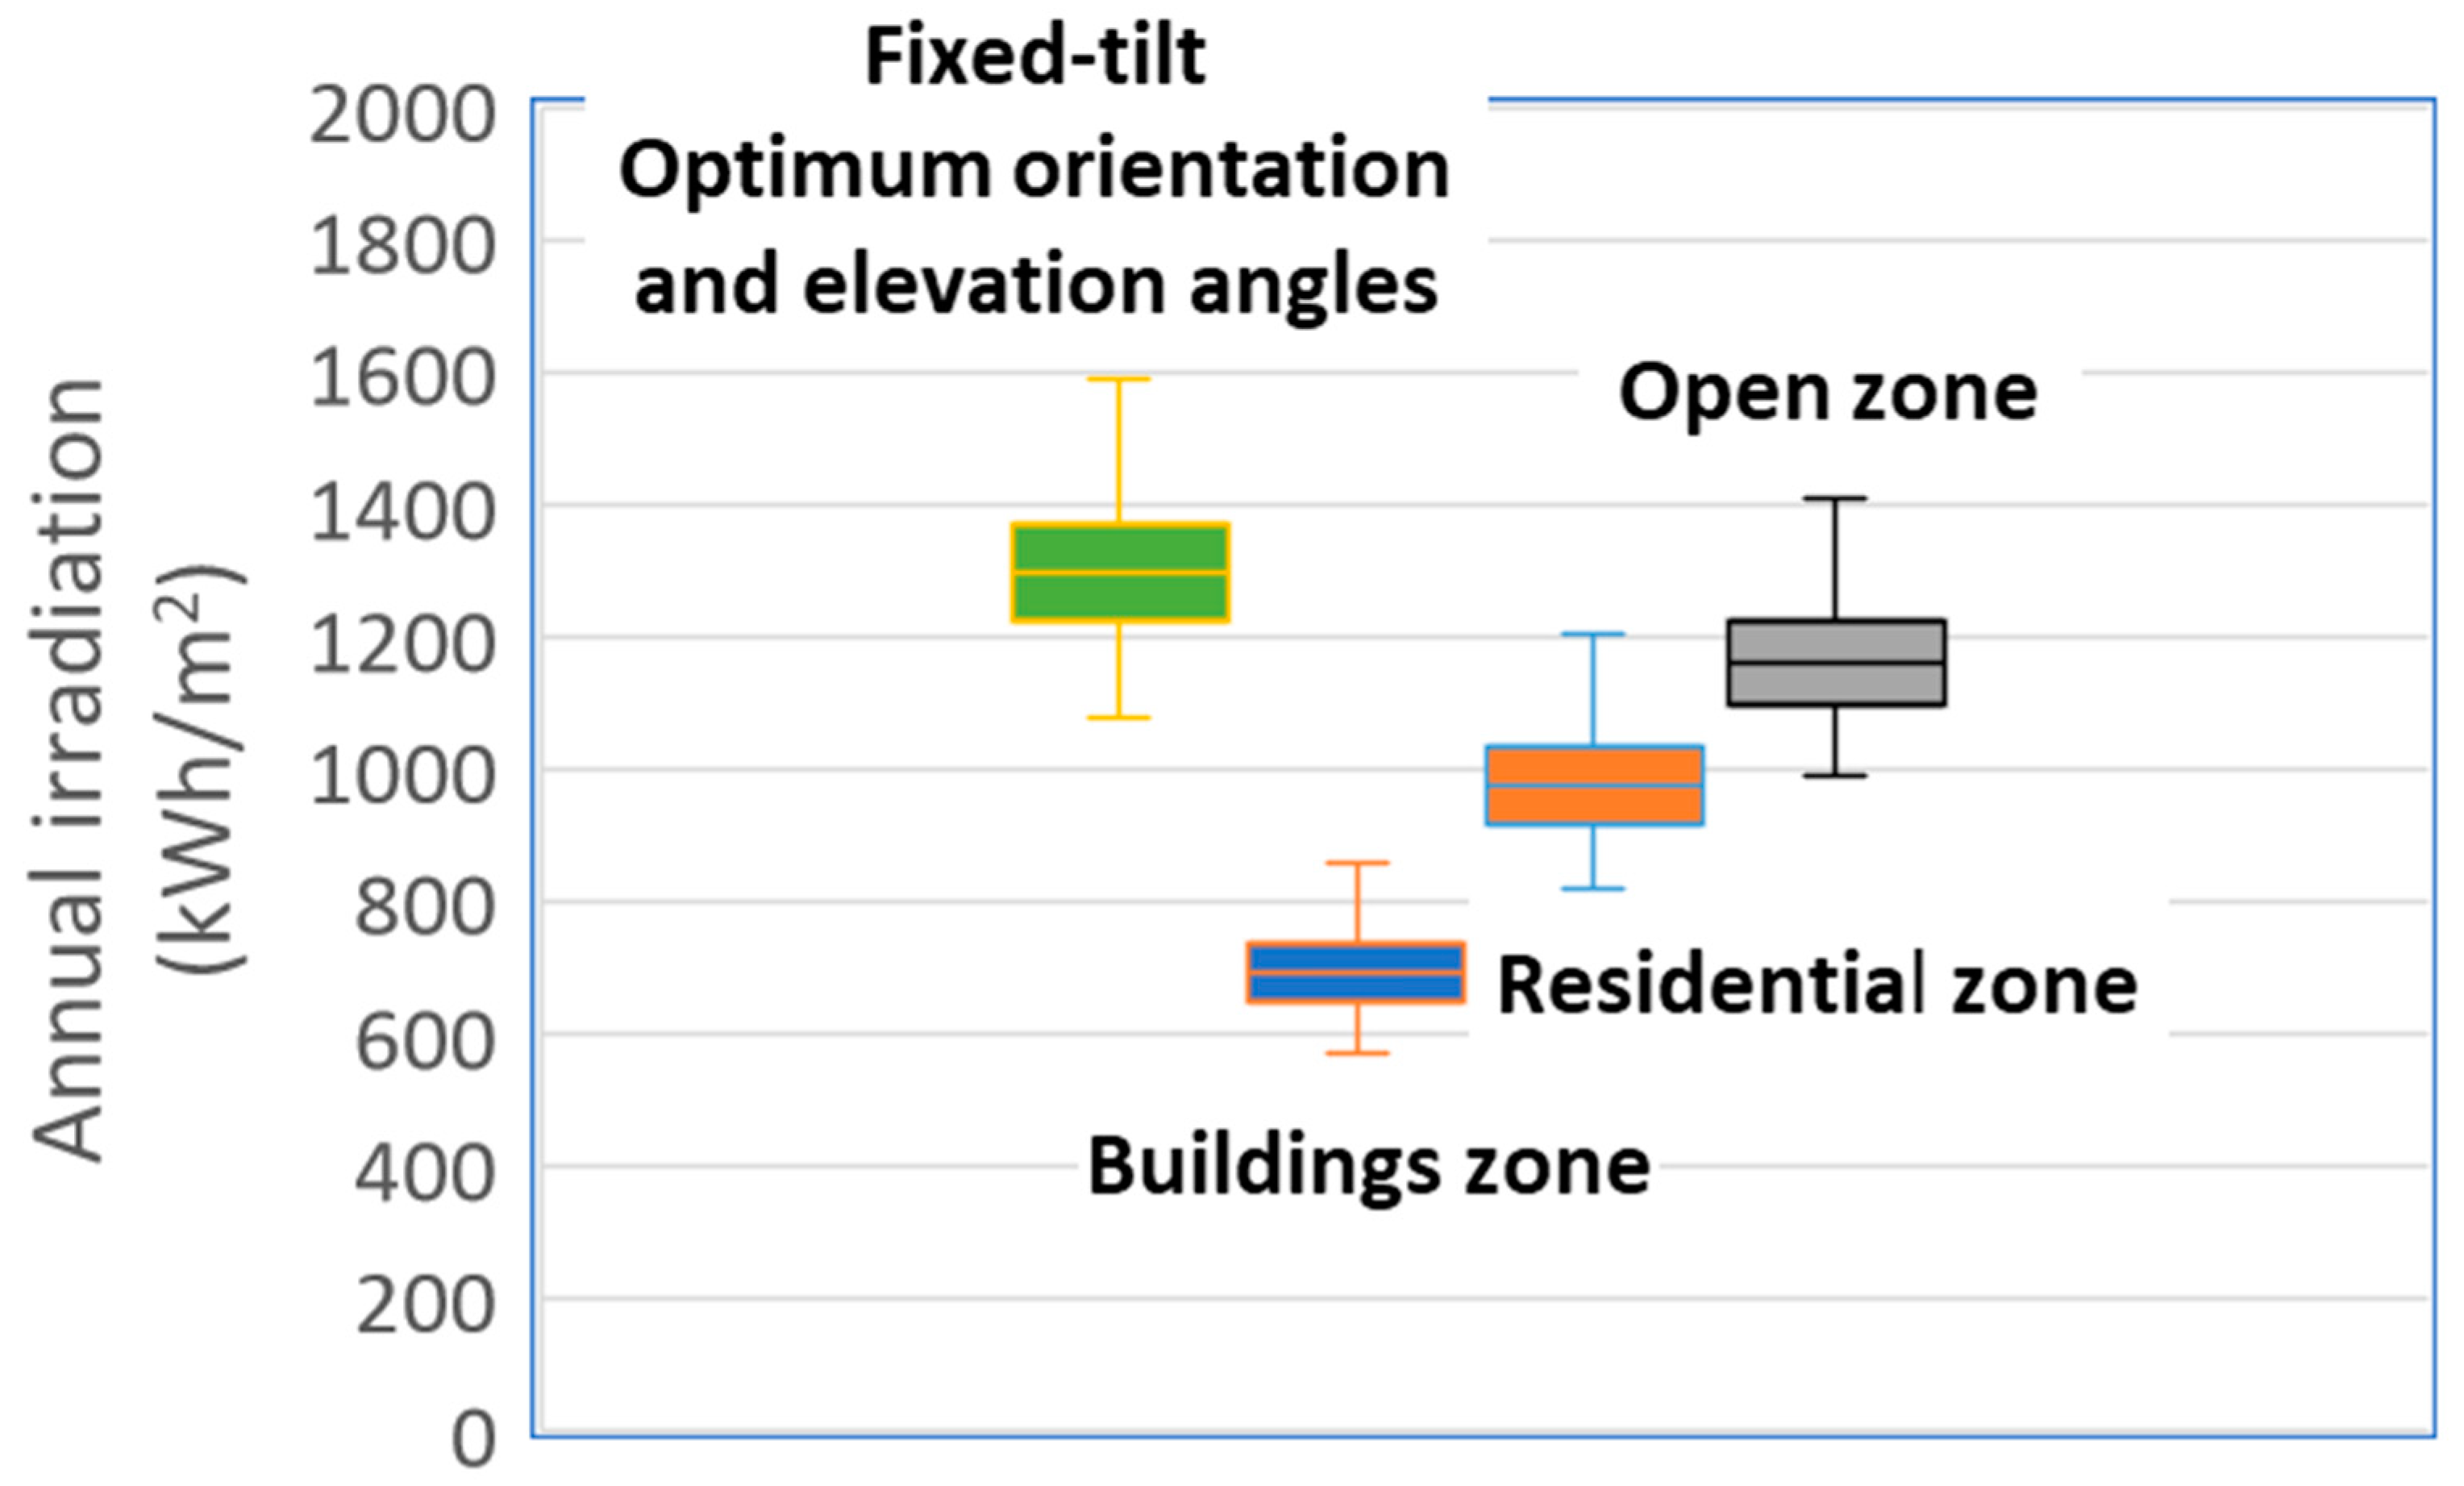
4.2. Estimation of Annual Solar Irradiance Using Shading Probability Distribution

The solar irradiation can be calculated using shading probability as follows:
S I z = S H I · S V F
D I z = D N I · sin θ · 1 F x θ + F y θ 2
R I z = S I x + S I y + D I x + D I y 2 · R v · 1 S V F
where I z is the irradiance on the vehicle roof, S I z is the diffused irradiance on the vehicle roof, S I x is the diffused irradiance on the vehicle’s front–rear sides, S I y is the diffused irradiance on the vehicle’s left–right side, D I z is the direct irradiance on the vehicle roof, θ is the height of the sun, D I x is the direct irradiance on the vehicle’s front–rear sides, D I y is the direct irradiance on the left–right side of the vehicle, R I z is the reflected irradiance on the vehicle roof, F x θ is the shading probability in the front–rear direction, F y θ is the shading probability in the left–right direction, and R v is the reflectance of the vertical structure (generally 0.25).
The vehicle orientation is assumed to be random (uniform distribution from 0° to 360°). S I x + S I y + D I x + D I y are calculated using Equations (31) and (32).
The side irradiances for the left and right sides can be calculated using Equation (30). Furthermore, the irradiance for the other sides (front–back sides) can be calculated using Equation (30) by replacing the subscript x with y:
I x = S I x + D I x + R I x + R I s
I y = S I y + D I y + R I y + R I s
S I x = S H I · 0 ° 90 ° 1 F x θ · cos 2 θ d θ 90 °
D I x = D N I · cos θ · 1 F x θ 4
R I x = R v · S I x + D I x 360 ° · 0 ° 90 ° F x θ · cos 2 θ d θ
S I y = S H I · 0 ° 90 ° 1 F y θ · cos 2 θ d θ 90 °
D I y = D N I · cos θ · 1 F y θ 4
R I y = R v · S I y + D I y 360 ° · 0 ° 90 ° F y θ · cos 2 θ d θ
R I s = R s · I z 2
where I x is the irradiance on the left–right side of the vehicle, S I x is the diffused irradiance on the left–right side of the vehicle, D I x is the direct irradiance on the left–right side of the vehicle, R I x . is the irradiance reflected by the surrounding structures on the front side of the vehicle, R s is the reflectance of the horizontal structures (roads) (generally 0.08), and R I s is the irradiance reflected by the surrounding horizontal structures (roads).
The calculation of solar irradiance on a car roof (Equations (26)–(37)) is applied to the entire area of Japan using the METPV-11 solar database [54,55] considering the driving zone category (Figure 15). The calculation addresses 830 sites ranging from the subpolar zone to the subtropical zone (N45° to N24° latitude). Unlike the standard installation of solar panels, which are less affected by the shading environment, the energy yield of a VIPV varies mainly according to the zone (building, residential, and open zones) instead of the climate zone or latitude (Figure 16).

5. Conclusions

The standard installation of solar panels prevents shading. The energy yield can be predicted without considering the non-uniform distribution of shading objects. However, VIPVs and BIPVs are generally shaded by surrounding objects, and their distribution is non-uniform. A 3D model using an aperture (shading matrix) is effective in such cases.
This study presented a measurement and calculation method for the shading matrix and validated the calculated solar irradiance for the measurement. It was also extended to solar panels for mobility, such as VIPVs.
The energy yield of a VIPV was examined in the three zones of the shading environment. Unlike the standard installation of solar panels, which are less affected by the shading environment, the solar resource of a VIPV varied mainly according to the shading environment instead of the climate zone or latitude.

Author Contributions

Methodology, K.A. and Y.O.; data curation, K.A.; validation, Y.O.; formal analysis, K.A.; investigation, Y.O.; conceptualization, K.A. and Y.O.; software, K.A.; visualization, K.A.; writing—original draft preparation, K.A.; writing—review and editing, K.A. and A.N.; resources, K.N.; supervision, K.N.; project administration, K.N.; funding acquisition, K.N. All authors have read and agreed to the published version of the manuscript.

Funding

This presentation is based on results obtained from the JPNP20015 project commissioned by the New Energy and Industrial Technology Development Organization (NEDO).

Data Availability Statement

Data will be made available on request.

Acknowledgments

We thank the members of the IEC TC82 experts (specifically members of the WG2 and PT600 groups and PVTEC) for the technical discussions.

Conflicts of Interest

The authors declare no conflict of interest.

Abbreviations

2Dtwo-dimensional
3Dthree-dimensional
BEVbattery electric vehicle
BIPVbuilding-integrated photovoltaics
DCdirect current
DNIdirect normal irradiance
ECUelectronic control unit
EVelectric vehicle
GHIglobal horizonal irradiance
GPSglobal positioning system
IECInternational Electrotechnical Commission
I-Vcurrent-voltage
MPPTmaximum power point tracking
PVphotovoltaic
RGBred-green-blue
SEVsolar electric vehicle
Sisilicon
SVFsky view factor
VIPVvehicle-integrated photovoltaics

References

  1. Thiel, C.; Amillo, A.G.; Tansini, A.; Tsakalidis, A.; Fontaras, G.; Dunlop, E.; Taylor, N.; Jäger-Waldau, A.; Araki, K.; Nishioka, K.; et al. Impact of climatic conditions on prospects for integrated photovoltaics in electric vehicle. Renew. Sustain. Energy Rev. 2022, 158, 112109. [Google Scholar] [CrossRef]
  2. Araki, K.; Ji, L.; Kelly, G.; Yamaguchi, M. To Do List for Research and Development and International Standardization to Achieve the Goal of Running a Majority of Electric Vehicles on Solar Energy. Coatings 2018, 8, 251. [Google Scholar] [CrossRef] [Green Version]
  3. Muntwyler, U. Towards 100% renewable energy supplies. In Proceedings of the 2015 Tenth International Conference on Ecological Vehicles and Renewable Energies (EVER), Monte Carlo, Monaco, 31 March–2 April 2015; pp. 1–8. [Google Scholar] [CrossRef]
  4. Masuda, T.; Araki, K.; Okumura, K.; Urabe, S.; Kudo, Y.; Kimura, K.; Nakado, T.; Sato, A.; Yamaguchi, M. Static concentrator photovoltaics for automotive applications. Sol. Energy 2017, 146, 523–531. [Google Scholar] [CrossRef]
  5. NEDO. Interim Report of the Exploratory Committee on the Automobile Using Photovoltaic System. Available online: http://www.nedo.go.jp/news/press/AA5_100909.html (accessed on 9 May 2018).
  6. Masuda, T.; Araki, K.; Okumura, K.; Urabe, S.; Kudo, Y.; Kimura, K.; Nakado, T.; Sato, A.; Yamaguchi, M. Next environment-friendly cars: Application of solar power as automobile energy source. In Proceedings of the IEEE 43rd Photovoltaic Specialists Conference (PVSC), Portland, OR, USA, 5–10 June 2016. [Google Scholar] [CrossRef]
  7. Araki, K.; Sato, D.; Masuda, T.; Lee, K.-H.; Yamada, N.; Yamaguchi, M. Why and how does car-roof PV create 50 GW/year of new installations? Also, why is a static CPV suitable to this application? AIP Conf. Proc. 2019, 2149, 050003. [Google Scholar] [CrossRef]
  8. Stutzmann, M. Role of mechanical stress in the light-induced degradation of hydrogenated amorphous silicon. Appl. Phys. Lett. 1985, 47, 21–23. [Google Scholar] [CrossRef]
  9. Moeini, I.; Ahmadpour, M.; Mosavi, A.; Alharbi, N.; Gorji, N.E. Modeling the time-dependent characteristics of perovskite solar cells. Sol. Energy 2018, 170, 969–973. [Google Scholar] [CrossRef]
  10. Lindroos, J.; Savin, H. Review of light-induced degradation in crystalline silicon solar cells. Sol. Energy Mater. Sol. Cells 2016, 147, 115–126. [Google Scholar] [CrossRef]
  11. Meyer, E.L.; Van Dyk, E.E. Assessing the reliability and degradation of photovoltaic module performance parameters. IEEE Trans. Reliab. 2004, 53, 83–92. [Google Scholar] [CrossRef]
  12. Letendre, S.; Perez, R.; Herig, C. Vehicle integrated PV: A clean and secure fuel for hybrid electric vehicles. In Proceedings of the Solar Conference; American Solar Energy Society: Boulder, CO, USA; American Institute of Architects: Washington, DC, USA, 2003; pp. 201–206. [Google Scholar]
  13. De Pinto, S.; Lu, Q.; Camocardi, P.; Chatzikomis, C.; Sorniotti, A.; Ragonese, D.; Iuzzolino, G.; Perlo, P.; Lekakou, C. Electric vehicle driving range extension using photovoltaic panels. In Proceedings of the IEEE Vehicle Power and Propulsion Conference (VPPC), Hangzhou, China, 17–20 October 2016; IEEE: Piscataway, NJ, USA, 2016; pp. 1–6. [Google Scholar] [CrossRef] [Green Version]
  14. Kim, J.; Wang, Y.; Pedram, M.; Chang, N. Fast photovoltaic array reconfiguration for partial solar powered vehicles. In Proceedings of the International Symposium on Low Power Electronics and Design, La Jolla, CA, USA, 11–13 August 2014; pp. 357–362. [Google Scholar] [CrossRef]
  15. Alhammad, Y.A.; Al-Azzawi, W.F. Exploitation the waste energy in hybrid cars to improve the efficiency of solar cell panel as an auxiliary power supply. In Proceedings of the 10th International Symposium on Mechatronics and Its Applications (ISMA), Sharjah, United Arab Emirates, 8–10 December 2015; IEEE: Piscataway, NJ, USA, 2016; pp. 1–6. [Google Scholar] [CrossRef]
  16. The Ford Motor Company. Let the Sun In: Ford C-MAX Solar Energi Concept Goes Off the Grid, Gives Glimpse of Clean Vehicle Future. Available online: https://media.ford.com/content/fordmedia/fna/us/en/news/2014/01/02/let-the-sun-in--ford-c-max-solar-energi-concept-goes-off-the-gri.html (accessed on 9 May 2018).
  17. Automotive News, Next-Generation Toyota Prius Has Solar Roof for Europe, Japan. Available online: http://www.autonews.com/article/20160616/OEM05/160619900/next-generation-toyota-prius-has-solar-roof-for-europe-japan (accessed on 3 March 2023).
  18. Automotive News. Available online: http://www.autonews.com/article/20160811/OEM04/308119912/karma-targets-tesla-with-$115000-solar-boosted-hybrid (accessed on 3 March 2023).
  19. Hanergy Holding Group Ltd. Available online: https://www.autoevolution.com/news/china-s-hanergy-unveils-four-solar-powered-concept-cars-109094.html (accessed on 3 March 2023).
  20. Nissan Motor Corporation. Nissan Sustainability Report 2014. Available online: https://www.nissan-global.com/EN/SUSTAINABILITY/LIBRARY/SR/2014/ (accessed on 3 March 2023).
  21. Sierra, A.; Reinders, A. Designing innovative solutions for solar-powered electric mobility applications. Prog. Photovolt. Res. Appl. 2021, 29, 802–818. [Google Scholar] [CrossRef]
  22. Kanz, O.; Reinders, A.; May, J.; Ding, K. Environmental Impacts of Integrated Photovoltaic Modules in Light Utility Electric Vehicles. Energies 2020, 13, 5120. [Google Scholar] [CrossRef]
  23. Araki, K.; Ota, Y.; Maeda, A.; Kumano, M.; Nishioka, K. Solar Electric Vehicles as Energy Sources in Disaster Zones: Physical and Social Factors. Energies 2023, 16, 3580. [Google Scholar] [CrossRef]
  24. Kim, S.; Holz, M.; Park, S.; Yoon, Y.; Cho, E.; Yi, J. Future Options for Lightweight Photovoltaic Modules in Electrical Passenger Cars. Sustainability 2021, 13, 2532. [Google Scholar] [CrossRef]
  25. Macias, J.; Herrero, R.; Nunez, R.; Anton, I. On the effect of cell interconnection in Vehicle Integrated Photovoltaics: Modelling energy under different scenarios. In Proceedings of the 2021 IEEE 48th Photovoltaic Specialists Conference (PVSC), Fort Lauderdale, FL, USA, 20–25 June 2021. [Google Scholar] [CrossRef]
  26. Sagaria, S.; Duarte, G.; Neves, D.; Baptista, P. Photovoltaic integrated electric vehicles: Assessment of synergies between solar energy, vehicle types and usage patterns. J. Clean. Prod. 2022, 348, 131402. [Google Scholar] [CrossRef]
  27. Mallon, K.R.; Assadian, F.; Fu, B. Analysis of On-Board Photovoltaics for a Battery Electric Bus and Their Impact on Battery Lifespan. Energies 2017, 10, 943. [Google Scholar] [CrossRef] [Green Version]
  28. Conti, S.; Di Mauro, S.; Raciti, A.; Rizzo, S.A.; Susinni, G.; Musumeci, S.; Tenconi, A. Solar electric vehicles: State-of-the-art and perspectives. In Proceedings of the 2018 AEIT International Annual Conference, Bari, Italy, 3–5 October 2018; pp. 1–6. [Google Scholar] [CrossRef]
  29. Available online: https://metro.co.uk/2019/06/26/lightyear-one-solar-powered-electric-car-thatll-450-miles-10072219/ (accessed on 1 March 2023).
  30. Available online: https://sonomotors.com/ (accessed on 1 March 2023).
  31. Araki, K.; Ota, Y.; Yamaguchi, M. Measurement and Modeling of 3D Solar Irradiance for Vehicle-Integrated Photovoltaic. Appl. Sci. 2020, 10, 872. [Google Scholar] [CrossRef] [Green Version]
  32. Heinrich, M.; Kutter, C.; Basler, F.; Mittag, M.; Alanis, L.E.; Eberlein, D.; Schmid, A.; Reise, C.; Kroyer, T.; Neuhaus, D.H.; et al. Yield Potential of Vehicle Integrated Photovoltaics on Commercial Trucks and Vans. In Proceedings of the 37th European PV Solar Energy Conference and Exhibition, Online, 7–11 September 2020; Volume 7, pp. 1695–1700. [Google Scholar] [CrossRef]
  33. Abdelhamid, M.; Pilla, S.; Singh, R.; Haque, I.; Filipi, Z. A comprehensive optimized model for on-board solar photovoltaic system for plug-in electric vehicles: Energy and economic impacts: On-board solar photovoltaic system for plug-in electric vehicles. Int. J. Energy Res. 2016, 40, 1489–1508. [Google Scholar] [CrossRef]
  34. Ota, Y.; Araki, K.; Nagaoka, A.; Nishioka, K. Curve correction of vehicle-integrated photovoltaics using statistics on commercial car bodies. Prog. Photovolt. Res. Appl. 2022, 30, 152–163. [Google Scholar] [CrossRef]
  35. Tayagaki, T.; Araki, K.; Yamaguchi, M.; Sugaya, T. Impact of Nonplanar Panels on Photovoltaic Power Generation in the Case of Vehicles. IEEE J. Photovolt. 2019, 9, 1721–1726. [Google Scholar] [CrossRef]
  36. Ota, Y.; Araki, K.; Nagaoka, A.; Nishioka, K. Facilitating vehicle-integrated photovoltaics by considering the radius of curvature of the roof surface for solar cell coverage. Clean. Eng. Technol. 2022, 7, 100446. [Google Scholar] [CrossRef]
  37. Nagaoka, A.; Ota, Y.; Sakai, K.; Araki, K.; Matsuo, H.; Kadota, N.; Maeda, K.; Nakajima, A.; Nishioka, K. Performance evaluation and spectrum-based analysis of a wall-mounted photovoltaic system for zero-energy building. Renew. Energy 2021, 174, 147–156. [Google Scholar] [CrossRef]
  38. Ekins-Daukes, N.; Betts, T.R.; Kemmoku, Y.; Araki, K.; Lee, H.; Gottschalg, R.; Boreland, M.; Infield, D.; Yamaguchi, M. Syracuse—A multi-junction concentrator system computer model. In Proceedings of the Conference Record of the Thirty-First IEEE Photovoltaic Specialists Conference 2005, Lake Buena Vista, FL, USA, 3–7 January 2005; pp. 651–654. [Google Scholar] [CrossRef] [Green Version]
  39. Celik, B.; Karatepe, E.; Silvestre, S.; Gokmen, N.; Chouder, A. Analysis of Spatial Fixed PV Arrays Configurations to Maximize Energy Harvesting in BIPV Applications. Renew. Energy 2015, 75, 534–540. [Google Scholar] [CrossRef] [Green Version]
  40. Gurupira, T.; Rix, A.J. PV Simulation Software Comparisons: Pvsyst, Nrel Sam and Pvlib. In Proceedings of the 25th Southern African Universities Power Engineering Conference (SAUPEC 2017), Stellenbosch, South Africa, 30 January–1 February 2017; Available online: https://www.researchgate.net/publication/313249367_PV_SIMULATION_SOFTWARE_COMPARISONS_PVSYST_NREL_SAM_AND_PVLIB?enrichId=rgreq-e788d259e0b7f587850acc24621c272d-XXX&enrichSource=Y292ZXJQYWdlOzMxMzI0OTM2NztBUzo0NTc1OTY3NTE2MTgwNDhAMTQ4NjExMDk3NTM2Nw%3D%3D&el=1_x_2&_esc=publicationCoverPdf (accessed on 29 May 2023).
  41. Ahmed, R.; Sreeram, V.; Mishra, Y.; Arif, M.D. A Review and Evaluation of the State-of-the-Art in PV Solar Power Forecasting: Techniques and Optimization. Renew. Sustain. Energy Rev. 2020, 124, 109792. [Google Scholar] [CrossRef]
  42. Wang, F.; Xuan, Z.; Zhen, Z.; Li, K.; Wang, T.; Shi, M. A Day-Ahead PV Power Forecasting Method Based on LSTM-RNN Model and Time Correlation Modification under Partial Daily Pattern Prediction Framework. Energy Convers. Manag. 2020, 212, 112766. [Google Scholar] [CrossRef]
  43. Landelius, T.; Andersson, S.; Abrahamsson, R. Modelling and Forecasting PV Production in the Absence of Behind-the-Meter Measurements. Prog. Photovolt. Res. Appl. 2019, 27, 990–998. [Google Scholar] [CrossRef] [Green Version]
  44. Jakica, N.; Ynag, R.J.; Eisenlohr, J. BIPV Design and Performance Modelling: Tools and Methods; Report IEA-PVPS T15-09:2019; International Energy Agency: Paris, France, 2019; ISBN 9783906042862. Available online: http://iea-pvps.org/ (accessed on 29 May 2023).
  45. Dorman, M.; Erell, E.; Vulkan, A.; Kloog, I. Shadow: R Package for Geometric Shadow Calculations in an Urban Environment. R J. 2020, 11, 287. [Google Scholar] [CrossRef] [Green Version]
  46. De Sousa Freitas, J.; Cronemberger, J.; Soares, R.M.; Amorim, C.N.D. Modeling and Assessing BIPV Envelopes Using Parametric Rhinoceros Plugins Grasshopper and Ladybug. Renew. Energy 2020, 160, 1468–1479. [Google Scholar] [CrossRef]
  47. Polo, J.; Martín-Chivelet, N.; Sanz-Saiz, C. BIPV Modeling with Artificial Neural Networks: Towards a BIPV Digital Twin. Energies 2022, 15, 4173. [Google Scholar] [CrossRef]
  48. Behera, M.K.; Majumder, I.; Nayak, N. Solar Photovoltaic Power Forecasting Using Optimized Modified Extreme Learning Machine Technique. Eng. Sci. Technol. Int. J. 2018, 21, 428–438. [Google Scholar] [CrossRef]
  49. Zhang, Y.; Waibel, C.; Schlüter, A. Stochastic Solar Irradiance from Deep Generative Networks and their Application in BIPV Design. IOP Conf. Ser. Earth Environ. Sci. 2022, 1078, 012040. [Google Scholar] [CrossRef]
  50. Brito, M.; antos, T.; Moura, F.; Pera, D.; Rocha, J. Urban solar potential for vehicle integrated photovoltaics. Transp. Res. D Trans. Environ. 2021, 94, 102810. [Google Scholar] [CrossRef]
  51. Ota, Y.; Masuda, K.; Araki, K.; Yamaguchi, M. A mobile multipyranometer array for the assessment of solar irradiance incident on a photovoltaic-powered vehicle. Sol. Energy 2019, 184, 84–90. [Google Scholar] [CrossRef]
  52. von Hinüber, E. Inertial measuring systems with fibre-optic gyroscopes. ATZ Worldw. 2002, 104, 17–20. [Google Scholar] [CrossRef]
  53. Araki, K.; Ota, Y.; Nishioka, K.; Tobita, H.; Ji, L.; Kelly, G.; Yamaguchi, M. Toward the Standardization of the Car-roof PV–The challenge to the 3-D Sunshine Modeling and Rating of the 3-D Continuously Curved PV Panel. In Proceedings of the 2018 IEEE 7th World Conference on Photovoltaic Energy Conversion (WCPEC) (A Joint Conference of 45th IEEE PVSC, 28th PVSEC & 34th EU PVSEC), Waikoloa, HI, USA, 10–15 June 2018; pp. 0368–0373. [Google Scholar] [CrossRef]
  54. Itagaki, A.; Okumura, H.; Yamada, A. Preparation of meteorological data set throughout Japan for suitable design of PV systems Photovoltaic Energy Conversion. In Proceedings of the 3rd World Conference on Photovoltaic Energy Conversion, Osaka, Japan, 11–18 May 2003; pp. 11–18. [Google Scholar]
  55. Shirakawa, K.; Itagaki, A.; Utsunomiya, T. Preparation of hourly solar radiation data on inclined surface (METPV-11) throughout Japan. In Proceedings of the JSES/JWEA Joint Conference, Wakkanai, Japan, 21–22 September 2011. [Google Scholar]
Figure 1. Orientation angles around the vehicle (local and global orientation).
Energies 16 04414 g001
Figure 2. Local coordinate system around the car body for VIPVs [23].
Energies 16 04414 g002
Figure 3. Measurement system for 3D solar irradiance on five orientations by the local coordinate system [23].
Energies 16 04414 g003
Figure 4. Examples of favorable timings for capturing the fisheye images.
Energies 16 04414 g004
Figure 5. Image processing and 2D histogram [23].
Energies 16 04414 g005
Figure 6. Structure of the aperture matrix [23].
Energies 16 04414 g006
Figure 7. Accumulated logistic curve distribution of the shading objects; The blue line indicates the y-direction in Figure 2, and the orange line indicates the x-direction in Figure 2.
Energies 16 04414 g007
Figure 8. Examples of shading probability distributions; The blue line indicates the y-direction in Figure 2, and the orange line indicates the x-direction in Figure 2.
Energies 16 04414 g008
Figure 9. Bar chart comparing the measured and calculated solar irradiance on five orthogonal orientations with regard to global horizontal irradiance (GHI) without shading (stationary measurement on the roof of the building (eight floors)).
Energies 16 04414 g009
Figure 10. Comparison of the plot in Figure 9 in various shading environments and car orientations with regard to sky view factor (SVF).
Energies 16 04414 g010
Figure 11. Comparison between the measured and calculated values when distributed along the 45° line.
Energies 16 04414 g011
Figure 12. Comparison between μ s and SVF from the data points of Figure 8; The blue line indicates the x-direction in Figure 2, and the orange line indicates the y-direction in Figure 2.
Energies 16 04414 g012
Figure 13. Comparison between s and SVF from the data points of Figure 8.
Energies 16 04414 g013
Figure 14. Typical sky images (fisheye camera) of the three zones: (a) Open zone; (b) Residential zone; and (c) Building zone.
Energies 16 04414 g014
Figure 15. Shading probabilities of the three zones (open, residential, and building zones). The red and blue lines indicate the probability in the y-direction (front–rear direction) and x-direction (left–right direction), respectively [23].
Energies 16 04414 g015
Figure 16. Distribution of solar irradiance on car roofs in buildings zone, residential zone, and open zone.
Energies 16 04414 g016
Table 1. Conditions of pyranometers and their mounts.
Conditions
Pyranometer mountThe angular error should be at most 1°.
The pyranometers should be fixed tightly to the vehicle structure, with no vibration resonance during driving.
The absorber of pyranometers should capture the entire hemisphere and not be shaded by the vehicle body.
Pyranometer performanceThe time constant should be at most 5 s.
The temperature error should be at most ±5%/K.
Class B or better
Table 2. Parameter list of the shading probability function. Typical sky view factors (SVF) for the open, residential, and building zones are 0.95, 0.75, and 0.55, respectively.
CategoryOrientationSVF μ s s
Open zoneX0.952.8°1.2°
Y2.2°
Residential zoneX0.7524.0°7.9°
Y19.1°
Building zoneX0.5545.1°10.3°
Y36.0°
Disclaimer/Publisher’s Note: The statements, opinions and data contained in all publications are solely those of the individual author(s) and contributor(s) and not of MDPI and/or the editor(s). MDPI and/or the editor(s) disclaim responsibility for any injury to people or property resulting from any ideas, methods, instructions or products referred to in the content.

