Article

Study of Internal Flow Heat Transfer Characteristics of Ejection-Permeable FADS

1
School of Civil Engineering and Architecture, Wuhan University of Technology, Wuhan 430070, China
2
Hainan Institute, Wuhan University of Technology, No. 5 Chuangxin Road, Sanya 572024, China
3
CITIC General Institute of Architectural Design and Research CO., Ltd., Wuhan 430014, China
4
Faculty of Mechanical Engineering, Shahrood University of Technology, Shahrood 3619995161, Iran
*
Author to whom correspondence should be addressed.
Energies 2023, 16(11), 4377; https://doi.org/10.3390/en16114377
Submission received: 24 April 2023 / Revised: 20 May 2023 / Accepted: 24 May 2023 / Published: 28 May 2023

Abstract

:
A fabric air dispersion system (FADS) is a type of flexible air supply system that integrates air transmission and distribution. This innovative system has the potential to address common issues such as uneven air supply and surface condensation, which are often associated with traditional ventilation systems. Existing numerical simulation studies on fiber ducts have encountered problems with mesh generation and simulation accuracy. This work develops a simulation method based on the equivalent discounting method to overcome these challenges. The proposed method is utilized to investigate the flow and heat transfer characteristics inside fiber ducts while also examining the effects of various shapes and opening configurations. The findings indicate that the temperature rise inside the duct is positively correlated with flow rate, with higher temperatures resulting from faster flow speeds. The temperature rise of FADS with four rows of openings increased by 0.4 k compared to other opening methods. Additionally, the study shows that increasing the number of rows of openings in the fiber duct leads to a faster decay of flow velocity and a higher temperature rise. At the same time, increasing the number of openings in the duct slightly reduces flow velocity while slightly increasing the temperature rise. The presence of more fiber duct elbows leads to greater local resistance, which accelerates the decay of the flow velocity and increases the temperature rise. Compared to the “1”-shaped FADS, the temperature rises of the “L”-shaped and “U”-shaped systems have increased by 0.9 k and 2.9 k, respectively.

1. Introduction

As living standards rise, people are increasingly demanding comfortable interior environments, which has led to a rise in the use of air conditioning in a variety of settings [1]. While traditional air conditioning systems provide thermal comfort, they are associated with practical problems such as the accumulation of dust and dirt, susceptibility to moisture, corrosion and rust in metal ducts, and difficulties in cleaning [2]. Additionally, filters, air supply, and return air vents can, through accumulated dust, lead to secondary pollution of indoor air, deterioration of indoor air quality, and reduced productivity and well-being of occupants [3]. Due to the limitations of traditional air conditioning systems, a new air supply system called a Fabric Air Dispersion System (FADS) has been introduced. FADS is made of a special polyester fiber and comprises a set of air distribution and supply ducts. It offers numerous advantages, such as uniform air supply, no blowing sensation, quiet operation, anti-condensation properties, lightweight design, easy installation and disassembly, corrosion resistance, ease of transportation, simple cleaning and disinfection, and the ability to be dyed in various colors as desired. As a result, FADS has gained significant attention and is now widely used in a variety of settings, including large shopping malls, factories, stadiums, and theaters [4].
Research on FADS commenced in 2005, when Nielsen et al. [5] conducted experimental studies. These studies demonstrated that, for similar load conditions, the air-flow velocity of FADS was less than that of traditional air-conditioning systems using ceiling- and wall-mounted diffusers. As a result, FADS creates a smaller and more comfortable indoor temperature gradient. Chen et al. [6] conducted flow visualization experiments on FADS using dry ice and found that the air is discharged at a lower velocity in the direction perpendicular to the direction of the wall around FADS and is uniformly dispersed along the fiber axis. Wang et al. [7] studied the airflow organization of FADS through dry-ice visualization experiments and compared it with that of traditional air-supply systems. They developed a semi-empirical expression for calculating the jet deflection angle due to different jet velocities and, using dry ice, experimentally visualized the study of the flow field of FADS compared with those of rectangular nozzles, circular nozzles, and linear slit diffusers [8]. Leverette et al. [9] investigated the axial pressure and velocity variation inside FADS through theoretical calculations and found that using a skeleton inside and a hole in the duct surface would add additional drag. Huang et al. [10] conducted experimental studies on the airflow pressure and velocity distribution and opening airflow velocity distribution of FADS for large spaces with different air supply temperatures and air supply volumes.
Compared with experimental methods, Computer Fluid Dynamics (CFD) methods have several advantages, including low cost, rapid processing, the ability to obtain complete data, and the ability to simulate a variety of different operating conditions. Nielsen was the first to apply CFD techniques to FADS, numerically simulating the air quality, flow, and temperature fields in rooms with and without personalized ventilation. The study concluded that personalized ventilation based on FADS can improve air quality and avoid cross-contamination [11]. Fontanini et al. [12] conducted a comparative study using CFD to analyze FADS and traditional air conditioning systems’ transient simulations, and they found that FADS cools a room more quickly and more uniformly.
Previously, studies on FADS simulation models were oversimplified without taking into account the influence of fiber structural properties [13,14] on FADS’ air delivery characteristics. To address this issue, Chen et al. [15] proposed a porous media model and used FLUENT software to simulate the airflow characteristics of FADS. Their results agree well with the experimental results. They further proposed the mean velocity method [16] and the effective area method [17], which significantly reduced the demand for computational resources and improved the accuracy of the calculation. Through these methods, they simulated and investigated the effects of duct and outlet layout on the velocity and temperature fields of indoor airflow for pure infiltration mode FADS [18] and examined the effects of physical parameters such as equivalent diameter and fiber porosity on airflow characteristics [19] as well as the effects of jet infiltration FADS length on indoor airflow distribution [20]. Numerous researchers have also used these methods to simulate various types of FADS applied in offices [4], laboratories [21], cold storage rooms [22], and other settings. In addition to simulation methods, there is also the porous jump method [23], which Xing et al. [24] used to conduct a comparative numerical simulation study of the flow field inside a FADS made of two fabrics of different porosities. They found that FADS made of small-porosity fabrics can uniformly send fresh air to the environment outside the tube at low velocity, which is more effective than using FADS made of large-porosity fabrics.
The wall of the fiber duct is typically very thin, usually less than 0.5 mm, and the length and diameter of the duct are several orders of magnitude greater than the wall thickness. Therefore, generating a high-quality grid, including the wall grid, is difficult, especially if the surface of the duct has open slits or holes. The direct description method can increase the thickness of the fiber layer by one to two orders of magnitude, but this approach does not account for changes in thermal and flow resistance and results in low accuracy. The average flow velocity method and the effective area method have limitations and can only simulate the environment outside the FADS tube, not inside it [18]. The porous jump method requires a high-quality grid. If the FADS has a complex shape or open holes on the surface, the quality of the grid will be poor, resulting in discretized and unreliable computation results [24]. To address these issues, this work proposes a new method—the equivalent discounting method—that can simulate the environment both inside and outside the FADS tube while saving computational resources and improving the accuracy of the calculated results.
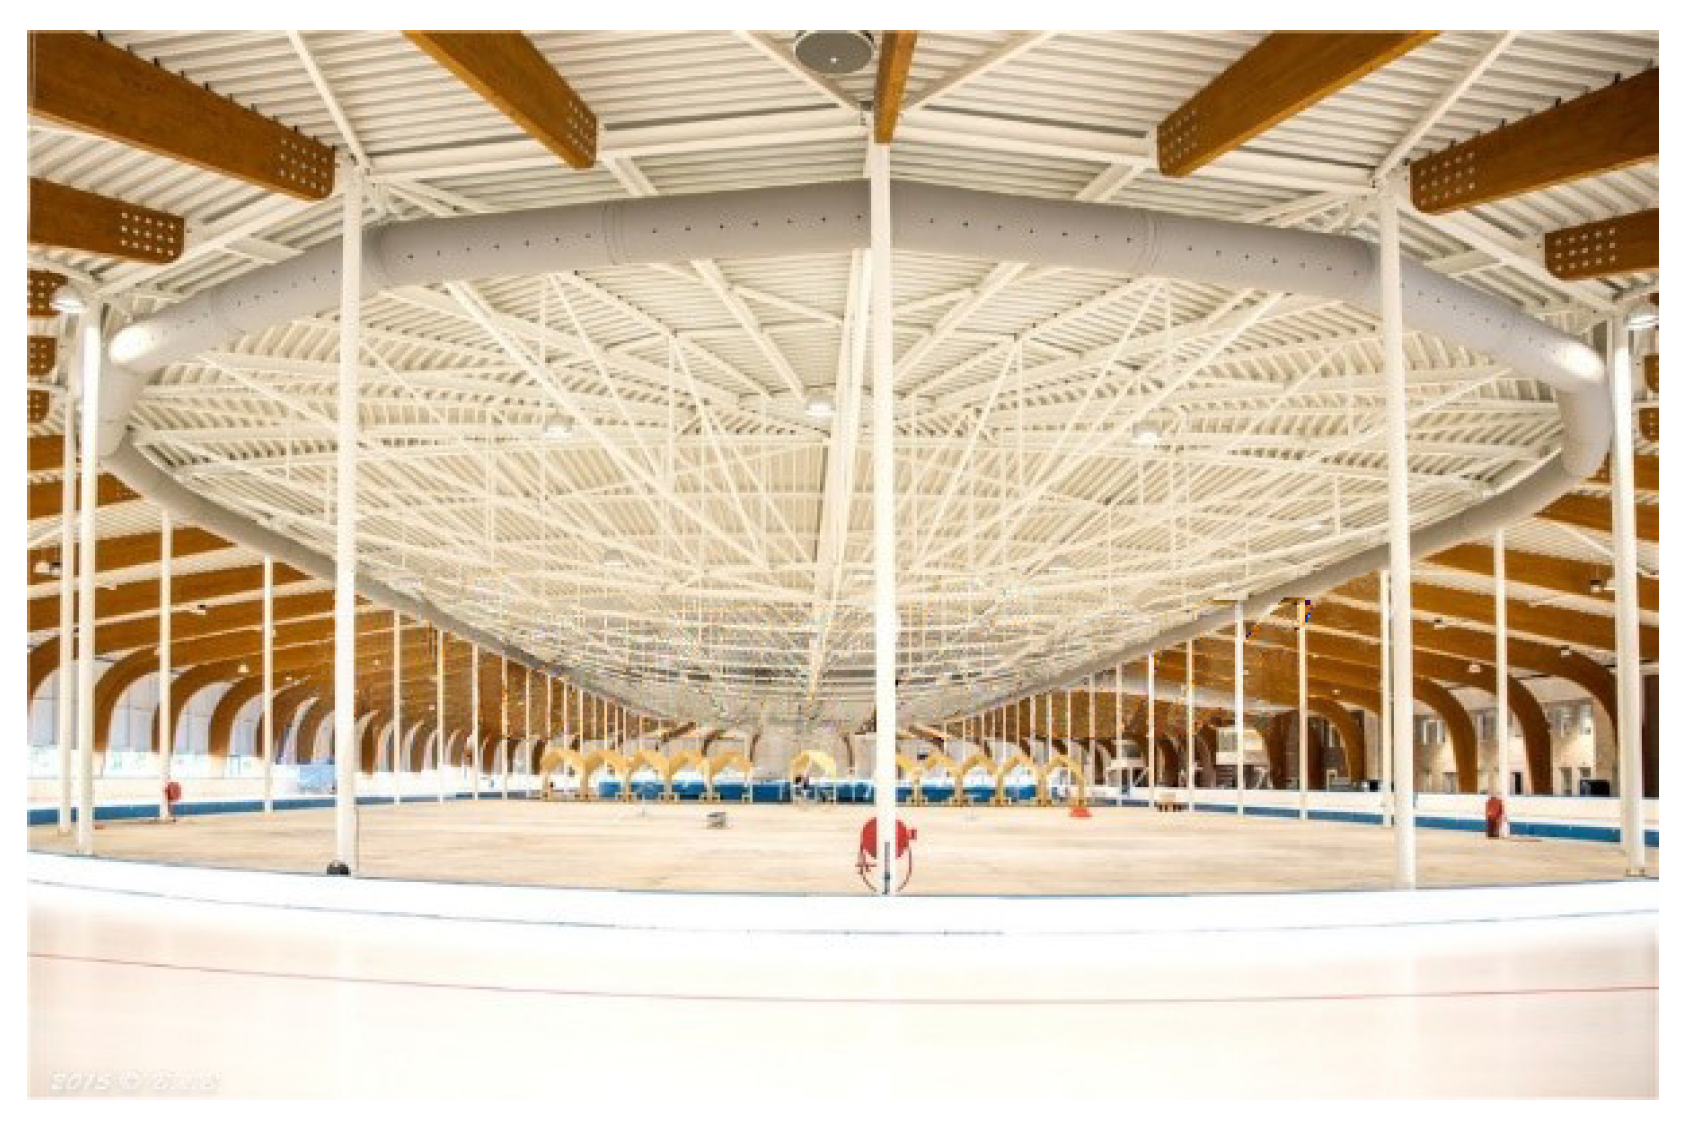
Recent studies of FADS by numerical simulation are limited to relatively short lengths, typically no more than 10 m. However, in large, tall spaces such as convention centers and factories, longer FADS measuring 15 m or more, and even up to 40 m, are often used. In the middle and back sections of long air ducts, heat transfer between the flowing air and the external environment can occur, which can significantly impact the indoor air-conditioning performance. Unfortunately, there is a scarcity of studies that have been conducted on FADS with such long ducts. Furthermore, although FADS are available in various shapes, as depicted in Figure 1 and Figure 2, most previous studies on FADS have only focused on linear designs, with little to no attention given to the commonly used non-linear designs.
In this study, the numerical simulation method of equivalent discounting was employed to investigate the performance of long FADS with various shapes and opening forms, addressing a gap in current research. The findings provide practical insights into the design of FADS systems with different shapes, sizes, and opening forms for various applications, thereby contributing to the development of this field of research.

2. Model Description

2.1. Mathematical Model

This study assumes steady-state, turbulent airflow with constant physical properties in an incompressible air system. The simulation employs the standard k ε model, and the governing equations are the continuity equation, momentum equation, energy equation, turbulent kinetic energy k equation, and dissipation rate ε equation. The Boussinesq hypothesis is utilized to account for the effect of density variation on buoyancy forces in natural convection. Specifically, the study focuses on the airflow in a 20 m long FADS, where a substantial temperature difference exists between the supply air and the ambient air. In this regard, the Boussinesq assumption is that physical properties remain constant, except for the buoyancy force term, with density differences proportional to temperature differences [25]:
ρ ρ = ρ β T T
where β is the volume expansion coefficient, and T is the reference temperature. Based on the above assumptions, the continuity equation, momentum equation, energy equation, turbulent kinetic energy k equation, and dissipation rate ε equation can be written as follows [20]:
Continuity equation:
U i x j = 0
Momentum equation:
U i t + ( U i U j ) x j = 1 ρ P x i + x i v e f f U i x j + U j x i + β T T g i
Energy equation:
ρ T t + T ρ u i x i = x i T x i ν t σ T + K c p
Turbulence kinetic energy equation:
ρ k t + ρ k u j x j = x j ρ + ν t σ k k x j + ν t U i x j U i x j + U j x i β g i ν t σ T T x j ρ ε
Dissipation rate equation:
ρ ε t + ρ ε u j x j = x j ν + ν t σ ε ε x j C 2 ε ρ ε 2 k + C 1 ε ε k ν t U i x j U i x j + U j x i
where U is the macroscopic flow velocity, P is the macroscopic pressure, ρ is the air density, v e f f is the effective viscosity coefficient, i and j denote the Cartesian coordinate directions, T is the temperature, c p is the specific heat capacity, K is the heat transfer coefficient of the fluid, k is the turbulent kinetic energy, ν is the dynamic viscosity,   ε is the turbulent dissipation rate, C 1 ε and C 2 ε are empirical values generally taken as 1.44 and 1.92, and σ k and σ ε are the turbulent Prandtl numbers corresponding to k and ε , and are 1.0 and 1.3, respectively.

2.2. Geometric Model

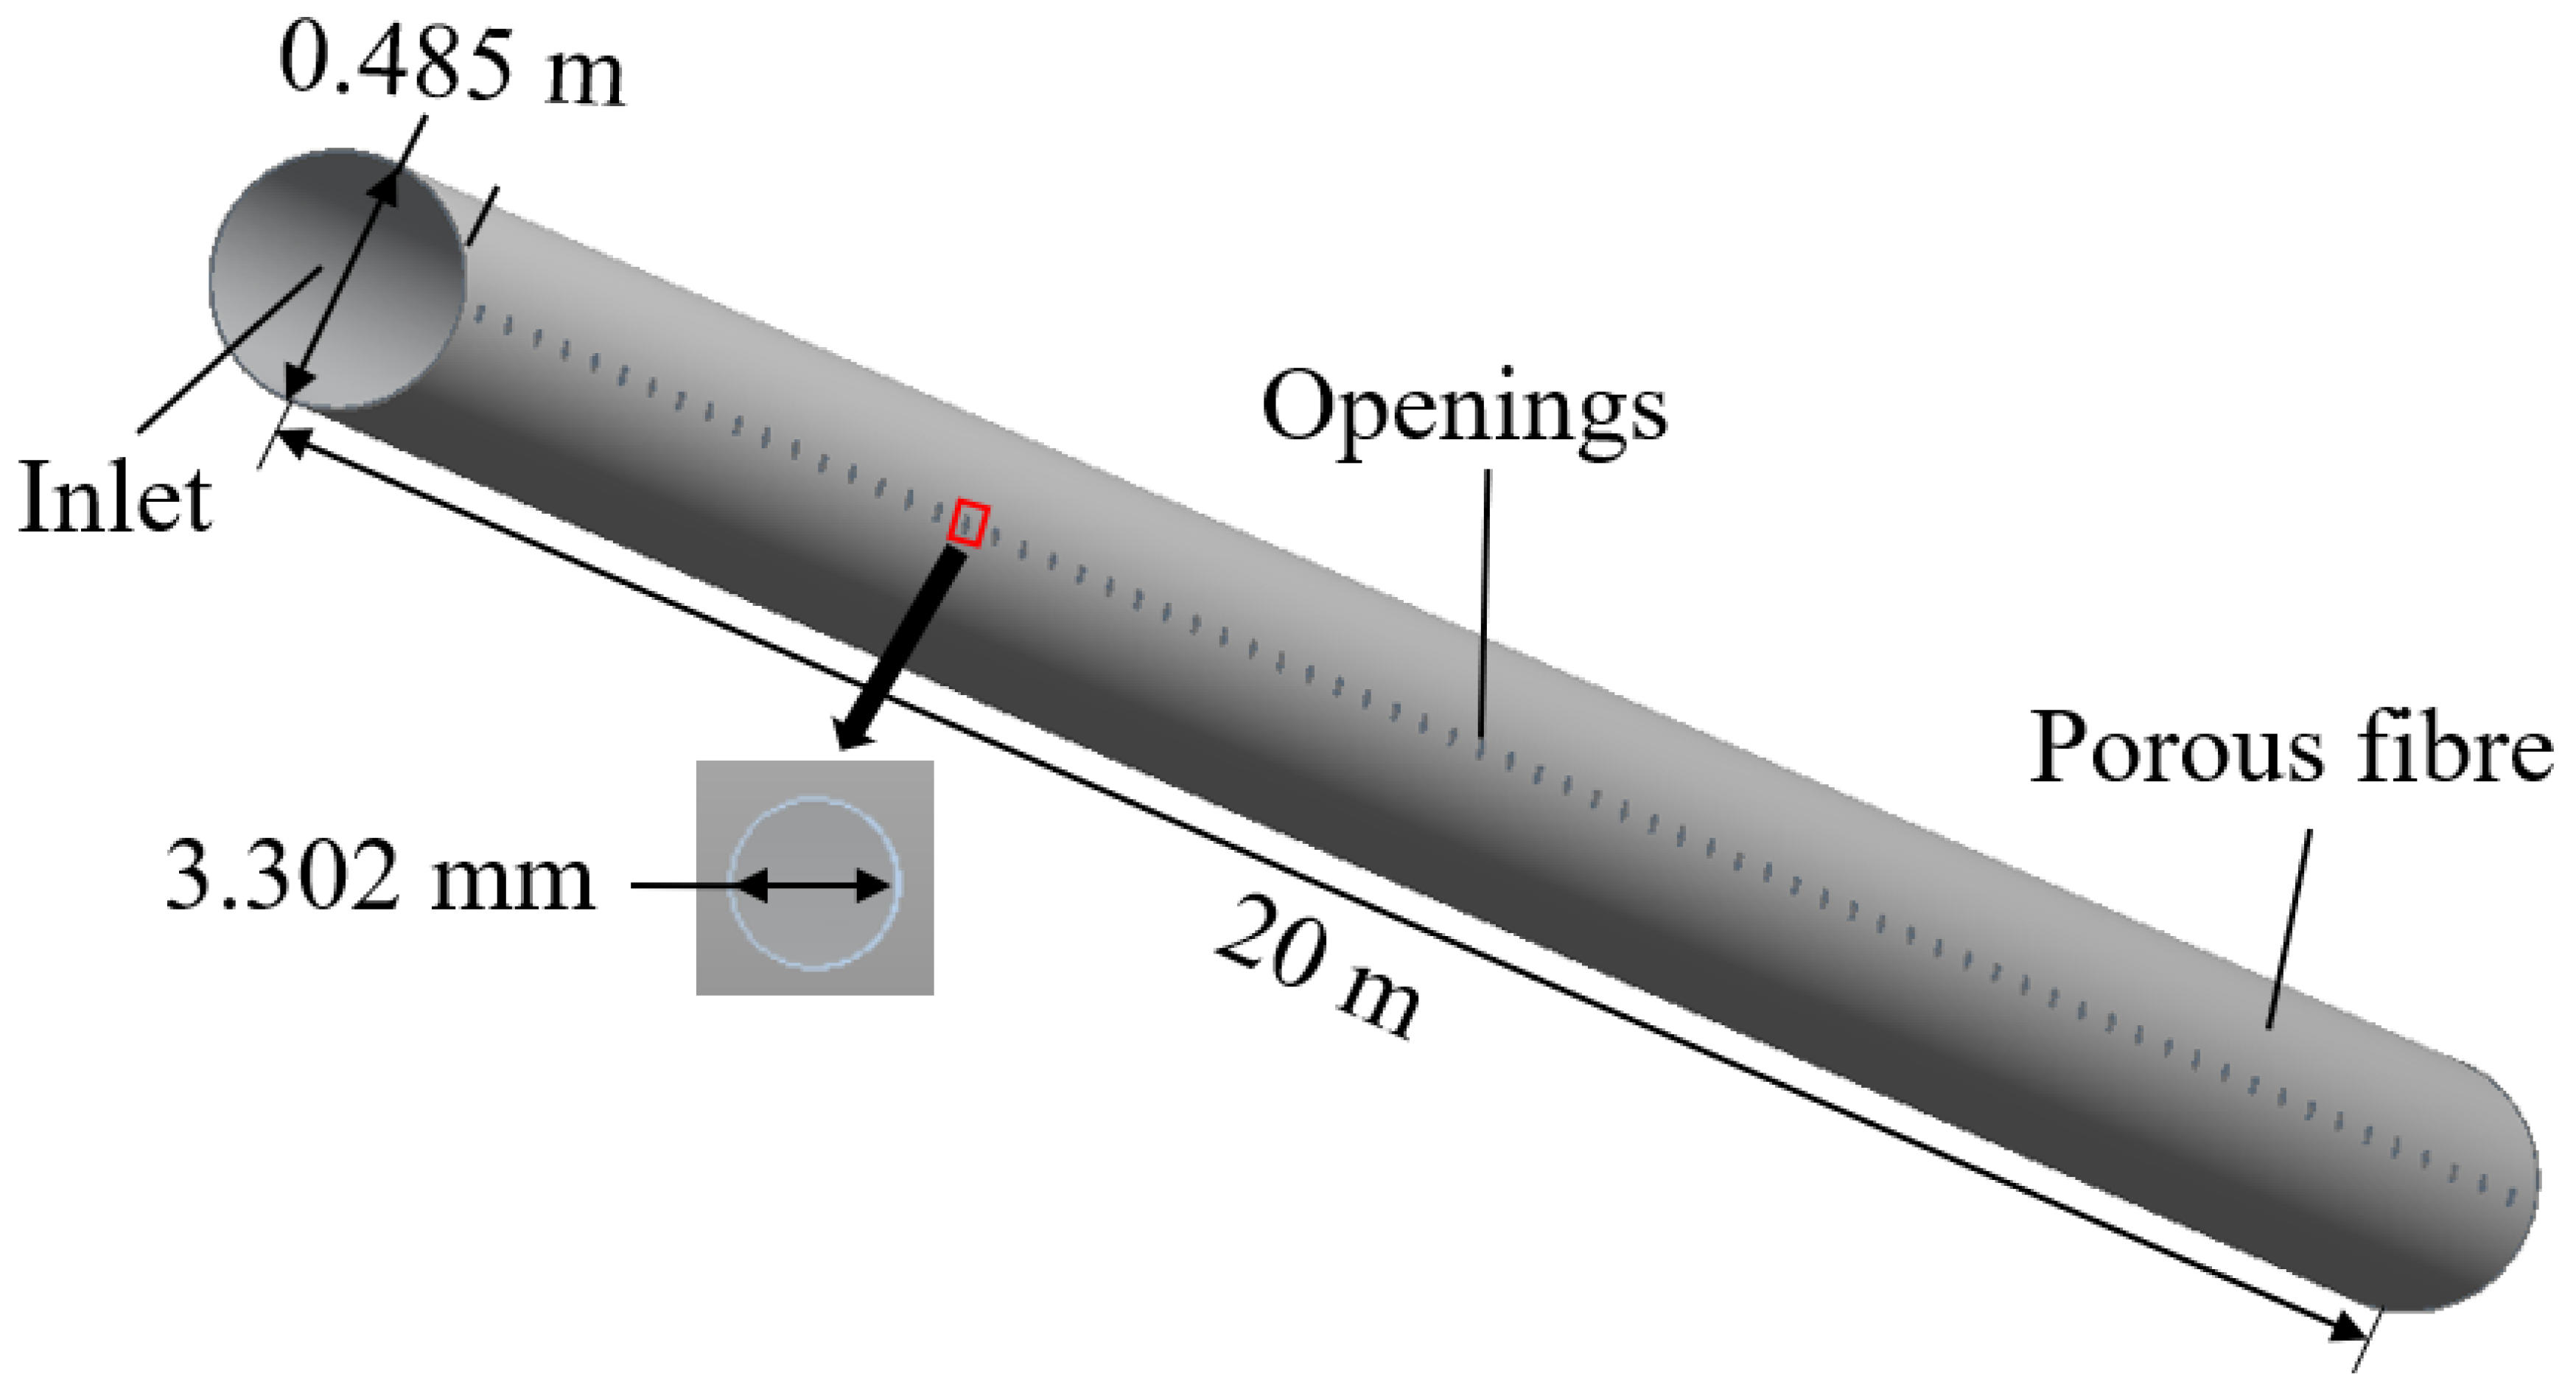
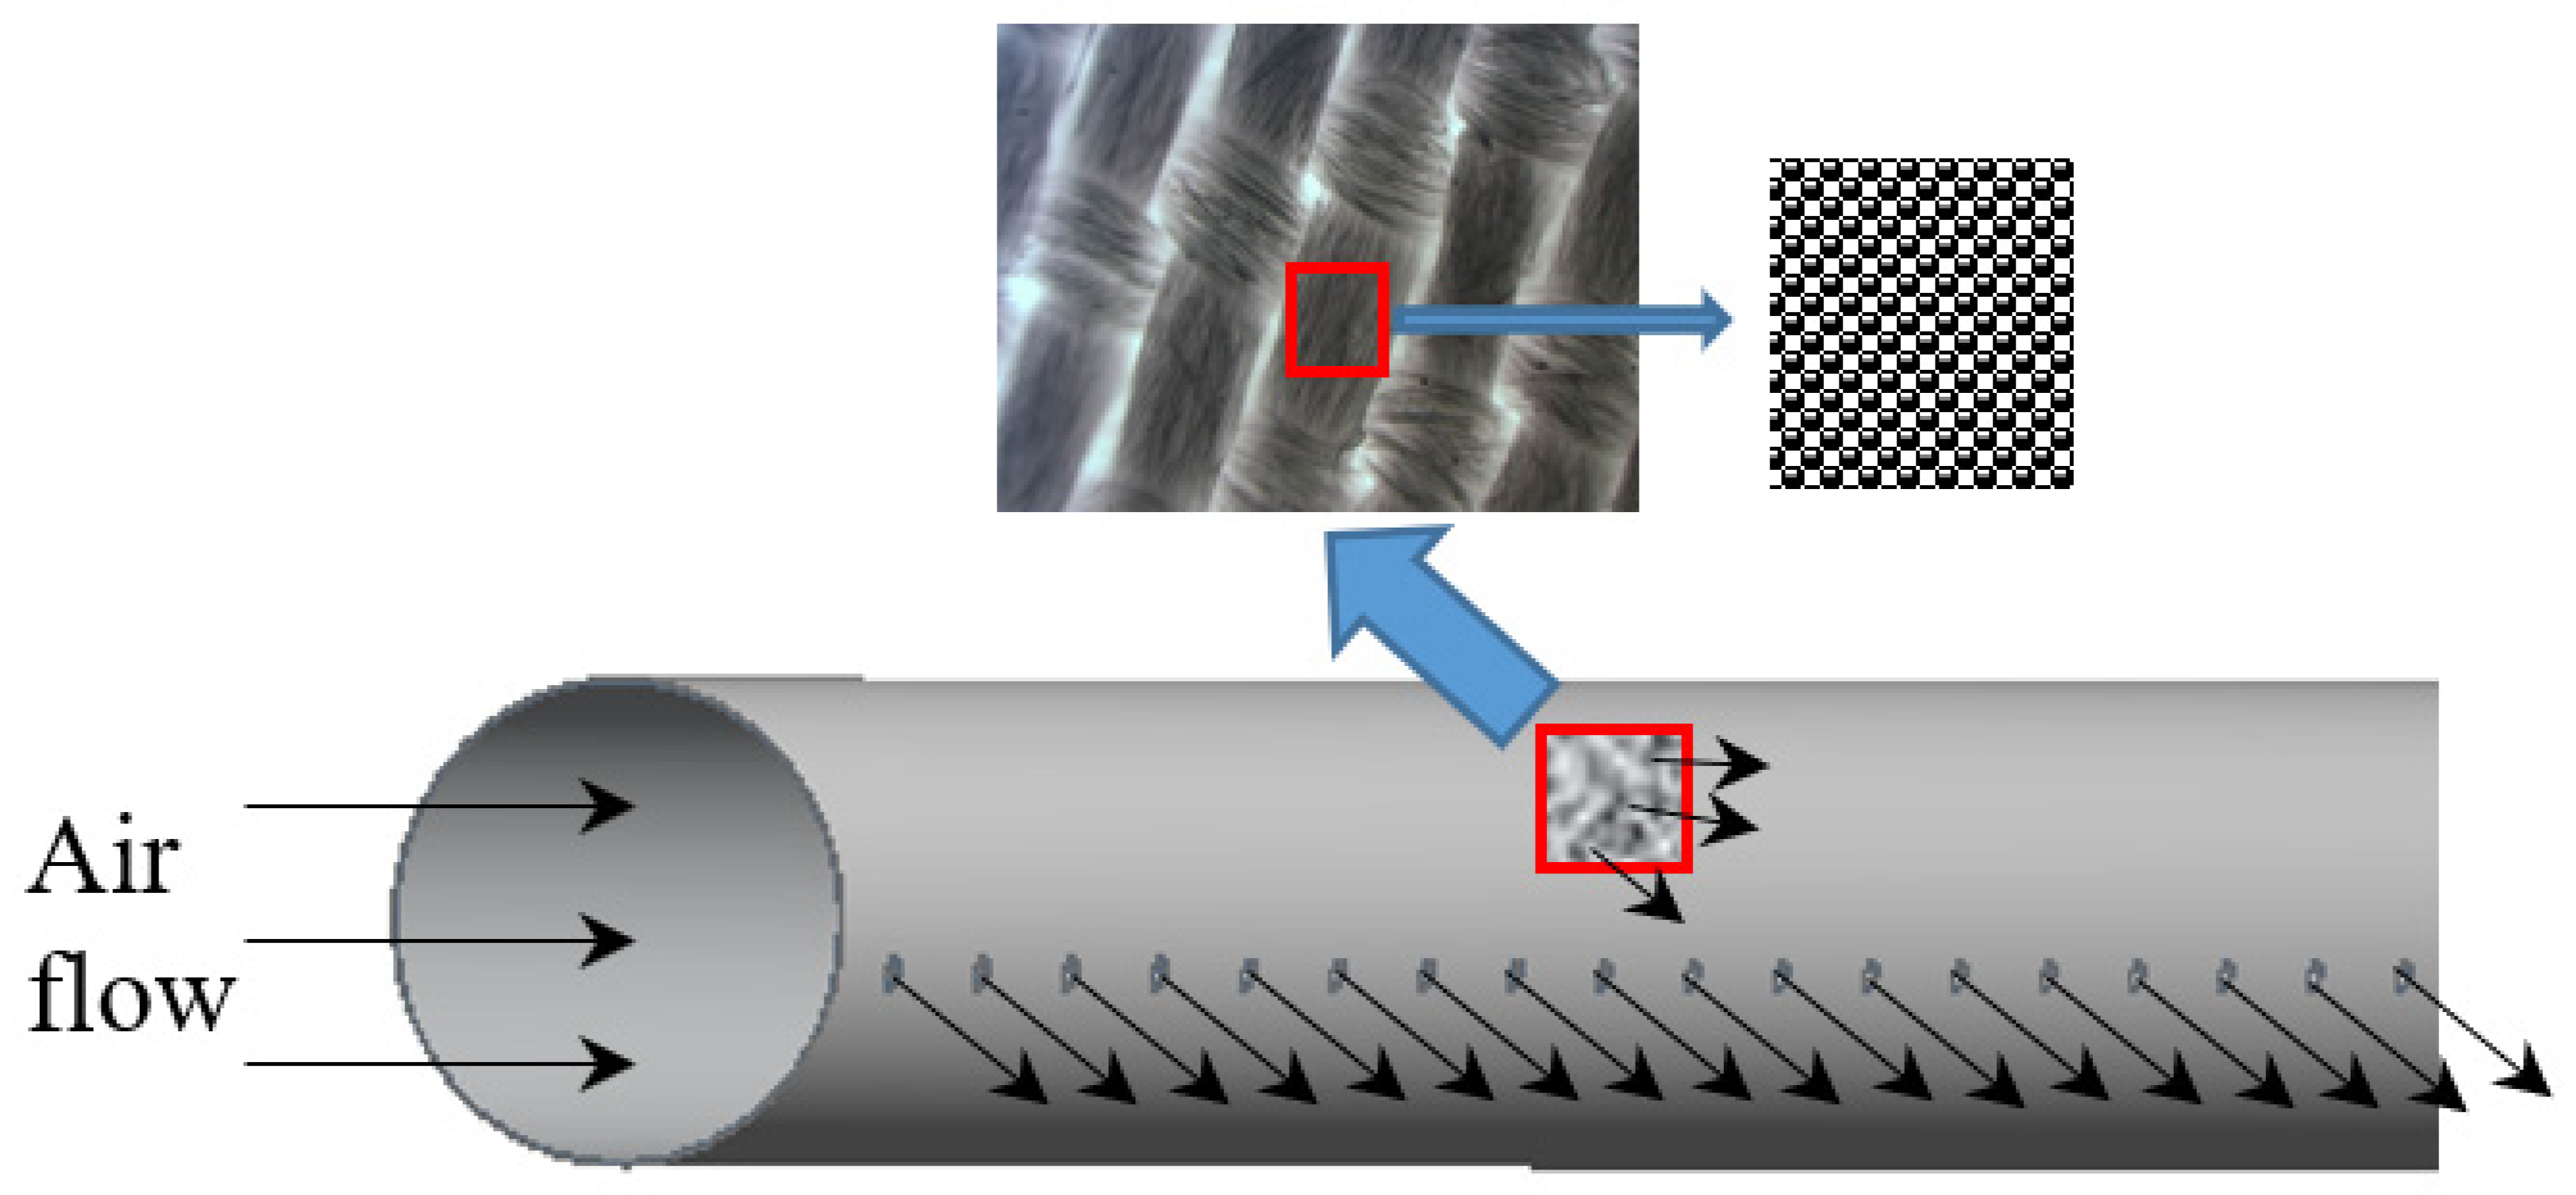
This study considers a fiber duct with 72 open holes, each with a diameter of 3.302 mm, spaced 0.276 m apart, a tube wall thickness of 0.2 mm, and an aperture ratio of 0.061. The air outlet is designed to be ejection permeable, with air flowing outward through the porous fiber pores and the openings. Figure 3 presents the physical model of the ejection-permeable FADS, which serves as the basis for the modified FADS models examined in this study.

2.3. Grid Division Method and Validation of Grid Independence

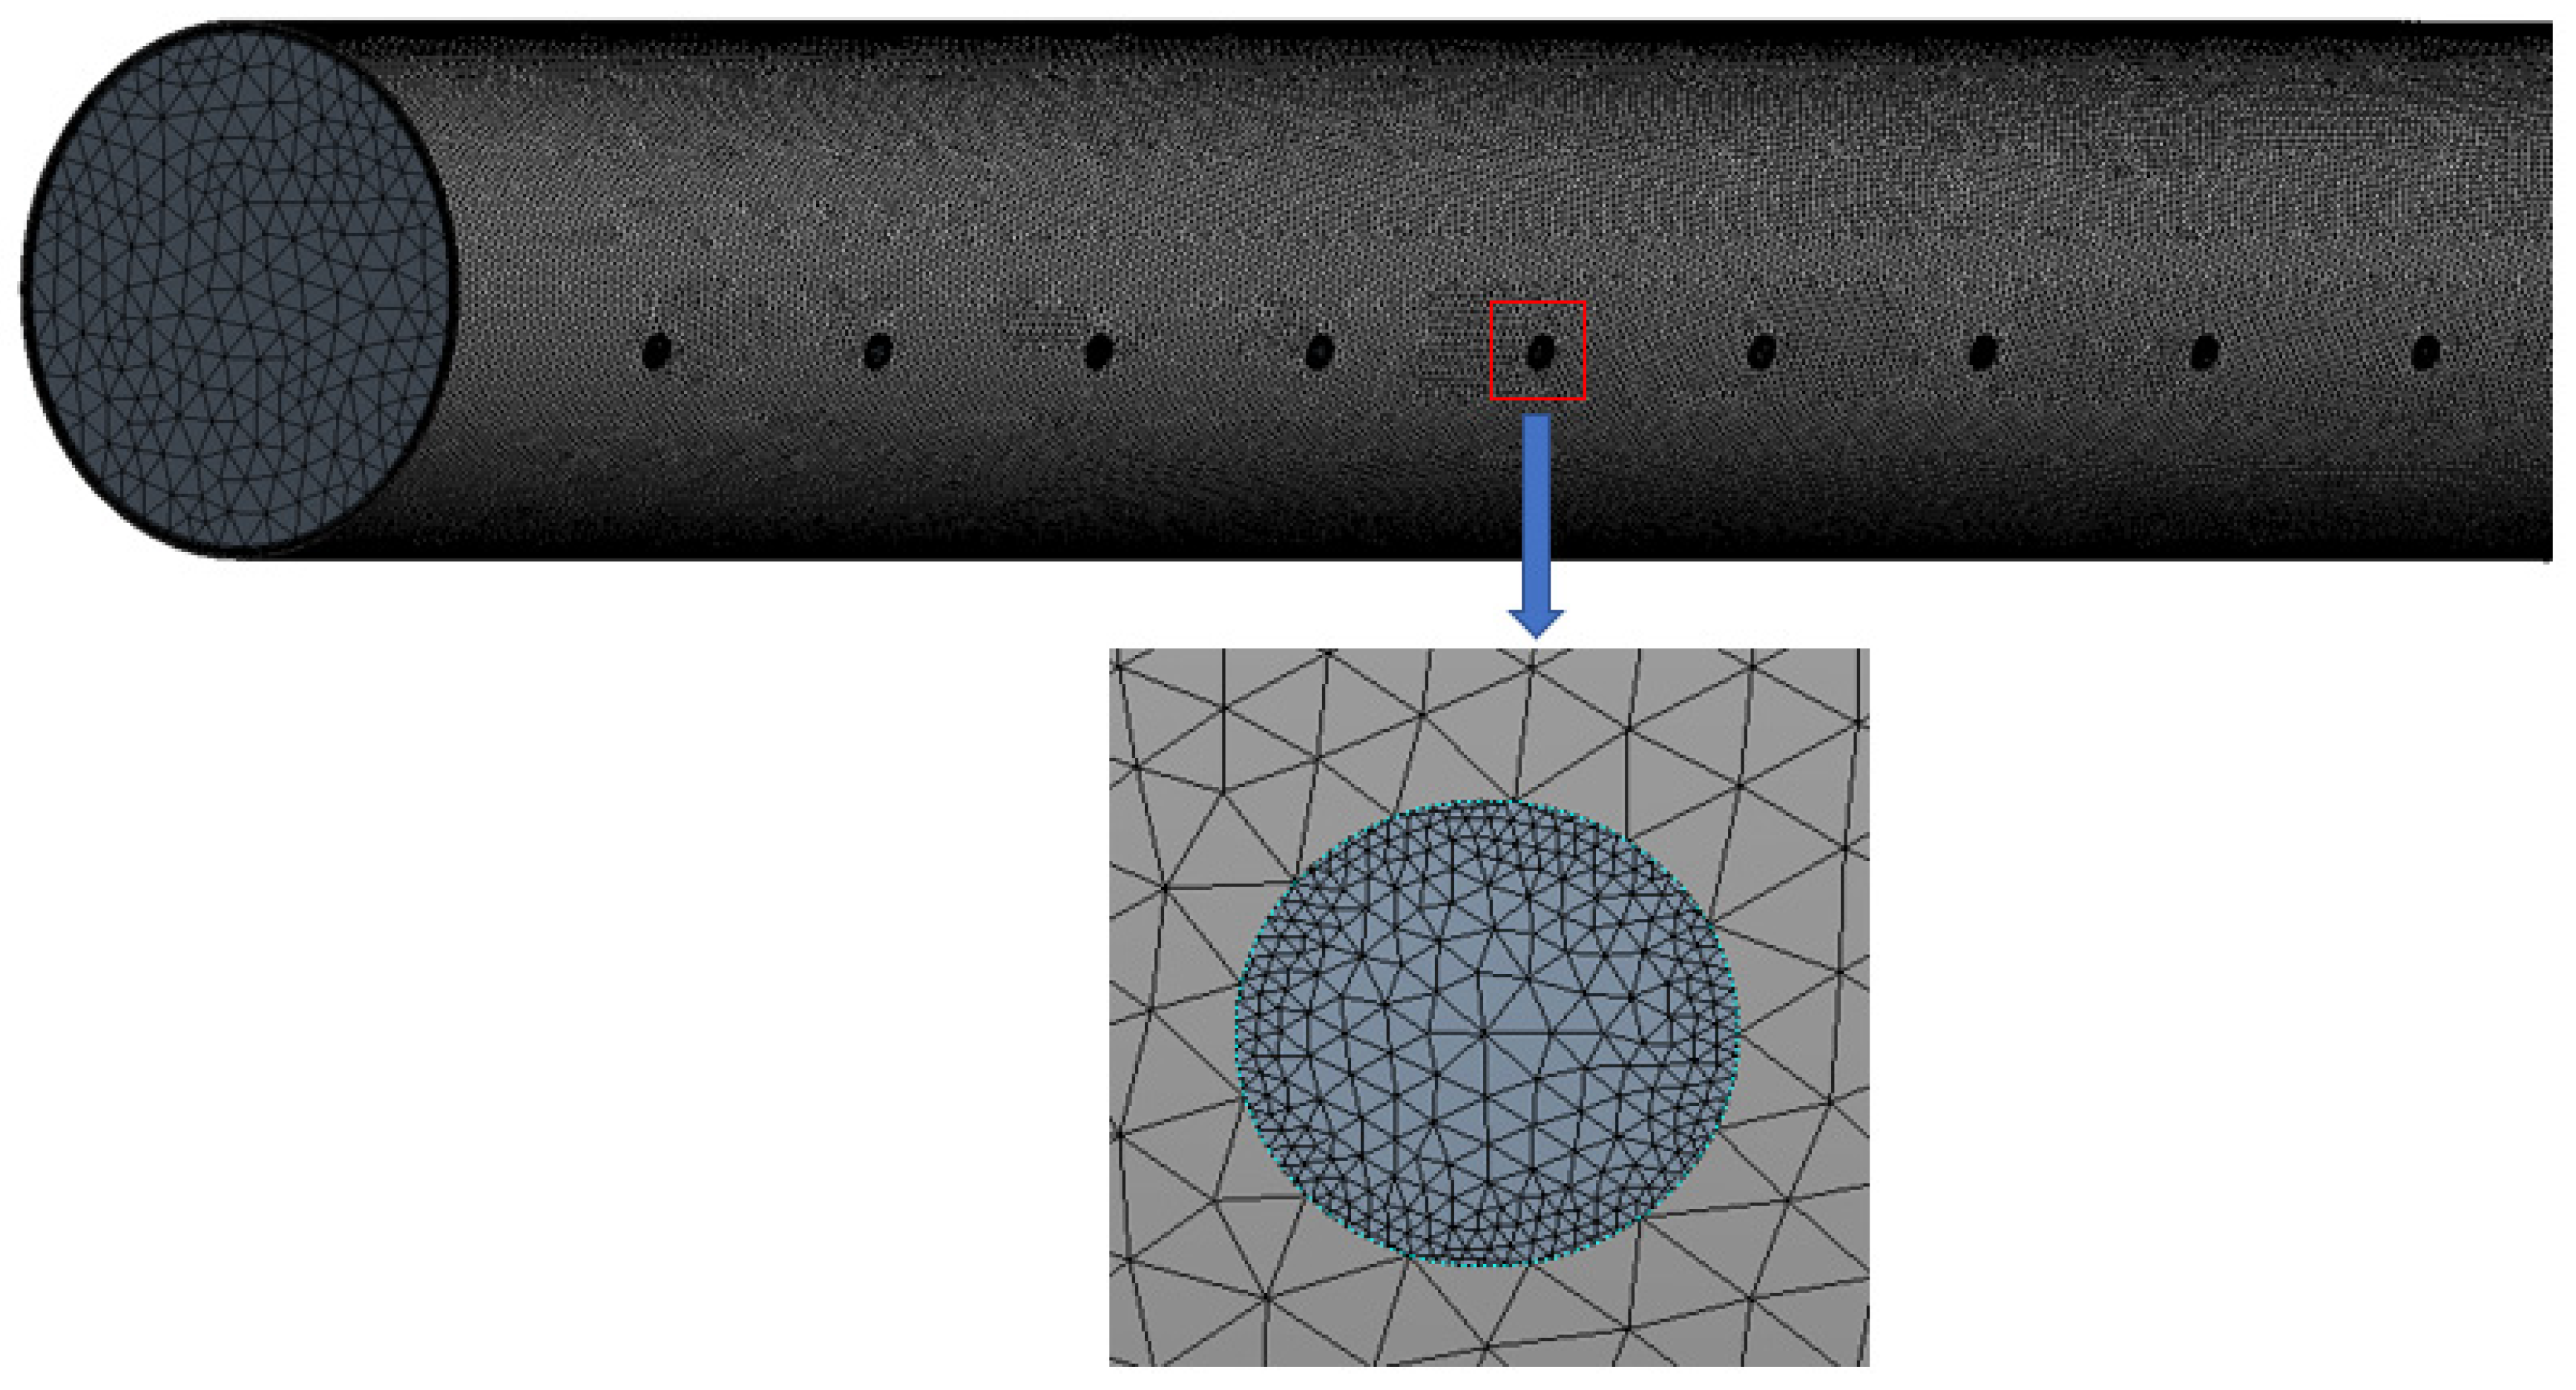
In the model, many small holes are opened in the wall. Since the thickness of the tube wall (of order 10−4 m) and the length of the tube (of order 101 m) differ by many orders of magnitude, a non-structured grid is deemed a better choice. The wall of the fiber tube is discretized to enhance the accuracy of the calculation, and the fluid at the opening is also discretized. Additionally, boundary layers are formed near the inner wall surface of the tube, as illustrated in Figure 4.
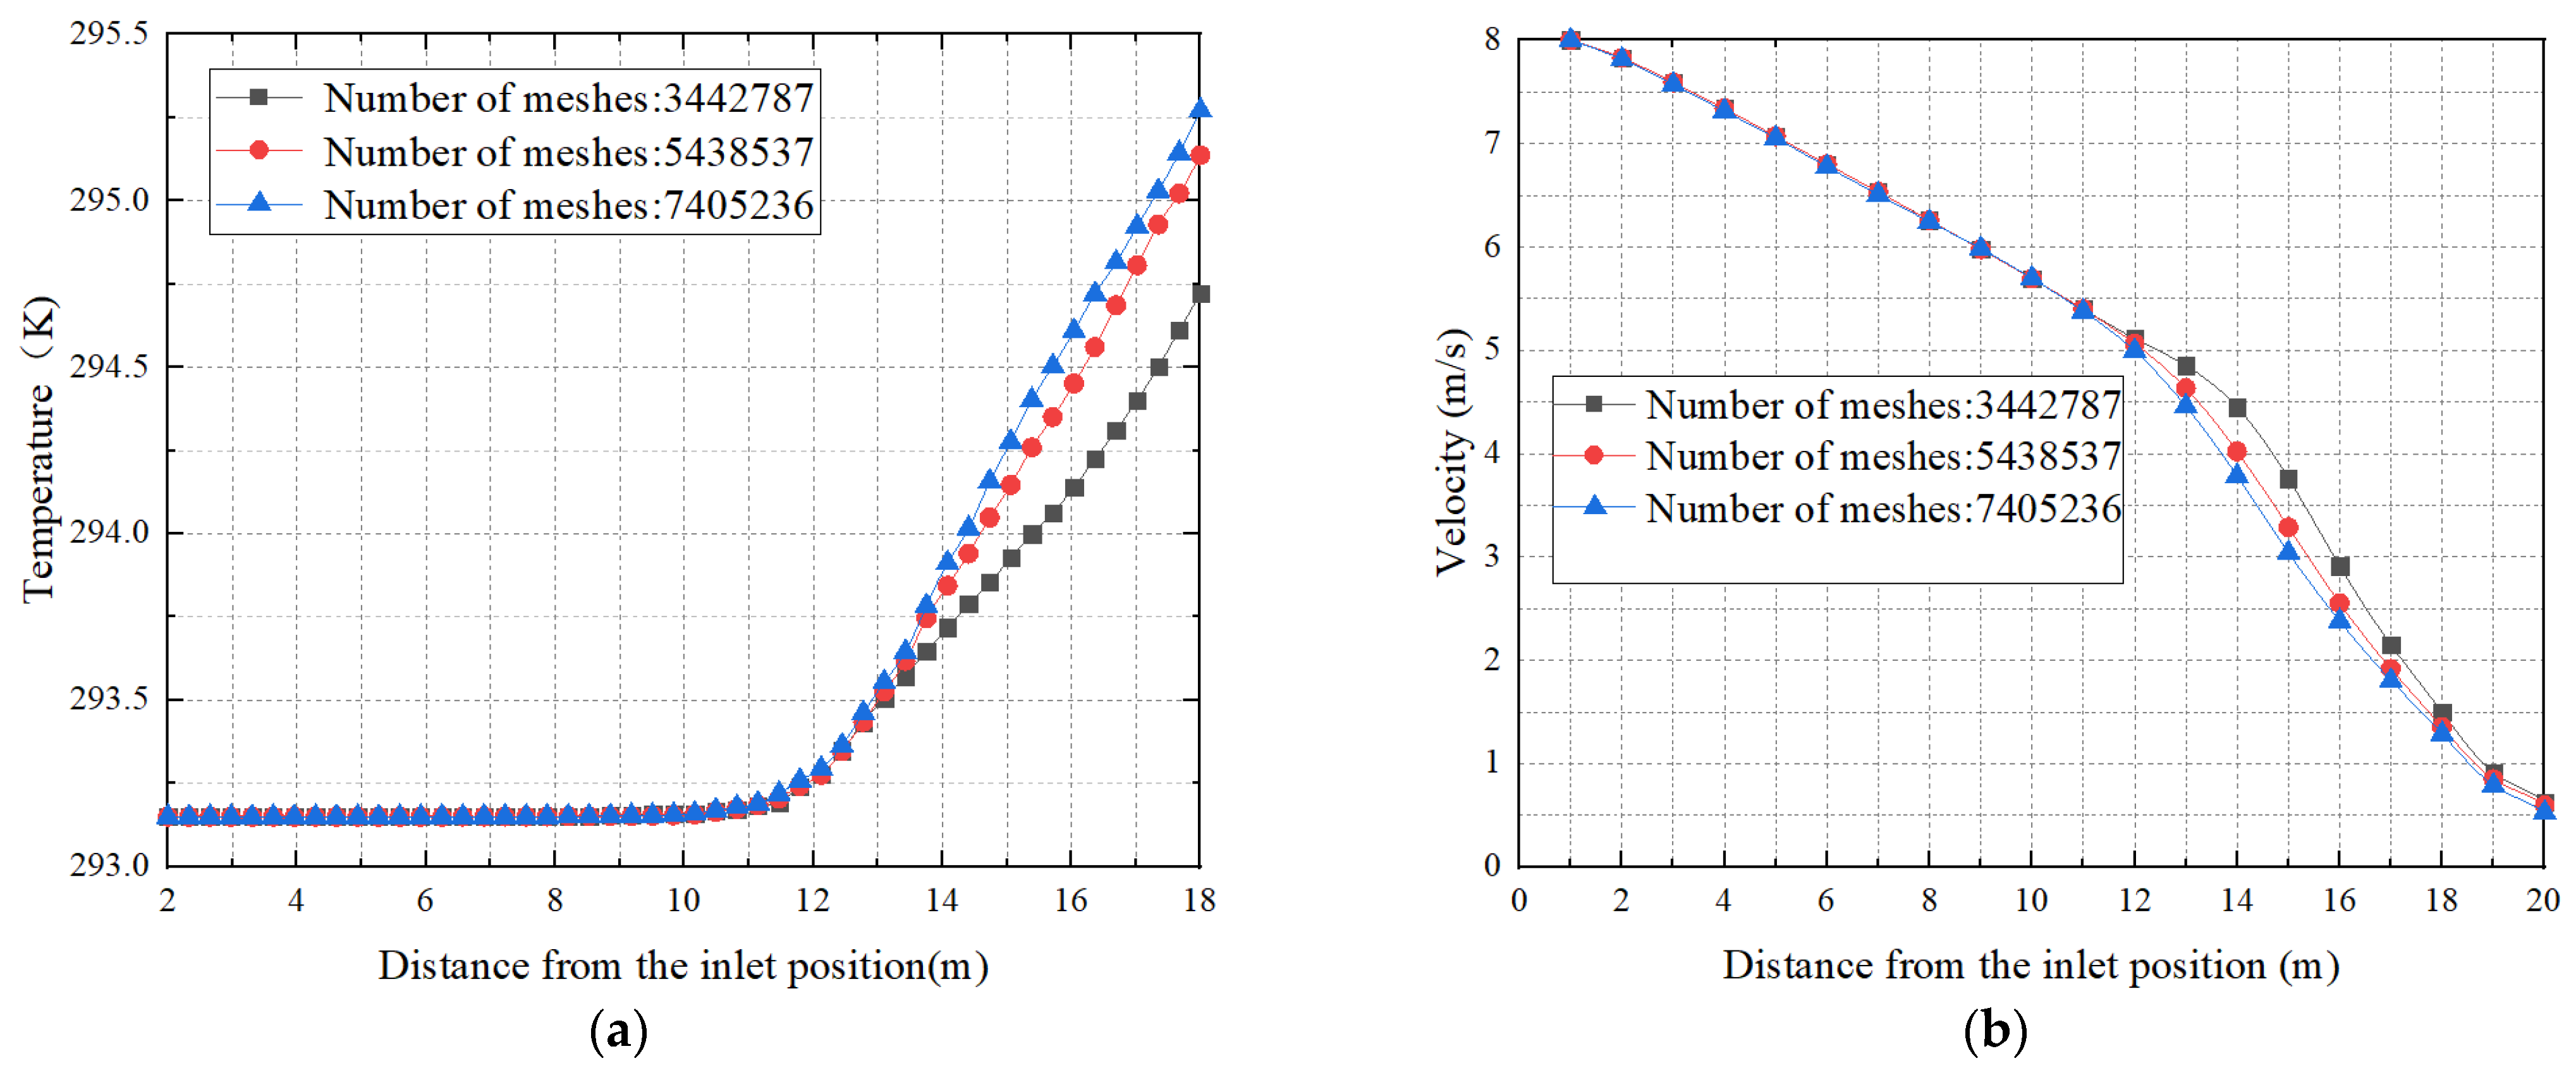
To ensure the accuracy of the calculated results, it is necessary to verify the independence of the grid. To achieve this, three sets of grids were used: 3.443 million, 5.439 million, and 7.405 million, with the same boundary conditions. The results, as shown in Figure 5, indicate that the temperature rise trends and speed change trends corresponding to the three different grid numbers are basically the same, with differences within 5%. This verifies grid independence. It is observed that the differences between the results for 3.443 million grids and for the latter two grid numbers are relatively large, while the difference between the latter two is negligible. The values of y + at the wall surface for the three grid schemes are, respectively, 230 for 3.443 million grids, 80 for 5.438 million grids, and 35 for 7.405 million grids. The latter two mesh schemes can better meet the requirements of wall y + , which makes the simulation more accurate. Considering the need for both computational efficiency and accuracy of the results, we chose a total grid number of 5.438 million for subsequent calculations and analysis.

2.4. Boundary Conditions and Solver Settings

To ensure the accuracy and reliability of the simulation results, the boundary conditions are shown in Table 1:
The model consists of two calculational domains: the internal fluid region of the duct and the fiber layer region, as shown in Figure 6. Gaps exist between the fine fiber particles in the fiber layer; hence, the fiber layer region is often treated as a porous medium [20]. During the simulation process, the FLUENT porous media model was used. The SIMPLE algorithm was used to solve the coupled pressure and velocity equations, with the pressure discretization equation in PRESTO and the rest in second-order upwind format. Convergence was achieved when the residuals of velocity, turbulent kinetic energy k , and dissipation rate ε were less than 10−5, and the residuals of temperature were less than 10−6.

3. Equivalent Discounting Method and Verification

3.1. Equivalent Discounting Method

The equivalent discounting method is employed to simulate the inside and outside of the duct by increasing the thickness of the duct wall based on a certain ratio and then discounting the relevant physical parameters accordingly. Thickening the duct wall and enhancing computational efficiency. The conversion of relevant physical parameters is a crucial step in improving the accuracy of the results.
In this work, the subsequent experiments and simulations are conducted using the same fiber duct material with a thickness of 0.2 mm. The porosity of the fiber material was experimentally measured to be 0.15, and its thermal conductivity was found to be λ = 0.154 W/(m·K).
Described below is the conversion process used in this study:
First, the thickness of the fiber layer was increased to 20 times the original thickness, i.e., from 0.2 mm to 4 mm. This allowed for the generation of a higher-quality mesh. However, the increase in the thickness of the pipe wall leads to changes in the thermal and flow resistance of the pipe. Therefore, it was necessary to discount the relevant physical parameters to ensure the accuracy of the results during numerical simulations. In this study, the fibrous material was treated as a porous medium, and the key parameters in the porous medium model were viscous resistance and inertial resistance [26]:
Viscous   Resistance :   1 α = 150 1 η 2 D a 2 η 3
Inertial   Resistance :   C 2 = 3.5 1 η D a 2 η 3
where η is the porosity of the porous medium and D a is the average particle size of the porous medium.
Pressure   drop   formula :   Δ p = μ α v i + 1 2 C 2 ρ v v i Δ n
where Δ p is the pressure difference between the two sides of the pipe wall, ρ is the fluid density, v i is the velocity in a certain direction, and Δ n is the thickness of the pipe wall material. The first term on the right side of Equation (11) is very small and can be neglected. According to test results, 1 α = 2.76 × 10 11 , C 2 = 6.94 × 10 5 .
Substituting Equation (10) into Equation (11) gives Δ n = 2 Δ p D p 2 3.5 ρ v v i η 3 1 η . The parameter η = 0.15, as measured by experiment, and Δ n increases to 20 times the original thickness of the pipe wall, while 2 Δ p D p 2 3.5 ρ v v i remains unchanged, and we calculate: η n = 0.3687 ,   1 α n = 1.025 × 10 12 ,   and   C 2 n = 34,700 .
The effective thermal conductivity of the duct material is measured by experiment: λ e f f = 0.154 W/(m·K), and the thermal conductivity of air is   λ a i r = 0.0267 W/(m·K). The virtual tube wall thickness is increased to 20 times the original one, and to ensure that the thermal resistance remains unchanged, λ e f f also needs to be increased to 20 times its original value, i.e., 3.08 W/(m·K).
From   the   formula   λ e f f n = η n λ f n + 1 η n   λ a i r
we get λ f n = λ e f f n 1 η n   λ a i r η n   = 8.308 W/(m·K).
This leads to new values:   η n = 0.3687 ,   1 α n = 1.025 × 10 12 ,   C 2 n = 34,700 ,   and   λ f n = 8.308 W/(m·K).

3.2. Method Verification

In order to assess the reliability of the CFD simulation method, experimental measurements were conducted to observe the variation of flow velocity along the interior of the FADS system. The field experiment layout is shown in Figure 7. The duct had a length of 20 m, a diameter of 0.485 m, a wall thickness of 0.2 mm, and a hole spacing of 0.16 m. It had 144 holes with a diameter of 24.15 mm, and the hole directions were set at 10.30 and 1:30 o’clock. The airflow velocity inside the fiber duct was measured using a thermal anemometer with a range of 0–20 m/s, a resolution of 0.01 m/s, and an accuracy of ±0.05 m/s. Measurements were taken at intervals of 2 m, starting at 2 m from the entrance of the duct, after the system reached a stable state; the average value was obtained from three trials.
To ensure the reliability of the CFD simulation method, the numerical model was designed to match the experimental model in terms of pipe length, diameter, opening spacing, number of openings, opening diameter, and opening angle. Furthermore, the pipe wall was thickened to 4 mm using the equivalent discounting algorithm, and the openings were also meshed using a densified technique. The final grid comprised 5.703 million cells.
The inlet of the system was set as a velocity inlet. The fiber layer region on the wall of the FADS is modeled as a porous medium. The outermost surface of the wall is set as a pressure outlet, and the openings on the FADS are also set as a pressure outlet. The schematics of ejection-permeable FADS is shown in Figure 8. The SIMPLE algorithm was used to iteratively solve the coupled pressure and velocity equations. The pressure discretization equations were solved using PRESTO, while the others were solved using second-order upwind differencing. The convergence criteria were defined as the residuals of velocity, turbulent kinetic energy k , and dissipation rate ε being less than 10−5, and the residuals of temperature being less than 10−6.
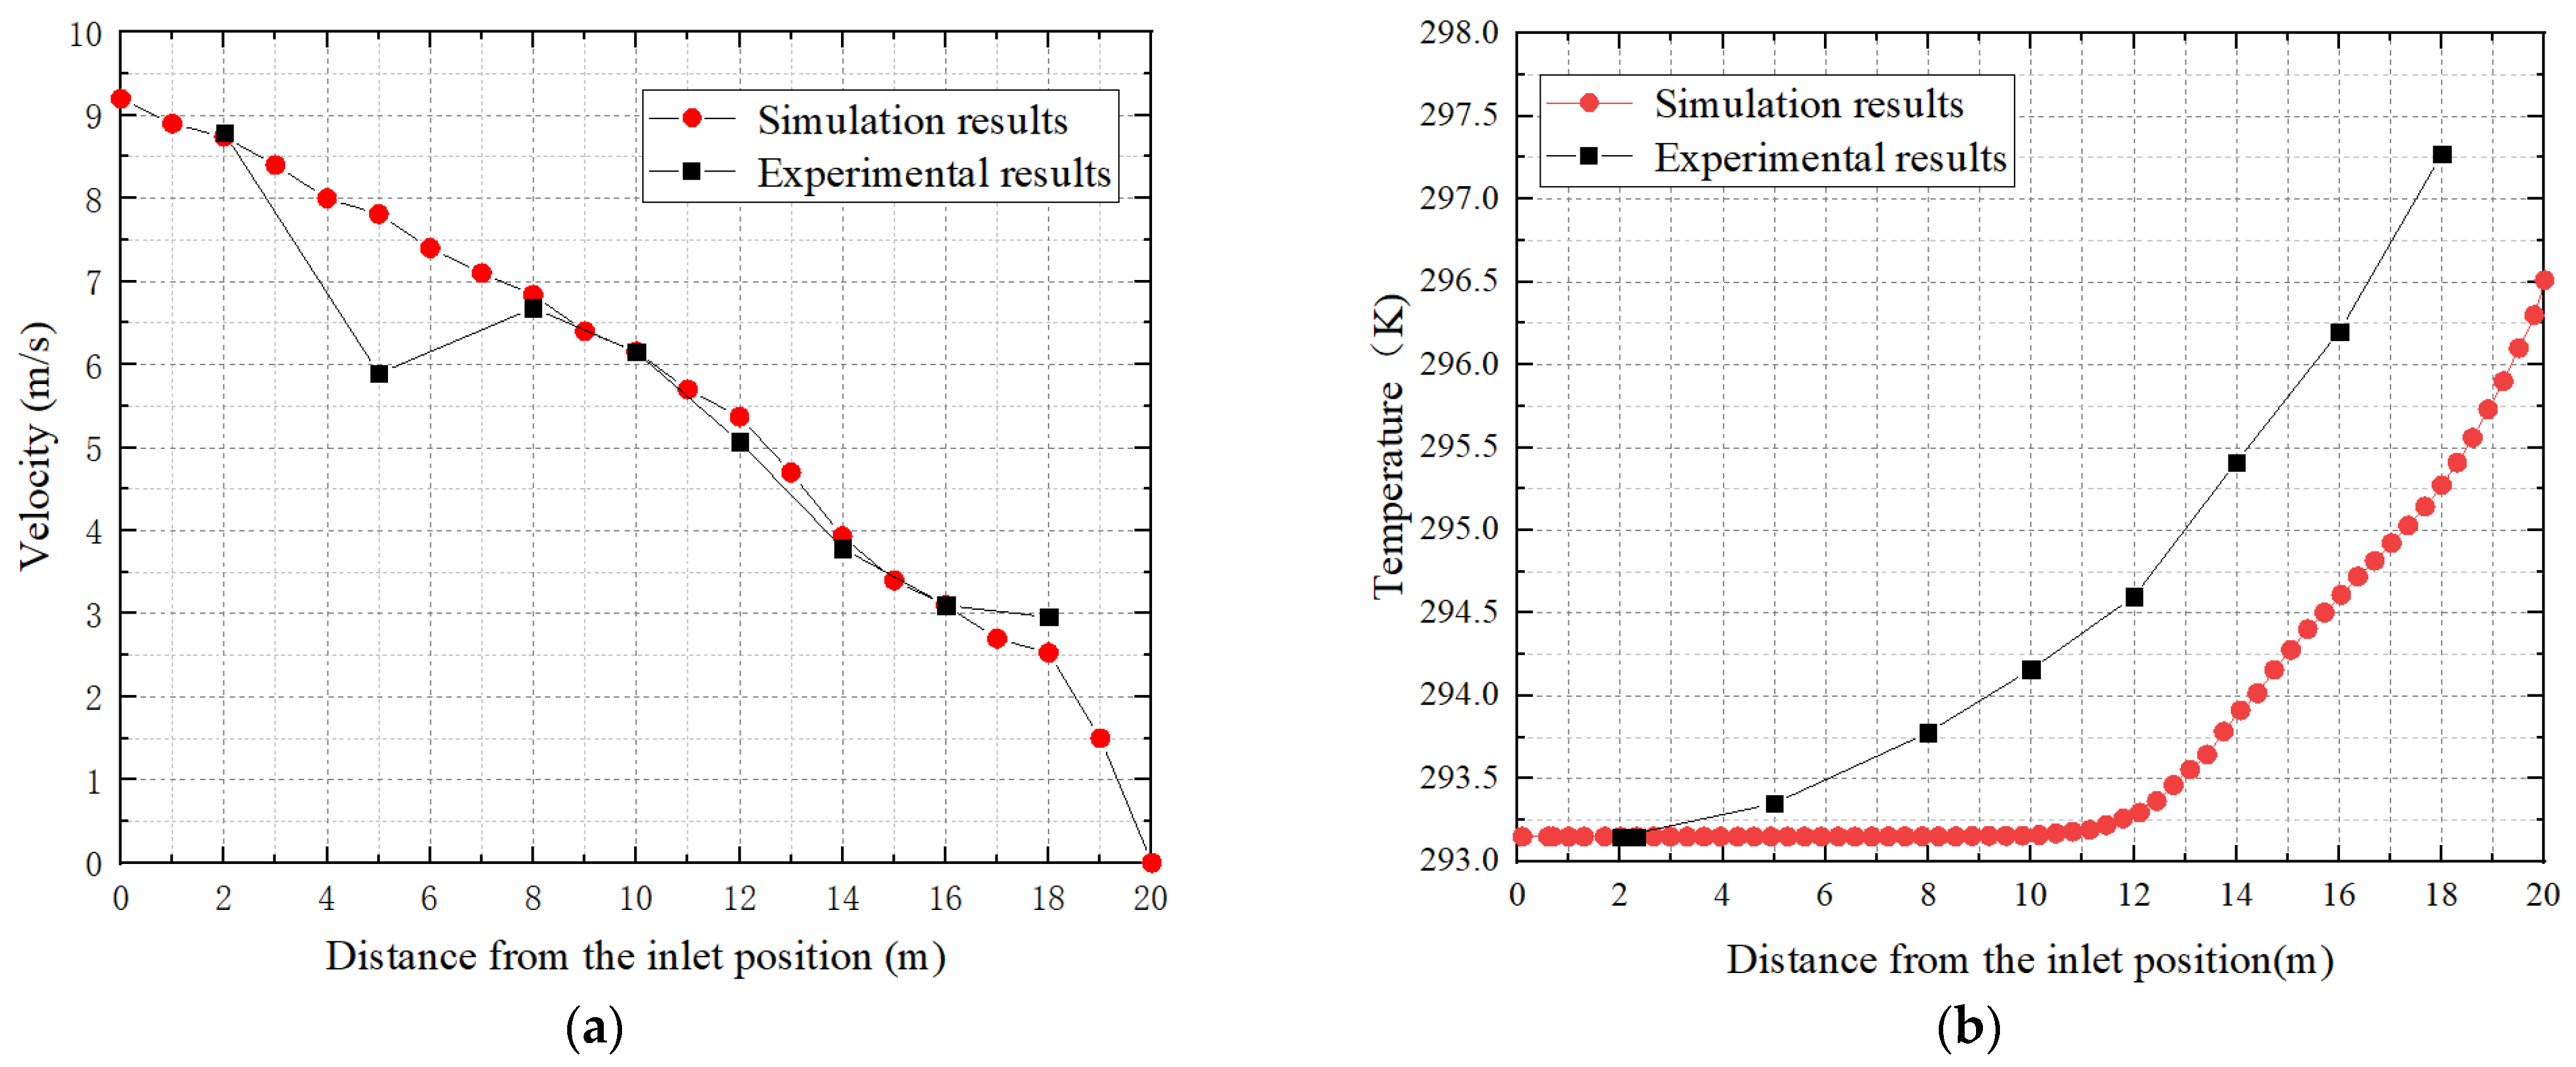
Figure 9a shows the flow velocity at various measurement points within the duct. The results indicate a gradual decrease in flow velocity from approximately 9 m/s to 0 m/s along the direction of the duct, due to resistance. The measured and simulated results are in good agreement, with relative errors within 15%. Figure 9b shows the temperature at various measurement points within the duct. The results indicate a gradual rise in temperature from approximately 293.15 K to 296.5 K for simulation and to 297.25 K for experiment along the direction of the duct. The measured and simulated results are in good agreement, with relative errors within 15%. The temperature increase within the pipe is closely associated with the airflow velocity. Higher velocities promote efficient air ejection and improved air penetration from the surface, resulting in reduced heat transfer from the external environment and subsequently mitigated temperature fluctuations. As the velocity becomes relatively low after 12 m, it becomes more susceptible to the thermal conditions outside the pipe, resulting in a faster temperature rise after this position. Given that the actual measured data and simulation are subject to multiple factors, such as inlet wind speed, simplified model conversion, numerical simulation errors, and instrument aging, the relative error falls within an acceptable range, thereby validating the feasibility of the equivalent discounting method.

4. Results and Discussion

The distributions of flow and temperature in the FADS have a direct impact on its effectiveness for indoor air conditioning. The flow and heat transfer characteristics of a FADS are significantly influenced by its shape and opening form. To investigate these effects on the internal flow and temperature of FADS, this study used the verified equivalent discounting method.

4.1. Impact of the Number of Opening Rows on the Internal Velocity and Temperature Rise of FADS

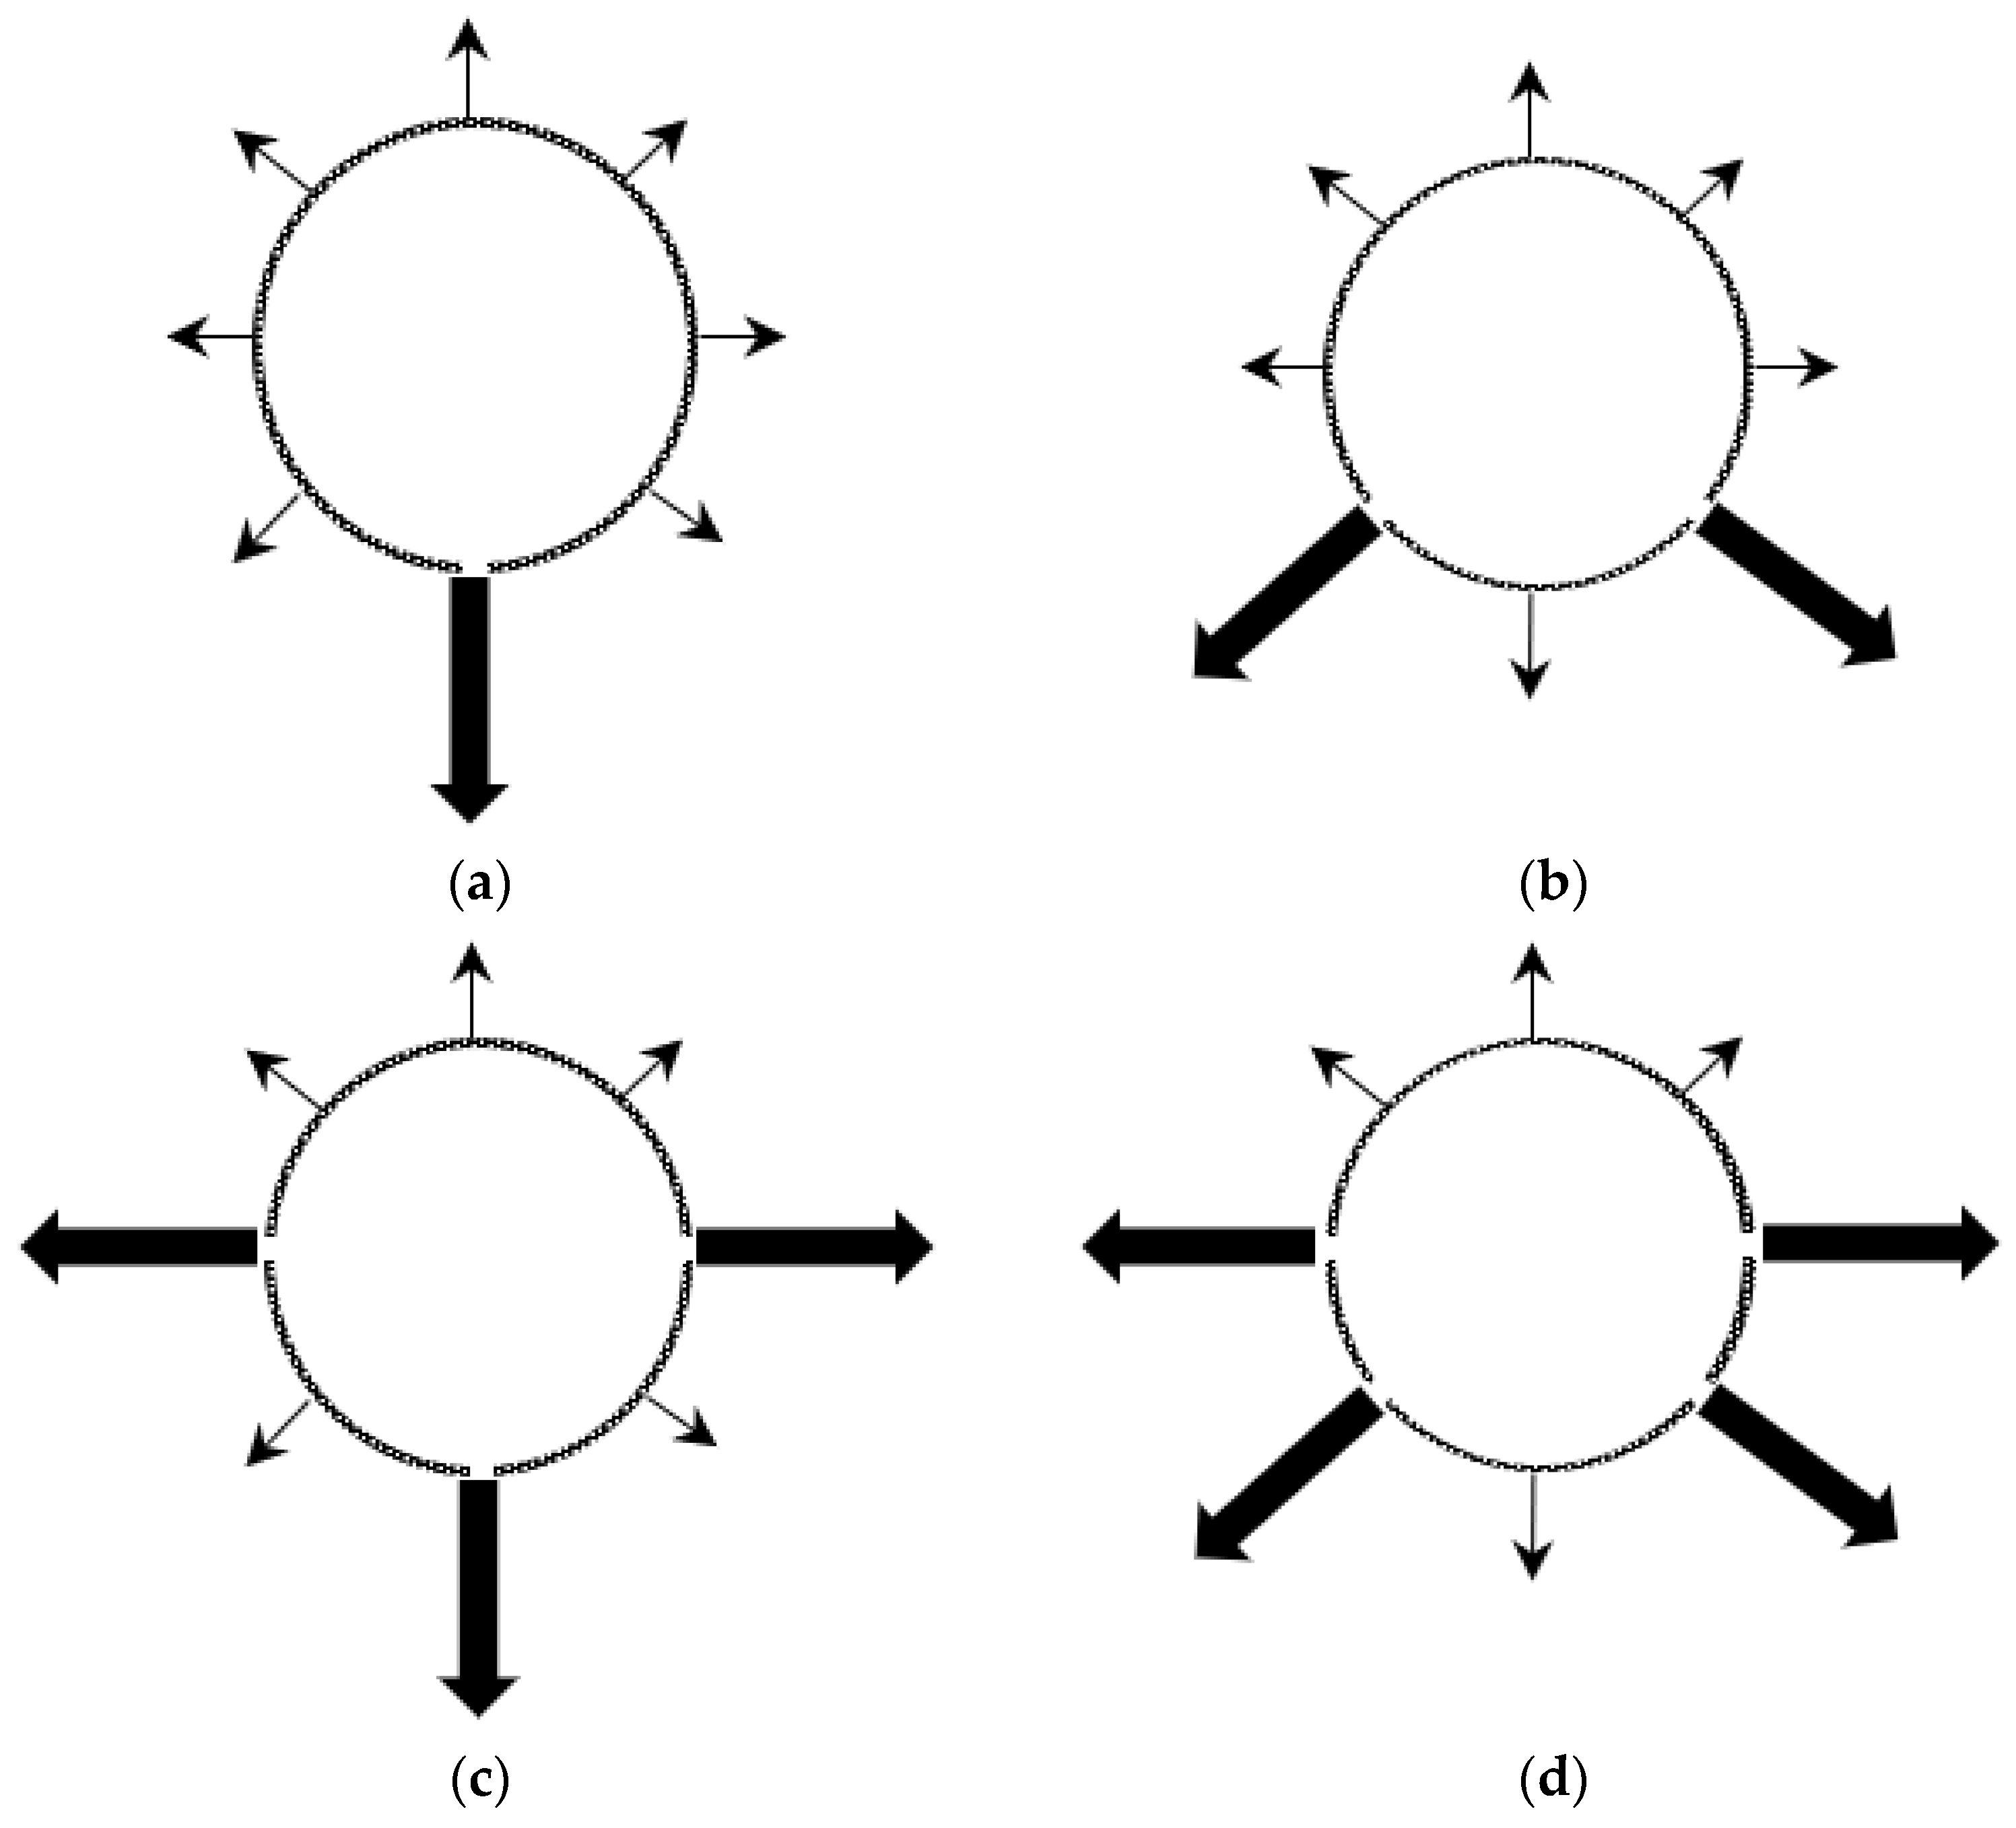
To satisfy the air-supply requirements of large spaces, FADS are often equipped with multiple rows of openings to increase the jet influence area [27]. This section reports the impact of different numbers of opening rows on flow velocity and temperature rise inside FADS, providing a guide for selecting the appropriate number of rows. Four common opening-row configurations were tested: 1, 2, 3, and 4 rows. The opening angles were positioned at 6 o’clock for one row, 4:30 and 7:30 o’clock for two rows, and 3, 6, and 9 o’clock and 3, 4:30, 7:30, and 9 o’clock for three and four rows, respectively. The hole spacing was 0.276 m, resulting in 72, 144, 216, and 288 corresponding open holes, with all other conditions remaining constant.
Figure 10 illustrates the specific configurations tested.

4.1.1. Variation of Internal Flow Velocity inside FADS with Four Opening Rows

Air velocity inside the duct will gradually decrease due to factors such as escape to the outside, injection, and loss of resistance along the way. Figure 11 shows the variation of the central velocity in the four kinds of FADS with different numbers of openings. From Figure 11, it can be observed that the internal velocity of FADS with four different configurations of rows follows a similar trend, decreasing smoothly from 8 m/s at the entrance to zero at the closed end. These results are consistent with the trend of the results of previous studies on the variation of flow velocity inside FADS [16,20]. Specifically, the flow velocity decreases at an almost uniform rate for the first 10 m from the entrance for all four types of openings. Beyond 10 m, the rate of reduction in flow velocity increases, and after 15 m, the rate of decrease stabilizes. The flow velocity inside the duct with only one row of openings is consistently higher than with the other three types of openings (except, of course, at the inlet and end points). The larger the number of openings, the smaller the flow velocity at the same location inside the duct. This is because with more openings, air can more easily exit the duct, leading to a more rapid decrease in internal air velocity and a smaller flow velocity at the same location inside the FADS with more rows of openings.

4.1.2. Variation of the Internal Temperature Rise of FADS with Four Opening Rows

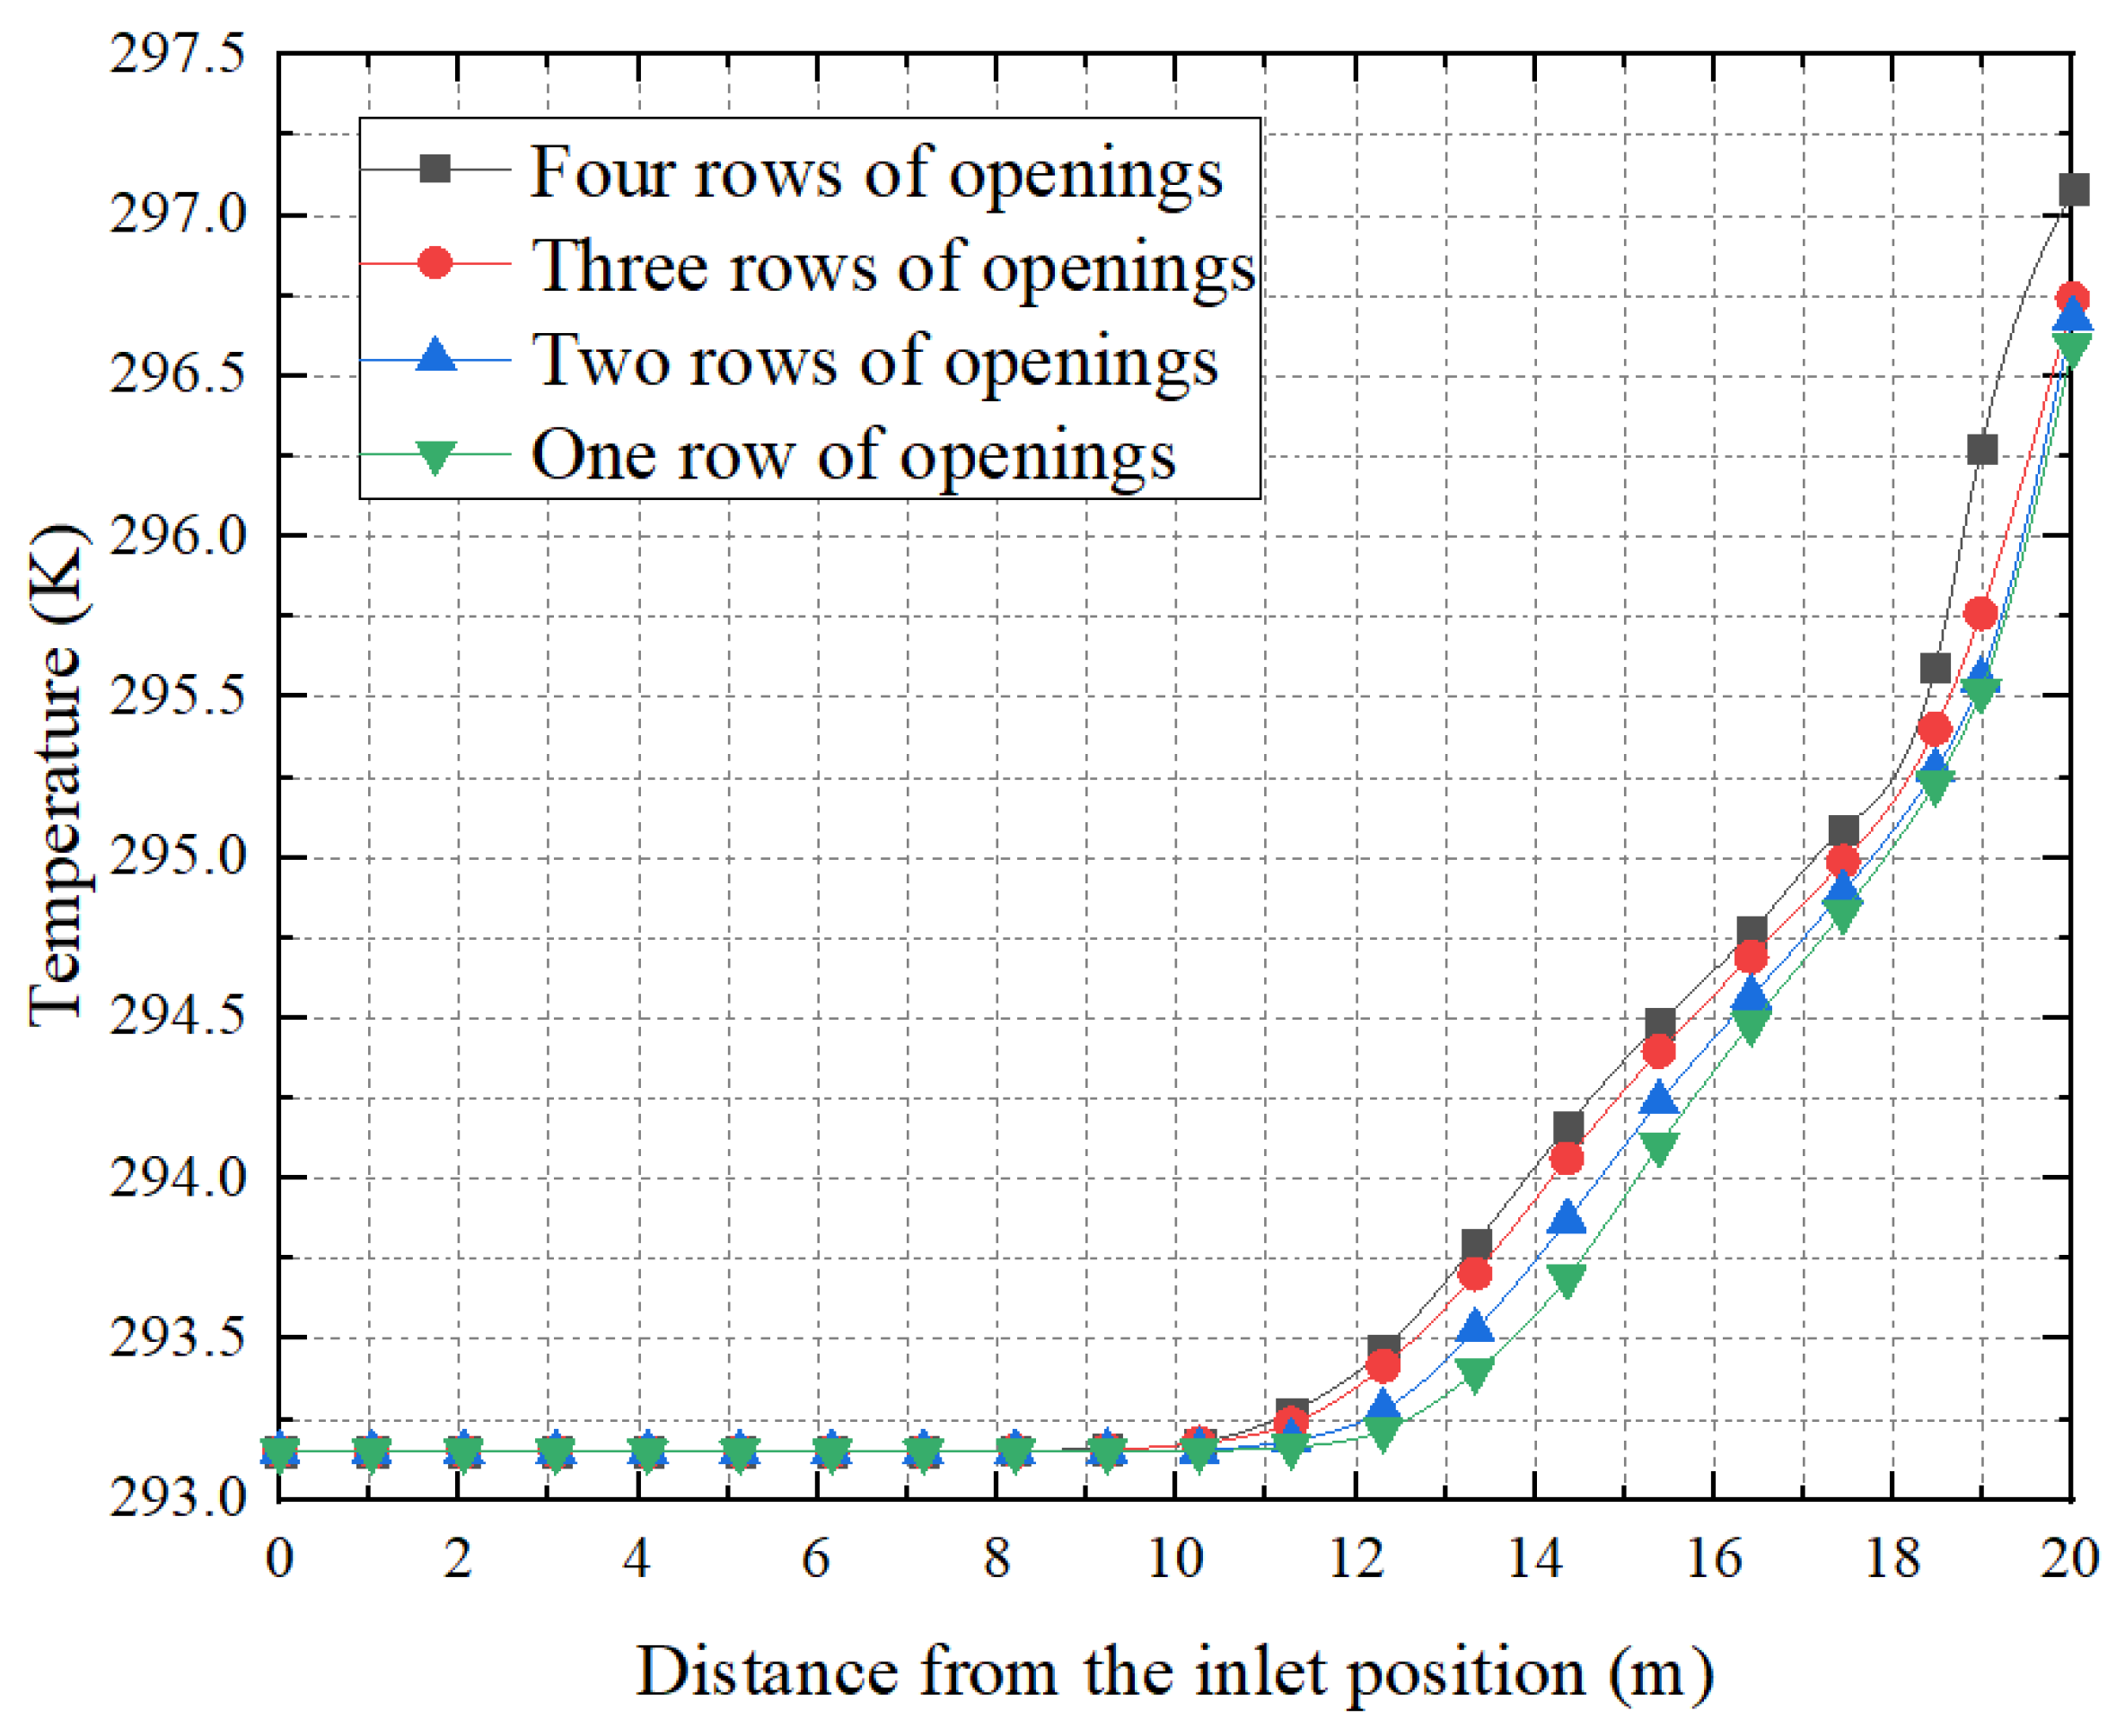
In summer conditions, the air temperature outside the tube is higher than the air supply temperature, resulting in convection and conduction that heat the air inside the tube. Figure 12 shows the variation of the central temperature in the four kinds of FADS with different numbers of openings. From Figure 12, it can be observed that the internal temperature of FADS with four types of opening rows follows a similar trend. The temperature rises almost uniformly from 13 m to 17 m and then accelerates again near the rear end at 18 m. The temperature rise of the FADS with four rows of open holes is significantly higher than for the other three, with the end temperature exceeding 297 K and rising by about 3.9 K. The temperature rise for the FADS with three rows of open holes is slightly higher than for the FADS with one and two rows of open holes, and the temperature rise for the FADS with two rows of open holes is slightly higher than for the FADS with one row of open holes. These three FADS experience a temperature rise of nearly 3.5 K. The temperature rise inside the tube is closely correlated with the airflow velocity. Higher flow velocities facilitate more efficient air ejection and enhanced air penetration from the surface of the duct, resulting in reduced heat transfer from the external environment and subsequently lower temperature changes. Conversely, when the flow rate in the pipe is low, the air flow is more susceptible to the external environment, resulting in a higher temperature. Specifically, after 12 m, because the airflow velocity becomes relatively low, the temperature rises faster after this position, about 3.5 K for the FADS with one, two, and three rows of openings, and about 3.9 K for the FADS with four rows of openings.
The flow velocity inside the tube is highest in the first section, where the influence of heat transfer from the external environment is minimal, resulting in a small temperature rise. As the flow velocity gradually decreases along the tube, the temperature rise becomes more significant in the middle and rear sections. The number of open rows in the FADS is negatively correlated with the flow velocity in the tube, and higher numbers of rows result in lower flow velocity and greater temperature rises. Therefore, FADS with more rows of openings exhibit a higher temperature rise and higher temperatures at the same location inside the tube.
The velocity of the air inside the long FADS pipe decays rapidly, particularly in the middle and rear sections, leading to a significant increase in temperature. The installation of multiple rows of openings in the FADS amplifies the reduction of wind speed and intensifies the increase in temperature. This phenomenon is detrimental to air supply efficiency. It is therefore recommended to avoid setting up too many openings in long-distance air supply systems.

4.2. Impact of Opening Arrangements on the Internal Velocity and Temperature Rise of FADS

In practical applications, the duct’s openings can be varied by adjusting the number of rows, hole spacing, and other parameters, resulting in various opening configurations [28]. This section investigates the impact of different opening configurations on the flow rate and temperature rise within the FADS, providing valuable insights for the design of opening configurations. Two types of openings, one row and two rows, are considered, each with 144 openings, achieved by setting different opening spacings: 0.138 m for the one-row type and 0.276 m for the two-row type. The other parameters remain constant across all configurations. Figure 13 and Figure 14 illustrate these two kinds of opening configurations.

4.2.1. Variation of Flow Velocity inside FADS with a Two-Opening Arrangement

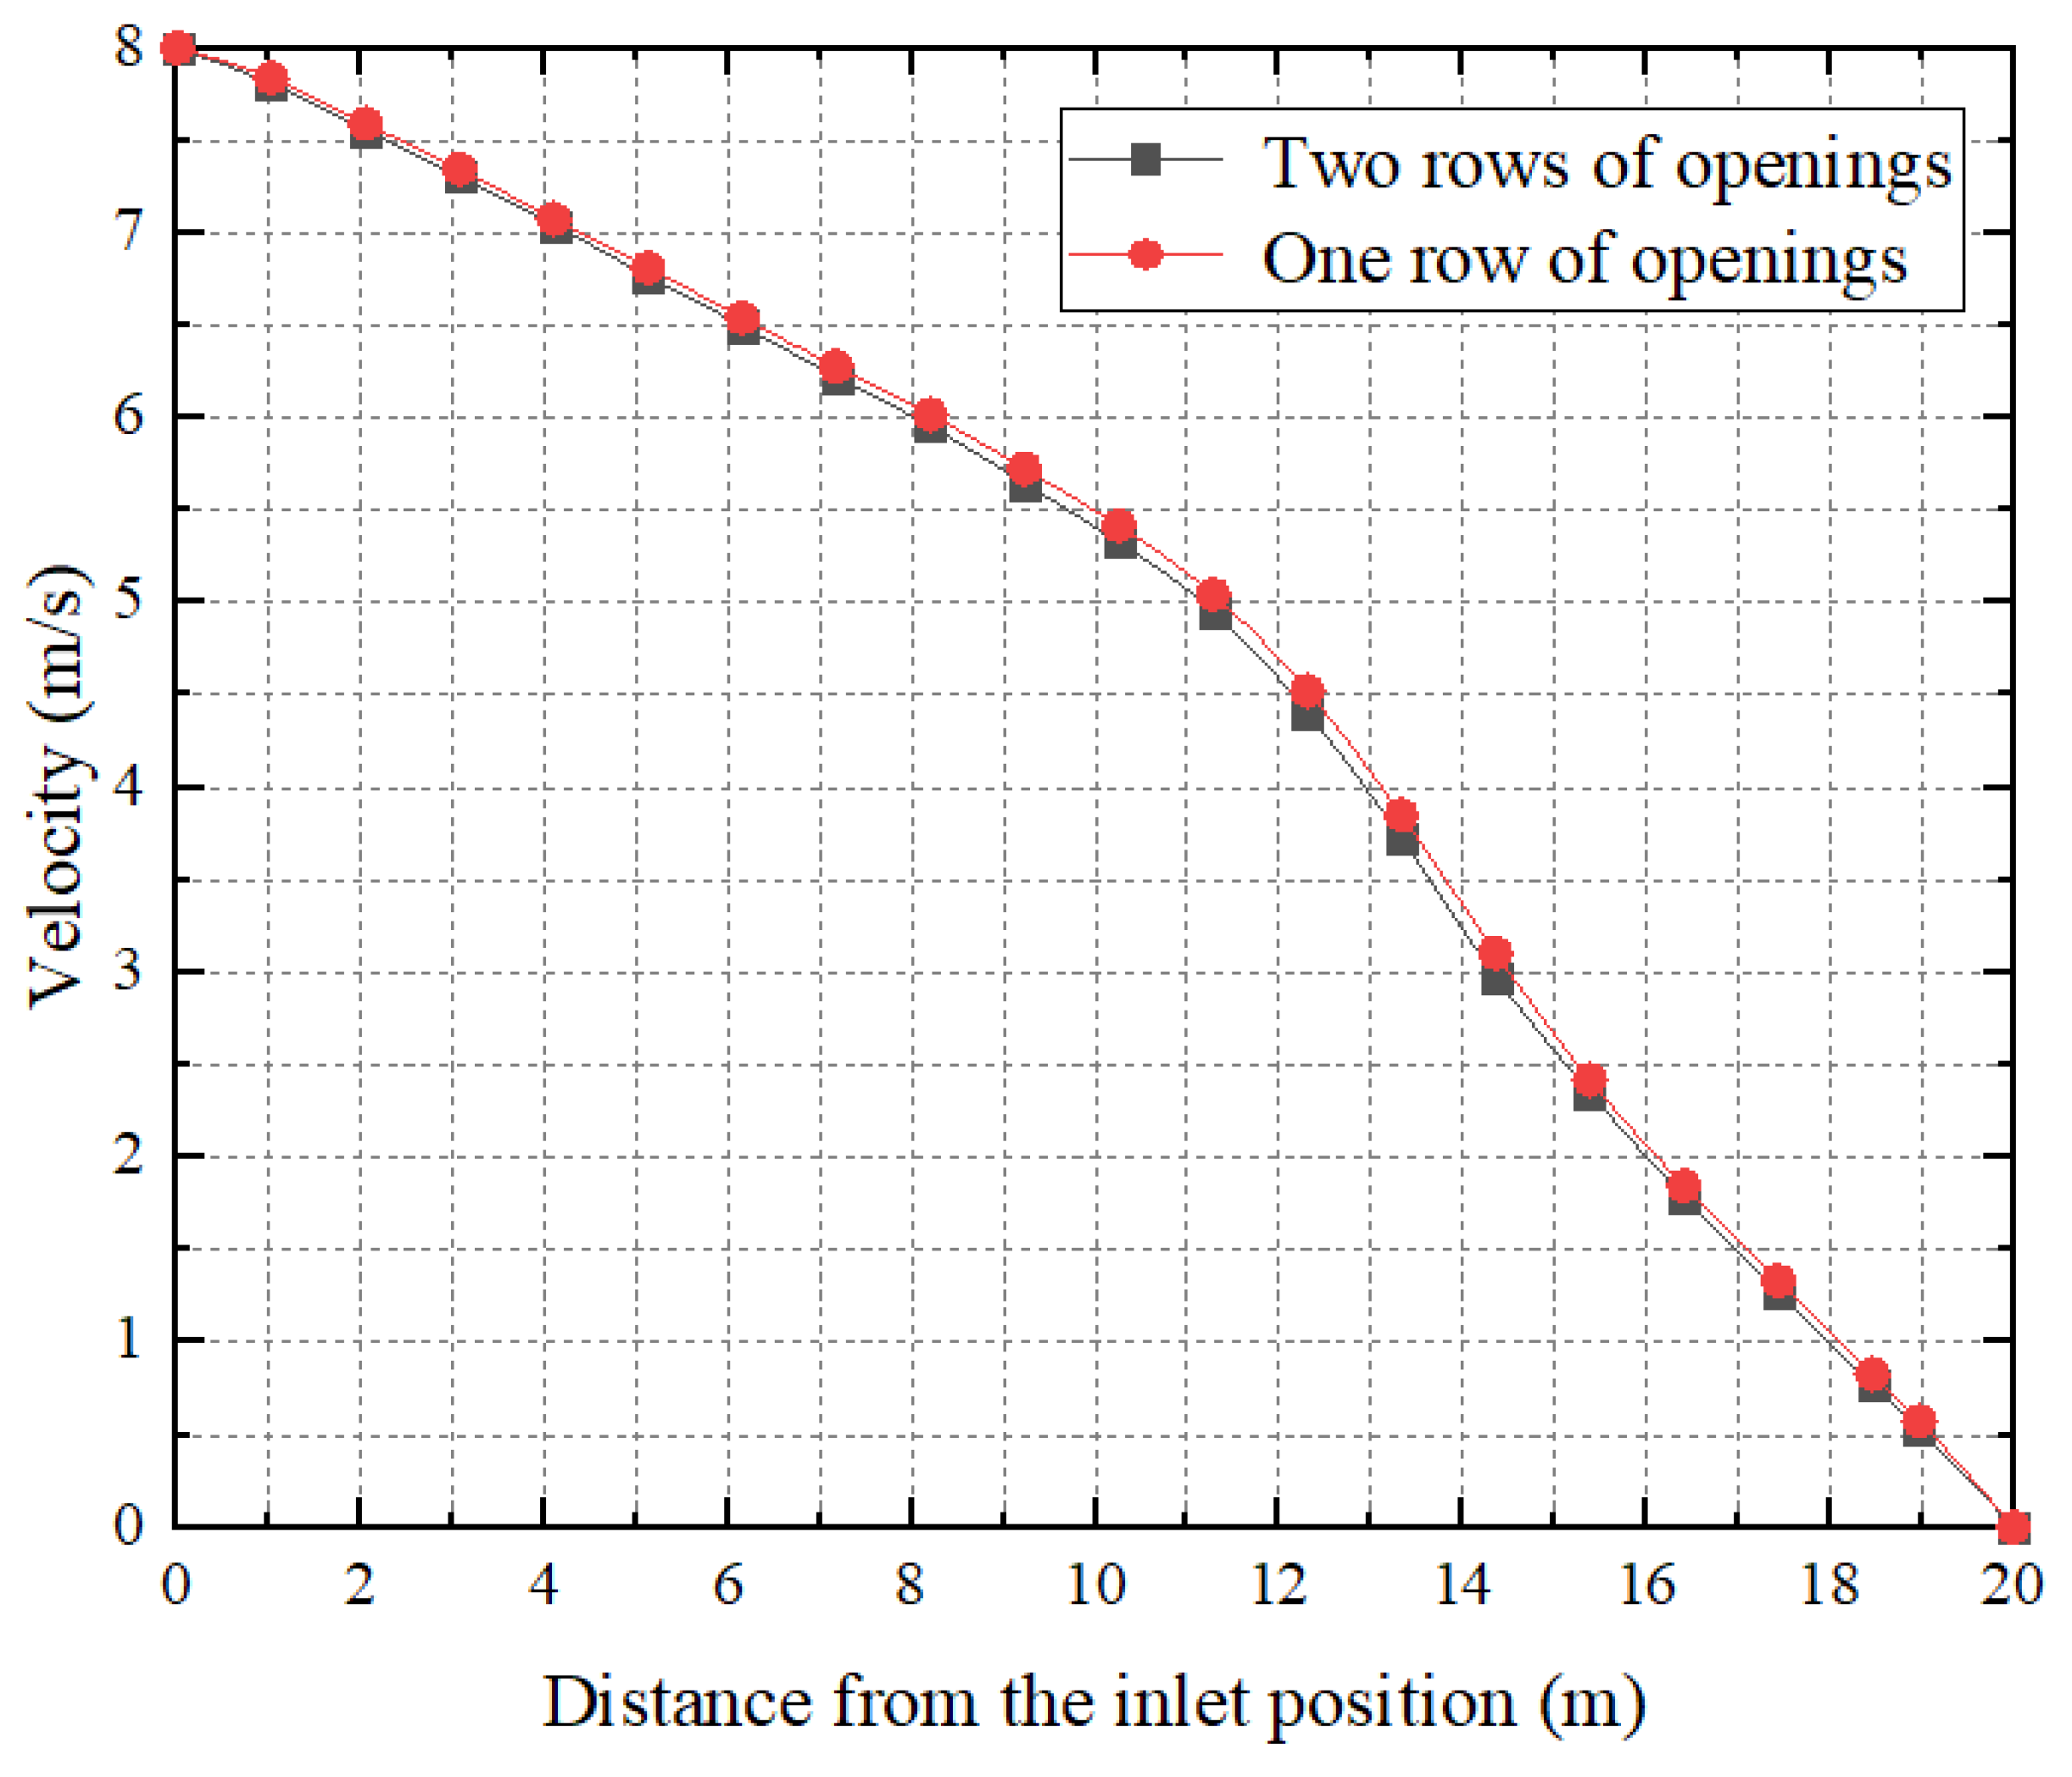
Figure 15 shows the central flow velocity inside two FADS ducts with the same number of openings, one with one row of open holes and one with two rows of open holes. It can be observed that even though the number of openings is the same, two rows of openings facilitate smoother airflow out of the duct than one row of openings. Furthermore, the wind speed decays at a somewhat faster rate with two rows, resulting in a lower wind speed at the same location within the tube. Therefore, when the number of openings is the same, increasing the number of rows of FADS openings will result in a faster wind speed decay within the tube.

4.2.2. Variation of the Internal Temperature Rise of FADS with Two Opening Arrangements

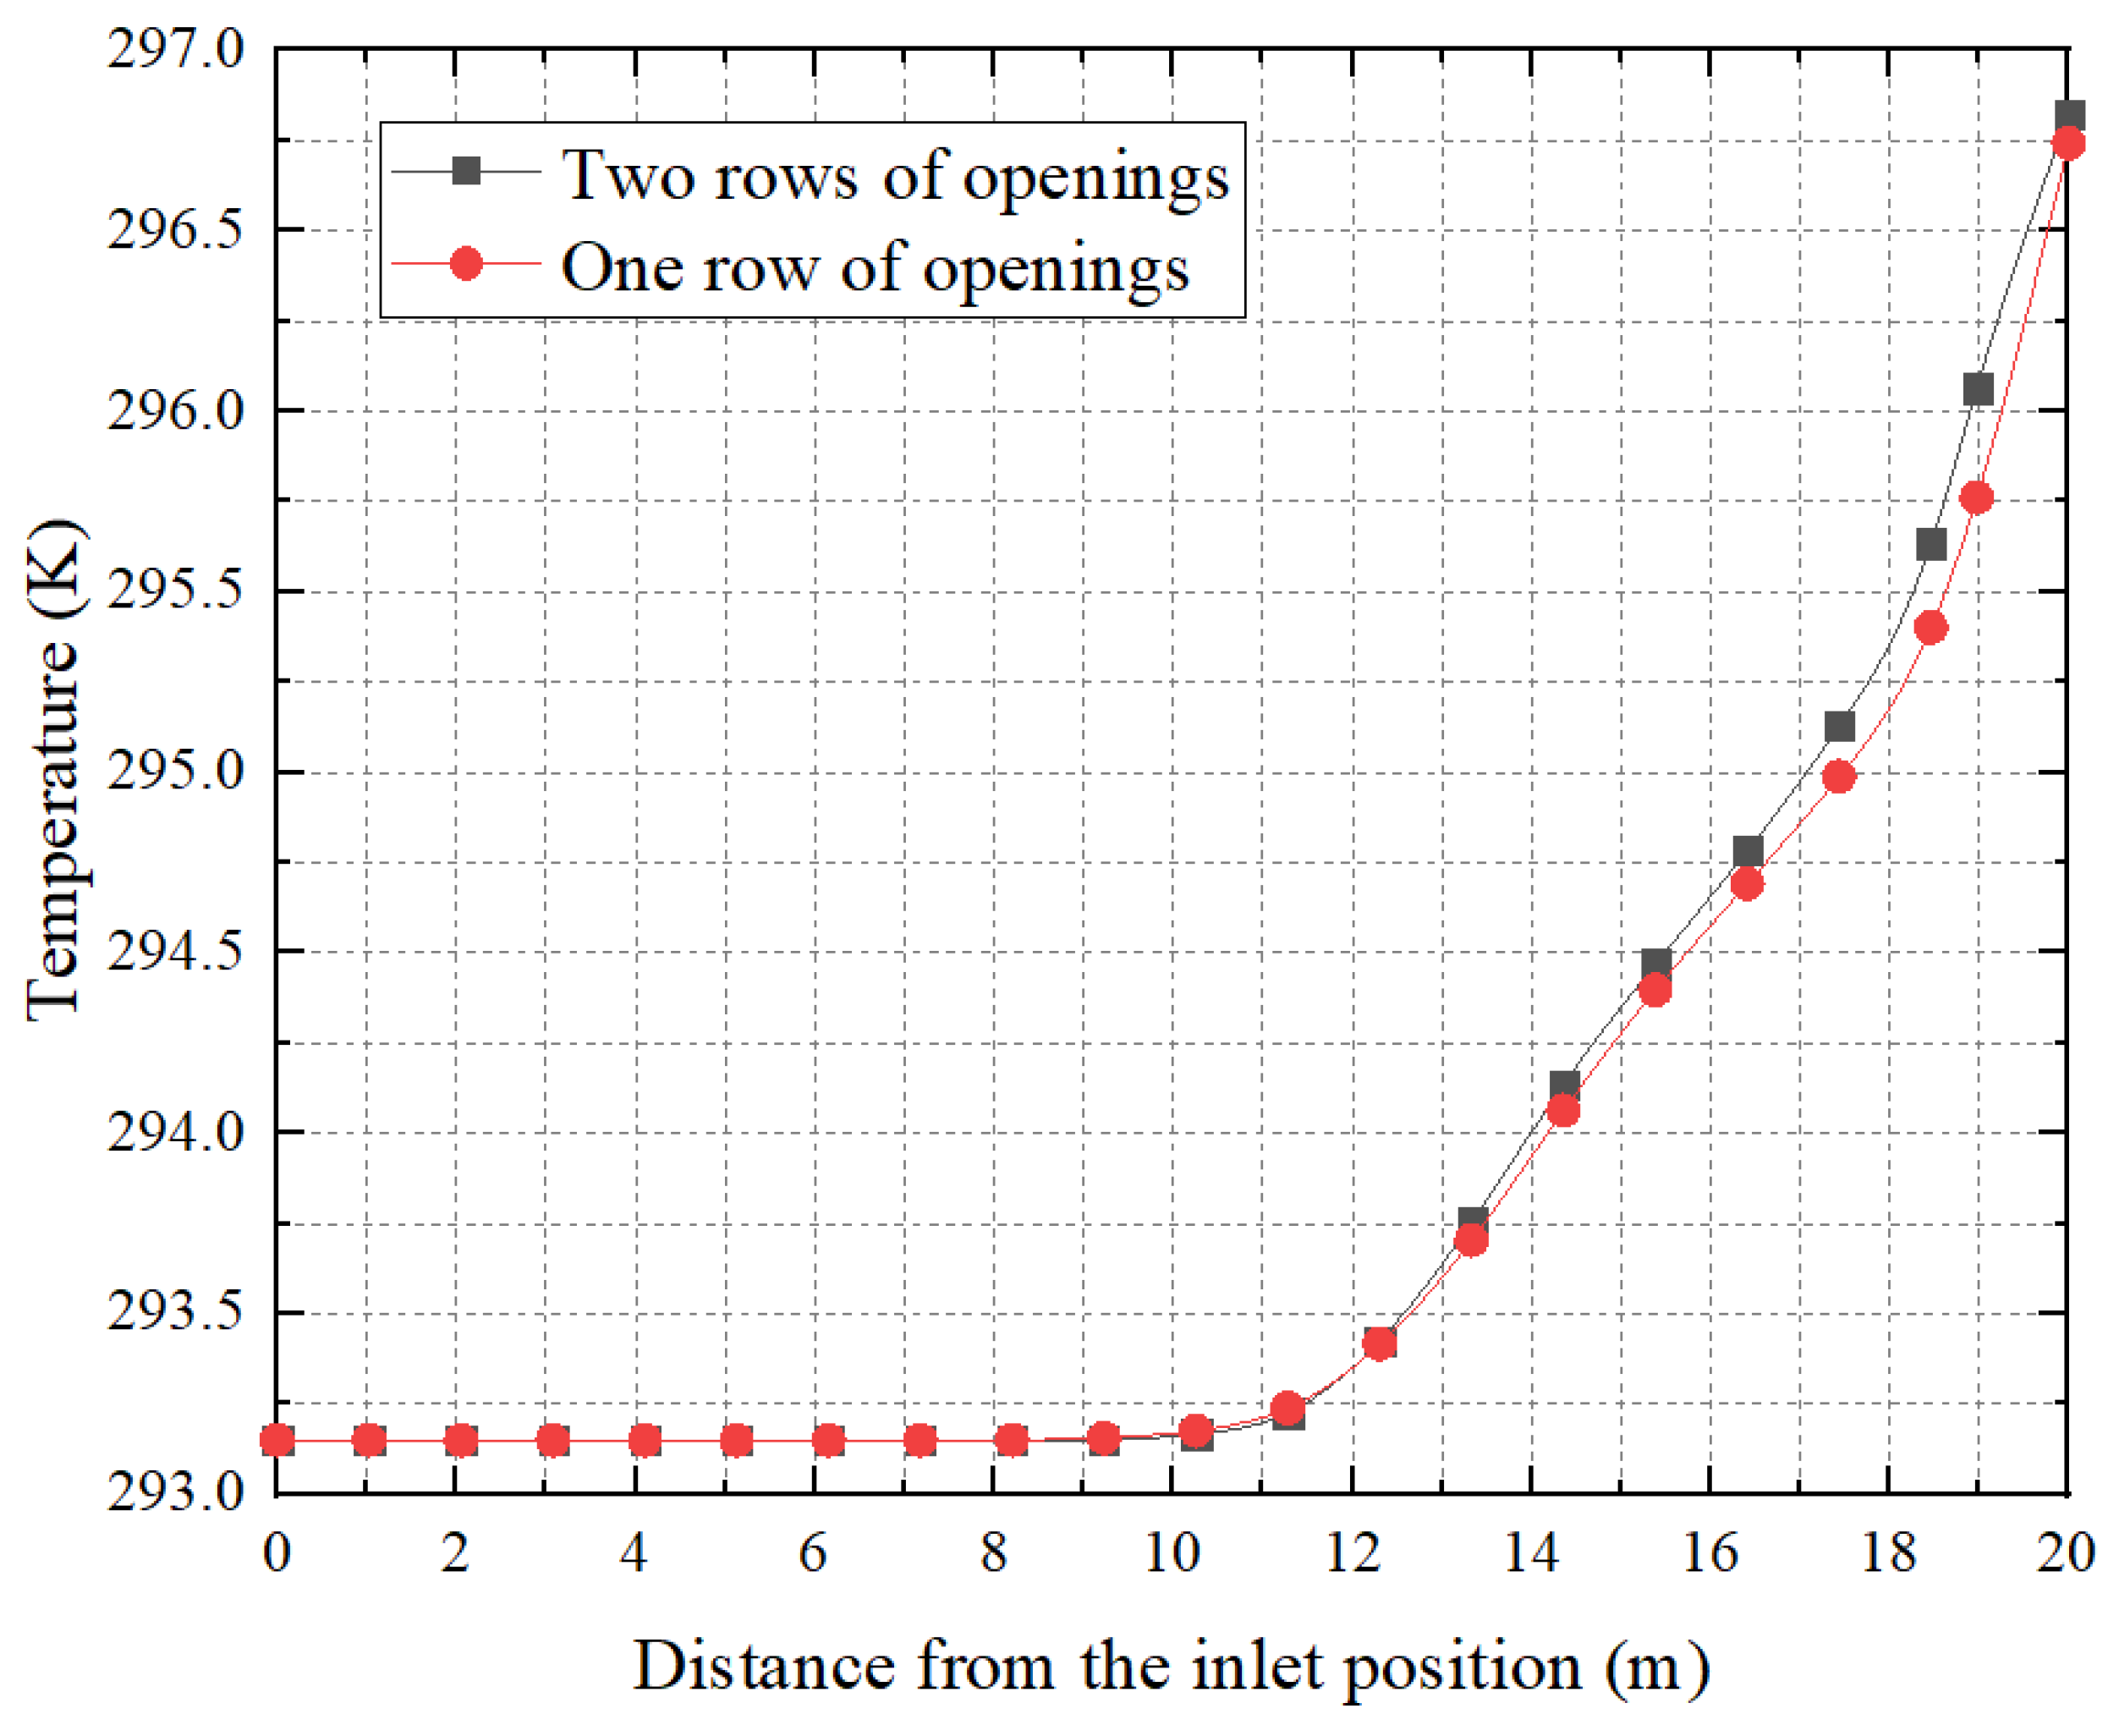
Figure 16 shows the central temperature inside the FADS tubes with one row of open holes and with two rows of open holes, both having the same number of open holes. As shown in the figure, the temperature inside both FADS tubes remains unchanged for the first 12 m. Then the temperature rise inside the duct with two rows of open holes becomes somewhat greater than in the duct with one row of open holes, and the temperature difference increases progressively, with the maximum difference exceeding 0.25 K. During the first 12 m, the flow velocity is relatively high, resulting in a small temperature rise. As a result, the temperature rise inside the two FADS tubes is nearly identical. However, beyond 12 m, the velocity decreases gradually, and the rate of temperature rise becomes greater. Additionally, the wind velocity inside the FADS ducts with one row of open holes is always higher than that of the FADS with two rows of open holes, resulting in a smaller temperature rise for the former than the latter. Therefore, it can be concluded that in situations with the same number of openings, FADS with more rows of openings result in a higher temperature rise inside the tube.

4.3. Different Shapes of FADS Internal Flow Fields

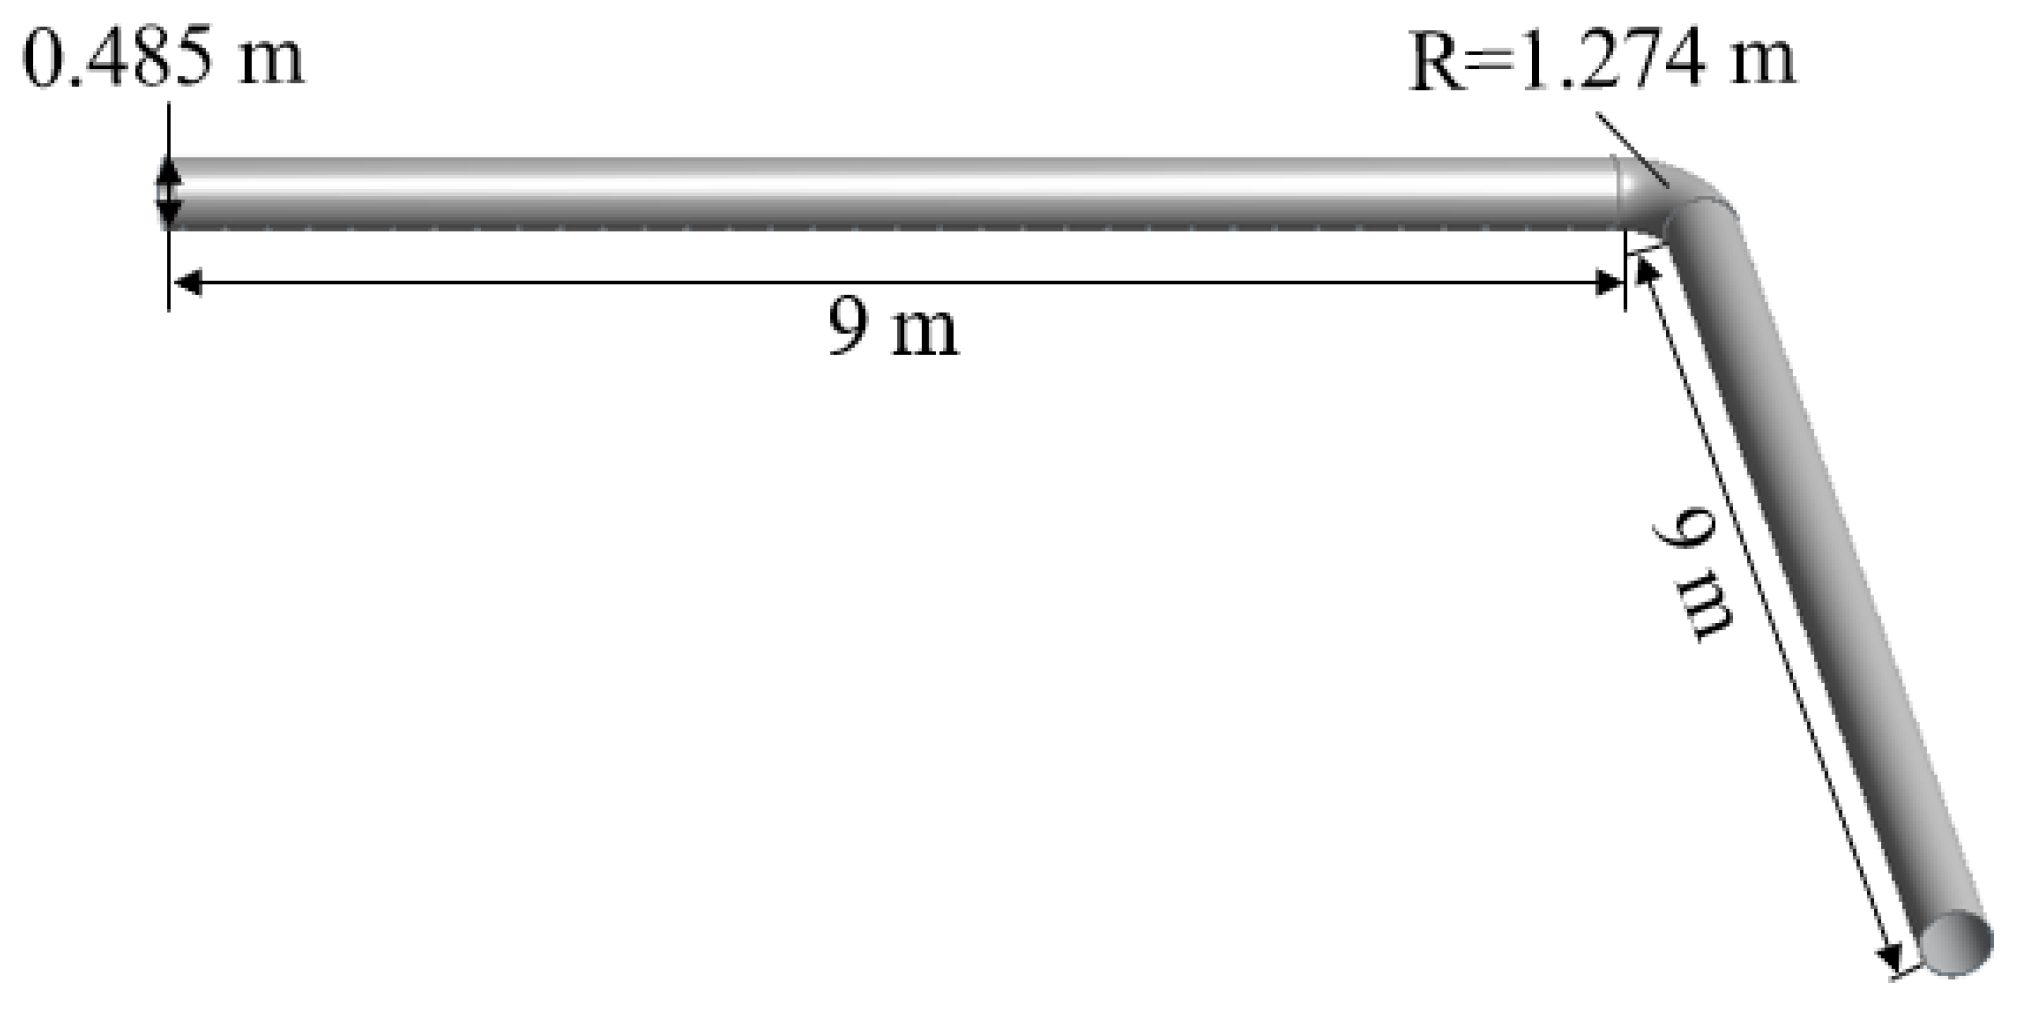
This section investigates the internal flow velocity and temperature variations of different FADS shapes. Three different FADS shapes, denoted as “1”, “L”, and “U”, are commonly used in applications, as illustrated in Figure 17, Figure 18 and Figure 19. The number of openings for each FADS is 72, the opening spacing is consistent at 0.276 m, the opening diameter is 3.302 mm, and the openings are arranged in a single row.

4.3.1. Flow Field Characteristics

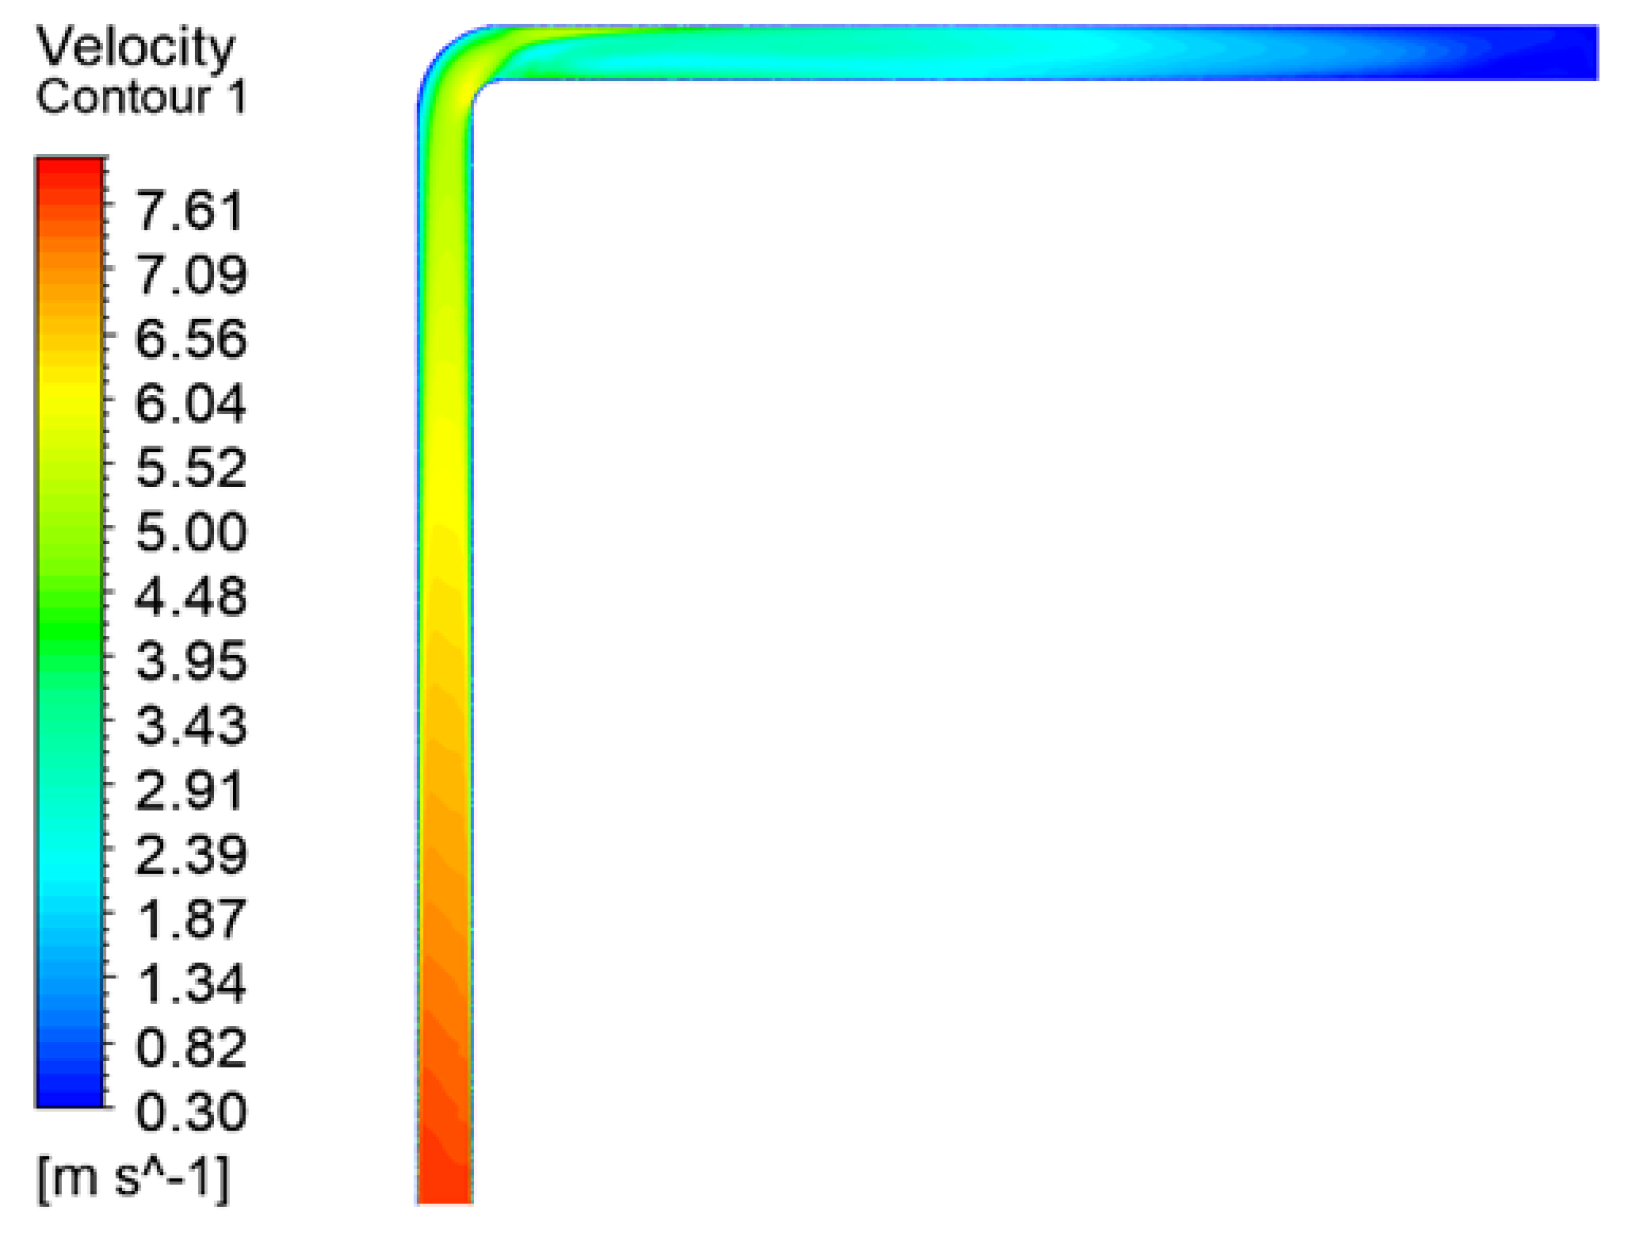
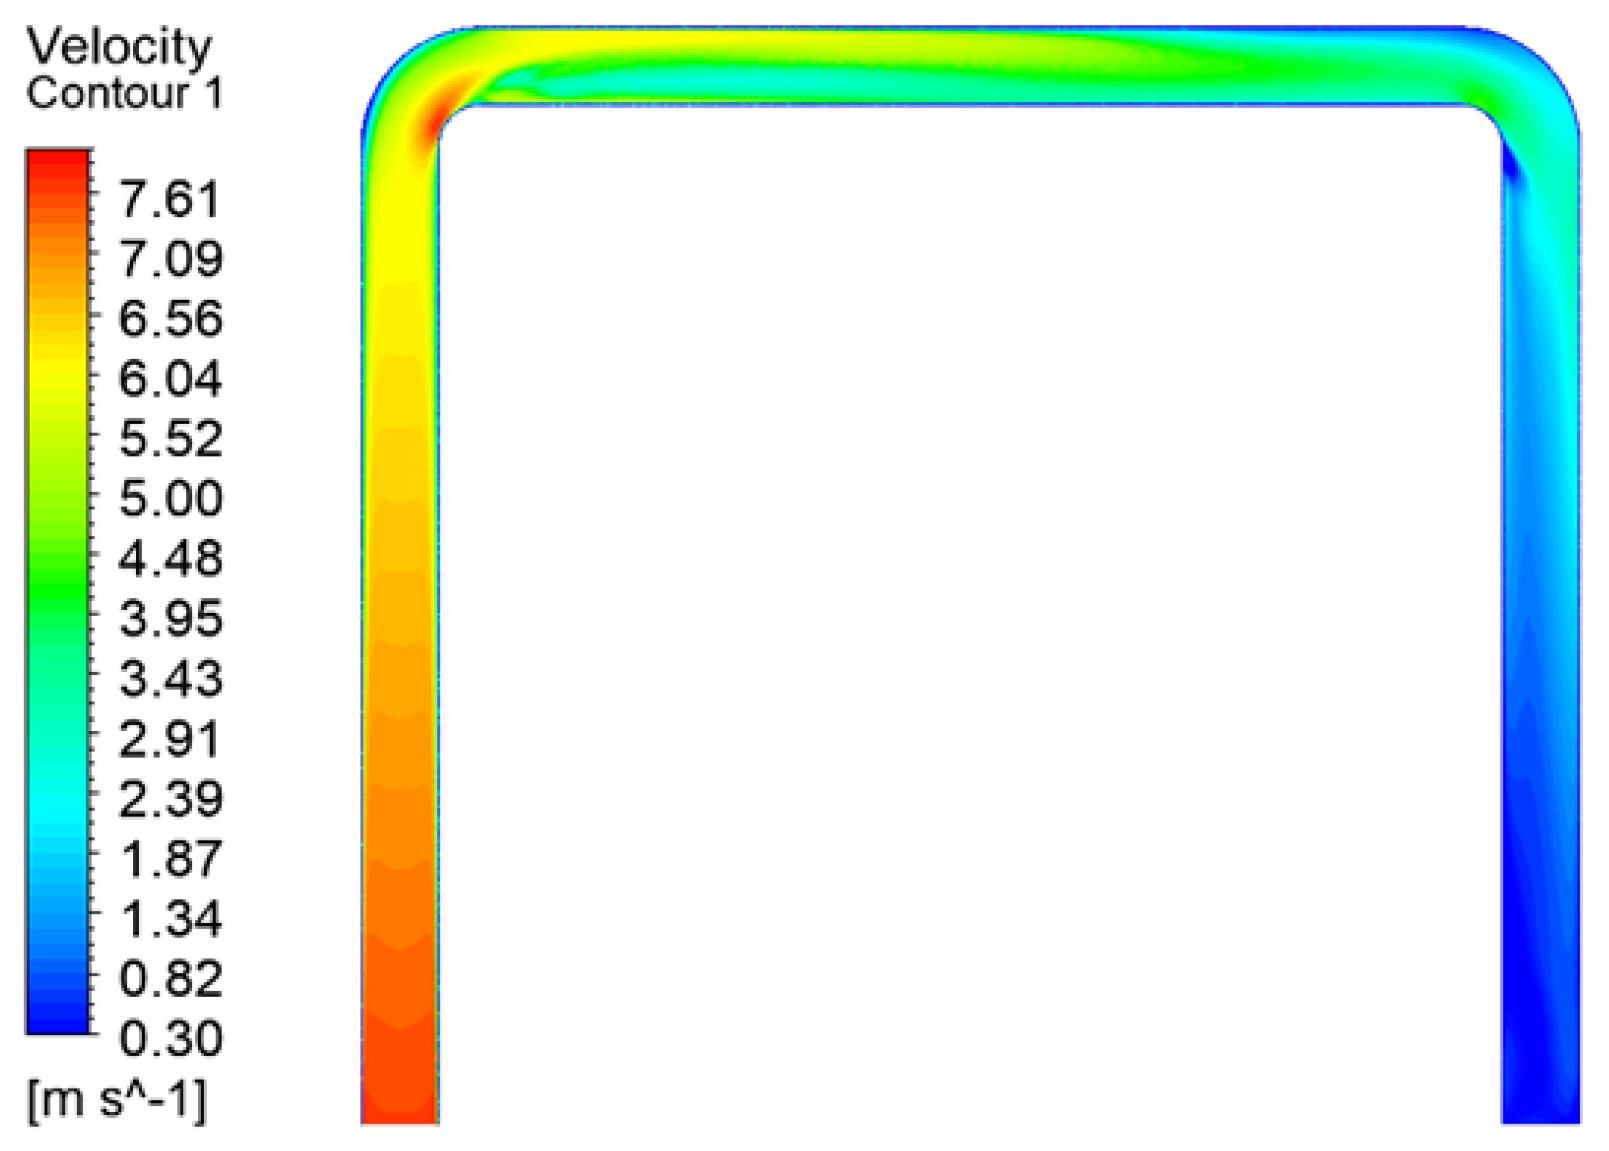
Figure 20 shows a velocity cloud diagram of the “1”-shaped FADS. It can be observed that the velocity inside the “1”-shaped FADS is relatively uniform. Except for the tail, the flow velocity inside the tube is distributed symmetrically along the centerline. The turbulence in the tail airflow caused by the end closure explains the asymmetry at the tail end. Figure 21 shows that the velocity inside the “L”-shaped FADS decreases uniformly before the elbow of the duct and changes significantly at the elbow. The velocity on the outside of the elbow decreases rapidly, while the velocity on the inside becomes larger. The velocity decreases rapidly after passing the elbow and then decreases uniformly and slowly. Figure 22 shows that the flow velocity inside the “U”-shaped FADS decreases uniformly before the first duct elbow. At the elbow, the outer speed decreases rapidly and the inner speed increases. The speed decreases after passing through the elbow, but the upper part of the middle section of the duct decreases slowly, while the lower part decreases rapidly at first and then decreases slowly. Beyond the second elbow, the speed of the outer side slowly decreases, while the inner side first rapidly decreases and then increases. The speed of the central position inside the duct after passing the second elbow is less than that on the two sides, after which the speed decreases evenly and slowly.
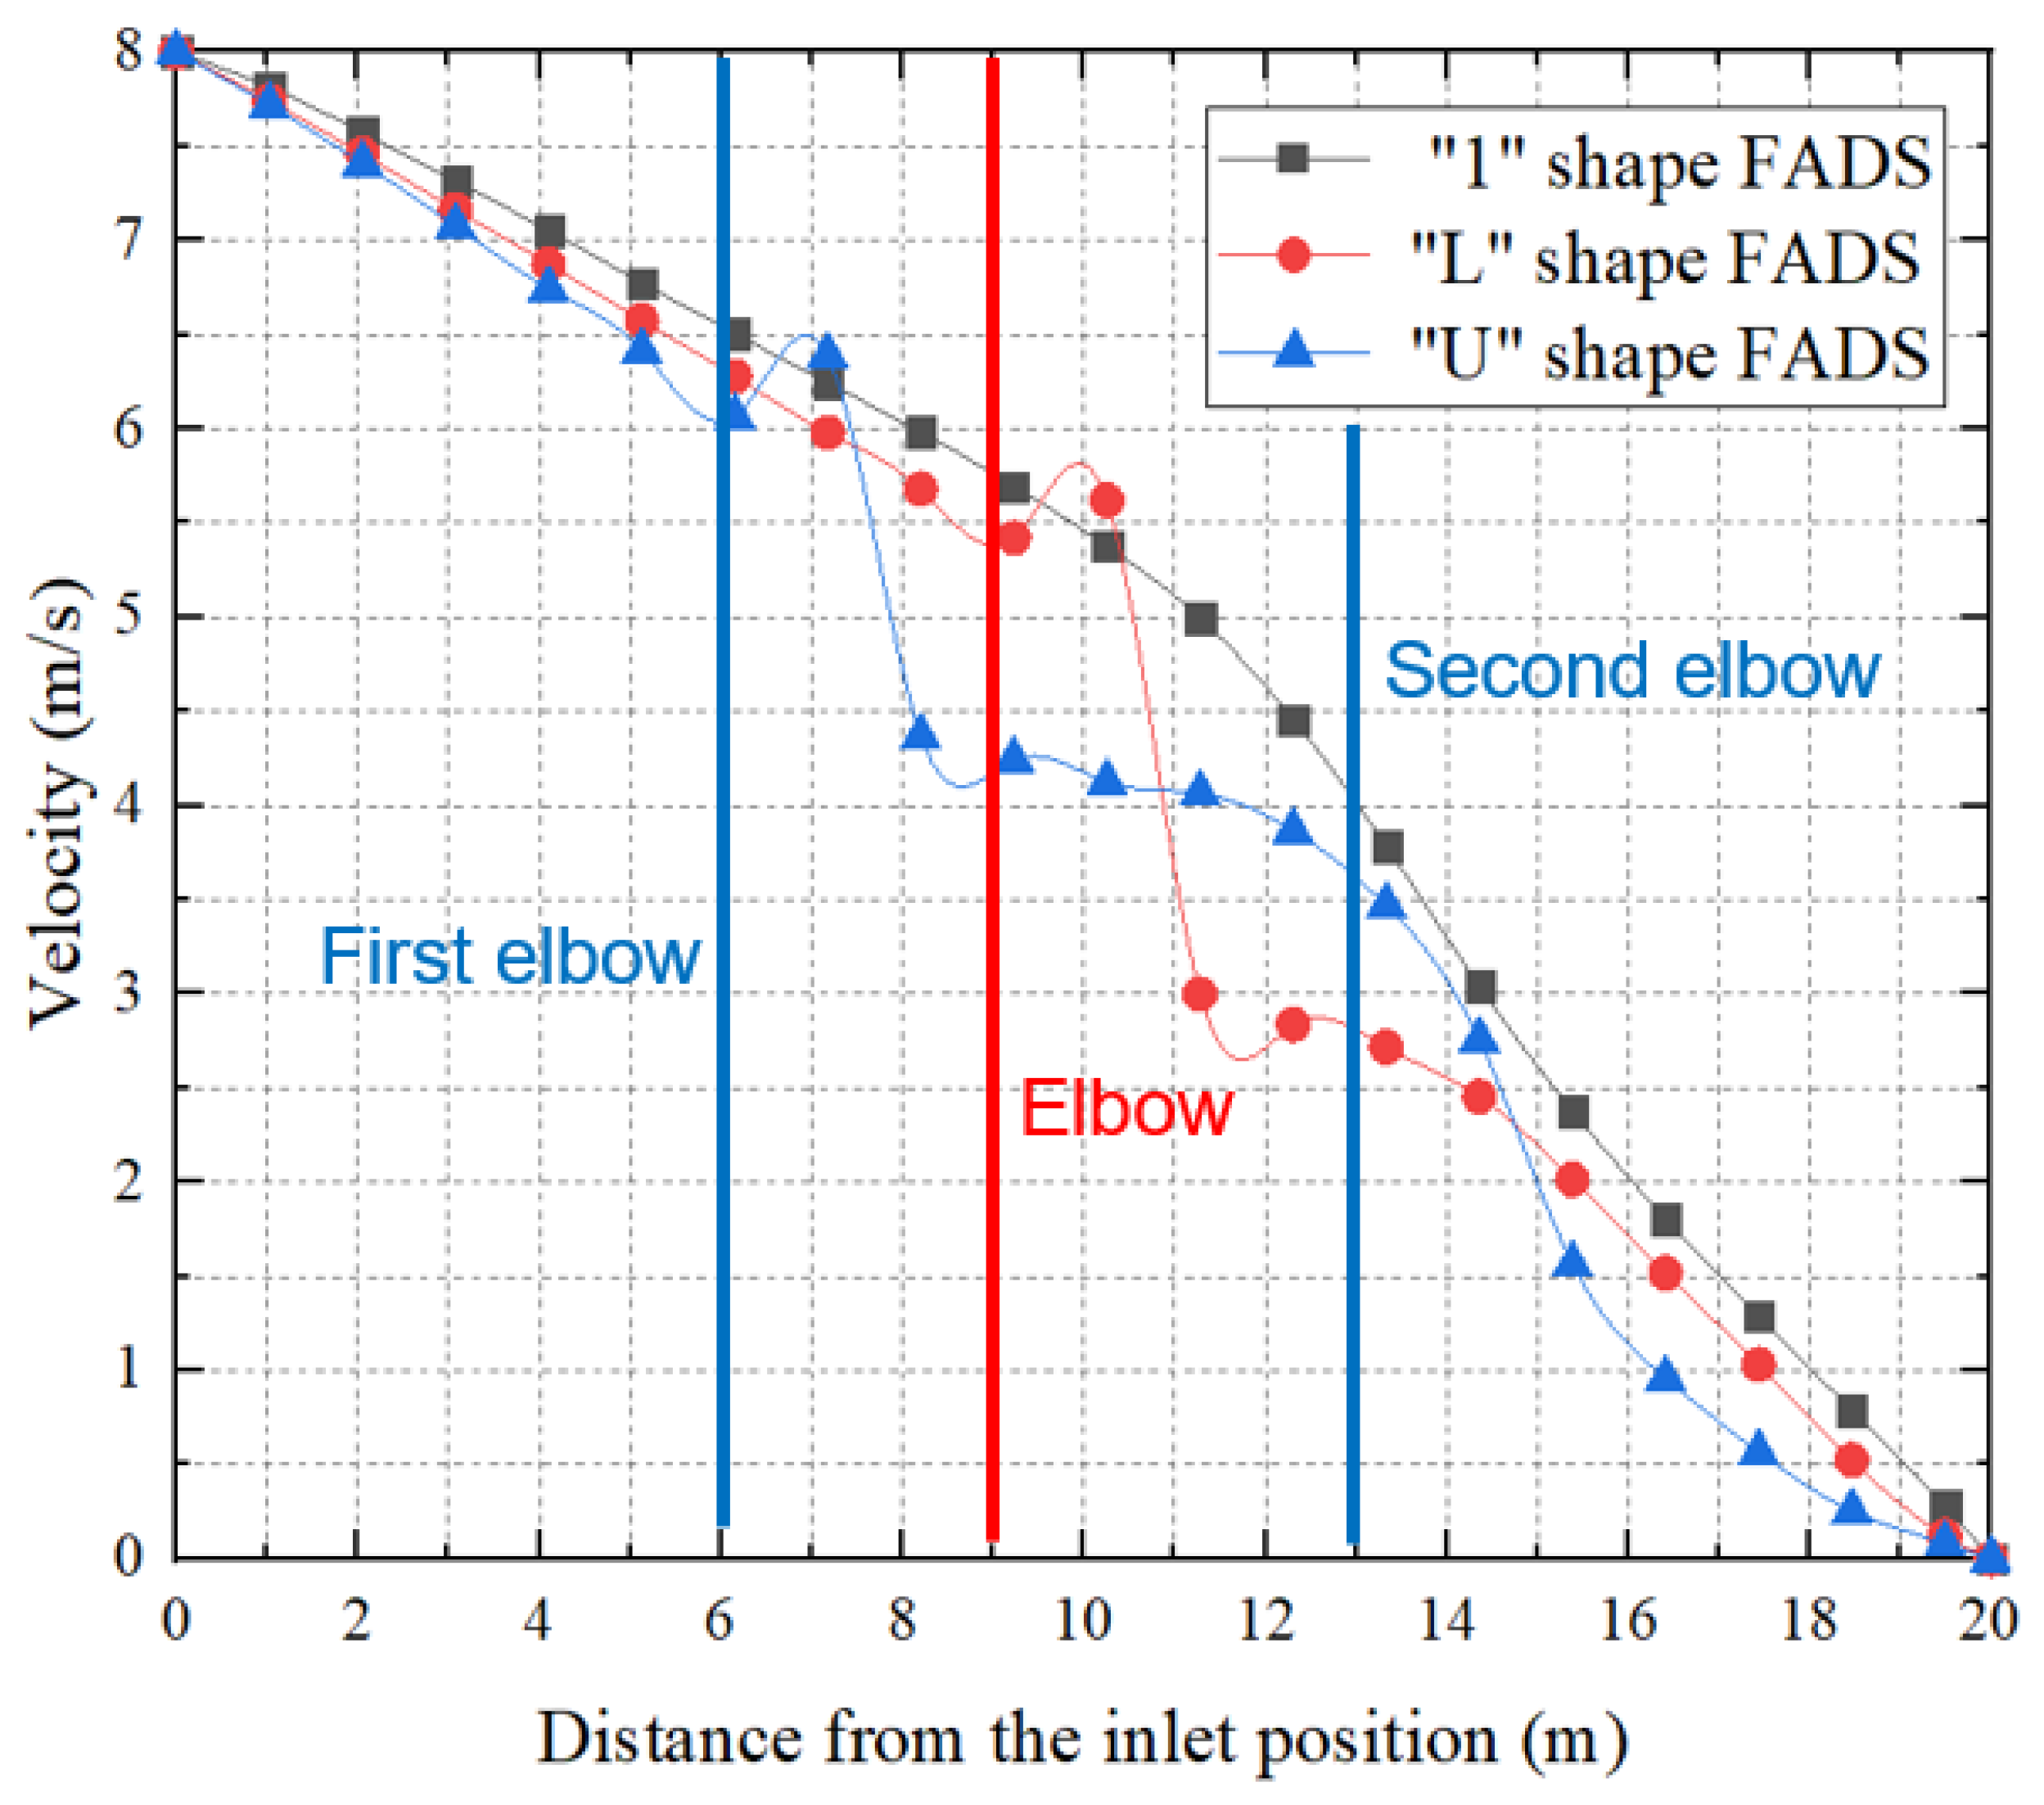
Figure 23 provides a comparison of the central velocity inside FADS tubes with three different shapes: “1”, “L”, and “U”. As the graphs show, the wind speed inside all three FADS tubes gradually decreases from 8 m/s. The “1”-shaped FADS experience the slowest decrease in speed, followed by the “L”-shaped FADS, while the “U”-shaped FADS experience the fastest decrease in speed. The speed of the “U”-shaped FADS increases to about 6.4 m/s at the first duct elbow, where it exceeds the speed of the other two FADS. However, it then sharply decreases to about 4.4 m/s, becoming the lowest speed of the three ducts, before gradually decreasing again. On the other hand, the speed of the “U”-shaped FADS increases to about 6.4 m/s at the first duct elbow, overtaking the speed of the other two FADS. The speed of the “L”-shaped FADS increases further to about 5.6 m/s at the elbow, becoming the highest wind speed of the three ducts. However, it then sharply decreases to about 3 m/s, becoming the lowest wind speed of the three, before gradually decreasing again. Finally, the “U”-shaped FADS experiences a rapid reduction in speed after the second duct elbow, and it starts becoming the lowest of the three at 14.1 m. Subsequently, the speed of all three FADSs uniformly and gradually declines to zero.

4.3.2. Temperature Field Characteristics

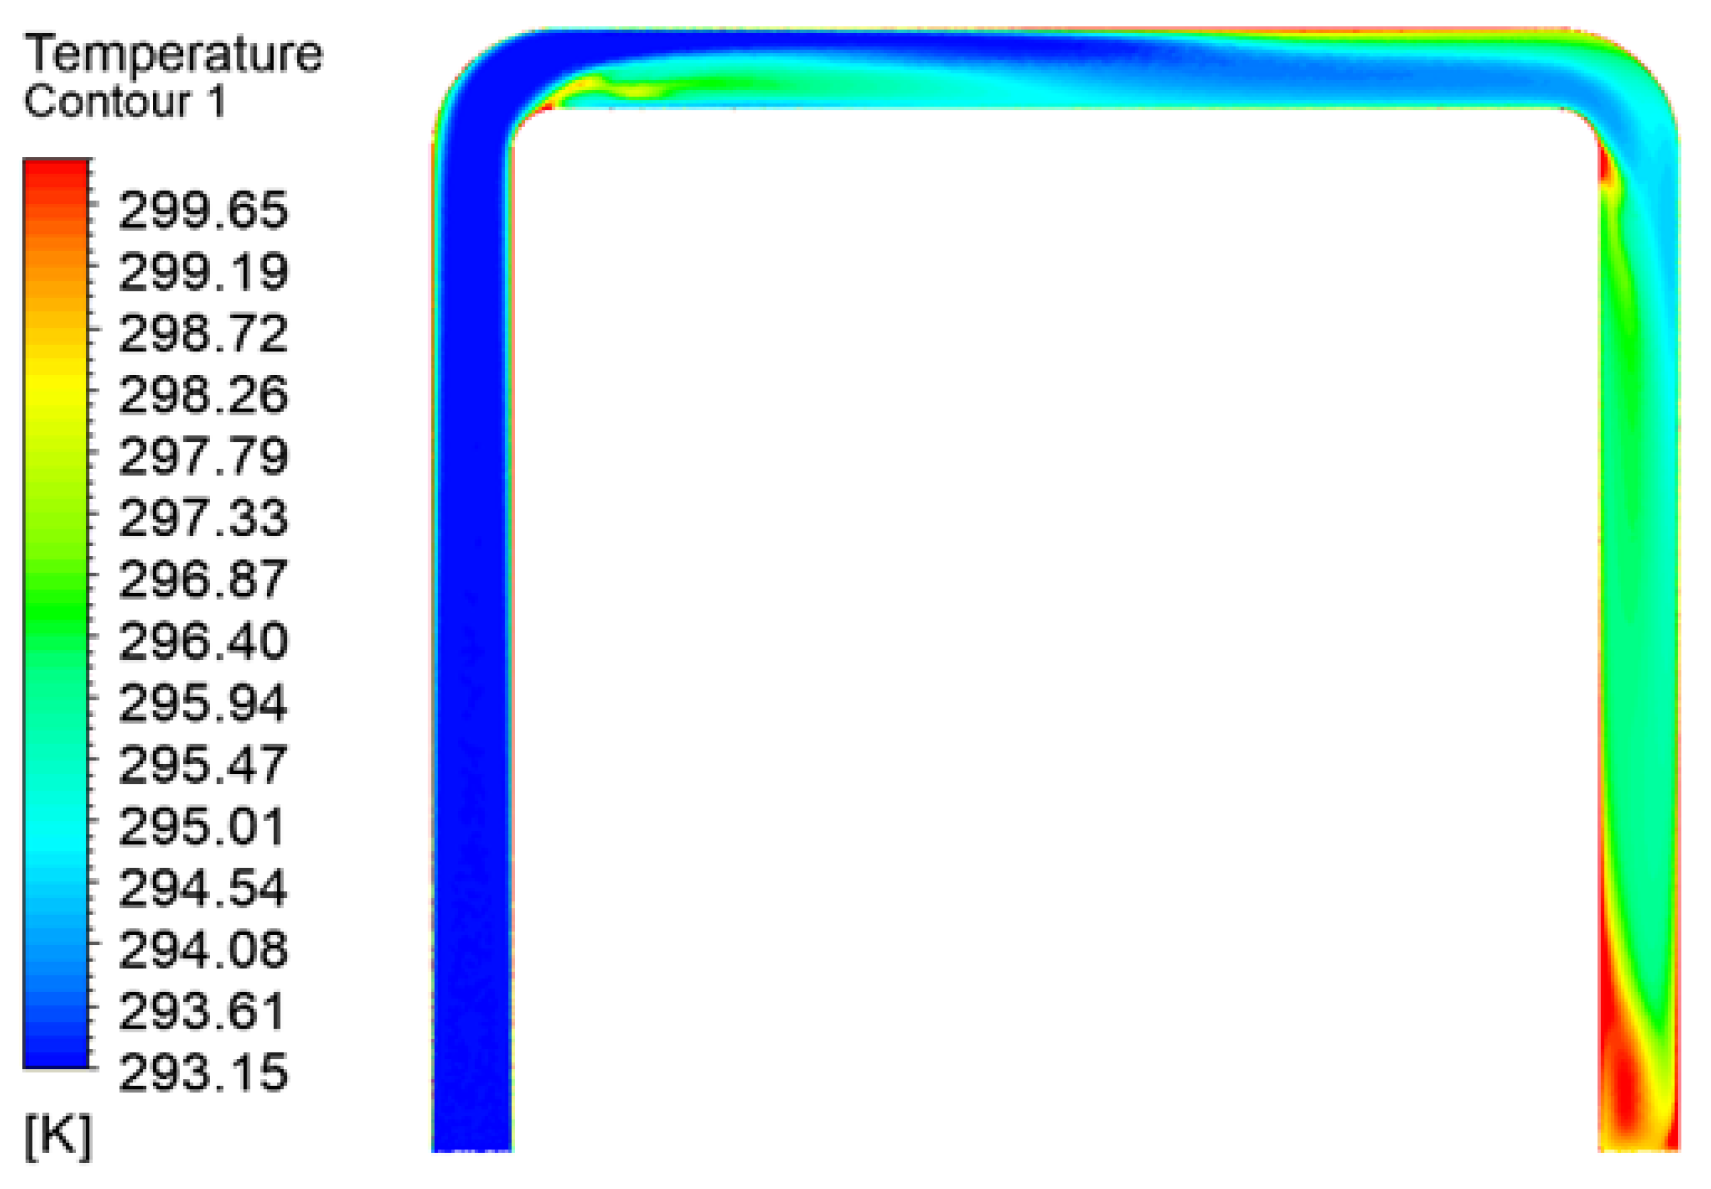
Figure 24 displays the temperature variation cloud diagram of the “1”-shaped FADS. Its internal temperature increases gradually along the axial direction, with a small temperature change at the front and a significant temperature rise on the outer sides of the middle section. The temperature distribution is roughly symmetrical with respect to the center, except for the tail, where the temperature rise is less symmetrical, with the upper part showing a larger increase than the lower part. This asymmetry is due to the turbulence caused by the backflow at the end of the closed duct. Figure 25 shows that the temperature of the “L”-shaped FADS does not change significantly before the elbow of the duct, with only a small temperature rise observed on the outside. At the elbow, there is a large temperature rise on the outside of the elbow; after passing the elbow, the temperature rise is stratified, with no change on the upper side and a rapid rise followed by a slow decline on the lower side. Subsequently, the temperature rises slowly and uniformly before increasing and decreasing again at the end due to reflux. In Figure 26, it is observed that the temperature of the “U”-shaped FADS increases slightly on the outer side before the first duct elbow, but there is no significant temperature change. After passing the first elbow, the airflow is disturbed and oscillation occurs, with the temperature on the upper side remaining unchanged while the temperature on the lower side rises rapidly and then falls slowly. At the second elbow, a stratified temperature rise is observed due to airflow turbulence, with the temperature inside the elbow first rising and then falling and the opposite change observed on the outside. The temperature distribution gradually becomes uniform, and the temperature rises slowly before increasing and decreasing again on the left and right sides due to reflux in the tail section.
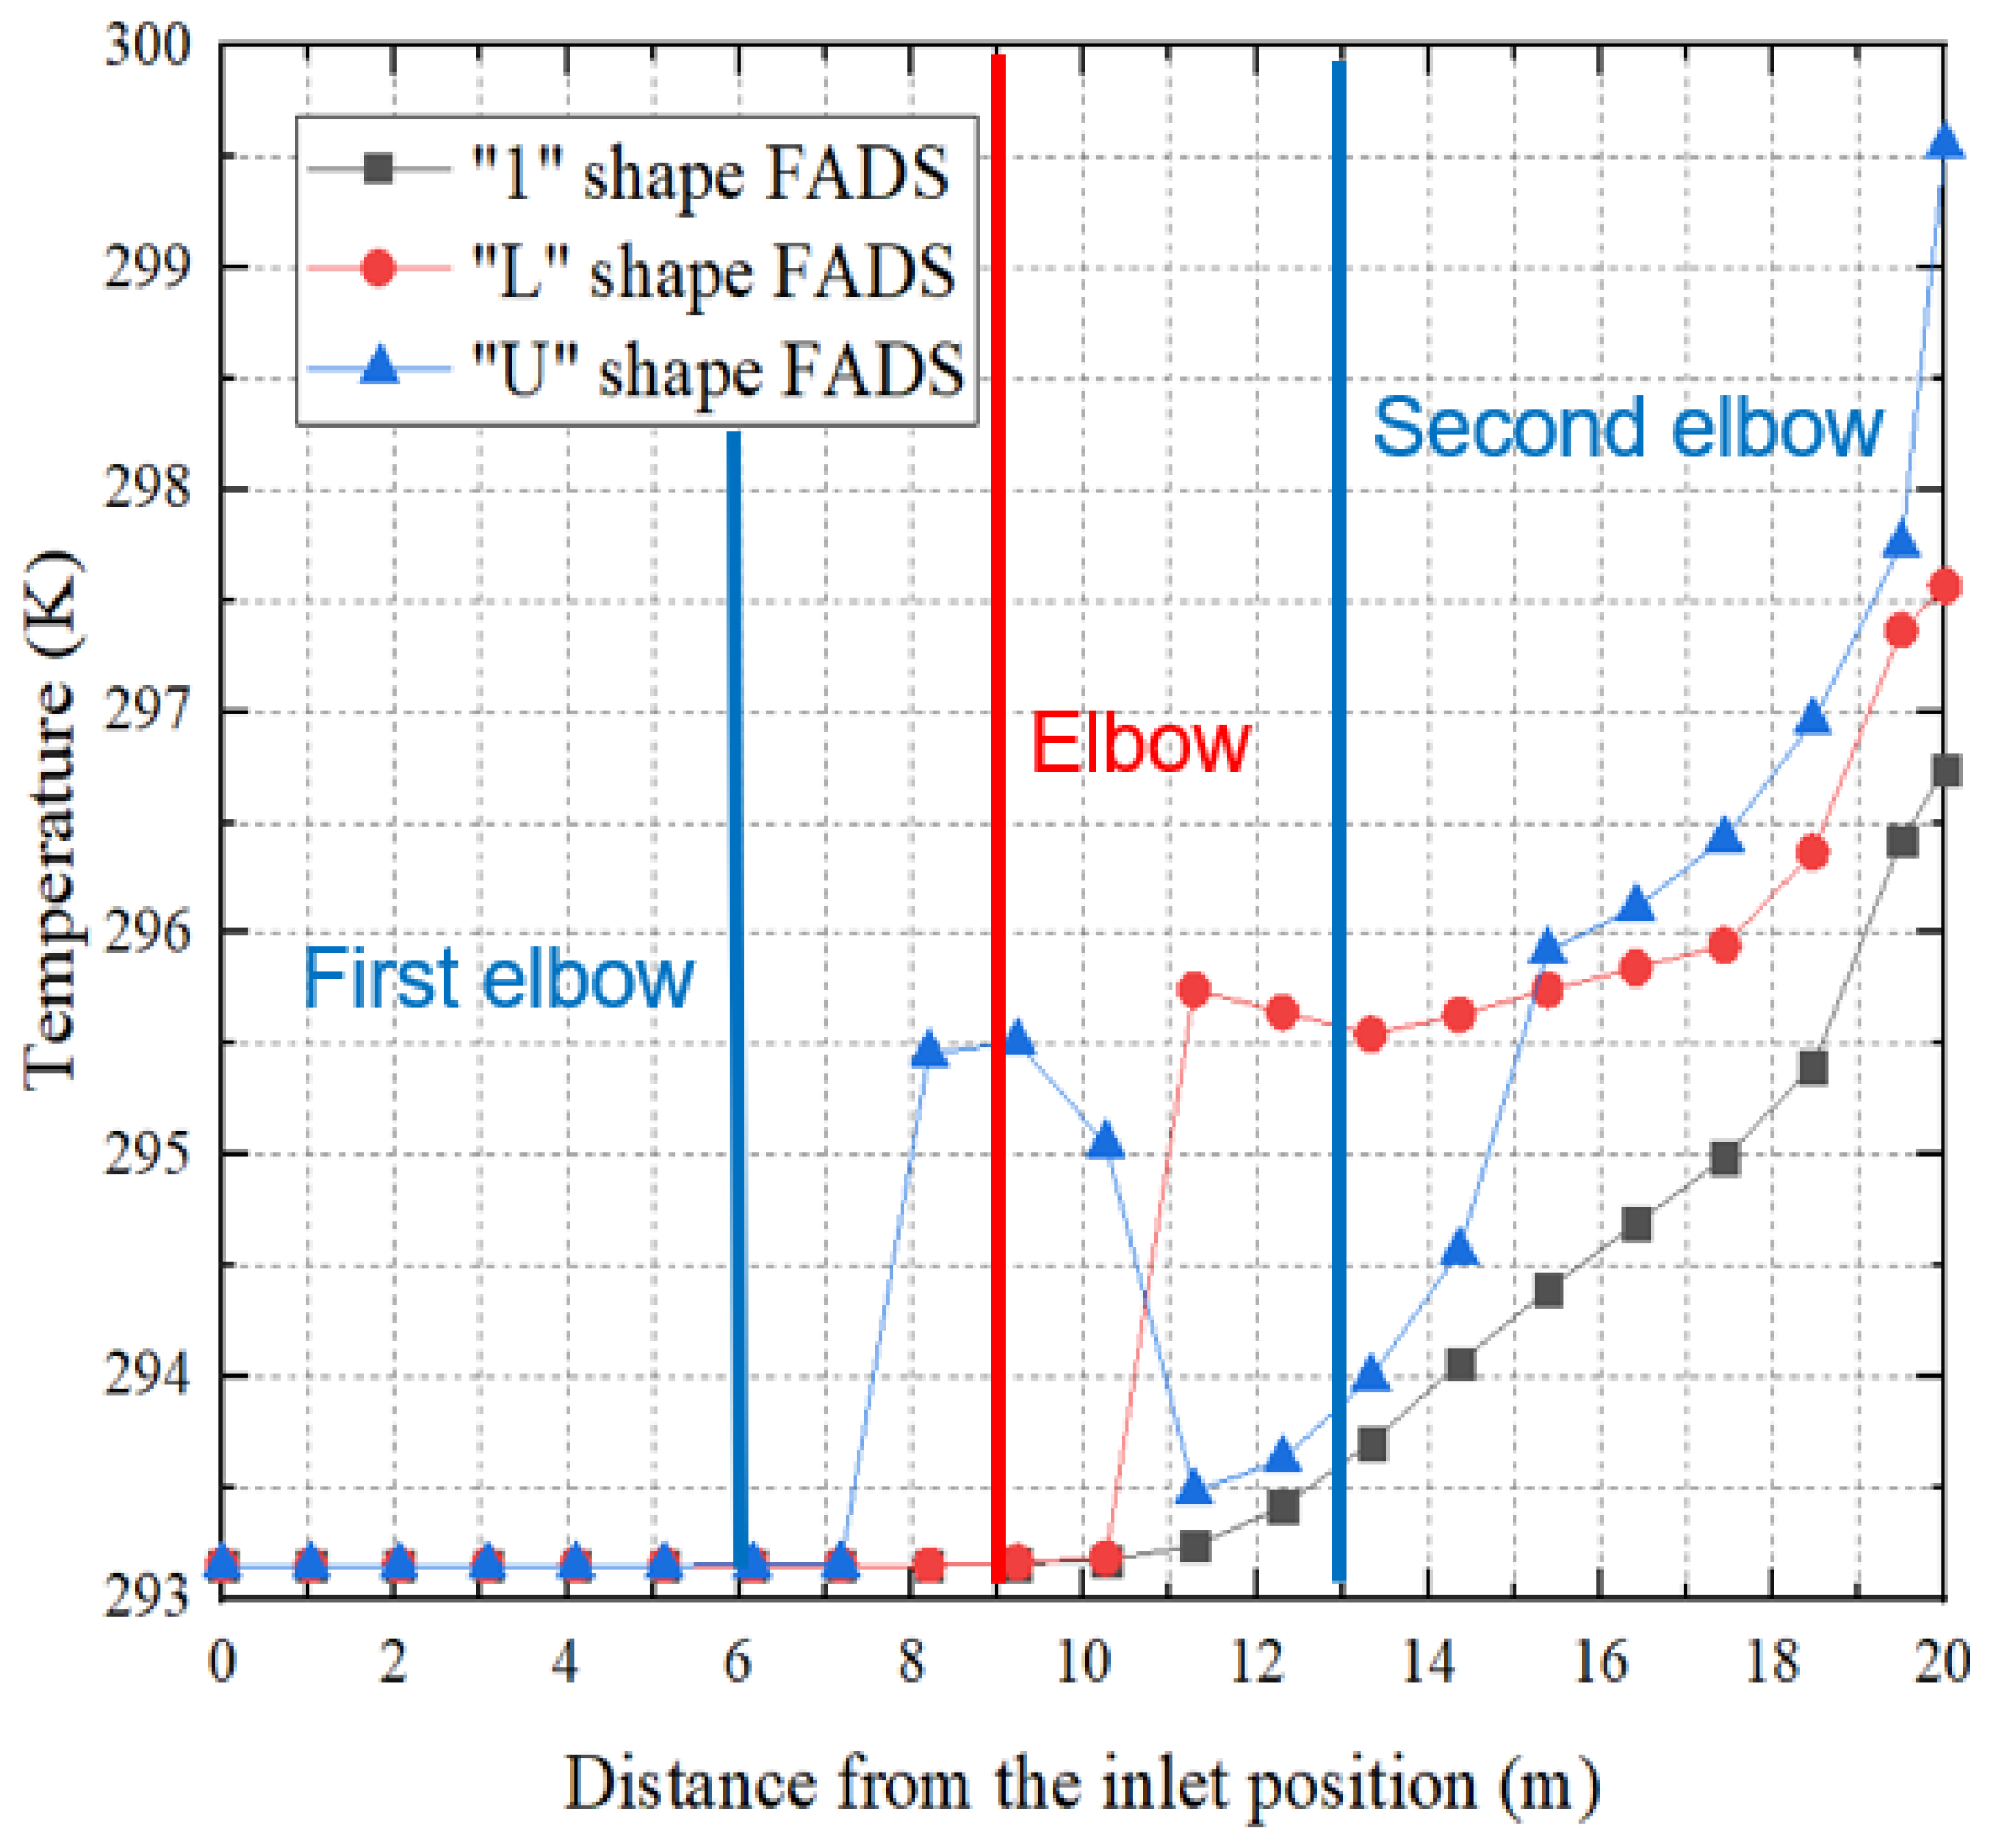
Figure 27 shows a comparison of the central temperature changes inside the FADS ducts with three different shapes: “1”, “L”, and “U”. The temperature remains unchanged for the first 7 m. The “U”-shaped FADS experiences a sudden and rapid increase in temperature of about 2.3 K at the first duct elbow due to the rapid reduction of local resistance speed. This temperature rise exceeds that of the other two FADS, but it then rapidly declines by 2 K, while the temperature in the “1”-shaped FADS only begins to rise slowly at this point. On the other hand, the “L”-shaped FADS experiences a sudden and rapid temperature rise of about 2.5 K at the elbow due to local resistance to the rapid decay of wind speed, which is higher than in the other two FADS, and the temperature rises slowly after maintaining this temperature for some distance. The temperature of the “U”-shaped FADS starts to increase rapidly after the middle and then slows down at the elbow of the second duct before increasing rapidly again, surpassing that of the “L”-shaped FADS to become the highest of the three. Finally, the temperature rise of “1”-shaped FADS is about 3.6 K, that of “L”-shaped FADS is about 4.5 K, and that of “U”-shaped FADS is about 6.5 K.
After analyzing the temperature changes inside FADS ducts of different shapes, it becomes evident that the local resistance at duct elbows is relatively large, which causes a large pressure loss, resulting in a significant drop in the airflow speed and a rapid increase in temperature after the airflow passes through the elbow. Additionally, the airflow inside the duct becomes more disordered, resulting in non-uniform air speed and temperature. This situation intensifies at each duct elbow, making it preferable to minimize the use of elbows and to use straight air ducts wherever possible.

5. Conclusions

In this work, an equivalent discounting method is proposed to improve the simulation accuracy of FADS by providing a high-quality wall mesh. The reliability of this method has been verified experimentally. The flow and temperature characteristics of FADS with varying shapes and open configurations are investigated using this method. Specifically, the effects of four different opening configurations in rows 1, 2, 3, and 4, as well as the effects of two different openings on internal velocity and temperature rise, are examined. Additionally, the temperature field changes in three different FADS shapes, namely “1,” “L,” and “U,” are analyzed. The main findings of this study are as follows:
(1)
The long FADS exhibits a more rapid decline in internal flow velocity as well as a greater temperature rise in the middle and rear sections. The temperature rise inside the duct is influenced by the air velocity, with a higher number of rows of openings exacerbating the decay of flow velocity and resulting in an increased temperature rise. Specifically, the FADS with four rows of openings experienced an internal temperature increase of approximately 3.9 K, while FADS with other configurations of openings saw an increase of about 3.5 K. Hence, in the design of long-distance air supply systems, it is advisable to avoid an excessive number of openings in order to minimize inefficient air supply;
(2)
The arrangement of openings in the FADS has an influence on the flow velocity and temperature rise inside the tube. When more rows of openings are used or when the openings are scattered, it leads to a faster decay in internal flow velocity and a greater temperature rise. However, these changes are not significant. On the other hand, a more concentrated opening configuration can increase the internal wind speed and reduce the temperature rise to some extent, but it may also impact the air supply. Therefore, the choice of opening configuration should be based on the specific requirements and demands of the application;
(3)
The presence of elbows in the FADS has a significant impact on local resistance, speed decay, and temperature rise. The “1”-shaped FADS exhibits a temperature rise of approximately 3.6 K, the “L”-shaped FADS shows a temperature rise of around 4.5 K, and the “U”-shaped FADS experiences a temperature rise of about 6.5 K. The introduction of elbows disrupts the airflow inside the duct, leading to non-uniform air speed and temperature distribution. To mitigate these effects, it is recommended to minimize the number of elbows and prioritize the use of straight air ducts.

Author Contributions

Conceptualization, Y.W.; Validation, Y.C.; Writing—original draft, K.Y.; Writing—review & editing, T.S. and M.H.A.; Visualization, Z.Y.; Supervision, T.M. All authors have read and agreed to the published version of the manuscript.

Funding

This research was supported by the National Natural Science Foundation of China (Grant No. 52278123).

Data Availability Statement

Not applicable.

Acknowledgments

The authors of this paper are very grateful to Yanping Yuan for his contribution.

Conflicts of Interest

The authors declare no conflict of interest.

References

  1. Antelmi, M.; Turrin, F.; Zille, A.; Fedrizzi, R. A New Type in TRNSYS 18 for Simulation of Borehole Heat Exchangers Affected by Different Groundwater Flow Velocities. Energies 2023, 16, 1288. [Google Scholar] [CrossRef]
  2. Chen, Y.; Lin, G.; Crowe, E.; Granderson, J. Development of a Unified Taxonomy for HVAC System Faults. Energies 2021, 14, 5581. [Google Scholar] [CrossRef]
  3. Asim, N.; Badiei, M.; Mohammad, M.; Razali, H.; Rajabi, A.; Chin Haw, L.; Jameelah Ghazali, M. Sustainability of Heating, Ventilation and Air-Conditioning (HVAC) Systems in Buildings-An Overview. Int. J. Environ. Res. Public Health 2022, 19, 1016. [Google Scholar] [CrossRef] [PubMed]
  4. Agafonova, V.V.; Skibin, A.P.; Volkov, V.Y. Modeling of Air Distribution in an Office Building Using Microperforated Textile Air Duct. IOP Conf. Ser. Mater. Sci. Eng. 2021, 1079, 052077. [Google Scholar] [CrossRef]
  5. Nielsen, P.V.; Topp, C.; Sønnichsen, M.; Andersen, H. Air distribution in rooms generated by a textile terminal-comparison with mixing and displacement ventilation. In Proceedings of the Winter Meeting of the American-Society-of-Heating, Refrigerating and Air-Conditioning Engineers, Orlando, FL, USA, 5–9 February 2005; American Society of Heating, Refrigeration and Air Conditioning Engineers: Atlanta, GA, USA, 2005. [Google Scholar]
  6. Chen, F.; Chen, H.; Xie, J.; Shu, Z.; Mao, J. Air distribution in room ventilated by fabric air dispersion system. Build. Environ. 2011, 46, 2121–2129. [Google Scholar] [CrossRef]
  7. Wang, X.; Li, A. Experimental Investigation of Airflow Pattern of Fabric Air Dispersion System. In Proceedings of the 8th International Symposium on Heating, Ventilation, and Air Conditioning (ISHVAC), Xi’an, China, 19–21 October 2013; Springer: Berlin/Heidelberg, Germany, 2014. [Google Scholar]
  8. Wang, X.L.; Li, A.G. Airflow characteristics generated by fabric air dispersion ventilation. Indoor Built Environ. 2015, 24, 1059–1068. [Google Scholar] [CrossRef]
  9. Leverette, J.; Gebke, K.; Idem, S. Pressure and velocity variation in a fabric air dispersion system. HVAC&R Res. 2014, 20, 862–874. [Google Scholar]
  10. Huang, C.; Wu, C.W.; Long, C.Y.; Li, H. Experimental Research of Air Supply Characteristics of Ejection-permeation Fabric Air Dispersion System in a Large Space Building. In Proceedings of the 10th International Symposium on Heating, Ventilation and Air Conditioning (ISHVAC), Jinan, China, 19–22 October 2017; Elsevier Science: Amsterdam, The Netherlands, 2017. [Google Scholar]
  11. Nielsen, P.V.; Hyldgaard, C.E.; Melikov, A.; Andersen, H.; Soennichsen, M. Personal exposure between people in a room ventilated by textile terminals—With and without personalized ventilation. In Proceedings of the 10th International Conference on Indoor Air Quality and Climate (Indoor Air 2005), Beijing, China, 4–9 September 2005; Tsinghua University Press: Beijing, China, 2005. [Google Scholar]
  12. Fontanini, A.; Olsen, M.G.; Ganapathysubramanian, B. Thermal comparison between ceiling diffusers and fabric ductwork diffusers for green buildings. Energy Build. 2011, 43, 2973–2987. [Google Scholar] [CrossRef]
  13. Xiao, B.Q.; Wang, W.; Zhang, X.; Long, G.; Fan, J.; Chen, H.; Deng, L. A novel fractal solution for permeability and Kozeny-Carman constant of fibrous porous media made up of solid particles and porous fibers. Powder Technol. 2019, 349, 92–98. [Google Scholar] [CrossRef]
  14. Lai, B.Z.; Wang, Z.L.; Wang, H.; Bai, J.; Li, W.; Ming, P. Prediction of the permeability of fibrous porous structures under the full flow regimes. Phys. Fluids 2022, 34, 082117. [Google Scholar] [CrossRef]
  15. Chen, F.J.; Chen, H.X.; Xie, J.L.; Shu, Z.; Hu, Y.; Mao, J. Numerical Simulation on Air dispersion of the Fabric Air Distribution System in Pure-Penetration Mode. In Proceedings of the 6th International Symposium on Heating, Ventilating and Air Conditioning, Nanjing, China, 6–9 November 2009; Southeast University Press: Nanjing, China, 2009. [Google Scholar]
  16. Chen, F.J.; Wu, Q.Y.; Huang, D.D.; Wang, H. Indoor air flow motions caused by the fabric air dispersion system: A simplified method for CFD simulations. Indoor Built Environ. 2017, 26, 841–854. [Google Scholar] [CrossRef]
  17. Chen, F.J.; Wu, Q.Y.; Huang, D.D.; Zhang, Y.; Lu, W.; Chen, M.M. Validation of the free area method for modelling fabric air dispersion system without orifices in computational fluid dynamics simulation. Indoor Built Environ. 2018, 27, 969–982. [Google Scholar] [CrossRef]
  18. Chen, F.J.; Chen, H.X.; Xie, J.L.; Shu, Z.; Zhang, C.; Hu, Y. Characterizing airflow through fabric air dispersion system using a porous media model. Energy Build. 2011, 43, 665–670. [Google Scholar] [CrossRef]
  19. Chen, F.J.; Chen, H.X.; Wang, H.; Wang, S.; Wang, J.; Wang, X.; Qian, Z. Parametrical analysis on characteristics of airflow generated by fabric air dispersion system in penetration mode. Energy Build. 2013, 67, 365–373. [Google Scholar] [CrossRef]
  20. Chen, F.J.; Lu, W.; Wu, Q.Y.; Chen, H.; Chen, J.; Zhou, N. Simulation of Airflow Characteristics induced by Fabric Air Dispersion System with Orifices Using Direct Description Method. In Proceedings of the 10th International Symposium on Heating, Ventilation and Air Conditioning (ISHVAC), Jinan, China, 19–22 October 2017; Elsevier Science: Amsterdam, The Netherlands, 2017. [Google Scholar]
  21. Adhya, S. Air Dispersion Characteristics and Thermal Comparison of Traditional and Fabric Ductwork Using Computational Fluid Dynamics. Ph.D. Thesis, Cooper Union for the Advancement of Science and Art, Albert Nerken School of Engineering, Maurice Kanbar Graduate Institute, New York City, NY, USA, 2014. [Google Scholar]
  22. Zhao, X.; Nan, X.; Wu, Q.; Zhang, L. Ethylene distribution and ventilation strategies of apple cold storage. E3S Web Conf. 2022, 356, 01060. [Google Scholar] [CrossRef]
  23. Tominaga, Y.; Shirzadi, M. RANS CFD modeling of the flow around a thin windbreak fence with various porosities: Validation using wind tunnel measurements. J. Wind Eng. Ind. Aerodyn. 2022, 230, 105176. [Google Scholar] [CrossRef]
  24. Xing, X.Q.; Zhao, X.F.; Qin, Z.; Zhou, X.H. Numerical Simulation the Airflow Field in the Flame Retardant Cloth Ducts. In Proceedings of the 8th China International Silk Conference (ISC 2013)/4th Asian Protective Clothing Conference (APCC 2013)/Eco-Friendly Textile Dyeing and Finishing Conference, Suzhou, China, 8–10 September 2013; Trans Tech Publications Ltd.: Stafa-Zurich, Switzerland, 2013. [Google Scholar]
  25. Wellinger, P.; Uhl, P.; Weigand, B.; Rodriguez, J. Analysis of turbulence structures and the validity of the linear Boussinesq hypothesis for an infinite tube bundle. Int. J. Heat Fluid Flow 2021, 91, 108779. [Google Scholar] [CrossRef]
  26. Balhoff, M.; Mikelic, A.; Wheeler, M.F. Polynomial Filtration Laws for Low Reynolds Number Flows Through Porous Media. Transp. Porous Media 2010, 81, 35–60. [Google Scholar] [CrossRef]
  27. Yang, J.; Dong, Z.M.; Yang, H.H.; Liu, Y.; Wang, Y.; Chen, F.; Chen, H. Numerical and Experimental Study on Thermal Comfort of Human Body by Split-Fiber Air Conditioner. Energies 2022, 15, 3755. [Google Scholar] [CrossRef]
  28. Raphe, P.; Fellouah, H.; Poncet, S.; Ameur, M. Ventilation effectiveness of uniform and non-uniform perforated duct diffusers at office room. Build. Environ. 2021, 204, 108118. [Google Scholar] [CrossRef]
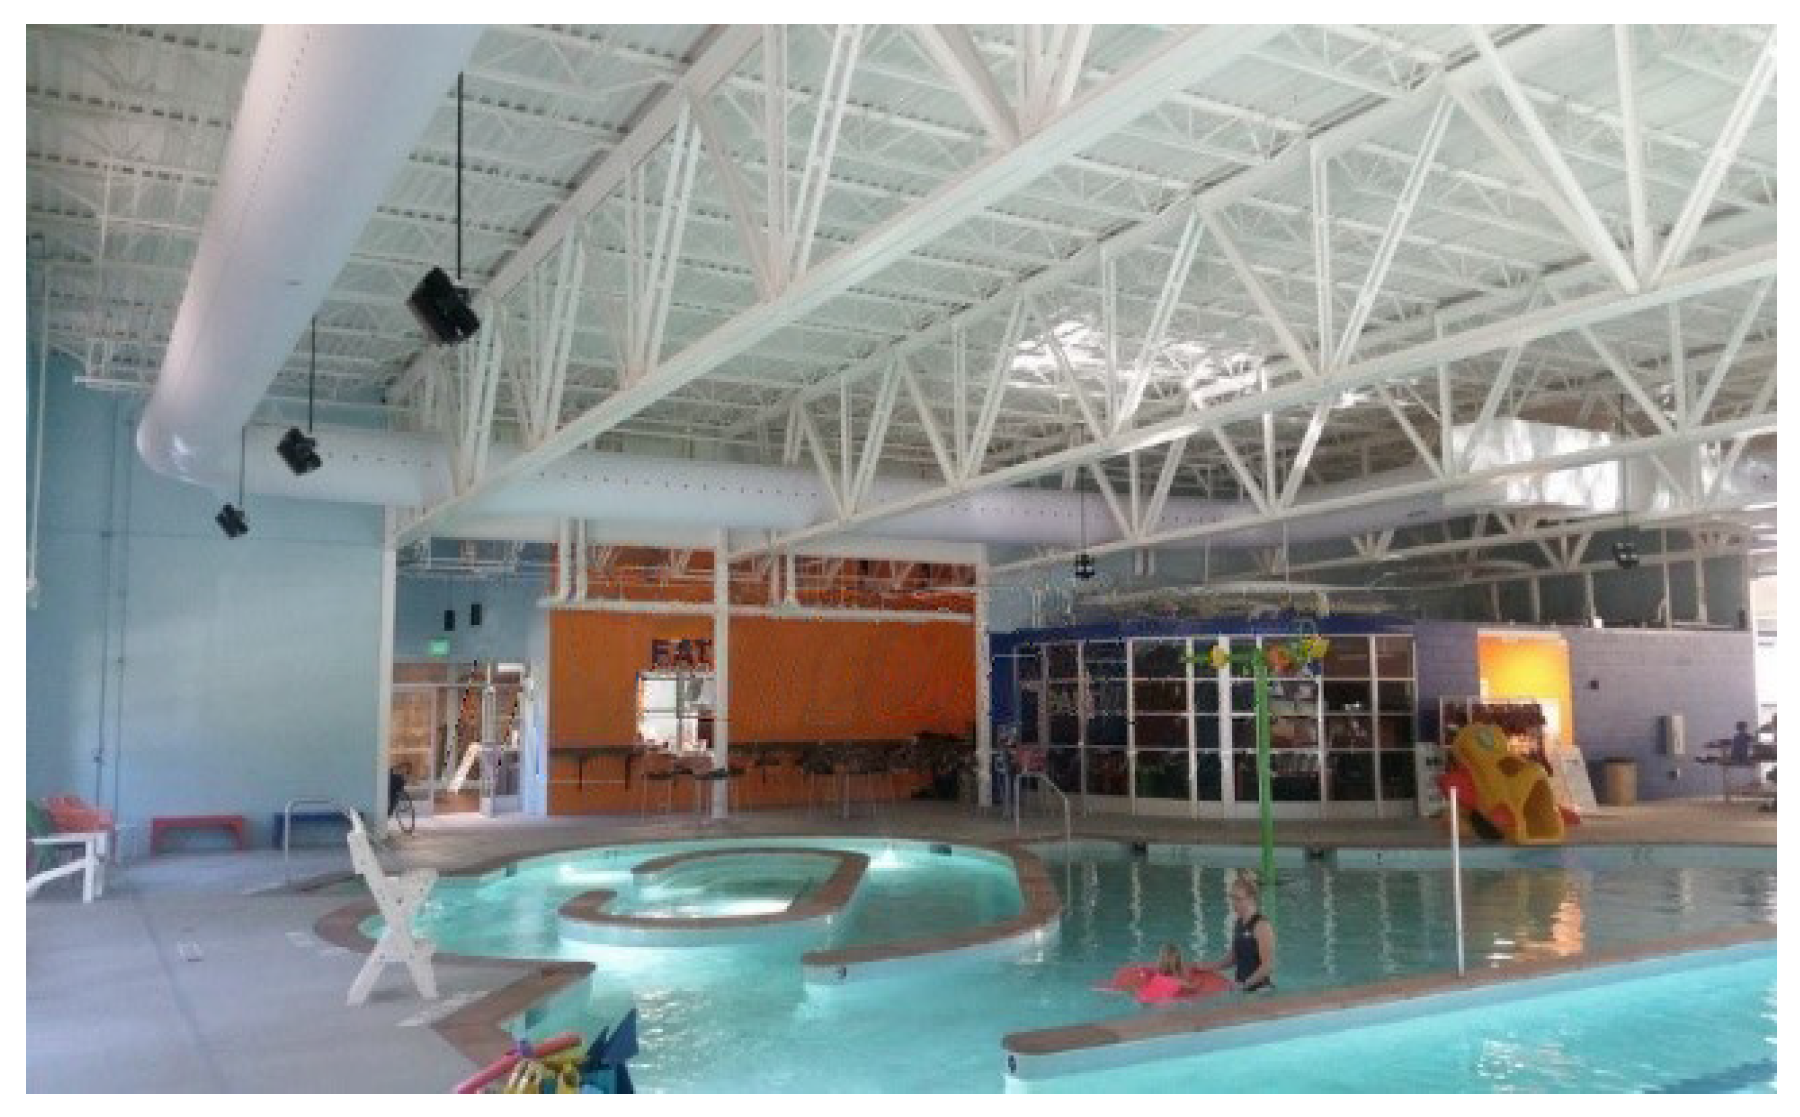
Figure 1. “L”-shaped FADS used in swimming pools.
Energies 16 04377 g001
Figure 2. “U”-shaped FADS used in exhibition halls.
Energies 16 04377 g002
Figure 3. Physical model of ejection-permeable FADS.
Energies 16 04377 g003
Figure 4. Schematic of the grid system.
Energies 16 04377 g004
Figure 5. Internal temperature and velocity of the FADS tube for three different grid numbers. (a) Temperature; (b) Flow velocity.
Energies 16 04377 g005
Figure 6. Air delivery principle of ejection-permeable FADS.
Energies 16 04377 g006
Figure 7. Field experiment layout.
Energies 16 04377 g007
Figure 8. Schematics of ejection-permeable FADS.
Energies 16 04377 g008
Figure 9. Comparison of experimental data and simulation results. (a) Flow velocity and (b) temperature.
Energies 16 04377 g009
Figure 10. Four kinds of FADS with different numbers of openings. (a) One row of openings (6 o’clock); (b) Two rows of openings (4:30 and 7:30 o’clock); (c) Three rows of openings (3, 6, and 9 o’clock); (d) Four rows of openings (3, 4:30, 7:30, and 9 o’clock).
Energies 16 04377 g010
Figure 11. Comparison of internal flow velocities of FADS with four different opening schemes.
Energies 16 04377 g011
Figure 12. Internal temperature of FADS with four different open-hole rows.
Energies 16 04377 g012
Figure 13. One row of openings (6 o’clock).
Energies 16 04377 g013
Figure 14. Two rows of openings (4:30 and 7:30 o’clock).
Energies 16 04377 g014
Figure 15. Wind speed inside FADS tubes with two different opening configurations.
Energies 16 04377 g015
Figure 16. Internal temperature of FADS with two different opening configurations.
Energies 16 04377 g016
Figure 17. “1”-shaped FADS.
Energies 16 04377 g017
Figure 18. “L”-shaped FADS.
Energies 16 04377 g018
Figure 19. “U”-shaped FADS.
Energies 16 04377 g019
Figure 20. “1”-shaped FADS velocity distribution.
Energies 16 04377 g020
Figure 21. “L”-shaped FADS velocity distribution.
Energies 16 04377 g021
Figure 22. “U”-shaped FADS velocity distribution.
Energies 16 04377 g022
Figure 23. Internal velocities for three different shapes of FADS.
Energies 16 04377 g023
Figure 24. “1”-shaped FADS temperature distribution.
Energies 16 04377 g024
Figure 25. “L”-shaped FADS temperature distribution.
Energies 16 04377 g025
Figure 26. “U”-shaped FADS temperature distribution.
Energies 16 04377 g026
Figure 27. Temperature along the internal course of three different shapes of FADS.
Energies 16 04377 g027
Table 1. Boundary conditions.
PositionBoundary TypeValue
Front end Velocity inlet8 m/s; 20 °C
Rear endWall/
OpeningsPressure outlet0 Pa
Duct surfacePressure outlet0 Pa
Disclaimer/Publisher’s Note: The statements, opinions and data contained in all publications are solely those of the individual author(s) and contributor(s) and not of MDPI and/or the editor(s). MDPI and/or the editor(s) disclaim responsibility for any injury to people or property resulting from any ideas, methods, instructions or products referred to in the content.