1. Introduction
Unmanned aviation vehicles (UAVs) have been applied widely in civil and military domains. It is critical to develop a power system with a high power-to-weight ratio, a good economy, and a long reliability. Spark ignition (SI) engines are a promising option with apparent advantages. However, conventional SI engines are supplied with gasoline fuel, which cannot fulfil the rigid requirements of aviation. Kerosene has a low volatility and a high flash point compared with gasoline and has already been used as standard aviation fuel [
1]. Therefore, it is necessary to investigate the feasibility of kerosene as a fuel of SI engines, which is useful for not only UAVs but also aviation vehicles in general.
The combustion process inside a high-speed SI engine is very complicated, and dramatic oxidation reactions occur in a short time. Numerical simulation [
2] and experimental investigation [
3] are often employed to characterize the combustion of various fuels. The working conditions in SI engines differ greatly from those in gas turbines. Therefore, the combustion characteristics of kerosene in SI engines need to be explored. Ignition delay time as a key indicator of premixed combustion is often measured via shock tube [
4], constant volume combustion chamber [
5], and rapid compression machine [
6]. The measured data of ignition delay time can be used to construct detailed reaction mechanisms or provide elementary data for combustion optimization [
7,
8]. Marek et al. [
9] studied the ignition delay time of Jet-A with a premixing-pervaporating flame tube under the conditions of 5.4–25 bar and 550–700 K, showing an inversely proportional relation with working pressure. Liang et al. [
10] measured the ignition delay time of JP3 with a temperature of 820–1500 K and a pressure of 5.5–22 bar via a heated high-pressure shock tube, which exhibited strong power dependencies on the oxygen concentration and the pressure, whereas it had a weak power correlation with the fuel concentration. In [
11], the effects of temperature and pressure as well as equivalence ratio on the ignition delay time of RP-3 kerosene were estimated. The logarithm of the ignition delay time manifested a linear correlation with the reciprocal of temperature, and a correlation was proposed. Additionally, Shi et al. [
12] found that the ignition delay time was shortened via blending kerosene with diesel fuel in a compression ignition (CI) engine.
Table 1 lists the ranges of the ignition delay time and the relative operation conditions.
Detailed combustion mechanisms have been developed for kerosene. Xiao et al. [
13] built a detailed mechanism consisting of 109 species and 946 elementary reactions, and the ignition characteristics of RP-3 kerosene were predicted. Tay et al. analyzed the combustion process of kerosene in CI engines extensively [
14,
15]. In [
16], a detailed combustion scheme incorporating 123 species and 586 elementary reactions was designed to simulate the combustion of a kerosene-diesel mixture. Later, a simplified mechanism containing 48 species and 152 reactions was developed and validated using the data measured in a constant volume chamber and an optical engine [
17]. The effects of fuel injection [
18] and emissions of NO and CO [
19] were also investigated.
Laminar flame speed as another important parameter refers to the propagation speed of the flame front under conditions with a low Reynold number [
20]. The measured laminar flame speed can provide a fundamental reference for turbulent combustion occurring inside an engine [
21]. Recently, many investigations focused on the laminar flame speed [
22,
23]. Schlieren photography [
24] and Bunsen flame method [
25,
26] are often used to determine the laminar flame speed. Liu et al. [
27] measured the ignition delay time and laminar flame speed of RP-3 kerosene under the conditions of 1–3 bar and 400–480 K.
Compared with gasoline, the flame speed of kerosene is much slower, causing severe knock under a very low indicative mean effective pressure. Blending kerosene can improve the combustion speed. The laminar flame speed increased when blending with ethanol, and the exhaust temperature decreased [
28,
29]. On the other hand, hydrogen addition was employed to enhance the combustion performance of various fuels. Zeng et al. [
30] mixed hydrogen with RP-3 kerosene, and the laminar flame speed was improved as the hydrogen blending ratio increased. Meng et al. [
31] also found that the flame propagation was shortened evidently via hydrogen addition in a rotatory engine. The laminar flame speed and Markstein length of mixture n-decane/hydrogen/air were measured by Xu et al. [
32] at the temperature of 470 K and the pressures of 1 and 2 bar. An investigation from Wang et al. [
33] indicated that the flame amplitude increased and the frequency decreased as the hydrogen addition ascended. The flame stability could be improved although the flame thickness and curvature were affected [
34]. The reason was attributed to the increment in concentration gradient of reaction species before the flame front as hydrogen addition rose, leading to a lower flame temperature [
35].
Hydrogen addition not only improves the flame speed and thus alleviates knock phenomenon [
36] but also suppresses the formation of soot emission [
37,
38]. Khanehzar et al. [
39] found that the dilution effect had the most significant effect on the reaction rate of soot formation/oxidation. Meanwhile, hydrogen addition promoted the formation of OH and H through elementary reactions [
40]. Guo et al. [
41] studied the flame characteristics of methane/hydrogen mixture and discussed the effects on the concentrations of OH and H.
Although there are some investigations about hydrogen addition, few have explored the premixed combustion of kerosene. In [
42], the authors investigated the ignition characteristics of kerosene in an aviation SI engine. In [
43], water injection was employed to suppress knock of an SI engine fueled with kerosene. However, the performance still was not comparable with that of fueling with gasoline; therefore, further technology should be developed. Is it possible to improve the laminar flame speed of kerosene via blending hydrogen? Can the ignition characteristics be tuned and the severe knock of kerosene be suppressed via hydrogen addition? It is necessary to explore these issues to further improve the performance of SI engines fueled with kerosene. Herein, the effects of hydrogen addition on the ignition delay time and laminar flame speed of kerosene are investigated according to the operation conditions of an SI engine. Numerical simulations are performed under the working pressures of 15–35 bar and the hydrogen blending ratios of 0–0.4 using a detailed mechanism. The sensitivities are analyzed, and important elementary reactions are sorted out. The results can provide some insights for the application of kerosene in SI engines.
3. Effect of Pressure on Ignition Delay Time
The ignition delay time of kerosene in CI engines was predicted well by the reaction mechanism developed by Tay et al. [
17]. This mechanism consisting of 48 species and 152 elementary reactions is employed in this study to simulate the ignition delay time of kerosene blending with hydrogen in SI engines.
Figure 1 shows the simulated results of ignition delay time of a stoichiometric mixture under the pressure of 20 bar. The measured data are from [
44]. The average deviation is around 0.3 ms. The temperature range of NTC (Negative Temperature Coefficient) is predicted although the simulated value is slightly lower. It can be seen that a high consistency appears among these data.
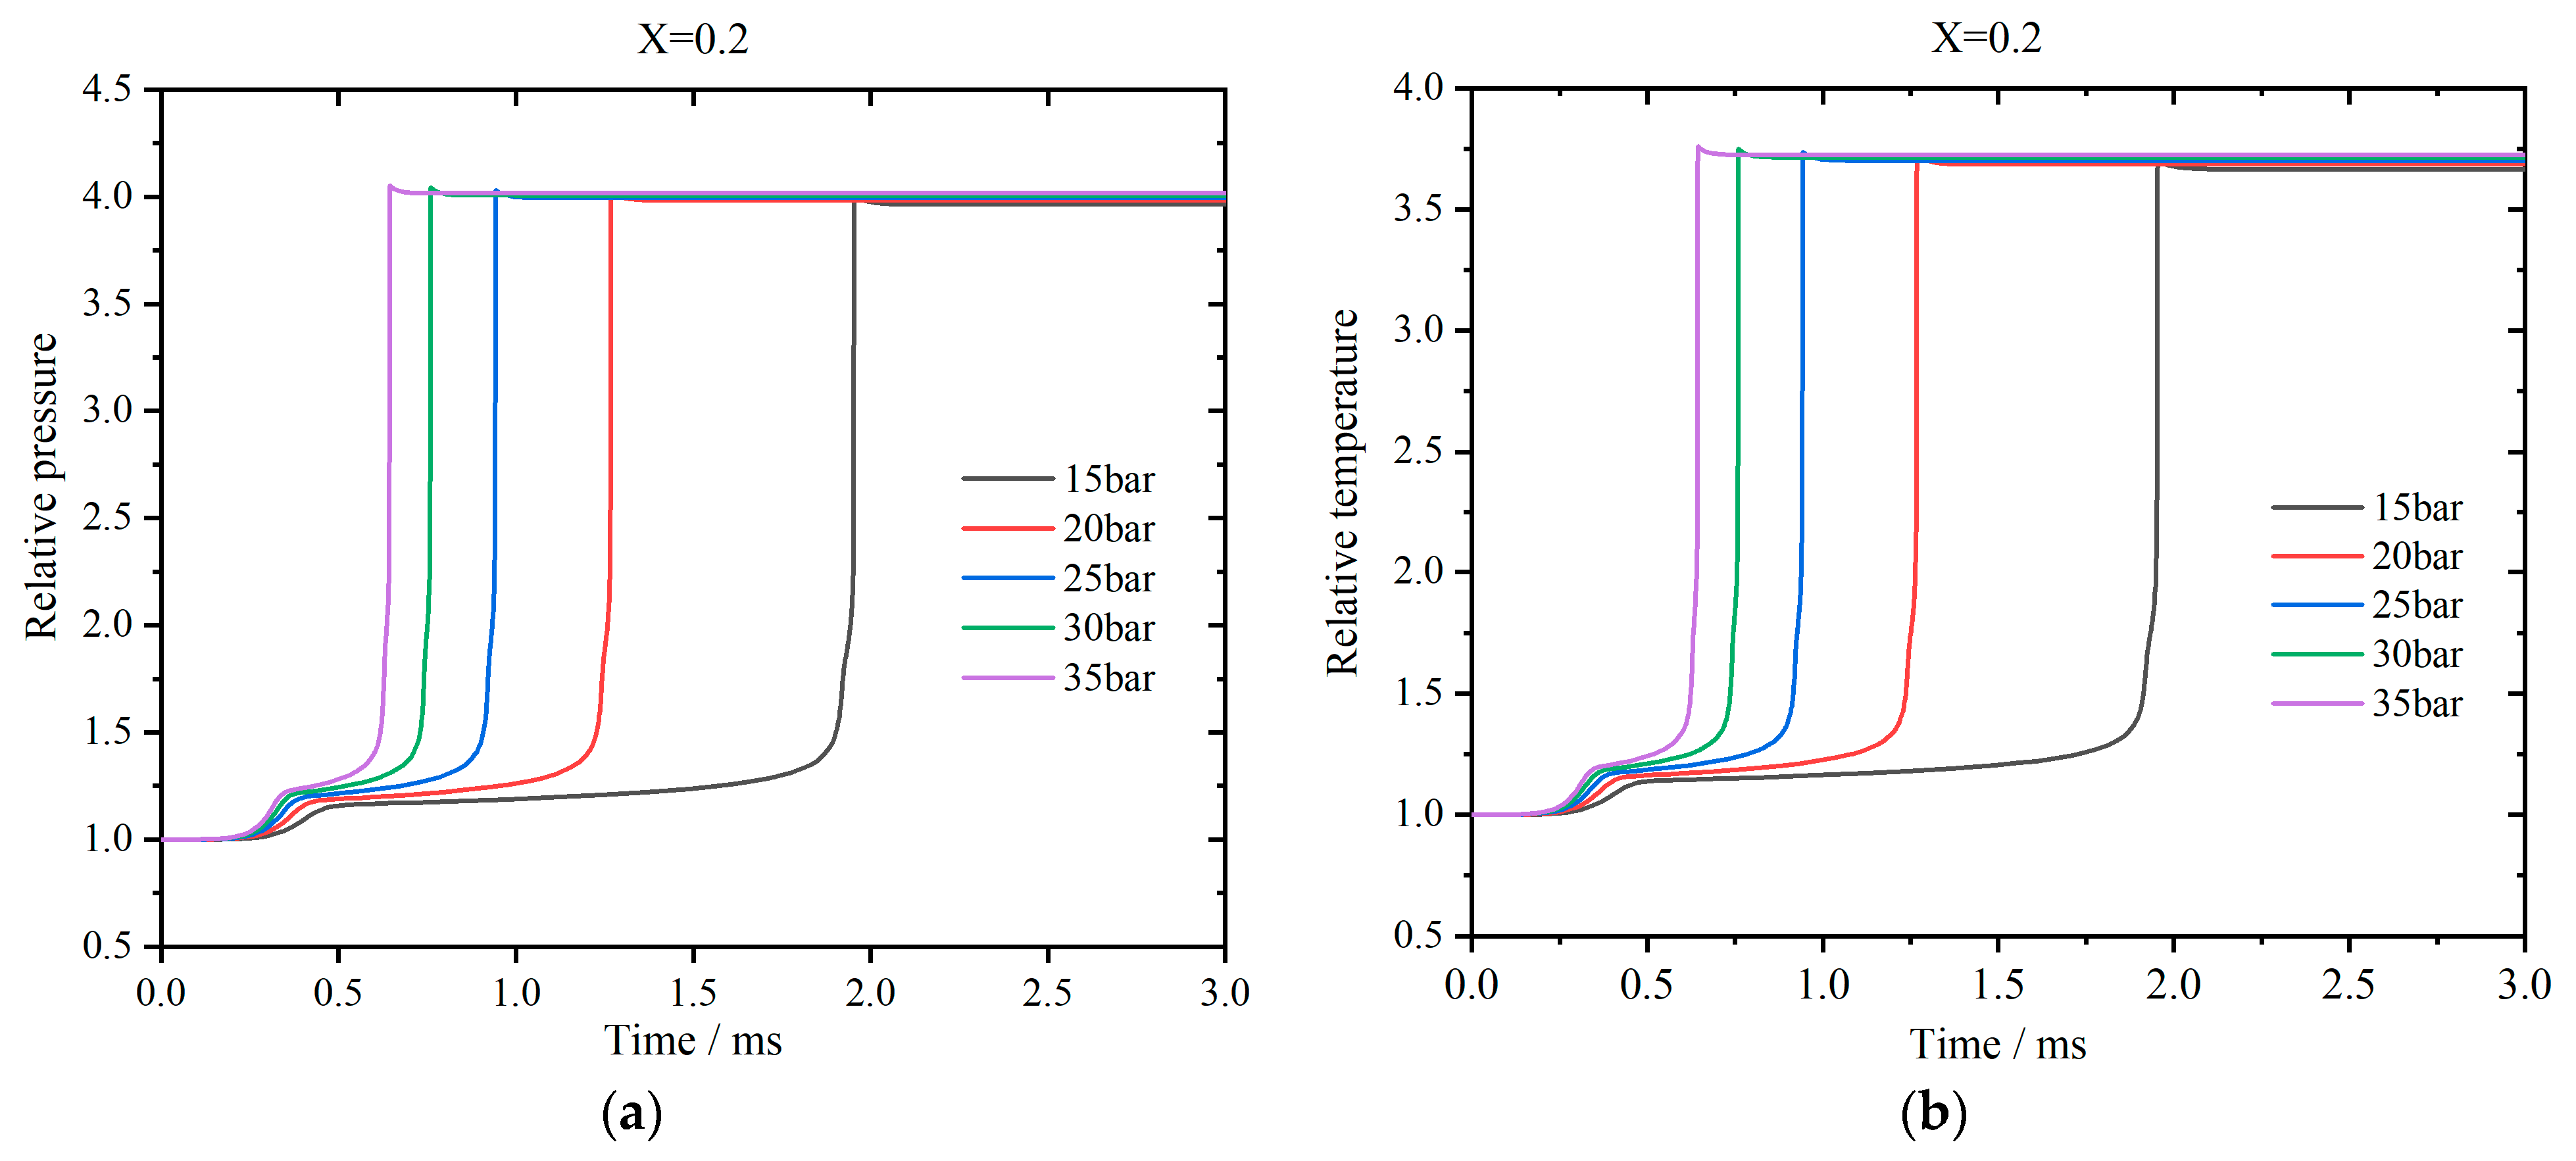
The profiles of the pressure relative to the initial value for the stoichiometric premixed combustion of kerosene with a hydrogen blending ratio of 0.2 are shown in
Figure 2a. The initial temperature is 800 K. It can be observed that there are two pressure peaks for each profile. First, the pressure increases slowly until the first peak. Then, it continues to rise and suddenly arrives at the second peak rapidly. Finally, the pressure declines slightly and maintains at a stable value. As the initial pressure increases, the first-stage ignition delay time decreases slightly, while the second-stage ignition delay time is reduced apparently.
Figure 2b shows the corresponding temperature profiles relative to the initial value. Similarly, there are also two peaks. The final pressure increases as the initial pressure rises, while the final temperatures remain almost at the same level. Herein, an adiabatic wall of the constant volume is assumed and the maximum temperature approaches to 3000 K. In actual operation conditions of SI engines, heat transfer to the cooling system always exists and the peak temperature is normally less than 2300 K.
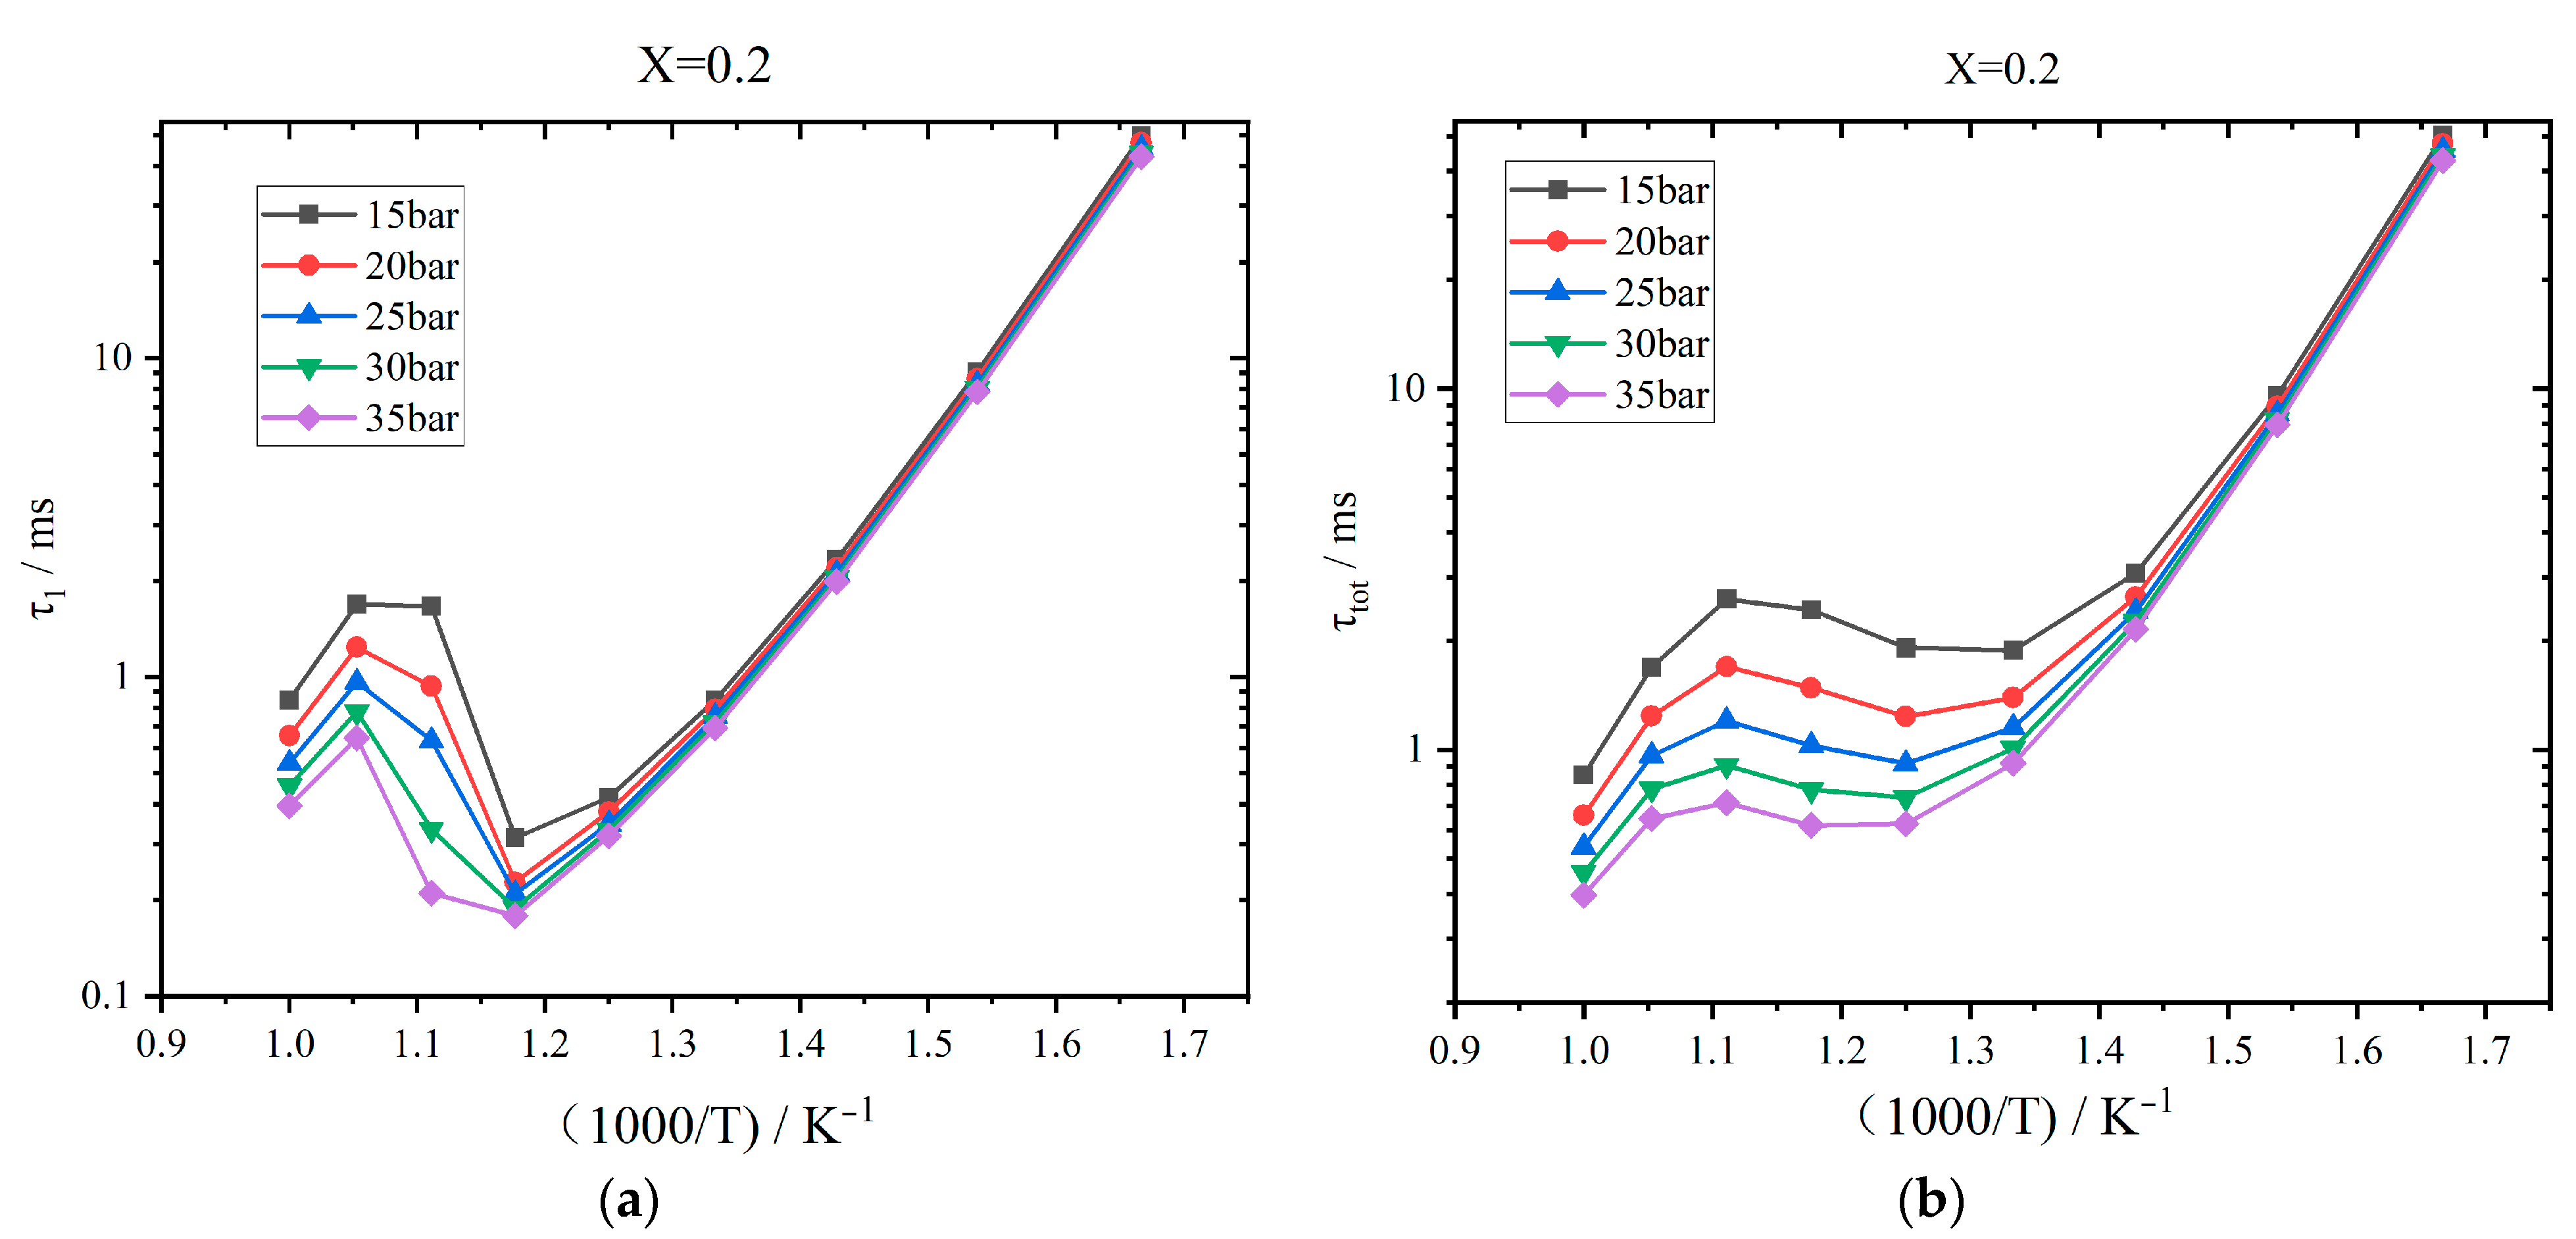
Figure 3 exhibits the effects of initial pressure on the ignition delay time. The initial temperature is set to 600–1000 K. The mixture is assumed to be stoichiometric. When the initial temperature is less than 800 K (ratio 1000/T = 1.25),
τ1 reduces with the increase in the temperature, as shown in
Figure 3a. For every 50 K increment in temperature,
τ1 decreases by about 11.39 ms. When the initial temperature enters the NTC interval, which is greater than 800 K,
τ1 enlarges with the increase in temperature. An apparent two-stage heat releasing phenomenon cannot be observed, and
τ1 approaches to
τtot. When the initial temperature is greater than 950 K, the NTC phenomenon disappears, and
τ1 again decreases as the temperature rises. Meanwhile,
τ1 is reduced as the initial pressure is higher. When the initial temperature is in the range of 600–800 K (ratio 1000/T = 1.67–1.25),
τ1 decreases by about 0.45 ms for every five-bar increment in the pressure. In the NTC interval,
τ1 decreases by about 0.22 ms for every five-bar increment in the pressure.
Figure 3b shows the effects of pressure on the overall ignition delay time. When the initial temperature is 600–750 K (ratio 1000/T = 1.67–1.33),
τtot decreases with the increase in the temperature. The higher the temperature, the lower the change rate of
τtot. In the NTC interval, the average increase in
τtot is 14.93 ms for every 50 K increment in temperature. When the temperature is greater than 900 K,
τtot decreases by about 0.42 ms for every 50 K increment. Meanwhile,
τtot decreases as the pressure rises. For every five-bar increment,
τtot decreases by 0.69 ms, 0.42 ms, and 0.19 ms for the above three temperature ranges, respectively.
Table 2 lists the main elementary reactions for the premixed combustion of kerosene and hydrogen. Compared with pure kerosene shown in [
42], reactions R5 (KERO-OO = KERO#OOH), R6 (KERO#OOH + O
2 = OOKERO#OOH), R4 (KERO- + O
2 = KERO-OO), and R72 (H
2O
2 + OH = HO
2 + H
2O) are removed, while the importance of R78, R32, and R67 rises. R6 and R4 are two oxygenation reactions, and R5 is the isomerization of the product of R4. As the hydrogen concentration increases in the premixed mixture, these oxygenation reactions are suppressed. Instead, the oxygen is consumed principally by the dehydrogenation reactions of R9, R121, and R78. Meanwhile, small species such as C
2H
4 are produced via the pyrolysis of kerosene and further react with OH to generate CH
2O, as R32 shows. Finally, hydrogen peroxide H
2O
2 is decoupled into OH via colliding with the third species when the hydrogen concentration is high, displayed as R67.
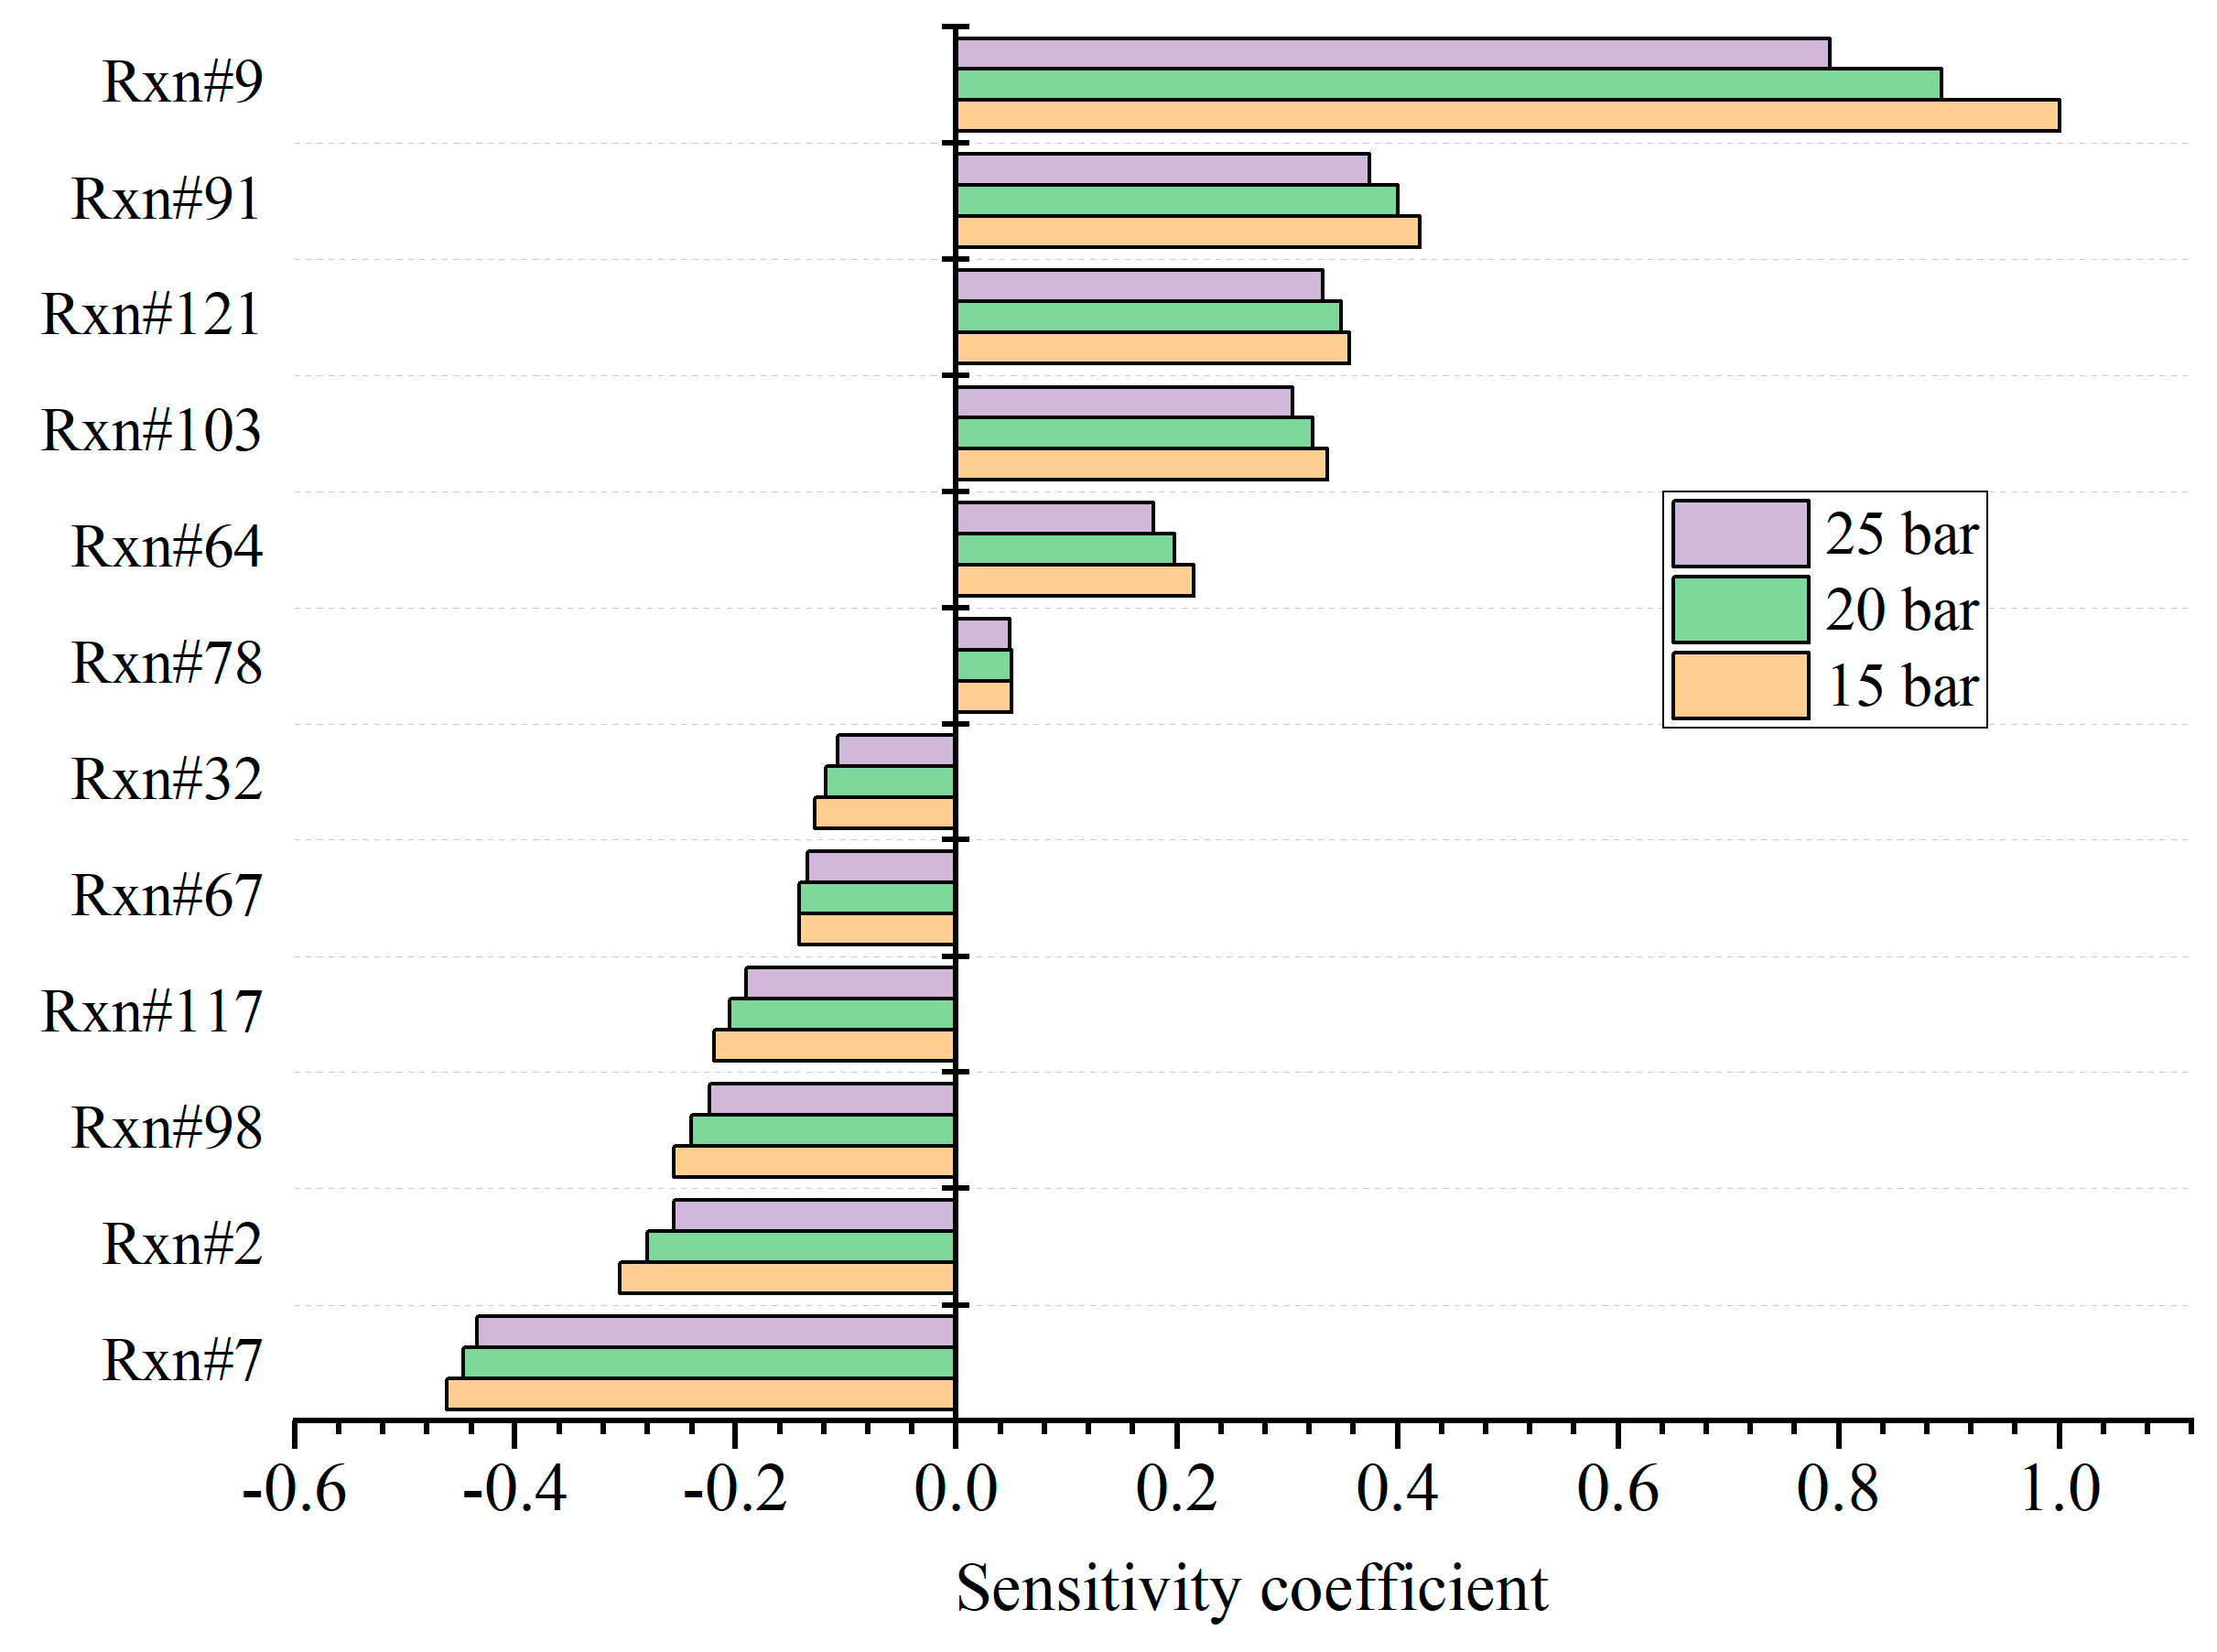
Figure 4 shows the sensitivity of ignition delay time with respect to the pressure. The initial temperature is fixed as 800 K, and the hydrogen addition ratio of the stoichiometric mixture is 0.2. A positive value means suppression of ignition and vice versa. When hydrogen is added, the main reactions that suppress ignition are R9, R91, and R121. R9 and R121 are oxygenation reactions, and stable HO
2 is formed. R91 is the dehydrogenation of CH
2O, and the generated radical HCO further reacts with O
2 to form stable CO and HO
2 via R78. R103 and R64 consume active radicals CH
3 and OH, respectively, and stable species such as CH
4 and H
2O are generated. Therefore, these reactions exhibit apparent suppression of the chain reactions and extend the ignition delay time. In comparison, R7, R2, and R98 are the main reactions that promote ignition. R7 is the decomposition reaction of large groups of kerosene and active OH radical forms. Meanwhile, R67 is conducive for the generation of OH. Then, OH further reacts with a kerosene molecule to produce active radical KERO-. Meanwhile, OH reacts with C
2H
4 and active CH
3 is formed via R32. The active CH
3 further collides with HO
2 and accelerates the production of OH. In addition, R117 produces active H radicals. Therefore, lots of radicals are generated via these reactions, and the ignition is promoted apparently. The chemical reaction accelerates as the pressure increases, leading to a lower ignition delay time. As a result, the sensitivities for almost all the reactions decline, and the sequence of sensitivities remains constant under various pressures.
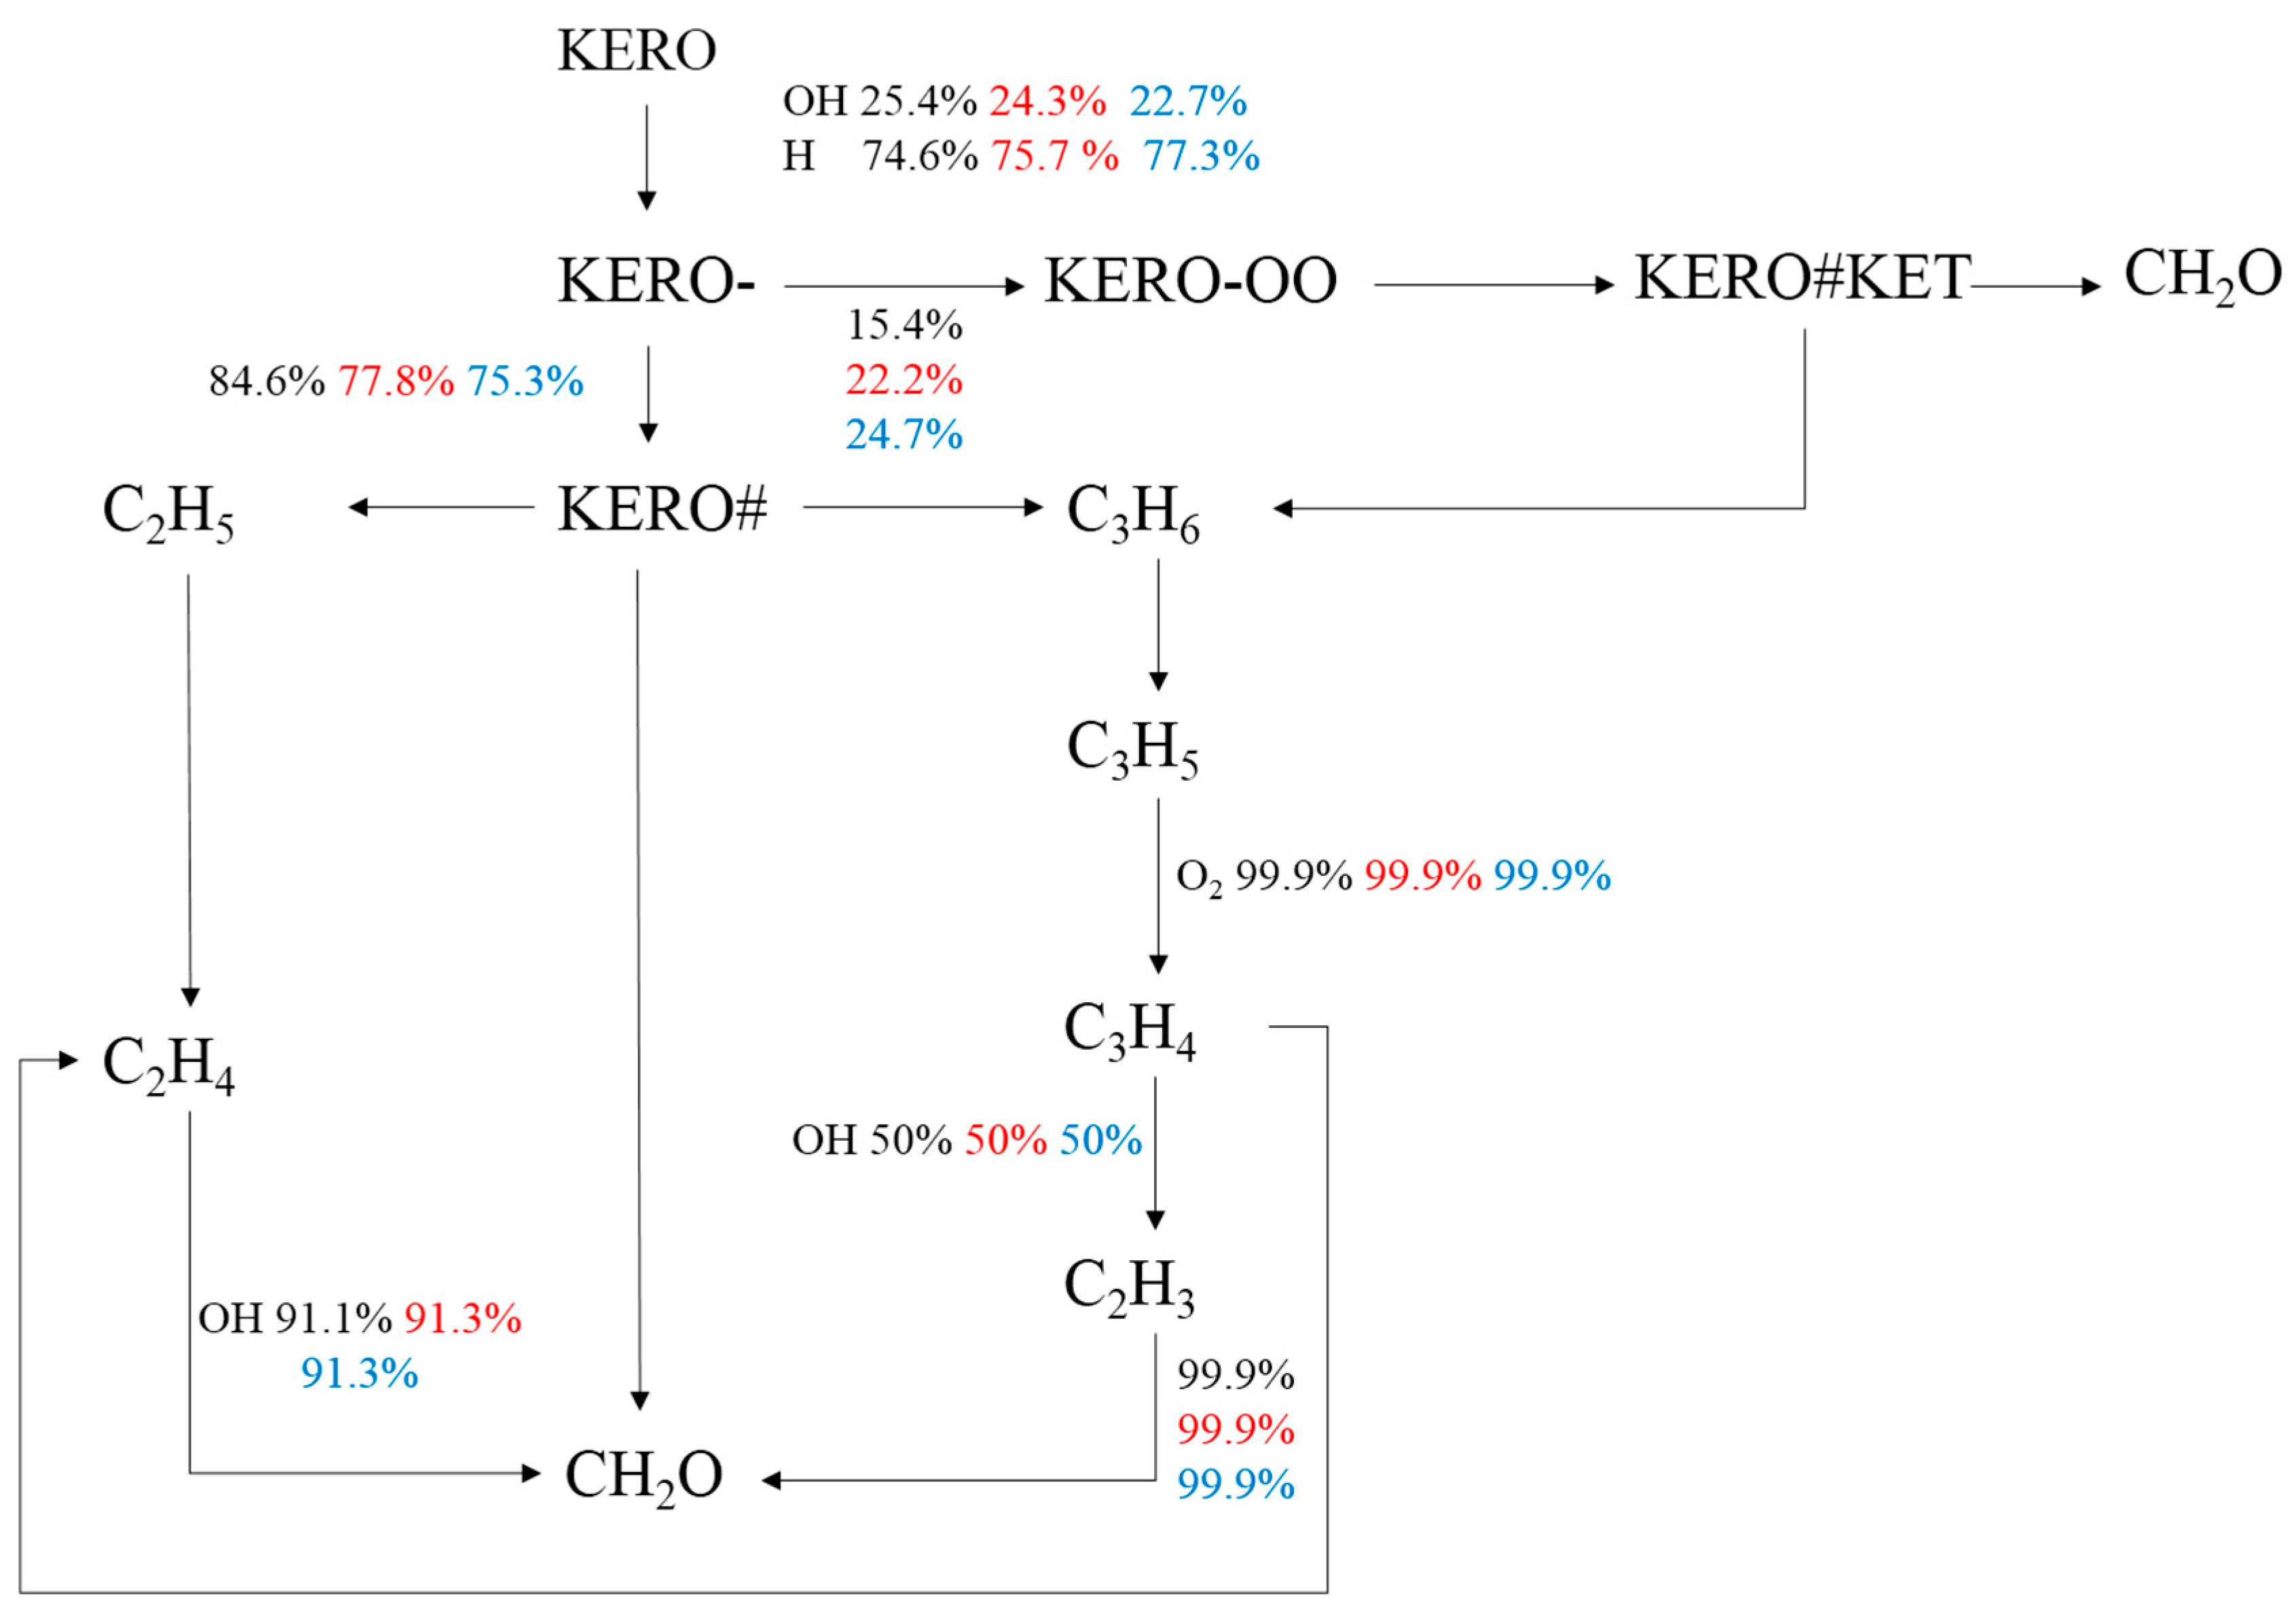
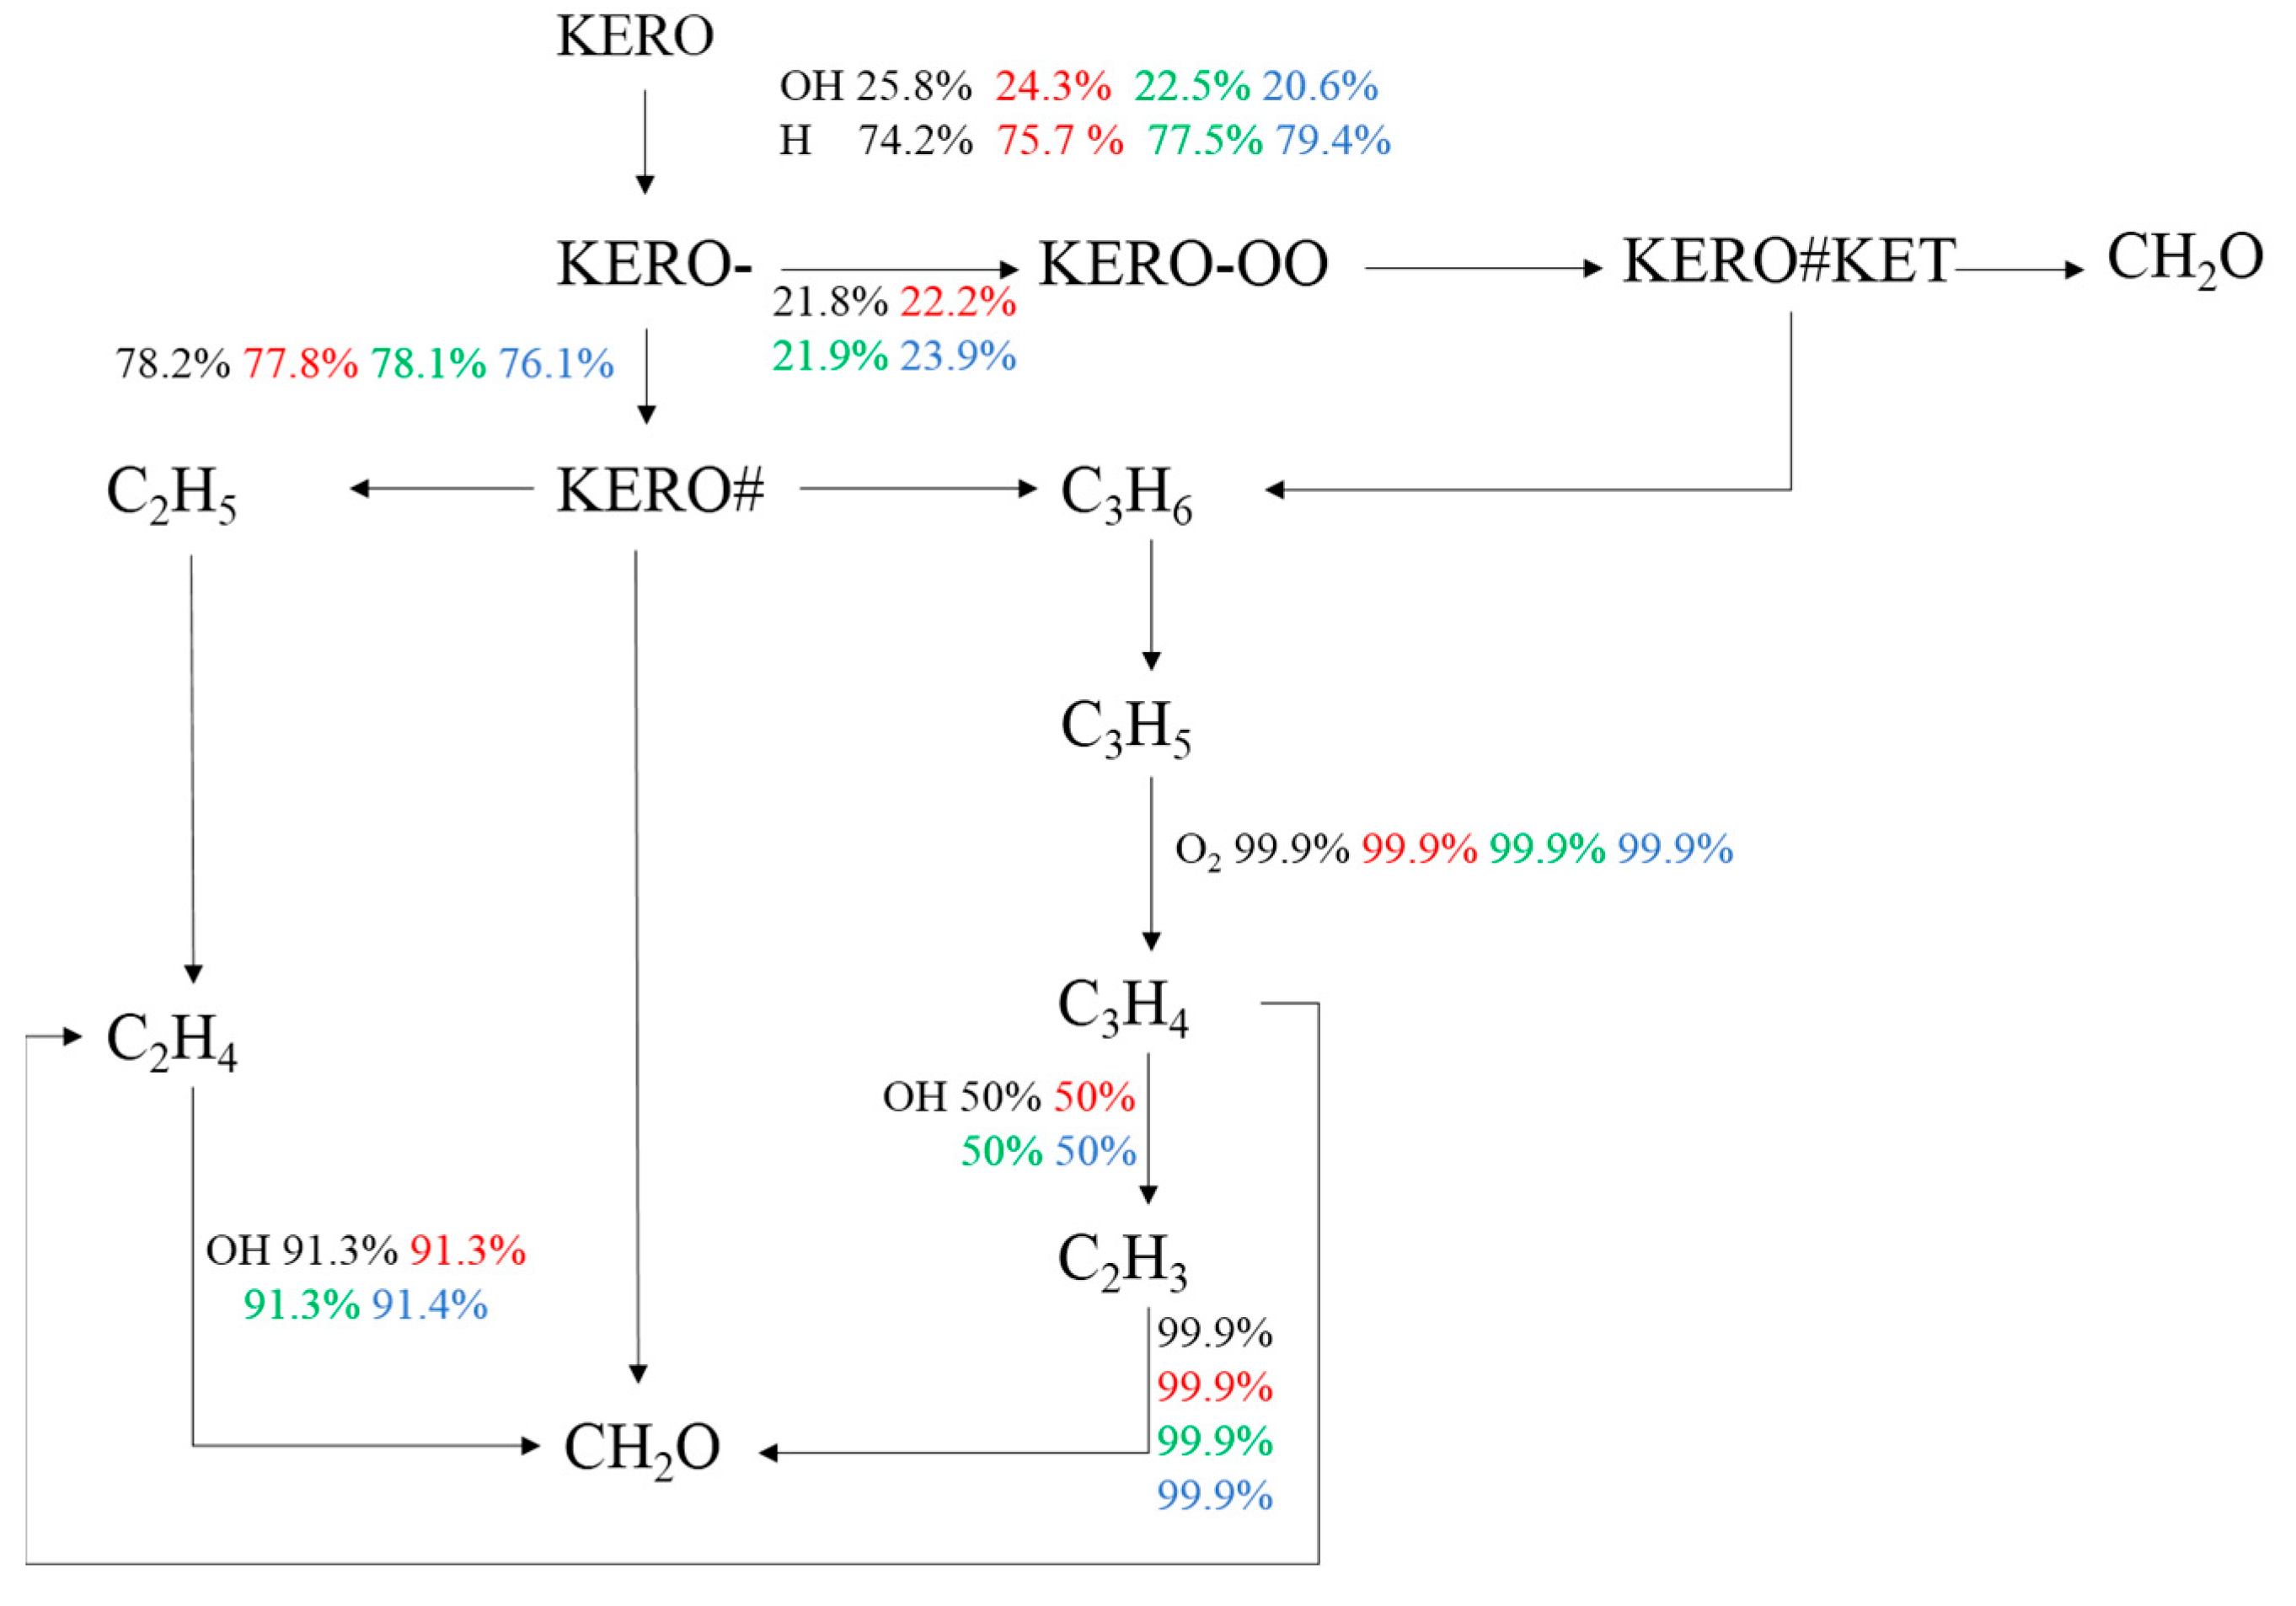
The chemical reaction path is analyzed for premixed combustion of kerosene blending with hydrogen, and the results are shown in
Figure 5 when 20% fuel mixture is burnt. The initial temperature is 800 K and the hydrogen addition ratio is 0.2. The variation in pressure affects the first several steps obviously. First, KERO is pyrolyzed into KERO-. The path via reacting with H strengthens, while the routine reacting with OH attenuates as the pressure ascends. In the following step, KERO- is reconstructed as KERO# or KERO-OO via oxygenation. The increment in pressure will alter the proportions of the chain branching reactions. As the pressure increases, the proportion of the oxygenation reaction enlarges. Then, large groups continue to dissociate, and small groups such as C
2H
5 and C
3H
6 are generated, which are further decomposed, and CH
2O is obtained. Afterwards, the mechanism follows the well-known reaction path of formaldehyde until the final products CO
2 and H
2O.
4. Effects of Hydrogen Addition Ratio on Ignition Delay Time
The results of overall ignition delay time
τtot as a function of hydrogen addition ratio
X are displayed in
Figure 6 for the stoichiometric kerosene/hydrogen mixture. Generally, the overall ignition delay time decreases gradually as the hydrogen blending ratio increases. When the initial temperature and pressure are 800 K and 20 bar, respectively,
τtot is 1.33 ms for pure kerosene, while it is reduced to 1.12 ms with a hydrogen addition ratio of 0.4. When the pressure rises to 35 bar, the corresponding two values decrease to 0.66 ms and 0.58 ms, respectively. On the other hand,
τtot decreases evidently if the temperature is higher. When the temperature is 600 K,
τtot is 47.9 ms under the pressure of 20 bar for pure kerosene, and it drops to 47.23 ms with a hydrogen addition ratio of 0.4. When the temperature increases to 1000 K, these two values decrease to 0.67 ms and 0.64 ms, respectively. To quantitively estimate the variations in
τtot under different hydrogen addition ratios, relative improvement
t is defined as
where
τtot,0 denotes the overall ignition delay time for pure kerosene and
τtot,X represents the overall ignition delay time when the hydrogen addition ratio is
X. The relative improvement
t describes the reduced magnitude of
τtot when the hydrogen blending ratio increases.
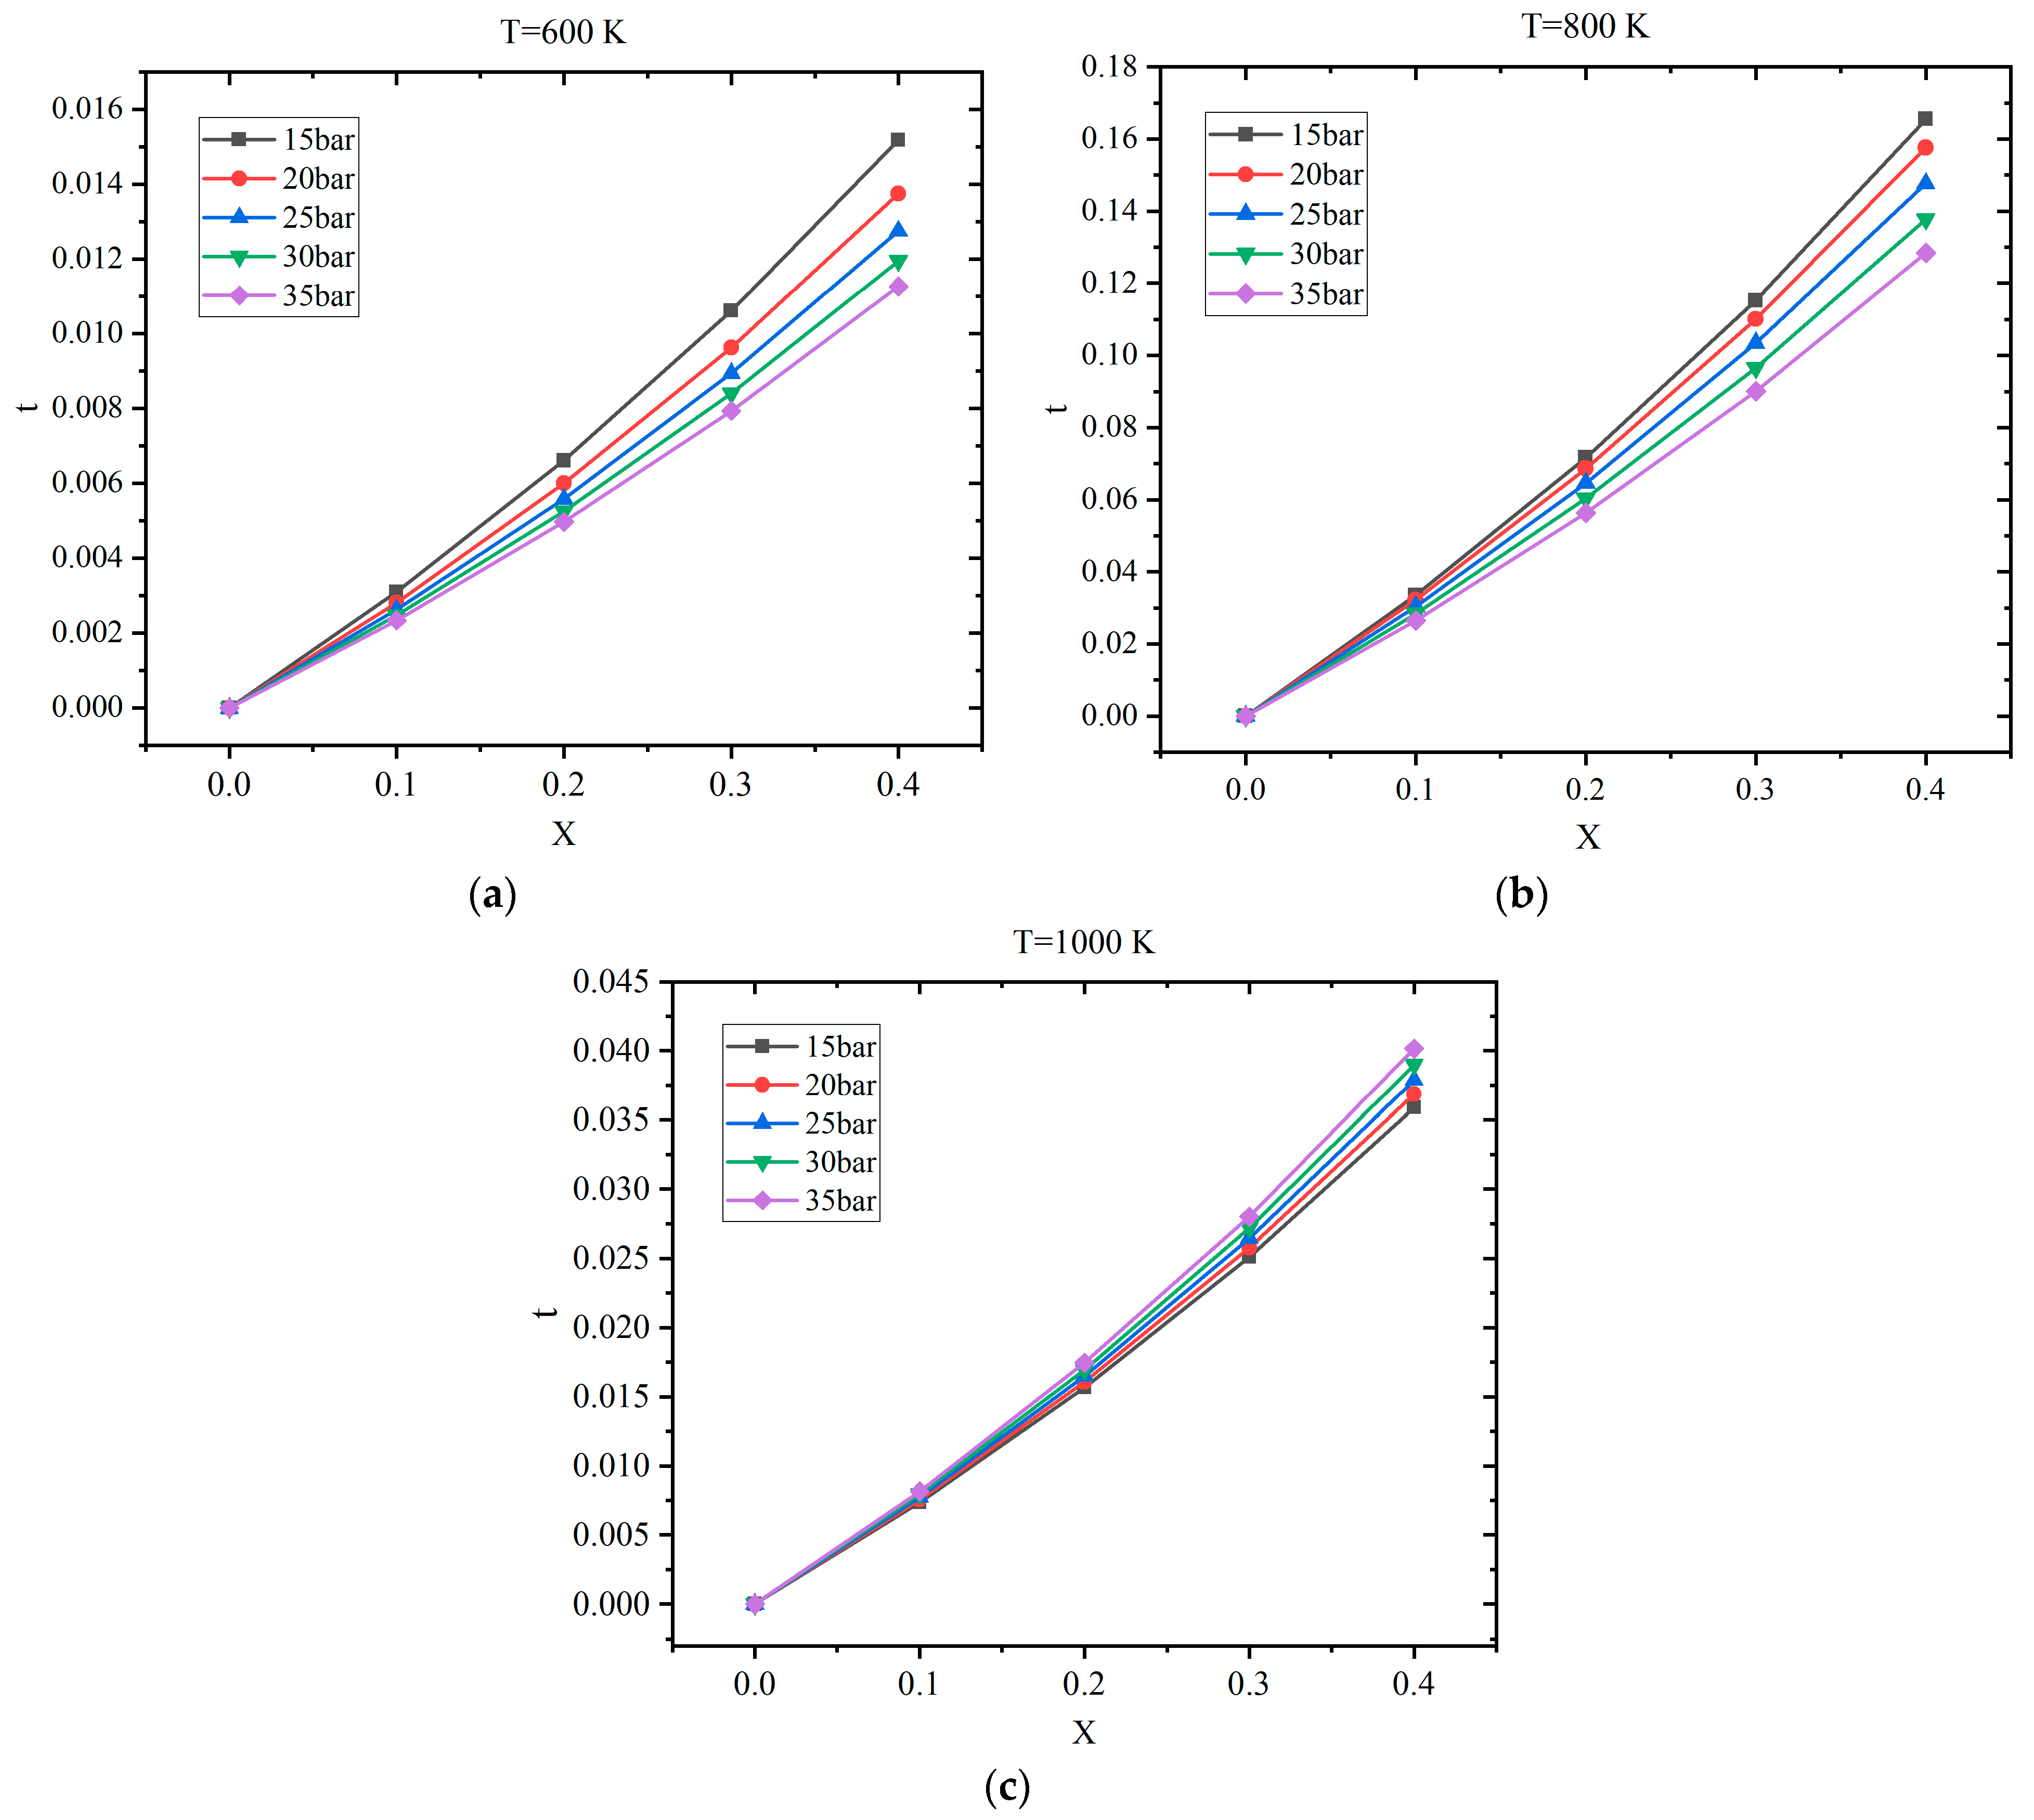
Figure 7 shows the profiles of relative improvement under various temperatures and pressures. It can be observed that
t increases almost linearly as the hydrogen blending ratio ascends. The relative improvements under 800 K are the largest as 12.84–16.55%, and the values of
t under 600 K are the smallest as 1.13–1.52%. The relative improvement at 1000 K is in the range of 3.59–4.02%. When the temperature is 800 K, the stoichiometric mixture operates in the NTC interval. The results indicate that
τtot can be decreased obviously if H
2 concentration is increased. Meanwhile,
t decreases at a fixed
X as the pressure increases from 15 to 35 bar at a temperature of 600 K or 800 K. In comparison,
t increases slightly with the increase in pressure when the temperature is 1000 K. Additionally, the sensitivity of
t to the variation in pressure is more significant when the hydrogen addition ratio is high.
The sensitivity of
τtot with respect to the hydrogen addition ratio is analyzed, and the results are displayed in
Figure 8. The initial stoichiometric mixture is set to 800 K and 20 bar. The main reactions promoting ignition are R7, R2, and R98, while reactions R9, R91, and R121 suppress the ignition apparently. As the hydrogen addition ratio increases, the sensitivity decreases. The influences are significant for reactions R2, R121, and R117. When
X increases from 0.1 to 0.4, the absolute value for R2 decreases by 17.5%, while it drops by 10.6% for R121 and 6.3% for R117. The concentration of H is enhanced apparently as the increment in
X. Therefore, the dehydrogenation reaction of kerosene through colliding with H is promoted evidently. Accordingly, the proportion of the dehydrogenation of kerosene via OH declines, as shown in R2. Meanwhile, the forward reaction of R117 is suppressed as well due to the enlargement in H concentration. Furthermore, with the increase in
X, the concentrations of hydrocarbons drop in the stoichiometric mixture. Therefore, the reaction rate of R121 is also reduced. On the other hand, the variation in
X has little impact on the reactions R7 and R9, which are decreased only by 0.26% and 0.9%, respectively. In R7, unstable OOKERO#OOH will transform to KERO#KET and OH very soon and is hardly affected by the increase in
X. Meanwhile, the oxygenation reaction of active KERO- is also not influenced by the hydrogen concentration. The sensitivities of R7 and R9 are the largest and can be considered as the rate-determining steps.
The effects of hydrogen addition ratio on the chemical reaction path from kerosene to the oxidation product formaldehyde (CH
2O) are illustrated in
Figure 9. The stoichiometric mixture combusts under the condition of 800 K and 20 bar. The variation in hydrogen addition ratio has an apparent impact on the reaction from KERO to KERO-. There are two main routines: one is via R2: KERO + OH = KERO- + H
2O, and the other is R3: KERO + H = KERO- + H
2. Both are H-abstraction reactions. As H
2 concentration increases, more H radicals are produced. Thus, R3 is promoted, while the proportion of R2 declines. Meanwhile, the oxygenation reaction of KERO- is also affected by the H
2 concentration. The main involved reactions are R4: KERO- + O2 = KERO-OO and R9: KERO- + O2 = KERO# + HO
2. In fact, R9 is an H-abstraction reaction. As the H
2 concentration increases, it is more difficult for R9. Therefore, more groups of KERO- are consumed by R4 to generate KERO-OO. The following steps are the dissociation reactions of large-molecule hydrocarbons and are seldomly influenced by the variation in
X.
5. Laminar Flame Speed of Kerosene/Hydrogen Mixture
Laminar flame speed is an important parameter of premixed combustion. Therefore, the effects of hydrogen addition on the laminar flame speed of kerosene are estimated.
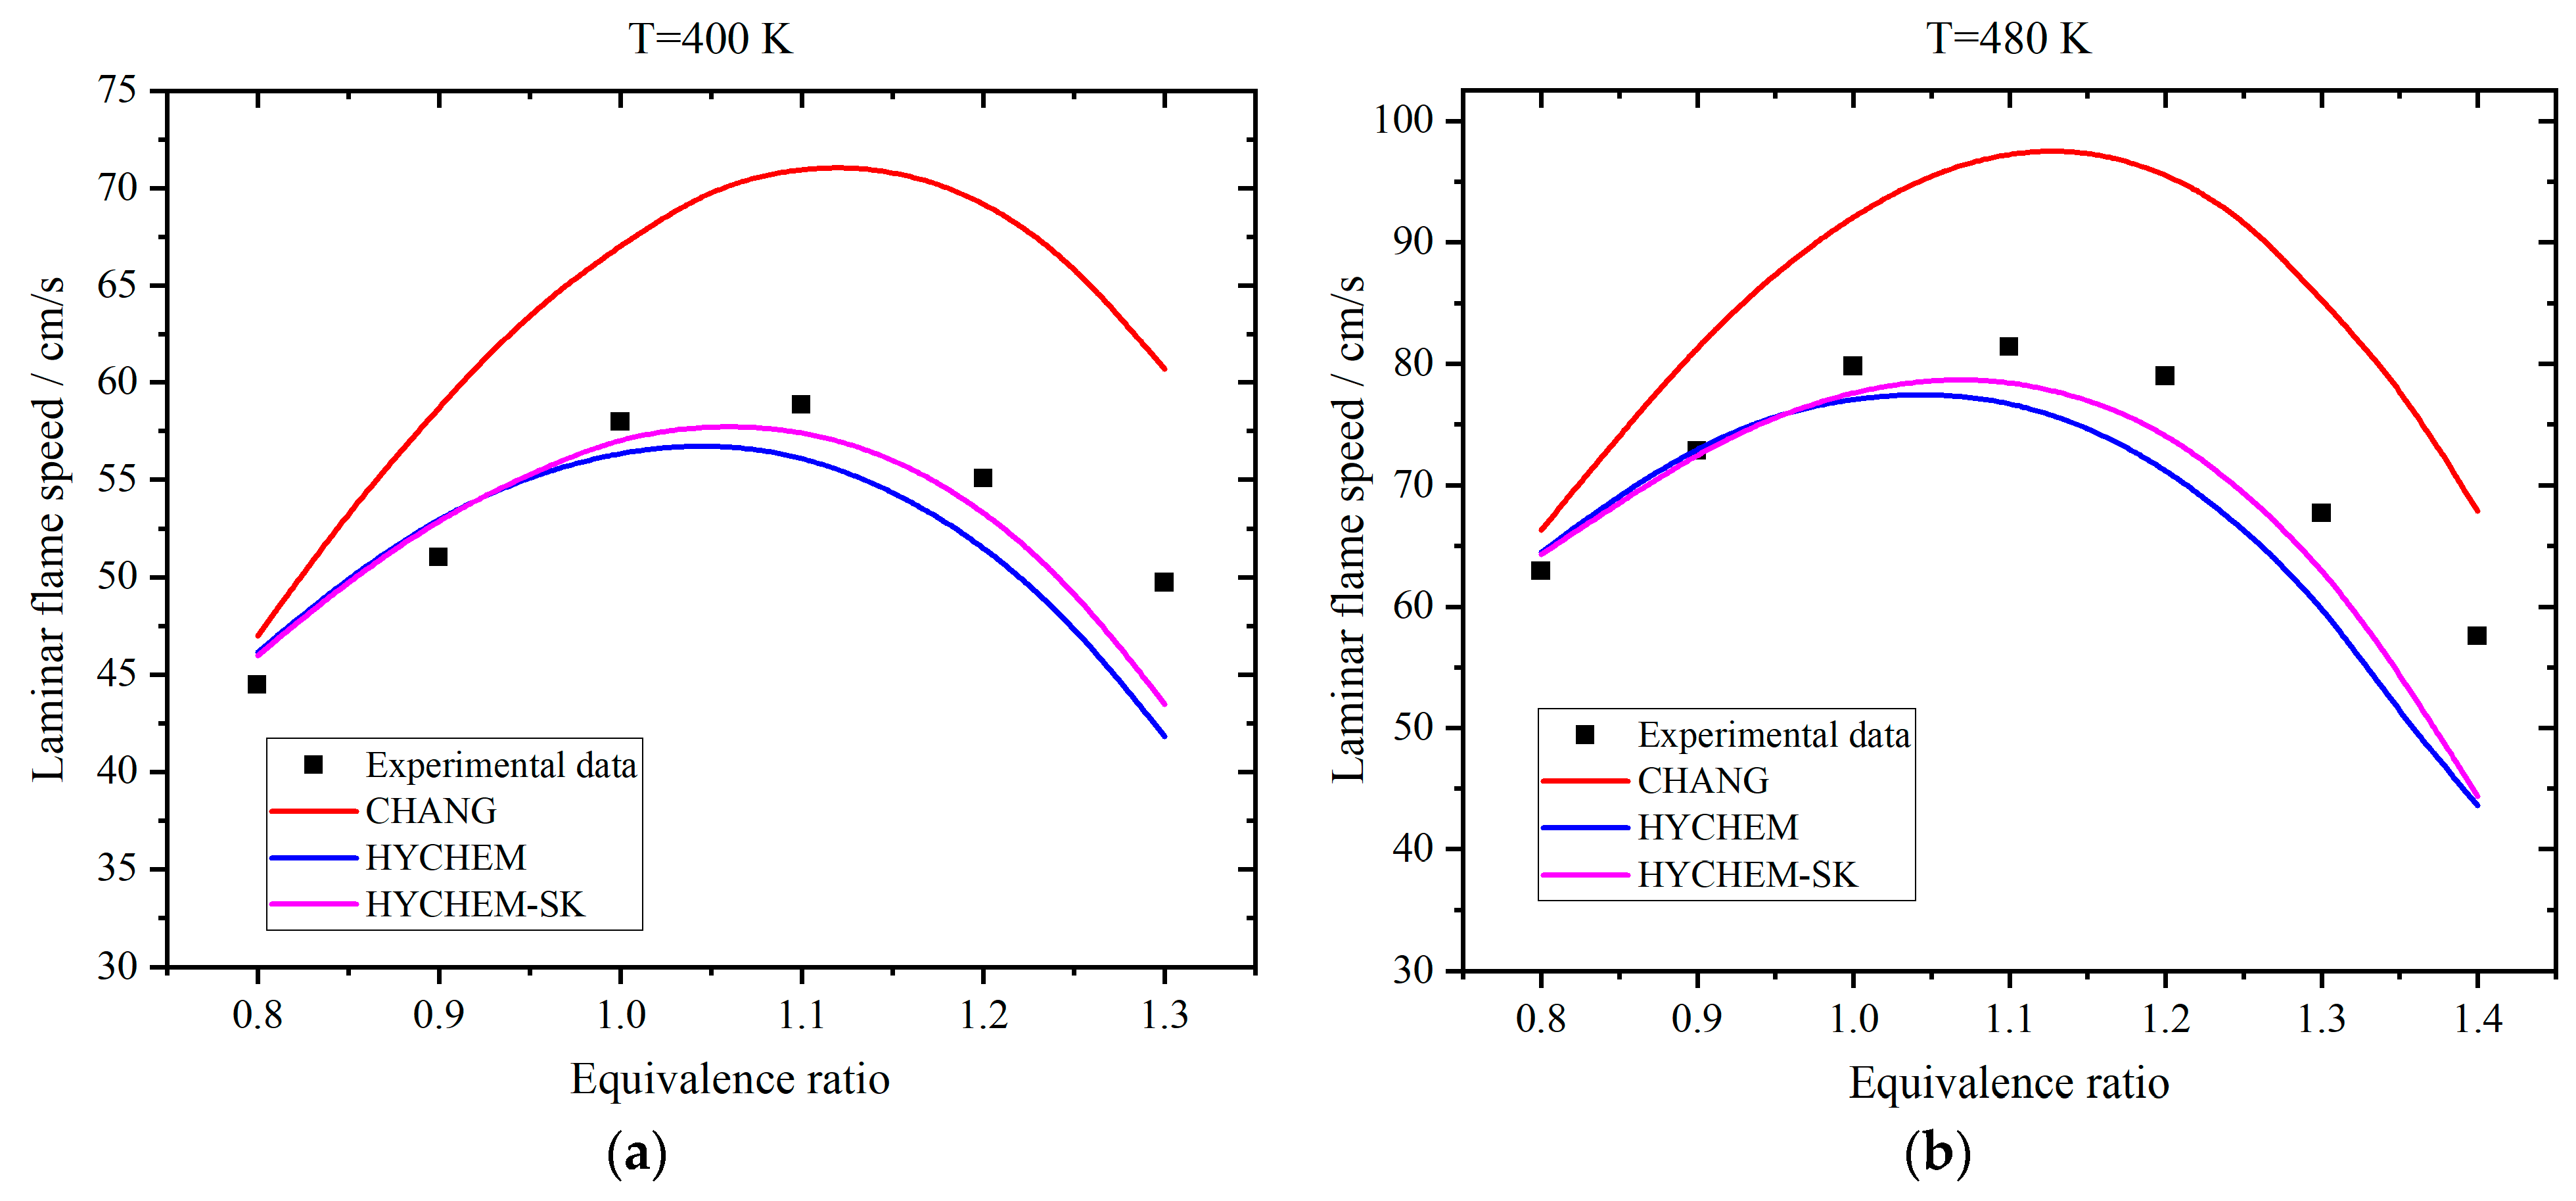
Figure 10 exhibits the comparison of simulated results using experimental data on different reaction mechanisms [
28]. The operation pressure is 1 bar. The Chang, HYCHEM, and HYCHEM-SK mechanisms can be referenced in [
45,
46,
47], respectively. In the previous section, the Tay mechanism is employed to simulate the ignition delay time. However, it is found that the deviations are large if this mechanism is adopted to estimate the laminar flame speed. The reason might be attributed to the oversimplification of the Tay mechanism that omits some rate-determining steps for the laminar flame speed. Therefore, other mechanisms are considered in this section. The laminar flame speed of the Chang mechanism is greater than in the experimental data. When the equivalence ratio is less than 1, the results of HYCHEM and HYCHEM-SK are almost the same and very close to the experimental data. When the equivalence ratio is greater than 1, the results of HYCHEM-SK are more accurate than that of HYCHEM. The average deviation of HYCHEM-SK against the experimental data is 1.9 cm/s. Meanwhile, HYCHEM-SK, consisting of 41 species and 202 elementary reactions, is more concise compared with HYCHEM. Therefore, the HYCHEM-SK mechanism is employed for the following analysis.
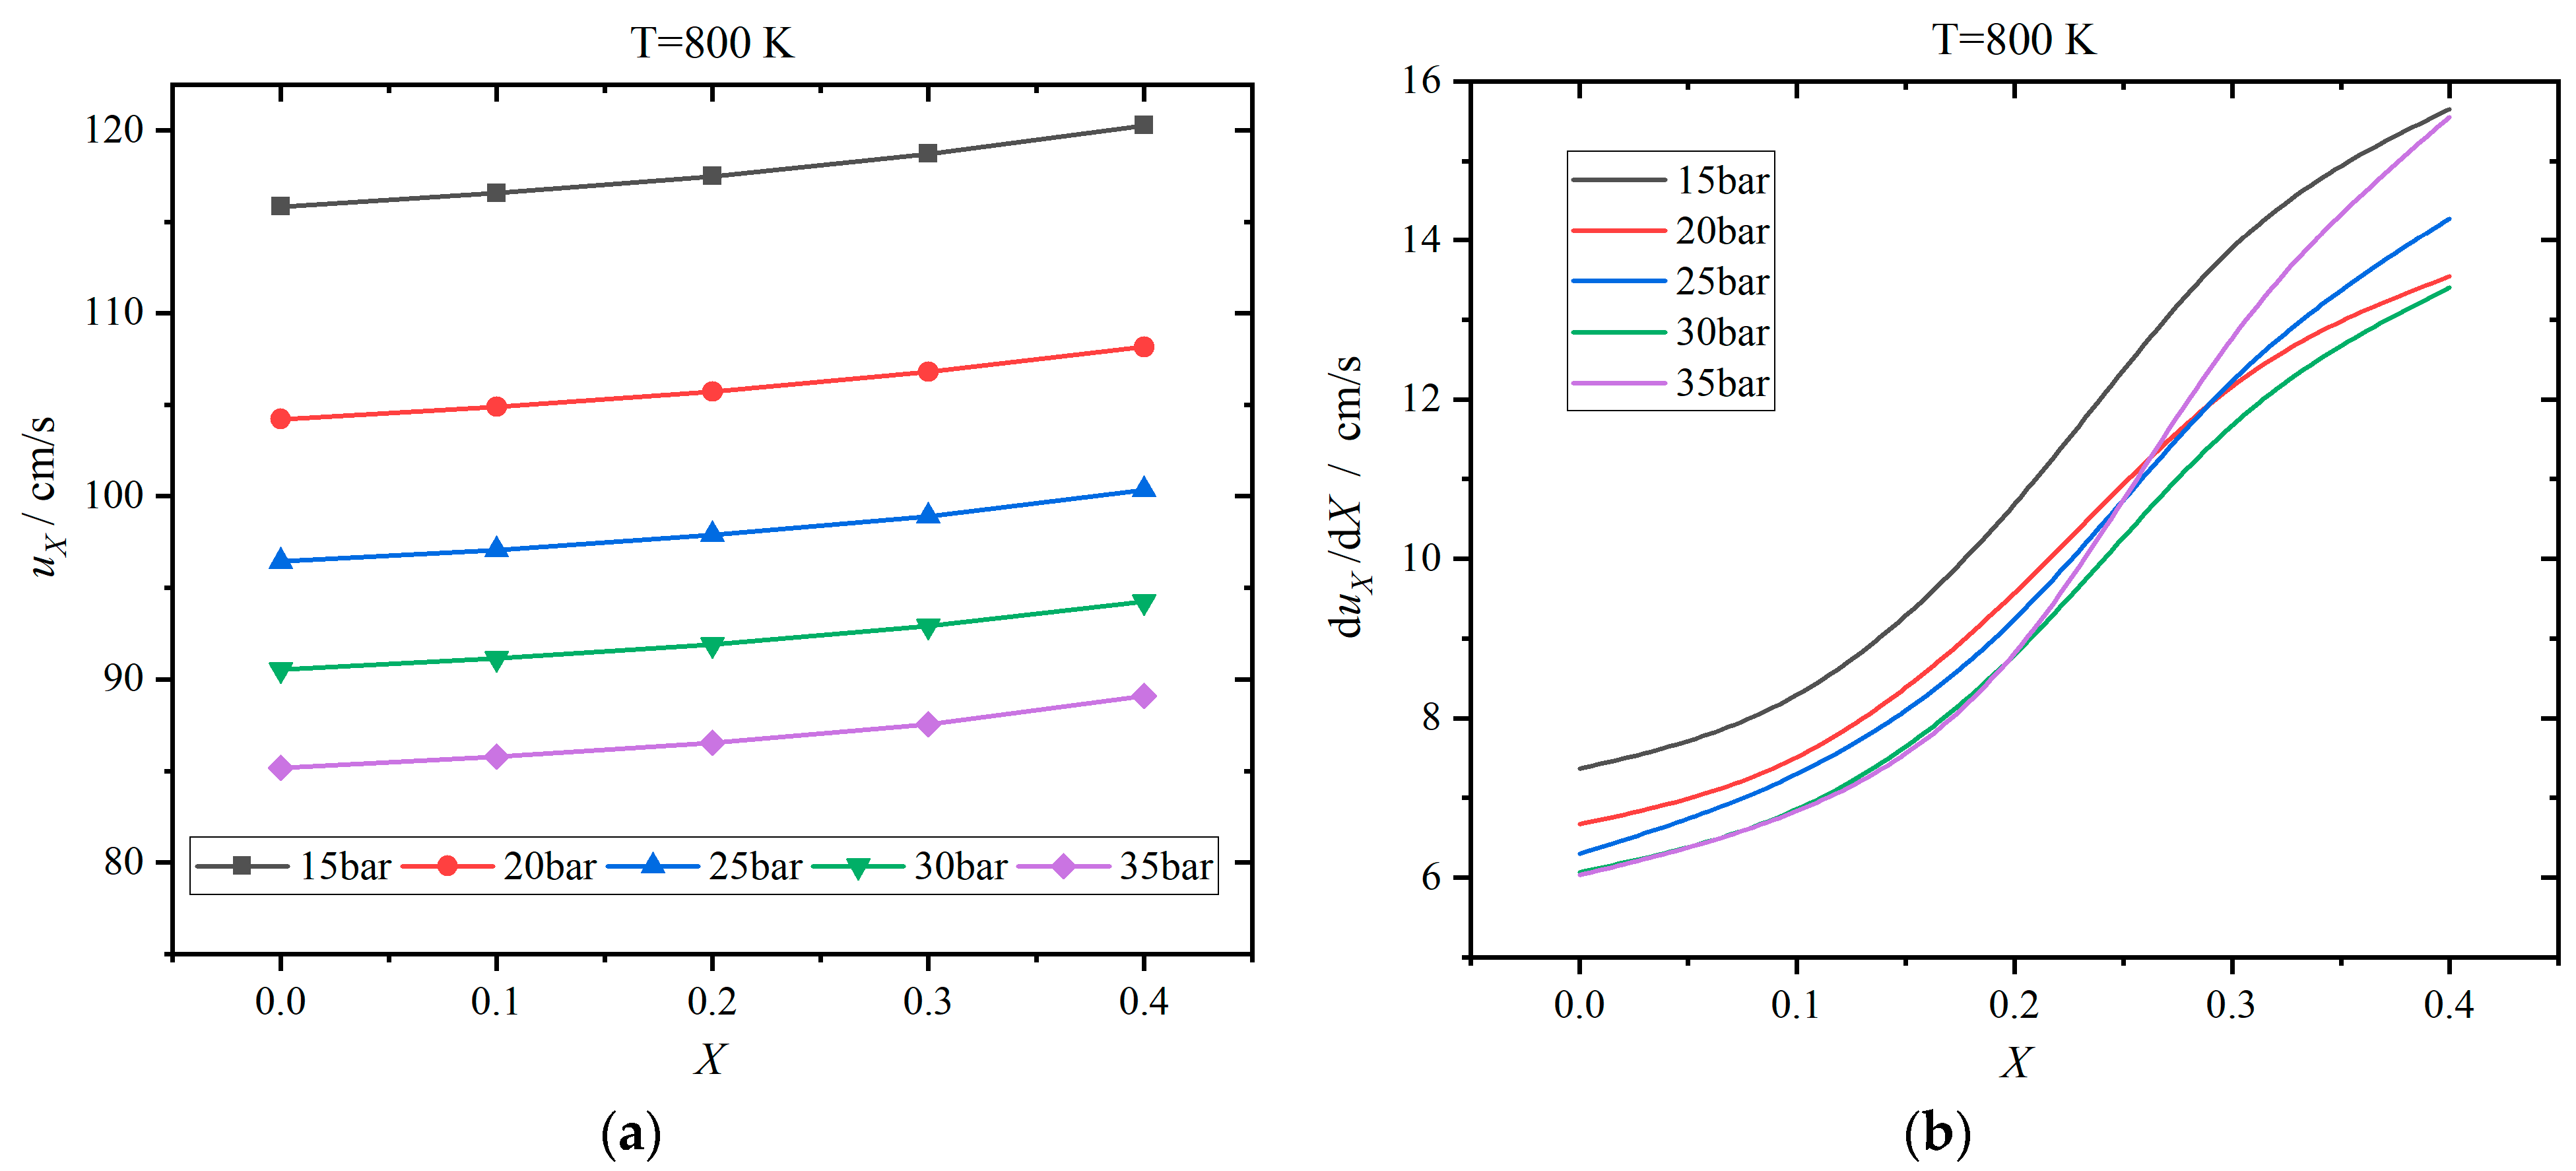
The laminar flame speed varies with the hydrogen addition ratio, and the results for 600 K are shown in
Figure 11.
Figure 12 displayed the results for 800 K. The change rate is defined as the derivative of the laminar flame speed with respect to the hydrogen addition ratio. The laminar flame speed increases gradually as the hydrogen addition ratio increases from 0 to 0.4. This is because the laminar flame speed of hydrogen is apparently greater than that of kerosene. When the temperature is 600 K, the laminar flame speed varies from 40 cm/s to 60 cm/s, which is increased by 3.34–3.70% as
X rises from 0 to 0.4. The higher the pressure, the smaller the laminar flame speed. When the temperature rises to 800 K, the laminar flame speed increases to the range of 85–120 cm/s and is enhanced by 3.85–4.60%. The effects of pressure are similar to the case of 600 K. The change rate also increases as the hydrogen addition ratio ascends, manifesting a nonlinear relationship. When the hydrogen addition ratio is in the proximity of 0.2, the change rate increases more rapidly. Meanwhile, the change rate drops evidently as the pressure rises from 15 to 35 bar, as shown in
Figure 11b. However, when the temperature enters the NTC interval as in the case of 800 K, the behaviors of change rate are more complicated, as displayed in
Figure 12b. Herein, the change rate declines apparently as the pressure ascends when the pressure is not greater than 20 bar. However, the change rate is essentially insensitive to the pressure when the pressure exceeds 20 bar. Only when the pressure rises to 35 bar with an
X of greater than 0.2, the change rate increases evidently again. When the hydrogen addition ratio is high, the change rates of the laminar flame speed at 15 and 35 bar are relatively large.
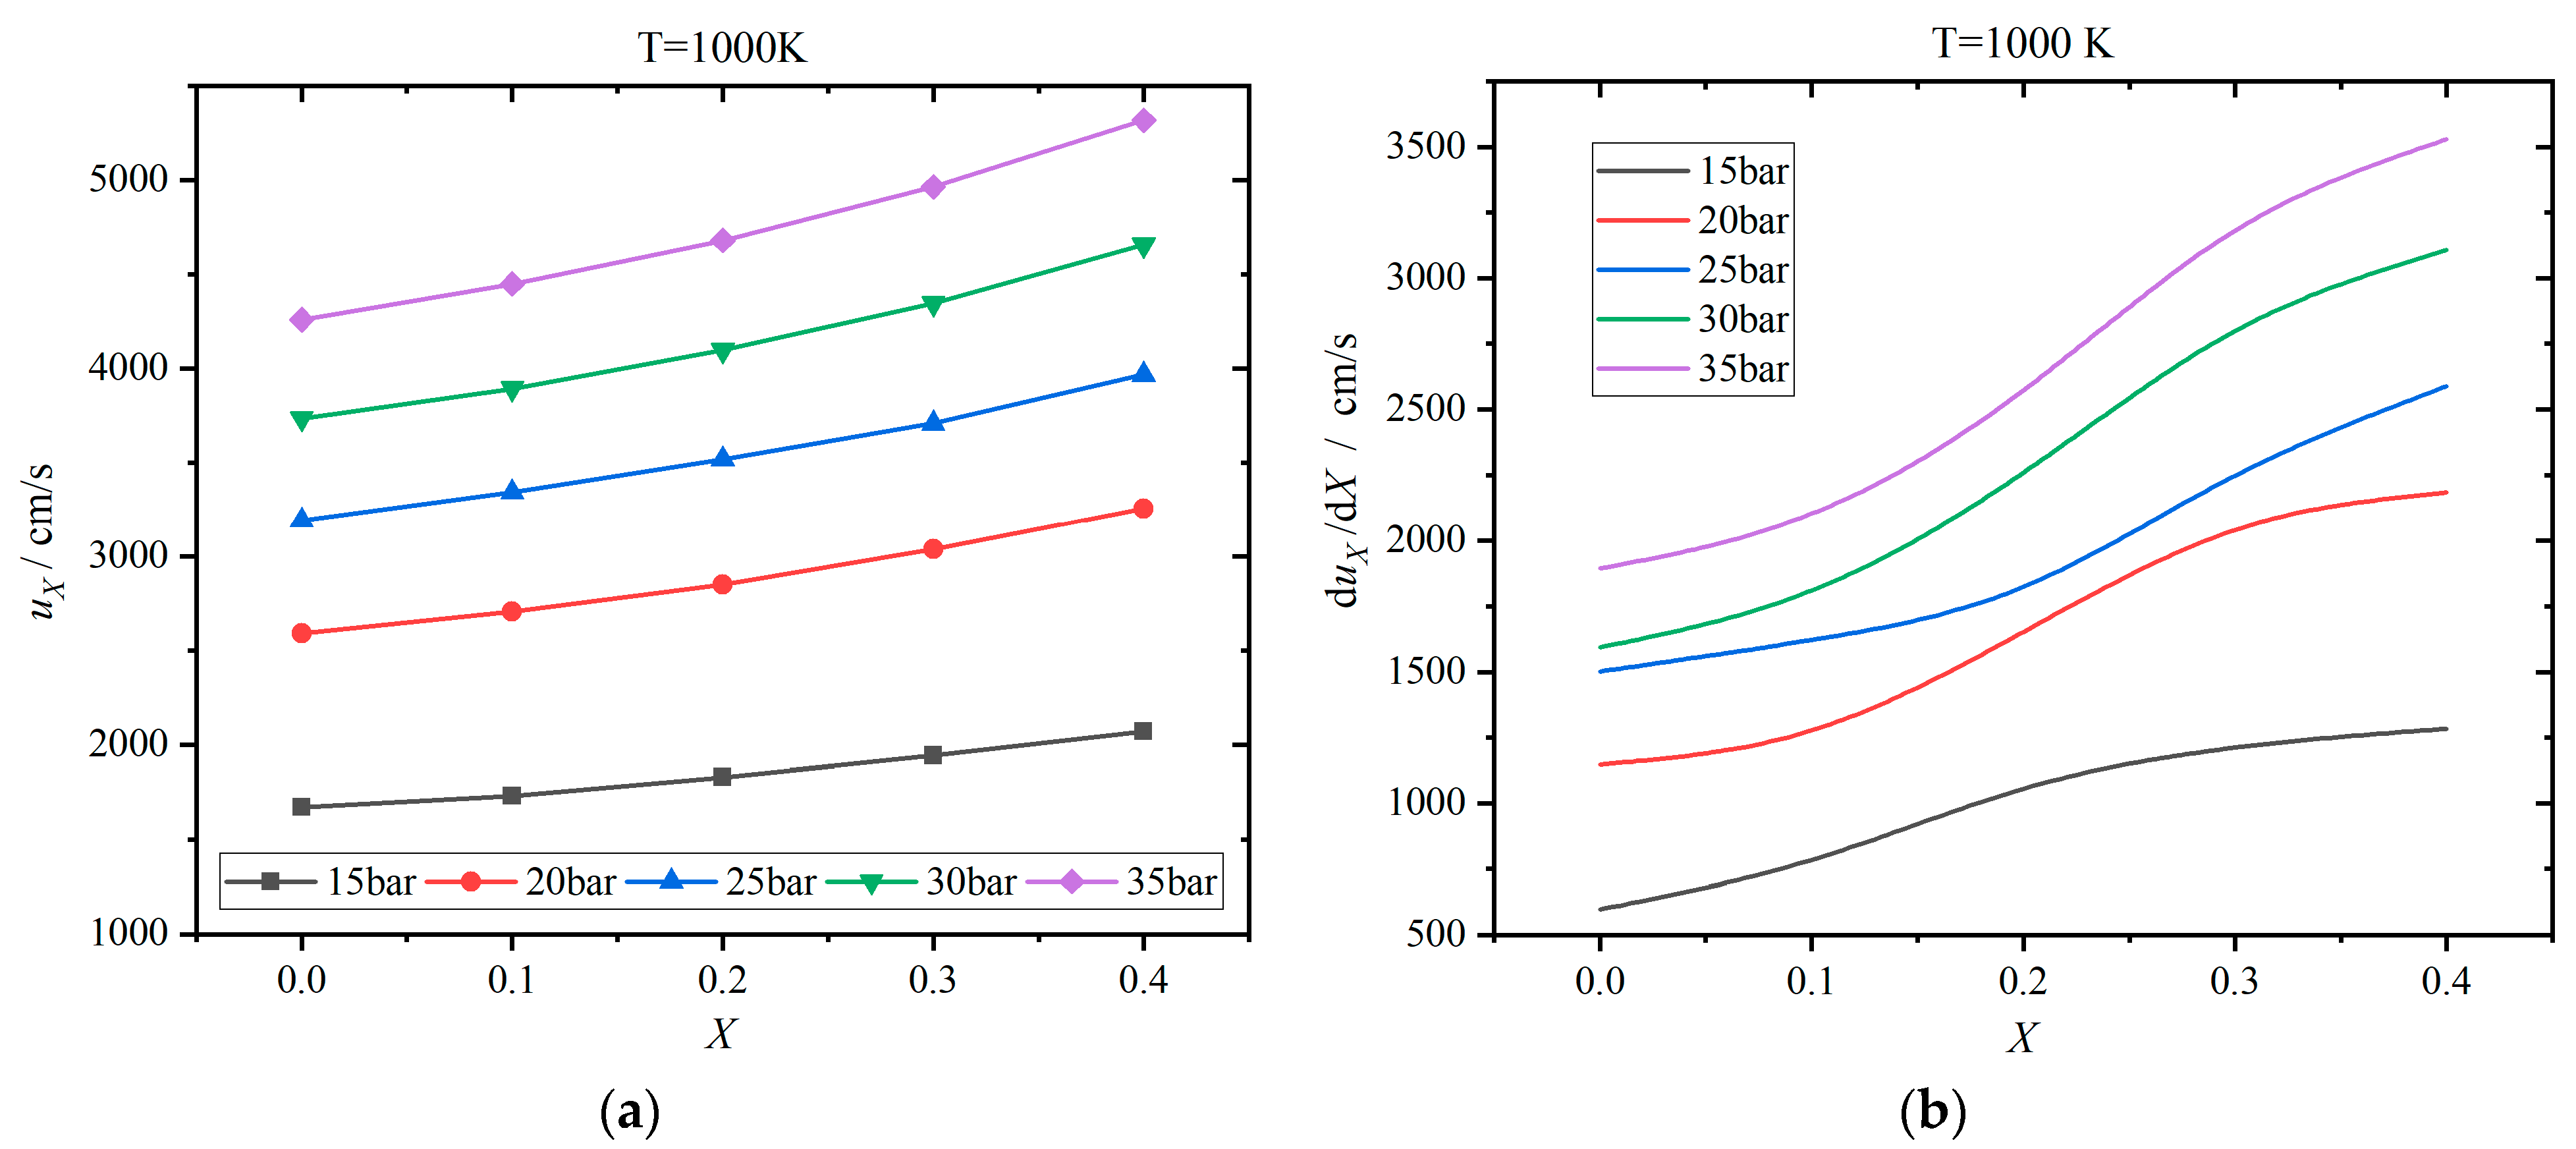
Figure 13 shows the results at 1000 K. The laminar flame speed increases to 1500–5500 cm/s at 1000 K, which is significantly greater than those in
Figure 11 and
Figure 12. Particularly, the laminar flame speed is increased by 23.85–24.82% as the hydrogen addition ratio rises from 0 to 0.4. Furthermore, the laminar flame speed enlarges as the pressure increases, exhibiting a controversary trend compared with
Figure 11 and
Figure 12. Meanwhile, the change rates are also improved by almost two orders of magnitude, as shown in
Figure 13b. In addition, the change rate rises apparently as the pressure increases from 15 to 35 bar.
Table 3 lists the top 10 reactions that affect the laminar flame speed based on the HYCHEM-SK mechanism. Compared with the case of pure kerosene, the sensitivities of R49, R120, R132 are improved, and their reaction rates exceed those of R40, R152, and R162. The sequence of the other seven reactions remains invariant.
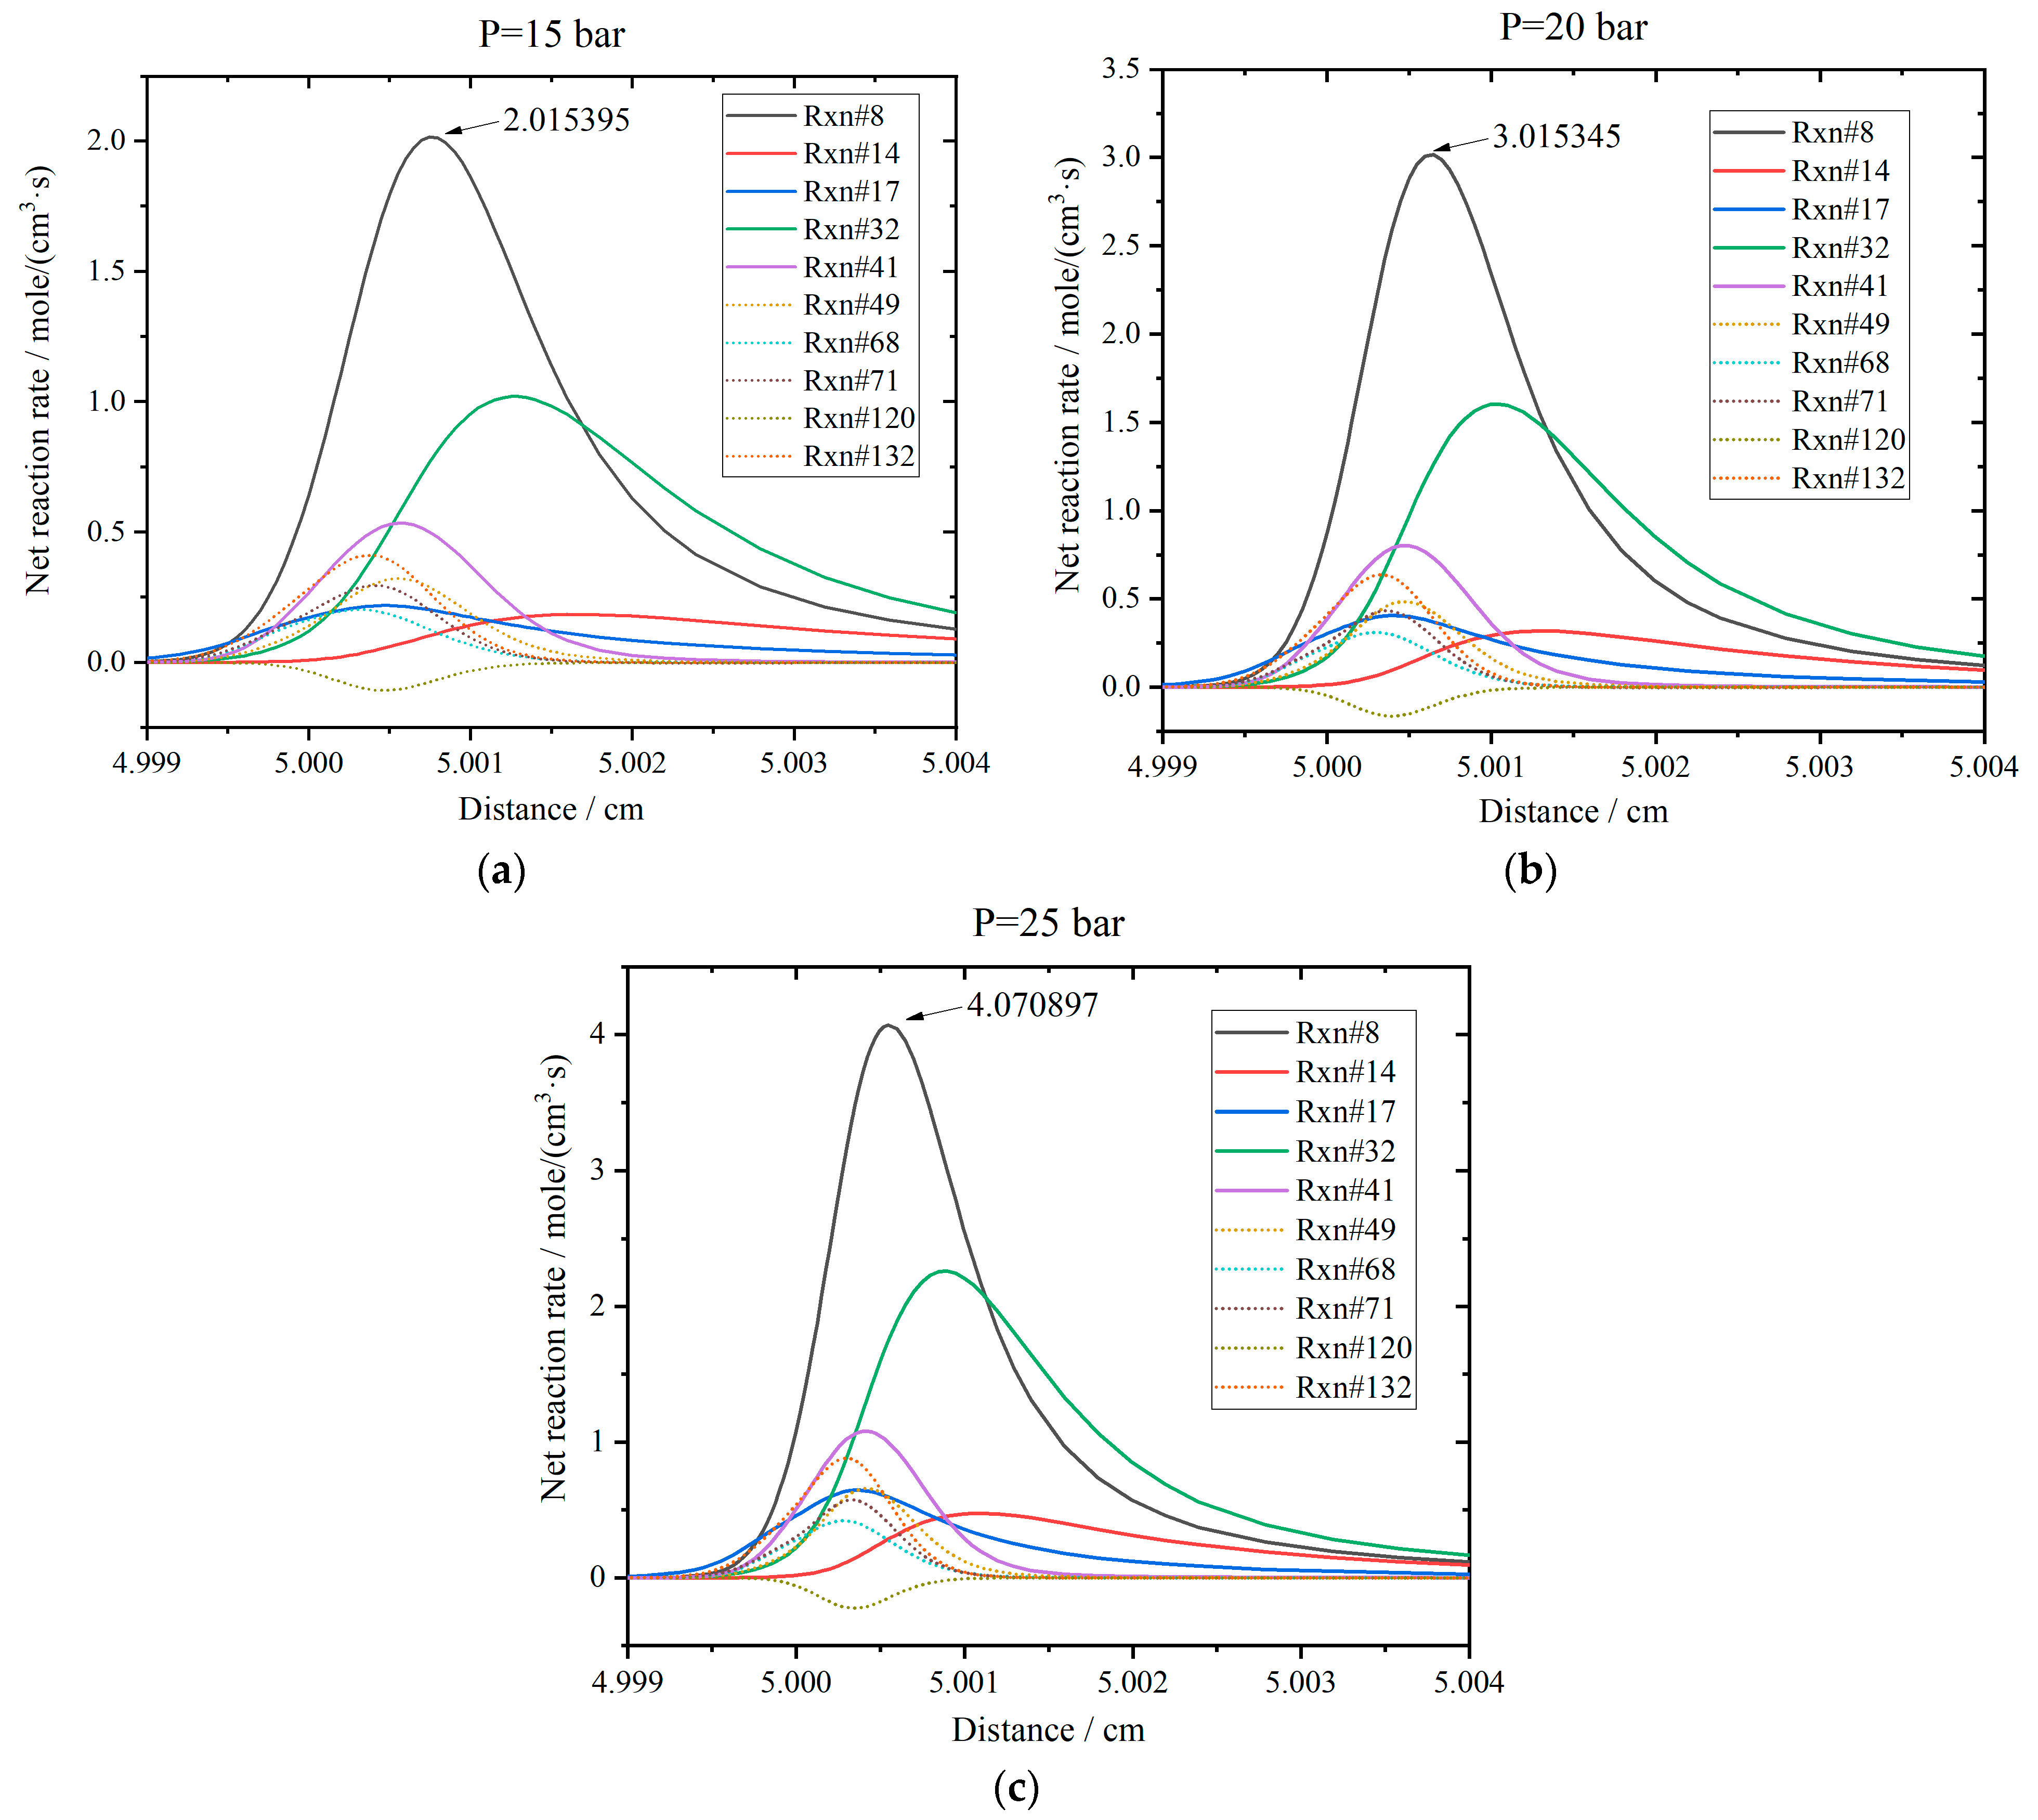
Figure 14 shows the profiles of net chemical reaction rates at the flame front. The net reaction rate is the difference of the rates between the forward and backward reactions. In this figure, the flame front propagates to the position of about 5 cm. The initial temperature is 800 K, and the hydrogen addition ratio is 0.2 for the stoichiometric mixture. When the pressure is 15 bar, reactions R8, R32, and R41 exhibit the largest net reaction rates. Reactions R32 and R41 generate H, and reaction R8 consumes H. The profiles of the net rate are asymmetric, and the concentration of H is relatively larger before the flame front. The maximum rate is 2.015 mole/(cm
3·s) for R8. The sequence of reaction rates is R8 > R32 > R41 > R132 > R49 > R71 > R17 > R68 > R14 > R120. The reaction rate of R120 is negative, meaning the backward reaction is dominant, and H radials are consumed. When the pressure rises to 20 bar, the net rates of all the reactions increase. The maximum of R8 arrives at 3.015 mole/(cm
3·s). The sequence is the same in the case of 15 bar. However, the net rates of R14 and R17 increase evidently. When the pressure is 25 bar, the net rates continue to increase, and the peak arrives at 4.071 mole/(cm
3·s) for R8. The sequence changes to R8 > R32 > R41 > R132 > R49 > R17 > R71 > R14 > R68 > R120. The net rates of R17 and R14 increase apparently and exceed those of R71 and R68. Therefore, the sensitivities of R14 and R17 are improved. Meanwhile, R8 and R32 are the first two reactions in the sequence and can be deemed as the rate-determining steps. In addition, the positions of the peaks shift to the left slightly as the pressure increases.
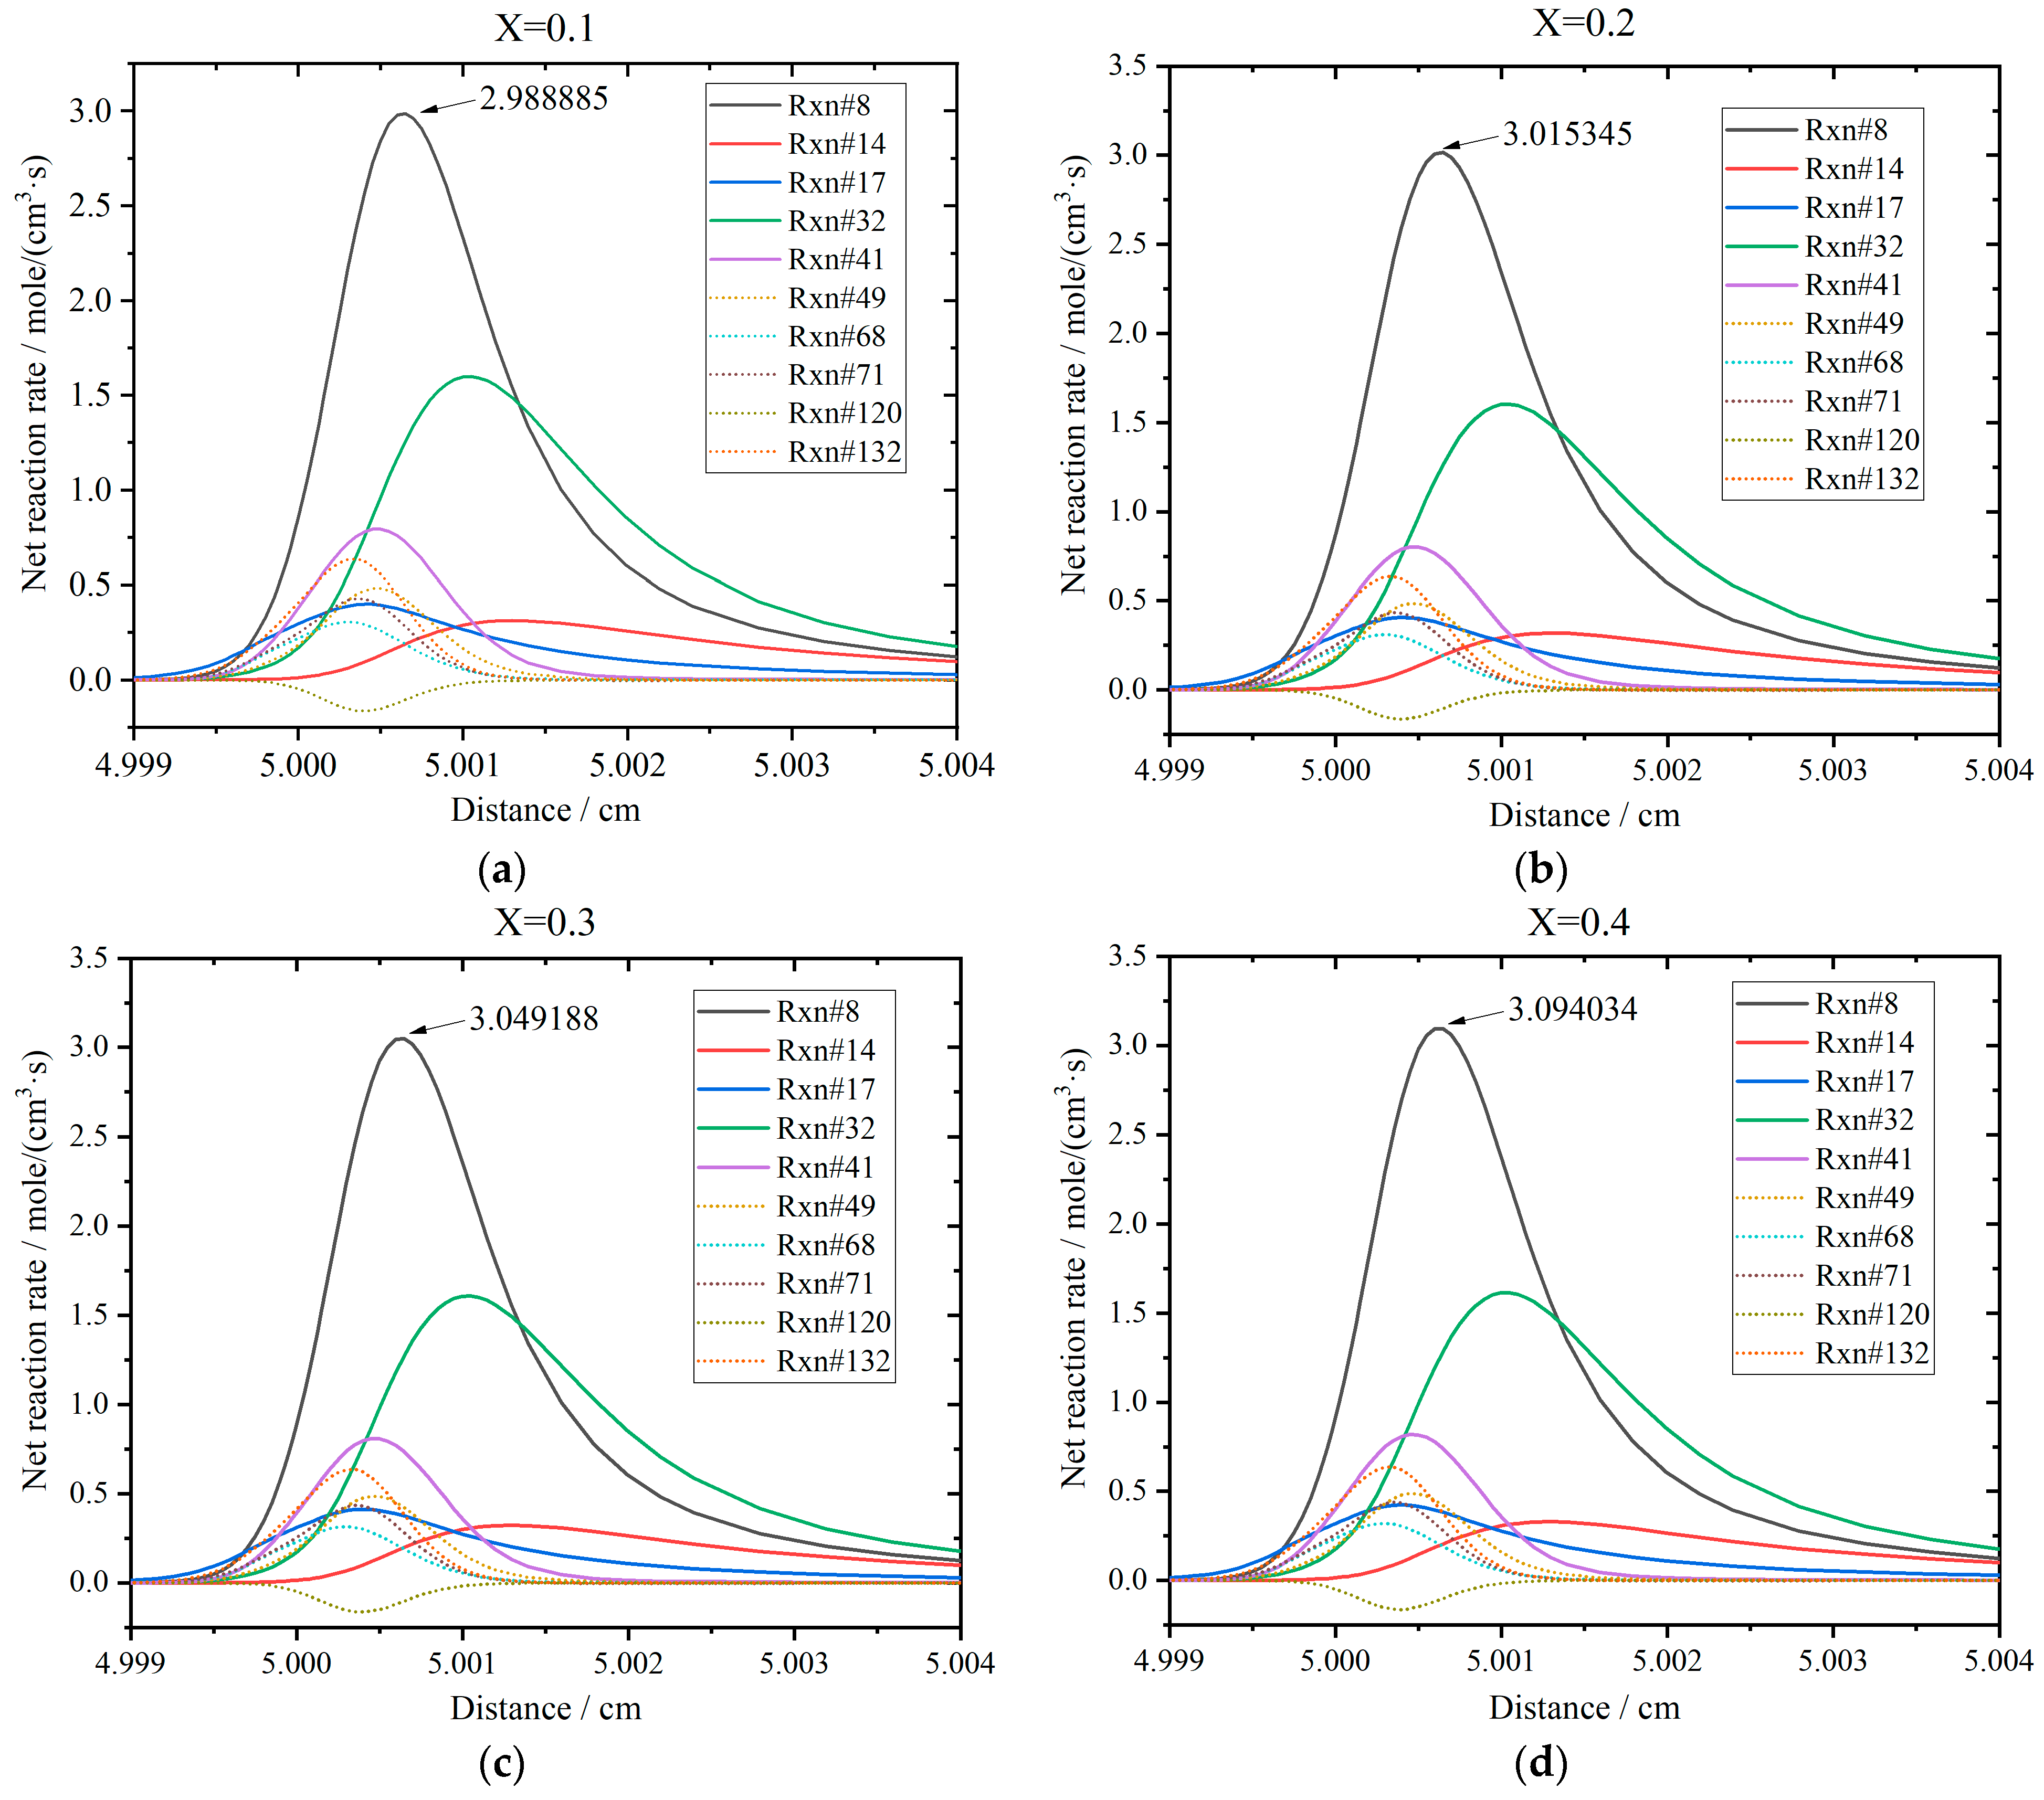
The profiles for the net rates of the ten reactions are shown in
Figure 15 when the hydrogen addition ratio increases from 0.1 to 0.4. The initial temperature and pressure of the stoichiometric mixture are 800 K and 20 bar. The direction of R120 is backward, while the others are forward. When
X is 0.1, the sequence of the net rates is R8 > R32 > R41 > R132 > R49 > R71 > R17 > R68 > R14 > R120. The peak of R8 is the largest as 2.989 mole/(cm
3·s). The net rate of each reaction increases slightly for every 0.1 increment in
X. When
X = 0.2, the peak of R8 is 3.015 mole/(cm
3·s); when
X = 0.3, the peak of R8 further increases to 3.049 mole/(cm
3·s); when
X = 0.4, the peak of R8 rises to 3.094 mole/(cm
3·s). The sequences of these three cases are the same as that of
X = 0.1.
The net rates of the main reactions are all increased as the hydrogen addition ratio rises. This is because seven reactions (R8, R14, R17, R32, R41, R68, R120) are directly associated with H radicals, and the other three reactions (R49, R71, R132) are also connected with H indirectly via OH, indicating that the concentrations of H and OH are important parameters affecting the laminar flame speed. As the hydrogen addition ratio increases, H radicals increase evidently. Therefore, the forward coagulation reaction of R120 is suppressed. Meanwhile, OH concentration increases via R8, which will accelerate the H-abstraction reactions of R71 and R132 and the generation of CO2 via R32. Finally, the concentration of H2O increases via R14, and CO is consumed rapidly via R32. Therefore, the net rate of R41 is enhanced and further promotes the oxidation of C1, shown as R49. As a result, the laminar flame speed increases as the hydrogen addition ratio ascends. In addition, the increase of the net rate for every 0.1 increment in the hydrogen addition ratio is far less than that for every five-bar increment in the pressure. Hence, the effects of the pressure are more significant.
6. Conclusions
The characteristics of premixed combustion of kerosene blending with hydrogen in SI engines were investigated numerically. Detailed chemical reaction mechanisms were employed to simulate the ignition delay time and laminar flame speed of the mixture. Meanwhile, the effects of temperature (600–1000 K) and pressure (15–35 bar) as well as hydrogen addition ratio (0–0.4) were discussed. The main conclusions are summarized as follows:
(1) The ignition delay time of the stoichiometric mixture of kerosene/hydrogen mixture is estimated under the conditions of 600–1000 K and 15–35 bar with a hydrogen addition ratio of 0–0.4. As the temperature rises, the ignition delay time first decreases, then increases when entering the NTC interval, and finally decreases again. When the temperature is less than 750 K, the variation in the pressure almost has no impact on the ignition delay time. However, the ignition delay time will be shortened if the temperature continues to rise. The effect of pressure is more significant in the NTC range compared with even greater temperatures.
(2) The ignition delay time decreases slightly, while the same NTC interval is maintained as the hydrogen addition ratio increases. When the hydrogen addition ratio is 0.4, the improvement in overall ignition delay time relative to pure kerosene is 12.84–16.55% at 800 K, almost one order of magnitude greater than that at 1000 K (3.59–4.02%). Meanwhile, the impact of hydrogen addition at 600 K is the smallest (1.13–1.52%).
(3) Increasing the hydrogen concentration of kerosene/hydrogen mixture will promote the path of initial H-abstraction reaction from KERO to KERO- and the following oxygenation reaction of KERO-. In the Tay mechanism, R7, R2, and R98 are the main reactions that accelerate the ignition due to the dehydrogenation of kerosene and the generation of active OH, while reactions of R9, R91, and R121 suppress the ignition evidently because of the formation of stable HO2. The sensitivity of each reaction declines as the hydrogen addition ratio rises. The reactions of R2, R121, and R117 have a relatively large variation owing to the increment in H concentration and the decrement in the concentrations of hydrocarbons, while the reactions of R7 and R9 almost are not affected by the hydrogen addition.
(4) The laminar flame speed increases evidently as the temperature rises. When the temperature is 600 K or 800 K, the laminar flame speed decreases as the pressure increases, while an opposite trend is exhibited at 1000 K. Compared with pure kerosene, the laminar flame speeds with a hydrogen addition ratio of 0.4 are improved by 3.34–3.70%, 3.85–4.60%, and 23.85–24.82% at 600, 800, and 1000 K, respectively.
(5) Hydrogen addition affects the laminar flame speed of kerosene via altering the concentrations of small groups such as H, OH, H2O. The radicals of H and OH are increased apparently as the hydrogen addition ratio rises. Therefore, the H-abstraction reactions of C1 and the following oxidation of HCO are accelerated. The reactions of R8 and R32 in the HYCHEM-SK mechanism exhibit the largest sensitivity for the laminar flame speed.
The relative improvement of the laminar flame speed (23.85–24.82%) is apparently greater than that of the ignition delay time (3.59–4.02%) at 1000 K and 15–35 bar. Therefore, hydrogen addition will be helpful to suppress the knock of kerosene in SI engines. Meanwhile, the ignition delay time decreases apparently in the NTC range, which is beneficial for the ignition and the following flame development in SI engines. More experiments are required to further validate the effects of hydrogen addition on the knock suppression of SI engines with kerosene. The potential improvement in power output via hydrogen addition also needs to be investigated in the future.


