
Modeling the Effects of Electromagnetic Interference from Multi-Wire Traction Networks on Pipelines

 ,
, 
 ,
,
Abstract
:1. Introduction
- Magnitudes and phases of current flowing through the wires of contact suspensions, 6-10-25 kV power lines laid on the supports of the contact network, and rail lines.
- Similar parameters for voltage at the nodal points of the traction network.
- Approach width when pipes are laid parallel to the railway track.
- Parameters of the approach in the case of non-parallel sections.
- Electrical parameters of soils on the approach path.
- -
- The method can determine electromagnetic influences in any technically feasible situations. For example, overhead and cable lines of various designs, current ducts, bus ducts, contact networks of railways, and other elements can act as influencing factors.
- -
- The method employs a systems approach to model electromagnetic influences by calculating power flows within a complex electric power system.
- -
- The adequacy of determining electromagnetic influences is achieved through correct operation in the near, intermediate, and remote zones of the Carson integral.
- -
- The method calculates the induced voltage while considering harmonic distortions of current and voltage in the influencing power transmission line or traction network.
- -
- The method can account for the heterogeneity of electrical parameters of soils along the approach path between the influencing power transmission line (traction network) and the pipeline.
- -
- The approach path of the influencing power transmission line and the affected pipeline can be parallel, converging, or complex.
- -
- The method enables the determination of the technical performance of devices used to reduce induced voltage, such as shielding wires.
- -
- The method can accurately consider dedicated means of pipeline grounding, which minimizes the impact on corrosion protection systems.
- -
- In addition to surface pipelines, underground structures can also be properly taken into account.
2. Problem Statement
- Adequately consider all factors affecting the levels of induced voltage on the components of the structure and the current passing through the pipes.
- Calculate induced voltage and current based on the operational parameters of the traction network and the power supply system [34].
- Such models rely on modeling methods in phase coordinates, which are implemented in the Fazonord software [35]. Below are the results of modeling the voltage induced by multi-wire traction networks on pipelines.
3. Determination of Induced Voltage Based on Phase Coordinates
- Construction of a conductivity matrix without considering capacitive couplings between wires.
- Addition of capacitive couplings.
- modeling the train schedule,
- building instant diagrams that take into account the position of trains in space for the given moment of time and the magnitude of non-traction loads,
- identifying power flow for each instant diagram, and
- calculating the summary indicators of the modeling process.
- identifying the position of each train at the current moment of time based on the traffic schedule;
- calculating the active and reactive power of the load at the node corresponding to the train’s position based on information about traction currents, train weight, and railway milepost;
- redefining the lengths of the catenary system components according to the position of the trains;
- recalculating the models of the catenary system components and integrating them into the stationary part of the calculation scheme. Once this step is completed, the next instant diagram is prepared for the calculation of operating parameters.
- Distributed generation
- FACTS devices
- Multiphase transmission lines
- Gas-insulated and cryogenic power lines
- Phase shifting devices
- Current limiters
- Controlled devices for unbalance elimination
- Active harmonic conditioners
- Surface and underground cable lines with insulation from highly cross-linked polyethylene
- The 25 kV traction network of a traditional design.
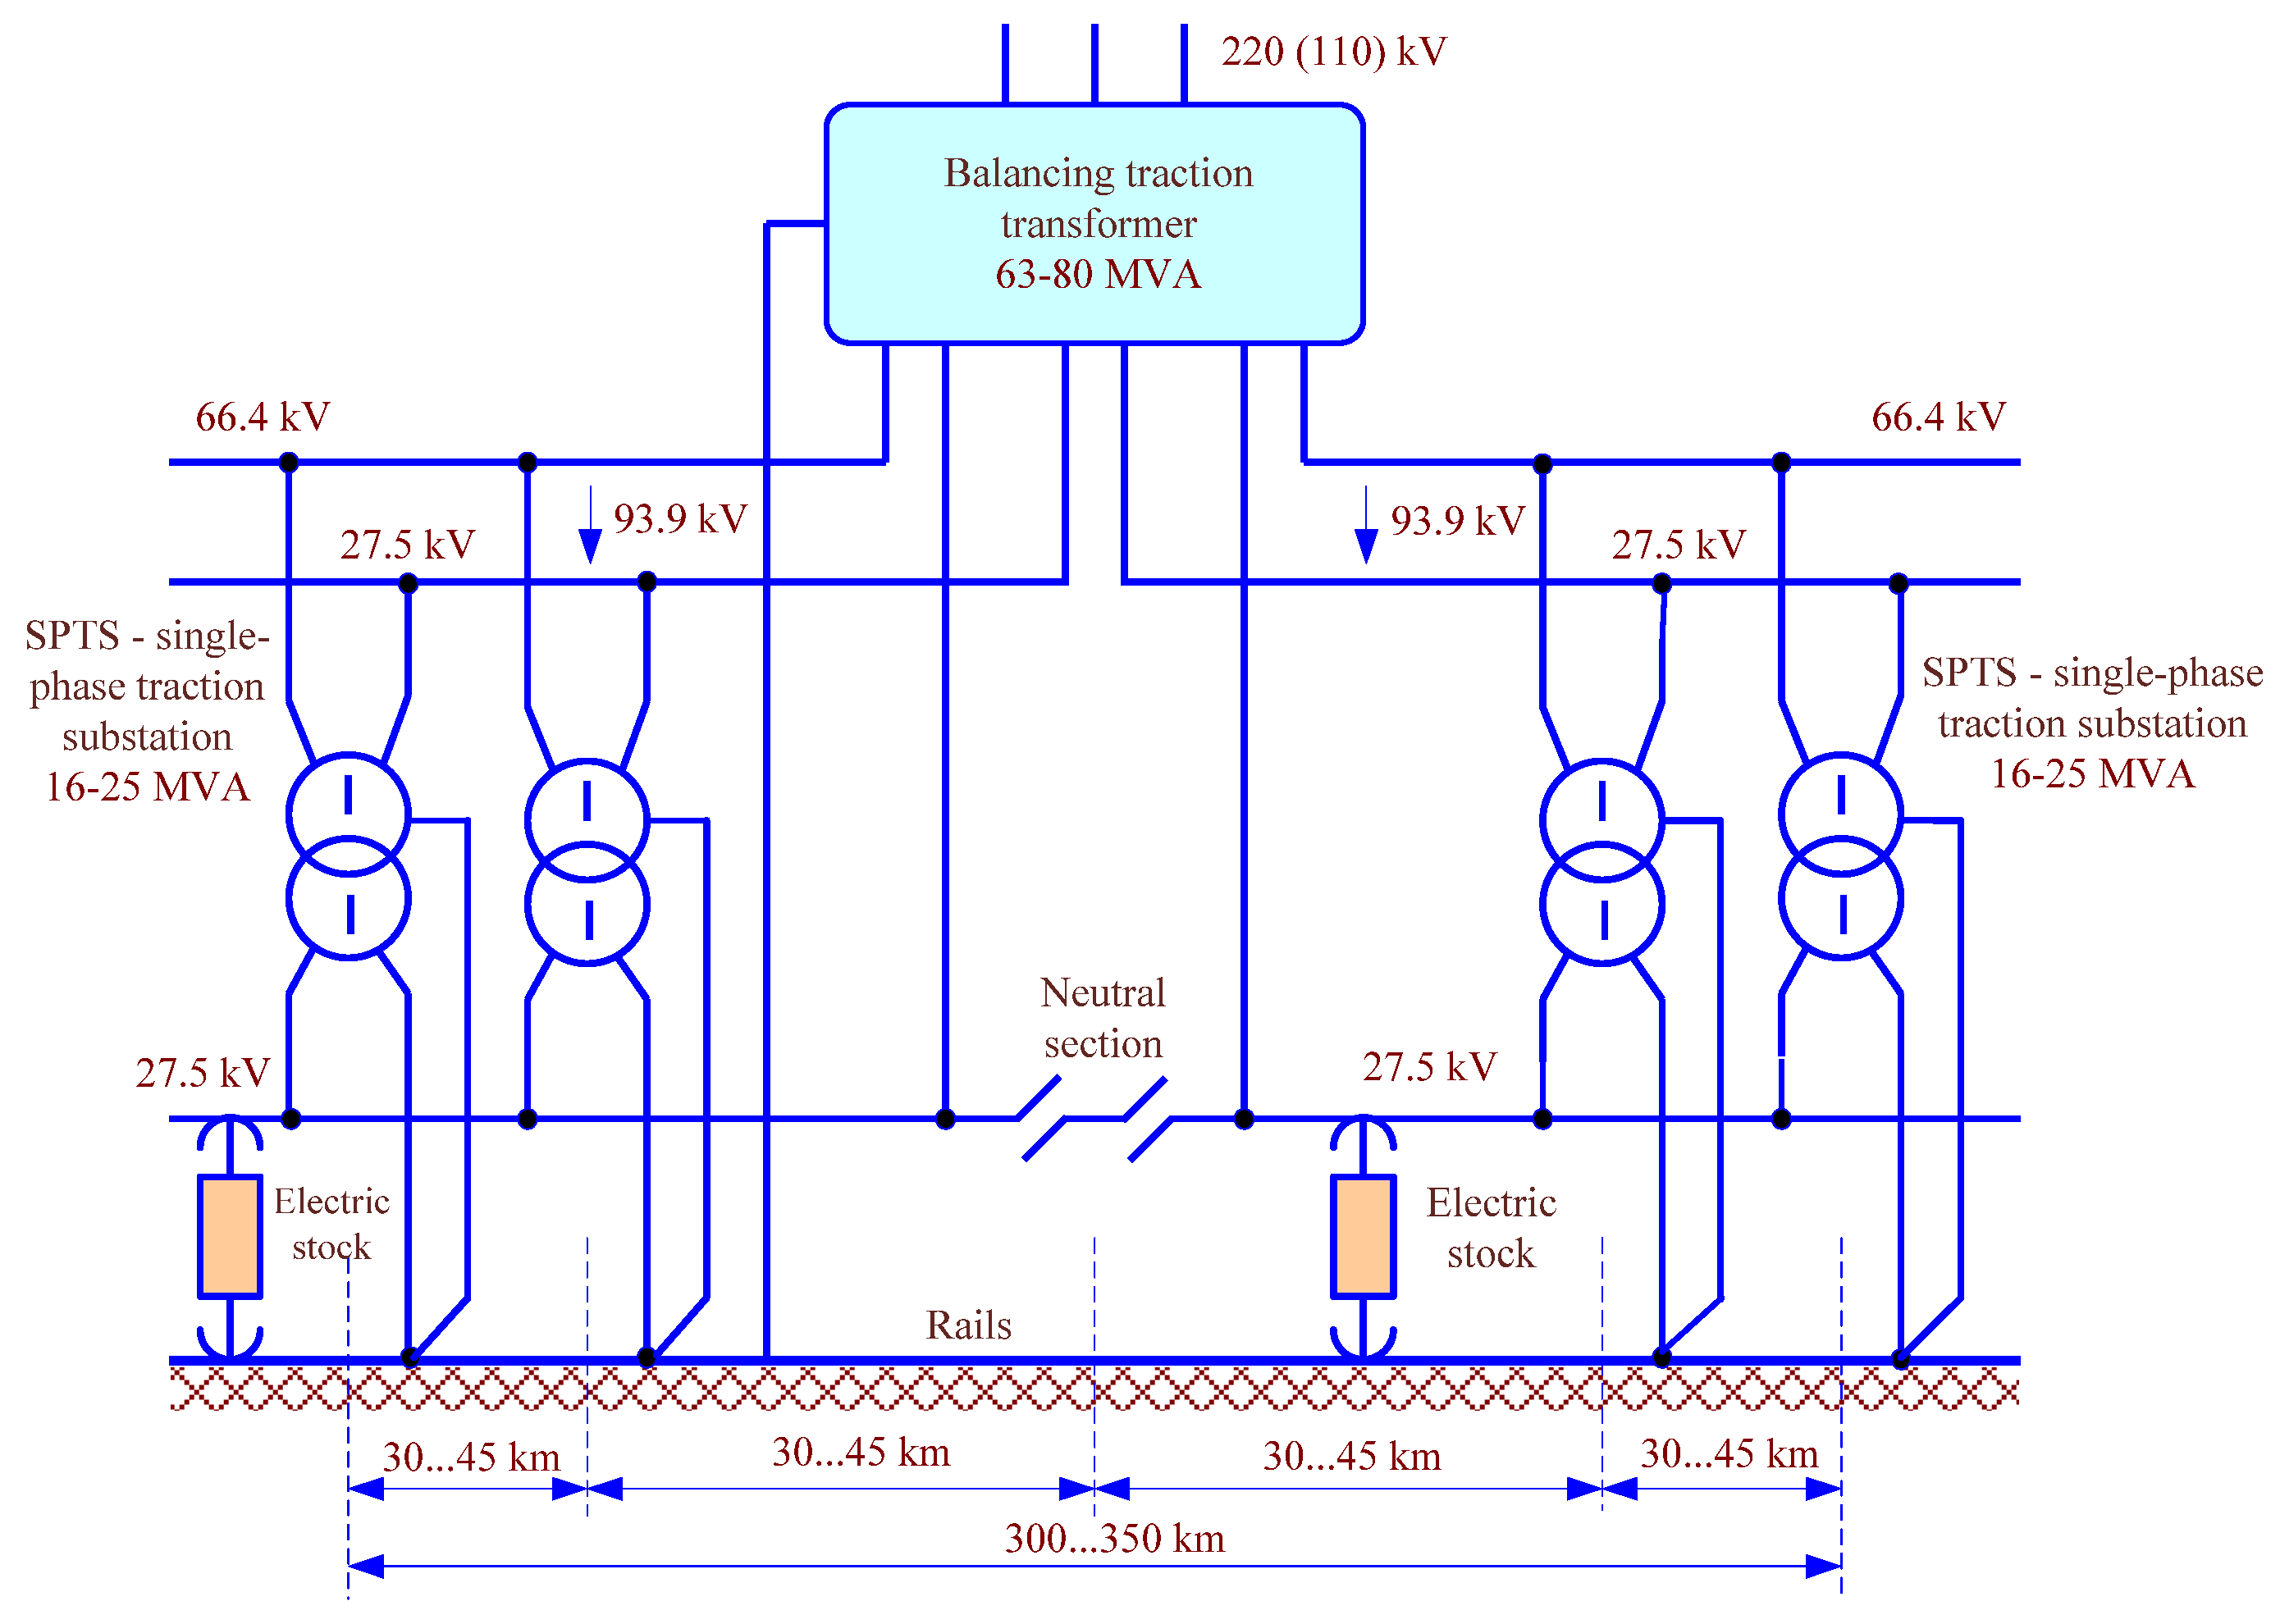
- The prospective traction network with balancing transformers [38].
- The multi-track traction network of a railway station.
4. The 25 kV Traction Network
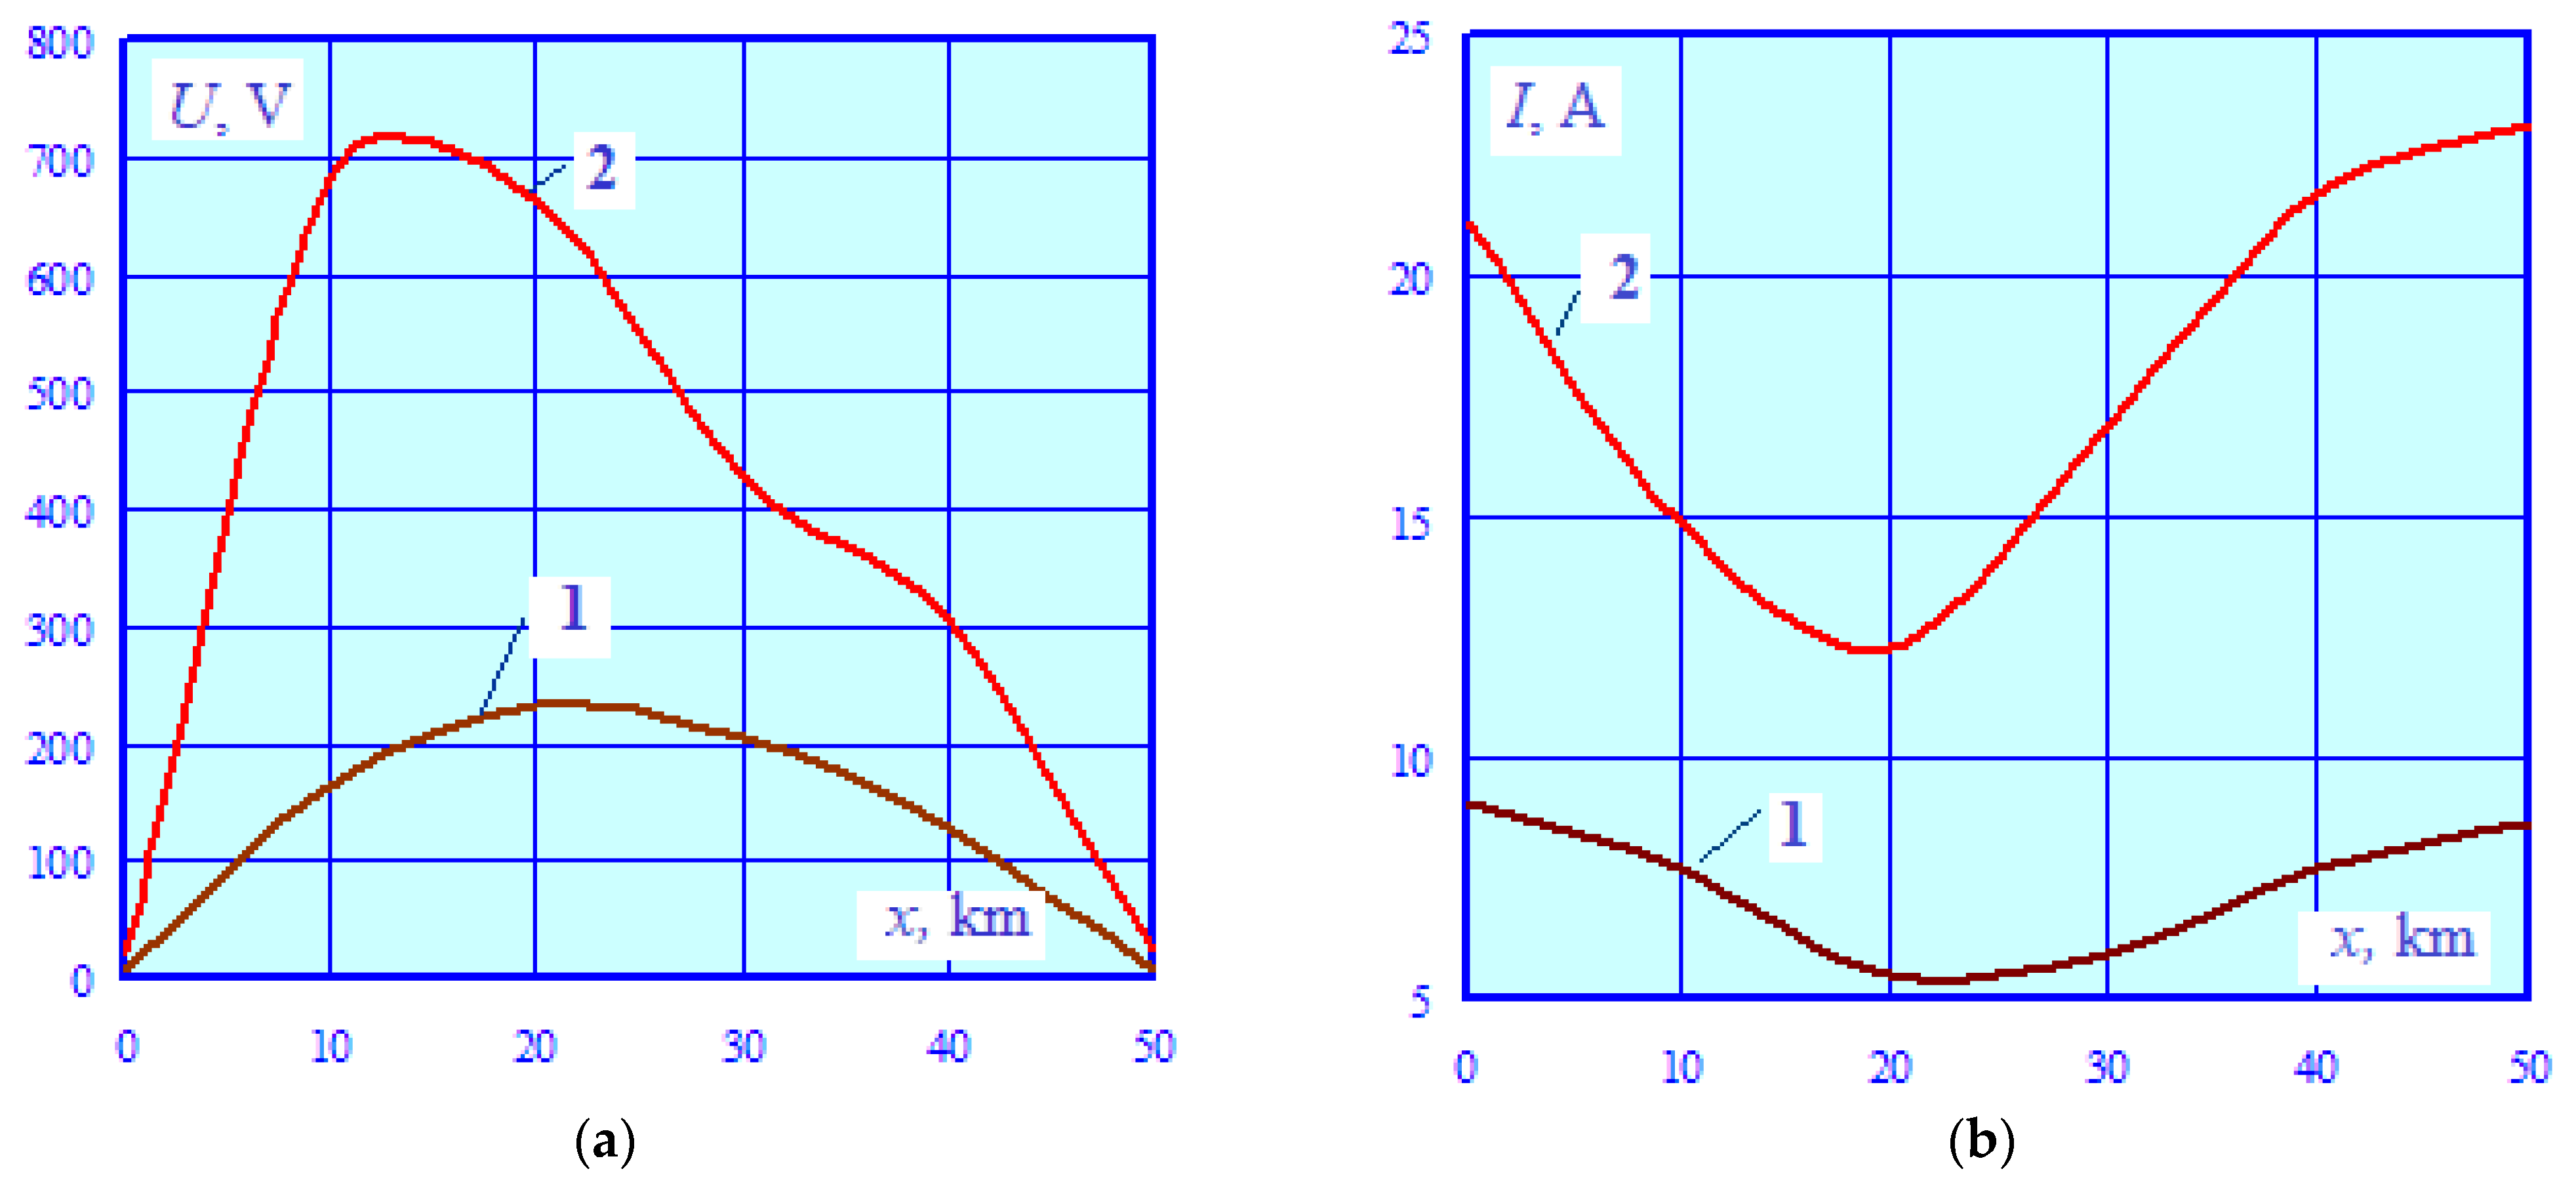
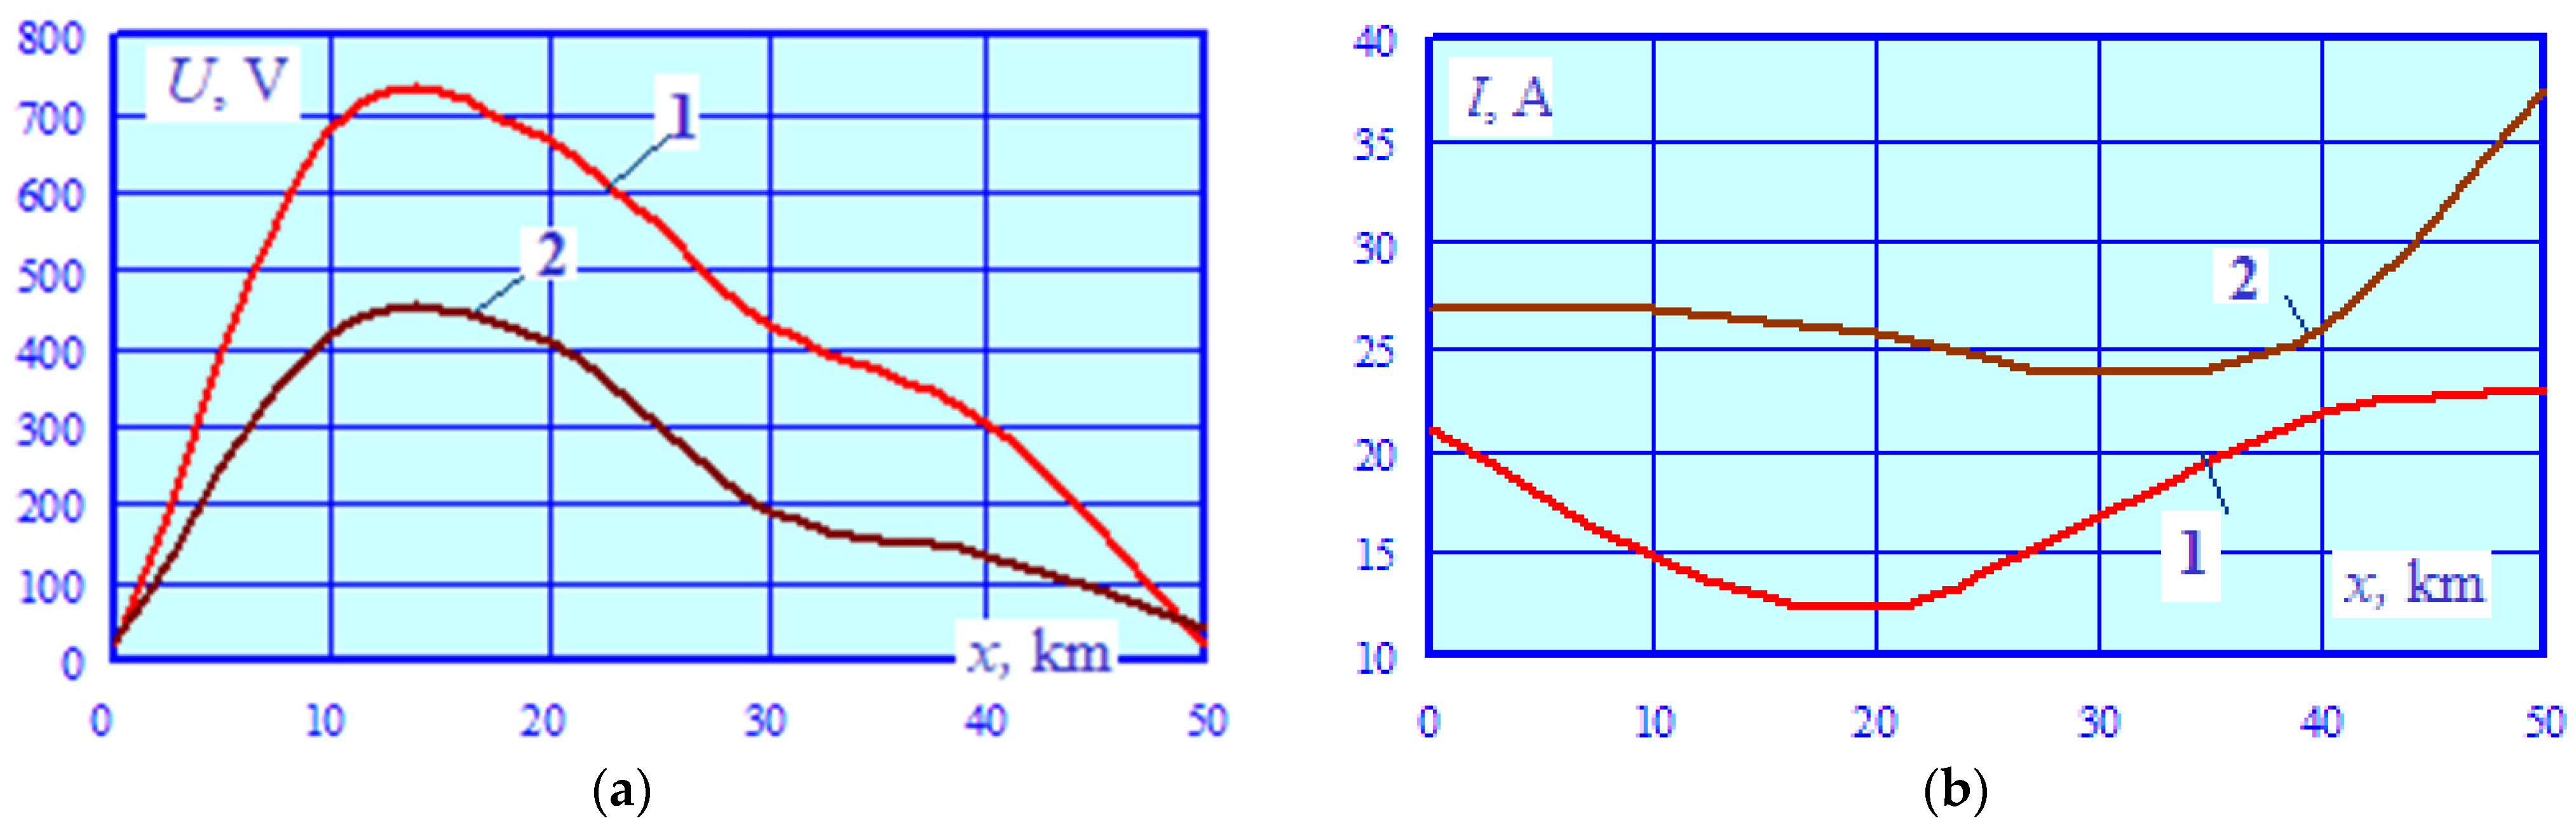
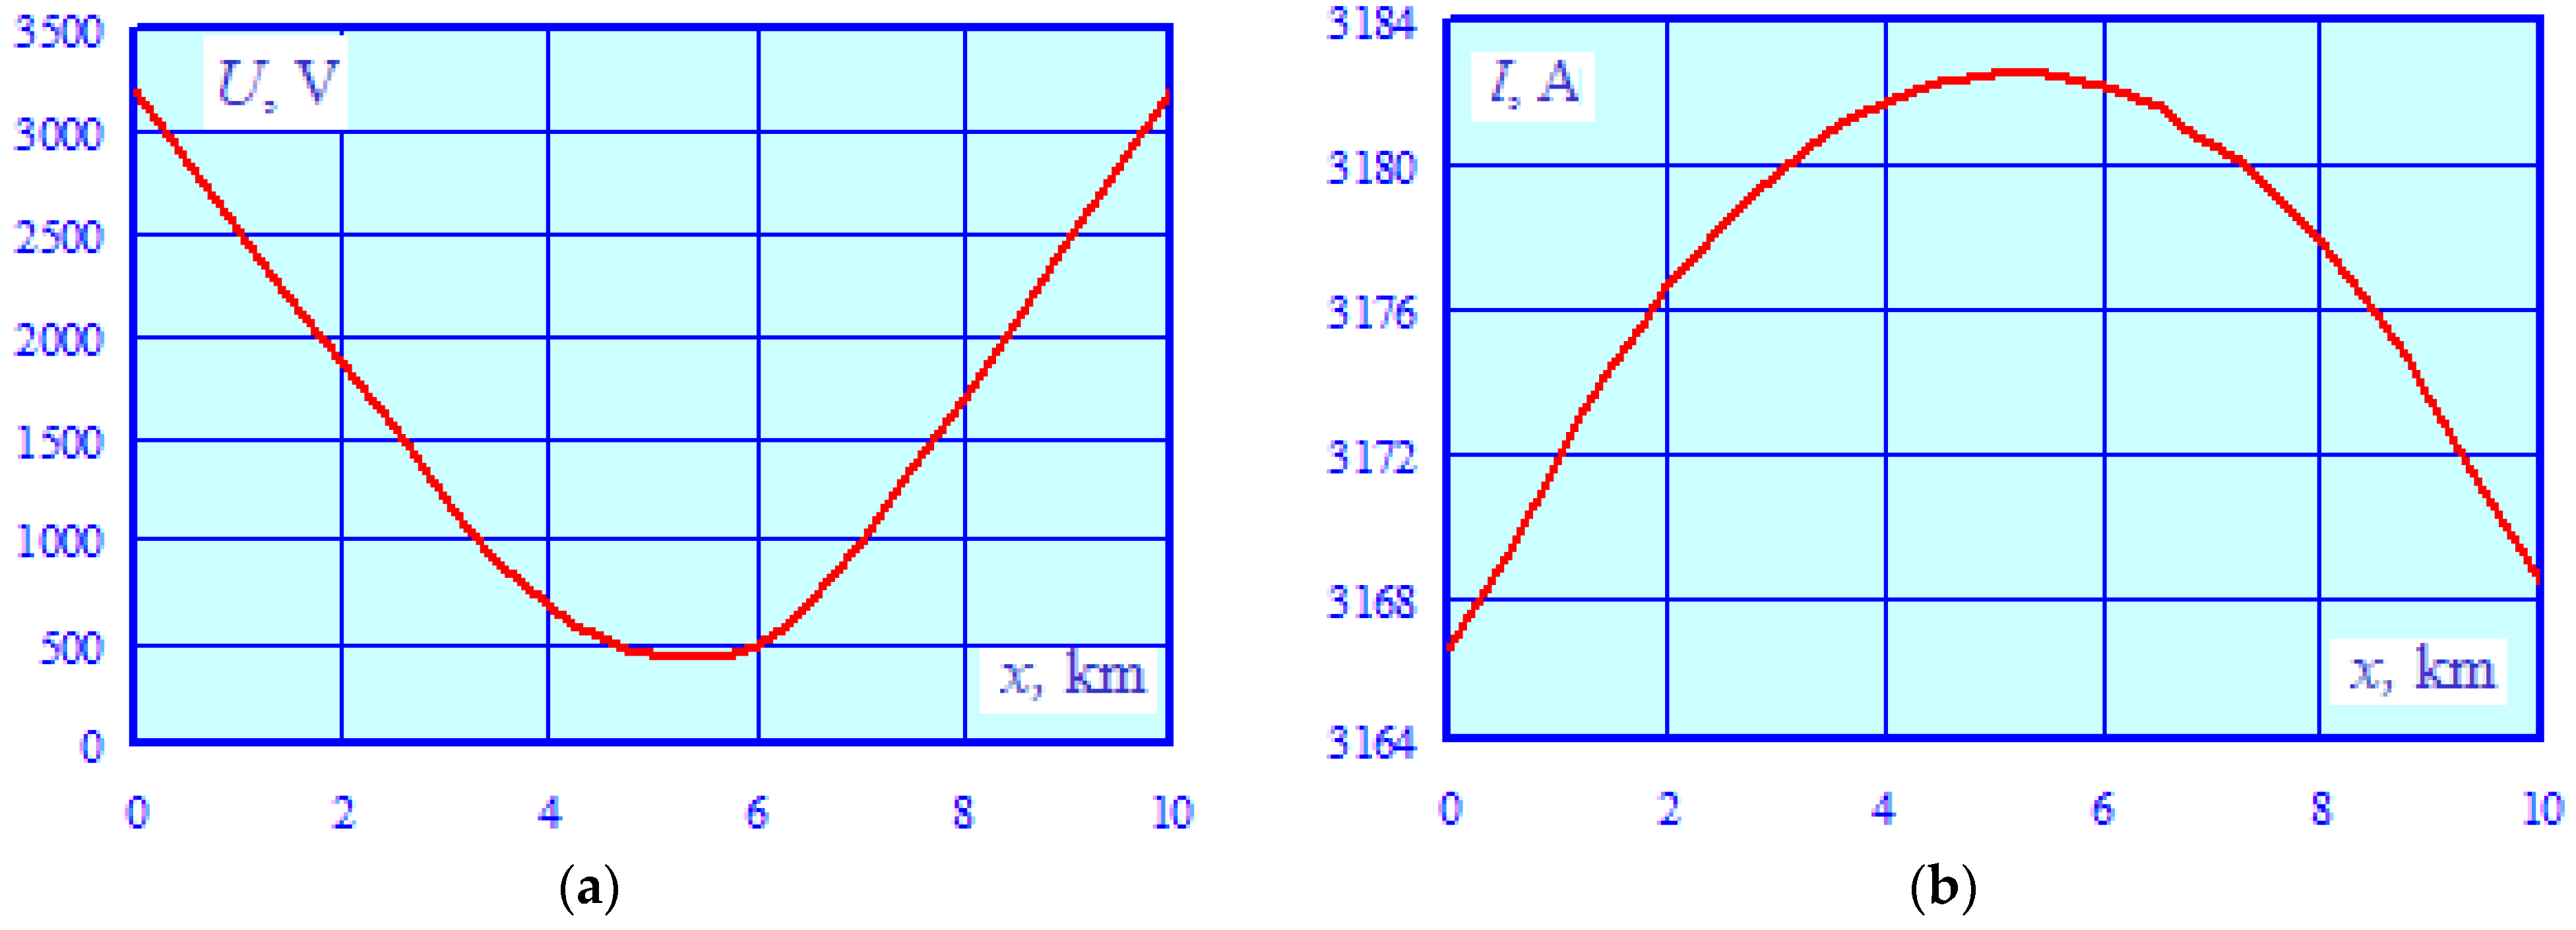
- The electromagnetically unbalanced 25 kV traction network has significant electromagnetic interference effects on the parallel pipeline. The maximum levels of induced voltage at individual points along the pipe were within the range of 300–670 V, with a peak approaching 700 V at the coordinate x = 10 km, which significantly exceeds the permissible level of 60 V [2]. It should be noted that these induced voltage values were obtained with an insulation conductivity of G = 0.002 S/km, which is typical for structures with short periods of operation. Over time, this parameter can decrease to 0.4 S/km [4]. In this case, the distributed grounding will be amplified, which will lead to a noticeable decline in the induced voltage. For example, calculations for a value of G = 0.05 S/km show that, with other factors held constant, the maximum induced voltage decreases to 170 V.
- The current flowing through the pipe, which exceeds 20 A, can have a negative effect on corrosion protection devices (CPD).
- Reducing in the electromagnetic interference effects of the traction network can involve the following measures: reducing the length of parallel sections between the pipeline and the railway line, increasing the width of the approach, and installing additional grounding (in this case, the pipe can be connected to additional grounding conductors through blocks of capacitors to exclude the CPD malfunction). The proposed method and developed digital models will enable the selection of the most rational measures to mitigate the electromagnetic interference effects of traditional traction networks.
5. Prospective Traction Power Supply Systems with Balancing Transformers
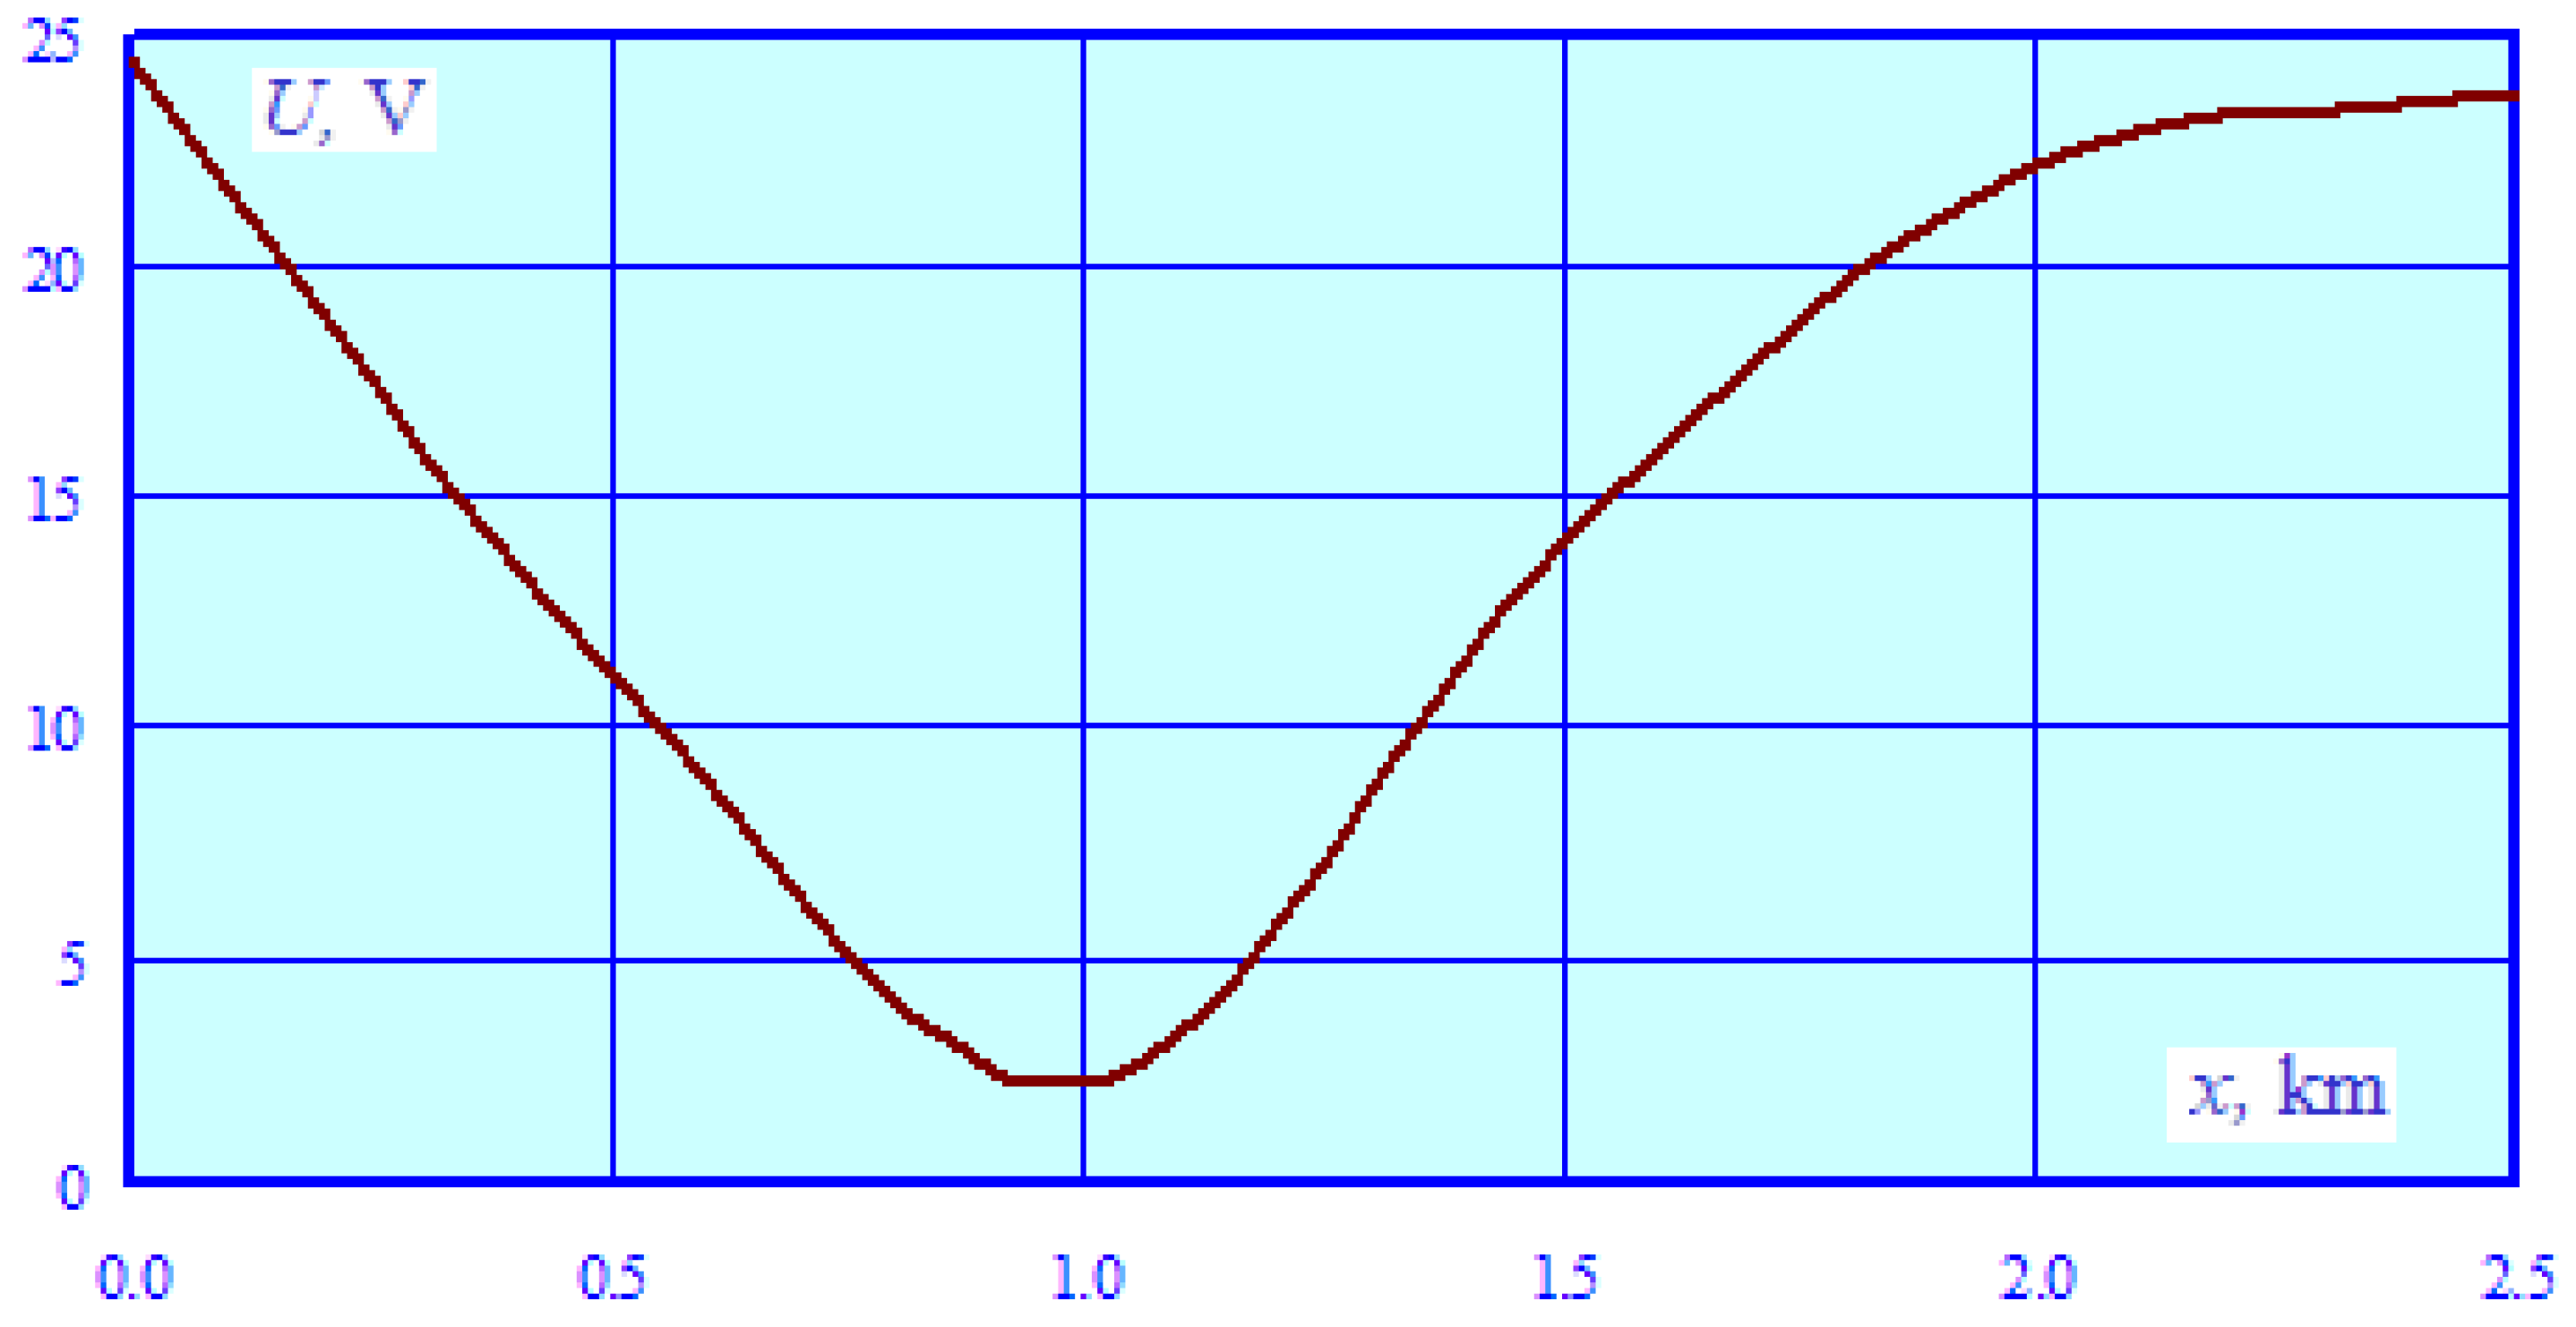
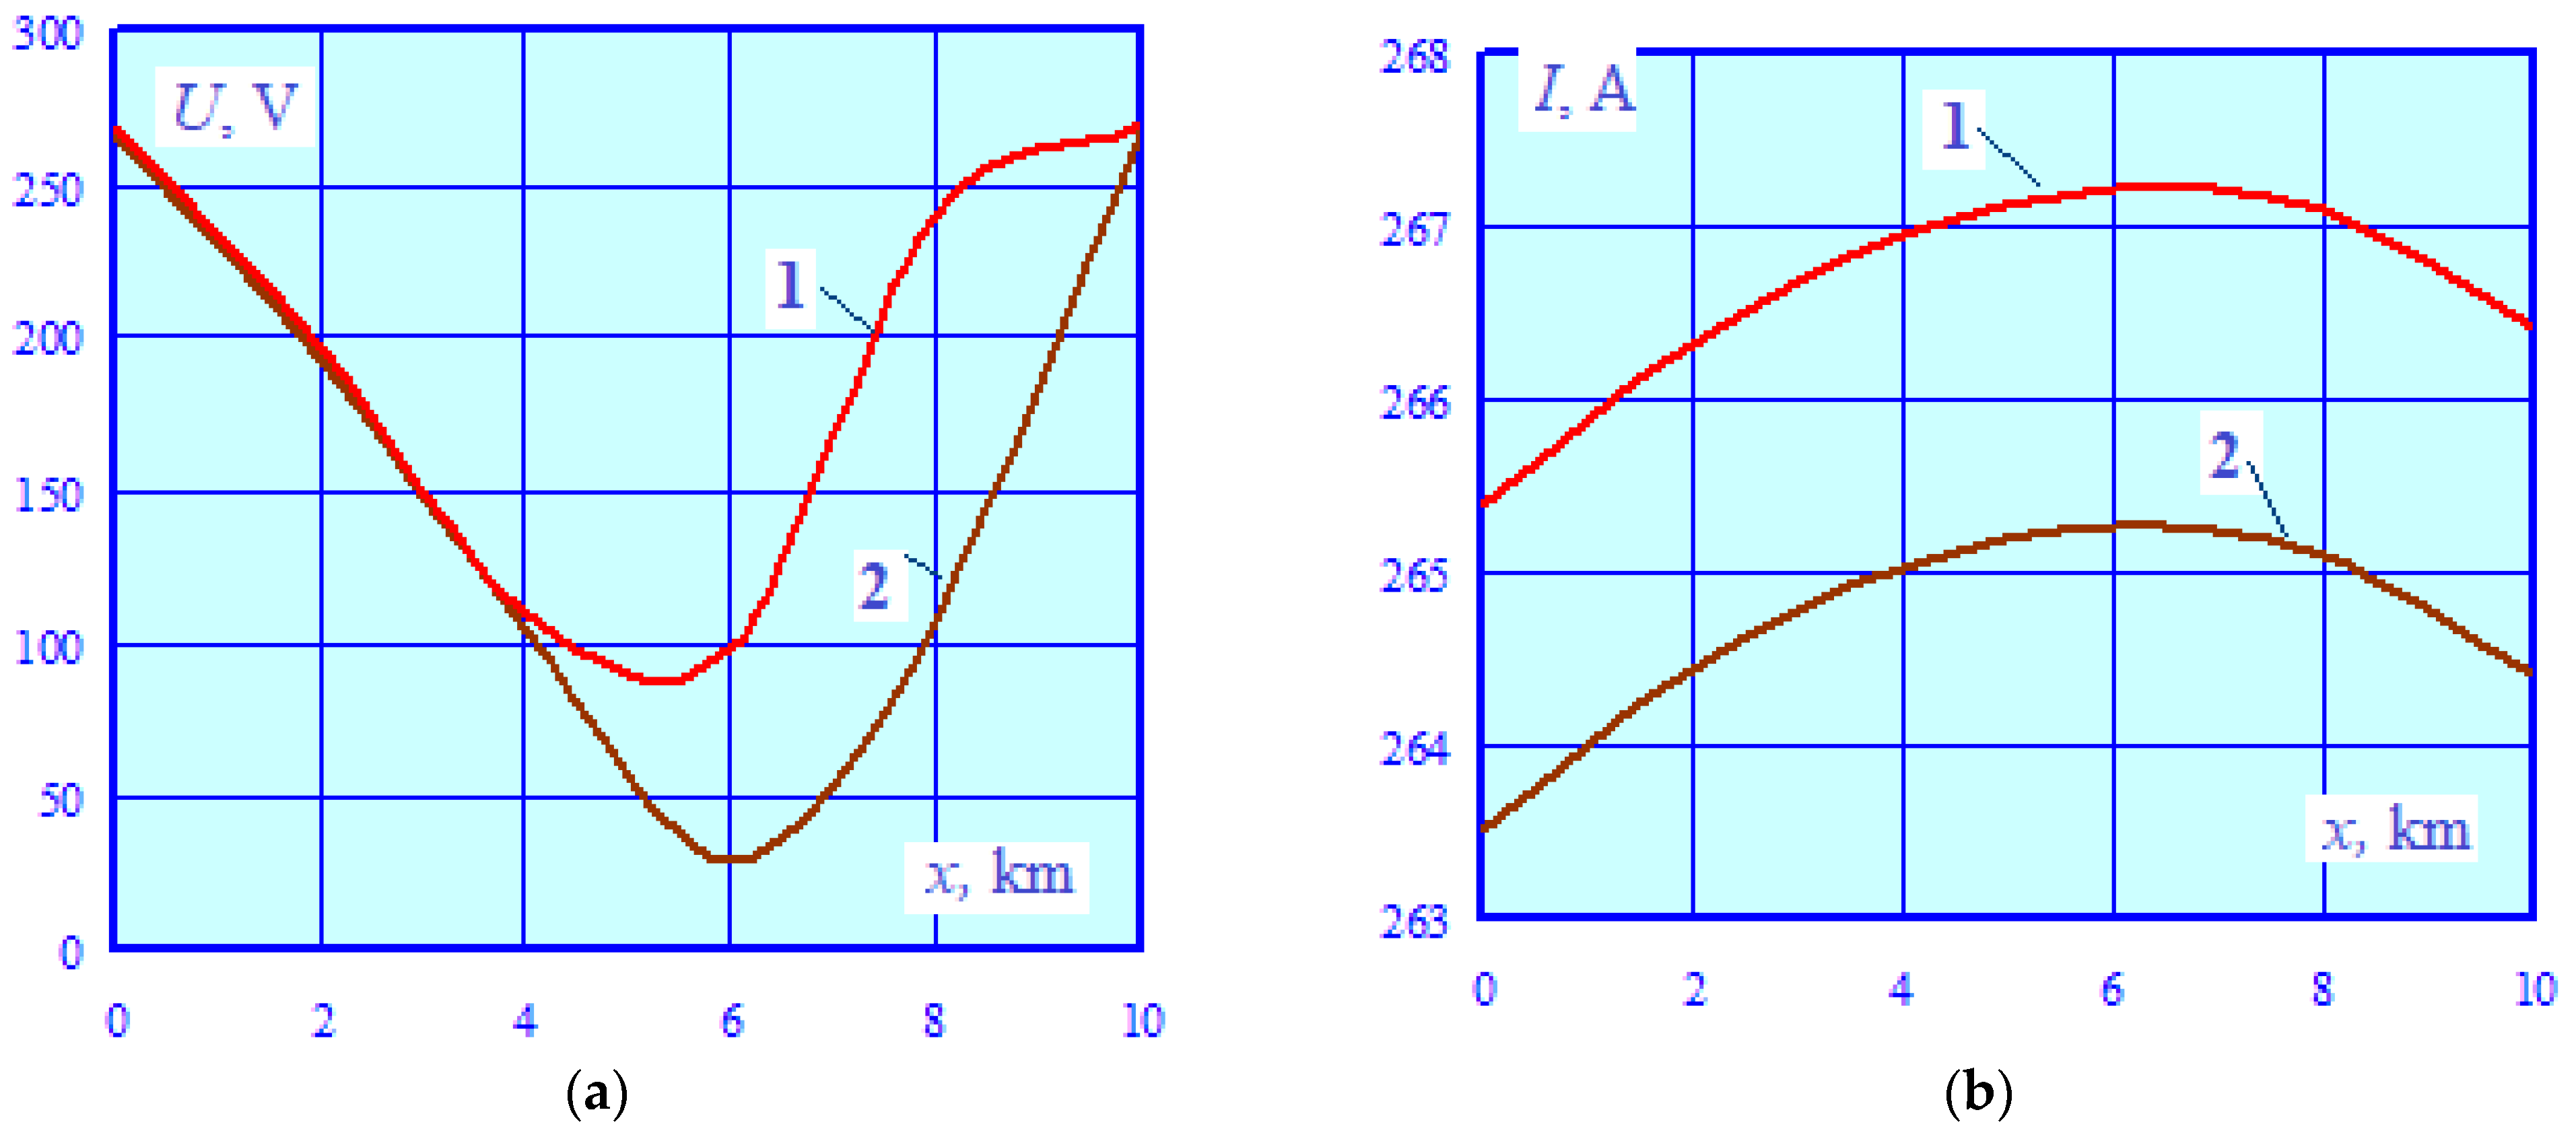
- The demagnetizing effect of supply wires in the prospective traction power supply system results in a more than two-fold decrease in the induced voltage maxima at the pipe points corresponding to x coordinates or 30 and 40 km. At points with x coordinates equal to 10 and 20 km, the voltage decreases by a factor of 1.6. The voltage along the edges of the structure increases by 27 to 60% but does not exceed the permissible values.
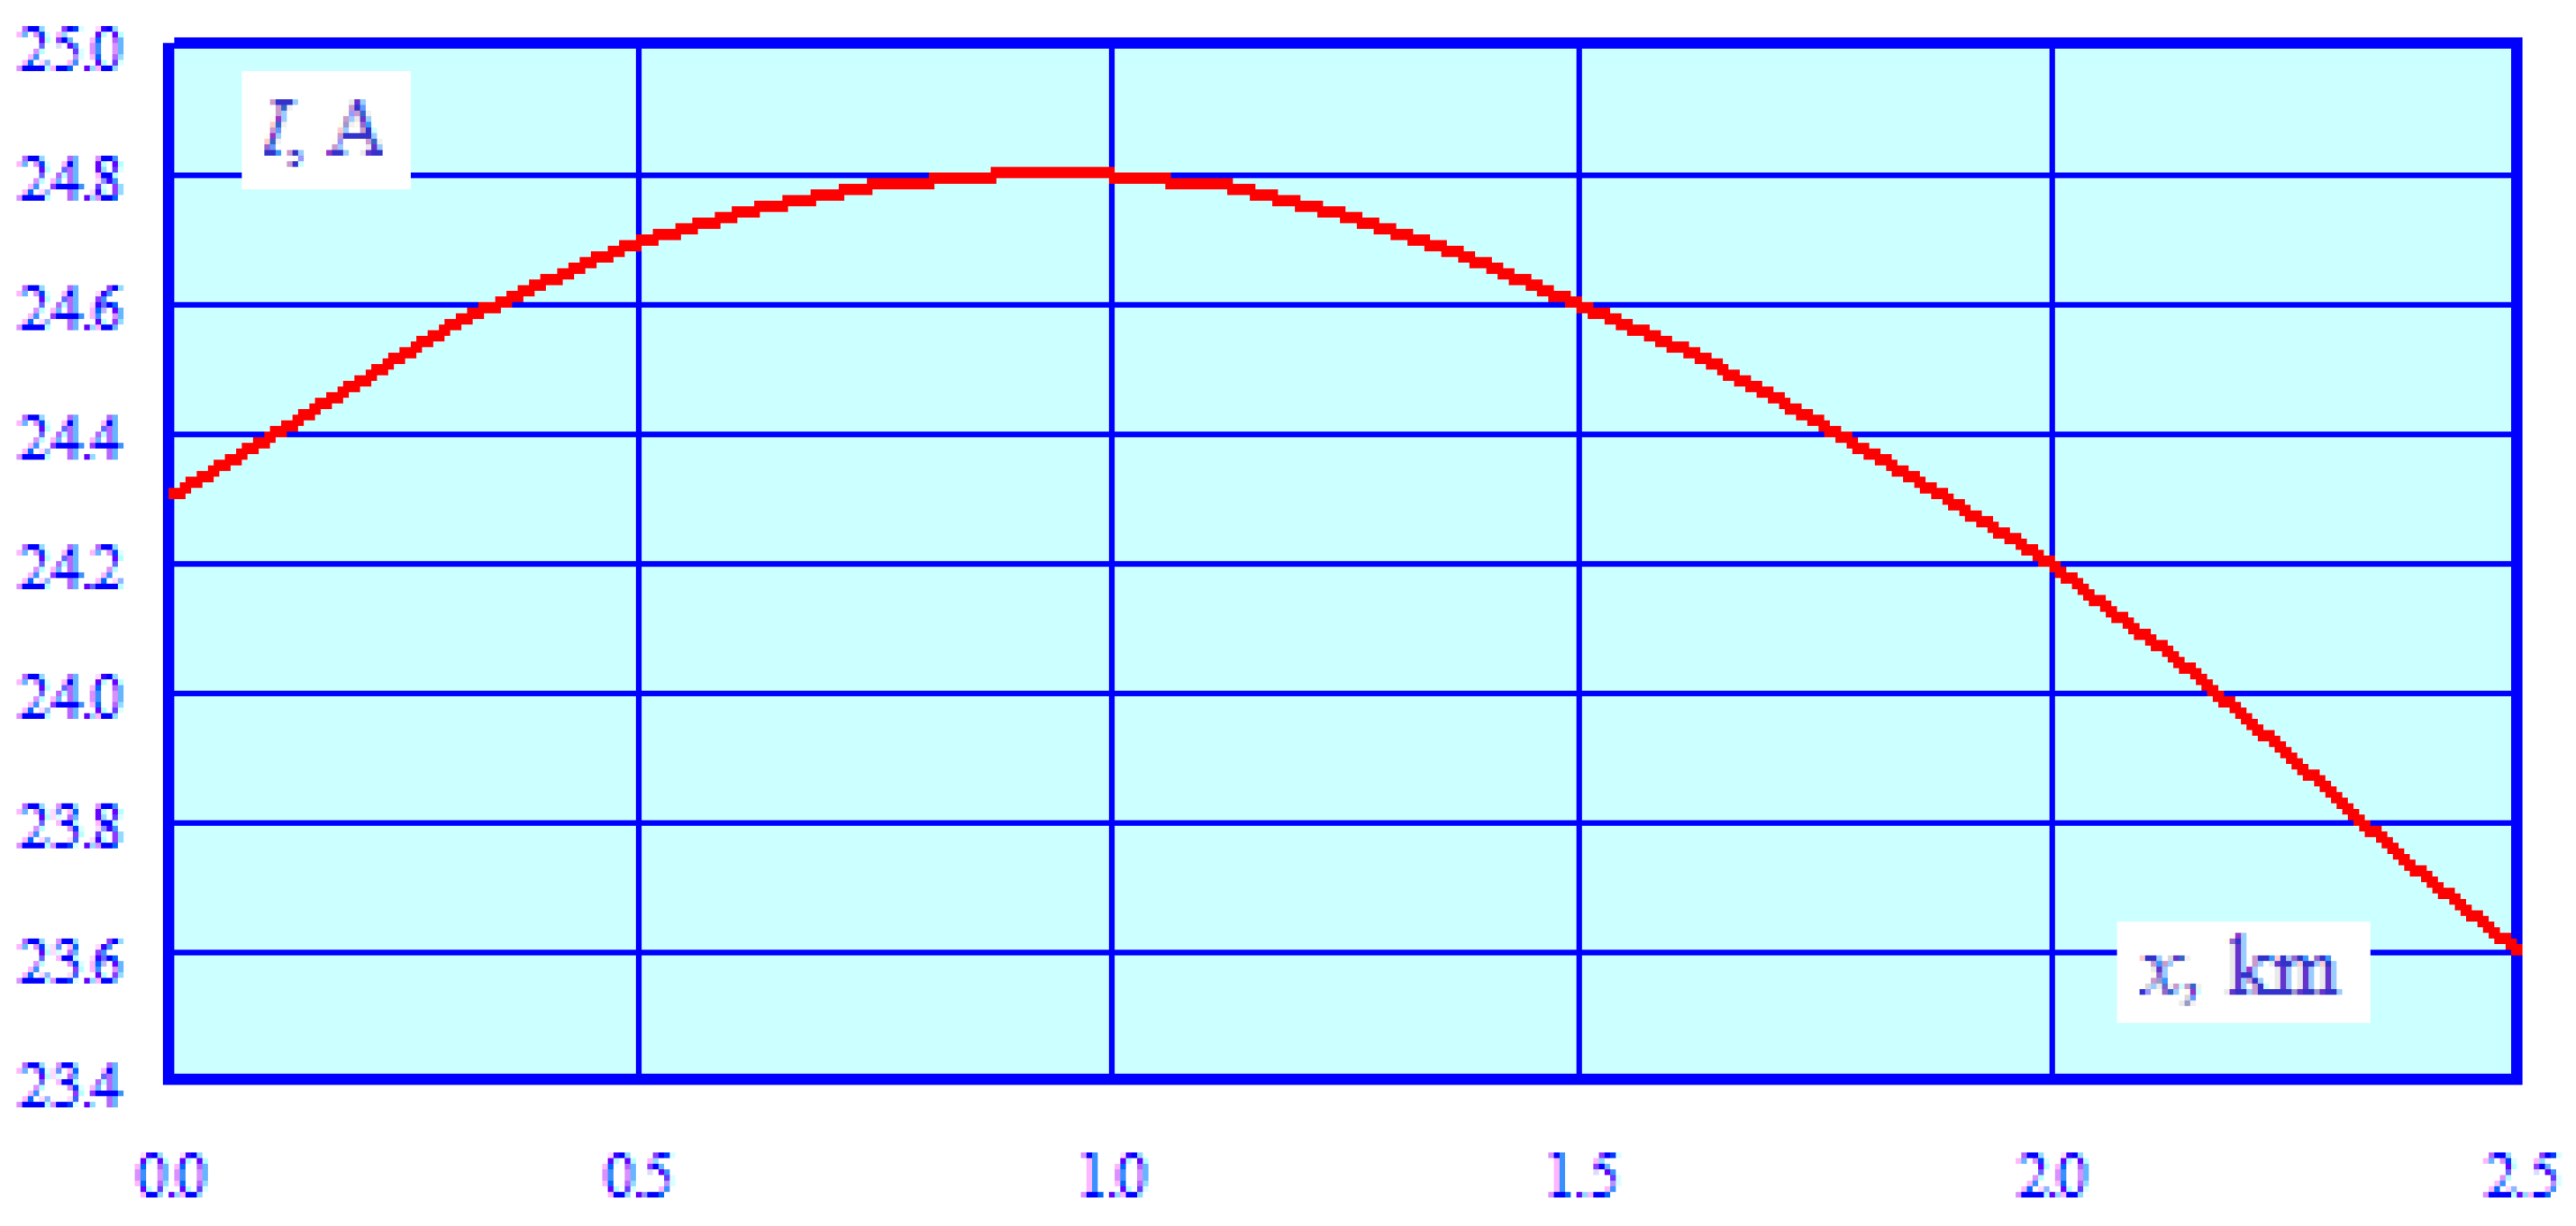
- The maximum current running through the pipe increases compared to the 25 kV traction network by 1.3 to 2.1 times.
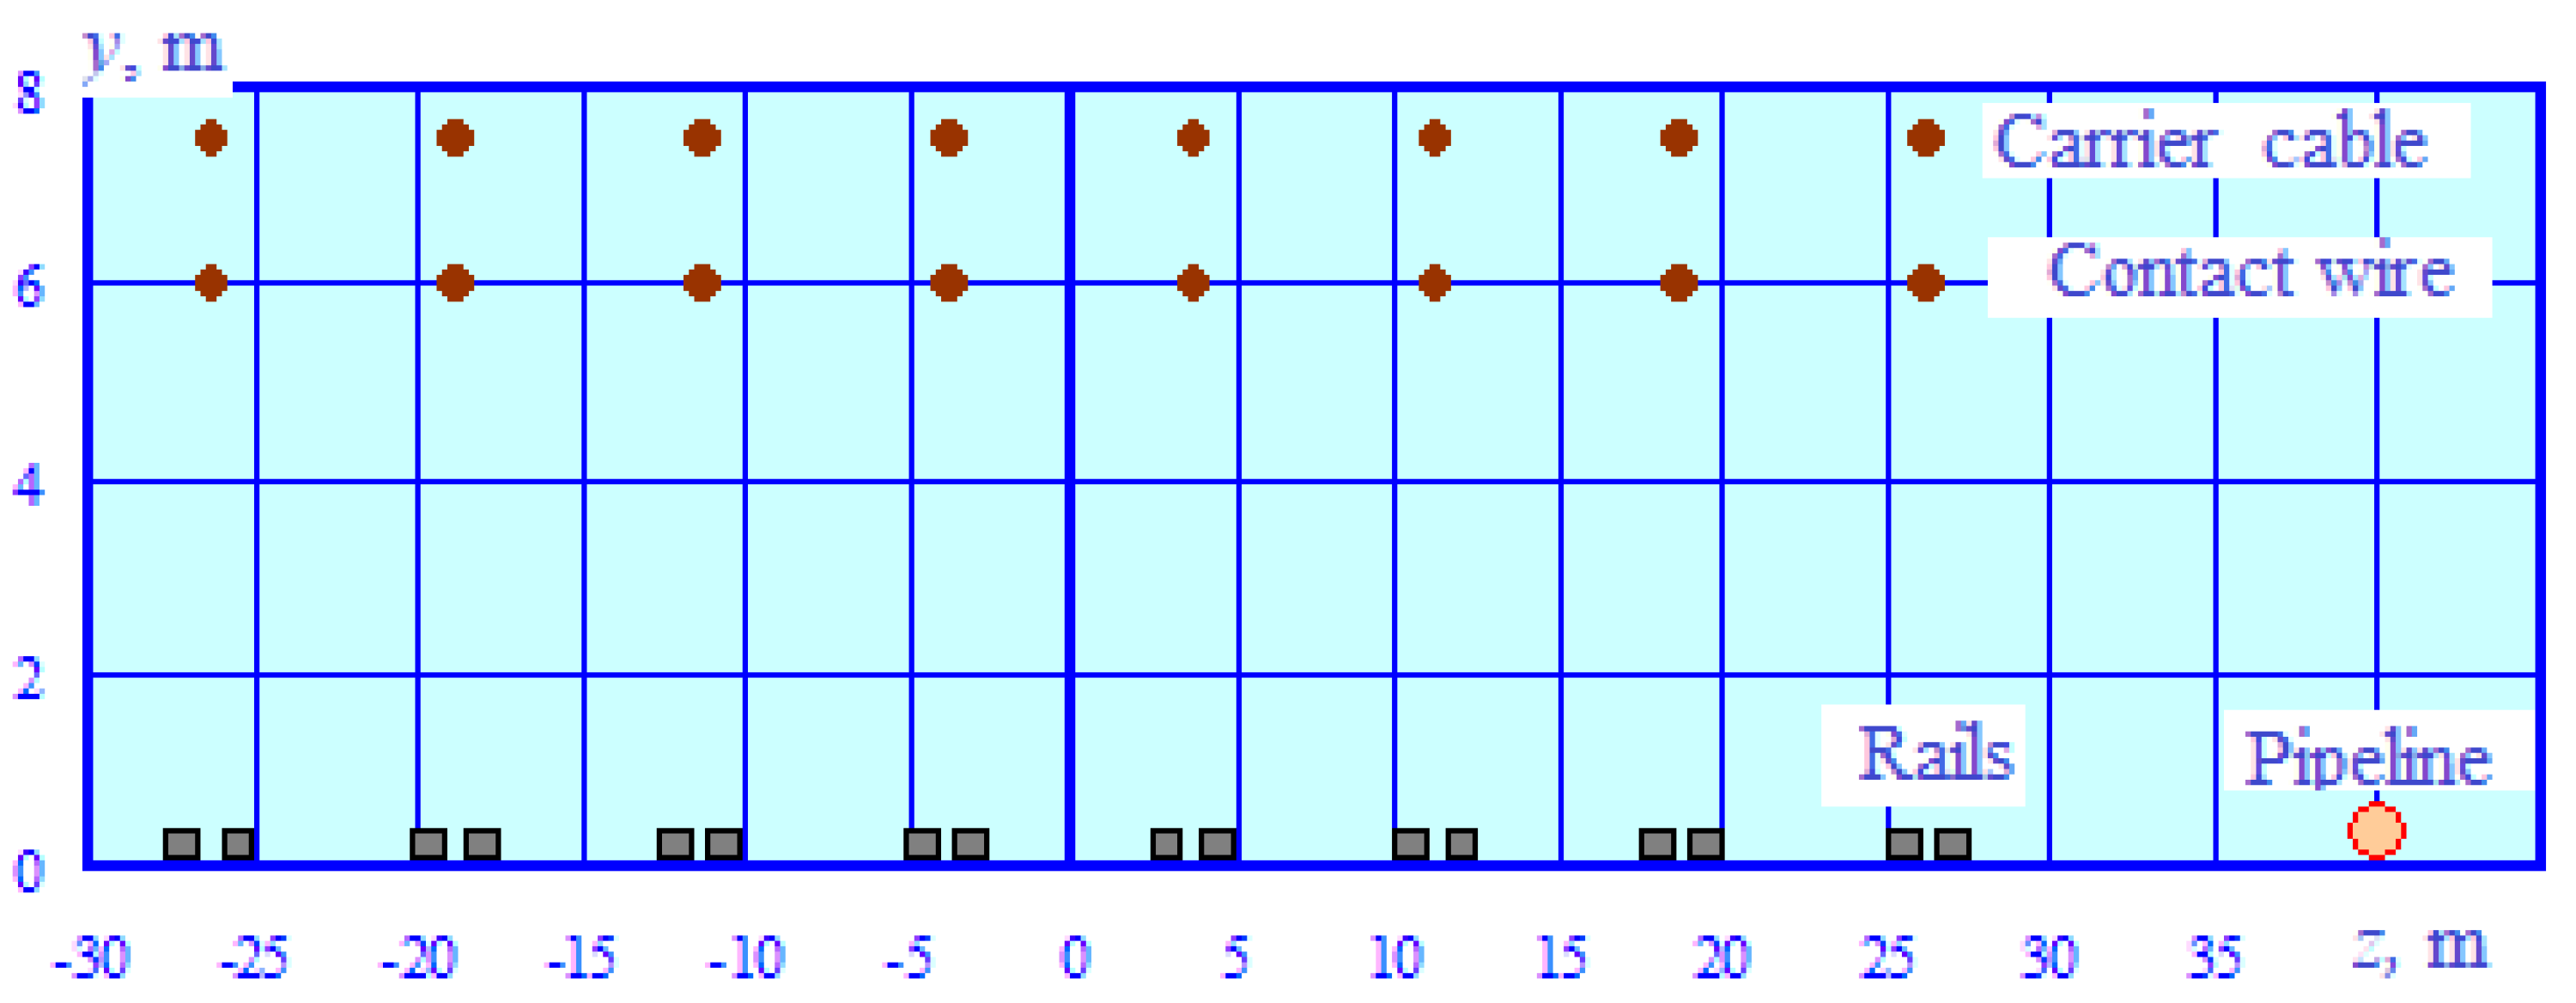
6. Multi-Track Traction Network of a Railway Station
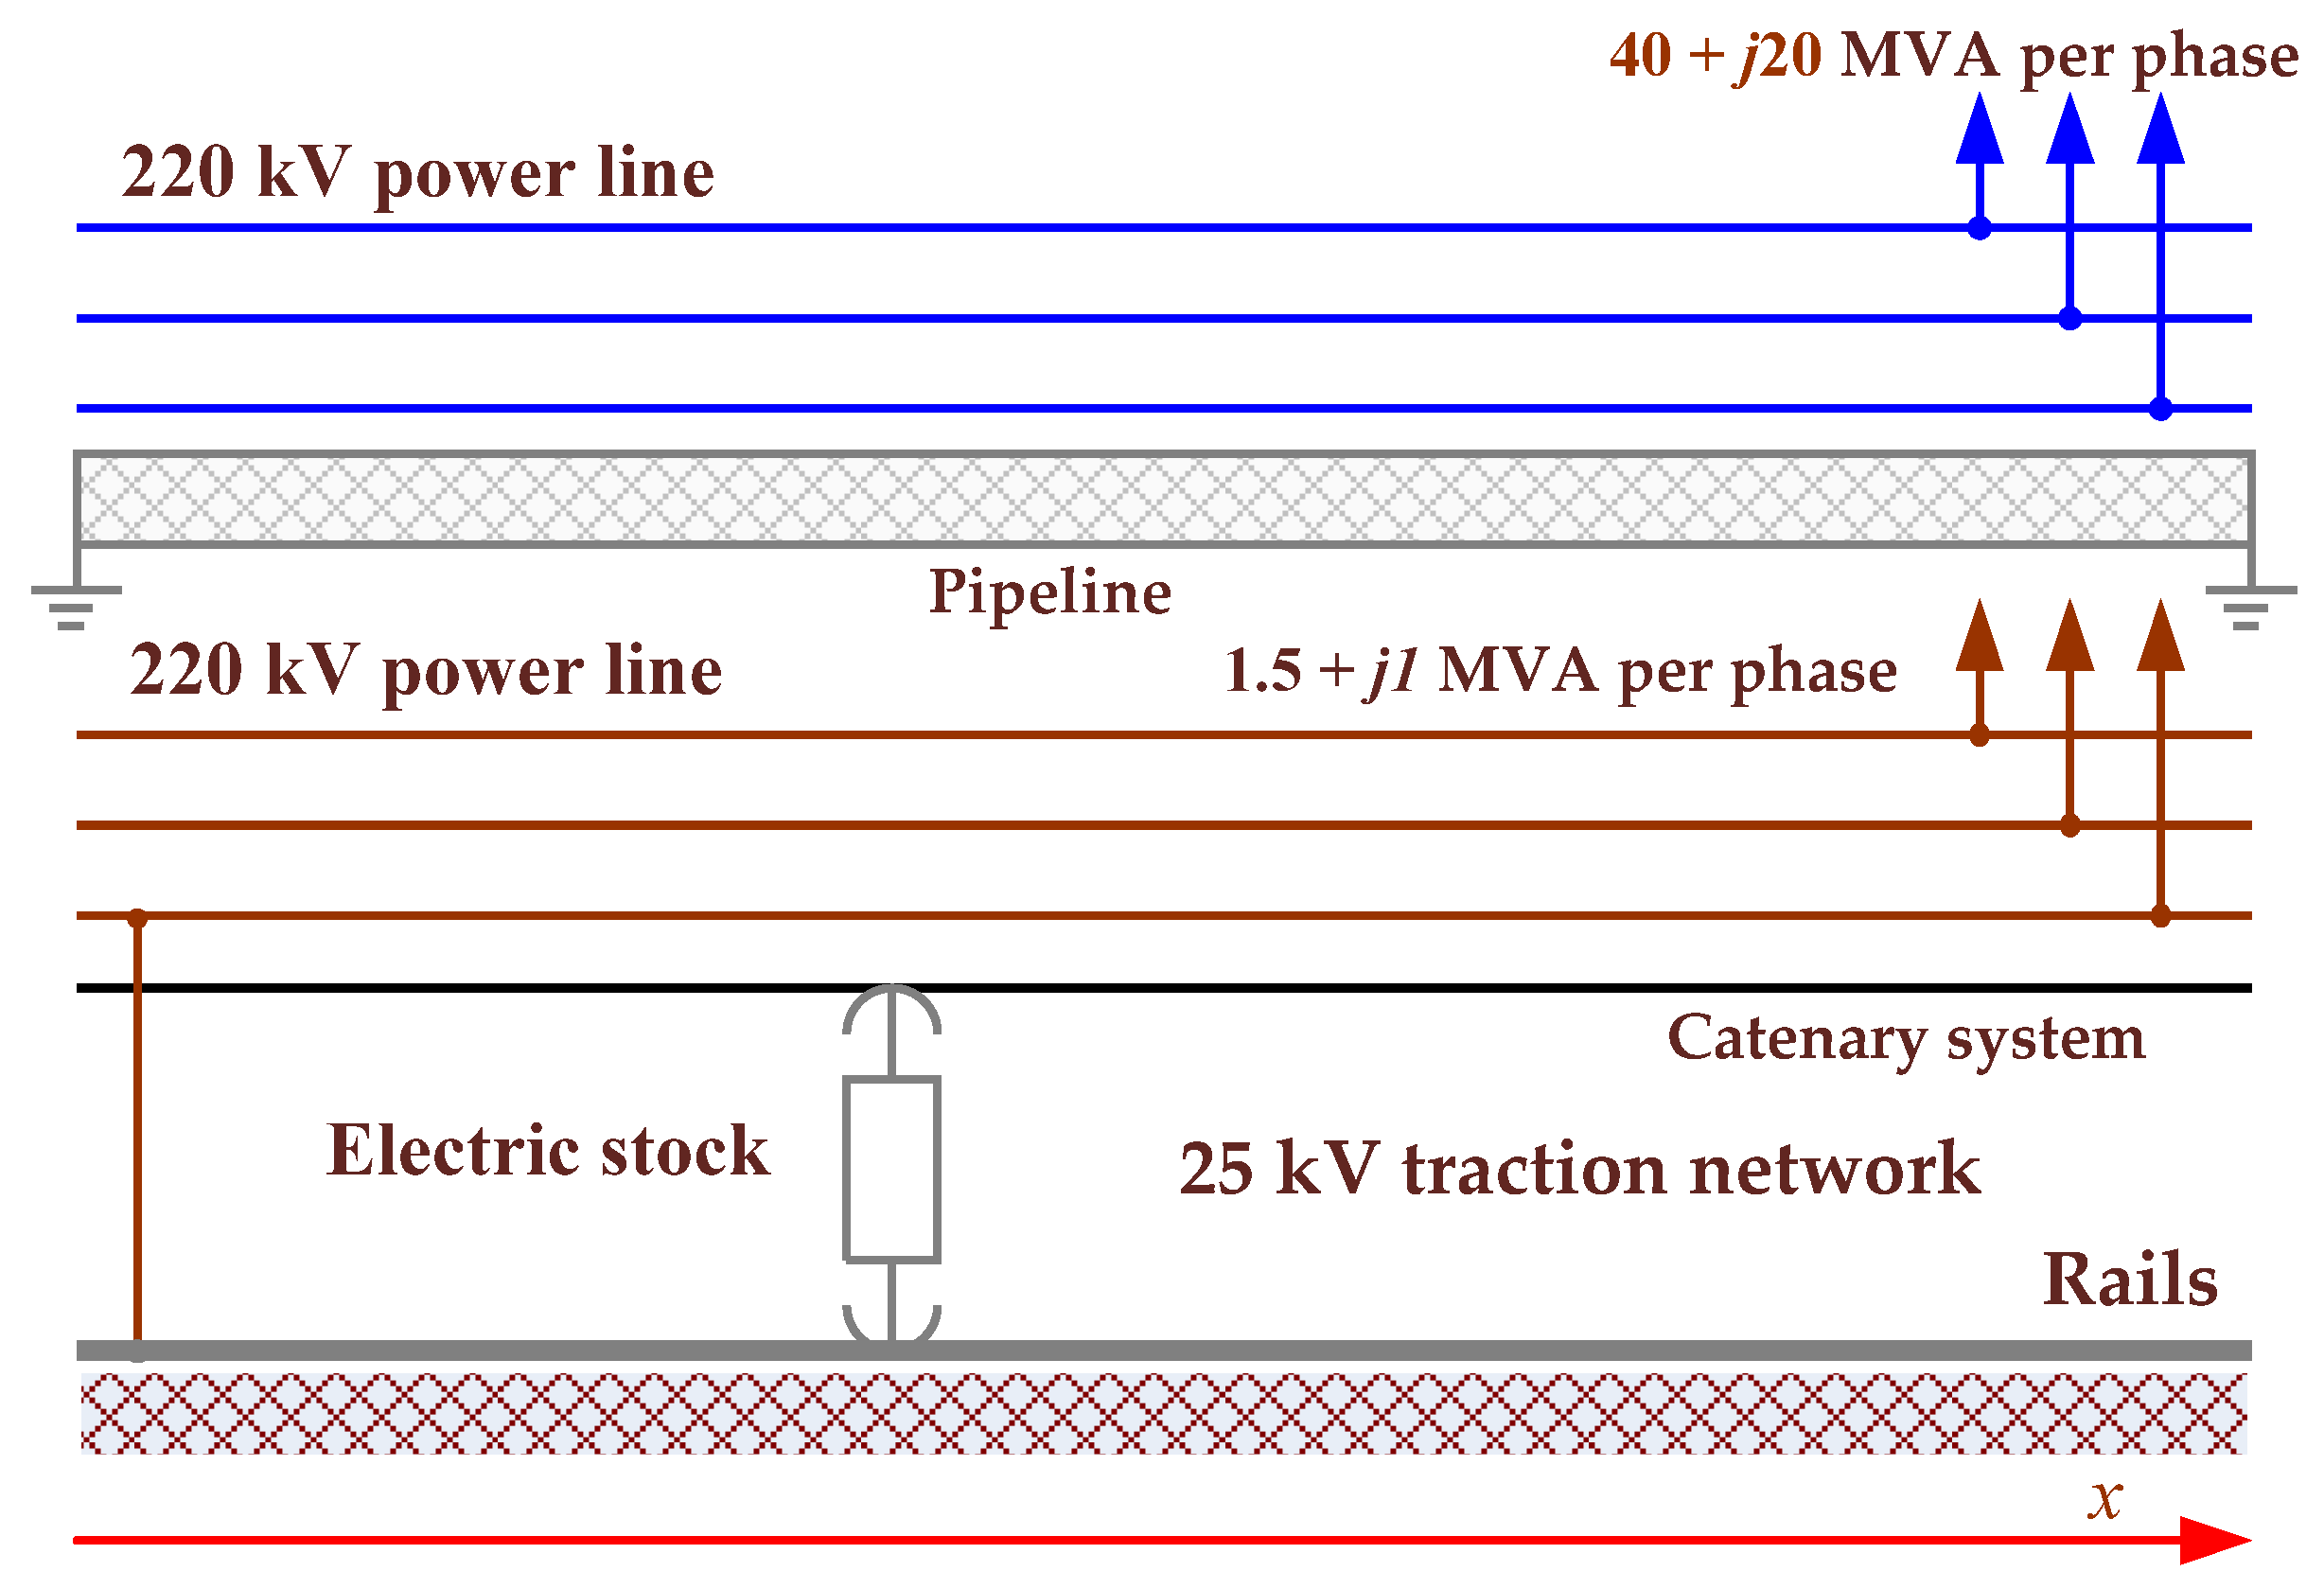
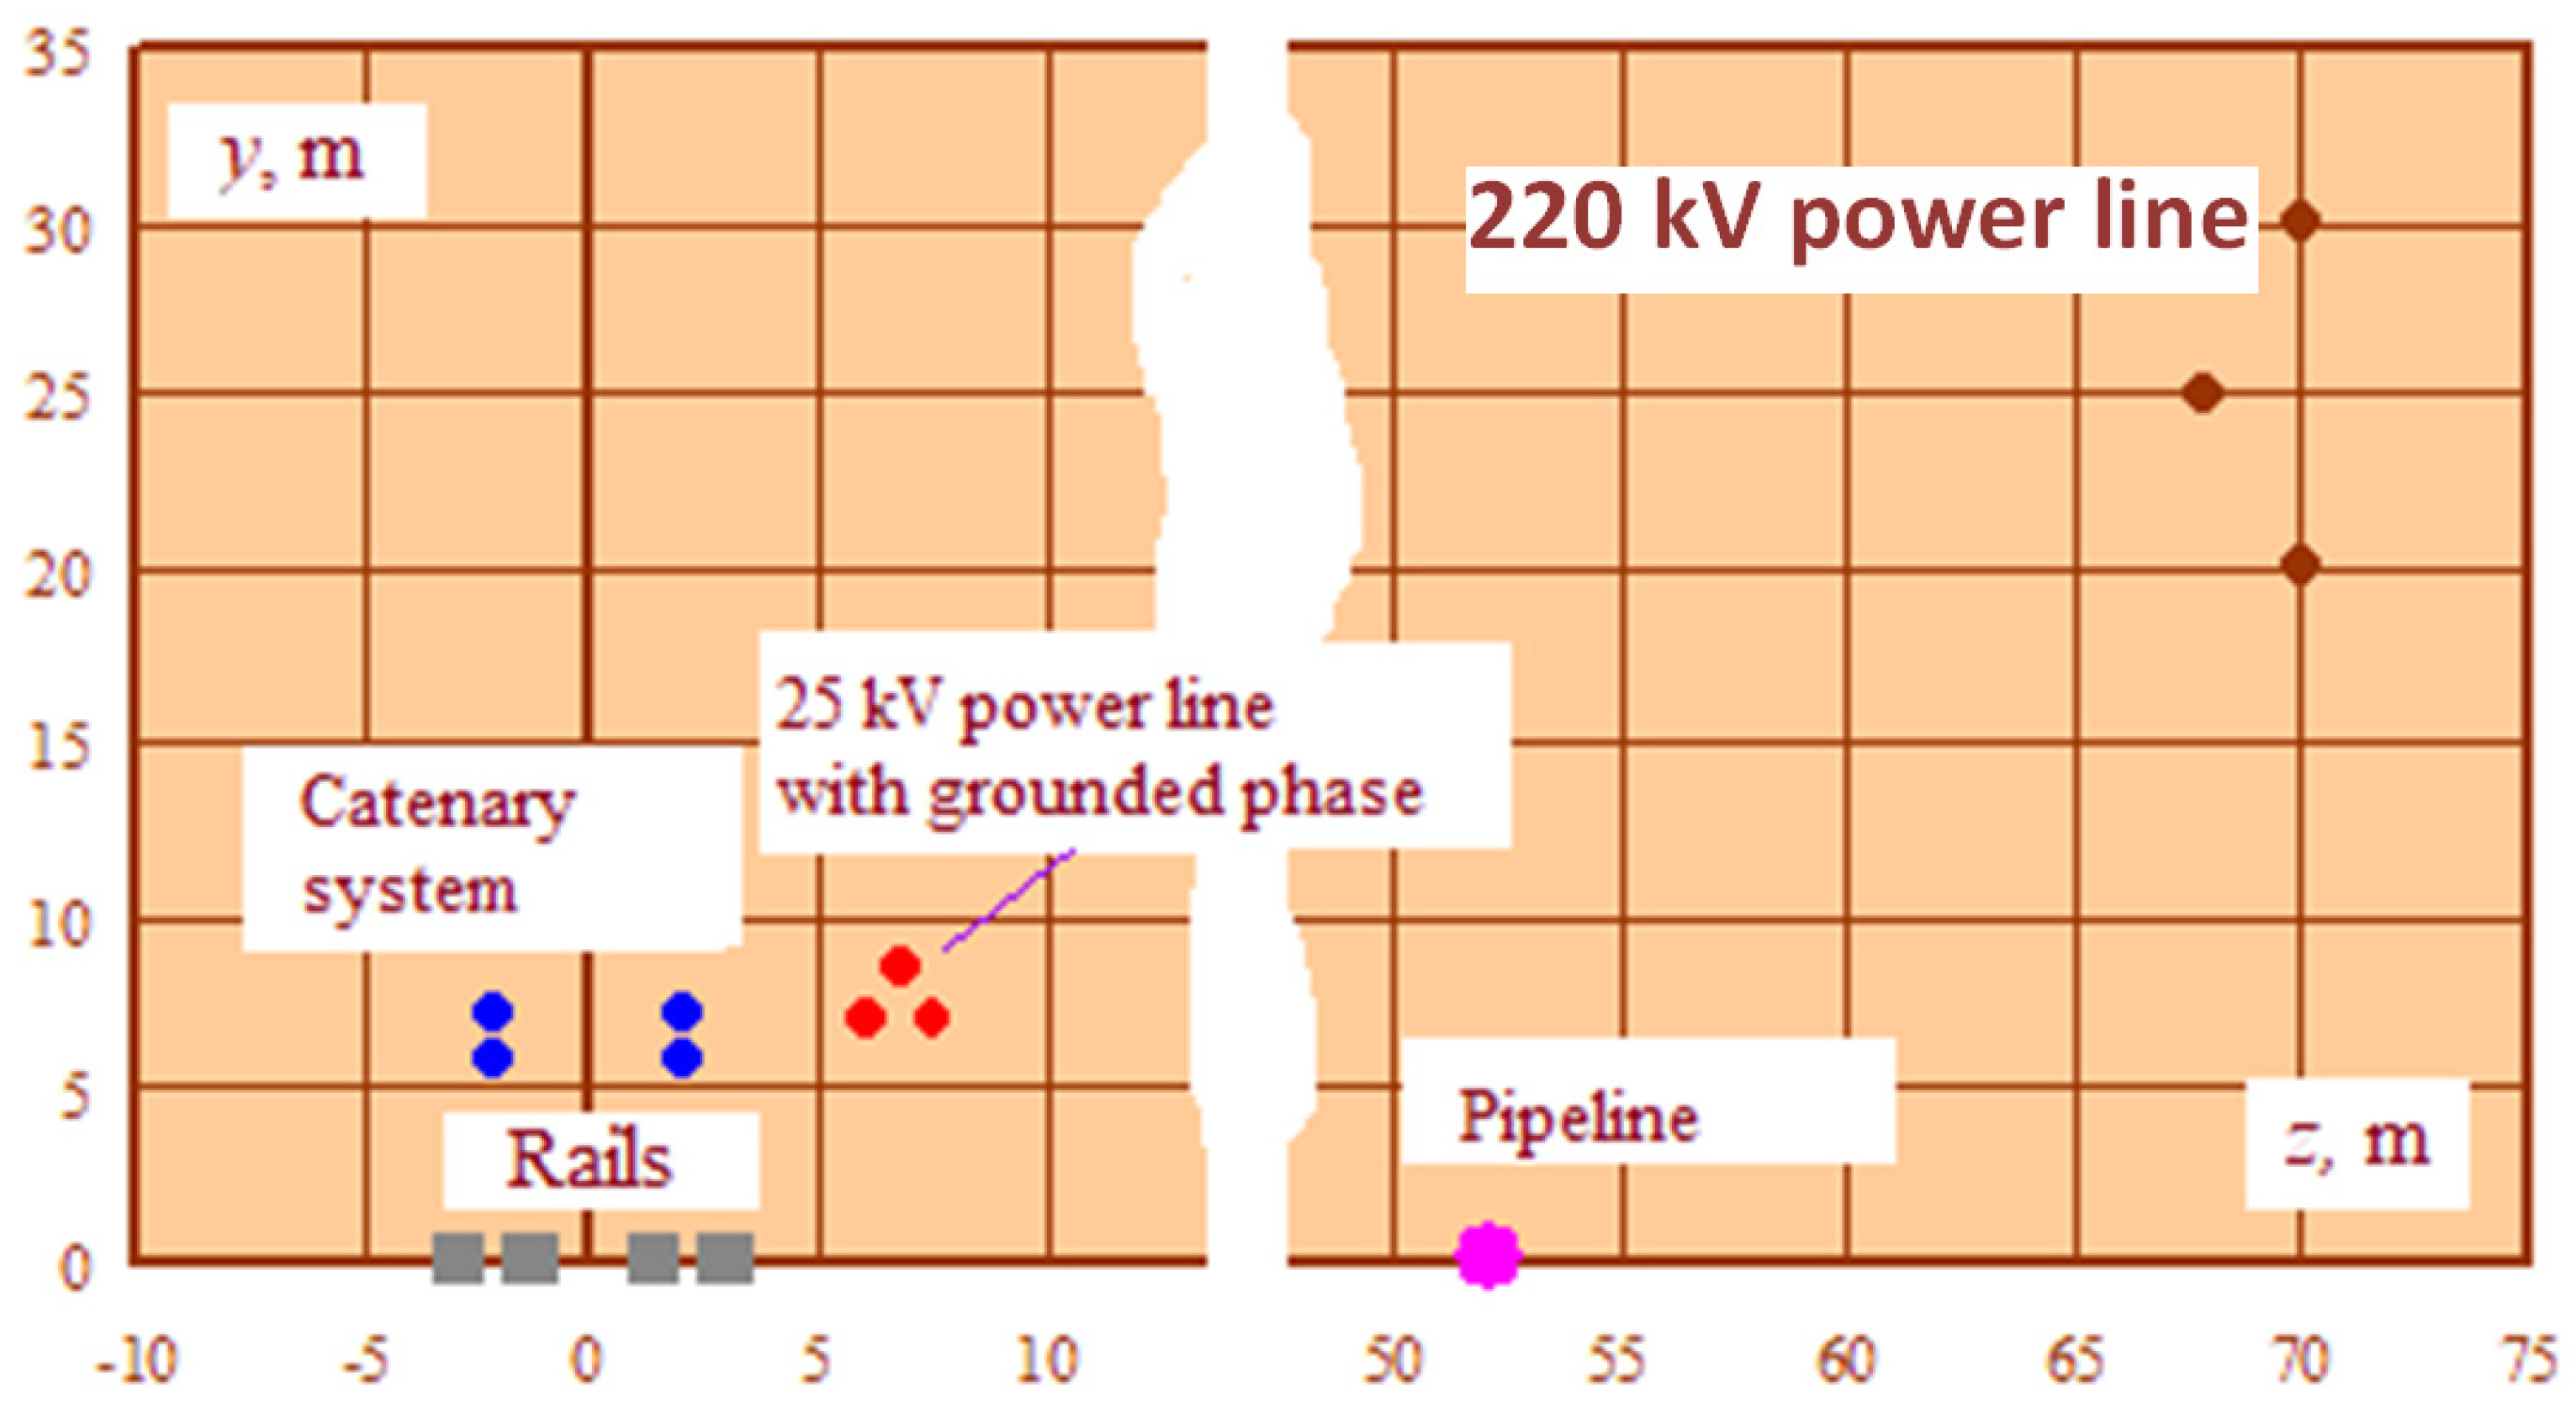
- The 220 kV high-voltage transmission line;
- The traction transformer TDTNZh-40000-230/27.5;
- The eight-track 25 kV traction network, which was 2.5 km long and had total loads equal to 9 + j9 MVA for the up-train direction and 10 + j10 MVA for the down-train direction.
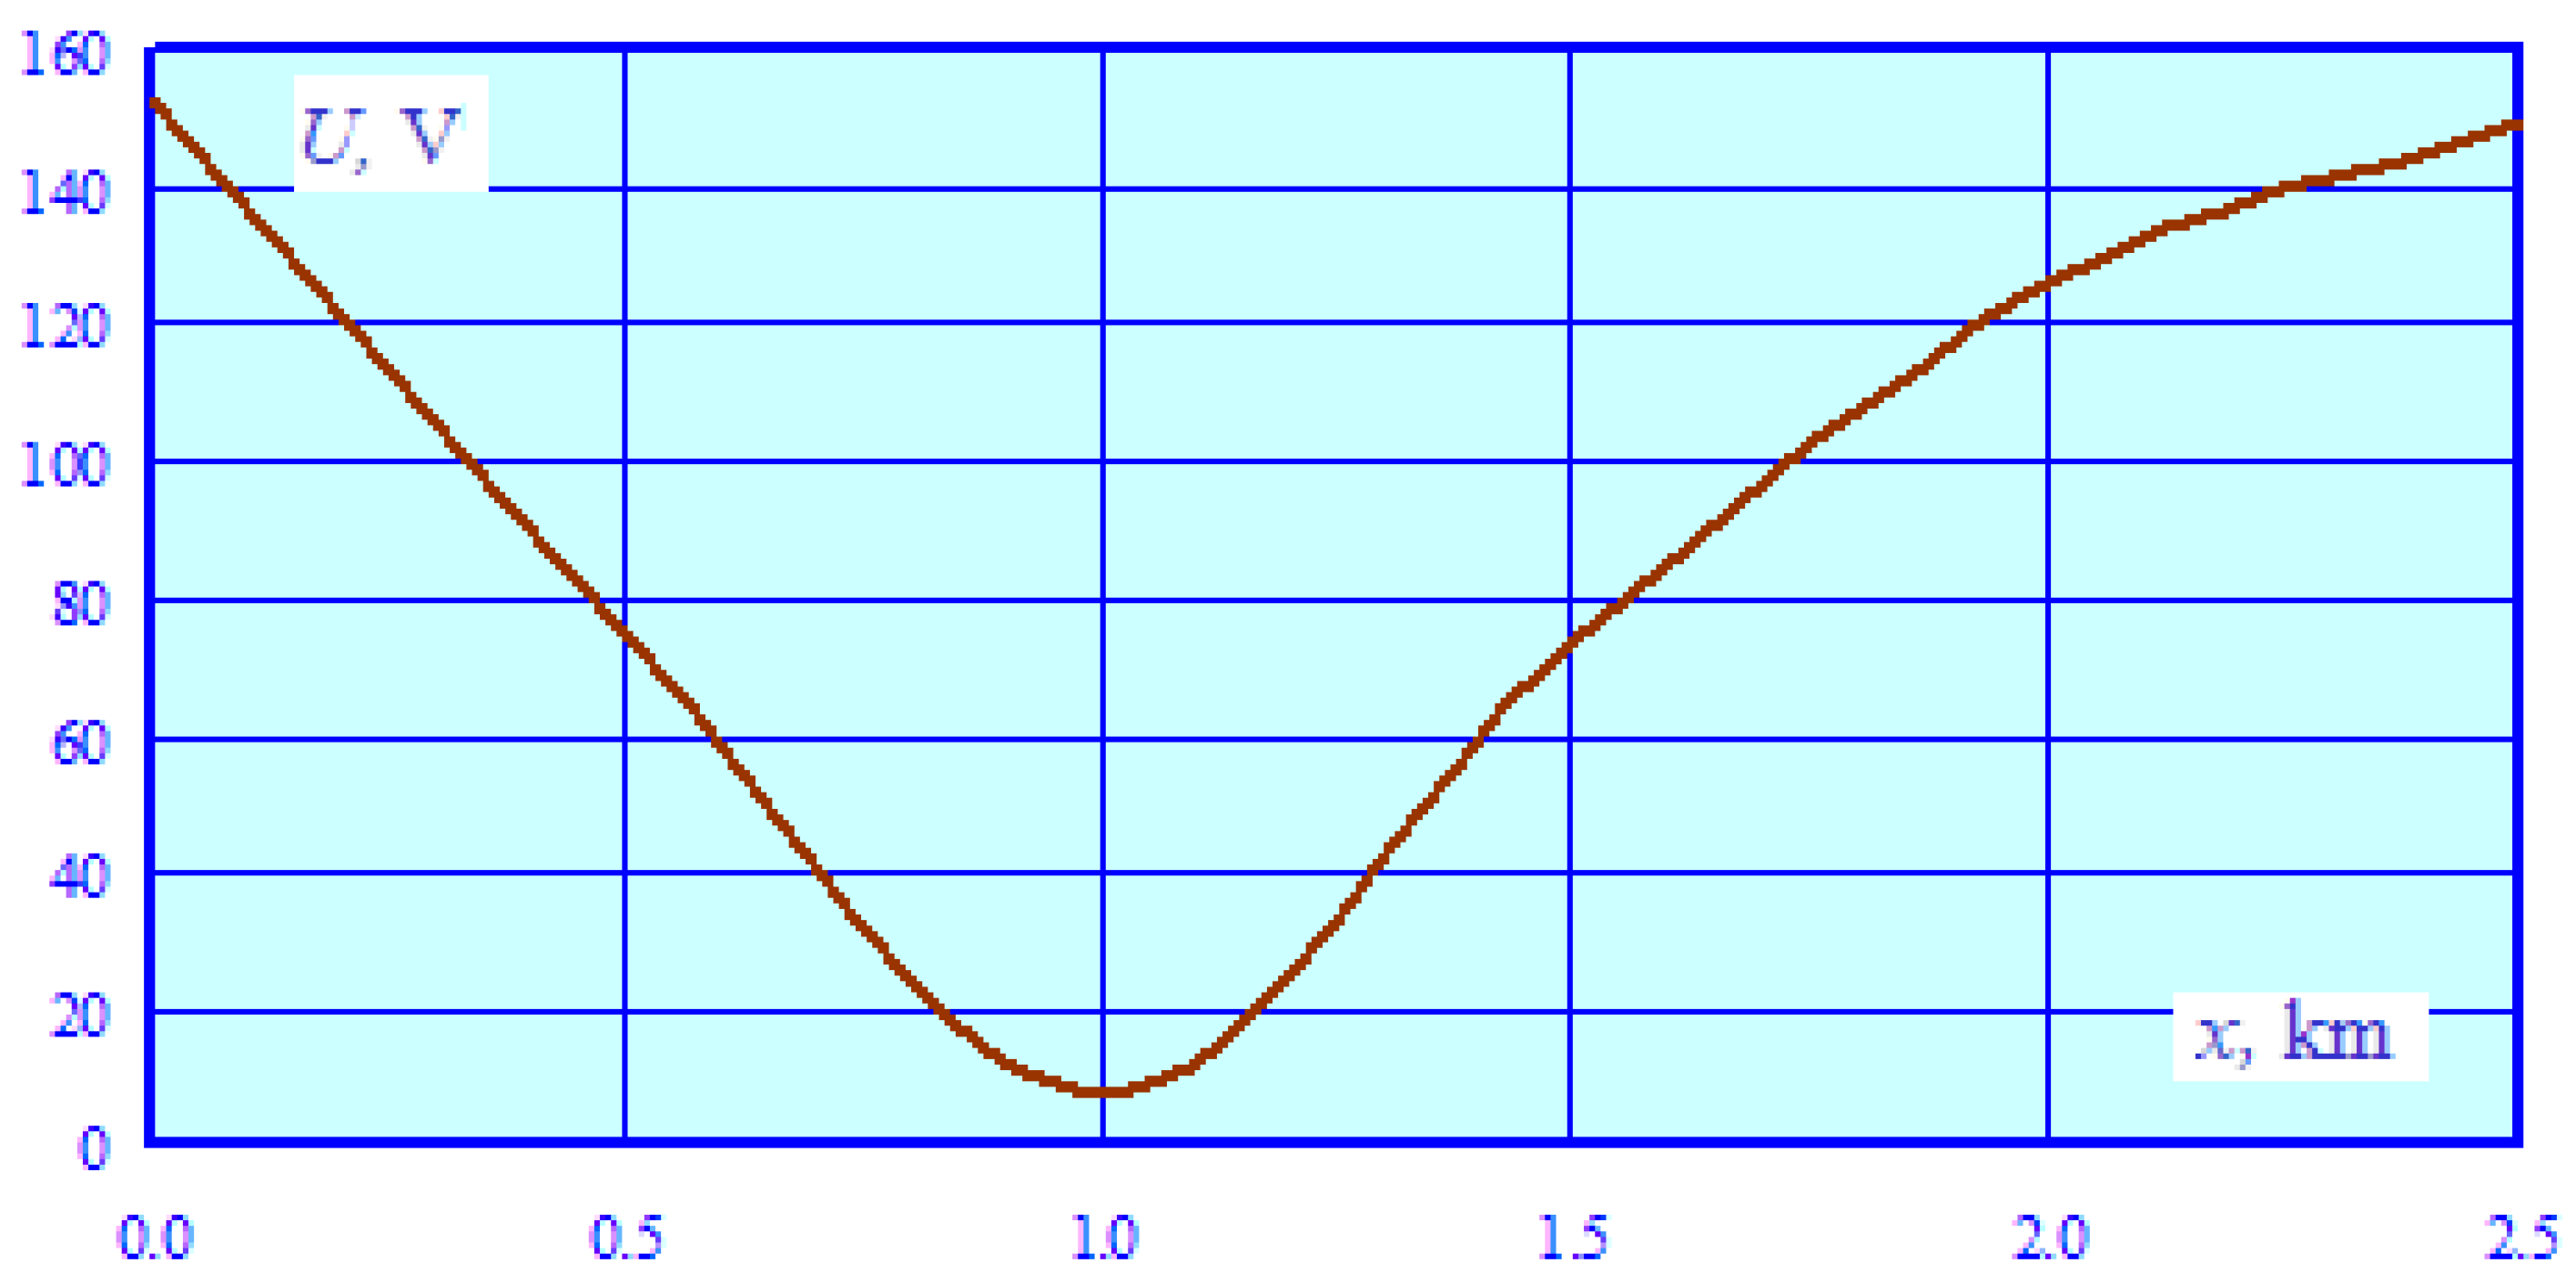
- The levels of voltage induced on pipeline components under the load and emergency conditions do not exceed the permissible values established by the regulatory document [2].
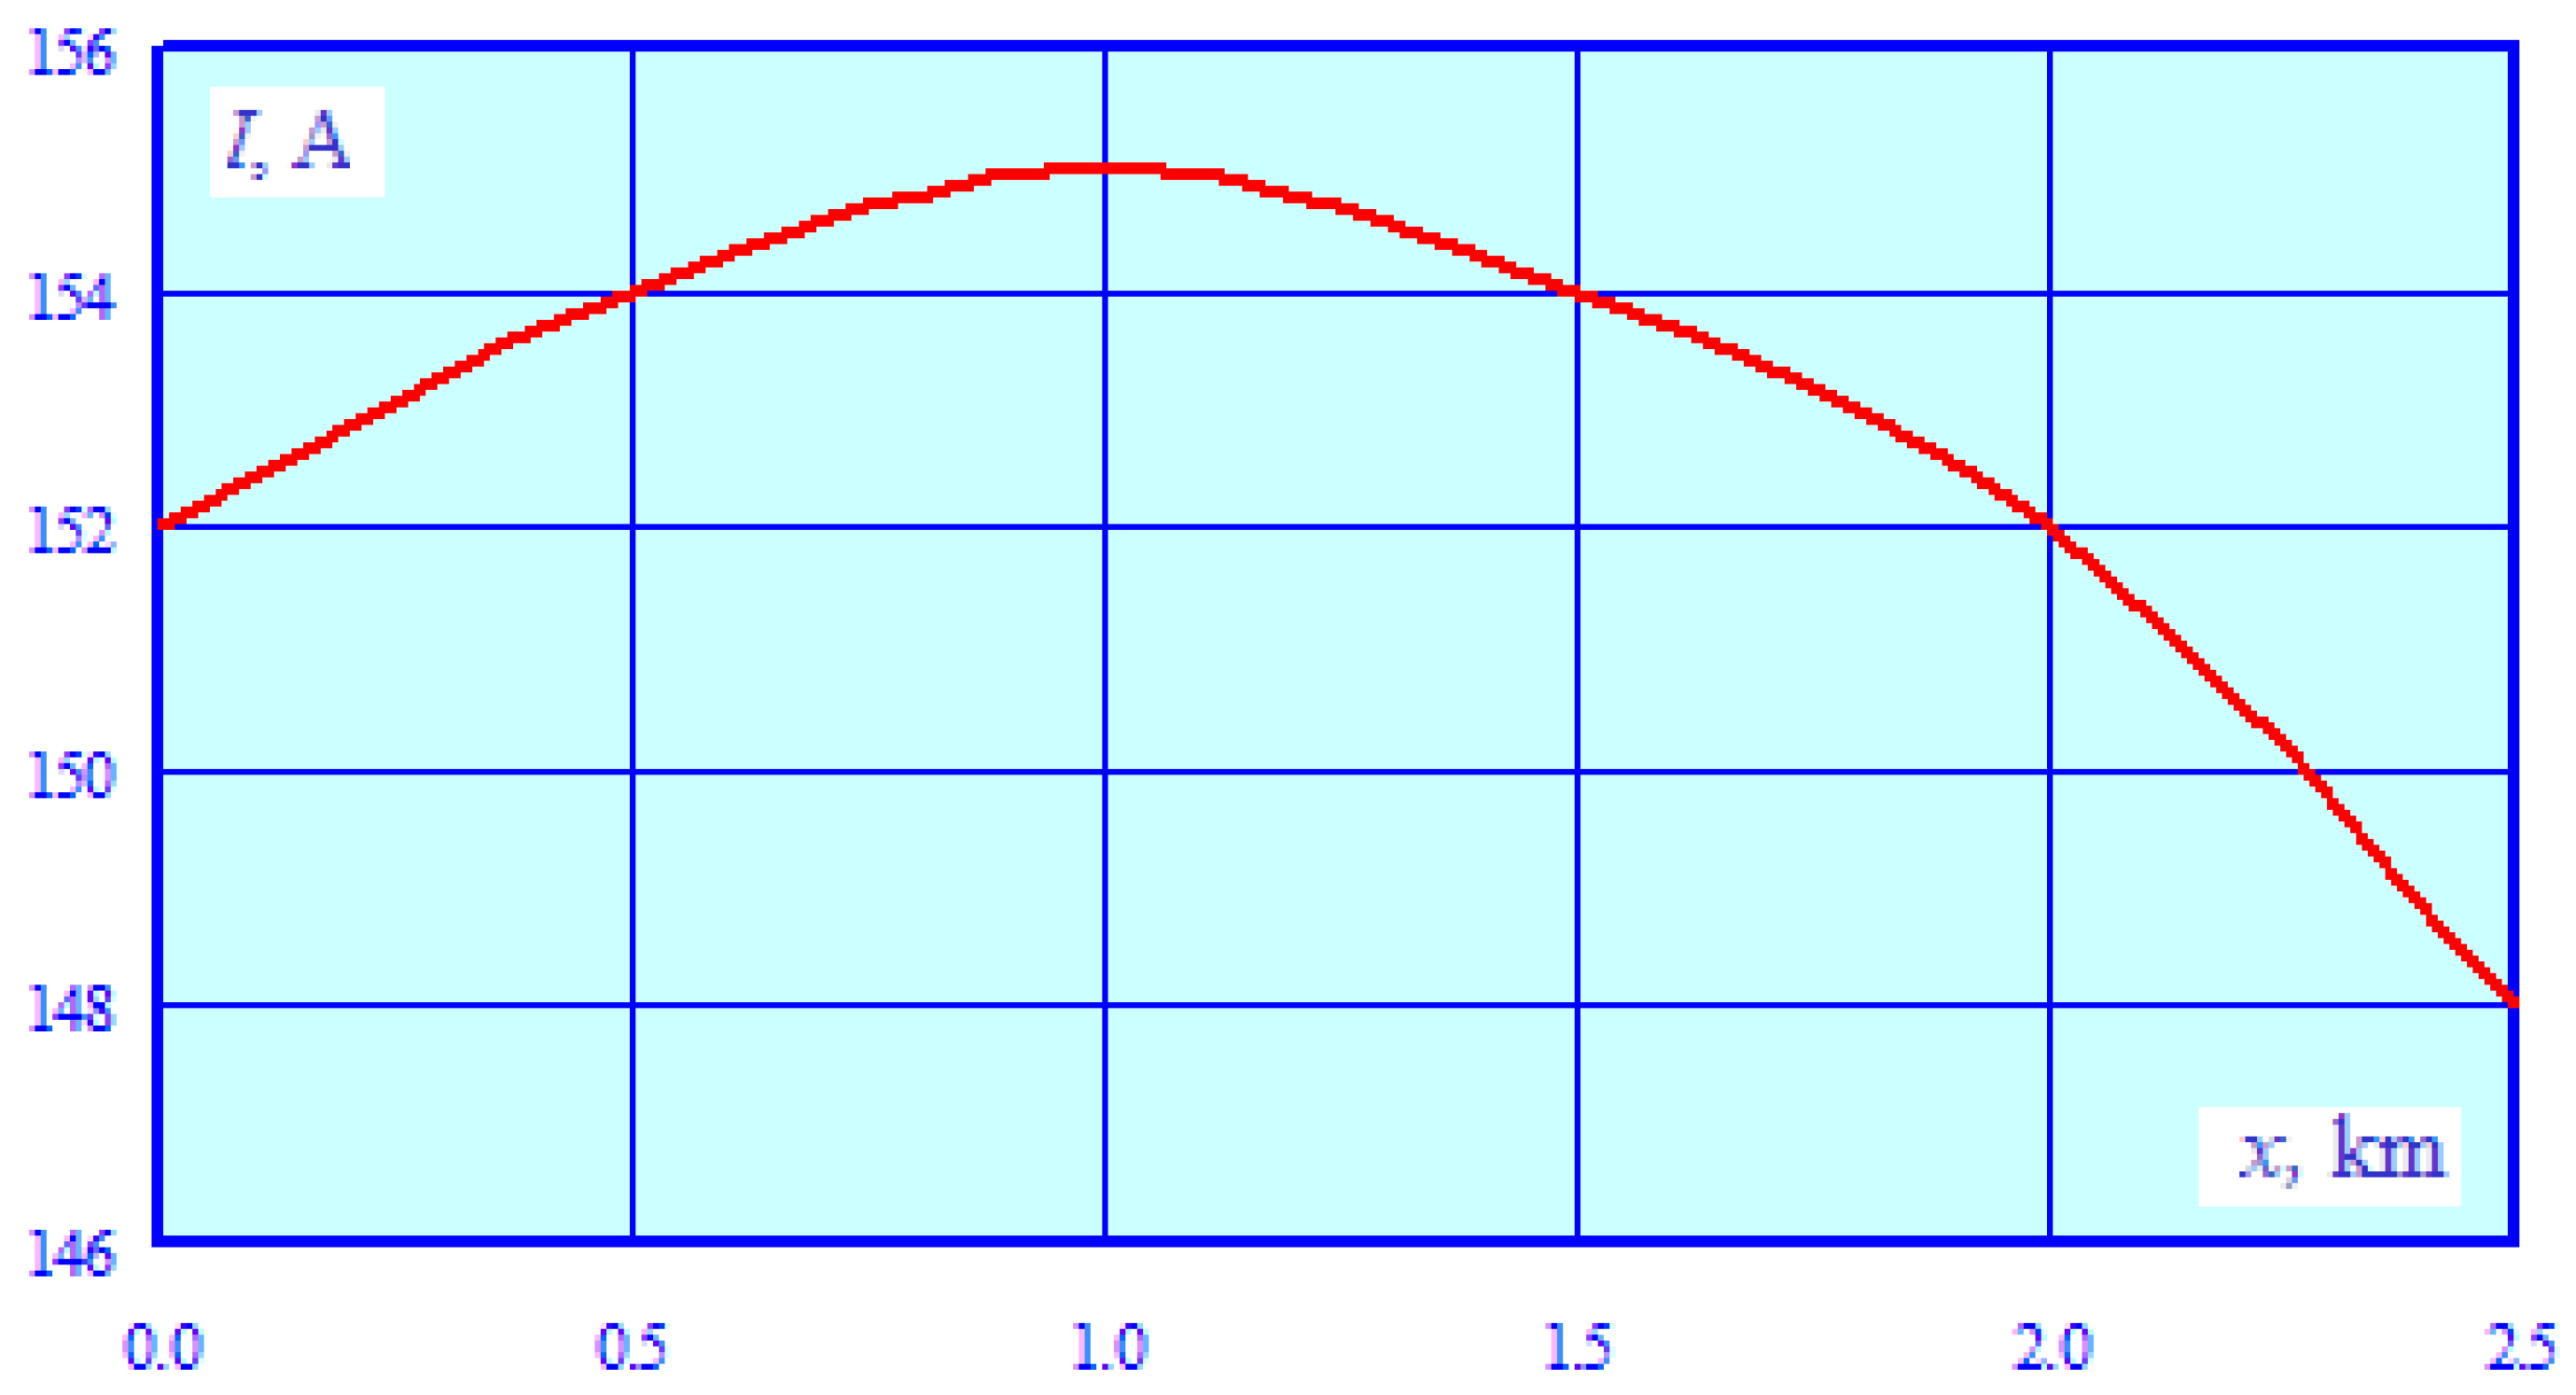
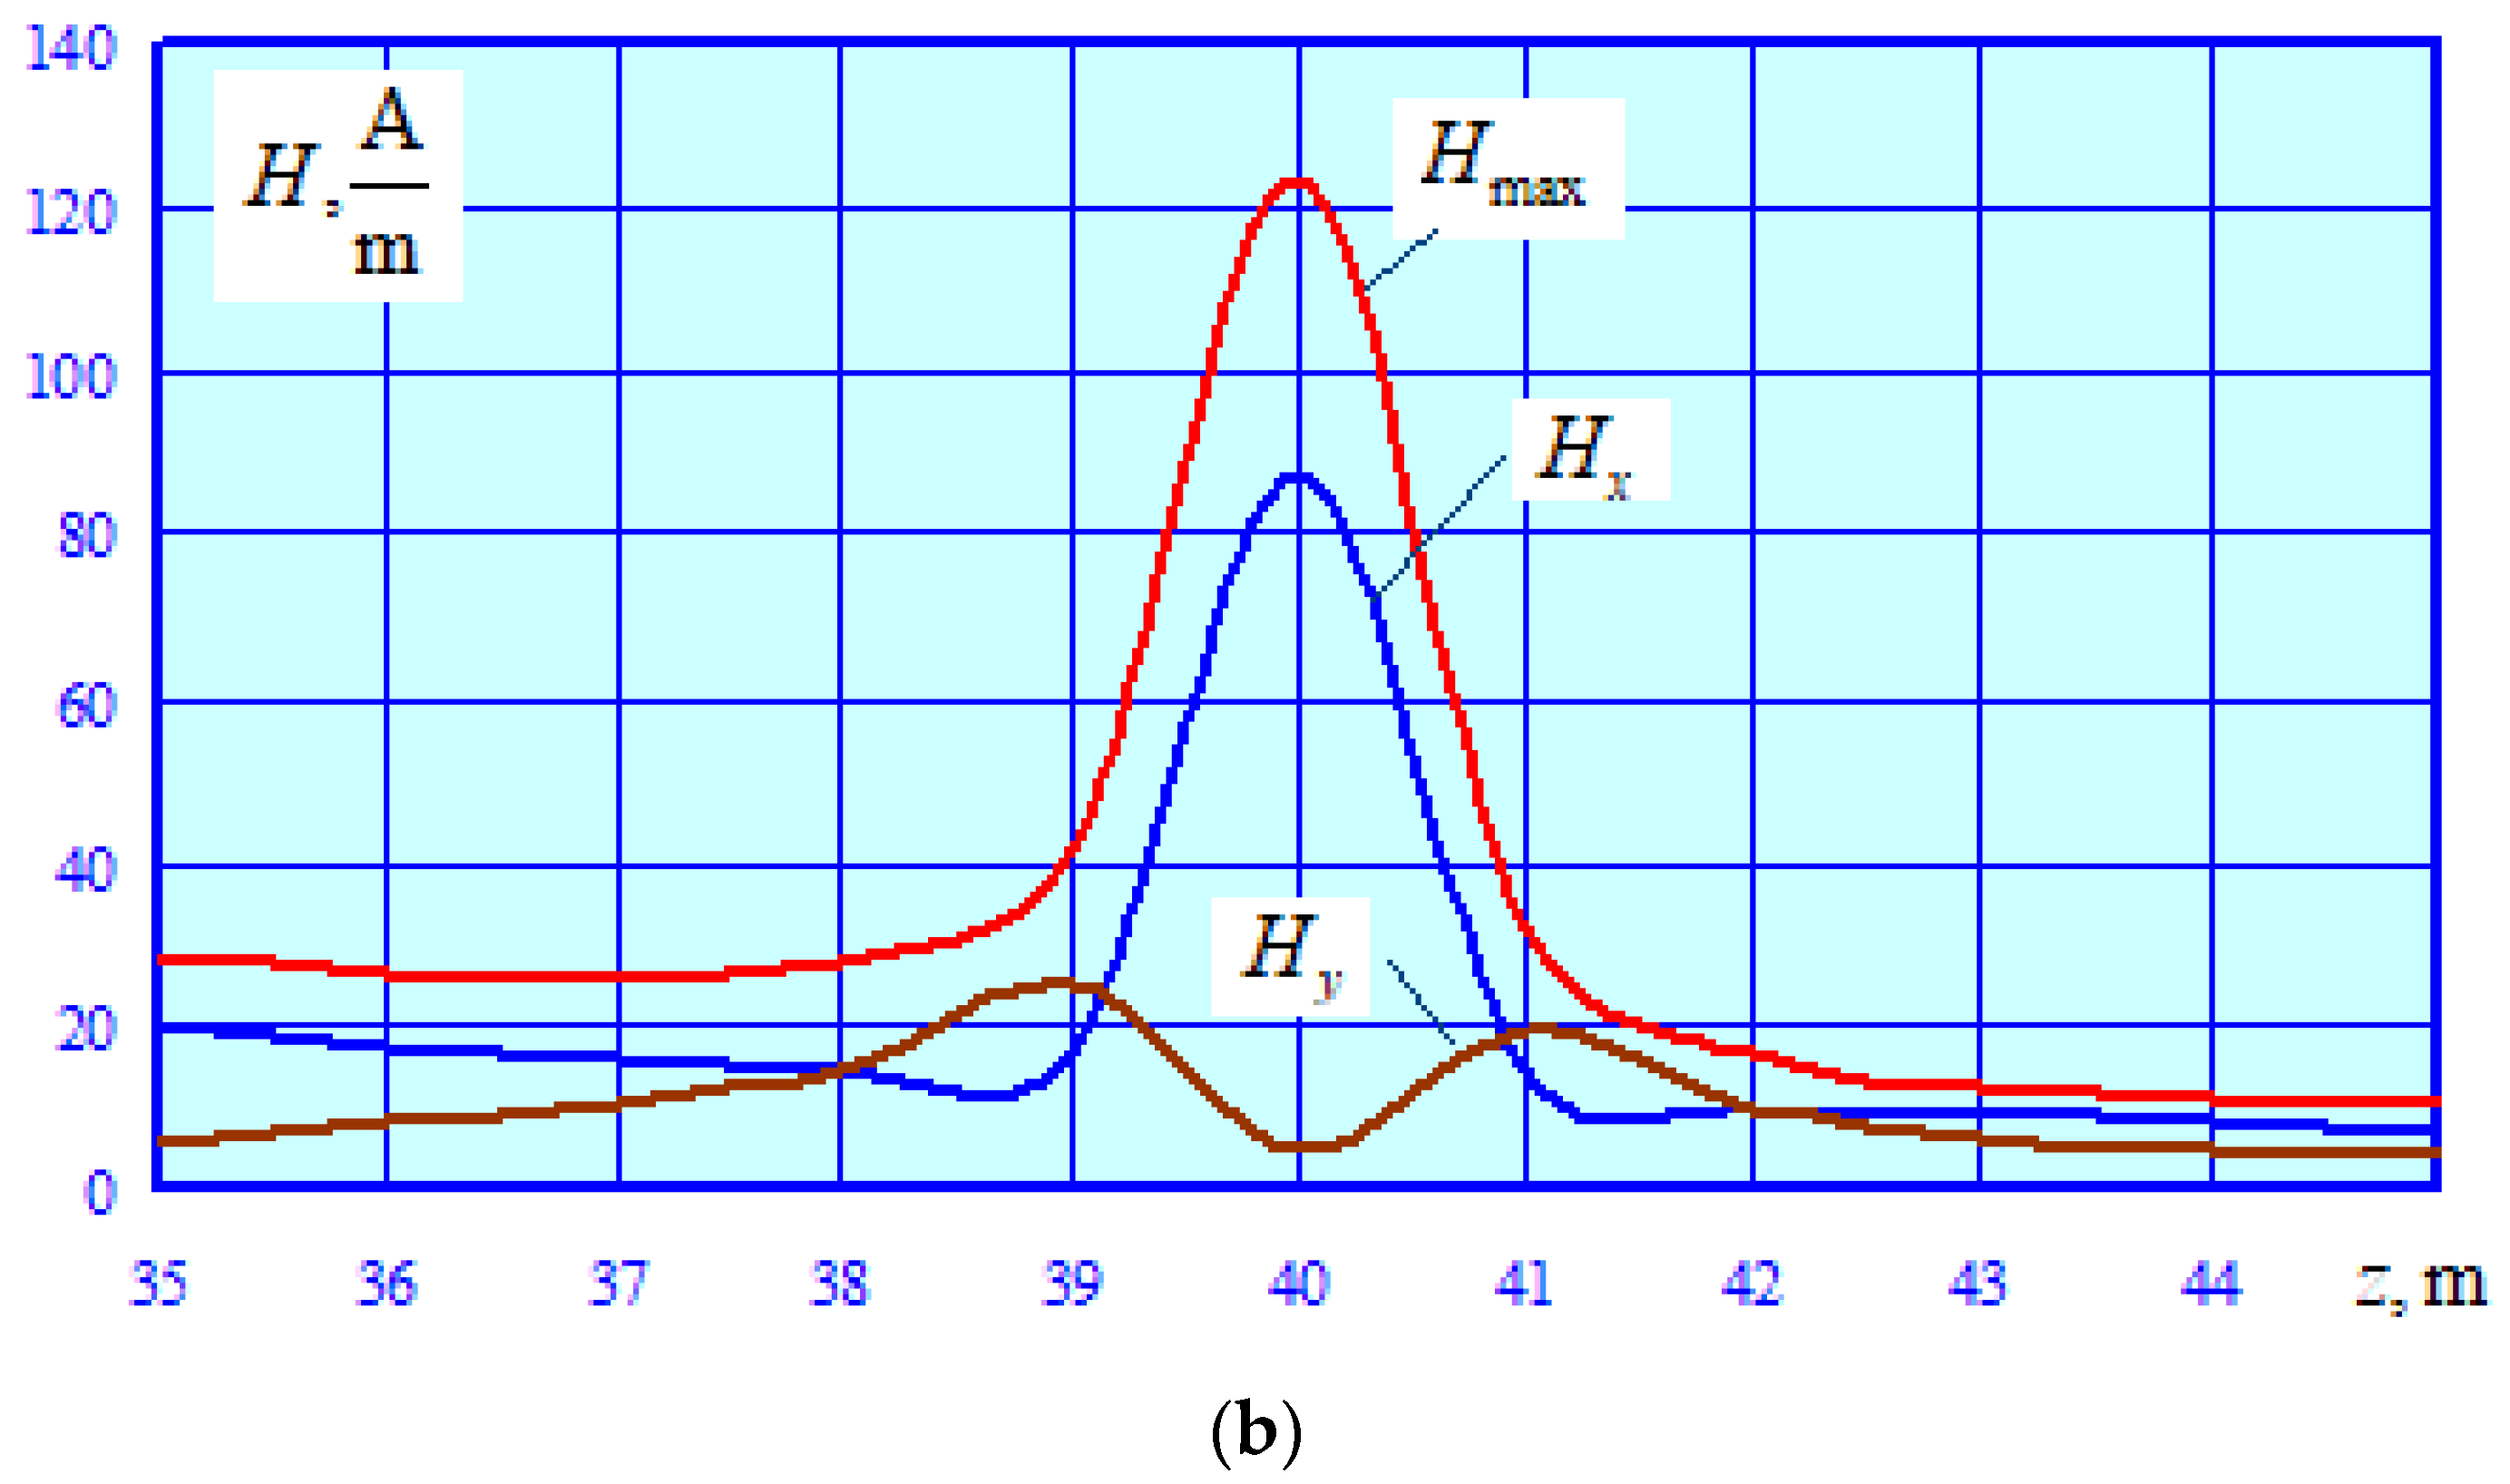
- A significant current (155 A) flowing through the pipeline in the case of a short circuit can have a negative impact on the pipeline’s corrosion protection system. The main mechanism that determines the induced voltage and current flowing through the pipe is the magnetic effect, which depends on the distribution of the traction network’s magnetic field in space. Figure 16 shows the z-coordinate dependencies of the TN magnetic field strength, which are calculated at a height of 0.5 m for the axis located perpendicular to the railway track.
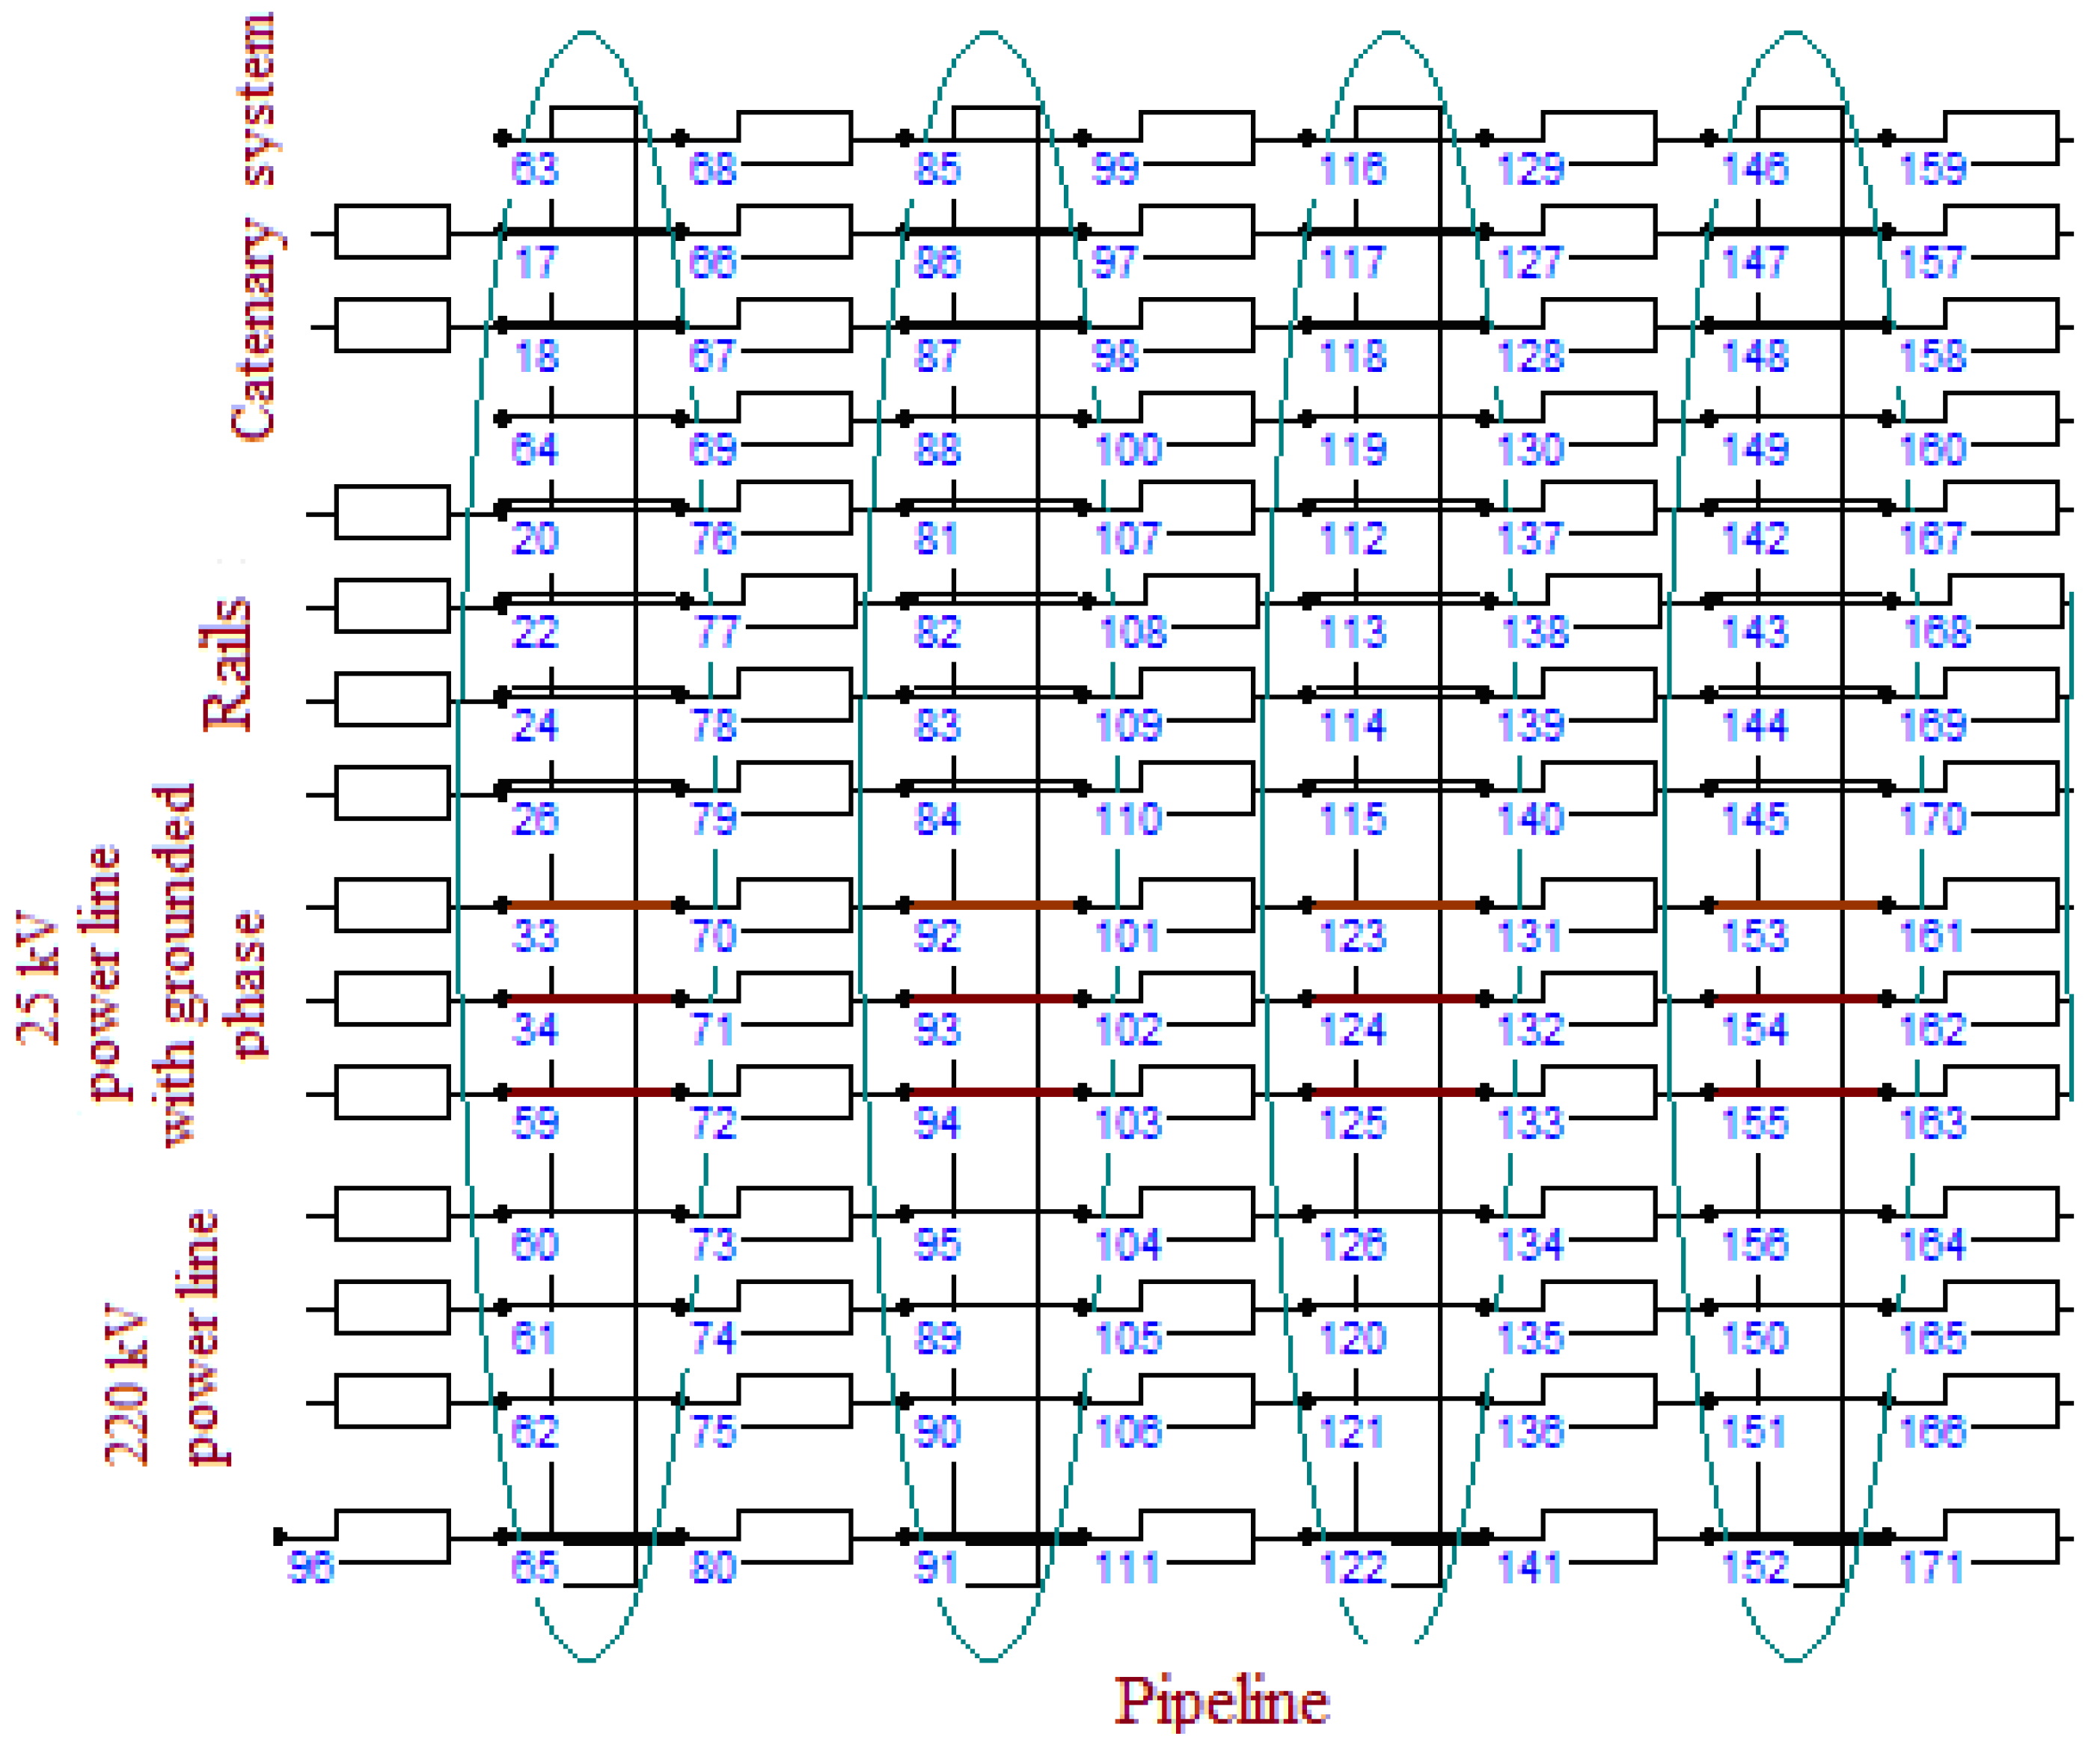
7. Modeling the Resulting Effects of Electromagnetic Interference Caused by the Traction Network and High-Voltage Power Lines on the Pipeline
- -
- Two-phase short-circuit, single-phase short circuit, and two-phase-to-ground short circuit on a 220 kV power line.
- -
- Single-phase short circuit on the 0.4 kV buses of the substation connected to the power line with a grounded phase.
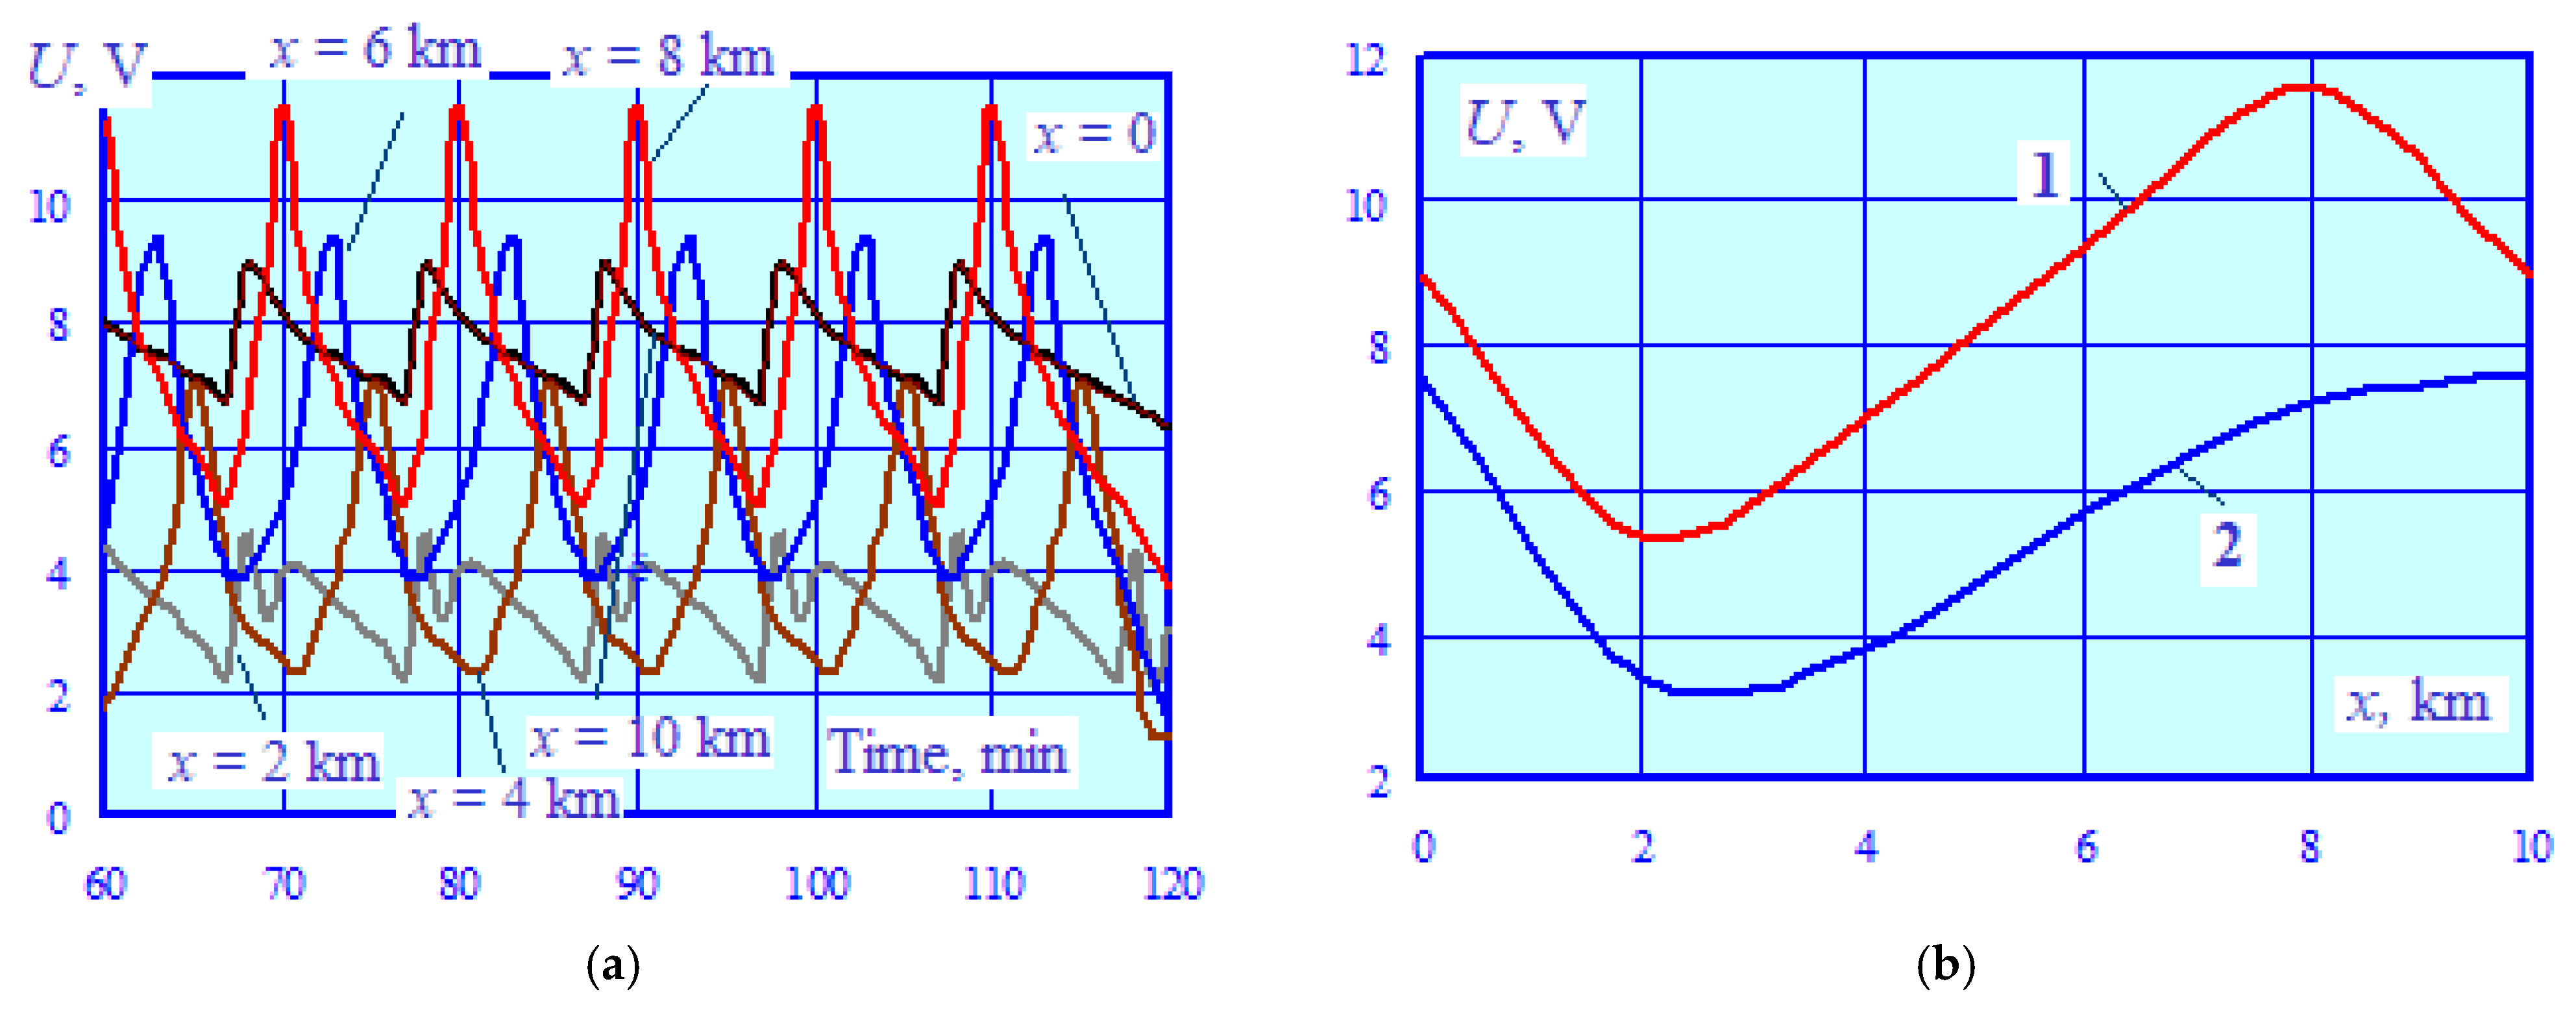
- Under normal conditions of the traction network and balanced loads of the 220 kV power line and 25 kV transmission line with a grounded phase, the maximum induced voltage does not exceed the permissible limit [2] and remains within the range of 5 to 12 V. A similar parameter for the current running through the pipe does not exceed 9 A.
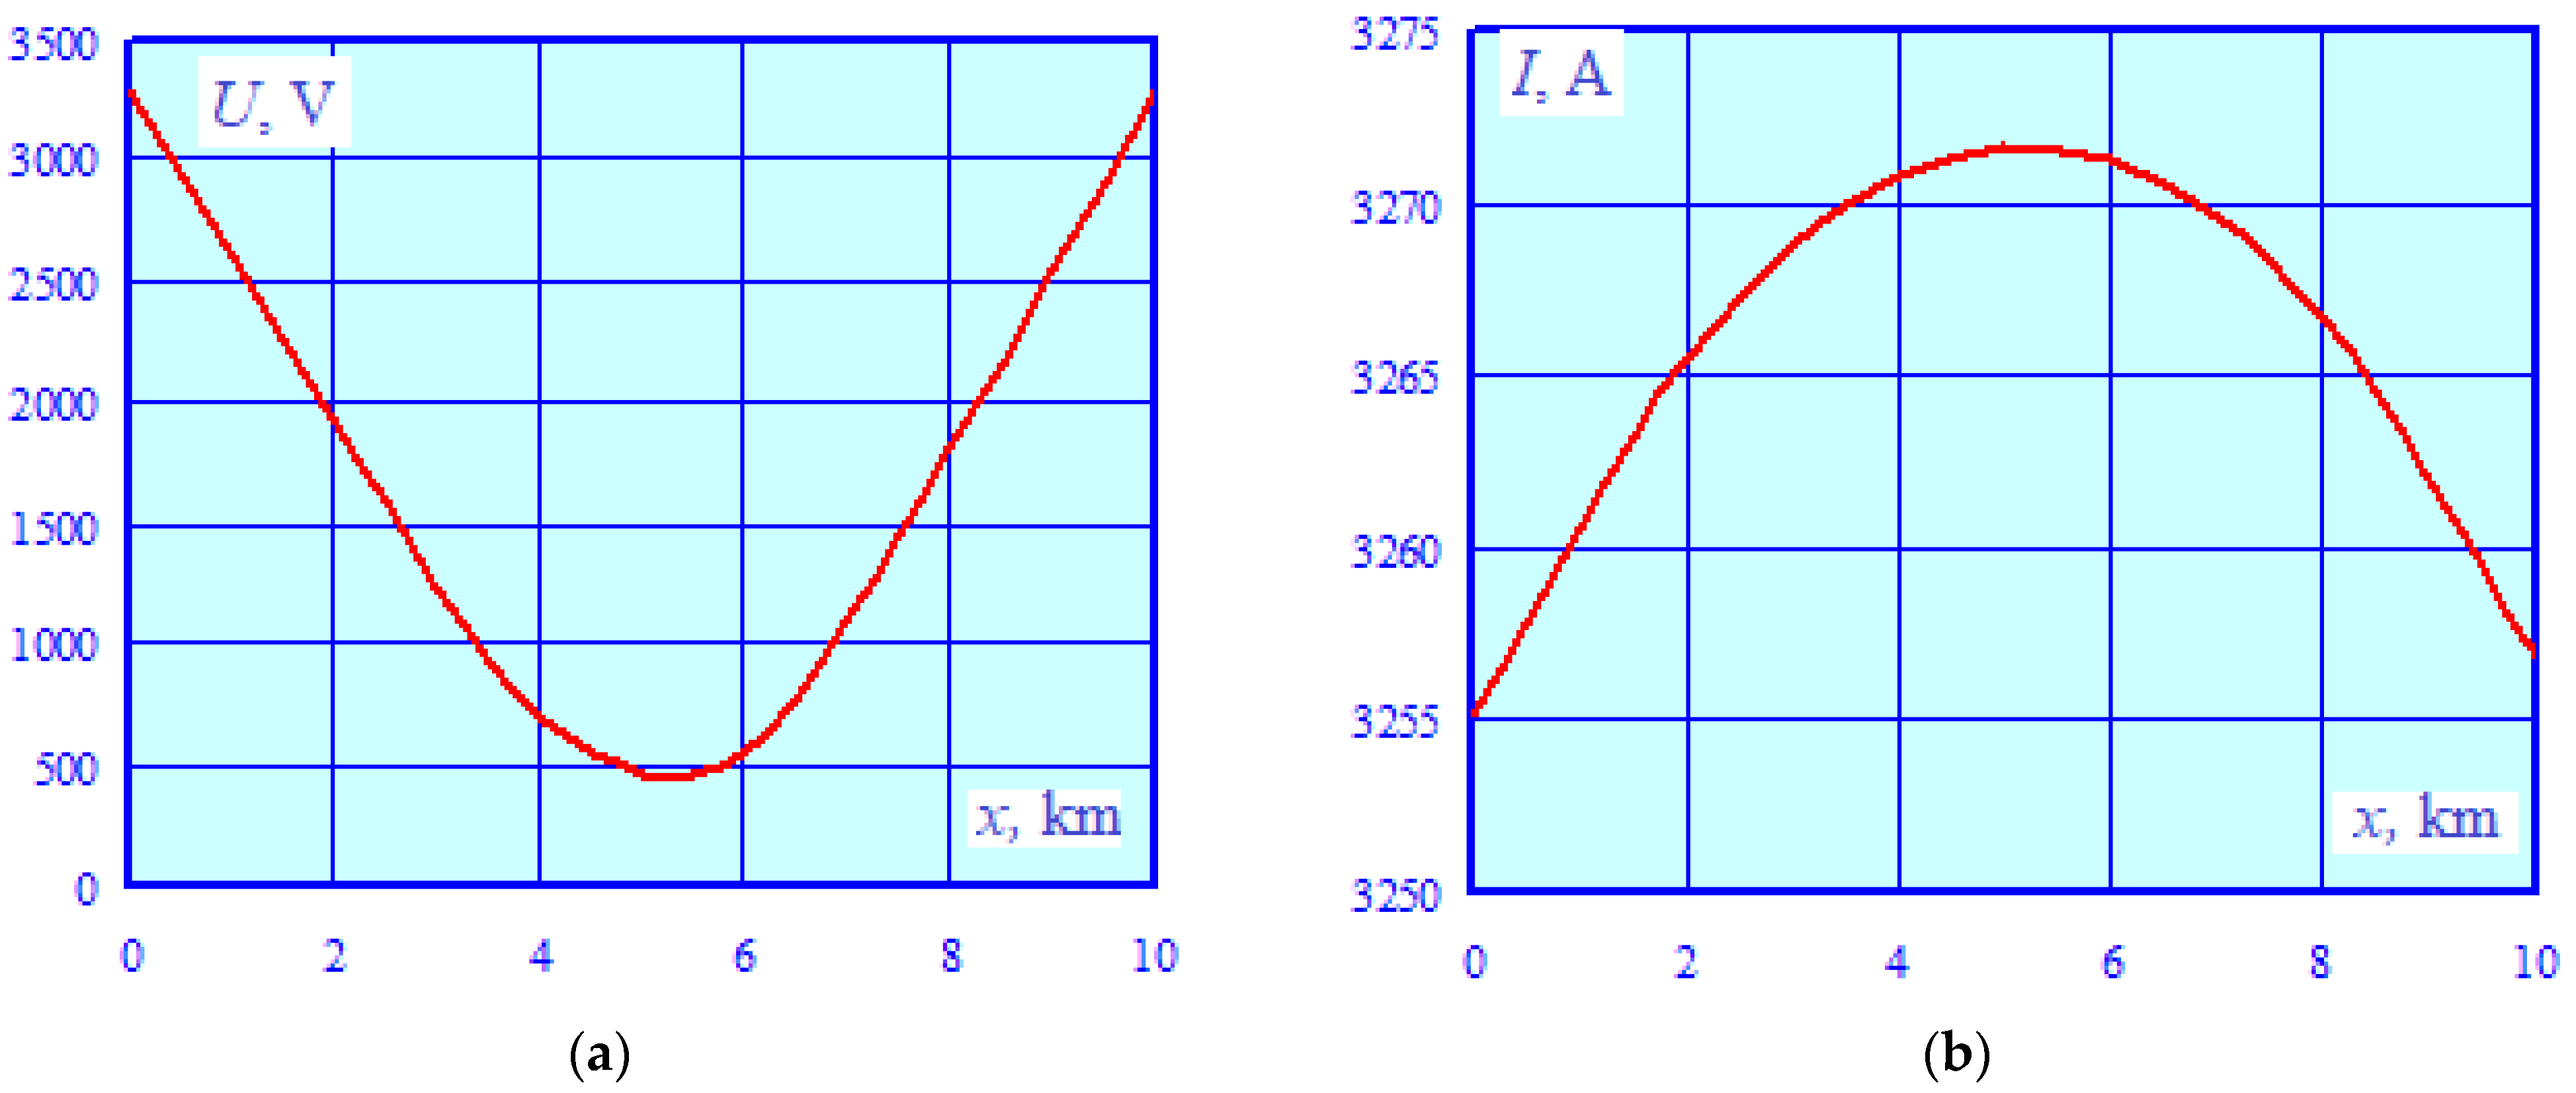
- Under emergency conditions of the 220 kV transmission line, the induced voltage and current increase significantly. In the case of a single-phase short circuit, the highest induced voltage occurs at the edges of the structure and reaches 3.3 kV, which significantly exceeds the permissible value of 1000 V [2]. Current and voltage close to the indicated values occur with a two-phase-to-ground fault.
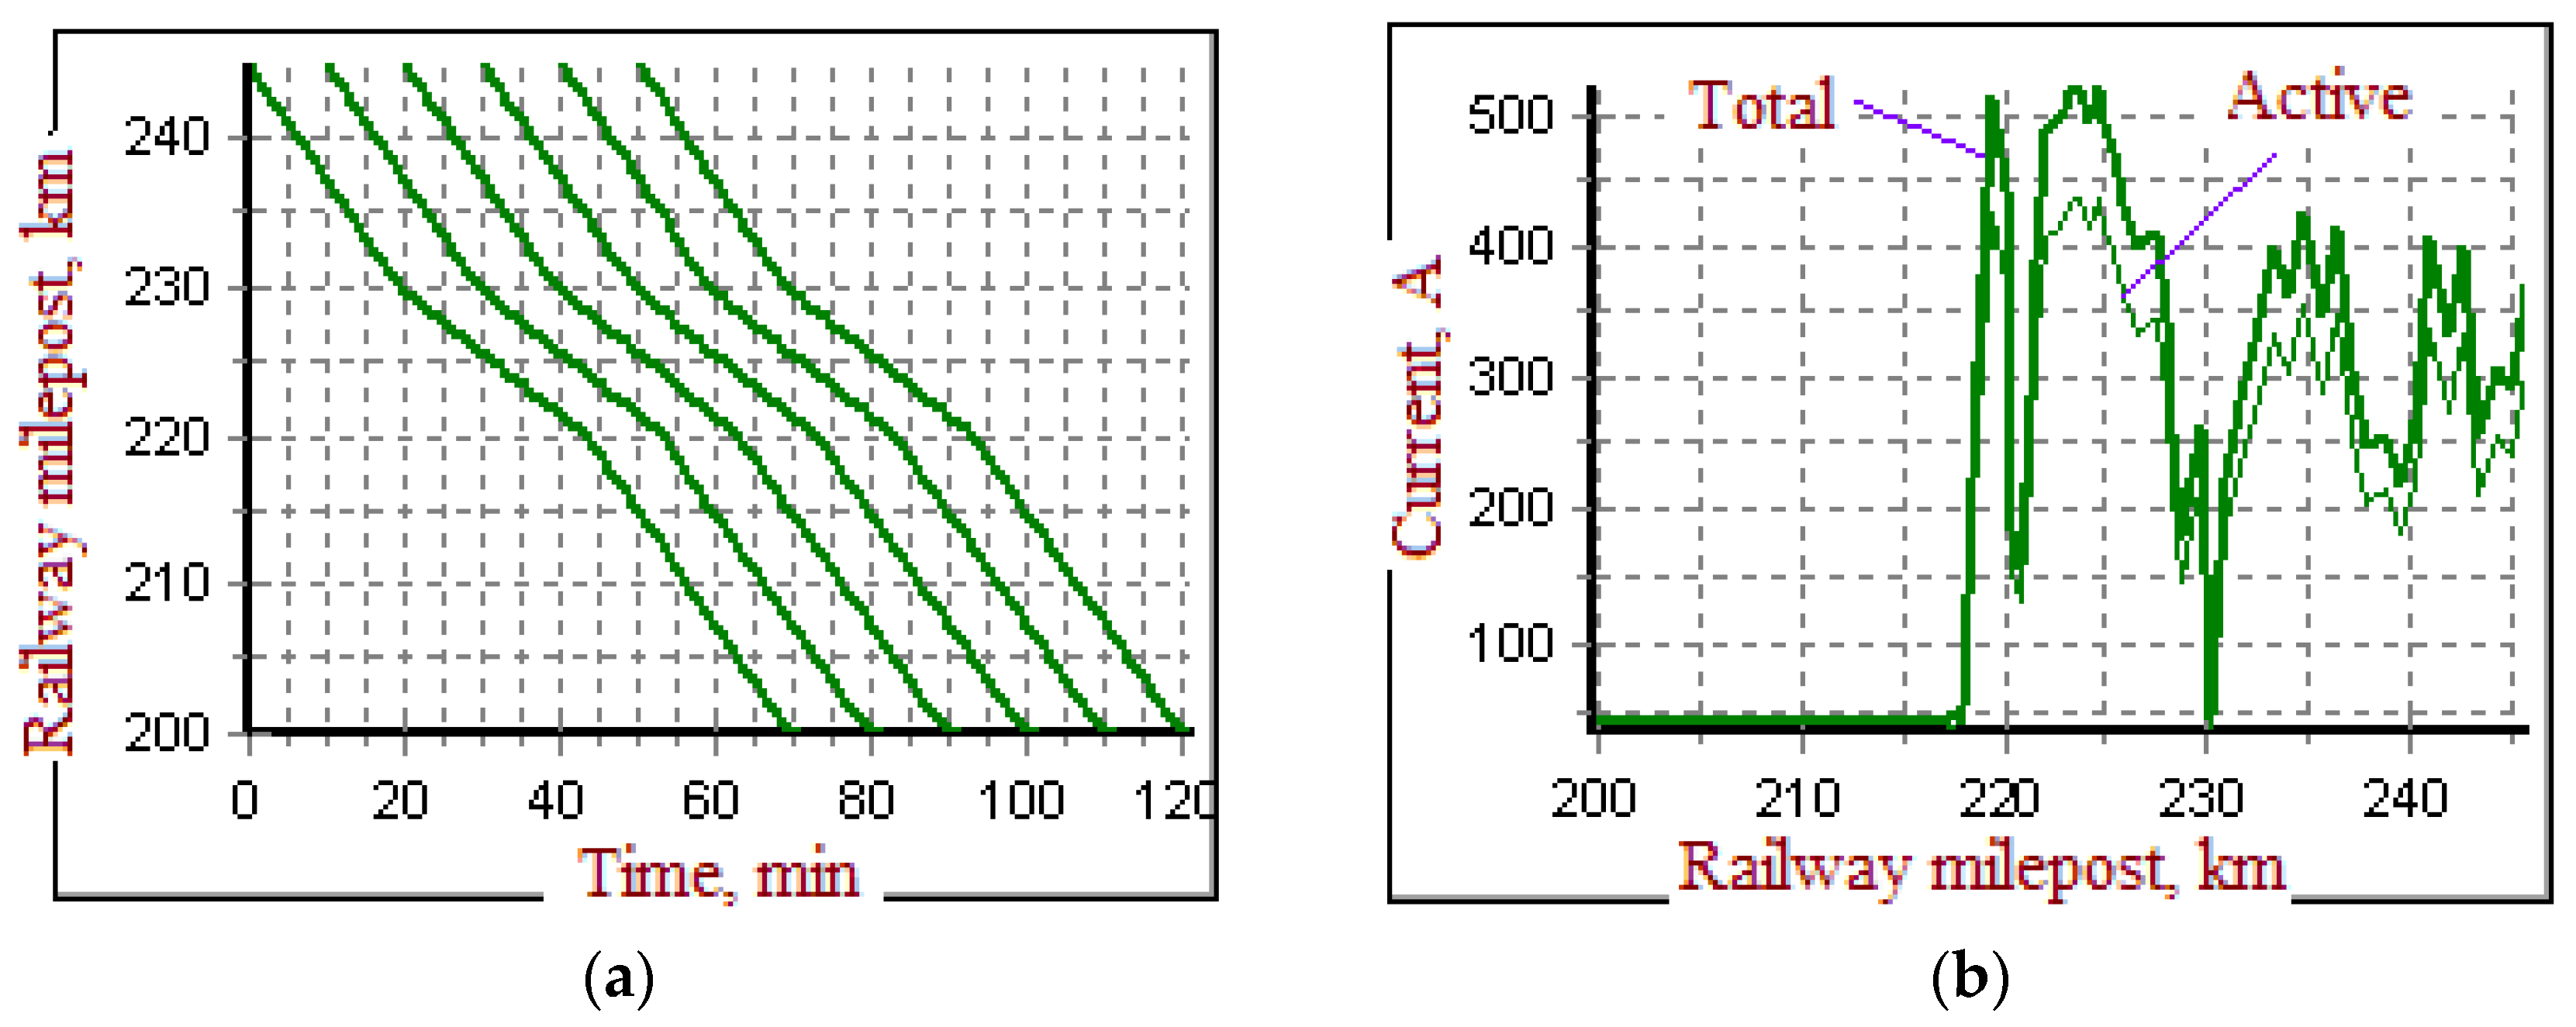
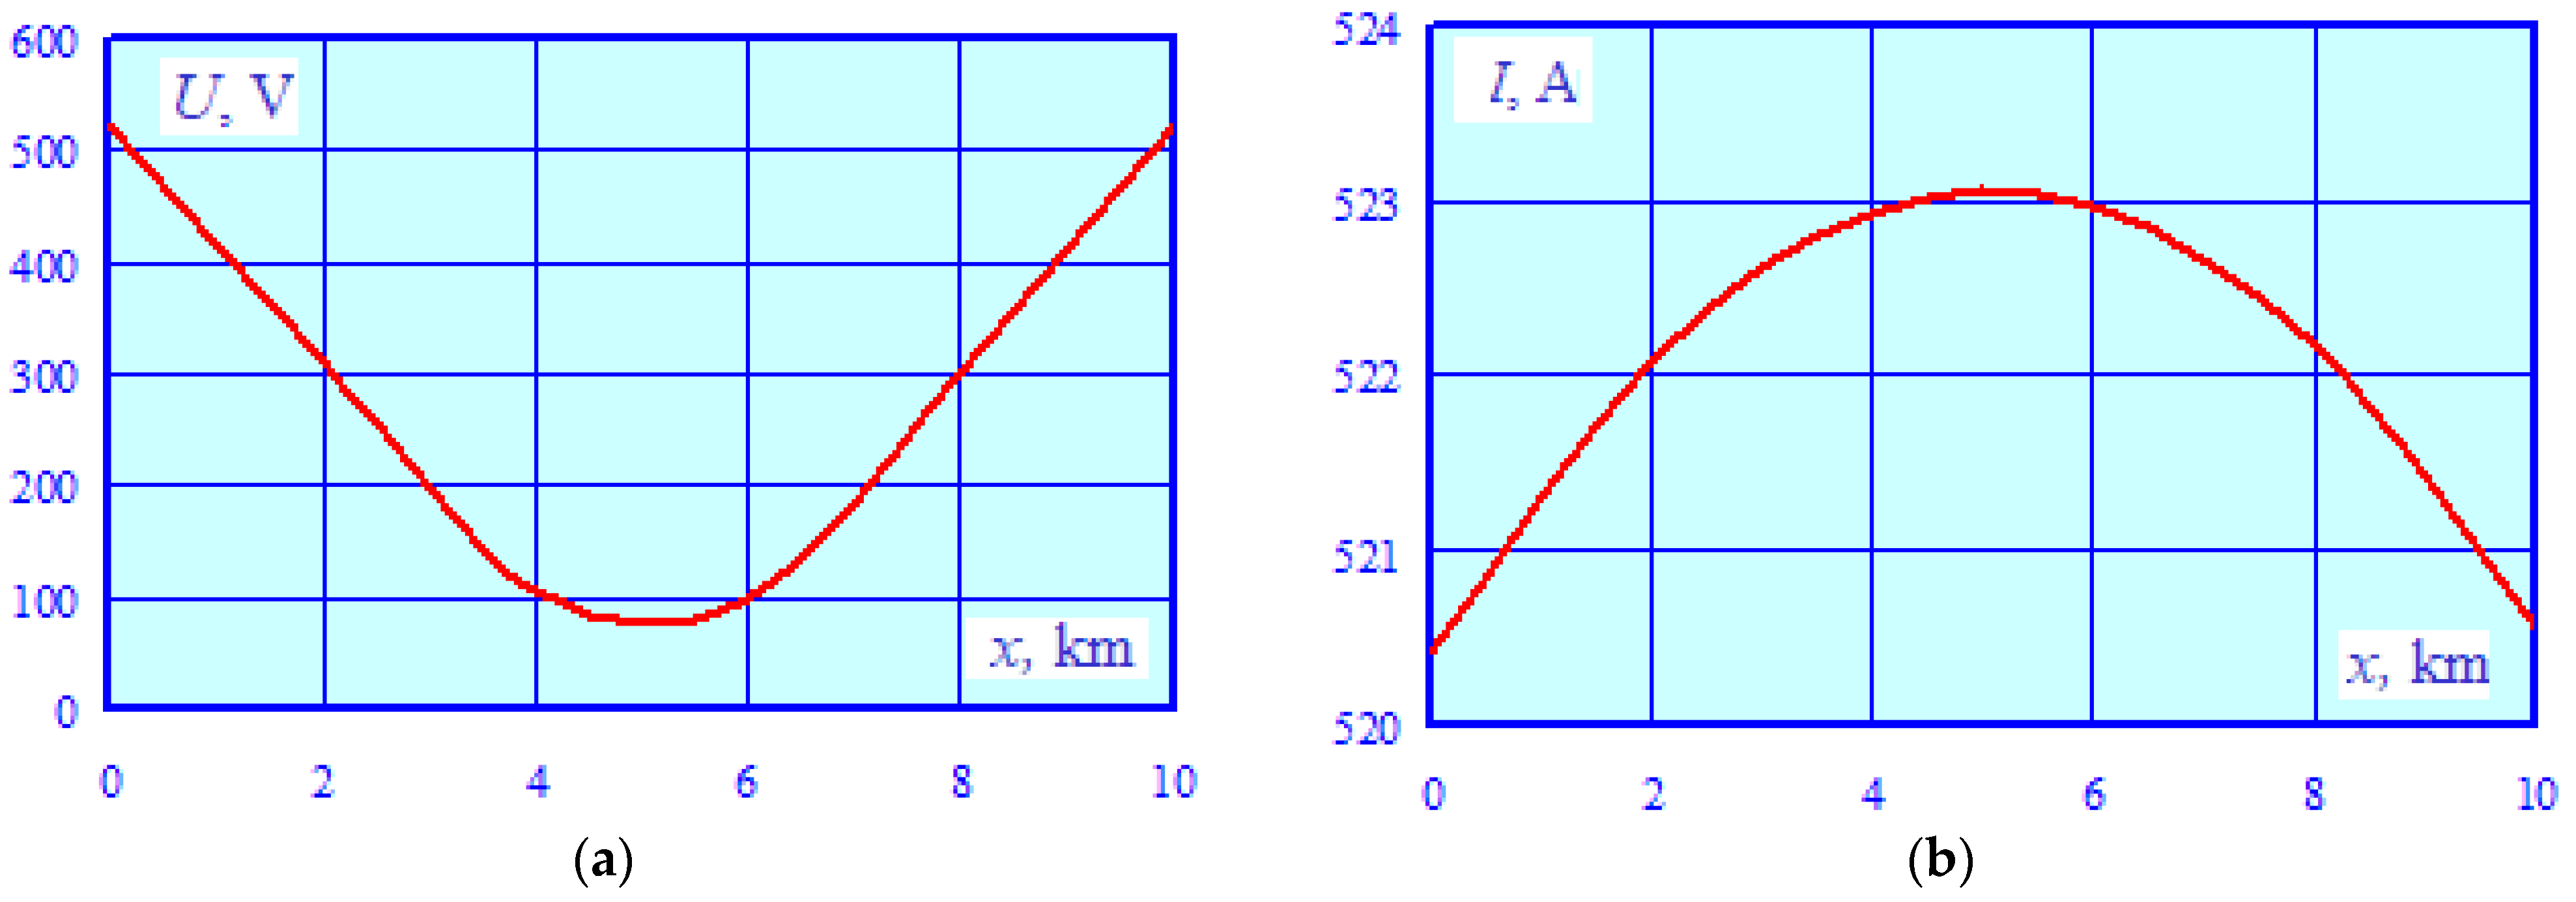
- Due to the different directions of the two-phase short-circuit currents, the induced voltage and current are much lower than the values indicated in the previous paragraph. The maximum induced voltage lies within the range of 100 to 520 V and does not exceed the permissible limit. The maximum current flowing through the pipe is within the range of 511 to 514 A.
- In the event of a single-phase short circuit on the 0.4 kV buses of the substation connected to the line with a grounded phase, the maximum induced voltage does not exceed the permissible value, ranging from 98 to 270 V. The range of 265 to 267 A corresponds to the similar parameter of induced current.
8. Discussion of Results
9. Conclusions
- Operating conditions of the influencing transmission line or traction network
- Approach trajectory
- Approach width for parallel lines and approach corridor dimensions for complex trajectories
- Nature of pipeline grounding
- Length of the joint passage for the influencing transmission line and the affected pipeline
- Soil conductivity along the approach path
- Resistance of insulating coatings
Author Contributions
Funding
Data Availability Statement
Conflicts of Interest
References
- Kotelnikov, A.V.; Kosarev, A.B. Electromagnetic effect of AC traction networks on metal structures. Electricity 1992, 9, 26–34. (In Russian) [Google Scholar]
- Technische Richtlinien-71 (TRL-71). EMR-Technic Kathodischer Korrosionsschutz fur Erdgasfernleitungen. p. 80. Available online: https://angtu.editorum.ru/en/nauka/article/38184/view (accessed on 10 March 2023).
- Shamshetdinov, K.L. Specific features of electrometric control of corrosion protection of underground pipelines affected by high-voltage power lines. Pipeline Transp. Theory Pract. 2008, 1, 58–60. (In Russian) [Google Scholar]
- Bulatov, Y.; Kryukov, A.; Suslov, K. Modeling High-voltage Transmission Line Operation under Double Earth Faults for Calculating Voltage Induced on Pipeline. In Proceedings of the 17th International Conference on Harmonics and Quality of Power (ICHQP), Naples, Italy, 29 May–1 June 2022. [Google Scholar]
- Kulikov, A.; Ilyushin, P.; Suslov, K.; Filippov, S. Estimating the Error of Fault Location on Overhead Power Lines by Emergency State Parameters Using an Analytical Technique. Energies 2023, 16, 1552. [Google Scholar] [CrossRef]
- Ratner, M.P. Inductive influence of electrified railways on electrical networks and pipelines. Transport 1966, 164. (In Russian) [Google Scholar]
- Gouda, O.E.; El Dein, A.Z.; El-Gabalawy, M.A.H. Effect of electromagnetic field of overhead transmission lines on the metallic gas pipe-lines. Electr. Power Syst. Res. 2013, 103, 129–136. [Google Scholar] [CrossRef]
- Wang, Y.; Wang, X.; Zhu, Z.; Zeng, L.; Yong, J. Effects of harmonic induction on metallic pipeline caused by overhead power lines. Int. J. Electr. Power Energy Syst. 2022, 137, 107758. [Google Scholar] [CrossRef]
- Czumbil, L.; Micu, D.D.; Munteanu, C.; Stet, D.; Tomoioaga, B. Optimal design of the pipeline right-of-way nearby high voltage transmission lines using genetic algorithms. In Proceedings of the 2015 50th International Universities Power Engineering Conference (UPEC), Stoke on Trent, UK, 3 December 2015. [Google Scholar]
- Popoli, A.; Sandrolini, L.; Cristofolini, A. Inductive coupling on metallic pipelines: Effects of a nonuniform soil resistivity along a pipeline-power line corridor. Electr. Power Syst. Res. 2020, 189, 106621. [Google Scholar] [CrossRef]
- Al Shahri, A.S.; Nair, N.-K.C. Overhead shielding wire and induced potential on pipeline located close to high voltage transmission. In Proceedings of the 2016 Australasian Universities Power Engineering Conference (AUPEC), Brisbane, QLD, Australia, 25–28 September 2016. [Google Scholar]
- Al Shahri, A.S. Assessment of Induced Potential on Metallic Pipeline Located Nearby to EHV AC OHTL. In Proceedings of the 2021 IEEE 2nd International Conference on Signal, Control and Communication (SCC), Tunis, Tunisia, 20–22 December 2021. [Google Scholar]
- Wang, X.; Wang, Y.; Sun, T.; Yang, X.; Yang, L.; Qi, Y. Study of the coupling interference of high-voltage transmission lines on adjacent buried steel pipelines based on CDEGS. Electr. Power Syst. Res. 2023, 217, 109125. [Google Scholar] [CrossRef]
- Mu, W.; Zhao, Z.; Zhu, Y.; Lei, X. A rapid modeling for analysis the effect of transmission line to oil and gas pipeline. In Proceedings of the 2016 Asia-Pacific International Symposium on Electromagnetic Compatibility (APEMC), Shenzhen, China, 17–21 May 2016; Volume 1. [Google Scholar]
- Chai, C.S.; Ab Kadir, M.Z.A.; Izadi, M.; Jasni, J.; Gomes, C. The effect of electromagnetic fields due to hv line on the parallel pipeline. In Proceedings of the 2014 IEEE International Conference on Power and Energy (PECon), Kuching, Malaysia, 1–3 December 2014. [Google Scholar]
- Al-Gabalawy, M.; Mostafa, M.A.; Hamza, A.S. Mitigation of AC induced voltage on the metallic pipeline based-on the optimal design of KOH-Polarization cells. Electr. Power Syst. Res. 2021, 194, 107081. [Google Scholar] [CrossRef]
- Junyang; Li, X. Interference on Buried Pipeline with Insulating Flange Near High Voltage Transmission Line. In Proceedings of the 2018 2nd IEEE Advanced Information Management, Communicates, Electronic and Automation Control Conference (IMCEC), Xi’an, China, 25–27 May 2018. [Google Scholar]
- Shwehdi, M.H.; Alaqil, M.A.; Mohamed, S.R. EMF Analysis for a 380 kV Transmission OHL in the Vicinity of Buried Pipelines. IEEE Access 2020, 8, 3710–3717. [Google Scholar] [CrossRef]
- Al Shahri, A.S.; Nair, N.-K.C. AC potential on pipelines nearby EHV power lines due to Low Frequency Induction. In Proceedings of the 2015 Australasian Universities Power Engineering Conference (AUPEC), Wollongong, NSW, Australia, 27–30 September 2015. [Google Scholar]
- Dawalibi, F.; Pinho, A. Computerized Analysis of Power Systems and Pipelines Proximity Effects. IEEE Trans. Power Deliv. 1986, 1, 40–48. [Google Scholar] [CrossRef]
- Sun, H.; Wang, P.; Chang, H.; Ai, X.; E, T.; Su, B.; Zhu, R.; Li, Z.; Wang, C. Study on electromagnetic influence of 750 kV AC transmission lines on multiple buried pipelines. In Proceedings of the Asia-Pacific International Symposium on Electromagnetic Compatibility (APEMC), Shenzhen, China, 17–21 May 2016; Volume 1. [Google Scholar]
- Liu, X.-T.; Wang, W.; Yu, H. Analysis of Mutual Electromagnetic Influence between Transmission Line and Buried Pipeline. In Proceedings of the 2017 4th International Conference on Information Science and Control Engineering (ICISCE), Changsha, China, 21–23 July 2017. [Google Scholar]
- Sawma, E.; Zeitoun, B.; Harmouche, N.; Georges, S.; Hamad, M.; Slaoui, F.H. Electromagnetic induction in pipelines due to overhead high voltage power lines. In Proceedings of the 2010 International Conference on Power System Technology, Zhejiang, China, 24–28 October 2010. [Google Scholar]
- Lu, D.; Liu, C.; Qi, L.; Yuan, H. Mitigation of Electromagnetic Influence on the Buried Metal Pipeline near Overhead AC Transmission Line. In Proceedings of the 2012 Sixth International Conference on Electromagnetic Field Problems and Applications, Dalian, China, 19–21 June 2012. [Google Scholar]
- Adamek, M.; Vostracky, Z. Interference from transmission lines to buried pipelines. In Proceedings of the 2015 16th International Scientific Conference on Electric Power Engineering (EPE), Kouty nad Desnou, Czech Republic, 20–22 May 2015. [Google Scholar]
- Xie, H.-C.; Zhang, G.-Z.; Zhang, X.-W. Study of electromagnetic impact on buried metallic pipelines due to lightning strike on UHV AC double-circuit tower. In Proceedings of the 2010 Asia-Pacific International Symposium on Electromagnetic Compatibility, Beijing, China, 12–16 April 2010. [Google Scholar]
- Suslov, K.; Kryukov, A.; Voronina, E.; Fesak, I. Modeling Power Flows and Electromagnetic Fields Induced by Compact Overhead Lines Feeding Traction Substations of Mainline Railroads. Appl. Sci. 2023, 13, 4249. [Google Scholar] [CrossRef]
- Liu, X.-T.; Wang, W.; Yu, H. Electromagnetic Effect on Underground Pipeline of the Lightning Strike 330kV Transmission Lines. In Proceedings of the 2017 4th International Conference on Information Science and Control Engineering (ICISCE), Changsha, China, 21–23 July 2017. [Google Scholar]
- Kryukov, A.; Suslov, K.; Van Thao, L.; Hung, T.D.; Akhmetshin, A. Power Flow Modeling of Multi-Circuit Transmission Lines. Energies 2022, 15, 8249. [Google Scholar] [CrossRef]
- Chrysostomou, D.; Dimitriou, A.; Kokkinos, N.; Charalambous, C.A. Short-Term Electromagnetic Interference on a Buried Gas Pipeline Caused by Critical Fault Events of a Wind Park: A Realistic Case Study. IEEE Trans. Ind. Appl. 2020, 56, 1162–1170. [Google Scholar] [CrossRef]
- Elhirbawy, M.A.; Jennings, L.S.; Al Dhalaan, S.M.; Keerthipala, W.W.L. Practical results and finite difference method to analyze the electric and magnetic field coupling between power transmission line and pipeline. In Proceedings of the 2003 International Symposium on Circuits and Systems, 2003. ISCAS’03, Bangkok, Thailand, 25–28 May 2003. [Google Scholar]
- Zhang, W.; Jiang, J.; Guo, J.; Lu, J. A electromagnetic effect calculation method for engineering design on oil/gas pipelines due to 1000kV AC transmission line in single-phase ground fault. In Proceedings of the 2010 Asia-Pacific International Symposium on Electromagnetic Compatibility, Beijing, China, 12–16 April 2010. [Google Scholar]
- Zou, J.; Yuan, J.; Ma, X. A circuit model of buried metallic pipelines for the evaluation of shielding effectiveness to nearby communication lines. In Proceedings of the 2002 3rd International Symposium on Electromagnetic Compatibility, Beijing, China, 21–24 May 2002. [Google Scholar]
- Zakaryukin, V.P.; Kryukov, A.V. Complex Unbalanced Operating Conditions of Electrical Systems; Publishing House of Irkutsk State University: Irkutsk, Russia, 2005; p. 273. (In Russian) [Google Scholar]
- Zakaryukin, V.P.; Kryukov, A.V. Determination of the induced voltages when nonparallel power lines are adjacent to one another. Power Technol. Eng. 2015, 49, 304–309. (In Russian) [Google Scholar] [CrossRef]
- Kryukov, A.; Suslov, K.; Ilyushin, P.; Akhmetshin, A. Parameter Identification of Asynchronous Load Nodes. Energies 2023, 16, 1893. [Google Scholar] [CrossRef]
- Carson, I.R. Wave propagation in overhead wires with ground return. Bell Syst. Tech. J. 1926, 5, 539–554. [Google Scholar] [CrossRef]
- Vasilyansky, A.M.; Mamoshin, R.R.; Yakimov, G.B. Improving the system of traction power supply of railways electrified on alternating current 27.5 kV, 50 Hz. Zheleznye Dorogi Mira 2002, 8, 40–46. (In Russian) [Google Scholar]
- Kulikov, A.; Ilyushin, P.; Suslov, K.; Filippov, S. Organization of Control of the Generalized Power Quality Parameter Using Wald’s Sequential Analysis Procedure. Inventions 2023, 8, 17. [Google Scholar] [CrossRef]


| No. | Parameter | Phase A | Phase B | Phase C |
|---|---|---|---|---|
| 1 | UHV, kV | 132.8 | 132.8 | 132.8 |
| 2 | UMV, kV | 27.5 | 27.5 | 27.5 |
| 3 | ULV, kV | 11 | 11 | 11 |
| No. | Parameter | HV-MV | HV-LV | MV-LV |
|---|---|---|---|---|
| 1 | ∆Pk, kW | 220 | 220 | 200 |
| 2 | 12.5 | 17 | 6 |
| S1, m2 | S2, m2 | l1, m | l2, m | l7, m |
|---|---|---|---|---|
| 0.4 | 0.8 | 1.5 | 3 | 1.5 |
| Winding | SH, MV·A | B2m, T | Ix, % | ΔPx, kW |
|---|---|---|---|---|
| HV | 40 | 1.6 | 1.1 | 66 |
| MV | 40 | |||
| LV | 40 |
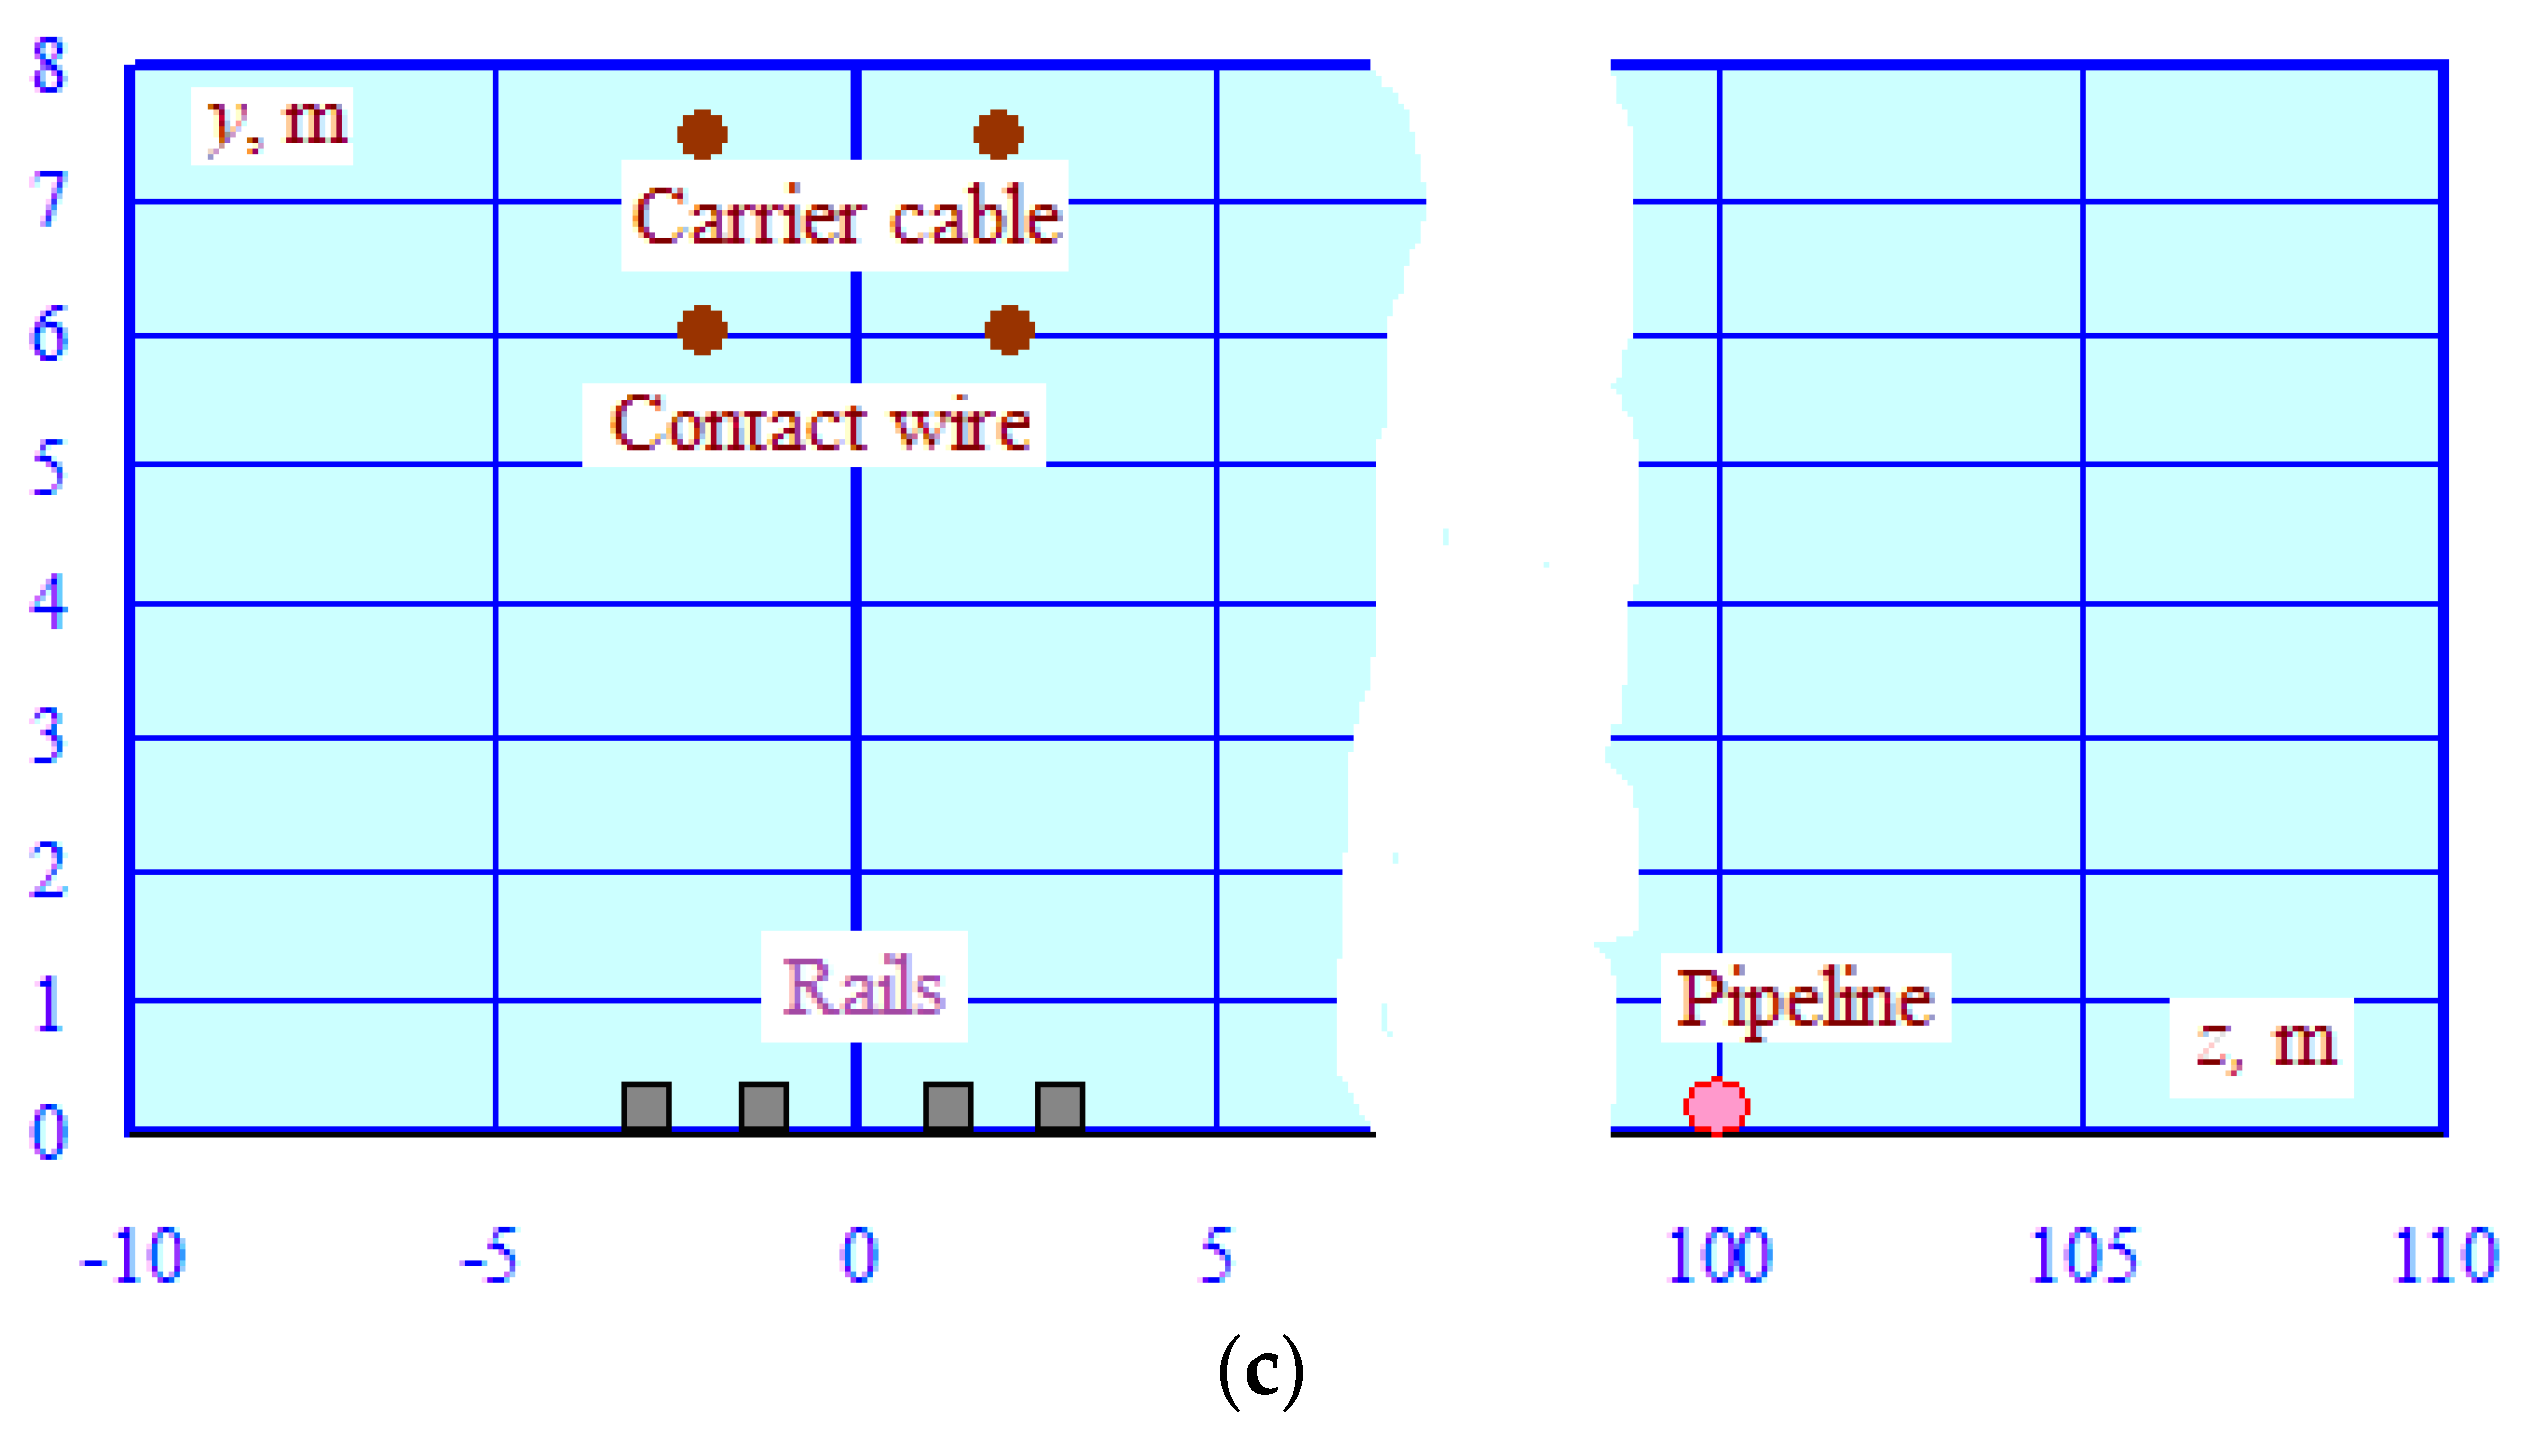
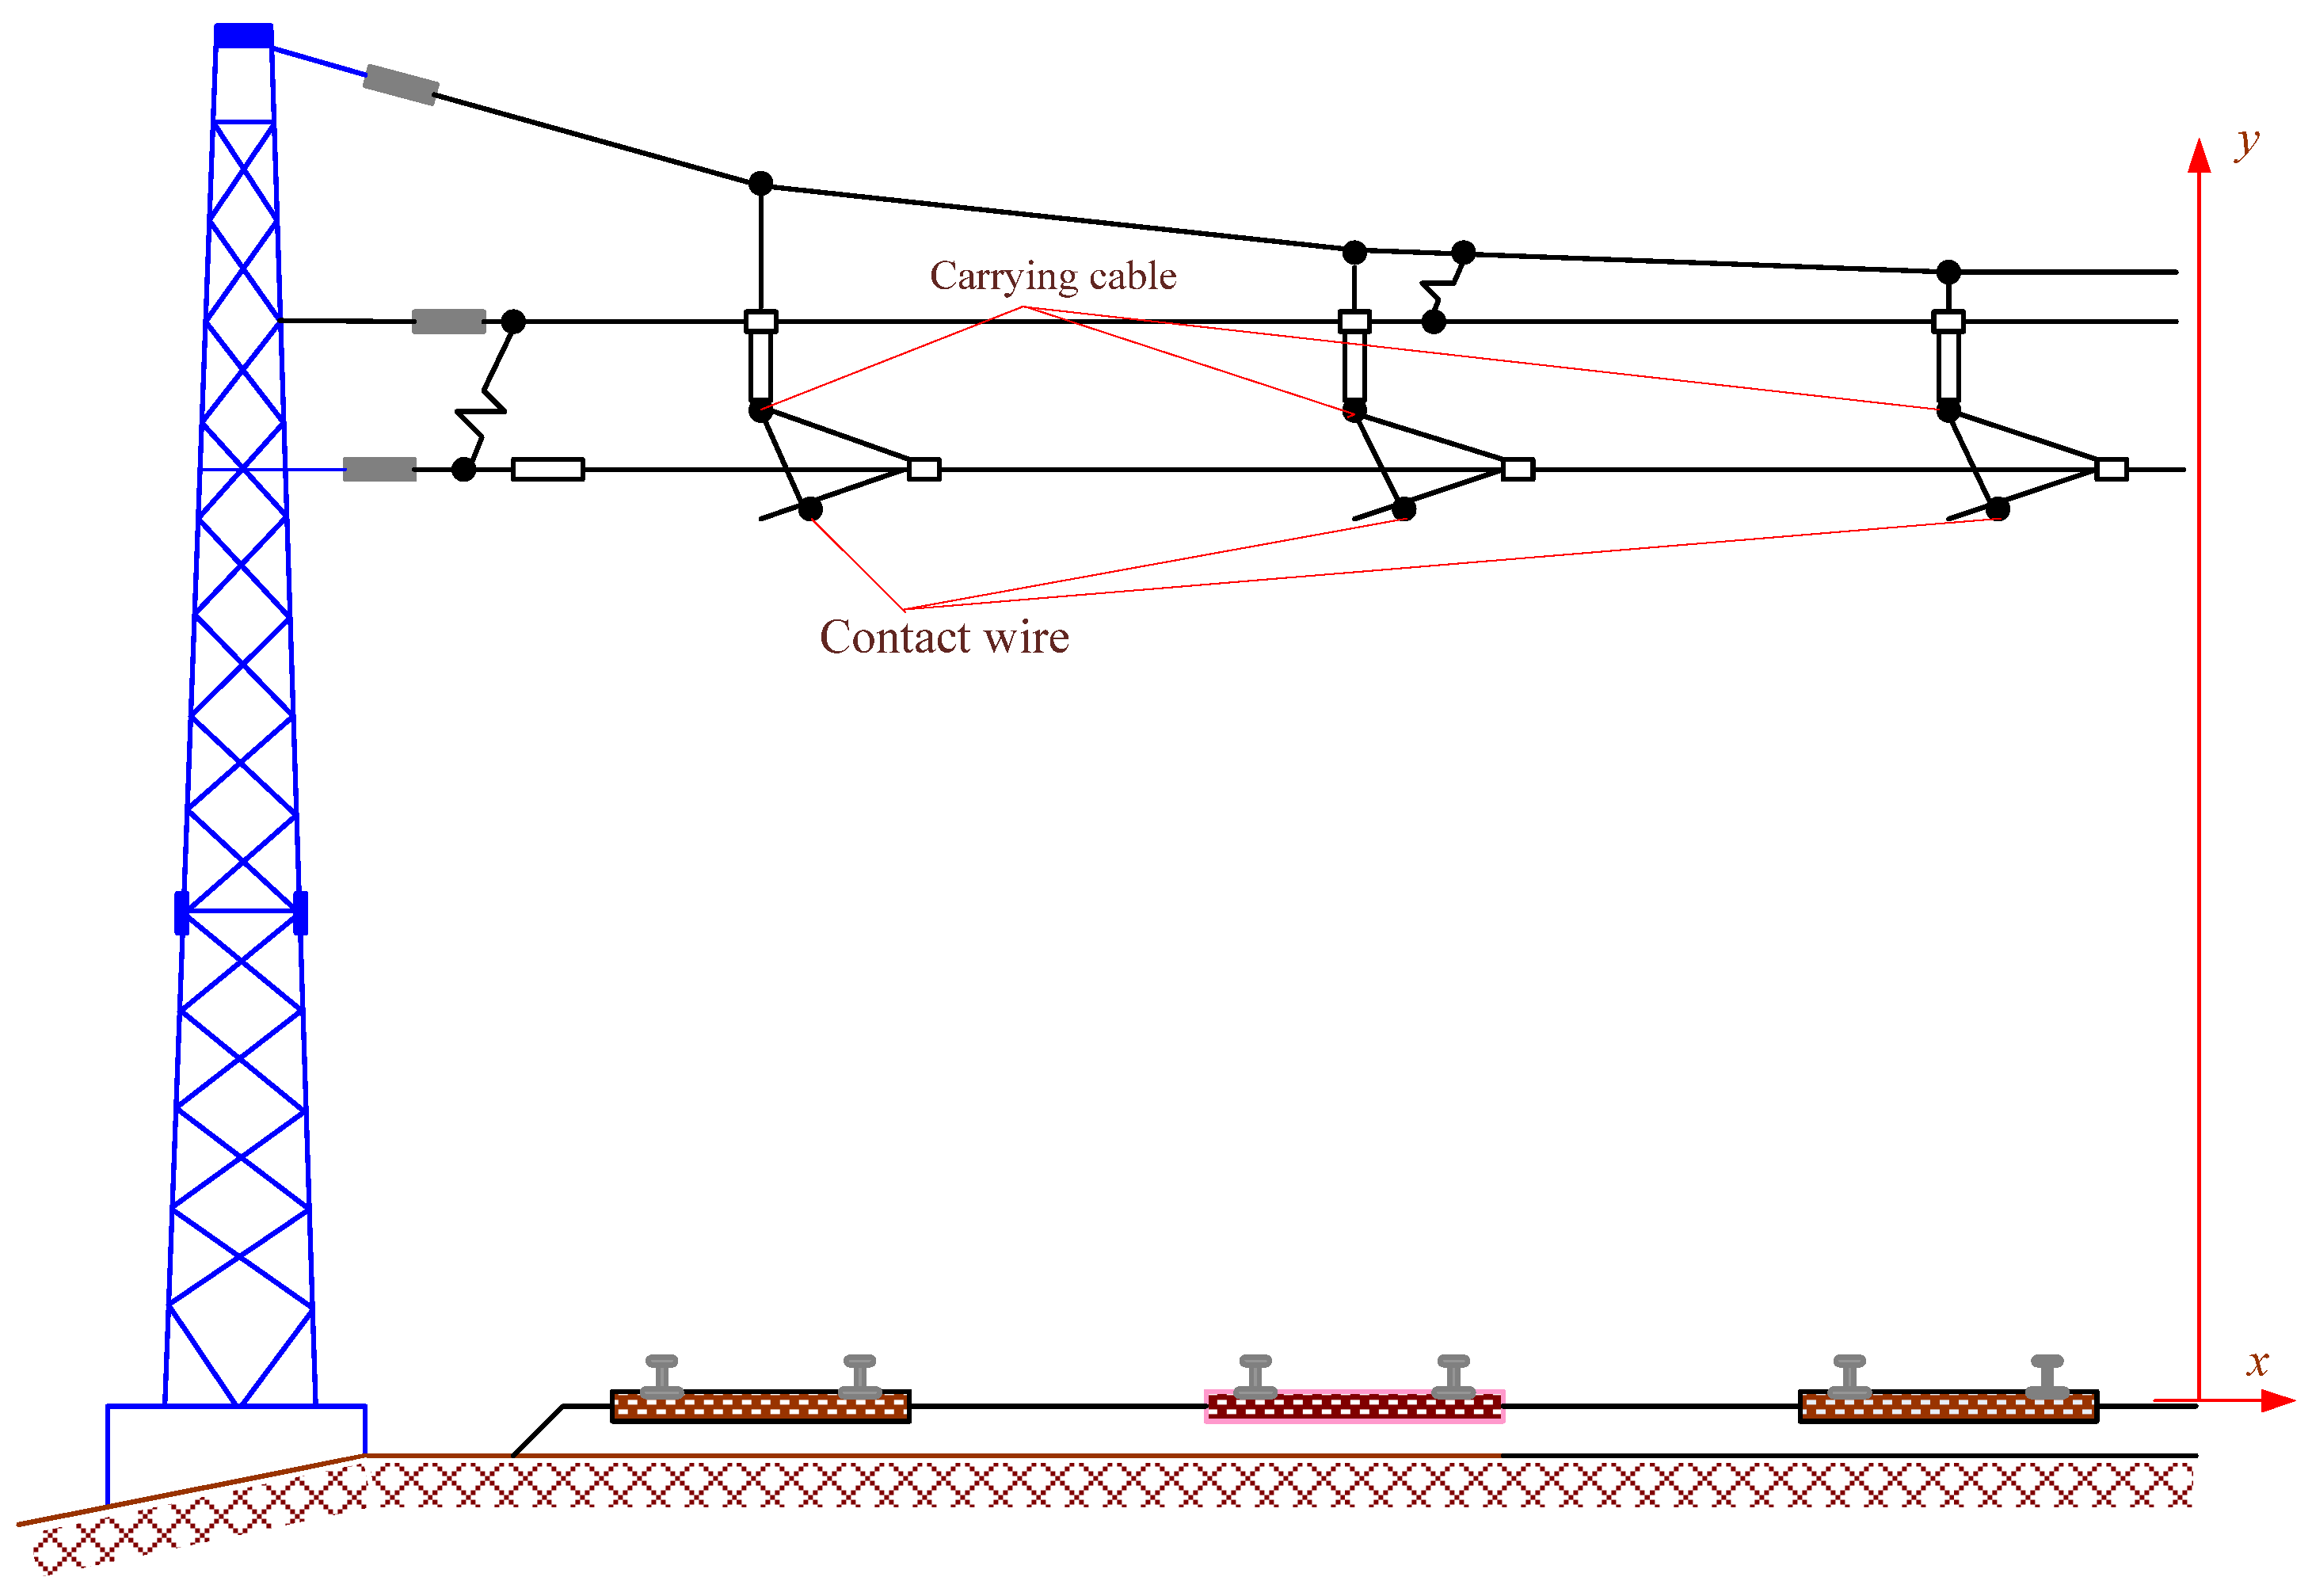
| Name of Current-Carrying Part | R0, Ohm/km | Radius, cm | F, mm2 | γ, S/km |
|---|---|---|---|---|
| Carrier cable | 0.62 | 0.62 | 95 | 0 |
| Contact wire | 0.177 | 0.62 | 100 | 0 |
| Rail | 0.2 | 11.14 | 8290 | 0.5 |
| Pipeline | 0.1 | 12.5 | 50,000 | 0.05 |
Disclaimer/Publisher’s Note: The statements, opinions and data contained in all publications are solely those of the individual author(s) and contributor(s) and not of MDPI and/or the editor(s). MDPI and/or the editor(s) disclaim responsibility for any injury to people or property resulting from any ideas, methods, instructions or products referred to in the content. |
© 2023 by the authors. Licensee MDPI, Basel, Switzerland. This article is an open access article distributed under the terms and conditions of the Creative Commons Attribution (CC BY) license (https://creativecommons.org/licenses/by/4.0/).
Share and Cite
Suslov, K.; Kryukov, A.; Ilyushin, P.; Cherepanov, A.; Kryukov, A. Modeling the Effects of Electromagnetic Interference from Multi-Wire Traction Networks on Pipelines. Energies 2023, 16, 4188. https://doi.org/10.3390/en16104188
Suslov K, Kryukov A, Ilyushin P, Cherepanov A, Kryukov A. Modeling the Effects of Electromagnetic Interference from Multi-Wire Traction Networks on Pipelines. Energies. 2023; 16(10):4188. https://doi.org/10.3390/en16104188
Chicago/Turabian StyleSuslov, Konstantin, Andrey Kryukov, Pavel Ilyushin, Aleksander Cherepanov, and Aleksander Kryukov. 2023. "Modeling the Effects of Electromagnetic Interference from Multi-Wire Traction Networks on Pipelines" Energies 16, no. 10: 4188. https://doi.org/10.3390/en16104188
APA StyleSuslov, K., Kryukov, A., Ilyushin, P., Cherepanov, A., & Kryukov, A. (2023). Modeling the Effects of Electromagnetic Interference from Multi-Wire Traction Networks on Pipelines. Energies, 16(10), 4188. https://doi.org/10.3390/en16104188