Abstract
Based on the shear stress transfer (SST) k-ω model, Ffowcs-Williams and Hawkings (FW–H) equation, and Lilley sound source equation, the flow and sound field of high-temperature and high-pressure steam ejectors are simulated. The entrainment performance, near-field sound source, and far-field noise of the steam ejector are discussed. The influences of working parameters including the primary steam pressure, the secondary steam pressure, and the back pressure are analyzed. The results show that under the design conditions, the steam ejector has two shock waves and three sound source regions. A shear layer at the boundary of the first shock wave generates the Sound source-I, and the flow separation at the boundary of the second shock wave causes the Sound source-III. The Sound source-II is located near the mixing chamber wall and the sound pressure levels around the ejector depend on the distances from the Sound source-II. In terms of the entrainment performance, with the increasing primary pressure or the decreasing secondary pressure, as the driving pressure difference of the secondary steam decreases, so does the entrainment ratio. As the back pressure increases, the entrainment ratio firstly remains constant, and then rapidly decreases when the back pressure exceeds the critical value at pb = 5.5 MPa. In terms of the noise characteristics, the sound pressure level and the intensity of the second shock wave have a positive correlation. When the primary or secondary pressure increases, the sound pressure level increases. Moreover, with the increasing back pressure, the sound pressure level firstly decreases, reaches the minimum of 98.2 dB at the critical back pressure, and then slowly increases.
1. Introduction
The ejector is a device that entrains the low-pressure fluid by the high-pressure fluid to produce a mixed medium-pressure fluid. The ejector can increase the pressure of low-pressure fluid without dynamic work, which has been widely used in the petrochemical industry [1], building refrigeration [2], seawater desalination [3], and so on. The steam ejector is a gas–gas ejecting device derived from the ejector. Its function is that the high-pressure steam entrains the low-pressure steam, and then the medium-pressure steam is produced. This property makes the steam ejector one of the potential solutions for the thermoelectric decoupling in the thermal power plants [4]. In this solution scheme, the superheat steam from the superheater of the boiler is used as the primary steam of the ejector, and the exhaust steam from the medium-pressure cylinder of the turbine is used as the secondary steam. The mixed steam from the outlet of the ejector enters the reheater of the boiler. Thus, by controlling the entrainment ability of the ejector, the quantity of steam into the high-pressure cylinder of turbine can be adjusted in order to realize the purpose of thermoelectric peak regulation. Furthermore, since the ejector contains a Laval nozzle structure, the supersonic steam in the ejector can generate a huge noise pollution, which is similar to the noise level produced by an aircraft engine [5]. To sum up, it is very important to master the flow and noise characteristics in the steam ejector aiming at the stable operation in the thermal power plant.
Sun et al. [6] studied the performance of an adjustable steam ejector in a 350 MW supercritical unit, which used the superheat steam of the boiler as the primary steam (11.7 MPa, 500 °C) and the reheat steam as the secondary steam (3.0 MPa, 318 °C), respectively. The study pointed out that the entrainment ratio and outlet flow rate can be stabilized in a high range by changing the throat-to-outlet area ratio of the nozzle. The current research on the steam ejector are relatively less about the application of the boiler’s main steam, which behaves as a parameter of high temperature and high pressure, but are mostly focusing on the refrigeration or evaporation systems, which have a low steam parameter [7,8]. Li et al. [9] simulated the steam ejector in refrigeration systems with the ideal gas model. According to the variations of the back pressure and the entrainment ratio, they obtained a critical back pressure value of 8 kPa, and divided the ejector performance into three modes: critical mode, subcritical mode, and reflux mode. Han et al. [10] numerically studied the flow characteristics in the steam ejector with four turbulence models. The results revealed that the SST k-ω turbulence model was in good agreement with the experiments. Meanwhile, it was found that there might be a phenomenon of flow separation in the suction chamber and diffuser chamber. This was attributed to vortexes caused by the reverse pressure and velocity gradient. Giorgio et al. [11] evaluated the performances of CFD models for the single-phase supersonic ejector. Compared with the k-ε RNG model, the k-ω SST model showed better agreement with the experimental results concerning the wall pressure and the position of the shock wave under the design conditions. The average error of entrainment ratio is 14% and the maximum error is 20%. Li et al. [12] studied the effects of steam pressures on shock waves of steam ejectors with the real gas properties. The results indicated that the first shock wave moved downstream with the increasing primary pressure or the decreasing secondary pressure. The intensity and number of the second shock wave increased as the primary pressure and the secondary pressure increased or the back pressure decreased. Li et al. [13] further revealed the relationship between the entrainment performance and shock waves. When the intensity and number of shock waves were both minimum and the secondary steam reached the supersonic state, the performance was optimal. Wen et al. [14] established a two-phase condensation flow model considering the non-equilibrium condensation phenomenon to evaluate the performance of the steam ejector, which is used in a multi-effect distillation and desalination system. The results revealed that the entrainment ratio increased significantly as the secondary steam pressure increased. Sun et al. [15] numerically studied a steam ejector applied in a distillation system, which prepared the distilled water for medical injections. It was found that compared with the original nozzle, the entrainment ratios of the streamlined nozzle were increased by 19.79% and 8.04%, respectively, at the primary pressures of 0.45 MPa and 0.55 MPa. Tang et al. [16] studied the relation between the entrainment performance of ejector and the area of two-phase chocking flow in a desalination system. As a result, with the primary steam pressure rising, the primary chocking area increased linearly and the secondary chocking area decreased slightly, and thence the entrainment ratio was reduced.
In terms of the noise characteristics, Gerard [17] made a theoretical and experimental study on the noise characteristics of an ejector-silencer combination and proposed the generation mechanisms of impingement noise and edge noise. It was proved experimentally that the low-frequency noise produced by the ejector was mainly caused by the natural mode excitation. Mohammed [18] divided the noise sources generated by the mixer-ejector nozzle into internal noise, external pre-merged noise, and merged noise. The internal noise had a significant high-frequency characteristic. As mentioned above, since the previous research on steam ejectors mainly focus on the field of low-parameter steam, there are relatively few research on its noise characteristics. Considering that the steam ejector noise with high parameters mainly comes from the supersonic flow generated by the Laval nozzle, the research on the noise characteristics of the nozzle are summarized as follows. Rafael et al. [19] considered two chevron nozzles with different penetration angles and made a numerical study of noise generated by jet flow operating at Mach number 0.9 and Reynolds number 1.38 × 10⁶. The results demonstrated that the Reynolds averaged Navier-Stokes (RANS)-based methods were reliable means to predict noise. Das et al. [20] presented a computational noise study of an axisymmetric contoured plug-nozzle. The design pressure ratio was 3.62 and the range of pressure ratios was from 2.00 to 5.00. The predicted noise errors were within 3.0 dB at the design pressure ratio and the errors were within 5.0 dB at the off-design pressure ratios. Suponitsky et al. [21] conducted a study on the sound source structure generated by subsonic jets in the aircraft nozzles. The conclusion was that the decrease in the Mach number led to a reduction in the amplitudes of the sources and sound radiation. Kapusta et al. [22] experimentally studied the flow field in a supersonic nozzle with fluidic inserts. The analysis demonstrated that the fluidic inserts reduced the broadband shock-associated noise as well as the peak noise because the inserts in the nozzle changed the effective area ratio of the primary steam to the inserted steam passage and generated a streamwise vorticity. Yang et al. [23] investigated the influences of temperature on the sound produced by vortex-pairing in subsonic jets. The results showed that as the temperature of the jet core increased, the vortex-pairing position moved upstream, and the noise intensity was enhanced. Wei et al. [24] conducted an experimental investigation on the jet noise of a nozzle with trailing-edge modifications. It was displayed that at a certain polar and azimuthal angle, there was a significant noise reduction generated by the stepped nozzles. This was attributed to the reduction of the jet whistler-type noise and broadband shock-associated noise. Tide et al. [25] studied the effect of the chevron taper angles on the jet noise. Compared with the baseline nozzle, the chevron nozzle with the 0° taper angle had a reduction in the sound pressure level, and the chevron nozzle with the 5° taper angle had a slight increase. Based on the acoustic analogy theory, Ffowcs Williams and Hawkings [26] proposed the FW–H equation, decomposing the sound source into monopole, dipole, and quadrupole. The model ignored the source terms that did not play a major role and simplified the calculation process, thus being widely used to predict far-field noise. Meanwhile, it was found that there was an approximate positive correlation between the intensity of unsteady turbulence disturbance and noise. Therefore, it is important to combine an applicable turbulence model and the FW–H equation. Xing et al. [27] simulated the jet noise of the single-nozzle launch vehicle using the FW–H equation and the scale-adaptive simulation (SAS) turbulence model. The relative error between the numerical and experimental results was less than 1.6%. Morfey et al. [28] used a modified Lilley equation to describe the jet noise, and the jet noise source was shown as the fluctuating body force field driving the disturbance on a parallel shear flow. The quadrupole sound source in the shear layer was related to the mean density and mean velocity of the jet.
In summary, the previous studies on the performance of steam ejectors mainly focus on the low-temperature and low-pressure steam parameters, and there are few studies on the ejector of high-temperature and high-pressure steam. Similarly, the studies on the noise characteristics of the steam ejector are also very lacking. In this paper, the performance of flow and noise of the steam ejector are studied based on the FW–H equation and Lilley sound source equation numerically. The influences of the primary pressure, the secondary pressure, and the outlet back pressure on the flow field, near-field sound source, and far-field noise are discussed.
2. Numerical Model
2.1. Description of the Physical Problem
Figure 1 shows the physical model of the steam ejector studied in this paper, which is composed of a Laval nozzle, suction chamber, mixing chamber, and diffuser chamber. A high-pressure steam is used as the primary fluid, which enters the Laval nozzle through the primary inlet of the ejector. Due to the pressure reduction of the Laval nozzle, a supersonic flow and a low-pressure region is formed at the nozzle outlet. Thus, under the action of pressure difference, a low-pressure steam is pressed into the suction chamber through the secondary inlet of the ejector. In the mixing chamber, the high-pressure steam and low-pressure steam mix into a uniform mixed steam, which is then compressed into the medium-pressure steam through the diffuser chamber and discharged from the outlet of the ejector.
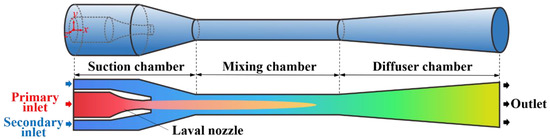
Figure 1.
Physical model of the steam ejector.
The current steam ejector is designed based on the steam parameters from a 350 MW thermal generator set of circulating fluidized bed. The parameters of high-pressure steam and low-pressure steam entering the ejector are pp = 17.0 MPa, Tp = 566 °C, qp = 250 t/h, and ps = 3.8 MPa, Ts = 340 °C, qs = 250 t/h, respectively. The shock circle model [29] is adopted to design the ejector, which takes into account the uneven distributions of radial velocities of the primary steam and secondary steam at the beginning of mixing. Therefore, the model improves the design accuracy and is suitable for the steam parameters of high temperature and high pressure. The equations used in the shock circle model are given as Equations (1)–(6). Equation (1) describes the flow of primary steam in the nozzle, Equations (2)–(4) describe the flow of primary steam in the suction chamber, and Equations (5) and (6) describe the flow of secondary steam in the suction chamber:
where is the isentropic coefficient for calculating the flow loss, n is the adiabatic exponent, namely, the ratio of specific heat capacity, is the flow loss coefficient, and nu is the exponent of the velocity function. A, D, and r are the area, diameter, and radius of the section, respectively. The subscripts of 0, 1, 2, and 3 represent the nozzle inlet, nozzle throat, nozzle outlet, and the mixing chamber inlet, respectively. The structural parameters of the steam ejector are listed in Table 1. The full length of the ejector is 3.548 m, and the center of the primary inlet is selected as the origin of three-dimensional spatial coordinates of xyz.

Table 1.
Structural parameters of steam ejector.
2.2. Mathematical Model
2.2.1. Governing Equations
The following assumptions are employed: (i) There is no phase change in the ejector, thus, the ideal gas equation is used for the density of steam. (ii) The ejector walls are adiabatic non-slip boundaries. (iii) Since the steam velocities at the inlets and outlet are much less than the velocity in the ejector, the steam dynamic pressures of the primary inlet, the secondary inlet, and the outlet are negligible.
The compressible flow and heat transfer process in the ejector are described by the governing equations as Equations (7)–(9):
Continuity equation:
Momentum equation:
Energy equation:
where are the total energy, pressure, velocity component, effective thermal conductivity, effective viscosity, and density, respectively. For the current compressible flow, the steam density follows the ideal gas law of , where M is the steam molecular weight of 18.015 g/mol and R is the universal gas constant of 8.314 J/(mol·K). In the current numerical simulation, a steady-state calculation is first conducted to obtain a stable initial flow field and near-field sound source, and then an unsteady-state calculation is proceeded to obtain the far-field noise characteristics.
2.2.2. Steady-State Process
During the steady-state calculation process, the SST k-ω model and the broadband noise sources model are used to solve the turbulent flow and the near-field sound source inside the ejector, respectively. By taking the transmission of turbulent shear stress into account in the definition of turbulent viscosity, the SST k-ω model well predicts the transonic shock waves and eddy current viscosity [30]. The model shows the good capacity to calculate free shear flow spreading rates and has a reasonable agreement with measurements for far wakes, mixing layers, and round-radial jets [31]. Therefore, the SST k-ω model can accurately predict the flow characteristics of shear layer between two steams in the ejector; the related equations are written in Equations (10) and (11):
where k, ω are the turbulent kinetic energy and turbulent dissipation rate, respectively. The parameter Γ is the effective diffusivity and Y is the turbulent dissipation. represent the k and ω generated by the mean velocity gradients, respectively. The related parameters and constants are shown in Equation (12):
The broadband noise source models can effectively extract which part of the flow is the main noise source. In these models, the RANS equations are utilized to obtain the statistical turbulent quantities, including the mean velocity field, turbulent kinetic energy, and dissipation rate. The required turbulent velocity components are calculated by the SNGR (stochastic noise generation and radiation) method [32]. Based on these steady solutions, the acoustic analogy theories and semi-empirical formulas are used to calculate the noise source. The Lilley equation (Equation (13)) is one of the broadband noise source models, which is applicable to the jet mixing noise [33,34]. The source terms in the equation are grouped according to whether they include the mean velocity gradients. Thereby, on the right of the equation, the second term is defined as the self-noise term, and the third and fourth terms are defined as the shear noise term:
where U represents the mean velocity component and represents the turbulent velocity component.
2.2.3. Unsteady-State Process
During the unsteady-state calculation process, the SAS model is used to obtain the unsteady flow, and then the FW–H equation is used to convert the obtained unsteady flow information into the sound field information. The SAS model introduces an exact transport equation on the basis of the SST k-ω model [35], as shown in Equations (14) and (15), where QSAS is the additional source item, which is obtained by Equation (16):
The detailed definitions of the parameters and the values of the constants in the above equations are displayed in Equation (17) [35]:
In the unsteady-state calculation, the FW–H equation is used to predict the propagation of noise into free space by calculating the integral solutions. Therefore, the FW–H equation is employed to obtain the sound signals generated by the flow field at the far-field, as shown in Equations (18)–(20) [26,36]:
where is the far-field sound speed. vi and vn represent the surface velocity component in the xi direction and normal direction, respectively. f = 0 is the integration surface of sound source data, and mean the Dirac delta function and Heaviside function, and are the stress tensor and Lighthill tensor, respectively.
In order for readers to better understand, Figure 2 shows the calculation process of the above-mentioned mathematical models.
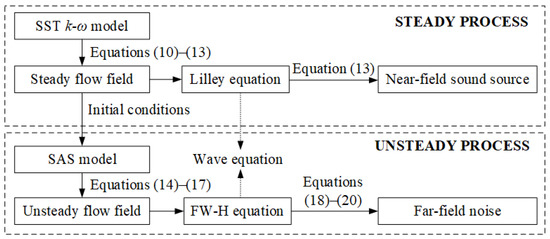
Figure 2.
Calculation process of mathematical models.
Furthermore, the primary inlet and the secondary inlet of the ejector (Figure 1) employ the pressure inlet as boundary conditions, and the ejector outlet applies the pressure outlet of boundary conditions. The adiabatic wall boundary conditions are used on all the walls in the ejector.
2.3. Computational Grid and Solution Procedure
The software of ICEM 18.0 (ANSYS Inc USA) is used as a mesh-generating tool. Due to the ejector being completely symmetrical about the x-axis, one-tenth of the physical model is used as the computational domain to reduce the calculation effort. The structured grid processing is carried out on all the domains, and the local meshes near the nozzle as well as the wall boundary layer are refined, as shown in Figure 3.
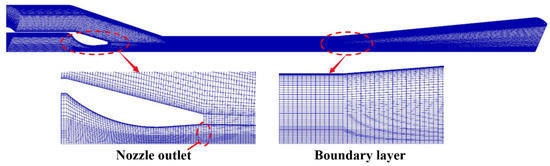
Figure 3.
Computational grid system.
In the steady-state calculation process, the pressure–velocity coupling is used for the coupled algorithm. The least squares cell-based method is applied to the gradient scheme. The energy and turbulence dissipation equations are discretized with the second-order upwind scheme. The momentum equation is treated with the bounded central differencing scheme. In the unsteady-state calculation process, the second-order implicit scheme is applied to transient formulation, and the discretization schemes of other terms are consistent with those in the steady-state calculation. The residuals of mass flow rates are less than 10−4, the net mass flow rate is less than 10−3, and the residuals of continuity, velocity components, energy, k, and ω are less than 10−6. The algebraic equations of the field are calculated uniformly using the software FLUENT 18.0 (ANSYS Inc USA).
2.4. Independence Checks and Model Verification
The entrainment performance and noise level of steam ejectors are evaluated by using the entrainment ratio of φ and sound pressure level of Ω, respectively. The flow characteristics in the ejector are analyzed by the dimensionless pressure of P, Mach number of Ma, and dimensionless temperature of θ. The sound field characteristics in the ejector are described by the vorticity of ξ, Lilley sound source intensity of S, and vortex criterion of Q:
where is the reference sound pressure of 2 × 10⁻⁵ Pa, uc is the local velocity of sound, A and B are the symmetric tensor and antisymmetric tensor [37], respectively.
The parameters of design condition with pp = 17.0 MPa, Tp = 566 °C, qp = 250 t/h, ps = 3.8 MPa, Ts = 340 °C, qs = 250 t/h, pb = 4.7 MPa, and Tb = 427 °C are considered as the default parameters for the current simulation. Before performing the numerical calculation, the independence checks on the grid number and time step are carried out. The entrainment ratio of ejector and the sound pressure level at the location of x = 5.548 m are chosen as the checking parameters. The checking results are displayed in Table 2. The cases of the grid numbers 821, 015, and the time step 2.5 × 10⁻⁵ s can satisfy the current calculation.
Table 2.
Independence checks for grid number and time step.
The current numerical model is verified by employing the numerical results of Wu (2017) [38] and experimental results of Wu et al. (2010) [39]. Figure 4a shows the comparison of the entrainment ratio between the current model and the reference’s model. The wet steam model in Wu (2017) [38] is aimed at the low-parameter ejectors in the refrigeration systems, in which condensation and droplet vaporization exist. Nonetheless, the current model uses the ideal gas model, aiming at the high-superheat steam studied in this paper. Hence, the difference in the models causes the high error. It can be seen that the maximum error is 17% at the primary pressure of 46.3 kPa. However, the variation trends of entrainment ratios calculated by the present model are consistent with those in the Wu (2017) [38], and the obtained values of the critical back pressure are the same as 45.0 kPa. This indicates that the current model can accurately predict the variation of entrainment ratio with the working parameters, and does not affect the following results and discussion. Figure 4b displays the contrast of sound pressure levels between the current model and experimental results [39]. With the variations of the primary pressure, their sound pressure levels follow the same trends, and the deviations of the current model from experimental results are less than 4%. The current model is about 2.0 dB larger than the experimental results except the case of pp = 261.3 kPa. As the primary steam rises from 181.3 kPa to 341.3 kPa, the current model and the experimental results have the same trends and approximate amplitudes. The sound pressure levels of the former increase by 23%, while that of the latter increase by 26%. With the primary pressure of 301.3 kPa in Figure 4b as an example, Figure 4c shows that sound pressure level distribution with the frequency for the current model agrees well with experimental results [39]. It can be seen that the middle frequency band (1 k Hz~2 k Hz) is the main noise contribution area, and its error is also less than 4%. The above comparisons verify the correctness of the current model.
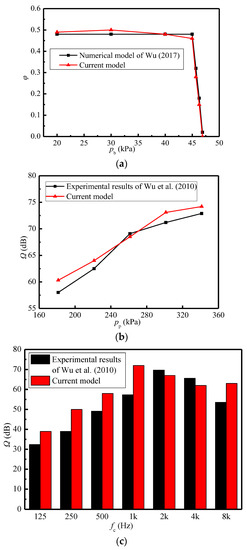
Figure 4.
Comparisons between the current model and published references [38,39]. (a) Entrainment ratio (pp = 600.0 kPa, Tp = 159 °C, ps = 15.0 kPa, Ts = 54 °C, Tb = 73 °C); (b) Sound pressure level (Tp = 140 °C, ps = 101.3 kPa, Ts = 110 °C, pb =95.3 kPa, Tb = 98 °C); (c) Sound pressure level distribution with the frequency (pp = 301.3 kPa, Tp = 140 °C, ps = 101.3 kPa, Ts = 110 °C, pb = 95.3 kPa, Tb = 98 °C).
3. Results and Discussion
3.1. Flow and Noise Characteristics
3.1.1. Flow Characteristics
The design parameters of the current steam ejector are used to analyze the flow and noise characteristics of the ejector. Figure 5a–c display the distributions of pressure, Mach number, and temperature of the steam ejector, respectively. By combining these three figures, it can be found that the primary steam forms a region of low-pressure, high-velocity, and low-temperature at the nozzle outlet after passing through the Laval nozzle. This is because the contraction–expansion structure of the Laval nozzle makes the primary steam undergo an adiabatic expansion process in the nozzle, which converts the potential energy into kinetic energy of the fluid. Under the pressure difference between the low-pressure region and the secondary inlet, the secondary steam is entrained into the suction chamber of the ejector and is mixed with the primary steam. Since the primary steam leaving the nozzle has been accelerated to the supersonic, a train of shock waves is formed in the suction chamber under the intense compression of the secondary steam, and it is labeled as the first shock wave. Further, the pressure of mixed steam is reduced after entering the mixing chamber (Figure 5a), which is caused by the fact that the cross-sectional area of the mixing chamber is smaller than that of the suction chamber. Correspondingly, the steam in the mixing chamber is further accelerated to form a core of potential flow (Figure 5b), and the temperature of the potential flow is also the lowest in the ejector (Figure 5c). After entering the diffuser chamber, the steam undergoes a process of pressure increasing, Mach number decreasing, and temperature increasing, due to the enlargement of the cross-sectional area of the flow passage. Furthermore, because of the compression action of the back pressure, a second shock wave is formed at the entrance of the diffuser chamber, as marked in the figures.
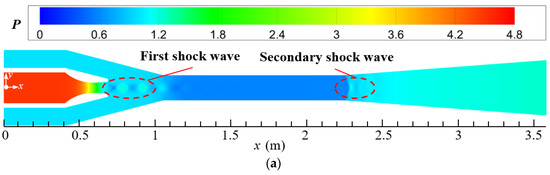
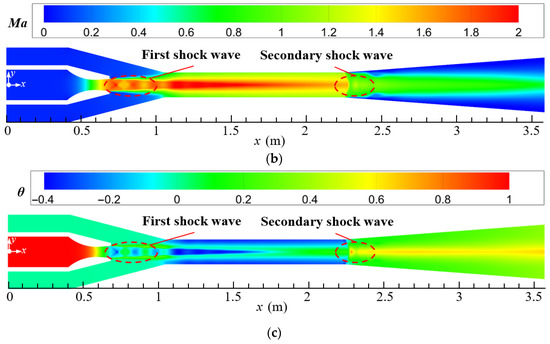
Figure 5.
Distributions of pressure, Mach number, and temperature on the symmetrical section of steam ejector (pp = 17.0 MPa, Tp = 566 °C, ps = 3.8 MPa, Ts = 340 °C, pb = 4.7 MPa, Tb = 427 °C). (a) Pressure distribution; (b) Mach number distribution; (c) Temperature distribution.
Figure 6 shows the variations of pressure, Mach number, and temperature of the steam ejector along the x-axis under the design conditions. It can be seen that the variations of pressure and temperature along the x-axis are consistent, which are opposite to that of Mach number. This indicates that the flow in the ejector is accompanied by the mutual conversion of kinetic energy, potential energy, and internal energy. With the curve of Mach number as an example, the length of first shock wave is about 0.75 m (0.75 m < x < 1.50 m), and that of second shock wave is shorter at 0.20 m (2.25 m < x < 2.45 m). However, the maximum intensity of the latter is larger than that of the former. This is because the pressure of the mixed steam increases drastically after entering the diffuser chamber, thence the shock wave intensity is more obvious. However, as the velocity of the steam drops rapidly to a subsonic state, the length of shock wave is relatively shorter. After the steam enters the mixing chamber, obviously, the Mach number increases and the intensity of the first shock decreases. This is due to the reduction of the cross-sectional area, which restricts the wave reflection. Moreover, the pressure drops to P = 0.6 and maintains a stable low-pressure state, and the pressure potential energy is correspondingly transformed into the kinetic energy.
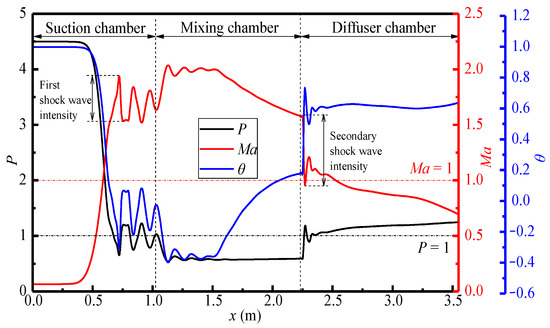
Figure 6.
Variations of pressure, Mach number, and temperature along the x-axis (pp = 17.0 MPa, Tp = 566 °C, ps = 3.8 MPa, Ts = 340 °C, pb = 4.7 MPa, Tb = 427 °C).
3.1.2. Near-Field Sound Source Characteristics
Figure 7a–c show the distributions of Lilley sound source intensity, vorticity, and vortex criterion on the symmetrical section (z = 0) of the steam ejector, respectively. As shown in Figure 7a, there are three high sound source regions in the ejector, which are marked with the Sound sources-I, II, and III. The Sound source-I is located at the boundary of the first shock wave in the suction chamber (Figure 5), the Sound source-II is concentrated on the near-wall region in the mixing chamber, and the Sound source-III appears downstream in the diffuser chamber. The generations of sound source regions can be explained in combination with the vorticity distribution in the ejector. As seen in Figure 7b, the primary and secondary steam meet at the boundary of the first shock wave, where the two steams occur to mix violently to form a shear layer. This leads to a very large vorticity at this location and thence causes the Sound source-I to appear. Further, in the mixing chamber, because the mixed steam has been accelerated to supersonic, it causes the steam to occur intense friction with the wall of the ejector, so a thin layer of high vorticity appears near the wall. This explains the Sound source-II occurring at the near-wall region of the mixing chamber. Moreover, a third region of high vorticity appears at the junction of the mixing chamber and diffuser chamber. This can be attributed to the second shock wave here, which leads to a strong disturbance in the flow and the occurrence of flow separation. However, it is noted that the location of the Sound source-III lags behind the location of the second shock wave. This can be explained by the vortex criterion distribution as displayed in Figure 7c. The second shock wave produces some small-scale vortices at the junction of the mixing and diffuser chamber. Along the flow direction, these small-scale vortices collide with each other and fuse into the large-scale vortices in the diffuser chamber. This causes the Sound source-III to be located downstream of the second shock wave.
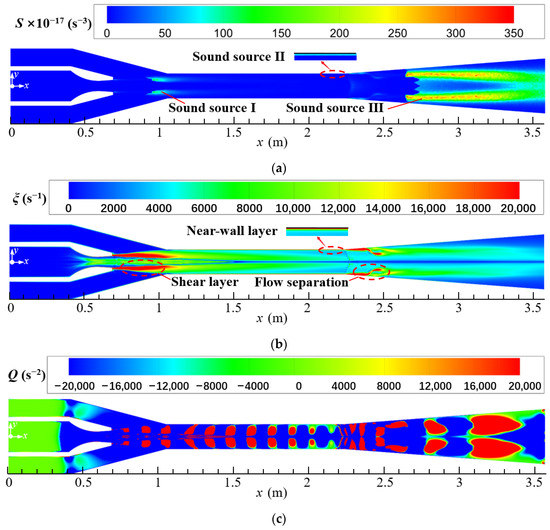
Figure 7.
Distributions of Lilley sound source intensity, vorticity, and vortex criterion on the symmetrical section of steam ejector (pp = 17.0 MPa, Tp = 566 °C, ps = 3.8 MPa, Ts = 340 °C, pb = 4.7 MPa, Tb = 427 °C). (a) Lilley sound source intensity distribution; (b) Vorticity distribution; (c) Vortex criterion distribution.
3.1.3. Far-Field Noise Characteristics
In order to analyze the far-field noise characteristics around the ejector, eight monitoring lines around the ejector are defined in Figure 8. The eight monitoring lines are set up to analyze the far-field noise characteristics of the three internal sound source regions and the ejector as an assembled sound source in axial and radial directions. As seen in Section-xoy of Figure 8a, Lines-#1–#4 are applied to record the sound pressure levels along the axial directions of the ejector. Line-#1 reflects the noise variation outside the ejector as the flow direction, which is parallel to the x-axis of the ejector, and the distance from the x-axis is 2 m. Line-#2 and Line-#3 reflect the sound source directivities upstream and downstream, respectively. They are two quarter arcs with the inlet center and outlet center of the ejector as the corresponding centers of circles. The radiuses of arcs are also 2 m and α signifies the angle with respect to the x-axis. Line-#4 is the monitoring line extending outward from the outlet of the ejector, which can show the noise characteristics along the axial direction. In Section-yoz of Figure 8b, Lines-#5, #6, #7, and #8 are employed to record the sound pressure levels along the radial directions of the ejector. They reflect the source directivity of the ejector circumferentially, where Lines-#5, #6, #7 are three half arcs at x = 0.861 m, 1.633 m, 2.886 m, which correspond to the locations of the Sound sources-I, II, and III (Figure 7a). Line-#8 is a half arc at x = 5.548 m, which is 2 m away from the outlet of the ejector. For the above four arcs, the centers are located on the x-axis, the radiuses are 2 m, and β means the angle with respect to the z-axis.
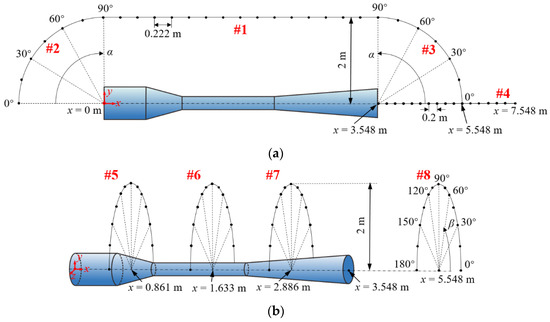
Figure 8.
Monitoring lines for the far-field noise of the ejector. (a) Axial distributions at Section-xoy; (b) Radial distributions at Section-yoz.
Figure 9a,b show the variations of sound pressure levels along the above-defined monitoring lines in Section-xoy. It can be known from Figure 9a that the sound pressure level along Line-#1 stays at the high values of 140.0 dB–150.0 dB, and those along Line-#2 and Line-#3 both decrease gradually with the α angle varying from 90° to 15° but increase abruptly from 15° to 0°. This phenomenon can be explained by the features of the near-field sound sources inside the ejector as follows. The Sound sources-I and III are generated by turbulence disturbance and act on the fluid, so the noise propagation from them depends on the flow of fluid and has the directivity characteristics. Comparatively, the Sound source-II is caused by the fluid–solid friction and acts on the solid wall of the mixing chamber, thence the noise from it uniformly propagates outward from the wall and has the radiation characteristic. Therefore, the noise from the Sound source-II is dominant in the far-field noise around the ejector. Based on this mechanism, the sound pressure levels of Line-#1 are high and relatively uniform because it is parallel to the mixing chamber, namely, the location of the Sound source-II. The sound pressure levels along Lines-#2 and #3 decrease with the α angle decreasing due to the distance from the Sound source-II becoming larger. However, from α = 15° to α = 0°, the sound pressure levels are clearly improved because they are located at the flow direction and easily affected by the Sound sources-I and III. Furthermore, as displayed in Figure 9b, the sound pressure levels along Line-#4 decrease with the distance from the ejector outlet becoming greater. This is due to the gradual attenuation of noise as it moves away from the ejector, and the attenuation amplitude diminishes gradually.
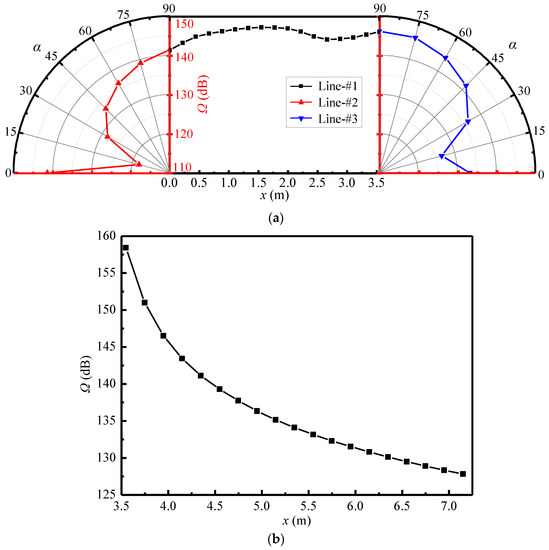
Figure 9.
Sound pressure level of far-field monitoring lines on the Section-xoy (pp = 17.0 MPa, Tp = 566 °C, ps = 3.8 MPa, Ts = 340 °C, pb = 4.7 MPa, Tb = 427 °C). (a) Variations of sound pressure level with x and α at Lines-#1, #2, and #3; (b) Variations of sound pressure level with x at Line-#4.
Figure 10 shows the variations of sound pressure levels along the monitoring lines in Section-yoz. It can be found that with the β angle, the sound pressure levels change little for the fixed monitoring lines. This indicates that the far-field noise has a uniform distribution along the radial directions of the ejector. Furthermore, at the fixed β angle, the sound pressure level successively decreases in the order of Lines-#6, #5, #7, and #8. This is because the far-field noise around the ejector is dominated by the Sound source-II, and the distances from the Sound source-II become farther in the order of Lines-#6, #5, #7, and #8, as displayed in Figure 8b.
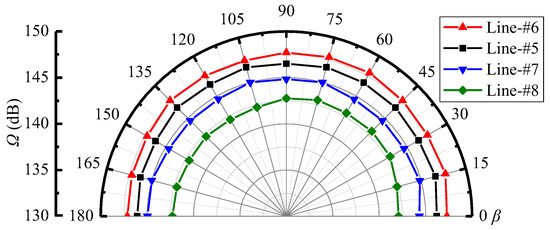
Figure 10.
Variations of sound pressure level with β at Lines-#5, #6, #7, and #8 on the Section-yoz (pp = 17.0 MPa, Tp = 566 °C, ps = 3.8 MPa, Ts = 340 °C, pb = 4.7 MPa, Tb = 427 °C).
3.2. Effect of Working Parameters
3.2.1. Primary Steam Pressure
In order to evaluate the sound pressure level of far-field noise from the ejector, the monitoring point at x = 5.548 m on the x-axis (Figure 8a) is selected as the characteristic point because it may reflect both the noise propagation from the Sound sources-II and III. Figure 11 displays the variations of sound pressure level and entrainment ratio of the ejector with the primary pressure. It is obvious that with the increasing primary steam pressure, the entrainment ratio decreases and the sound pressure level increases gradually. When the primary pressure increases from 14.0 MPa to 19.0 MPa, the entrainment ratio is reduced by 30%, and the sound pressure level is increased by 11%. The phenomena can be explained by combing the field distributions of Mach number, vorticity, and Lilley sound source intensity as revealed in Figure 12a, Figure 12b, Figure 12c, respectively, where the cases of pp = 14.0, 17.0, and 19.0 MPa are used as examples. As shown in Figure 12a, as the primary pressure increases, the intensity of the first shock wave decreases. The reason is related to the steam state at the nozzle outlet. As can be seen from Figure 6, the pressure at the nozzle outlet (x = 0.67 m) is less than the secondary pressure under the design condition, and the pressure difference between the two is the driving force for the secondary steam to enter the ejector. The increase of the primary pressure enhances the nozzle outlet pressure, which leads to the decrease of the pressure difference. Namely, the secondary steam driving force decreases, which leads to a smaller entrainment ratio. Further, the compression applied to the supersonic primary steam at the nozzle outlet is weakened, which reduces the intensity of the first shock wave.
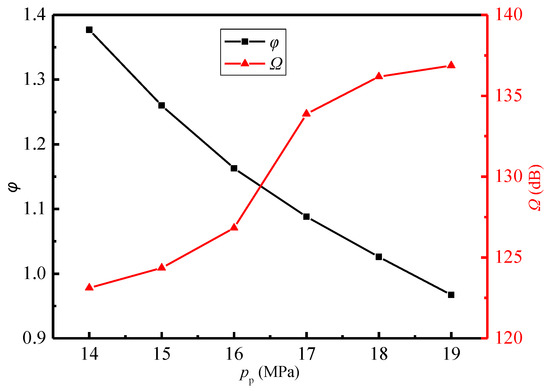
Figure 11.
Variations of the sound pressure level and entrainment ratio with the primary pressure (Tp = 566 °C, ps = 3.8 MPa, Ts = 340 °C, pb = 4.7 MPa, Tb = 427 °C).
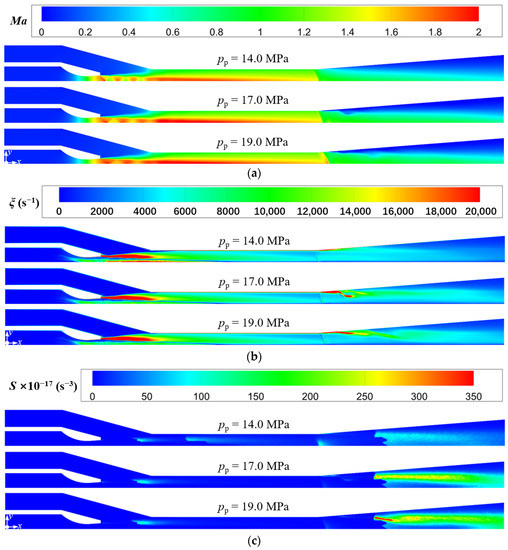
Figure 12.
Variations of Mach number, vorticity, and Lilley sound source intensity at different primary pressure (Tp = 566 °C, ps = 3.8 MPa, Ts = 340 °C, pb = 4.7 MPa, Tb = 427 °C). (a) Mach number distributions; (b) Vorticity distributions; (c) Lilley sound source intensity distributions.
Furthermore, it can also be found in Figure 12a that the increasing primary pressure makes the second shock wave move downstream and its intensity increase. This can be explained by the increase of primary steam pressure which brings about the increasing pressure at the mixing chamber outlet. This reduces the pressure difference between the diffuser chamber outlet and the mixing chamber outlet. Namely, the compression effect of the back pressure at the ejector outlet on the mixed steam at the mixing chamber outlet is weakened. Therefore, when entering the diffuser chamber, the mixed steam for the case with higher primary steam pressure can maintain a supersonic state for a distance before the second shock wave (Figure 12a), and the enlargement of the cross-sectional area further improves the Mach number of the mixed steam. Hence, the Mach number difference between before and after the second shock wave is enlarged, that is, the intensity of the second shock wave increases. This also leads to the more obvious flow separation in the diffuser chamber for the higher primary steam pressure (Figure 12b), and thus makes the intensity of the Sound source-III increase (Figure 12c), which explains why the sound pressure level increases as the primary steam pressure increases (Figure 11).
3.2.2. Secondary Steam Pressure
Figure 13 shows the variations of the sound pressure level and entrainment ratio with the secondary pressure. It displays that the sound pressure level and entrainment ratio gradually rise with the increasing secondary pressure. When the secondary pressure increases from 3.2 MPa to 4.2 MPa, the entrainment ratio is increased by 37%, and the sound pressure level is enhanced by 7%. The reason about the variations in the entrainment ratio can be found in the Mach number distributions (Figure 14a). It is obvious that the intensity of the first shock wave increases as the secondary pressure increases. When the primary pressure is fixed, the increasing secondary pressure enlarges the pressure difference between the secondary inlet and the nozzle outlet. This leads to the compression effect of the secondary steam on the primary steam being enhanced, and thence the first shock wave intensity being increased. Meanwhile, a larger pressure difference can drive more secondary steam into the suction chamber and leads to a higher entrainment ratio.
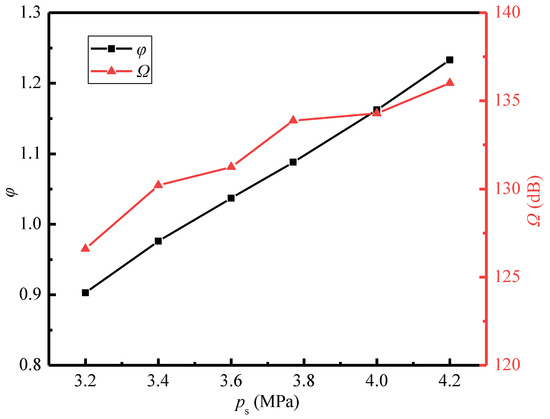
Figure 13.
Variations of the sound pressure level and entrainment ratio with the secondary pressure (pp = 17.0 MPa, Tp = 566 °C, Ts = 340 °C, pb = 4.7 MPa, Tb = 427 °C).
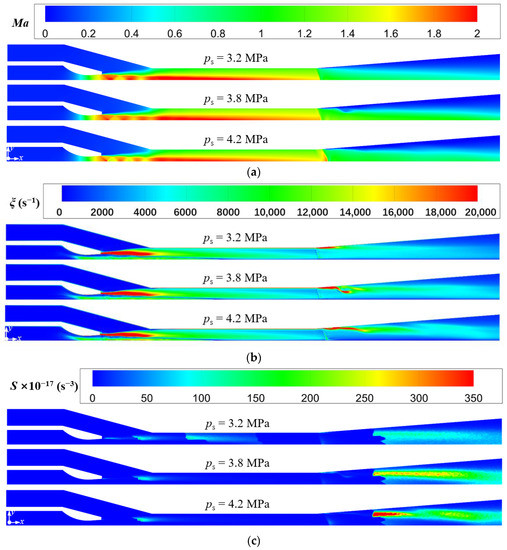
Figure 14.
Variations of Mach number, vorticity, and Lilley sound source intensity at different secondary pressure (pp = 17.0 MPa, Tp = 566 °C, Ts = 340 °C, pb = 4.7 MPa, Tb = 427 °C). (a) Mach number distributions; (b) Vorticity distributions; (c) Lilley sound source intensity distributions.
Furthermore, it is observed that the intensity of the second shock wave also increases as the secondary pressure increases, and its position moves downstream. This is because the increasing secondary pressure enhances the mixed steam pressure at the mixing chamber outlet. This results in the supersonic state of the mixed steam are longer and the Mach number is larger. Therefore, it can be seen from Figure 14a that in the case of ps = 4.2 MPa, the intensity of the second shock wave is the largest. Further, it is shown that the increase of secondary steam pressure enlarges the high vorticity region at the diffuser chamber (Figure 14b), which increases the intensity of the Sound source-III (Figure 14c). It explains why the sound pressure level increases as the secondary steam pressure increases (Figure 13). In summary, as concluded from Figure 11, Figure 12, Figure 13 and Figure 14, the entrainment ratio of the ejector is positively correlated with the intensity of the first shock wave, and the sound pressure level at the monitoring point in the far-field is positively correlated with the intensity of the second shock wave.
3.2.3. Back Pressure
Figure 15 shows the variations of the entrainment ratio and sound pressure level with the back pressure. It is known that with the increase of back pressure, the entrainment ratio keeps constant at 1.088 when the back pressure is less than 5.5 MPa. However, when the back pressure exceeds 5.5 MPa, the entrainment ratio decreases rapidly. Therefore, pb = 5.5 MPa can be defined as the critical back pressure for the current ejector, which divides the working condition of the ejector into critical mode and subcritical mode. In the critical mode, the sound pressure level decreases with the increase of the back pressure. The closer to the critical value the back pressure is, the more quickly the sound pressure level declines, reaching the minimum value of 98.2 dB at 5.5 MPa. Subsequently, the sound pressure level rises slowly as the back pressure increases. The Mach number, vorticity, and Lilley sound source intensity distributions in Figure 16a–c can be used to explain the above phenomenon.
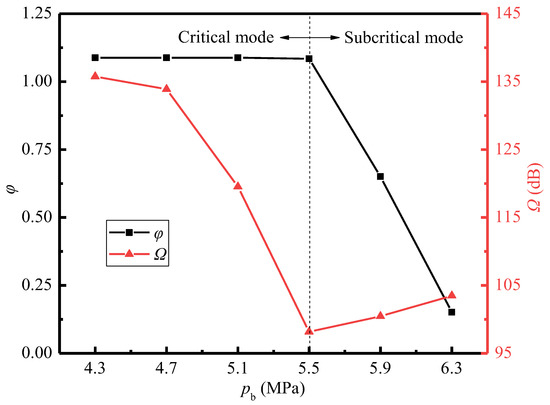
Figure 15.
Variations of the sound pressure level and entrainment ratio with the back pressure (pp = 17.0 MPa, Tp = 566 °C, ps = 3.8 MPa, Ts = 340 °C, Tb = 427 °C).
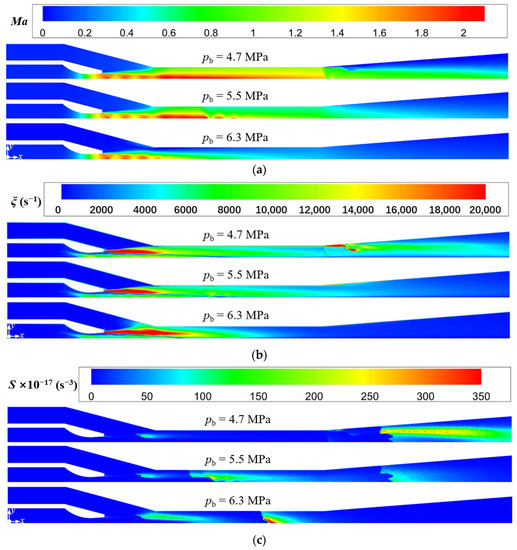
Figure 16.
Variations of Mach number, vorticity, and Lilley sound source intensity at different back pressure (pp = 17.0 MPa, Tp = 566 °C, ps = 3.8 MPa, Ts = 340 °C, Tb = 427 °C). (a) Mach number distributions; (b) Vorticity distributions; (c) Lilley sound source intensity distributions.
For the critical mode, by comparing the cases of pb = 4.7 MPa and pb = 5.5 MPa in Figure 16a, it indicates that the first shock wave keeps almost constant for different back pressures. This is because the variation of back pressure has little action on the flow process in the suction chamber, and thence the driving pressure difference of the secondary steam changes little, so the entrainment ratio almost remains constant. However, compared to the case of pb = 4.7 MPa, the position of the second shock wave for that of pb = 5.5 MPa moves upstream from the mixing chamber outlet to the middle part of that. This can be explained by when the pressures of primary steam and secondary steam are fixed, the pressure of the mixed steam changes little. Thus, with the increasing back pressure at the ejector outlet, the pressure difference between the outlet steam and the mixed steam will be enhanced. This results into the ability of the mixed steam to overcome the back pressure, however, maintaining the supersonic state is weakened, so that in the mixing chamber, the second shock wave occurs earlier. Therefore, as revealed in Figure 16b, the flow separation at the inlet of the diffuser chamber for the case of pb = 4.7 MPa disappears when the back pressure increases to pb = 5.5 MPa. Further, the intensity of the Sound source-III is also significantly weakened for the case of pb = 5.5 MPa compared to pb = 4.7 MPa (Figure 16c). As a result, the increasing back pressure reduces the sound pressure level, which reaches the minimum value of 98.2 dB at the critical back pressure (Figure 15).
When the ejector is in the subcritical mode, the cases of pb = 5.5 MPa and pb = 6.3 MPa in Figure 16a are compared. With the increasing back pressure, the second shock wave continues to move upstream into the suction chamber and merges with the first shock wave. Moreover, it is shown that the steam near the wall of the mixing chamber is subsonic at pb = 6.3 MPa, which means the secondary steam is not being accelerated to supersonic. In this situation, the entrainment ratio is not only affected by the intensity of the first shock wave, but also related to the flow resistance of the secondary steam. When the back pressure exceeds the critical value, the flow resistance is greater than the driving force caused by the pressure difference between the pressures at the secondary inlet and the nozzle outlet. Thus, as the flow rate of the secondary steam is reduced, so is the entrainment ratio. Furthermore, as displayed in Figure 16b, the shear layer at the nozzle outlet is extended for the case of pb = 6.3 MPa because of the merging shock waves, and then the high vorticity region also extends into the mixing chamber. This also explains an increase in the intensity of the Sound source-I, as shown in Figure 16c. However, the Sound source-III in the diffuser chamber completely disappears and is replaced by a small range of a new sound source region located in the mixing chamber for the case of pb = 6.3 MPa. This region reflects the turbulent disturbance from both the shock wave and the high back pressure, so the intensity of the new sound source is strong. Therefore, the sound pressure level increases accordingly when the back pressure exceeds the critical value of pb = 5.5 MPa (Figure 15).
4. Conclusions
The flow characteristics and noise characteristics of supersonic steam ejectors are studied numerically. The effects of pressures at the primary inlet, secondary inlet, and mixed outlet on ejector performance, near-field sound source, and far-field noise are discussed. The steam ejector has two shock waves and three sound source regions under the design conditions. The first shock wave and the second shock wave are located at the nozzle outlet and the mixing chamber outlet, respectively. A shear layer with high vorticity is located at the first shock boundary and the generated turbulence forms the Sound source-I. The flow separation occurs at the boundary of the second shock wave and the turbulent disturbance produced by it forms the Sound source-III. The Sound source-II is located near the mixing chamber wall and the sound pressure levels of the monitoring points around the ejector depending on the distance away from the Sound source-II. In terms of the entrainment performance, the entrainment ratio is positively correlated to the intensity of the first shock wave, both of which are affected by the driving pressure difference of the secondary steam. The entrainment ratio reduces with the increasing primary steam pressure, but increases with the increasing secondary steam pressure. In addition, when the back pressure increases, the entrainment ratio first remains constant and then decreases rapidly, in which the boundary is the critical back pressure of pb = 5.5 MPa. In terms of the noise characteristics, the sound pressure level at x = 5.548 m reflects the intensity of the Sound source-III, which is positively related to the intensity of the second shock wave. When the primary pressure or secondary pressure increases, the sound pressure level increases. Moreover, the sound pressure level first decreases with the increasing back pressure, reaches the minimum value at the critical back pressure of 98.2 dB, and then slowly increases.
Author Contributions
Conceptualization, S.M. and J.Z. (Jiajie Zhang); methodology, Y.L., Y.G. and J.Z. (Jingxian Zhang); software, Y.L.; validation, Y.L., Y.G. and J.Z. (Jingxian Zhang); formal analysis, J.Z. (Jiajie Zhang) and Y.L.; investigation, Y.L., Y.G. and J.Z. (Jingxian Zhang); resources, J.Z. (Jiajie Zhang); data curation, Y.L.; writing—original draft preparation, Y.L.; writing—review and editing, J.Z. (Jiajie Zhang); visualization, Y.L.; supervision, J.Z. (Jiajie Zhang) and S.M.; project administration, J.Z. (Jiajie Zhang) and S.M.; funding acquisition, S.M. All authors have read and agreed to the published version of the manuscript.
Funding
This research was funded by the National Key R&D Program of China (2020YFB0606302).
Data Availability Statement
Data available on request due to restrictions e.g., privacy or ethical. The data presented in this study are available on request from the corresponding author.
Conflicts of Interest
The authors declare no conflict of interest.
Nomenclature
| c | Specific heat capacity (J/(kg·K)) |
| E | Total energy (J/kg) |
| k | Turbulence kinetic energy (m2/s2) |
| Ma | Mach number |
| P | Dimensionless pressure, |
| Pij | Stress tensor |
| p | Pressure (MPa) |
| Q | Vortex criterion (1/s2) |
| q | Flow rate (t/h) |
| S | Lilley sound source intensity (1/s3) |
| T | Temperature (°C) |
| Tij | Lighthill tensor |
| u | Velocity (m/s) |
| v | Surface velocity (m/s) |
| x, y, z | Spatial coordinates (m) |
| Greek symbols | |
| α | Angle in Section-xoy |
| β | Angle in Section-yoz |
| θ | Dimensionless temperature, |
| μt | Turbulent viscosity (mPa·s) |
| ξ | Vorticity (1/s) |
| ρ | Density (kg/m3) |
| φ | Entrainment ratio, |
| Ω | Sound pressure level (dB) |
| ω | Specific dissipation (1/s) |
| Subscripts | |
| b | Back pressure |
| p | Primary steam |
| s | Secondary steam |
| i, j, k | Spatial vector |
References
- Bilal, E.Z.; Nikolay, B.; Hassan, H.A.; Kamel, A.M.; Anas, S.; Mouhammad, E.H. Investigation of the Effects of the Het Nozzle Geometry and Location on the Performance of Supersonic Fluid Ejectors. Energy Rep. 2022, 8, 228–233. [Google Scholar] [CrossRef]
- Tashtoush, B.M.; Al-Nimr, M.A.; Khasawneh, M.A. A Comprehensive Review of Ejector Design, Performance, and Applications. Appl. Energy 2019, 240, 138–172. [Google Scholar] [CrossRef]
- Kong, F.S.; Kim, H.D.; Jin, Y.Z.; Setoguchi, T. Application of Chevron Nozzle to a Supersonic Ejector-Diffuser System. Procedia Eng. 2013, 56, 193–200. [Google Scholar] [CrossRef]
- Ma, S.X.; Zhao, G.J. A Thermoelectric Peak Regulating Method for a Coal-Fired Unit. CHINA Patent 112,050,190, 8 December 2020. (In Chinese). [Google Scholar]
- Dirk, S.; Markus, M.; Cara, K.; Christin, P.; Thomas, E. Aircraft Noise and Quality of Life around Frankfurt Airport. Int. J. Environ. Res. Public Health 2010, 7, 3382–3405. [Google Scholar] [CrossRef]
- Sun, B.Z.; Yue, S.; Wang, C.B.; Xu, Z.Y.; Guo, J.L.; Mi, C.L. Numerical Simulation and Test Verification on Industrial Heating Performance of Adjustable Steam Ejector in 350MW Supercritical Unit. J. North China Electr. Power Univ. 2021, 48, 98–107. (In Chinese) [Google Scholar] [CrossRef]
- Zhang, G.J.; Zhang, X.Z.; Wang, D.B.; Jin, Z.L. Performance Evaluation and Operation Optimization of the Steam Ejector Based on Modified Model. Appl. Therm. Eng. 2019, 163, 114388. [Google Scholar] [CrossRef]
- Giuseppe, G.; Adriano, M.; Samuele, P. Prediction of Condensation in Steam Ejector for a Refrigeration System. Int. J. Refrig. 2011, 34, 1641–1648. [Google Scholar] [CrossRef]
- Li, H.; Wang, X.D.; Ning, J.X.; Zhang, P.F.; Huang, H.L.; Tu, J.Y. Numerical Investigation of the Nozzle Expansion State and its Effect on the Performance of the Steam Ejector Based on Ideal Gas Model. Appl. Therm. Eng. 2021, 199, 117509. [Google Scholar] [CrossRef]
- Han, Y.; Wang, X.D.; Sun, H.; Zhang, G.L.; Guo, L.X.; Tu, J.Y. CFD Simulation on the Boundary Layer Separation in the Steam Ejector and its Influence on the Pumping Performance. Energy 2019, 167, 469–483. [Google Scholar] [CrossRef]
- Giorgio, B.; Nicolò, C.; Lorenzo, C.; Gaël, R.G.; Fabio, I. Computational Fluid-dynamics Modelling of Supersonic Ejectors: Screening of Modelling Approaches, Comprehensive Validation and Assessment of Ejector Component Efficiencies. Appl. Therm. Eng. 2021, 186, 116431. [Google Scholar] [CrossRef]
- Li, Y.Q.; Shen, S.Q.; Niu, C.; Guo, Y.L.; Zhang, L.Y. The Effect of Different Pressure Conditions on Shock Waves in a Supersonic Steam Ejector. Energies 2022, 15, 2093. [Google Scholar] [CrossRef]
- Li, Y.Q.; Shen, S.Q.; Niu, C.; Mu, X.S.; Zhang, L.Y. The Effect of Variable Motive Pressures on the Performance and Shock Waves in a Supersonic Steam Ejector with Non-Equilibrium Condensing. Int. J. Therm. Sci. 2023, 185, 108034. [Google Scholar] [CrossRef]
- Wen, C.; Gong, L.; Ding, H.B.; Yang, Y. Steam Ejector Performance Considering Phase Transition for Multi-Effect Distillation with Thermal Vapour Compression (MED-TVC) Desalination System. Appl. Energy 2020, 279, 115831. [Google Scholar] [CrossRef]
- Sun, W.X.; Ma, X.J.; Zhang, Y.M.; Jia, L.; Xue, H.Y. Performance Analysis and Optimization of a Steam Ejector Through Streamlining of the Primary Nozzle. Case Stud. Therm. Eng. 2021, 27, 101356. [Google Scholar] [CrossRef]
- Tang, Y.Z.; Yuan, J.L.; Liu, Z.L.; Feng, Q.; Gong, X.L.; Lu, L.; Chua, K.J. Study on Evolution Laws of Two-Phase Choking Flow and Entrainment Performance of Steam Ejector Oriented Towards MED-TVC Desalination System. Energy 2022, 242, 122967. [Google Scholar] [CrossRef]
- Gerard, D. A Theoretical and Experimental Investigation on Ejector Acoustics and Ejector Silencer Design. Master’s Thesis, Carleton University, Ottawa, ON, Canada, 2018. [Google Scholar]
- Mohammed, S. Optimization of Acoustic Liner Design for Axisymmetric Mixer-Ejector Nozzles under ESPR Program. In Proceedings of the 23rd International Congress of Aeronautical Sciences, Toronto, ON, Canada, 8–13 September 2002. [Google Scholar]
- Rafael, C.E.; Carlos, R.I.S.; Cesar, J.D. Application of RANS-based method to predict acoustic noise of chevron nozzles. Appl. Acoust. 2014, 79, 153–163. [Google Scholar] [CrossRef]
- Das, I.S.; Khavaran, A.; Krejsa, E.A. A Computational Study of Contoured Plug-nozzle Jet Noise. J. Sound Vib. 1997, 206, 169–194. [Google Scholar] [CrossRef]
- Suponitsky, V.; Sandham, N.D.; Agarwal, A. On the Mach Number and Temperature Dependence of Jet Noise, Results from a Simplified Numerical Model. J. Sound Vib. 2011, 330, 4123–4138. [Google Scholar] [CrossRef]
- Kapusta, M.; Powers, R.; Morris, P.J. Numerical Simulations for Supersonic Jet Noise Reduction Using Fluidic Inserts. In Proceedings of the 54th AIAA Aerospace Sciences Meeting, San Diego, CA, USA, 4–8 January 2016. [Google Scholar]
- Yang, H.H.; Zhou, L.; Wan, Z.H.; Sun, D.J. The Effects of Temperature on Vortex-Pairing Noise in Axisymmetric Subsonic Jets. Procedia Eng. 2015, 126, 63–67. [Google Scholar] [CrossRef]
- Wei, X.F.; Mariani, R.; Chua, L.P.; Lim, H.D.; Lu, Z.B.; Cui, Y.D.; New, T.H. Mitigation of Under-Expanded Supersonic Jet Noise Through Stepped Nozzles. J. Sound Vib. 2019, 459, 114875. [Google Scholar] [CrossRef]
- Tide, P.S.; Babu, V. Numerical Predictions of Noise due to Subsonic Jets from Nozzles with and without Chevrons. Appl. Acoust. 2009, 70, 321–332. [Google Scholar] [CrossRef]
- Ffowcs, W.J.E.; Hawkings, D.L. Sound Generation by Turbulence and Surfaces in Arbitrary Motion. Philos. Trans. R. Soc. Lond. 1969, A264, 321–342. [Google Scholar] [CrossRef]
- Xing, C.L.; Le, G.G.; Shen, L.; Zhao, C.F.; Zheng, H. Numerical Investigations on Acoustic Environment of Multi-Nozzle Launch Vehicle at Lift-Off. Aerosp. Sci. Technol. 2020, 106, 106140. [Google Scholar] [CrossRef]
- Morfey, C.L.; Tester, B.J.; Powles, C.J. Numerical and Asymptotic Lilley-Equation Solutions for the Goldstein Jet-Noise Source Model. In Proceedings of the 13th AIAA/CEAS Aeroacoustics Conference (28th AIAA Aeroacoustics Conference), Rome, Italy, 21–23 May 2007. [Google Scholar]
- Zhu, Y.H.; Cai, W.J.; Wen, C.Y.; Li, Y.Z. Shock Circle Model for Ejector Performance Evaluation. Energy Convers. Manag. 2007, 48, 2533–2541. [Google Scholar] [CrossRef]
- Menter, F.R. Two-Equation Eddy-Viscosity Turbulence Models for Engineering Applications. AIAA J. 1994, 32, 1598–1605. [Google Scholar] [CrossRef]
- Kavous, A.; David, B.; Ghassan, A.D.; Navid, S. Mixing Layer Effects on the Entrainment Ratio in Steam Ejectors through Ideal Gas Computational Simulations. Energy 2016, 95, 380–392. [Google Scholar] [CrossRef]
- Walid, B.; Christophe, B.; Philippe, L. Stochastic Approach to Noise Modeling for Free Turbulent Flows. AIAA J. 1994, 32, 455–463. [Google Scholar] [CrossRef]
- Wan, Z.H.; Yang, H.H.; Zhang, X.C.; Sun, D.J. Instability Waves and Aerodynamic Noise in a Subsonic Transitional Turbulent Jet. Eur. J. Mech. B Fluids 2016, 57, 192–203. [Google Scholar] [CrossRef]
- Casalino, D.; Genito, M. Achievements in the Numerical Modeling of Fan Noise Radiation from Aero-engines. Aerosp. Sci. Technol. 2008, 12, 105–113. [Google Scholar] [CrossRef]
- Menter, F.; Egorov, Y. The Scale-Adaptive Simulation Method for Unsteady Turbulent Flow Predictions, Part 1, Theory and Model Sescription. J. Flow Turbul. Combust. 2010, 85, 113–138. [Google Scholar] [CrossRef]
- Brentner, K.S.; Farassat, F. An Analytical Comparison of the Acoustic Analogy and Kirchhoff Formulations for Moving Surfaces. AIAA J. 1998, 36, 1379–1386. [Google Scholar] [CrossRef]
- Liu, C.Q.; Gao, Y.S.; Dong, X.R.; Wang, Y.Q.; Liu, J.M.; Zhang, Y.N.; Cai, X.S.; Gui, N. Third generation of vortex identification methods: Omega and Liutex/Rortex based systems. J. Hydrodyn. 2019, 31, 205–223. [Google Scholar] [CrossRef]
- Wu, H.Q. A Study on the Flow and Phase Change Characteristics in Steam Ejector. Doctor Thesis, Beijing University of Technology, Beijing, China, 2017. (In Chinese). [Google Scholar]
- Wu, K.; Liang, L.X.; Huang, L.L.; Cao, J.Z. Numerical Simulation of Aerodynamic Noise for the Steam Jet of Ejector. Build. Energy Environ. 2010, 29, 41–44. (In Chinese) [Google Scholar] [CrossRef]
Disclaimer/Publisher’s Note: The statements, opinions and data contained in all publications are solely those of the individual author(s) and contributor(s) and not of MDPI and/or the editor(s). MDPI and/or the editor(s) disclaim responsibility for any injury to people or property resulting from any ideas, methods, instructions or products referred to in the content. |
© 2023 by the authors. Licensee MDPI, Basel, Switzerland. This article is an open access article distributed under the terms and conditions of the Creative Commons Attribution (CC BY) license (https://creativecommons.org/licenses/by/4.0/).