Abstract
CO2 geological storage, which is an effective way to reduce CO2 emissions, is of great significance to mitigate the current greenhouse effect. In long-term CO2 storage, although the chemical reaction rate of CO2–brine–rock is slow, it can significantly change the mineral composition of rock and the structure and properties of pores and joints, and then change the transport process and distribution state of CO2 in porous media. Therefore, a simplified 2D geological model is established based on the geological data of the Shihezi Formation in the Ordos Basin, China. The mechanism of the CO2–brine–rock reaction and its effect on mineral transformation and pore permeability are studied. In the early stage of CO2 geological sequestration, the rate of CO2 intrusion into the caprock is fast, the CO2–brine–rock reaction in the early stage is mainly a dissolution reaction, and the porosity and permeability of the caprock show an increasing trend. During the period from 100 to 1000 years of CO2 sequestration, the vertical distance of CO2 intrusion into the caprock does not change much. During this period, the type of CO2–brine–rock reaction is mainly a precipitation reaction, which reduces the porosity and permeability of the caprock and increases the sealing ability of the caprock to a certain extent. Our results can not only provide theoretical support for the site selection and risk assessment of CO2 geological sequestration, but also provide a theoretical basis and practical guidance for large-scale commercial storage in the future.
1. Introduction
In order to cope with the increasingly serious greenhouse effect, many countries began to study carbon capture and storage (CCS) as early as the 1990s [1]. At present, there are 30 carbon capture and storage facilities in operation around the world, storing about 40 million tons of CO2 each year. Deep saline aquifer has the greatest potential for CO2 geological storage compared with depleted oil and gas reservoirs and coal seams. There are some typical CCS projects around the world, such as the Sleipner project and Snϕhvit project in Norway, Salah project in Algeria, etc. In particular, the Sleipner project, which began in 1996, is the world’s first commercial example of a CCS project with 1 million tons of CO2 injected per year. As the largest developing country, China made clear in 2020 the carbon goal of “peak carbon emissions by 2030 and carbon neutrality by 2060”. China has been actively exploring the implementation of CCS projects, despite the great pressure of carbon emission reduction. Although CCS has been slow to make progress because of its cost, it is still seen as the key technique to mitigate climate change. In addition to carbon geological sequestration, CO2 is also widely used for enhanced oil recovery [2,3] and enhanced gas recovery [4,5], geothermal resources development [6], underground gas storage construction [7,8], etc., so as to realize a “capture-utilization-storage” “carbon neutral” energy supply system [9]. Whether it is carbon sequestration or any form of carbon use, the sealing ability of caprock needs to be considered [10,11]. Caprock heterogeneity is an important factor affecting the capacity and safety of CO2 storage, so heterogeneous models have attracted the attention of many scholars [12,13,14]. At the same time, the CO2–brine–rock reaction in the caprock will affect the pore structure of the caprock and the CO2 transport process in the caprock [15]. Therefore, it is of great significance to study the CO2–brine–rock reaction and the CO2 transport mechanism in caprock for the safety assessment of CO2 geological storage [16,17].
In this article, a numerical model is established to study the CO2 transport process in heterogeneous caprock and the influence of the CO2–brine–rock reaction on the sealing ability of caprock, which is based on the geological data of the Shihezi Formation in the Ordos Basin. Heterogeneity is described in Section 2, which is used in TOUGH software; in Section 3, the conceptual model and related parameters are introduced, and in Section 4 we investigate the simulation results, including the CO2 transport process and the CO2–brine–rock reaction and its influence on caprock sealing ability; lastly, some conclusions are discussed.
2. Heterogeneity Description of Caprock
Heterogeneity of rock can be characterized by several parameters, such as the Dykstra–Parsons coefficient, Lorenz heterogeneity index, Koval heterogeneity index, Gelhar–Axness heterogeneity index, and so on [18]. The Dykstra–Parsons coefficient is adopted to describe the heterogeneity [16]. For a natural reservoir, , where represents a homogeneous reservoir while represents a completely heterogeneous reservoir. Generally, . Permeability, , is commonly log-normally distributed. In this case, the Dykstra–Parsons coefficient can be expressed as and represented by logarithmic normal distribution
where is the geometric mean of permeability, is the standard deviation of , and describes the random field in keeping with normal distribution.
Permeability can also be rewritten as
where is the mean permeability.
Introducing Gaussian correlation function for two-dimension space,
where and are the horizontal lag distance and correlation length along the coordinate, and and are the vertical lag distance and correlation length along the coordinate, respectively. Isotropic case is considered here, that is . If the Gaussian correlation matrix is embedded into , we can obtain , where is a white noise random vector. So, the heterogeneity of permeability can be described by the Dykstra–Parsons coefficient and correlation length , where , and is the relative correlation length.
3. Conceptual Model
3.1. Description of Simulator
In this study, all numerical simulations are performed on TOUGHREACT v3.0 OMP [16], a parallel simulator for nonisothermal multiphase reactive transport in porous and fractured rock based on TOUGH2 [19], which has been used to simulate geological carbon sequestration and many other subsurface engineering problems. Heterogeneity of permeability can be randomly generated automatically in TOUGHREACT or set for each grid as needed by users [20]. The spatial correlation factor is adopted here, and the permeability of each grid is self-assigned by random sequence.
3.2. Geological Storage Project and Numerical Model
The project of “Coal-to-Oil Chemical Exhaust Capture-Saline Sequestration” was carried out in 2011–2014 in the Ordos Basin by Shenhua Group, the world’s largest coal enterprise, and a total of 300,000 tons of CO2 was injected. This project has a positive demonstration significance. The Ordos Basin is the second-largest sedimentary basin in China, and there are up to nine formations suitable for CCS projects, whose locations are depicted in Figure 1A. The target zone is located in the backfill area of the Shenhua open-pit coal mine in the western riverbed of the Ulan Moron River, which is about 45 km southeast of the Ordos City, China. The longitude is , and the latitude is . The Shihezi Formation is in the interior stable region of the Ordos Basin where it was top to bottom developed in the Cretaceous, Triassic, Permian, Carboniferous, Ordovician, and Cambrian periods. According to CCS experience and stratigraphic characteristics, five reservoir-cap combinations were selected as target storage sites by comparing reservoir factors and economic factors. As one of the main target areas for CO2 geological sequestration, the buried depth of the Shihezi Formation is about 1650–1850 km, belonging to the early Permian period, and the stratigraphic age is 1.5 × 10⁸–5 × 10⁸ years. The reservoir is mainly sandstone with a thickness of 100–200 m, and its average porosity and absolute permeability are 6–13% and 3–7 mD, respectively. The caprock is dominated by mudstone, whose thickness is 150–200 m, average porosity is 6–13%, and absolute permeability is 0.05–0.09 mD [21].
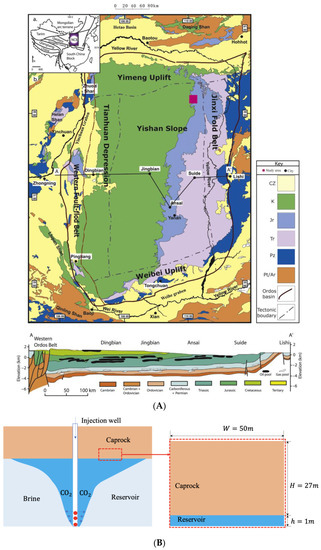
Figure 1.
Location of Shihezi Formation and conceptual model. (A) The target zone is located in Ordos Basin and shown by red square [22]; (B) Conceptual model.
The conceptual model is illustrated in Figure 1B for numerical simulation, where the length is 50 m along the horizontal coordinate, and 28 m along the vertical coordinate including 27 m of caprock and 1 m of reservoir. The main purpose is to investigate the effects of CO2 migration and aggregation on caprock sealing ability during CO2 sequestration. The reservoir of 1 m depth is regarded as the CO2 source, which supplies CO2 for caprock.
3.3. Model Parameters
The reservoir depth of the Shihezi Formation is between 1650 m and 1850 m, and the thickness of the caprock is about 150 m. The hydrostatic pressure gradient is 10 MPa/km, and the initial pressure of the caprock is 165 bar according to the pressure gradient. After CO2 injection, the reservoir pressure will be higher than its initial pressure. A trial-and-error approach was used to determine the reservoir pressure to 195 bar. At this pressure, CO2 can enter the caprock from the top of the reservoir, but it will not migrate out of the top of the caprock and leak. Under this pressure condition, the migration process of CO2 intruding into caprock, the CO2–brine–rock reaction and its influence on the CO2 seepage and the pore characteristics of caprock are analyzed. Some other parameters of the numerical model are listed in Table 1, which were collected from the Ordos Basin [21]. The volume contents of the minerals in the reservoir and caprock are adopted from reference [23], listed in Table 2.

Table 1.
Parameters of numerical model [23].

Table 2.
Volume contents of primary minerals of reservoir and caprock [22,23].
In Table 1, is the fitting parameter related to pore distribution. and are liquid residual saturation and gaseous residual saturation, respectively. and are liquid and gaseous relative permeability, respectively is liquid saturation, and is the saturation when rock is saturated by the liquid. If the capillary is not considered, that is, there is no capillary pressure, the value of can be chosen as 1. Obviously, both and are dimensionless. denotes capillary pressure, where is the maximum, and is the inlet pressure.
4. Results and Discussion
4.1. CO2 Distribution
In the early stage of sequestration, a large amount of CO2 is accumulated above the reservoir, so the pressure is high at the contact surface between the caprock and the reservoir. However, as time goes by, CO2 intrudes into the caprock, dissolves, and reacts with the minerals and brine, which will consume a great deal of CO2. Therefore, the overall CO2 pressure in the caprock drops in the later stage; especially, the pressure dissipation is obvious at the bottom of the caprock.
The CO2 accumulated above the reservoir migrates to the caprock at a maximum distance of nearly 10 m within a year, but the overall gaseous CO2 distribution is still concentrated at the interface between the reservoir and the caprock, as shown in Figure 2a. Ten years later after injection, the vertical distance of CO2 migration is over 10 m, as shown in Figure 2b. The maximum vertical migration distance is almost the same in 100 years and 1000 years, close to 20 m. However, the longer the time, the greater the range of lateral migration, as shown in Figure 2c,d. The vertical distance of CO2 invading the caprock remains almost constant after 100 years of injection. There may be two reasons. On the one hand, the reservoir pressure is assumed to be constant after CO2 injection stops, which can provide limited pressure. If CO2 is injected consistently, the increasing pressure will have a great impetus for intrusion. On the other hand, convection and diffusion of CO2 with its dissolution will promote the lateral transport in the process of CO2 intrusion into the caprock. At the same time, some CO2 is mineralized due to the CO2–brine–rock reaction, which may change the porosity and permeability of the caprock to a certain extent. This may also limit the vertical transport of gaseous CO2 in the caprock.
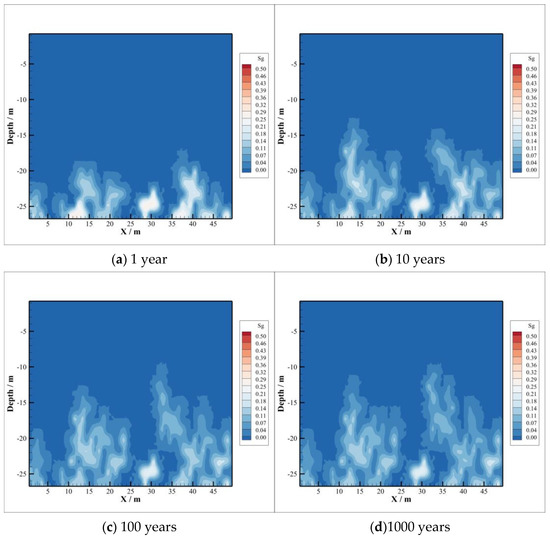
Figure 2.
Gas saturation.
4.2. CO2 Dissolution and Concentration Changes of Brine Components
The distribution area of CO2 dissolved in brine is consistent with the distribution range of gaseous CO2, where there are some patchy distributions. These areas represent high concentrations of dissolved CO2, and they are caused by heterogeneity of permeability. At the edge of the CO2 dissolved region, the concentration is lower because of CO2 diffusion. In the first year, the dissolved CO2 has intruded into caprock about 8 m, and 10 years later the depth of CO2 intrusion has expanded about 14 m, which are illustrated in Figure 3a,b. The longer the time, the greater the distance. However, there is little difference between Figure 3c,d. This means that CO2 intrusion distance into caprock is limited. According to the comparison of Figure 3c,d, the distribution region of dissolved CO2 does not change much, and the molar fraction of CO2 dissolved in brine hardly changes. This means, after 100 years or even longer, the amount of CO2 dissolved will not change when it has reached a certain degree of dissolution in the brine of the caprock.
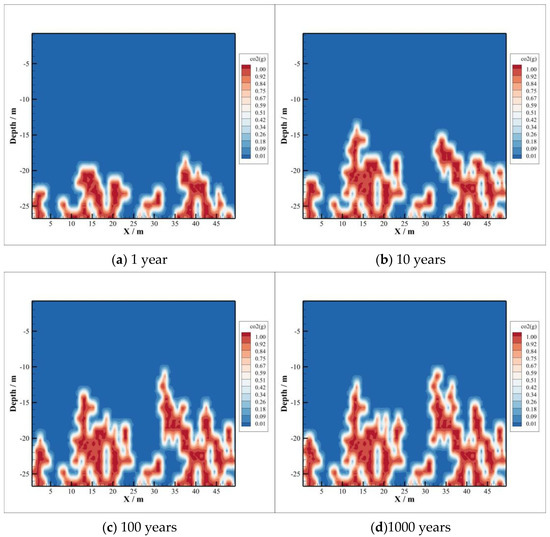
Figure 3.
Mole fraction of CO2.
The value of pH is distributed almost the same as the distribution region of dissolved CO2, as shown in Figure 4. This is precisely the reason for the significant reduction in pH value due to the dissolution of CO2 into the brine of caprock. The corresponding chemical reaction can be expressed as follows:
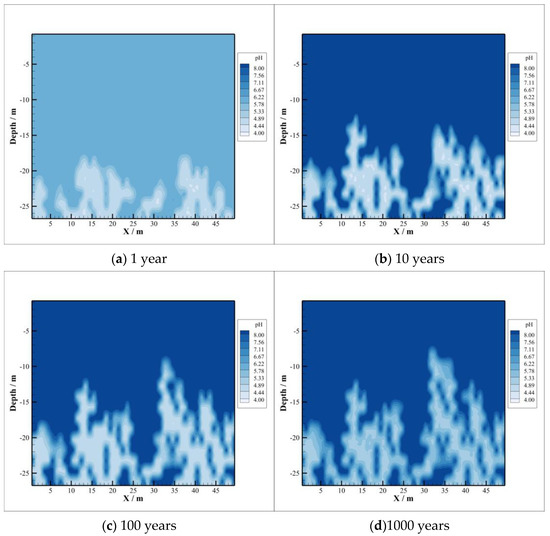
Figure 4.
pH Value.
From the comparison of Figure 4c,d, the latter has a higher pH value although the whole area increased slightly due to CO2 diffusion. This is because the dissolved CO2 reacts with minerals in the acidic environment, which buffers the pH of the brine to a certain extent compared with the initial stage of CO2 storage.
The density of the brine will increase due to the dissolution of CO2, and the region of density change is consistent with the region of dissolved CO2 and pH change, as depicted in Figure 5. The density decreases slightly in 1000 years compared to 100 years. There are two reasons for that. On the one hand, in the early stage of CO2 sequestration, the dissolution reaction is dominant, where minerals will dissolve, and the resulting ions lead to the increase in brine density. On the other hand, the precipitation reaction starts as time goes by, leading to the combination of metal cations and , which results in minerals precipitation. This can also be concluded from the change in mineral content caused by the subsequent CO2–brine–rock reaction.

Figure 5.
Density of brine.
According to the chemical equation of the ionization of CO2 dissolved in salt water, the concentration of is closely related to the process of CO2 dissolution, as illustrated in Figure 6. Therefore, the distribution of concentration highly coincides with the molar fraction of dissolved CO2, pH value, and the distribution region of brine density. Moreover, the concentration of shows a trend of increasing gradually with time due to the continuous dissolution of CO2 in brine.
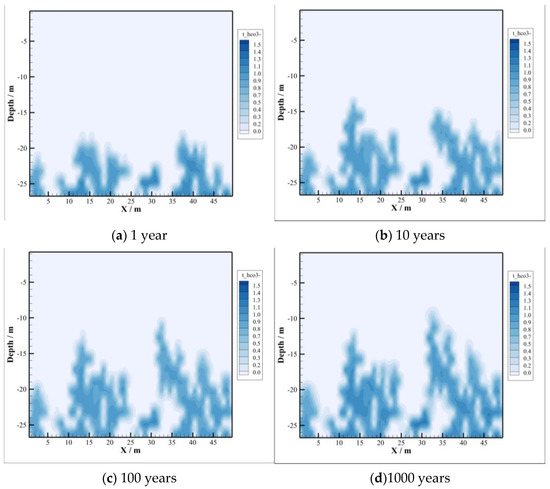
Figure 6.
Concentration of .
Compared with the concentration distribution of , the change area of and concentration is basically consistent with the area of CO2 intrusion into the caprock, depicted in Figure 7 and Figure 8, and at first the change range of concentration is larger than that of concentration. With the passing of time, the concentration of decreases gradually, while the concentration of increases gradually, which means that combines with the ionized after the dissolution of CO2 to form precipitate, resulting in its concentration becoming smaller and smaller. In the case of , the concentration of increases gradually because albite is dissolved at the initial stage of CO2 injection. By 1000 years after injection, sodium montmorillonite precipitation occurs, where the amount of consumed is too small compared to the amount released by the dissolution of oligaclase. So, concentrations continue to increase after CO2 injection.
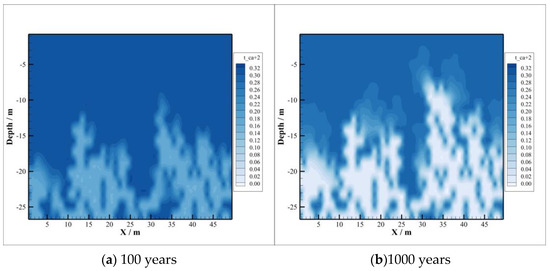
Figure 7.
Concentration of .
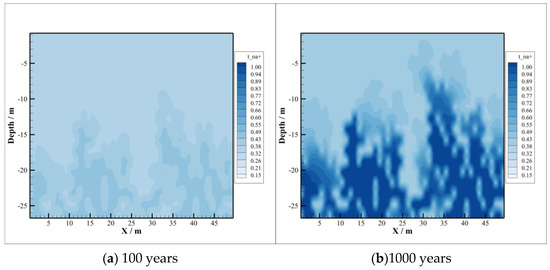
Figure 8.
Concentration of .
The concentration distributions of and are depicted in Figure 9 and Figure 10. After CO2 injection, the concentration of decreases. The reason is that the conversion of chlorite to sodium and calcium montmorillonite consumes a large amount of , although the dissolution of chlorite releases a portion of . It can be seen from Figure 10 that the concentration of shows a trend of increasing first and then decreasing. This is because a certain amount of is released by the dissolution of potassium K-feldspar in the early stage, and then the concentration is reduced due to the need for in the precipitation process of illite. At the beginning of CO2 sequestration, the dissolution rate of K-feldspar is greater than the precipitation rate of illite, and later the precipitation rate will exceed the dissolution rate. So, the concentration of shows different trends during CO2 sequestration.
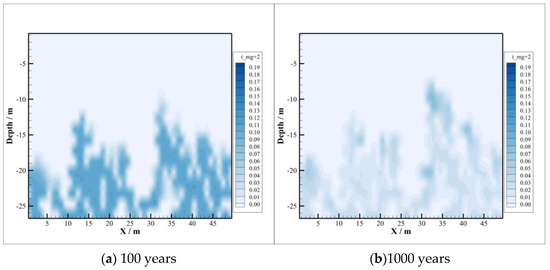
Figure 9.
Concentration of .
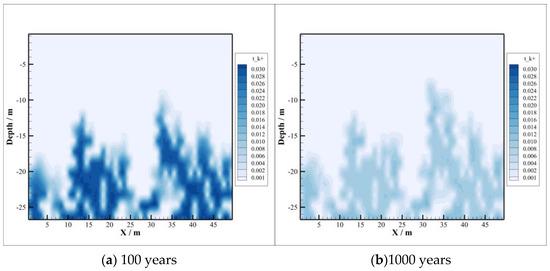
Figure 10.
Concentration of .
It can be seen from the above analysis that the change area of the main ion concentration in brine is basically consistent with the area of CO2 intrusion into the caprock. This indicates that CO2 dissolves in the process of intruding into the caprock, which reduces the pH value of brine significantly. The resulting CO2–brine–rock reactions change the concentration of the ions, which is closely related to the type of CO2–brine–rock reaction.
4.3. Minerals Transformation
The dissolution of CO2 into brine reduces its pH value, which accelerates the chemical reaction process of the minerals at the bottom of the cap. In the early stage of CO2 sequestration, mineral dissolution reaction can be effectively promoted in a lower pH environment, which will result in anion and metallic cations recombination, leading to mineral precipitation. Some typical minerals’ transformation will be listed including the volume change in the minerals and the corresponding area in the caprock during CO2 geological sequestration. In the numerical simulation, the numerical value represents the change in mineral volume content, where the positive number represents the increase in mineral volume, and the negative number represents the decrease in mineral volume. The relevant reaction types are precipitation and dissolution reaction.
Volume changes of K-feldspar, calcite, oligoclase, and chlorite are depicted in Figure 11, from which we can find that these minerals are mainly dissolved. The chemical equations of K-feldspar, calcite, oligoclase, and chlorite dissolution are listed as follows:
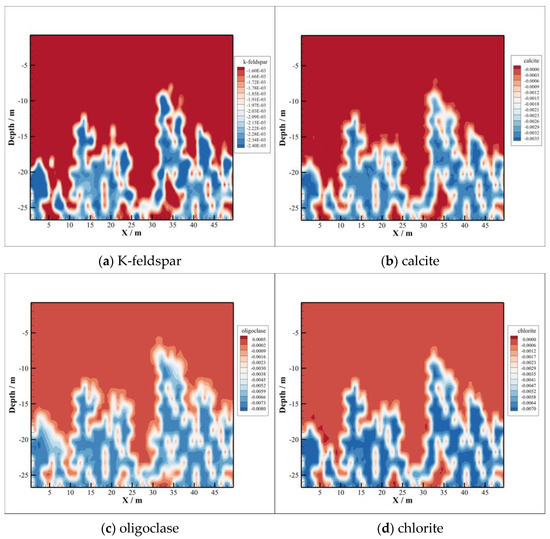
Figure 11.
Some minerals dissolution.
After 1000 years of injection, the maximum dissolution amounts of K-feldspar and calcite are 0.0024 and 0.0035, while oligoclase and chlorite are 0.008 and 0.0075. The volume contents decrements of the latter two minerals are more than double the first two minerals, as shown in Figure 11.
Meanwhile, sodium montmorillonite and calcium montmorillonite at the bottom of the caprock are mainly precipitated, as depicted in Figure 12a,b. The volume fraction of illite and ankerite also increases significantly at the bottom of the caprock, depicted in Figure 12c,d, and the maximum amounts of precipitation are 0.0055 and 0.008, respectively. The precipitation regions of the four minerals mentioned above are basically the same as those of the dissolved minerals, which indicates that the dissolution of calcite, oligoclase, and chlorite promotes the precipitation of these four minerals. Minerals, smectite-Na and smectite-Ca, can also regarded as chlorite reacting with , , and directly, whose chemical equation are listed as follows:
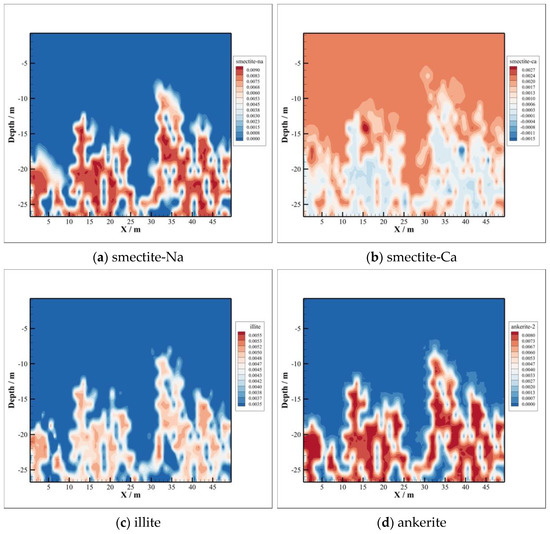
Figure 12.
Some minerals precipitation.
The precipitation area of illite is almost the same as that of K-feldspar, as illustrated in Figure 12c. The kaolinite is converted to illite due to the existence of . The corresponding chemical equation is as follows:
The precipitation of ankerite takes place, which can be seen from Figure 12d, due to existence of , provided by the dissolution of calcite, oligoclase, and chlorite.
4.4. Porosity and Permeability of Caprock
Porosity and permeability are important factors for the safety of CO2 sequestration, which are often adopted as the indices of caprock sealing ability. Changes in porosity and permeability result from minerals dissolution and precipitation, which are not caused by fluid pressure and other factors. Figure 13 and Figure 14 show evolutions of porosity and permeability versus time. From the comparison with them, variations of both porosity and permeability are similar due to their dependence.
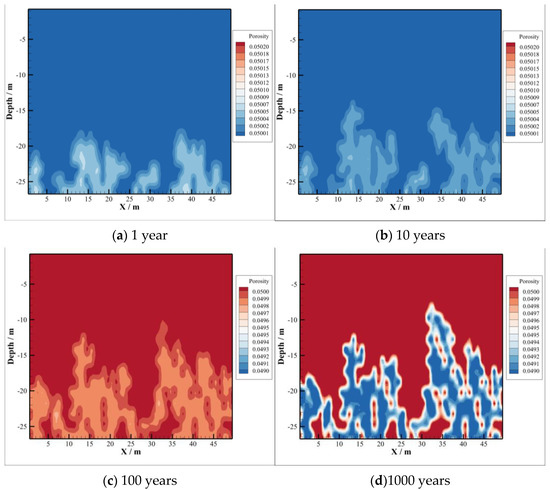
Figure 13.
Porosity of caprock.
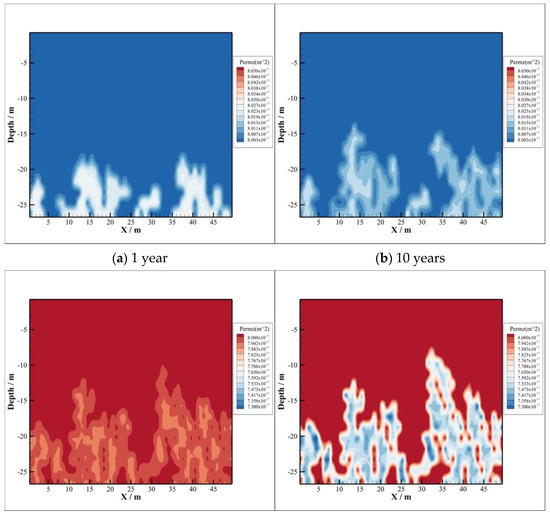
Figure 14.
Permeability of caprock.
The acidized brine will promote CO2–brine–rock interactions in caprock, where CO2 invade from the reservoir. During CO2 sequestration, both porosity and permeability increase firstly and decrease after that in the bottom of caprock. The reason of their increase firstly is that CO2 dissolves into the brine leading pH values to decrease significantly, where the type of reaction is dissolution. The increase area of both porosity and permeability in caprock is consistent with the CO2 invasion part, which is illustrated in Figure 13a,b and Figure 14a,b, respectively. As time goes on, the precipitation reaction dominates in the caprock. Both porosity and permeability have been decreasing since 100 years after injection, which can be found in (c) and (d) of Figure 13 and Figure 14, respectively. Moreover, the area of decreasing porosity, as well as permeability, is consistent with the area of minerals precipitation.
5. Conclusions
A simplified model is established to study the CO2 transport process and the CO2–brine–rock reaction mechanism and its influence on the porosity and permeability of the heterogeneous caprock in the Shihezi Formation, Ordos Basin. The main results can be concluded as follows:
- The heterogeneity of the caprock promotes the intrusion of CO2 into the caprock to a certain extent and accelerates the transport process of CO2 in the caprock. However, when CO2 migrates to a certain distance in the caprock, the vertical migration process slows down obviously. Simulation results show that the vertical transport distance of CO2 is almost unchanged during the period of 100 to 1000 years, about 20 m, but the horizontal transport distance increases.
- With the intrusion of CO2 gas into the caprock, part of the CO2 will be dissolved, which will significantly reduce the pH value of the brine in the caprock. However, the distribution of the dissolved CO2 in the caprock is smaller than the range of pH value change, which means that the ion transport range exceeds the range of CO2 dissolution, which can promote the CO2–brine–rock reaction in a larger range. On the one hand, CO2 dissolved in formation water can promote ion transport, which will promote the CO2–brine–rock reaction. On the other hand, the CO2–brine–rock reaction caused by the change in ion concentration in turn limits the ion transport distance. Therefore, the transport distance of CO2 almost does not change after a certain time.
- The CO2–brine–rock reaction during CO2 intrusion into the caprock can significantly change the changes in porosity and permeability. In the early stage of CO2 sequestration, due to the decrease in formation water pH value, the type of CO2–brine–rock reaction is mainly a dissolution reaction, so the porosity and permeability show an increasing trend. However, with the passage of time, the porosity and permeability with CO2 intrusion into the caprock decreased significantly, which means that the reaction type changed to precipitation, thus enhancing the sealing ability of the caprock.
Author Contributions
Conceptualization, Z.L. and Y.L.; methodology, B.L.; software, B.L.; formal analysis, B.L.; investigation, Z.L.; resources, Y.L.; writing—original draft preparation, Z.L. and B.L.; visualization, B.L.; supervision, Y.L.; project administration, B.L. All authors have read and agreed to the published version of the manuscript.
Funding
This research was funded by CNPC Innovation Found grant number 2021DQ02-1103, National Key Research and Development Program grant number SQ2022YFE020862, and National Natural Science Foundation of China grant number grant number 41602134 and 42072166.
Conflicts of Interest
The authors declare no conflict of interest.
References
- IPCC. Special Report on Carbon Dioxide Capture and Storage: Technical Sum-Mary; IPCC: Geneva, Switzerland, 2005. [Google Scholar]
- Naderi, S.; Simjoo, M. Numerical study of Low Salinity Water Alternating CO2 injection for enhancing oil recovery in a sandstone reservoir: Coupled geochemical and fluid flow modeling. J. Pet. Sci. Eng. 2019, 173, 279–286. [Google Scholar] [CrossRef]
- Zhang, X.; Wei, B.; Shang, J.; Gao, K.; Pu, W.; Xu, X.; Wood, C.; Sun, L. Alterations of geochemical properties of a tight sandstone reservoir caused by supercritical CO2-brine-rock interactions in CO2-EOR and geosequestration. J. CO2 Util. 2018, 28, 408–418. [Google Scholar] [CrossRef]
- Chen, Y.; Sari, A.; Zeng, L.; Saeedi, A.; Xie, Q. Geochemical insights for CO2 huff-n-puff process in shale oil reservoirs. J. Mol. Liq. 2020, 307, 112992. [Google Scholar] [CrossRef]
- Oldenburg, C.M.; Pruess, K.; Benson, S.M. Process Modeling of CO2 Injection into Natural Gas Reservoirs for Carbon Sequestration and Enhanced Gas Recovery. Energy Fuels 2000, 15, 293–298. [Google Scholar] [CrossRef]
- Spycher, N.; Pruess, K. A Phase-Partitioning Model for CO2–Brine Mixtures at Elevated Temperatures and Pressures: Application to CO2-Enhanced Geothermal Systems. Transp. Porous Media 2010, 82, 173–196. [Google Scholar] [CrossRef]
- Kim, J.; Choi, J.; Park, K. Comparison of nitrogen and carbon dioxide as cushion gas for underground gas storage reservoir. Geosystem Eng. 2015, 18, 163–167. [Google Scholar] [CrossRef]
- Oldenburg, C.M. Carbon Dioxide as Cushion Gas for Natural Gas Storage. Energy Fuels 2003, 17, 240–246. [Google Scholar] [CrossRef]
- Kühn, M.; Nakaten, N.; Streibel, M.; Kempka, T. CO2 Geological Storage and Utilization for a Carbon Neutral “Power-to-gas-to-power” Cycle to Even Out Fluctuations of Renewable Energy Provision. Energy Procedia 2014, 63, 8044–8049. [Google Scholar] [CrossRef]
- Gaus, I. Role and impact of CO2–rock interactions during CO2 storage in sedimentary rocks. Int. J. Greenh. Gas Control 2010, 4, 73–89. [Google Scholar] [CrossRef]
- Gaus, I.; Azaroual, M.; Czernichowski-Lauriol, I. Reactive transport modelling of the impact of CO2 injection on the clayey cap rock at Sleipner (North Sea). Chem. Geol. 2005, 217, 319–337. [Google Scholar] [CrossRef]
- Doughty, C. Modeling geologic storage of carbon dioxide: Comparison of non-hysteretic and hysteretic characteristic curves. Energy Convers. Manag. 2007, 48, 1768–1781. [Google Scholar] [CrossRef]
- Liu, B.; Zhang, Y. CO2 modelling in a deep saline aquifer: A predictive uncertainty analysis using design of experiment. Environ. Sci. Technol. 2011, 45, 3504–3510. [Google Scholar] [CrossRef] [PubMed]
- Deng, H.; Stauffer, P.H.; Dai, Z.; Jiao, Z.; Surdam, R.C. Simulation of industrial-scale CO2 storage: Multi-scale heterogeneity and its impacts on storage capacity, injectivity and leakage. Int. J. Greenh. Gas Control 2012, 10, 397–418. [Google Scholar] [CrossRef]
- Gherardi, F.; Xu, T.; Pruess, K. Numerical modeling of self-limiting and self-enhancing caprock alteration induced by CO2 storage in a depleted gas reservoir. Chem. Geol. 2007, 244, 103–129. [Google Scholar] [CrossRef]
- Xu, T.; Sonnenthal, E.; Spycher, N.; Pruess, K. TOUGHREACT-A simulation program for non-isothermal multiphase reactive geochemical transport in variably saturated geologic media: Applications to geothermal injectivity and CO2 geological sequestration. Comput. Geosci. 2006, 32, 145–165. [Google Scholar] [CrossRef]
- Xu, T.; Zheng, L.; Tian, H. Reactive transport modeling for CO2 geological sequestration. J. Pet. Sci. Eng. 2011, 78, 765–777. [Google Scholar] [CrossRef]
- Sahimi, M. Flow and Transport in Porous Media and Fractured Rock: From Classical Methods to Modern Approaches; Wiley-VCH Verlag GmbH & Co. KGaA: Weinheim, Germany, 2011. [Google Scholar]
- Pruess, K.; Oldenburg, C.M.; Moridis, G.J. TOUGH2 User’s Guide, Version 2; Lawrence Berkeley Laboratory Report LBL-43134; Lawrence Berkeley Laboratory: Berkeley, CA, USA, 1999.
- Pruess, K.; Zhang, K. Numerical Modeling Studies of the Dissolution-Diffusion-Convection Process during CO2 Storage in Saline Aquifers; Technical Report LBNL-1243E; Lawrence Berkeley Laboratory: Berkeley, CA, USA, 2008.
- Wu, X. China’s First Large-Scale Exploration of Carbon Dioxide Capture and Geological Storage, 1st ed.; Science Press: Beijing, China, 2013. [Google Scholar]
- Li, Q.; Liu, G.; Liu, X.; Li, X. Application of a health, safety, and environmental screening and ranking framework to the Shenhua CCS project. Int. J. Greenh. Gas Control 2013, 17, 504–514. [Google Scholar] [CrossRef]
- Tian, H. Impacts of CO2-Brine-Rock Interaction on the Caprock Sealing Efficiency: A Case Study of Shiqianfeng Formation Mudstone Caprock in Ordos Basin. Ph.D. Thesis, Jilin University, Changchun, China, 2014. [Google Scholar]
Disclaimer/Publisher’s Note: The statements, opinions and data contained in all publications are solely those of the individual author(s) and contributor(s) and not of MDPI and/or the editor(s). MDPI and/or the editor(s) disclaim responsibility for any injury to people or property resulting from any ideas, methods, instructions or products referred to in the content. |
© 2022 by the authors. Licensee MDPI, Basel, Switzerland. This article is an open access article distributed under the terms and conditions of the Creative Commons Attribution (CC BY) license (https://creativecommons.org/licenses/by/4.0/).