Article

Development of a Numerical Method for Calculating a Gas Supply System during a Period of Change in Thermal Loads

1
Department of Petroleum Engineering, Saint Petersburg Mining University, 2, 21st Line, 199106 Saint Petersburg, Russia
2
Department of Pipeline Transport, Samara State Technical University, St. Molodogvardeyskaya, 244, 443100 Samara, Russia
3
Department of Petroleum Engineering, China University of Petroleum-Beijing 18, Fuxue Road, Changping District, Beijing 102249, China
*
Author to whom correspondence should be addressed.
Energies 2023, 16(1), 60; https://doi.org/10.3390/en16010060
Submission received: 30 October 2022 / Revised: 7 December 2022 / Accepted: 15 December 2022 / Published: 21 December 2022
(This article belongs to the Special Issue Geotechnologies and Structures in the Energy Sector)

Abstract

:
Nowadays, modern gas supply systems are complex. They consist of gas distribution stations; high-, medium-, and low-pressure gas networks; gas installations; and control points. These systems are designed to provide natural gas to the population, including domestic, industrial, and agricultural consumers. This study is aimed at developing methods for improving the calculation of gas distribution networks. The gas supply system should ensure an uninterrupted and safe gas supply to consumers that is easy to operate and provides the possibility of shutting down its individual elements for preventive, repair, and emergency recovery work. Therefore, this study presents a mathematical calculation method to find the optimal operating conditions for any gas network during the period of seasonal changes in thermal loads. This method demonstrates how the reliability of gas distribution systems and resistance to non-standard critical loads are affected by consumers based on the time of year, month, and day, and external factors such as outdoor temperature. The results in this study show that this method will enable the implementation of tools for testing various management strategies for the gas distribution network.

1. Introduction

For the next 50 years, natural gas has the opportunity to be the primary low-cost energy source. The numerous advantages of gas, such as its low greenhouse gas emissions and relatively low capital costs in its production compared to other energy sources, make it competitive in most sectors of the economy. Gas distribution networks are a complex system with thousands of kilometers of pipes [1], which include production, storage, and distribution centers for gas distribution stations, as well as other devices for monitoring and regulating the gas transmission system [2,3]. These types of systems operate at high pressure using compressors and gas distribution stations to provide sufficient energy to move natural gas over long distances [4]. When the gas flows through the gas distribution network, it experiences energy and pressure losses due to the friction between the inner walls of the pipeline [5,6] and due to the heat exchange between the gas and the outside air temperature [7]. When analyzing literary sources, it was found that many scholars conducted their studies of gas pipelines, as well as gas distribution networks, in stationary and non-stationary working conditions. When modeling the operation of a gas distribution network, it is necessary to consider the volume flow as well as the pressure drop in the pipeline. When the required volume of gas is supplied to the points of consumption at a given pressure, it is necessary to periodically restore unwanted pressure drops in the distribution network [8]. This task is performed by gas distribution stations, which consume 3–5% of the transported gas [9]. During the period of changing thermal loads with an increase in the allowable gas pressure [10] and avoiding certain safety limits, it is necessary to activate emergency mechanisms to avoid such unforeseen circumstances [11,12,13]. To prevent this situation, there are pressure regulators in the network that are designed to reduce the pressure to the required values that are within these limits. As in the case of compressors and gas distribution stations [14], these devices consume part of the natural gas [15] transported through the network.
In the literature, there are various models [16,17,18] describing the behavior of dynamic gas [19] inside a pipeline with a constant circular cross section [20]. The equations of continuity [21], motion, and energy conservation [22] in the theoretical study proceed from the assumption that any flow that satisfies the equations of consistency [23], motion, and energy is stable [24]. However, this assumption is not always fulfilled. Since not every movement predicted by the theory [25] exists, for example, this statement occurs in the study of flows [26] arising from the interaction of forced and free convection [27]. To get a qualitative idea of such flows, it is necessary to analyze the issue of their stability by reviewing and analyzing the latest research in this area [28].
Yang et al. [29] proposed approaches to develop a secure integrated energy system through an integrated flow model of the electricity and gas to improve the planning efficiency of electro-gas integrated energy systems. Tchórzewska-Cieślak et al. [30] presented a statistical analysis of gas network failures and identified seasonal and random fluctuations in the tested fault-tolerant flow. The Poisson distribution model was proposed as a model for the distribution of failures in the gas networks.
Scholars proposed a method for predicting the tolerable consequences of a gas pipeline failure to support the management of urban gas networks, mainly in terms of strategic modernization plans and rehabilitation methods. Ullah et al. [31] studied methods for detecting defects in pipelines using an application for flaw detection, which showed that the method could accurately identify the structural parameters of the location of the gas pipeline. Zhu et al. [32] and Morales and Yu [33] presented their solutions to the issue of gas pipeline system safety based on an analytical and mathematical model of gas pipeline damage based on a Bayesian network. Therefore, according to the research in the authors’ works, companies operating on the pipelines need to ensure investments in safety, make sure that the gas pipeline system operates in safe modes, and make sure that it is in good condition. According to these studies, it is necessary to maintain the frequency of safety inspections in the organizations operating the system, build a management system for residents of cities along the pipeline, and accordingly conduct regular safety performance evaluations. In assessing the safe operation of gas pipelines, analytical equations of gas flow are known for stationary and non-stationary modes. These equations are related to the momentum and energy, and they include the well-known steady-state flow equations which are widely used in automated calculation software systems for calculations of hydraulic friction and cover a wide range of fluid flow regimes: Weymouth, Panhandle A, Panhandle B, and the American Gas Association (AGA), as well as the Colebrook–White equation. In the study conducted by El-Shiekh [34], he developed a mathematical calculation formula for the design of gas pipelines in the steady state. The natural gas network was optimized to select the optimal diameter, the number of compressor stations along the length of the pipeline (with the arrangement of gas distribution stations if necessary), the length between each two compressor stations, and the suction and discharge pressures at the compressor stations. In another study conducted by Farzaneh-Gord et al. [35], the effects of natural gas hydrates on an underground gas pipeline in a steady state were examined. Their study also examined the effect of the composition of natural gas. Guo, Q. et al. [36] presented research on developing an adaptive time-step method extensively for transient modeling of natural gas pipeline networks as an important way to improve computational efficiency. Di Fan et al. developed a transition composition tracking method for gas pipeline networks that adopts the control volume method for hydraulic simulation and a one-dimensional non-stationary heat transfer model for thermal simulation. Case studies show that the proposed methods can provide reliable results for transient simulations [37].
Yu et al. developed a method for assessing the gas supply capacity of a gas transmission system and its reliability [38]. The process of transitioning between states and the duration of each operating state are modeled based on the Monte Carlo approach. To figure out the capacity of the gas network system, the authors used both hydraulic analysis and transient process modeling. Behrooz and Boozarjomehry [39] evaluated and modeled the state of gas transmission networks. An algorithm for processing an emergency arising in a dynamic model of a gas pipeline system was proposed. In [40], the authors report on the physics of a non-stationary compressible flow that affects the operation of a transmission system under conditions of variable gas quality. The results show that variable gas quality has a significant impact on pipeline system inventory and peak capacity. Chaczykowski et al. [41] explored two methods for tracking gas composition, one using the moving grid method and the other using the advection equation using the implicit inverse difference method. These methods have been applied to an onshore pipeline model in the Polish transmission system and to an offshore pipeline model in the Norwegian transmission system. In [42], the issue of calculating the volume of gas flowing from vessels of high and ultra-high (more than 10 MPa) pressure through holes in the pipeline walls was considered. The main feature of the study was that the outflow process was considered within the context of a real gas model, which had a significant impact on the quantitative results. Lurie M.V. et al. have proven that due to the Joule–Thomson effect, the gas moving towards the hole cools much more strongly than the perfect gas model predicts. In addition, the values of pressure, density, and velocity of the gas in the most compressed section of the jet, and consequently, the flow rate of gas leakage in the example under consideration, differ significantly. The Divided Implicit Efficient Network Modeling (DIMENS) method is described in [43]. It is based on the divide and conquer approach. In this method, the hydraulic variables of all multipipe interconnections are first solved. The authors claim that when compared to the commercial software Stoner Pipeline Simulator (SPS) for pipeline simulation, the DIMENS method provides comparable calculation accuracy and is 2.5 times faster in calculation speed. In [44], a study of the heat transfer of a gas pipeline into the ground is presented. The authors study stationary, one-dimensional non-stationary, and two-dimensional non-stationary models of gas flow along the pipe walls and heat transfer to the ground. The authors of [45] developed a gas pipeline network model considering gas supplies either from external gas networks or in the form of injected biogas or gasified liquefied natural gas. The results of the study showed that the model can solve complex gas supply problems and find interesting alternatives when the optimal gas flow rate is reversed between periods. The author of [46] describes studies of stationary models of gas networks of the NLP type and describes a mathematical solution, which is primarily intended to include a detailed non-linear problem at the final stages of system optimization.
The purpose of this study is the development and subsequent implementation of a gas distribution network simulator to evaluate various operation scenarios, considering the characteristics of such systems when changing thermal loads. The presence of an effective simulator is a very important engineering solution for gaining deeper knowledge about the operation of a gas distribution system to solve problems of improving energy efficiency as well as test possible future control strategies. Two simplified models have been developed based on a system of partial differential equations derived from input data based on the operating conditions of the gas distribution network.
The work is organized as follows: The article consists of Section 2 on research methods, with a brief overview of the main features of the operation of gas supply systems that determine the dynamics of the process. Section 3 presents the results of the study obtained by the proposed numerical schemes on application examples, which describe the calculation of emergency modes of operation in all cases, comparing these results with data taken from the literature. A final discussion of the main issues in this area and conclusions are presented in Section 4 and Section 5.

2. Case Study

2.1. City Gas Supply Systems

The urban gas supply systems are designed to supply gas to consumers in cities and industrial enterprises (Figure 1).
All types of urban gas consumption can be represented as follows: domestic gas consumption in apartments; gas consumption by commercial and government enterprises; gas consumption for the heating and ventilation of buildings; and industrial gas consumption. The city’s gas supply system includes gas networks of high pressure (operating gas pressure of 0.3–1.2 MPa), medium pressure (operating gas pressure of 0.005–0.3 MPa), and low pressure (operating gas pressure up to 0.005 MPa); gas distribution stations (GDSs); gas control points (GCPs); gas control units (GCUs); internal house networks; and finally ends with gas burners; the disconnecting device on the subscriber inlet (DDSI); disconnecting device at the entrance of the gas pipeline to the building (DDEGPB).
The concentration of flue gases at refineries ranges from 6% for thermal power plants to 12% for installations burning heavy oil products [47,48].
Gas consumption is uneven and varies by month of the year, day of the week, and daily. Moreover, each category of consumers has its own characteristic curve of unevenness, which leads to a variable hydraulic regime [49] of gas networks during the period of change in thermal loads. The hydraulic regime of gas supply is controlled by maintaining a constant pressure [50] in certain parts of the network, regardless of the intensity of gas consumption. A feature of gas distribution networks is the absence of superchargers. Therefore, at the entrance to the network, the gas has a significant overpressure. The required pressure in the gas network is provided by reductions in the GDS, GCP, and GCU. In addition, gas distribution stations and hydraulic fracturing devices are provided for shutting off the gas supply in case of an unacceptable increase or decrease in pressure in the network [51].

2.2. The Physical Properties of the Pumped Gas

For optimal operation of the gas distribution system, it is necessary to know the gas composition, which is determined from the average component composition of natural gas, depending on the field. It is also necessary to calculate the characteristics of the gaseous fuel. The characteristics of natural gas are presented in Table 1 and Table 2.
When gas is burned, water vapor does not condense but is removed with other combustion products; therefore, the calculation must be carried out according to the net calorific value of the gas, which is given in Table 3. The calorific value (higher or lower) of dry gaseous fuel (gas) is determined by the formula:
Q c = ( Q 1 x 1 + Q 2 x 2 + Q k x k ) 100 ,   ( kJ / m 3 )
where Qc is the heat of combustion value of dry gas, kJ/m3; Q1, Q2, and Qk are the heats of combustion of the components that make up the gaseous fuel kJ/m3; and x1, x2, and x3 are the volume fractions of the components that make up the gaseous fuel by percent.
The density of dry gas is defined as the sum of the products of the densities of the components that make up the gaseous fuel and their volume fractions:
p = ( p 1 x 1 + p 2 x 2 + + p k x k ) 100 ,   ( kg / m 3 )
where p is the dry gas density in kg/m3 and p1, p2,…, pk are the component densities in kg/m3.
The relative density of dry gas in air is:
p d e n s i t y = p d r y a i r p a i r ,
where p a i r = 1.293 isthe air density under normal conditions in kg/m3.

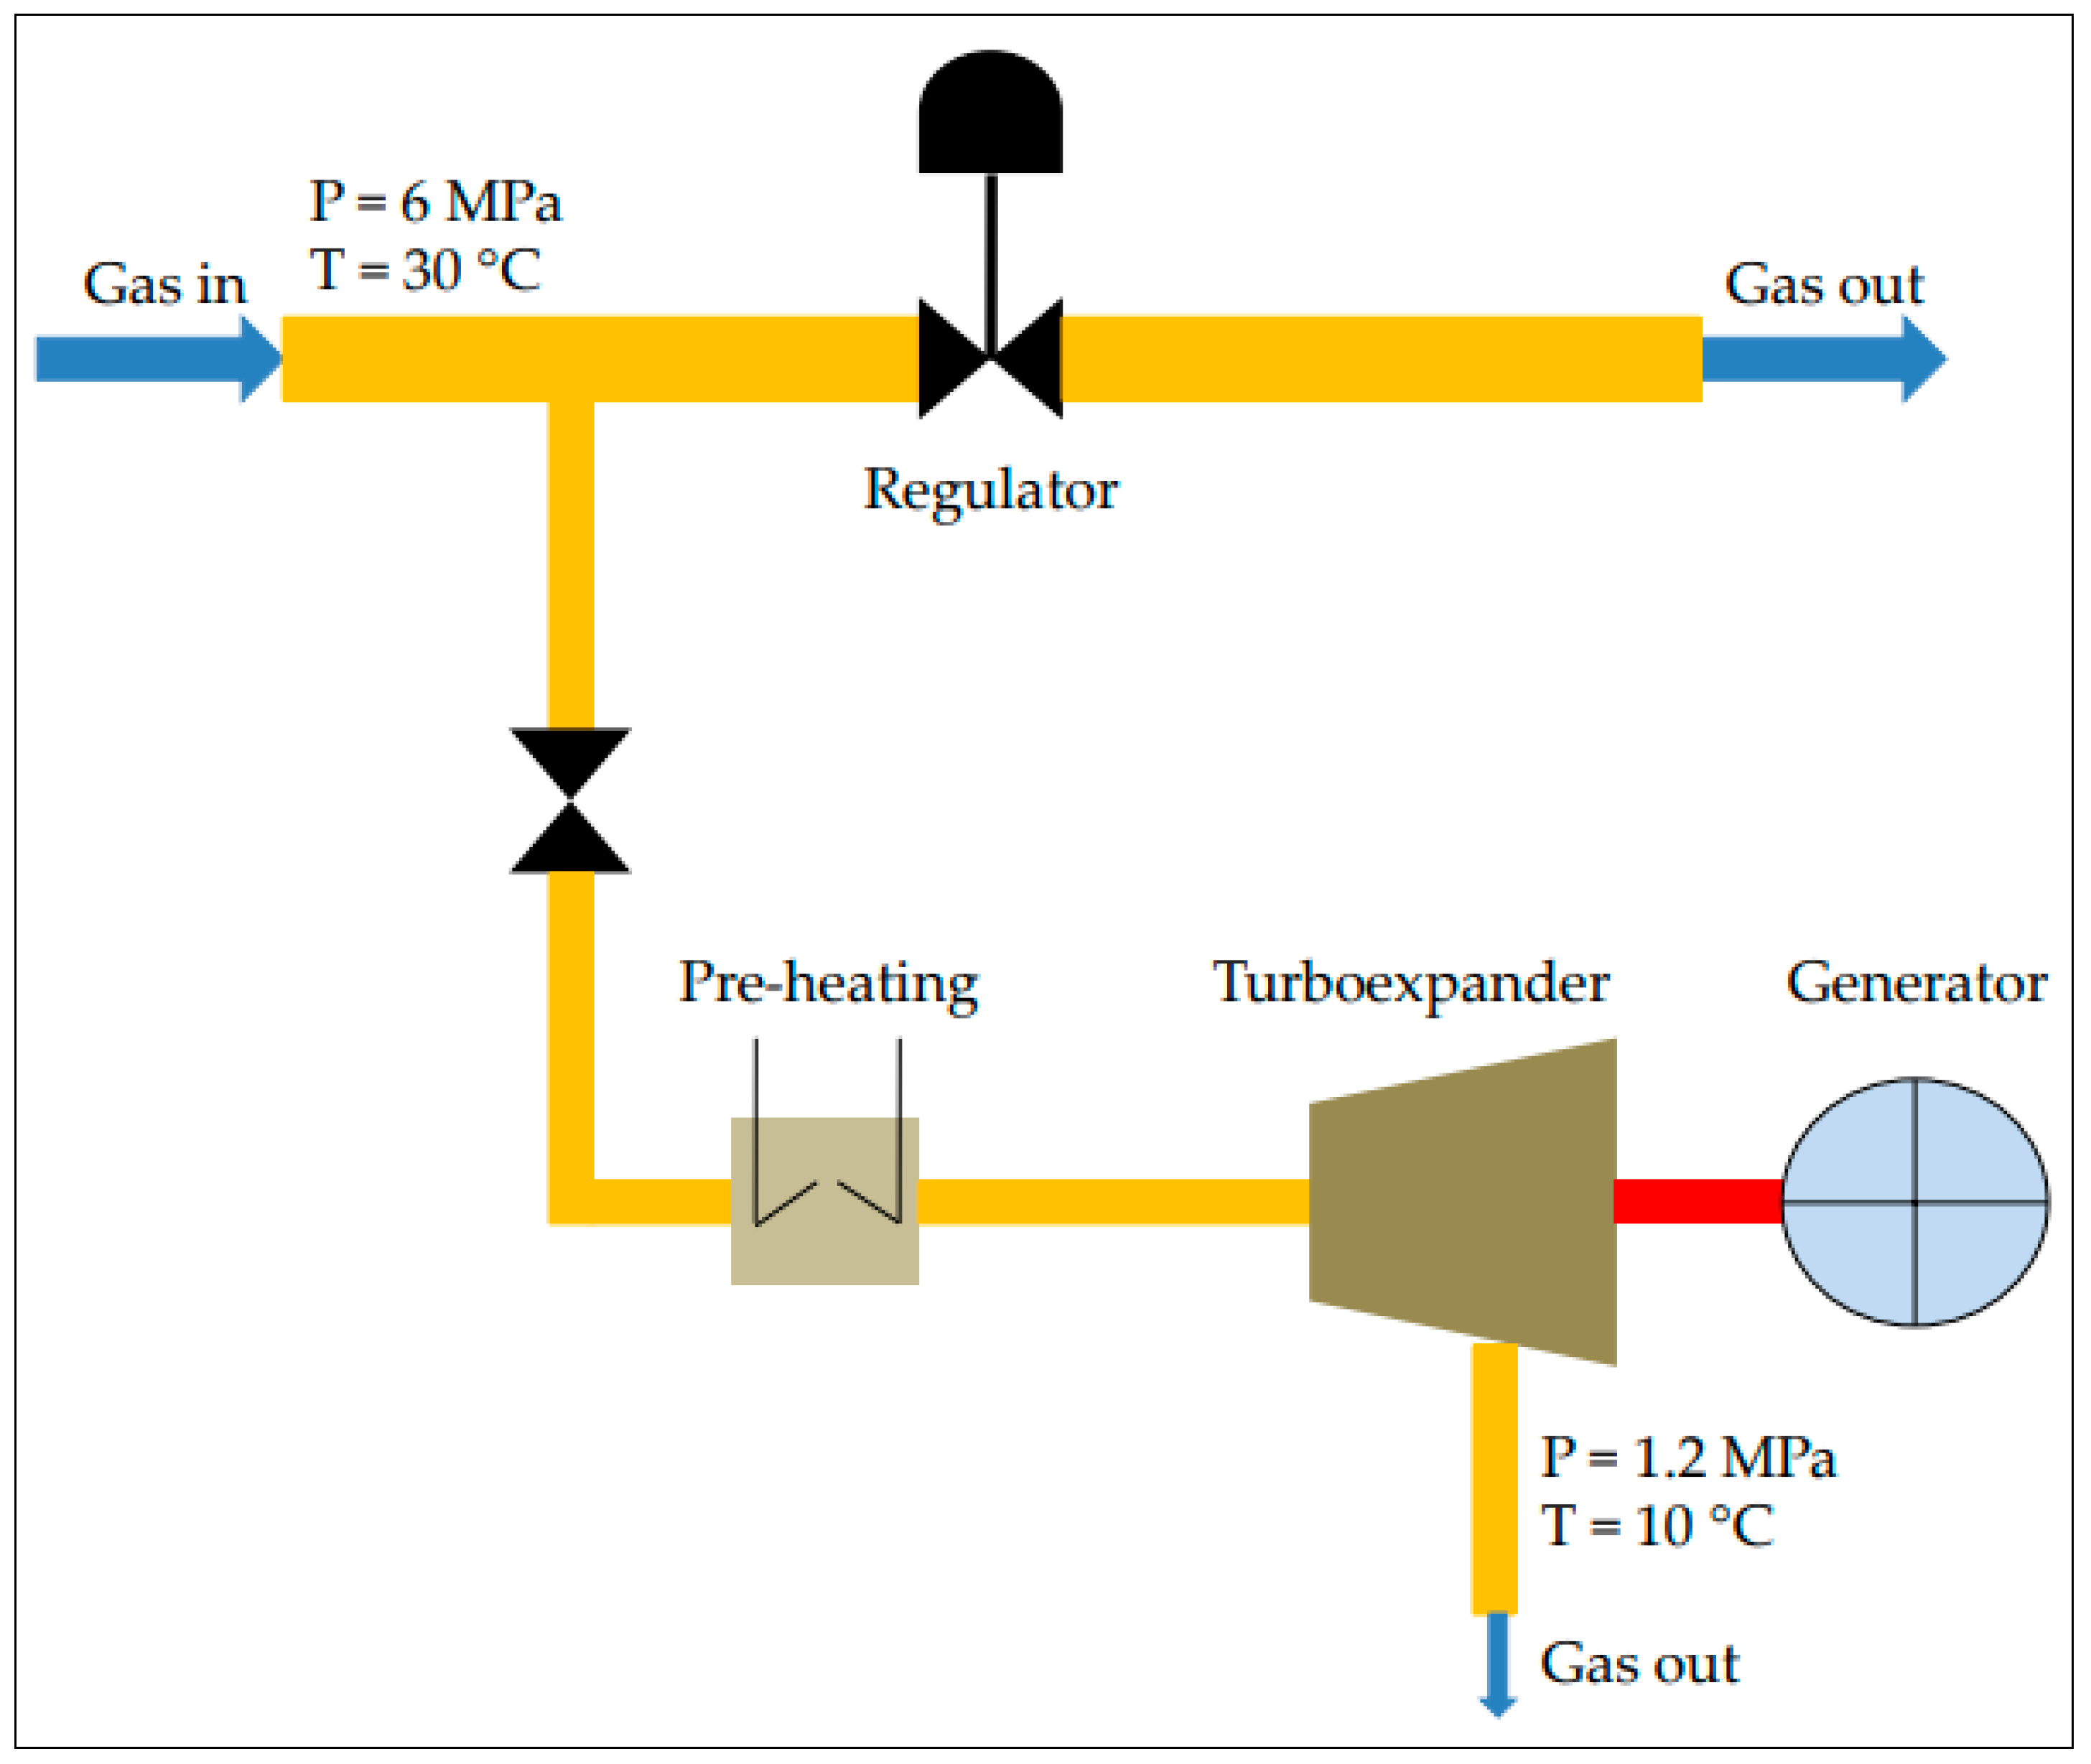
2.3. The Choice and Justification of the Gas Supply System

The nature of gas consumers who require gas at the appropriate pressure, as well as the length and load of gas pipelines, influence the city’s choice of gas supply system. The more diverse the gas consumers and the greater the length and load of gas pipelines, the more complex the gas supply system will be.
So, for cities with a population of up to 500 thousand people, the most economically feasible system is a two-stage system. For large cities with a population of more than one million people and the presence of large industrial enterprises, a three- or multi-stage system is preferable (Figure 2).
Gas pipeline routes are designed based on the minimum length of the network. At the same time, high-pressure gas pipelines are being laid along the outskirts of the city, where there is a low population density and a smaller number of underground structures.
The choice of the optimal number of GDSs for the city is one of the most important issues. With an increase in the number of GDSs, the loads and the range of city highways decrease, which leads to a decrease in their diameters and a decrease in the cost of metal. However, an increase in the number of GDSs increases the cost of their construction and the construction of main gas pipelines supplying gas to the GDS, and operating costs increase due to the maintenance of the service personnel of the GDS (Figure 3).
The GDS is located outside the city limits as a rule for security purposes [12]. If the number of GDSs is more than one, then they are located on different sides of the city. They are connected by two strings of gas pipelines, which ensure a higher reliability of gas supply to the city. Very large gas consumers, such as thermal power plants, industrial enterprises, metallurgical plants, etc., consume gas for their own needs directly from the GDS.

3. Results

3.1. Calculation in Emergency Modes

When the parts of the gas pipeline next to feed point 0 do not work (see Figure 4), the gas pipeline operation goes into emergency mode.
In our case, these are sections 1 and 18 of Figure 2. Gas supply to consumers in emergency conditions should be carried out through a dead-end network with the condition that the gas pressure at the last consumer must be maintained within P2 = 0.2 MPa. The calculation results are presented in Table 4 and Table 5. The gas consumption at the sites is determined by the formula:
V p = 0.59 · ( K i · V i ) ,         h h h h h         ( m 3 / h )
where K i is the security factor for various gas consumers and V i is hourly gas consumption at the corresponding consumer in m3/h.
For simplicity, the security factor is taken to be equal to 0.8 for all gas consumers. The estimated length of the gas pipeline sections is determined by the equation:
l p = 1.1 · l ,   km
The average specific difference of pressure squares in the first emergency mode is:
A i = 0.7 2 0.25 2 1.1 · 6.06 = 0.064 ,   ( Mpa / km ) ;
l i = 6.06 ,   ( km ) .
where A i is the average specific difference of squared pressures and l i is the sum of the lengths of all sections in the calculated direction in km. Coefficient 1.1 is a virtual increase in the length of the gas pipeline to compensate for various local resistances (turns, gate valves, compensators, etc.).
The calculation is correct. The tolerance is 2% of 5%. We proceed to the calculation of the second emergency mode.
The calculation is correct. The tolerance is 2.9% of 5%. The difference in calculations within 3–5% is acceptable. Knowing the pressure loss in each section, we determine the absolute pressure at each point in both emergency modes:
P i = P 1 2 P 1 2 P 2 2 i ,   ( MPa )
where P 1 2 P 2 2 is the sum of the difference in the squares of the pressures in the areas preceding the pressure determination point in MPa. All calculations for determining pressures at various points of gas consumption are summarized in Table 6.
The gas pressure at the points of connection to the consumer ring must be known in order to determine the diameters of the branches in the hydraulic calculation of the latter.

3.2. Hydraulic Calculation of Dead-End Low-Pressure Gas Pipelines

The low-pressure dead-end gas pipelines are laid inside residential buildings, inside production shops, and across the territory of small rural-type settlements (Figure 5).
Such gas pipelines are powered by low-pressure gas distribution points. A feature of the calculation here is that when determining pressure losses in vertical sections, it is necessary to take into account additional overpressure due to the difference in gas and air densities:
P = ± h · ρ a i r ρ g a s · g , ( MPa )
where h is the difference between the geometric marks at the end and beginning of the gas pipeline, m; ρ a i r and   ρ g a s are the density of air and gas under normal conditions, kg/m3; and g is the free fall acceleration, m/s2.
For natural gas, which is lighter than air, when it moves up the gas pipeline, the value of ∆P is negative, and when it moves down, it is positive.
Local resistance can be taken into account by introducing friction allowances:
l p = l i · 1 + a 100 ,     ( km )
where a is the percentage markup.
The following percentage surcharges are recommended: on gas pipelines from the entrance to the building to the riser, 25%; on risers, 20%; on the inside of the apartment wiring with a length of 1–2 m, 450%; with a length of 3–4 m, 200%; with a length of 5–7 m, 120%; and with a length of 8–12 m, 50%.

3.3. Determination of the Main Direction of Gas

Tocalculate the main direction of gas supply to the city, it is necessary to determine the estimated gas consumption for each section of the main direction according to the formula:
V p = V h · K i ,   ( m 3 / h )
where V h   is the maximum hourly gas consumption of the corresponding consumer, m3/h, V h = 1.17 (m3/h); and K i is the simultaneity factor, taking into account the probability of simultaneous operation of all consumers.
Determine the specific pressure drop in the main direction:
A = P / l p i ,   ( MPa / km )
A = 8.1871385 ,   ( MPa / km )
The next step is to determine the diameters of the gas pipeline sections in the main direction and clarify the specific pressure drop in each section in accordance with the selected standard pipeline diameter. For comparison with the allowable pressure loss in the gas pipeline, it is necessary to calculate the algebraic sum of pressure losses on the pipeline and additional overpressure. The criterion for the correctness of the calculation is the condition:
P i ± P + P P i ,   ( MPa )
where P i is the sum of pressure losses in all sections of the pipeline, Pa; ∆P is additional overpressure in the gas pipeline, Pa; P is loss of gas pressure in the gas-using device, Pa; and P i is given pressure drop, Pa. P i ± P + P = 338.24462 (Pa). The tolerance is 3.36%. The deviation P i ± P + P from ∆P should not exceed 10%. The calculation is correct. We finally accept the following diameters of the gas pipeline in the sections of the main direction: 10–15: 21.3 × 2.8 mm; 9–10: 21.3 × 2.8 mm; 8–9: 21.3 × 2.8 mm; 7–8: 21.3 × 2.8 mm; 6–7: 21.3 × 2.8 mm; 1–6: 21.3 × 2.8 mm; and 0–1: 21.3 × 2.8 mm.
Other gas ducts carry similar loads and are identical in design to the calculated one. Therefore, the diameters of the gas pipeline in these sections are taken to be the same as those calculated. As the construction of gas distribution networks continues to grow with the growing demand for natural gas to power cities, the complexity of these systems is also increasing. To avoid the irreversible costs of investment decisions, specialists in the gas industry are trying to find energy efficient solutions to ensure the operation of one gas supply network for many years. Moreover, searches are underway to improve the efficient operation of the GDS in ensuring the life of the stations and the efficient distribution of gas to the system. Therefore, it is important to develop an optimal calculation method that will satisfy the variable demand during seasonal gas consumption. This calculation must also take into account all system parameters, as well as changing operating conditions over time in accordance with the growing global demand for gas. The developed tool for optimizing the calculation of gas consumption is important for making strategic and operational decisions during seasonal consumption planning.

4. Discussion

In the gas distribution network, the GDS is the main structure that sends gas to the city. Its main job is to reduce pressure and keep it at a certain level [52], which is called “gas reduction.”
Gas reduction is a process in which the characteristics of the gas mixture change, such as pressure, temperature, entropy, and enthalpy [53]. This process is irreversible (the entropy of the system increases), and this leads to a decrease in system performance. The energy potential of natural gas is irretrievably lost. In the GDS under consideration, the reduction goes through standard pressure regulators to two production pipelines (Figure 6).
When introduced into the scheme of the expander–generator unit, shown in Figure 7, this potential can be converted into a useful resource.
The next step is to calculate the power of the expander–generator set. Let us determine the individual gas constant R, kJ/kg∙K, for the gas mixture of natural gas:
R = R u M g a s , kj / kg · K
Unit conversion: 1 J/kg∙K = 5.97994 ft lb./slug °R, and 1 ft lb./slug °R = 0.167226 J/kg∙K.
The Universal Gas Constant ( R u ) which appears in the ideal gas lawcan be expressed as the product between the Individual Gas Constant (R) and the Molecular Weight ( M g a s ) for the gas.
Because gas consumption varies according to season and almost never reaches a throughput of 20,000 m3/h in real operating conditions, additional calculations are performed considering the condition of the dynamics of gas consumption seasonality (Table 7).
According to the GDS capacity depending on the seasonsin2021, there was a constant graphical dependence of the amount of electricity generated per hour on the seasonsin2021 (Figure 8).
According to the schedule, it can be determined that regardless of the month of gas consumption, the amount of electricity generated exceeded the electricity needs of the GDS (red line), even in the summer period of operation, when gas consumption was minimal. It can be concluded that with the introduction of the technology of the expander–generator unit, it is possible to provide electricity to the GDS all year round, and with high gas consumption, there is an excess of electricity, making it possible to provide electricity to part of the industrial site of the same enterprise. It follows from this that this technical solution is effective based on low gas consumption costs.

5. Conclusions

In this study, an approach was proposed to optimize the operation of gas flow calculation for consumers to help gas operators expand due to changing conditions. The solution to this problem will help decision-makers determine the location and capacity of the GDS, the need to build new gas distribution pipelines, as well as planning the introduction of new gas distribution systems. The goal was to find the optimal operating conditions for any gas network. The objectives under consideration were to maximize the rate of gas supply in the system and minimize the energy consumption of the gas distribution station, considering daily restrictions. Two types of continuous decision variables were considered: the pressure in the network and the frequency of GDSs. Case studies are the most common topologies that exist in a real-life urban gas supply system and provide the basis for the study of large and complex networks that are a combination of these typical topologies with active gas consumption. The results in this study show that this method will enable the implementation of tools for testing various management strategies for the gas distribution network. Therefore, a sensitivity analysis was performed to determine the effect of changing parameters. It is also recommended that in the future, studies can be carried out on the optimization of large-scale gas networks and solve additional tasks. The results of the study can be applied in practice when implementing the technological scheme to optimize the work of the gas distribution network.

Author Contributions

V.F.: Conceptualization, Methodology, Formal analysis, Investigation, Project administration, Supervision, Writing—original draft, and Writing—review and editing. A.V.S.: Conceptualization, Supervision, Data curation, Formal analysis, and Writing—review and editing. S.A.M.: Formal analysis and Writing—review and editing. V.K.T.: Conceptualization, Formal analysis, Supervision, and Writing—review and editing. C.S.: Formal analysis, Supervision, and Writing—review and editing. All authors have read and agreed to the published version of the manuscript.

Funding

This research received no external funding.

Institutional Review Board Statement

Not applicable.

Informed Consent Statement

Not applicable.

Data Availability Statement

Not applicable.

Conflicts of Interest

The authors declare no conflict of interest.

Abbreviations

Qcthe heat of combustion value of dry gas, kJ/m3
Q1,Q2,Q3,Qkthe heat of combustion of the components that make up the gaseous fuel, kJ/m3
x1,x2,x3the volume fractions of the components that make up the gaseous fuel, %
pthe density of dry gas, kg/m3
p1, p2,…, pkthe densities of the components, kg/m3
Vhthe maximum hourly gas consumption of the corresponding consumer, m3/h, Vh = 1.17 (m3/h)
Kithe simultaneity factors
∑∆Pithe sum of pressure losses in all sections of the pipeline, Pa
∆Padditional overpressure in the gas pipeline, Pa
Ploss of gas pressure in the gas-using device, Pa
Pigiven pressure drop, Pa
MPamegapascal
GDSgas distribution stations
GCPgas control points
GCUgas control units
DDSIthe disconnecting device on the subscriber inlet
DDEGPBdisconnecting device at the entrance of the gas pipeline to the building

References

  1. Abeysekera, M.; Wu, J.; Jenkins, N.; Rees, M. Steady state analysis of gas networks with distributed injection of alternative gas. Appl. Energy 2016, 164, 991–1002. [Google Scholar] [CrossRef] [Green Version]
  2. Cui, G.; Jia, Q.-S.; Guan, X.; Liu, Q. Data-driven computation of natural gas pipeline network hydraulics. Results Control Optim. 2020, 1, 100004. [Google Scholar] [CrossRef]
  3. Farzaneh-Gord, M.; Rahbari, H.R. Unsteady natural gas flow within pipeline network, an analytical approach. J. Nat. Gas Sci. Eng. 2016, 28, 397–409. [Google Scholar] [CrossRef]
  4. Brkić, D. An improvement of Hardy Cross method applied on looped spatial natural gas distribution networks. Appl. Energy 2009, 86, 1290–1300. [Google Scholar] [CrossRef] [Green Version]
  5. Bagajewicz, M.; Valtinson, G. Computation of Natural Gas Pipeline Hydraulics. Ind. Eng. Chem. Res. 2014, 53, 10707–11072. [Google Scholar] [CrossRef]
  6. Brkić, D.; Praks, P. An Efficient Iterative Method for Looped Pipe Network Hydraulics Free of Flow-Corrections. Fluids 2019, 4, 73. [Google Scholar] [CrossRef] [Green Version]
  7. Farzaneh-Gord, M.; Reza Rahbari, H. Response of natural gas distribution pipeline networks to ambient temperature variation (unsteady simulation). J. Nat. Gas Sci. Eng. 2018, 52, 94–105. [Google Scholar] [CrossRef]
  8. Lustenberger, P.; Schumacher, F.; Spada, M.; Burgherr, P.; Stojadinovic, B. Assessing the Performance of the European Natural Gas Network for Selected Supply Disruption Scenarios Using Open-Source Information. Energies 2019, 12, 4685. [Google Scholar] [CrossRef] [Green Version]
  9. Zhu, M.; Xu, C.; Dong, S.; Tang, K.; Gu, C. An integrated multi-energy flow calculation method for electricity-gas-thermal integrated energy systems. Prot. Control Mod. Power Syst. 2021, 6, 5. [Google Scholar] [CrossRef]
  10. Herrán-González, A.; De La Cruz, J.M.; De Andrés-Toro, B.; Risco-Martín, J.L. Modeling and simulationof a gas distribution pipeline network. Appl. Math. Model. 2009, 33, 1584–1600. [Google Scholar] [CrossRef]
  11. Schipachev, A.; Fetisov, V.; Nazyrov, A.; Donghee, L.; Khamrakulov, A. Study of the Pipeline in Emergency Operation and Assessing the Magnitude of the Gas Leak. Energies 2022, 15, 5294. [Google Scholar] [CrossRef]
  12. Vasiliev, G.G.; Dzhaljabov, A.A.; Leonovich, I.A. Analysis of the causes of engineering structures deformations at gas industry facilities in the permafrost zone. J. Min. Inst. 2021, 249, 377–385. [Google Scholar] [CrossRef]
  13. Vasilyev, G.G.; Vasilyev, G.G.; Leonovich, I.A.; Latifov, K.A. On the methodology of risk-oriented standardization of safety parameters at the design and construction of gas and oil pipelines. Labor Saf. Ind. 2019, 2, 84–90. [Google Scholar] [CrossRef]
  14. Reddy, H.P.; Narasimhan, S.; Bhallamudi, S.M. Simulation and State Estimation of Transient Flow in Gas Pipeline Networks Using a Transfer Function Model. Ind. Eng. Chem. Res. 2006, 45, 3853–3863. [Google Scholar] [CrossRef]
  15. Li, T.; Liu, P.; Li, Z. Modelling and optimization of a natural gas supply system at a transient stage: A case study of China. BMC Energy 2019, 1, 5. [Google Scholar] [CrossRef] [Green Version]
  16. Belousov, A.E.; Ovchinnikov, E.S. Mathematical Modeling of the Operation of an Expander-Generator Pressure Regulator in Non-Stationary Conditions of Small Gas Pressure Reduction Stations. Mathematics 2022, 10, 393. [Google Scholar] [CrossRef]
  17. Möller, B.; Lund, H. Conversion of individual natural gas to district heating: Geographical studies of supply costs and consequences for the Danish energy system. Appl. Energy 2010, 87, 1846–1857. [Google Scholar] [CrossRef]
  18. Shan, X.; Wang, P.; Lu, W. The reliability and availability evaluation of repairable district heating networks under changeable external conditions. Appl. Energy 2017, 203, 686–695. [Google Scholar] [CrossRef]
  19. van der Linden, R.; Blokland, H.; Busking, T. Security of Supply in Gas and Hybrid Energy Networks. Energies 2021, 14, 792. [Google Scholar] [CrossRef]
  20. Nikolaev, A.K.; Zaripova, N.A. Substantiation of analytical dependences for hydraulic calculation of high-viscosity oil transportation. J. Min. Inst. 2021, 252, 885–895. [Google Scholar] [CrossRef]
  21. Faghri, A.; Zhang, Y. Generalized governing equations for multiphase systems: Averaging formulations. In Transport Phenomena in Multiphase Systems; Faghri, A., Zhang, Y., Eds.; Academic Press: Cambridge, MA, USA, 2006; pp. 238–330. [Google Scholar] [CrossRef]
  22. Wichterle, K.; Večeř, M. (Eds.) The steady unidirectional flow. In Transport and Surface Phenomena; Elsevier: Amsterdam, The Netherlands, 2020; pp. 127–145. [Google Scholar] [CrossRef]
  23. Wichterle, K.; Večeř, M. (Eds.) The basics of steady heat conduction and diffusion. In Transport and Surface Phenomena; Elsevier: Amsterdam, The Netherlands, 2020; pp. 147–157. [Google Scholar] [CrossRef]
  24. Su, H.; Zhang, J.; Zio, E.; Yang, N.; Li, X.; Zhang, Z. An integrated systemic method for supply reliability assessment of natural gas pipeline networks. Appl. Energy 2018, 209, 489–501. [Google Scholar] [CrossRef]
  25. Martirosyan, A.V.; Ilyushin, Y.V.; Afanaseva, O.V. Development of a Distributed Mathematical Model and Control System for Reducing Pollution Risk in Mineral Water Aquifer Systems. Water 2022, 14, 151. [Google Scholar] [CrossRef]
  26. Brkić, D. Iterative Methods for Looped Network Pipeline Calculation. Water Resour. Manag. 2011, 25, 2951–2987. [Google Scholar] [CrossRef] [Green Version]
  27. An, Y.; Wang, Y.; Yue, B.; Jin, S.; Wu, L.; Qu, Z. A novel method for natural gas pipeline safety online monitoring based on acoustic pulse compression. Process Saf. Environ. Prot. 2019, 130, 174–181. [Google Scholar] [CrossRef]
  28. Litvinenko, V.; Bowbrick, I.; Naumov, I.; Zaitseva, Z. Global guidelines and require-ments for professional competencies of natural resource extraction engineers: Implications for ESG principles and sustainable development goals. J. Clean. Prod. 2022, 338, 130530. [Google Scholar] [CrossRef]
  29. Yang, N.; Qin, T.; Wu, L.; Huang, Y.; Huang, Y.; Xing, C.; Zhang, L.; Zhu, B. A multi-agent game based joint planning approach for electricity-gas integrated energy systems considering wind power uncertainty. Electr. Power Syst. Res. 2022, 204, 107673. [Google Scholar] [CrossRef]
  30. Tchórzewska-Cieślak, B.; Pietrucha-Urbanik, K.; Urbanik, M.; Rak, J.R. Approaches for Safety Analysis of Gas-Pipeline Functionality in Terms of Failure Occurrence: A Case Study. Energies 2018, 11, 1589. [Google Scholar] [CrossRef]
  31. Ullah, Z.; Wang, X.; Chen, Y.; Zhang, T.; Ju, H.; Zhao, Y. Time-Domain Output Data Identification Model for Pipeline Flaw Detection Using Blind Source Separation Technique Complexity Pursuit. Acoustics 2019, 1, 13. [Google Scholar] [CrossRef] [Green Version]
  32. Zhu, B.; Yang, X.; Wang, J.; Shao, C.; Li, F.; Hong, B.; Song, D.; Guo, J. Third-Party Damage Model of a Natural Gas Pipeline Based on a Bayesian Network. Energies 2022, 15, 6067. [Google Scholar] [CrossRef]
  33. Morales, J.; Yu, W. Improving neural network’s performance using Bayesian inference. Neurocomputing 2021, 461, 319–326. [Google Scholar] [CrossRef]
  34. El-Shiekh, T.M. The Optimal Design of Natural Gas Transmission Pipelines. Energy Sources Part B Econ. Plan. Policy 2013, 8, 7–13. [Google Scholar] [CrossRef]
  35. Farzaneh-Gord, M.; Reza Rahbari, K.; Bajelan, M.; Pilehvari, L. Investigation of hydrate formation in natural gas flow through underground transmission pipeline. J. Nat. Gas Sci. Eng. 2013, 15, 27–37. [Google Scholar] [CrossRef]
  36. Guo, Q.; Liu, Y.; Yang, Y.; Song, T.; Wang, S. Improved Adaptive Time Step Method for Natural Gas Pipeline Transient Simulation. Energies 2022, 15, 4961. [Google Scholar] [CrossRef]
  37. Fan, D.; Gong, J.; Zhang, S.; Shi, G.; Kang, Q.; Xiao, Y.; Wu, C. A transient composition tracking method for natural gas pipe networks. Energy 2021, 215, 119131. [Google Scholar] [CrossRef]
  38. Yu, W.; Wen, K.; Li, Y.; Huang, W.; Gong, J. A Methodology to Assess the Gas Supply Capacity and Gas Supply Reliability of a Natural Gas Pipeline Network System. In Proceedings of the 2018 ASME 12th International Pipeline Conference, 2: Pipeline Safety Management Systems, Project Management, Design, Construction, and Environmental Issues, Strain Based Design, Risk and Reliability; Northern Offshore and Production Pipelines, Calgary, AL, Canada, 24–28 September 2018. [Google Scholar] [CrossRef]
  39. Yu, W.; Song, S.; Li, Y.; Min, Y.; Huang, R.; Wen, K.; Gong, J. Gas supply reliability assessment of natural gas transmission pipeline systems. Energy 2018, 162, 853–870. [Google Scholar] [CrossRef]
  40. Behrooz, H.A.; Boozarjomehry, R.B. Modeling and state estimation for gas transmission networks. J. Nat. Gas Sci. Eng. 2015, 22, 551–570. [Google Scholar] [CrossRef]
  41. Chaczykowski, M.; Sund, F.; Zarodkiewicz, P.; Mongstad Hope, S. Gas composition tracking in transient pipeline flow. J. Nat. Gas Sci. Eng. 2018, 55, 321–330. [Google Scholar] [CrossRef]
  42. Lurie, M.V.; Musailov, I.T.; Lysenko, N.O. The Effective Method of Calculating Gas Leaks through Holes in the Walls of Gas Pipelines and High-Pressure Vessels. TerritorijaNeftegas Oil and Gas Territory. 2020. Available online: https://tng.elpub.ru/jour/article/view/1136/985 (accessed on 26 October 2022).
  43. Wang, P.; Yu, B.; Han, D.; Sun, D.; Xiang, Y. Fast method for the hydraulic simulation of natural gas pipeline networks based on the divide-and-conquer approach. J. Nat. Gas Sci. Eng. 2018, 50, 55–63. [Google Scholar] [CrossRef]
  44. Oosterkamp, A.; Helgaker, J.F.; Ytrehus, T. Modelling of Natural Gas Pipe Flow with Rapid Transients-case Study of Effect of Ambient Model. Energy Procedia 2015, 64, 101–110. [Google Scholar] [CrossRef] [Green Version]
  45. Mikolajková, M.; Haikarainen, C.; Saxén, H.; Pettersson, F. Optimization of a natural gas distribution network with potential future extensions. Energy 2017, 125, 848–859. [Google Scholar] [CrossRef]
  46. Schmidt, M.; Steinbach, M.C.; Willert, B.M. High detail stationary optimization models for gas networks. Optim. Eng. 2015, 16, 131–164. [Google Scholar] [CrossRef]
  47. Kudaisya, S.K.; Kar, S.K. A Comprehensive Review of City Gas Distribution in India. In Natural Gas Markets in India; Kar, S., Gupta, A., Eds.; Springer: Singapore, 2017. [Google Scholar] [CrossRef]
  48. Fadeev, A.; Komendantova, N.; Cherepovitsyn, A.; Tsvetkova, A.; Paramonov, I. Methods and priorities for human resource planning in oil and gas projects in Russia and OPEC. OPEC Energy Rev. 2021, 45, 365–389. [Google Scholar] [CrossRef]
  49. Morenov, V.; Leusheva, E.; Lavrik, A.; Lavrik, A.; Buslaev, G. Gas-Fueled Binary Energy System with Low-Boiling Working Fluid for Enhanced Power Generation. Energies 2022, 15, 2551. [Google Scholar] [CrossRef]
  50. Bolobov, V.I.; Latipov, I.U.; Popov, G.G.; Buslaev, G.V.; Martynenko, Y.V. Estimation of the Influence of Compressed Hydrogen on the Mechanical Properties of Pipeline Steels. Energies 2021, 14, 6085. [Google Scholar] [CrossRef]
  51. Atroshchenko, V.A.; Avksentiev, S.Y.; Makharatkin, P.N.; Trufanova, I.S. Experimental hydrotransportation unit for testing material resistance of pipelines and parts of dredging pumps to hydro-abrasive wear. Obogas. Rud 2021, 2021, 39–45. [Google Scholar] [CrossRef]
  52. Ríos-Mercado, R.Z.; Borraz-Sánchez, C. Optimization problems in natural gas transportation systems: A state-of-the-art review. Appl. Energy 2015, 147, 536–555. [Google Scholar] [CrossRef]
  53. Schipachev, A.M.; Dmitrieva, A.S. Application of the resonant energy separation effect at natural gas reduction points in order to improve the energy efficiency of the gas distribution system. J. Min. Inst. 2021, 248, 253–259. [Google Scholar] [CrossRef]
Figure 1. Schematic diagram of the urban gas supply system.
Energies 16 00060 g001
Figure 2. The calculation diagram of a high-pressure ring gas pipeline.
Energies 16 00060 g002
Figure 3. The diagram of a gas distribution station.
Energies 16 00060 g003
Figure 4. The calculation scheme of the gas pipeline.
Energies 16 00060 g004
Figure 5. The gas supply scheme for residential buildings.
Energies 16 00060 g005
Figure 6. Gas reduction unit.
Energies 16 00060 g006
Figure 7. Scheme of the expander–generator unit.
Energies 16 00060 g007
Figure 8. The amount of electricity generated for GDS.
Energies 16 00060 g008
Table 1. The composition of natural gas by volume for various fields.
The Component of Natural GasCH4C2H6C3H8C4H10C5H12N2CO2H2S
Natural gas fieldShtokmanovskoye, Murmansk region
% content98.70.330.120.040.010.70.1-
Natural gas fieldMedvezhye, Tyumen region
% content990.10.005--0.80.095-
Natural gas fieldVaneyviskoe, Arkhangelsk region
% content89.592.420.70.271.163.931.680.25
Natural gas fieldZapolyarnoye, Tyumen region
% content98.50.20.050.0120.0010.70.5-
Natural gas fieldBovanenkovo, Yamalo-Nenets Autonomous Okrug
% content80.232.641.150.70.7113.80.73-
Natural gas fieldAngaro-Lenskoe, Irkutsk Region
% content93.120.40.20.34--
Table 2. Physical characteristics of the natural gas.
Composition of the Natural GasThe Density, kg/m3 at a
Temperature = 0 °C, P = 101.3 kPa
The Relative Density by Air
123
Methane CH40.71680.5545
Ethane C2H61.35661.049
Propane C3H82.0191.562
Butane C4H102.7032.091
i-sobutane C5H122.6682.064
Nitrogen N21.25050.9673
Carbon dioxide CO21.97681.5291
Hydrogen sulfide H2S1.53921.1906
Table 3. The combustion heat of pure combustible gases.
TheNaturalGasThe Combustion Heat
HigherLower
MJ/m3 at a Temperature = 0 °C and 101.3 kPa
123
CH439.8635.84
C2H670.4263.73
C3H8101.7493.37
C4H10133.98123.77
C5H12131.89121.84
CO212.6412.64
H2S25.4623.49
Table 4. Emergency mode at area 1 (Refusal at area 1).
№ AreadN
(Diameter) mm
lp
(Length)
km
VP
(Gas Flow)
m3/h
(P21−P22)/lP(m)
(Pressure)
MPa
P21−P22,
(Pressure)
MPa
123456
185000.07710,053.8310.0450.003465
175001.8489849.45010.040.07392
165000.4079809.21920.040.01628
155000.7269796.5790.040.02904
144000.0779787.36320.190.01463
134000.4739785.69090.190.08987
124000.2539745.460.180.04554
112500.0442566.84030.10.0044
102500.1212554.20020.10.0121
92500.221665.17870.0530.01166
82500.1211663.50640.0530.006413
72500.1761459.12570.0450.00792
62500.1541449.90990.0450.00693
52500.9131437.26970.0450.041085
42000.451903.33390.0450.020295
31500.154901.66160.20.0308
21000.36312.640160.0310.011253
l p = 6.578, (km) P 1 2 P 2 2 = 0.425601 , (MPa)
P 2 = 0.7 2 0.425601 0.1 = 0.1537696 , (Pa)
Table 5. Emergency mode at area 18.
Refusal at Area 18

Area
dN
(Diameter) mm
lp
(Length)
km
VP
(Gas Flow)
m3/h
(P21−P22)/lp(m)
(Pressure)
MPa
P21−P22,
(Pressure)
MPa
123456
15000.2210,053.8310.0450.0099
25000.23110,041.1910.0450.010395
35000.1549152.16920.0380.005852
45000.4519150.49690.0380.017138
54000.9138616.56110.10.0913
64000.1548603.92090.10.0154
74000.1768594.70510.10.0176
84000.1218390.32440.10.0121
94000.228388.65210.10.022
104000.1217499.63070.0850.010285
114000.0447486.99050.0850.00374
121250.253308.370820.0850.021505
131250.473268.13990.060.02838
141250.077266.46760.060.00462
151250.726257.25180.060.04356
161250.407244.611690.060.02442
171251.903204.380720.0450.085635
l p = 6.644, (km) P 1 2 P 2 2 = 0.42383 , (MPa)
P 2 = 0.7 2 0.42383 0.1 = 0.1572353 ,   (MPa)
Table 6. Calculation in case of the area failure.
Point Number on the RingThe Gas Pipeline Accident at Area 1The Gas Pipeline Accident at Area 19
Gas Pressure, MPaGas Pressure, MPa
00.70.7
10.25376960.6928925
20.27504910.6853503
30.32626986810675
40.35601540.6683674
50.4096730.5961669
60.4180550.5831081
70.42741310.567816
80.43485050.5570592
90.44805690.5369497
100.46136210.5272855
110.46610620.523727
120.51263530.5027773
130.5938560.473714
140.60604870.4688123
150.62955140.4197916
160.64235120.3896216
170.69752060.2572353
Table 7. Capacity of GDS.
MonthJanuary 2021February 2021March 2021April 2021May 2021June 2021
Capacity of GDS, Q2, thousand. m3/h15.22512.13210.2439.8978.2234.867
MonthJuly 2021August 2021September 2021October 2021November 2021December 2021
Capacity of GDS, Q2, thousand. m3/h2.1852.1864.1055.86710.12516.225
Disclaimer/Publisher’s Note: The statements, opinions and data contained in all publications are solely those of the individual author(s) and contributor(s) and not of MDPI and/or the editor(s). MDPI and/or the editor(s) disclaim responsibility for any injury to people or property resulting from any ideas, methods, instructions or products referred to in the content.

