Abstract
Aiming at the impact of the uncertainty of source load on the optimal scheduling in an integrated energy system (IES), in this paper, based on hybrid resolution modeling and hybrid instruction cycle scheduling technology, three time scales of day-ahead, intra-day rolling and real-time feedback optimization scheduling models are established, respectively, with the objectives of the economic optimal daily operation of the system, the minimum sum of the operation cost of energy purchase and wind curtailment penalty cost in the rolling control time domain, and the minimum adjustment amount of equipment output power. Then, the chaotic gravitational search algorithm (CGSA) is used to solve the problem, and the composite coordination optimization operation strategy of IES with mixed time scales based on CGSA is proposed. In the example, the comparison between the multi-timescale scheduling plan and the actual output, the comparison of the system scheduling results under different strategies and the comparison of different optimization algorithms show that the proposed optimization operation strategy is beneficial to optimize the energy flow distribution, reduce the system operation cost, improve the IES economy and optimization speed.
1. Introduction
With the deterioration of social energy issues, the establishment of a comprehensive energy system with multi-energy complementary and efficient utilization has become the inevitable choice for the development of modern energy systems [1,2,3,4,5]. As one of the specific implementation forms of IES, the energy station is an important physical carrier to improve the energy structure of users and promote the construction of intelligent energy. Therefore, the formulation of a reasonable optimal scheduling strategy for energy stations is an effective means to improve the economy and energy utilization efficiency in the energy system. At present, due to the continuous increase of renewable energy power generation capacity and unsynchronous power grid construction, the difficulty of renewable energy consumption occurs, followed by the waste of wind, light and other phenomena [6,7,8,9]. Therefore, making full use of the absorption and storage technology of energy stations can improve the consumption capacity of renewable energy and increase the utilization rate of renewable energy [10,11,12,13].
The complex equipment coupling within IES and the uncertain nature of renewable energy and load pose a challenge to optimizing the operation of IES. In order to contribute to the flexible configuration and general modeling of IES, electrical, flue gas, steam, hot water and air as the basic bus are selected, the bus structure describing the composition and structure of the combined cooling are proposed, thermal and electric power supply system independent modeling for each equipment is conducted, and a 0–1 mixed integer linear programming model for day-ahead dynamic economic scheduling is established in [14]. A multi-objective optimization model for the integrated energy system design of electricity, heat and cold, from the aspects of economy and environment is established, and each component of the system is selected and configurated in [15]. Different optimization methods to solve the IES scheduling and planning model are used in the above literatures, but the advantages of IES in the absorption of renewable energy are not highlighted. The local consumption of renewable energy can be promoted through the formation of multiple absorption technology and multiple storage technology through IES. For this reason, a day-ahead optimal scheduling model aiming at the lowest operation cost for a multi-energy complementary microgrid system containing wind power and photovoltaic is established in [16,17]. The former focuses on the analysis of the potential of P2G (power to gas) to absorb renewable energy, while the latter realizes the absorption of new energy and the improvement of power supply reliability through the flexible adjustment ability of the energy storage system.
The literature [14,15,16,17] is based on accurate prediction of renewable energy, but in actual operation, it will deviate from the predicted value, thus reducing the effectiveness of IES scheduling results. In order to solve this problem, a scenario analysis method to describe the uncertainty of renewable energy output and load prediction is adopted in [18,19], a large number of wind power and load predicted value scenarios are generated, and deterministic optimization of multiple scenarios are carried out. Chance-constrained programming to describe the uncertainty in the power system is used in [20], so that the scheduling results can meet the actual operation requirements at a certain confidence level. However, the models established by these studies are approximate models, which cannot be applied to the online scheduling of IES in actual scenarios. An IES scheduling method based on MPC dynamic time interval are presented in [21], which could meet the changing requirements of scheduling interval. A dynamic time-scale scheduling strategy based on long short-term memory (LSTM) and multiple load forecasting errors is proposed in [22]. A real-time optimization scheduling method for online cold-thermo-electric microgrid is proposed in [23], which is based on the model predictive control (MPC) method with feedback correction mechanism to correct the prediction errors. However, due to the lack of day-ahead planning guidance, the optimization results are not globally optimal. In [24], Real-time energy optimization of the microgrid is carried out within days based on improved MPC and day-before optimization results. In [25], an energy management model with two-stage scheduling before day and in real time is proposed aiming at the collaborative optimization of generator-load-storage of IES. In [26], a two-stage optimization method is proposed to minimize the total cost containing the device investment, operation, carbon emission penalty and renewable energy curtailment penalty and further determine the capacity of such five devices. In [27], a multi-time-scale stochastic optimization model for microgrid with low operation cost and high reliability against these uncertainties is proposed. In [28], probabilistic energy management for the operation planning of multi-microgrid (MMG) systems is proposed and the proposed model considers both day-ahead and real-time scheduling to provide an effective framework in the presence of renewable energy sources. In [29], a novel multi-time-scale dynamic robust optimal scheduling strategy is proposed for the coordinated operation of a CCHP microgrid, which includes two time scales: the day-ahead scheduling scale and the intraday adjustment scale. In [30], a day-ahead, intraday, multi-time-scale economic scheduling method based on light robust optimization and model predictive control (MPC) is also proposed. The adaptive improvement of MPC can better ensure the robustness of the system and the accuracy of optimization, but there is no real-time feedback link, and the deviation scheduling results cannot be corrected in real time.
The IES coordinated optimization problem is a mixed nonlinear programming problem with multiple variables and multiple constraints. In view of the complexity of this problem, traditional optimization algorithms such as linear programming method, nonlinear programming method, Newton method and interior point method are usually used to solve it. However, with the access of a large number of distributed power sources, the traditional optimization algorithm has great limitations to solve the optimization problem containing discrete variables and multi-objectives. In order to make up for this shortcoming, in recent years, intelligent optimization algorithms such as particle swarm optimization (PSO), genetic algorithm (GA) and Tabu search algorithm have been widely used in reactive power optimization. However, in practical application, the above intelligent algorithm also has some shortcomings such as slow convergence speed and precocity.
Therefore, this paper proposes an energy optimization scheduling strategy for an integrated energy system based on multi-time-scale coordination. The strategy takes the optimal daily operation economy of the system, the minimum sum of energy purchase operation cost and wind abandoning penalty cost in the time domain of rolling control, and the minimum adjustment amount of equipment output power as the objectives to establish the optimal scheduling models of day-ahead, day–day rolling and real-time feedback in three time scales, respectively. Meanwhile, to overcome the drawbacks of traditional intelligent optimization algorithms, this paper uses a CGSA based on the GSA to solve the optimal model. The main innovations of this paper are summarized as follows:
- (1)
- In order to make the scheduling results take into account the global economic optimal and smooth the energy fluctuations of the system, three time-scale optimization models are built, from global offline optimization to local rolling dynamic optimization and real-time feedback adjustment;
- (2)
- In order to solve the problem that the predicted data may deviate greatly from the actual operation scenario, the scenario analysis method is used to describe the uncertainty of the prediction error, and the closed-loop optimization of intra-day rolling and real-time feedback is constructed based on MPC.
- (3)
- The multi-time-scale coordinated optimization operation method of an integrated energy system based on CGSA is adopted.
2. Integrated Energy System Structure
The IES includes CHP, wind turbines, gas-fired boilers (GB), P2G, gas turbine (GT), waste heat boiler (WH), transformer (TF), and gas storage (GS). The IES structure is shown in Figure 1.
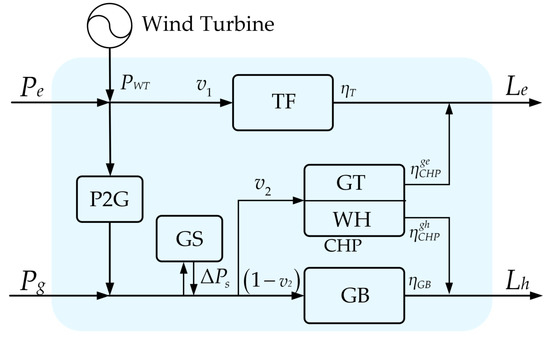
Figure 1.
IES diagram.
The process of using P2G technology involves, in the period of low load or peak output of renewable energy, the surplus electric energy being converted into natural gas or hydrogen, which is stored in natural gas pipeline network or natural gas storage equipment. When there is a power shortage, the stored gas is converted into electricity or thermal energy to provide to the user, thus improving the ability of the energy station to absorb renewable energy in the period of low load. P2G technology also increases the role of electricity–gas coupling in the system, and enhances the coupling between power and the natural gas system and the energy supply stability of the system.
At present, the efficiency of electricity-to-gas conversion technology can reach 60%. In addition, compared with a power storage device, the gas storage device has lower configuration and operation cost per unit capacity, and the coordination effect with P2G is more flexible.
The energy hub model of IES is described as follows,
in which , and are, respectively, the power purchase, gas purchase power and wind power output of the energy station, and are the electricity and heat load of the energy station, and is the gas power increment of the gas storage device. , , and are the efficiency parameters of the transformer, CHP generating unit, CHP generating heat and gas-fired boiler, respectively. is an intermediate variable with no specific physical meaning. and are the distribution coefficients of electricity and gas energy flow, respectively, and their values reflect the coupling degree of electricity and gas energy flow in the energy station.
3. Optimization Model and Coordinated Optimal Operation of IES
3.1. Day-Ahead Optimization Model
3.1.1. Objective Function
The planned goal of the IES is to minimize the daily operation cost. The daily operation cost includes natural gas consumption cost of CHP, natural gas consumption cost of a gas-fired boiler, power purchase cost, P2G operation cost and abandonment penalty cost, as shown in Equation (3):
in which is the daily operating cost, is the electricity price of the i period, is the purchased power at time i of the energy station, and are, respectively, the price of natural gas per unit power produced by P2G and the power of natural gas produced by P2G at time i, and is the penalty cost of abandoning wind per unit power, is the wind abandon power at time i, and is the scheduling interval.
3.1.2. Constraint Condition
(1) External network constraint
The energy input of the IES acts as the load node of the external power grid and the external gas network, respectively. For the change of the network state, it needs to be satisfied with Equation (2) power flow constraints of the power system and Equation (3) energy flow constraints of the natural gas pipeline network:
in which is the active power of node i, is the reactive power of node i, is a set of power system nodes, is the voltage amplitude of node i, is the voltage phase difference between node i and j, and and are the conductance and admittance of branch i to j:
in which is the reduced node–branch correlation matrix of natural gas network, and is the complete node–branch correlation matrix of natural gas network. is the natural gas flow of each branch, and is the outflow of each natural gas node. is the vector composed of the pressure square of the natural gas branch node, and is the vector composed of the pressure square difference of the head and end nodes of each branch.
For the security impact of the network, it is necessary to satisfy Equation (4) power system node voltage and branch power constraints and Equation (5) natural gas network node pressure and pipeline flow constraints:
in which is the voltage amplitude of node i of the power system, is the branch power of node i, is the branch set of power system. , , and are the maximum and minimum voltage amplitude of node i and the maximum and minimum branch power:
in which is the pressure of natural gas network node i, is the pipeline flow of node i, and are natural gas pipeline network nodes and branch sets, respectively. , , and are the maximum and minimum value of node pressure and the maximum and minimum value of pipeline flow in natural gas pipeline network, respectively.
(2) Energy hub model constraint
The mathematical model of the energy hub expressed in Equation (1) can be transformed into the corresponding constraint conditions, as shown in Equation (8):
in which is the electrical load of the energy station at time t, is the output power of the transformer of the energy station at time t, is the generation power of the CHP unit at time t, is the thermal load of the energy station at time t, is the heat generation power of the gas-fired boiler at time t, is the heat generation power of the CHP unit at time t, and is the power generation power of the CHP unit at time t. is the purchasing power of the energy station at time t; is the output of the fan of the energy station at time t; is the electric power consumed by the energy station at time t by converting electricity to gas; is the purchasing power of the energy station at time t; is the gas storage power of the energy station at time t.
(3) Equipment output power constraint in IES
The output power constraints of the equipment in the IES are shown in Equation (9):
in which , , , , are transformer power, CHP unit electrical power, CHP unit thermal power, P2G unit power and gas boiler thermal power, respectively, , , , , , , , , , are the upper and lower limits of transformer power, electric power of CHP unit, thermal power of CHP unit, power of P2G device and thermal power of gas-fired boiler, respectively.
(4) Gas storage device constraint
The constraint conditions of the gas storage device are shown in Equation (10):
in which and are the upper and lower limits of the capacity of the gas storage device, respectively. If the power outflow of the gas storage device is positive and is positive, it represents the upper limit of the extraction capacity of the gas storage device, is negative, and its absolute value represents the upper limit of the injection capacity of the gas storage device.
3.2. Intra-Day Rolling Optimization Model
3.2.1. Objective Function
The goal of the intra-day rolling plan is the same as that of the day-ahead plan, but the time span of the plan is different. The objective function of the intra-day rolling plan is shown in Equation (11),
in which is the target function value of a planning window.
3.2.2. Rolling Plan Constraint
The constraints of the rolling plan are the same as those of the day-ahead plan, as shown in Equations (4)–(10). The rolling plan is based on the day-ahead planning and scheduling scheme, and in the rolling planning process, the two adjacent time windows have a coincidence time of 2 h. In order to ensure that the deviation of the output of each piece of equipment during the coincidence period of the adjacent time window of the rolling plan is not too large, the output deviation of each piece of equipment should meet the following constraints:
in which and are the equipment output vectors of the i and i + 1 windows in the coincident t period. is the maximum equipment output vector. is the constraint factor of output deviation of rolling planning equipment.
3.3. Real-Time Planning Optimization Model
3.3.1. Objective Function
Real-time planning belongs to single-period optimization; real-time planning needs to refer to the scheduling scheme modified by the rolling plan, and the objective function of a period of time is to minimize the total adjustment cost of each piece of equipment in the system, as shown in Equations (13) and (14):
in which , , , and are the regulation costs of electricity purchase, gas purchase, gas storage device, P2G output and CHP unit output, respectively. , , , , , respectively, refer to the purchased electricity, purchased gas, gas power increment of gas storage device, P2G output, and CHP unit output in the rolling plan; , , , , , respectively, refer to the purchased electricity, purchased gas, gas power increment of gas storage device, P2G output, and CHP unit output in the real-time plan. w1, w2, w3, w4 and w5, respectively, correspond to the value coefficients adjusted by the above-mentioned equipment.
3.3.2. Constraint Condition
The constraints of the real-time plan are also the same as the day-ahead plan, such as Equations (4)–(10). However, the real-time plan is based on the final scheduling scheme of the rolling plan, so the deviation between the real-time plan and the equipment output of the corresponding rolling plan should not be too large. Therefore, real-time planning should meet the following constraints:
in which and are the real-time planned equipment output vector and rolling planning equipment output vector for t period. is the real-time planning equipment output deviation constraint factor.
3.4. Day-Ahead-Rolling-Realtime Compound Coordinated Optimization Operation
The day-ahead-rolling-realtime compound coordinated and optimal operation strategy of the IES firstly establishes the day-ahead scheduling scheme based on the day-ahead forecast data of electricity, heat load and wind power output, which provides preliminary reference information for the whole day operation of the system. Then, the rolling plan is carried out by using short-term rolling forecast data, the day-ahead plan is modified, and the basic operation point of each equipment output is established. Finally, the real-time planning is carried out by using ultra-short-term forecast data, and a planning scheme with high matching degree with the actual power, heat load and wind power output is obtained. In the compound coordinated optimal operation strategy, the scheduling period of the day-ahead plan is 24 h, and the scheduling interval is 15 min. The time window span of the rolling plan is 4 h, and the update interval is 2 h, and the time window scrolls backward in the planning process, as shown in Figure 2. The real-time plan is executed once every 15 min, and is responsible for arranging the scheduling plan for the next period of time in advance.
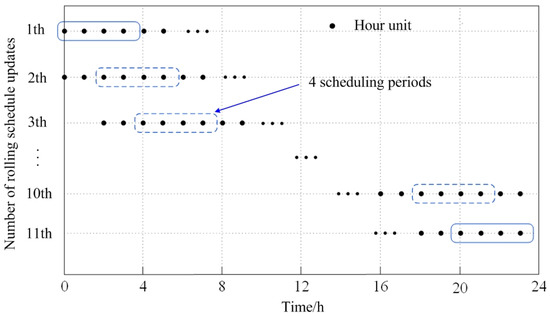
Figure 2.
Schematic diagram of rolling planning time window.
4. Model Solving
4.1. The Method of Solving the Day-Ahead and Rolling Plan
The compound coordinated scheduling model of IES is a nonlinear optimization problem with many variables and complex constraints. The day-ahead plan and rolling plan include multiple periods and have a large amount of data, so it is solved by yalmip toolbox. According to the Equations (4)–(7), the power ranges of power purchase and gas purchase that meet the external network constraints are calculated, and then they are transformed into the constraints of the EH model, that is
in which is the power purchased to meet the external network constraints, is the power purchased to meet the external network constraints. , , and are the upper and lower limits of power purchase and gas purchase power for energy stations that meet the constraints of the external network, respectively. Taking Equation (16) as the constraint condition instead of Equations (4)–(7), the original model is transformed into a linear programming model, and then the day-ahead plan and rolling plan of each period are solved by using yalmip toolbox.
4.2. Method for Solving Real-Time Planning
Real-time planning is only responsible for single-time optimization, which has the characteristics of a small amount of data and small error of data source. In order to ensure the accuracy of the solution, the chaotic universal gravitation algorithm is used to solve the problem.
4.2.1. Gravitational Search Algorithm
GSA is an intelligent optimization method based on the law of universal gravitation. In GSA, the solution of the optimization problem is regarded as a group of particles running in space. The particles attract each other through the action of universal gravity, and the motion of the particles follows the law of dynamics. The action of universal gravity makes the particles move towards the particles with the largest mass, and the particles with the largest mass occupy the optimal position, thus the optimal solution to the optimization problem can be obtained. The algorithm realizes the sharing of optimization information through the gravitational interaction between individuals and guides the group to search to the optimal solution region.
In GSA, each particle updates its speed and position during each iteration, as shown in Equation (17).
in which , , represent the position, velocity and acceleration of particle i in d dimension at t time, respectively. is a random number between [0, 1], which makes the search more reasonable with certain randomness. is the magnitude of the force acting on the particle i in the d dimension at t time; is the inertial mass of the particle i at t time. The formula for acceleration is as follows,
in which is the total number of particles. is the gravitation of particle j to particle i. is the gravitational constant at t time. is the inertial mass of particle j at time t, and , , respectively, represent the positions of two particles in d dimension at time t, is the Euclidean distance between particle i and particle j. is a constant with a very small value. is the size of the fitness value of the i particle at t time. and are the minimum and maximum fitness of the current population, respectively.
4.2.2. Chaotic Universal Gravitation Search Algorithm
In order to overcome the premature convergence defect of the artificial intelligence algorithm, this paper improves the universal gravity algorithm and uses the chaotic map of the combination of a logistics chaotic map and Chebyshev chaotic map to replace the ordinary random number to improve the ergodicity and uniformity of the random initial population:
in which is the first individual generated, is a normal distribution random number with a mean value of 0 and variance is 1, and is the k individual generated by chaos. , and are all intermediate variables in the process of chaotic sequence generation.
5. Analysis and Verification of Example
This paper adopts the coupling system of a 33-node power system and 14-node natural gas system, as shown in Figure 3.
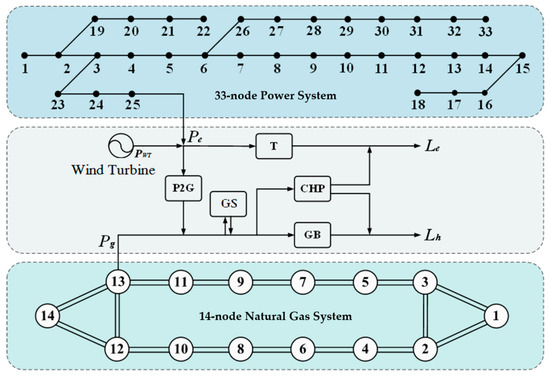
Figure 3.
Structure block diagram of electric power–natural gas coupling system.
The actual electricity, daily thermal load, wind power output and peak-valley time-sharing electricity price curve of the IES are shown in Figure 4. Natural gas price = 0.045 $/kWh, P2G operation cost coefficient = 0.009 $/kWh, abandoned wind penalty cost coefficient = 0.065 $/kWh.
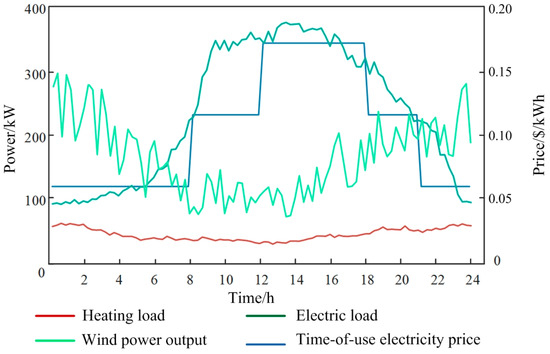
Figure 4.
Curves of different load, wind power and time-sharing electricity price.
The day-ahead prediction errors of given power, heat load and wind power output are 4%, 4% and 20%, respectively, rolling prediction errors are 2%, 2% and 5%, respectively, and real-time prediction errors are 0.4%, 0.4% and 2%, respectively.
5.1. Multi-Time-Scale Scheduling Plan and Actual Output Comparison
In this case, a multi-time-scale scheduling plan is carried out. Figure 5 shows the comparison curve of real-time planning and actual processing of electric load, and Figure 6 shows the output and actual output of electric load under day-ahead planning, rolling planning, real-time planning and real-time planning, respectively.
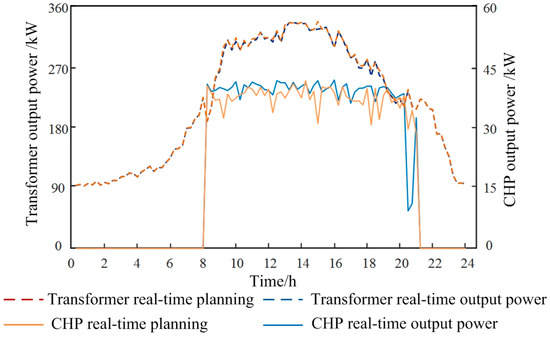
Figure 5.
Comparison between real-time planning and actual output of electric load.
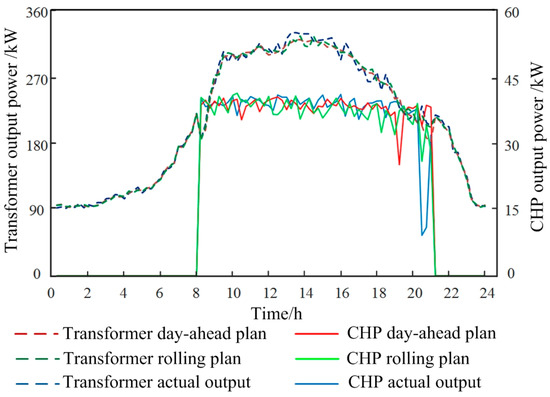
Figure 6.
Comparison of electricity load day plan, rolling plan and actual output.
Figure 7, Figure 8, Figure 9 and Figure 10 show that the output trend of each piece of equipment in the rolling plan is the same as that of the day-ahead plan, and it is closer to the actual situation due to the use of data with higher prediction accuracy. At the peak of electricity price from 8:00 to 21:00, the gas price of 0.045 $/kWh, is converted into electricity through the gas turbine, and the output electricity price of 0.112 $/kWh, is lower than the time-sharing electricity price, so it is more economic to use gas turbine to generate electricity to supplement the vacant electricity at the peak of electricity price than to purchase electricity directly from the power grid. In the recent forecast data, between 0:00–7:00 and 22:00–24:00, there is excess wind power output in and near the interval, and P2G devices work, and the excess wind power is converted into natural gas to be sent to gas storage devices for storage or directly consumed in gas-fired boilers. The combined use of P2G and gas storage device provides an effective way for the local consumption of wind power. In addition, real-time planning is an optimal scheduling scheme based on rolling planning, so there is little difference between real-time planning and rolling planning.
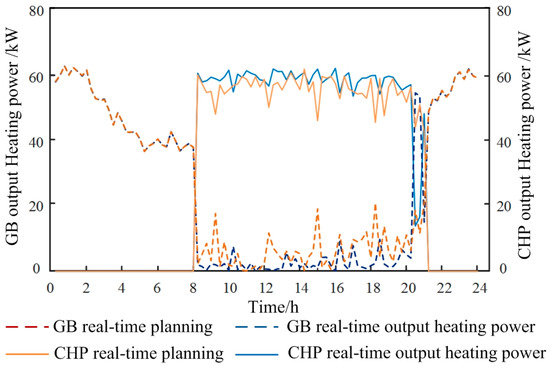
Figure 7.
Comparison of real-time planning and actual output of thermal power output of gas-fired boilers and CHP.
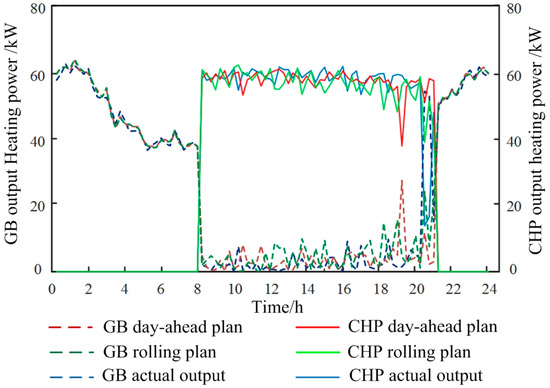
Figure 8.
Comparison of day-ahead plan, rolling plan and actual output of thermal power output of gas-fired boilers and CHP.
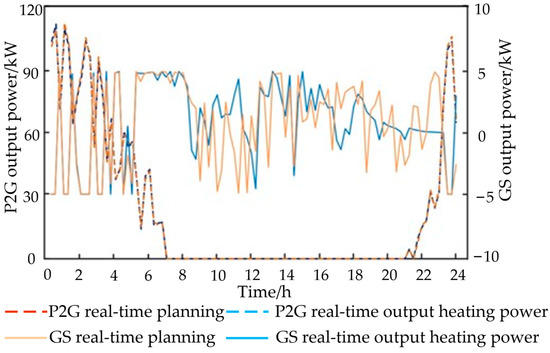
Figure 9.
Comparison of real-time planning and actual output of P2G and gas storage devices.
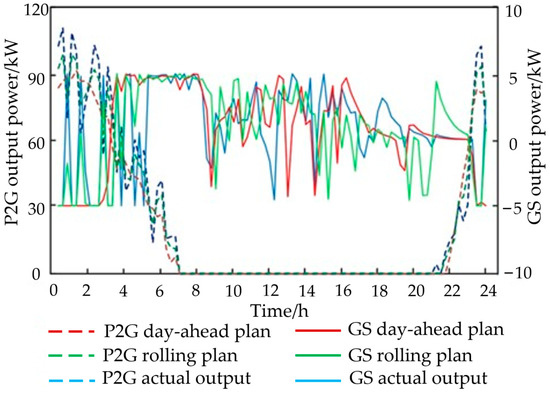
Figure 10.
Comparison of advance plan, rolling plan and actual output of P2G and gas storage device.
5.2. Multi-Time-Scale Scheduling Plan and Actual Output Comparison
The results of multi-time-scale coordination optimization in this paper are compared with the scheduling results based on day-ahead programming (DA-P).
The DA-P strategy is based on the day-ahead scheduling results. During the actual operation of the system, the power fluctuations caused by the prediction errors of the predicted data are all stabilized by the external network. In this paper, it is considered that the fluctuation of electric power is directly suppressed by the large grid.
Based on the day-ahead forecast data, the power purchase cost and the fluctuation rate of the interactive power of the liaison line are obtained by solving under the DA-P and multi-time-scale optimal scheduling strategies, respectively, as shown in Table 1. The system power purchase cost under the DA-P strategy is 472.3 dollars, and the system power purchase cost under the multi-time-scale optimal scheduling strategy is 458.8 dollars, which is 2.84% lower than the former. The reason is that the scheduling strategy of the former is based on the one-day-before offline full-period optimization, which has a large error. In actual operation, only the external network is used to suppress the prediction error, and a large amount of power purchase cost is generated in the process of suppressing. The latter, under the guidance of day-ahead planning, takes the uncertainty of forecast data into consideration while rolling repeatedly and uses real-time feedback adjustment to form closed-loop optimization. The actual power purchase cost is reduced by 0.8% compared with day-ahead optimization cost, which reduces the influence of forecast error on the economy of scheduling strategy.

Table 1.
Running results of IES under different strategies.
As shown in Figure 11, day-ahead, DA-P policy scheduling and real-time contact line interactive power scheduling results are compared. DA-P policy scheduling follows day-ahead optimization results and only changes the interactive power of large power grids to compensate for the prediction error. The day-ahead optimization time scale takes hours and cannot respond in a timely fashion to the power fluctuations of the system. Under the DA-P strategy, the actual operation of the contact line produces a lot of power fluctuations. The multi-time-scale optimal scheduling strategy makes the results more accurate by step-by-step refinement. Combined with the interactive power fluctuation rate of the contact lines shown in Table 1, the multi-time-scale scheduling strategy proposed in this paper can significantly reduce the power fluctuation of the contact lines and reduce the burden of the grid.
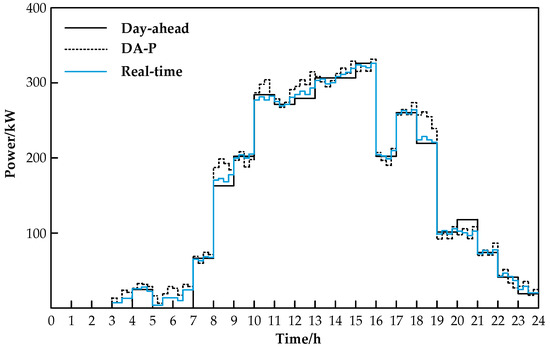
Figure 11.
Comparison of day-ahead, DA-P policy scheduling and real-time contact line interactive power scheduling results.
In order to further verify the advantages of CGSA proposed in this paper in solving the optimization operation problem of micro-grid, PSO, GSA and CGSA, algorithms are, respectively, used to solve the problem for 20 times under the same conditions. The statistical results are shown in Table 2.

Table 2.
The statistical results were calculated 20 times.
It can be seen from Table 2 that the proposed CGSA algorithm can make the microgrid obtain lower total operation cost and network loss in operation. By comparing the standard deviation of the total running cost, it can be seen that the CGSA algorithm in this paper has strong robustness. On the other hand, from the perspective of optimization operation time, it can be seen that the proposed CGSA algorithm has faster convergence speed. In a word, the improved CGSA has good optimization performance, fast convergence speed and strong robustness, which can be better applied to the IES optimization operation.
6. Conclusions
In this paper, three time scales of day-ahead, intra-day rolling and real-time feedback optimization scheduling models are established, respectively, with the objectives of the system economic optimal daily operation, the minimum sum of energy purchase operation cost and wind curtailment penalty cost in rolling control time domain, and the minimum adjustment amount of equipment output power. Based on these models, the energy optimization scheduling strategy of an integrated energy system is proposed. Meanwhile, this paper uses CGSA based on GSA to solve this optimization model. Through the example analysis, the following conclusions are obtained:
- (1)
- Three time scale optimization models are built, from global off-line optimization to local rolling dynamic optimization and then to real-time feedback adjustment, which is beneficial to optimize the energy flow distribution and reduce the operating cost of the system, in order to make the scheduling results take into account the global economic optimization, smooth the system energy fluctuations, and improve the IES operation economy.
- (2)
- The scenario analysis method is used to describe the uncertainty of the prediction error, and the closed-loop optimization of intra-day rolling and real-time feedback are constructed based on MPC to solve the problem that the prediction data may deviate significantly from the actual operation scenario.
- (3)
- CGSA has good optimization performance, fast convergence speed and strong robustness, which can be better applied to IES optimization operation.
It should be pointed out that, for the improvement of the algorithm in this paper, the chaotic map combined with the logistics chaotic map and Chebyshev chaotic map is used instead of the ordinary random number to improve the ergodic and uniform degree of the random initial population. In recent years, new swarm intelligence algorithms have been proposed endlessly, each with its own characteristics. They can combine the advantages of other algorithms and integrate with the gravitational algorithm for improvement and optimization, which is also the direction of future research.
Author Contributions
Conceptualization, Z.L. (Zhiheng Liu) and F.G.; methodology, Z.L. (Zhibin Liu); validation, X.L.; formal analysis, J.L.; investigation, Z.Z.; resources, F.G. and X.L.; data curation, A.L.; writing—original draft preparation, F.G.; writing—review and editing, Z.Z., J.L. and A.L.; funding acquisition, Z.L. (Zhibin Liu). All authors have read and agreed to the published version of the manuscript.
Funding
This work is funded by the Science and Technology Project of Hebei Education Department [No. ZD2021301], Natural Science Foundation of Hebei Province [F2020201014], Doctoral Research Fund Project of North China Institute of Aerospace Industry [No. BKY202013], Graduate Curriculum Construction and Educational and Teaching Research Programs of North China Institute of Aerospace Engineering [No. YJY-2021-01], Research on the Industry–University–Research Collaborative Training Mode of Local Universities—take the Provincial Innovation Centre as an example (The 14th Five-Year Plan Project of Hebei Society of Higher Education) [No. GJXHZ2021-34].
Data Availability Statement
Not applicable.
Conflicts of Interest
The authors declare no conflict of interest.
Nomenclature
| Power purchase | |
| Gas purchase | |
| The wind power output of the energy station | |
| The electricity load of the energy station | |
| The heat load of the energy station | |
| The gas power increment of the gas storage device | |
| The efficiency parameters of transformer | |
| CHP generating unit | |
| CHP generating heat | |
| Gas-fired boiler | |
| An intermediate variable with no specific physical meaning | |
| The distribution coefficients of electricity | |
| Gas energy flow | |
| The daily operation cost | |
| The electricity price of the i period | |
| The purchased power at time i of the energy station | |
| The price of natural gas per unit power produced by P2G | |
| The power of natural gas produced by P2G at time i | |
| The penalty cost of abandoning wind per unit power | |
| The wind abandon power at time i | |
| The scheduling interval | |
| The active power of node i | |
| The reactive power of node i | |
| A set of power system nodes | |
| The voltage amplitude of node i | |
| The voltage phase difference between node i and j | |
| The conductance of branch i−j | |
| The admittance of branch i−j | |
| The voltage amplitude of node i of the power system | |
| The branch power of node i | |
| The reduced node–branch correlation matrix of natural gas network | |
| The complete node–branch correlation matrix of natural gas network | |
| The natural gas flow of each branch | |
| The outflow of each natural gas node | |
| The vector composed of the pressure square of the natural gas branch node | |
| The vector composed of the pressure square difference of the head and end nodes of each branch | |
| The branch set of power system | |
| The maximum voltage amplitude of node i | |
| The minimum voltage amplitude of node i | |
| The maximum of branch power | |
| The minimum of branch power | |
| Natural gas pipeline network node | |
| Branch sets | |
| The pressure of natural gas network node i | |
| The pipeline flow of node i | |
| The maximum value of node pressure | |
| The minimum value of node pressure | |
| The maximum value of pipeline flow in natural gas pipeline network | |
| The minimum value of pipeline flow in natural gas pipeline network | |
| The electrical load of the energy station at time t | |
| The output power of the transformer of the energy station at time t | |
| The generation power of the CHP unit at time t | |
| The thermal load of the energy station at time t | |
| The heat generation power of the gas-fired boiler at time t | |
| The heat generation power of the CHP unit at time t | |
| The power generation power of the CHP unit at time t | |
| The purchasing power of the energy station at time t | |
| The output of the fan of the energy station at time t | |
| The electric power consumed by the energy station at time t by converting electricity to gas | |
| The purchasing power of the energy station at time t | |
| The gas storage power of the energy station at time t | |
| Transformer power | |
| CHP unit electrical power | |
| CHP unit thermal power | |
| P2G unit power | |
| Gas boiler thermal power | |
| The upper limits of transformer power | |
| The lower limits of transformer power | |
| The upper limits of electric power of CHP unit | |
| The lower limits of electric power of CHP unit | |
| The upper limits of thermal power of CHP unit | |
| The lower limits of thermal power of CHP unit | |
| The upper limits of power of P2G device | |
| The lower limits of power of P2G device | |
| The upper limits of thermal power of gas-fired boiler | |
| The lower limits of thermal power of gas-fired boiler | |
| The upper limits of the capacity of the gas storage device | |
| The lower limits of the capacity of the gas storage device | |
| The upper limit of the extraction capacity of the gas storage device | |
| The lower limit of the injection capacity of the gas storage device | |
| The target function value of a planning window. | |
| The equipment output vectors of the i windows in the coincident t period | |
| The equipment output vectors of the i + 1 windows in the coincident t period | |
| The maximum equipment output vector | |
| the constraint factor of output deviation of rolling planning equipment | |
| The regulation costs of electricity purchase | |
| The regulation costs of gas purchase | |
| The regulation costs of gas storage device | |
| The regulation costs of P2G output | |
| The regulation costs of CHP unit output | |
| Purchased electricity in the rolling plan | |
| Purchased gas in the rolling plan | |
| Gas power increment of gas storage device in the rolling plan | |
| P2G output in the rolling plan | |
| CHP unit output in the rolling plan | |
| Purchased electricity in the real-time plan | |
| Purchased gas in the real-time plan | |
| Gas power increment of gas storage device in the real-time plan | |
| P2G output in the real-time plan | |
| CHP unit output in the rolling plan | |
| The real-time planned equipment output vector | |
| Rolling planning equipment output vector for t period | |
| The real-time planning equipment output deviation constraint factor | |
| The power purchased to meet the external network constraints | |
| The power purchased to meet the external network constraints | |
| The upper limits of power purchase for energy stations | |
| The lower limits of power purchase for energy stations | |
| The upper limits of gas purchase power for energy stations | |
| The lower limits of gas purchase power for energy stations | |
| The position of particle i in d dimension at t time | |
| The velocity of particle i in d dimension at t time | |
| The acceleration of particle i in d dimension at t time | |
| A random number between [0, 1] | |
| The magnitude of the force acting on the particle i in the d dimension at t time | |
| The inertial mass of the particle i at t time | |
| The total number of particles | |
| The gravitation of particle j to particle i | |
| The gravitational constant at t time | |
| The inertial mass of particle j at time t | |
| The positions of two particles in d dimension at time t | |
| The Euclidean distance between particle i and particle j | |
| A constant with a very small value | |
| The size of the fitness value of the i particle at t time | |
| The minimum fitness of the current population | |
| The maximum fitness of the current population | |
| The first individual generated | |
| A normal distribution random number with a mean value of 0 and variance is 1 | |
| The k individual generated by chaos | |
| All intermediate variables in the process of chaotic sequence generation |
References
- IEA. World Energy Outlook Paris: IEA. 2022. Available online: https://www.iea.org/reports/world-energy-outlook-2022 (accessed on 1 September 2022).
- Mouheb, M.; Malek, A.; Loukarfi, L. Contribution of solar energy for the correction of the voltage drop recorded on a LV power grid in Algeria. Energy Sources Part A Recovery Util. Environ. Eff. 2019, 42, 2485–2500. [Google Scholar] [CrossRef]
- Vesterlund, M.; Toffolo, A.; Dahl, J. Optimization of multi-source complex district heating network, a case study. Energy 2017, 126, 53–63. [Google Scholar] [CrossRef]
- Zurita, A.; Mata-Torres, C.; Valenzuela, C.; Felbol, C.; Cardemil, J.M.; Guzmán, A.M.; Escobar, R.A. Techno-economic evaluation of a hybrid CSP+PV plant integrated with thermal energy storage and a large-scale battery energy storage system for base generation. Sol. Energy 2018, 173, 1262–1277. [Google Scholar] [CrossRef]
- Bamisile, O.; Olagoke, O.; Dagbasi, M.; Dika, F.; Okwesi, B. Review of solar assisted HVAC systems; Its performance analysis using CO2 as a refrigerant. Energy Sources Part A Recovery Util. Environ. Eff. 2019, 41, 2957–2974. [Google Scholar] [CrossRef]
- Ortiz, C.; Romano, M.; Valverde, J.; Binotti, M.; Chacartegui, R. Process integration of Calcium-Looping thermochemical energy storage system in concentrating solar power plants. Energy 2018, 155, 535–551. [Google Scholar] [CrossRef]
- Çelik, Ö.; Tan, A.; Inci, M.; Teke, A. Improvement of energy harvesting capability in grid-connected photovoltaic micro-inverters. Energy Sources Part A Recovery Util. Environ. Eff. [CrossRef]
- Shad, M.; Momeni, A.; Errouissi, R.; Diduch, C.P.; Kaye, M.E.; Chang, L. Identification and estimation for electric water heaters indirect load control programs. IEEE Trans. Smart Grid 2017, 8, 947–955. [Google Scholar]
- Koirala, B.P.; van Oost, E.; van der Windt, H. Community energy storage: A responsible innovation towards a sustainable energy system. Appl. Energy 2018, 231, 570–585. [Google Scholar] [CrossRef]
- Renaldi, R.; Friedrich, D. Techno-economic analysis of a solar district heating system with seasonal thermal storage in the UK. Appl. Energy 2019, 236, 388–400. [Google Scholar] [CrossRef]
- Renaldi, R.; Friedrich, D. Multiple time grids in operational optimisation of energy systems with short- and long-term thermal energy storage. Energy 2017, 133, 784–795. [Google Scholar] [CrossRef]
- Alva, G.; Lin, Y.; Fang, G. An overview of thermal energy storage systems. Energy 2018, 144, 341–378. [Google Scholar] [CrossRef]
- Van Der Stelt, S.; AlSkaif, T.; van Sark, W. Techno-economic analysis of household and community energy storage for residential prosumers with smart appliances. Appl. Energy 2018, 209, 266–276. [Google Scholar] [CrossRef]
- Wang, C.S.; Hong, B.W.; Guo, L.; Zhang, D.J.; Liu, W.J. A general modeling method for optimal dispatch of combined cooling, heating and power microgrid. Proc. CSEE 2013, 33, 26–33. [Google Scholar]
- Wang, Y.; Wang, X.; Yu, H.; Huang, Y.; Dong, H.; Qi, C.; Baptiste, N. Optimal design of integrated energy system considering economics, autonomy and carbon emissions. J. Clean. Prod. 2019, 225, 563–578. [Google Scholar] [CrossRef]
- Chen, Z.; Wang, D.; Jia, H.; Wang, W.L.; Guo, B.Q.; Qu, B.; Fan, M.H. Research on optimal day-ahead economic dispatching strategy for microgrid considering P2G and multi-source energy storage system. Proc. CSEE 2017, 37, 3067–3077. [Google Scholar]
- Zhu, Y.; Lan, Z.; Wei, Z.; Liu, B.; Feng, W.; Zhou, S.; Chen, X.; Wei, G.; Sun, C.; Zhang, S. Research on optimal operation of wind-PV-ES complementary system considering carbon emission cost. Power Syst. Prot. Control 2019, 47, 127–133. [Google Scholar]
- Pazouki, S.; Haghifam, M.-R.; Moser, A. Uncertainty modeling in optimal operation of energy hub in presence of wind, storage and demand response. Int. J. Electr. Power Energy Syst. 2014, 61, 335–345. [Google Scholar] [CrossRef]
- Li, W.; Fu, C.; Zhang, H. Day-ahead unit commitment models considering uncertainties in wind power for wind power bundled with thermal power transmitted by DC. Proc. CSU-EPSA 2018, 30, 38–43. [Google Scholar]
- Liu, G.; Starke, M.; Xiao, B.; Zhang, X.; Tomsovic, K. Microgrid optimal scheduling with chance-constrained islanding capability. Electr. Power Syst. Res. 2017, 145, 197–206. [Google Scholar] [CrossRef]
- Dou, X.; Wang, J.; Wang, Z.; Li, L.; Bai, L.; Ren, S.; Gao, M. A dispatching method for integrated energy system based on dynamic time-interval of model predictive control. J. Mod. Power Syst. Clean Energy 2020, 8, 841–852. [Google Scholar] [CrossRef]
- Sun, F.; Li, R.; Han, Y.; Liu, L.; Liu, H. The IES dynamic time-scale scheduling strategy based on multiple load forecasting errors. Glob. Energy Interconnect. 2021, 4, 58–68. [Google Scholar] [CrossRef]
- Gu, W.; Wang, Z.; Wu, Z.; Luo, Z.; Tang, Y.; Wang, J. An online optimal dispatch schedule for CCHP microgrids based on model predictive control. IEEE Trans. Smart Grid 2017, 8, 2332–2342. [Google Scholar] [CrossRef]
- Dou, X.; Xiao, Y.; Yuan, X.; Wu, Z.; Hu, M. Energy management strategy based on improved model predictive control for microgrid. Autom. Electr. Power Syst. 2017, 41, 56–65. [Google Scholar]
- Liu, J.; Ma, L.; Wang, Q. Energy management method of integrated energy system based on collaborative optimization of distributed flexible resources. Energy 2023, 264, 125981. [Google Scholar] [CrossRef]
- Yan, R.; Wang, J.; Huo, S.; Qin, Y.; Zhang, J.; Tang, S.; Wang, Y.; Liu, Y.; Zhou, L. Flexibility improvement and stochastic multi-scenario hybrid optimization for an integrated energy system with high-proportion renewable energy. Energy 2023, 263, 125779. [Google Scholar] [CrossRef]
- Cheng, Z.; Jia, D.; Li, Z.; Xu, S.; Si, J. Multi-time-scale energy management for microgrid using expected-scenario-oriented stochastic optimization. Sustain. Energy Grids Netw. 2022, 30, 100670. [Google Scholar] [CrossRef]
- Jani, A.; Karimi, H.; Jadid, S. Multi-time scale energy management of multi-microgrid systems considering energy storage systems: A multi-objective two-stage optimization framework. J. Energy Storage 2022, 51, 104554. [Google Scholar] [CrossRef]
- Cheng, Z.; Jia, D.; Li, Z.; Si, J.; Xu, S. Multi-time scale dynamic robust optimal scheduling of CCHP microgrid based on rolling optimization. Int. J. Electr. Power Energy Syst. 2022, 139, 107957. [Google Scholar] [CrossRef]
- He, Y.; Li, Z.; Zhang, J.; Shi, G.; Cao, W. Day-ahead and intraday multi-time scale microgrid scheduling based on light robustness and MPC. Int. J. Electr. Power Energy Syst. 2022, 144, 108546. [Google Scholar] [CrossRef]
Disclaimer/Publisher’s Note: The statements, opinions and data contained in all publications are solely those of the individual author(s) and contributor(s) and not of MDPI and/or the editor(s). MDPI and/or the editor(s) disclaim responsibility for any injury to people or property resulting from any ideas, methods, instructions or products referred to in the content. |
© 2023 by the authors. Licensee MDPI, Basel, Switzerland. This article is an open access article distributed under the terms and conditions of the Creative Commons Attribution (CC BY) license (https://creativecommons.org/licenses/by/4.0/).