


Energy Autonomy Simulation Model of Solar Powered UAV
 ,
,  , , and
Abstract
1. Introduction
- Solar modules into the mold—this method is good for new UAVs. Solar cells are a direct part of the wing. The advantage is its easy to arrange wiring, however, the PV modules cannot be swapped in case of damage.
- TwinStratos 110 (TS110) scaled 1:10—UAV for testing general layout and specific simplified control system;
- TS17 scaled 1:7—UAV for testing the power supply system, energy consumption simulation model, and technology of manufacturing;
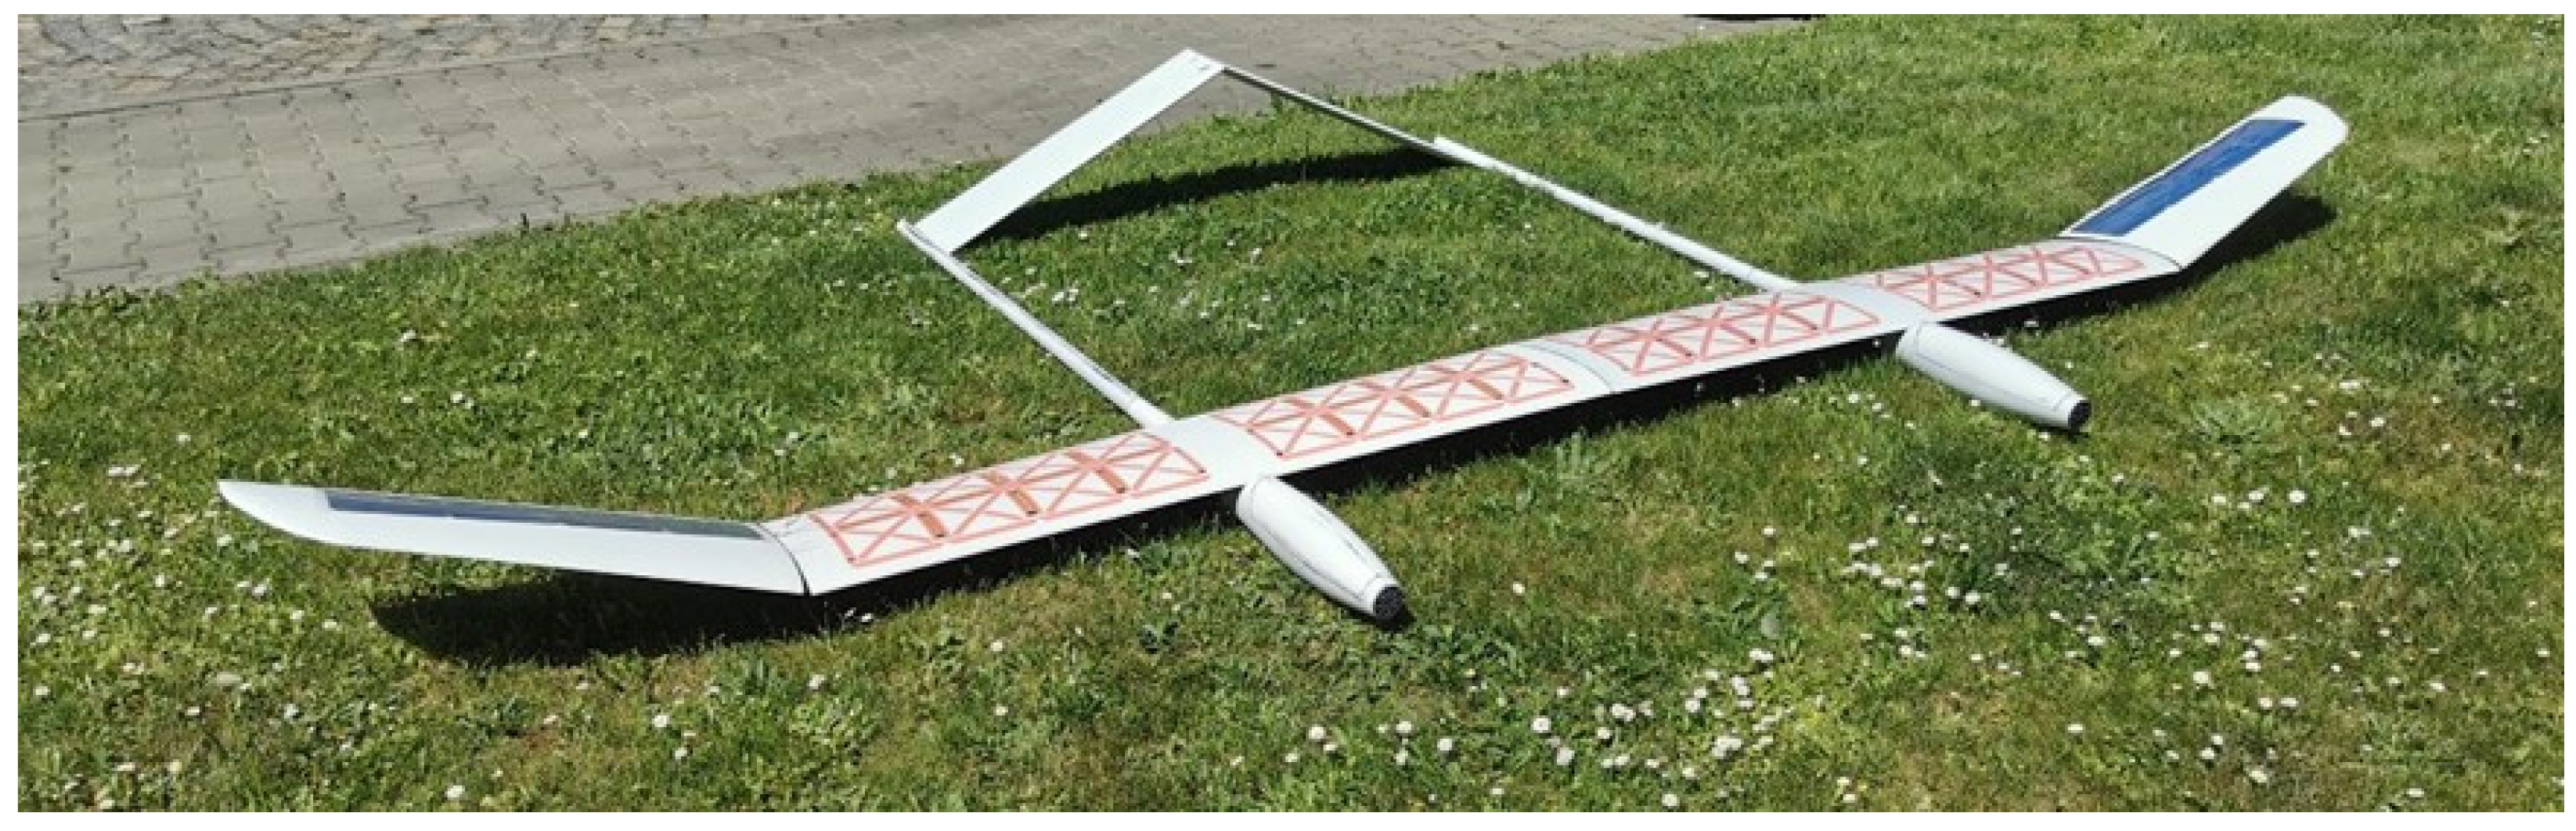
- TS12 scaled 1:2—UAV for long endurance tests, verification flight parameters and performance ranges in operation mode, designated for service use and research tests;
- TS—target UAV intended for the research and implementation of commercial services.
2. Solar Energy Production
2.1. Irradiation
2.2. External Restrictions on Solar Energy Production
2.2.1. Cloudiness
- cirrus clouds;
- cumulus clouds;
- stratus clouds.
2.2.2. Temperature
2.2.3. Air and Solar Cell Pollutions
3. Materials and Methods—Numerical Model Data
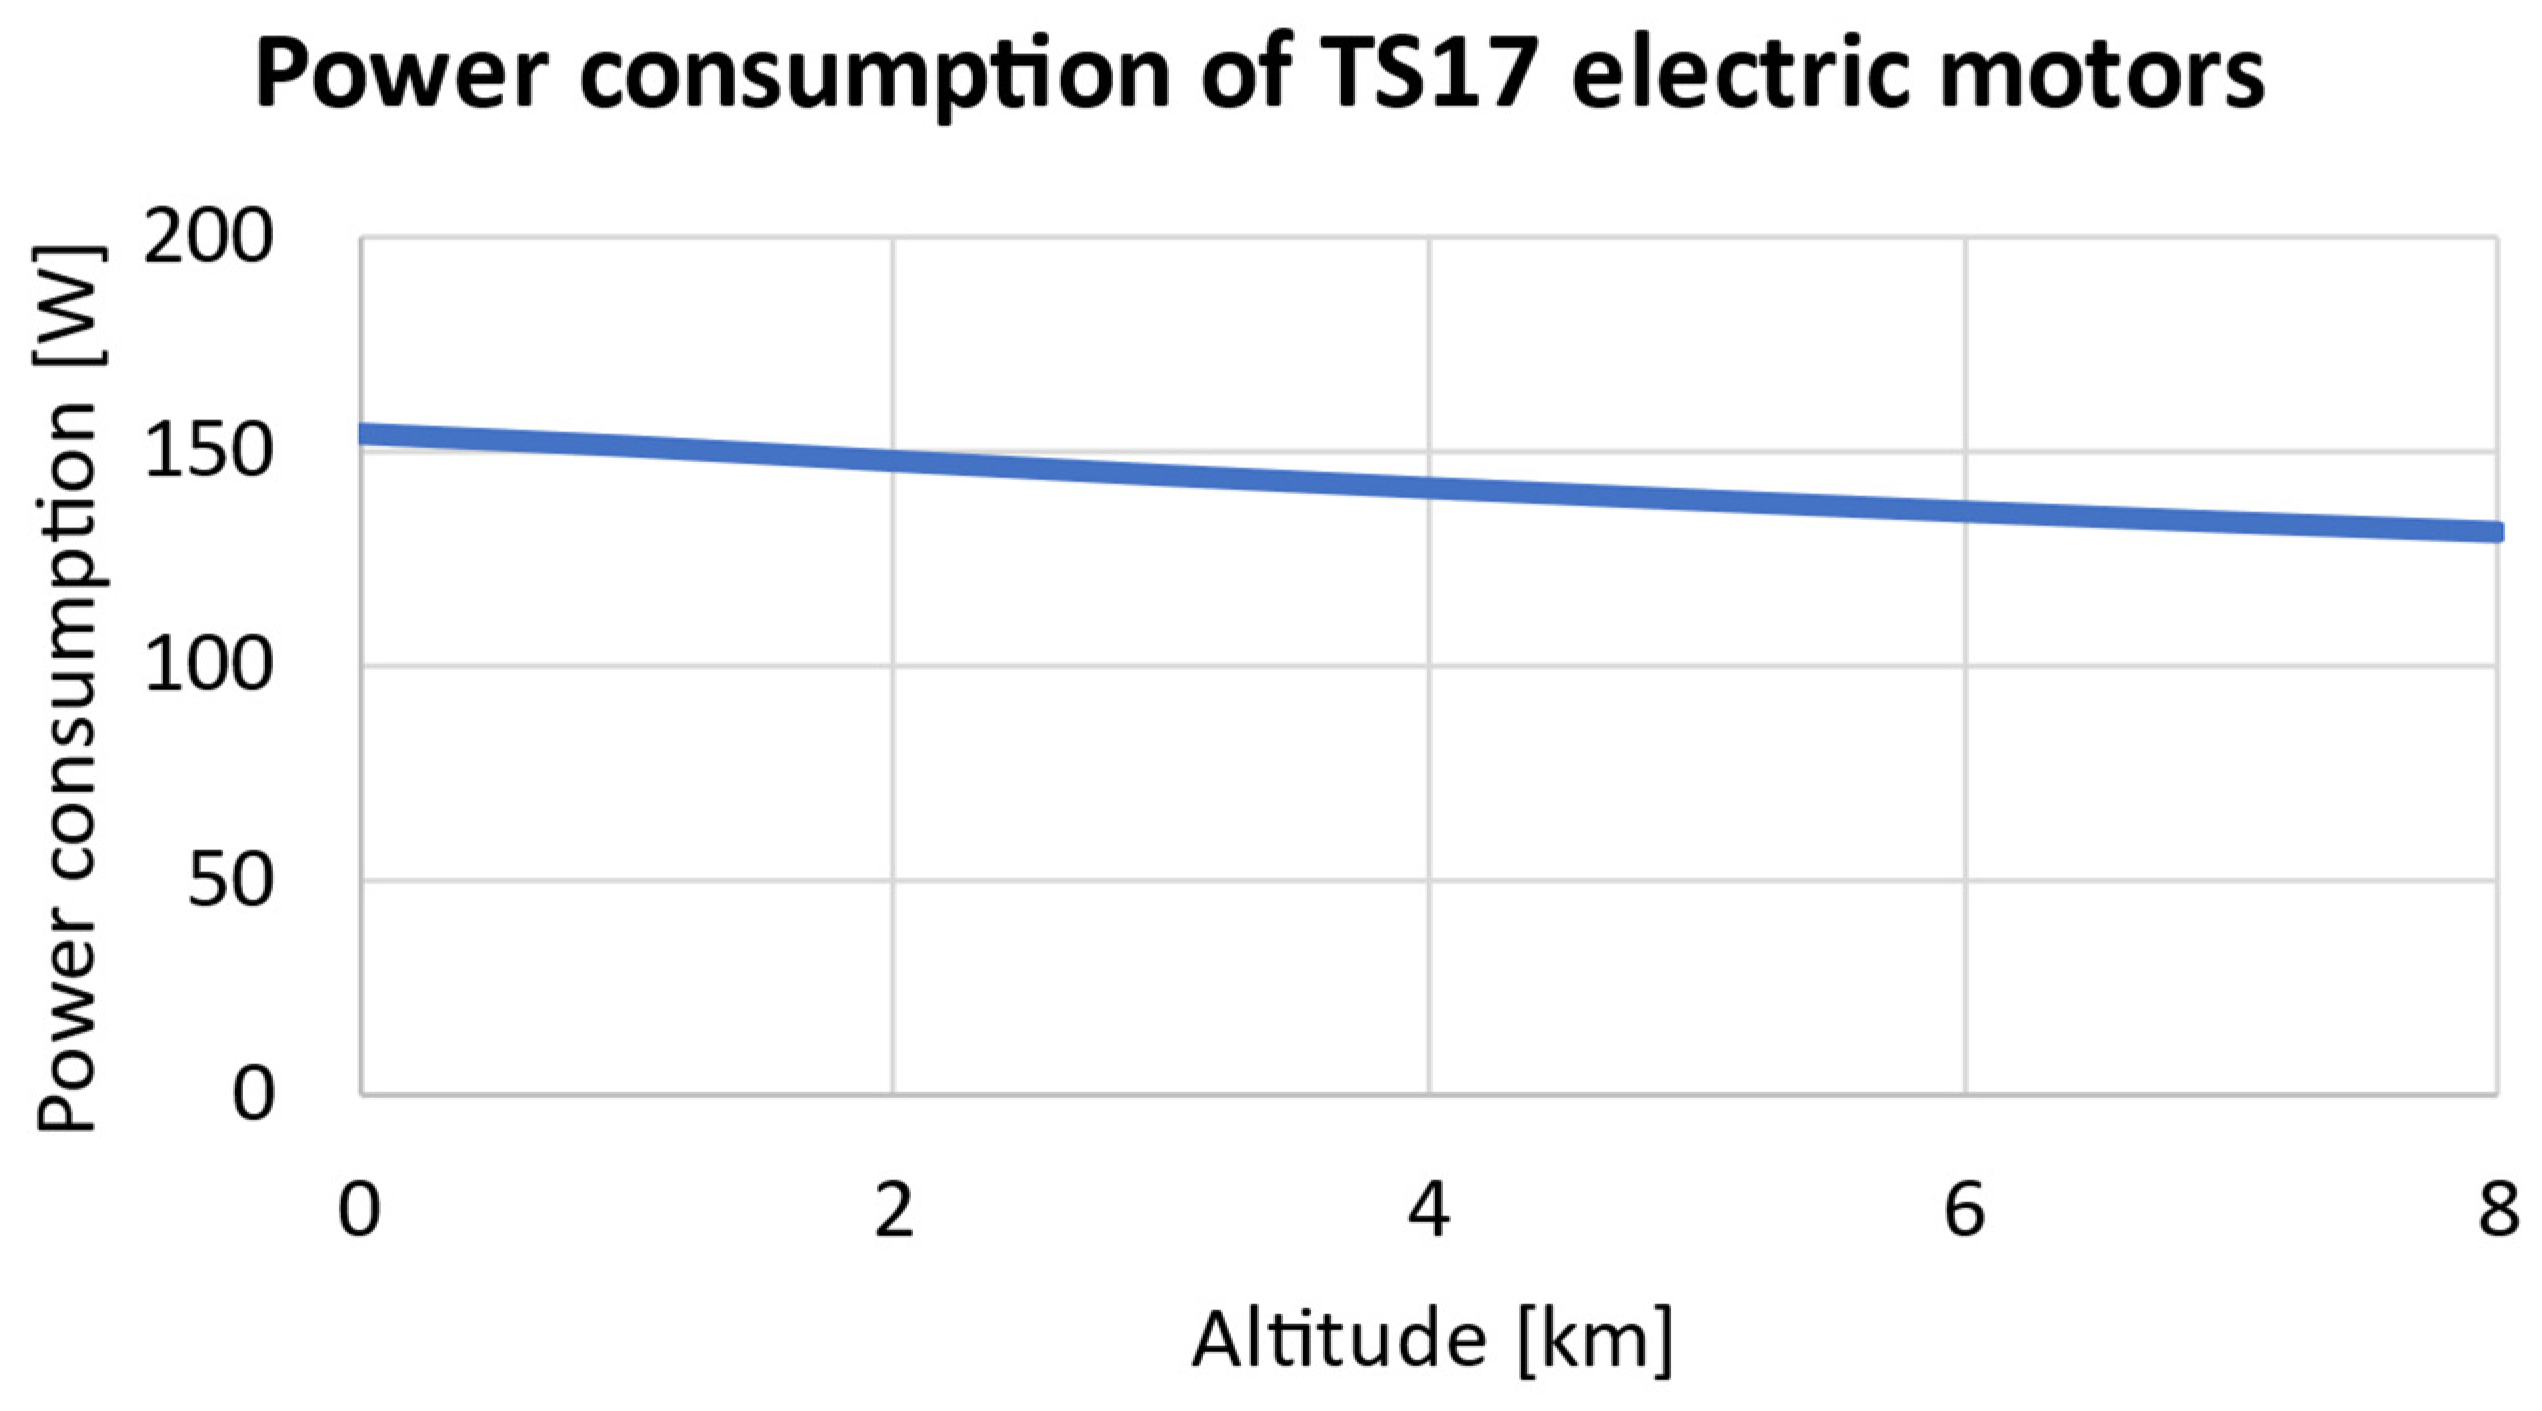
3.1. Power Consumption
- Flight Control Module (FCM): controls the UAV and carries out the prepared mission scenario;
- Environment: calculates the changes in the atmospheric parameters due to changes in the UAV altitude;
- Airframe: calculates, based on the information from Flight Control Module and Environment, the required torque and energy demand of the UAV to fly with the given parameters;
- Power Subsystem: consists of the following subsystems: Battery, Electric Motor and Loads, which are responsible for simulating the power demand for avionics.
- The electric motor runs on a direct current;
- The flight takes place in nonthermal and nonwind conditions;
- The battery operation is not affected by the temperature;
- The UAV is considered to be a mass point;
- The UAV is not equipped with solar cells.
3.2. Power Supply System Elements
3.2.1. Solar Cells
3.2.2. Battery Cells
3.3. Simulation Model
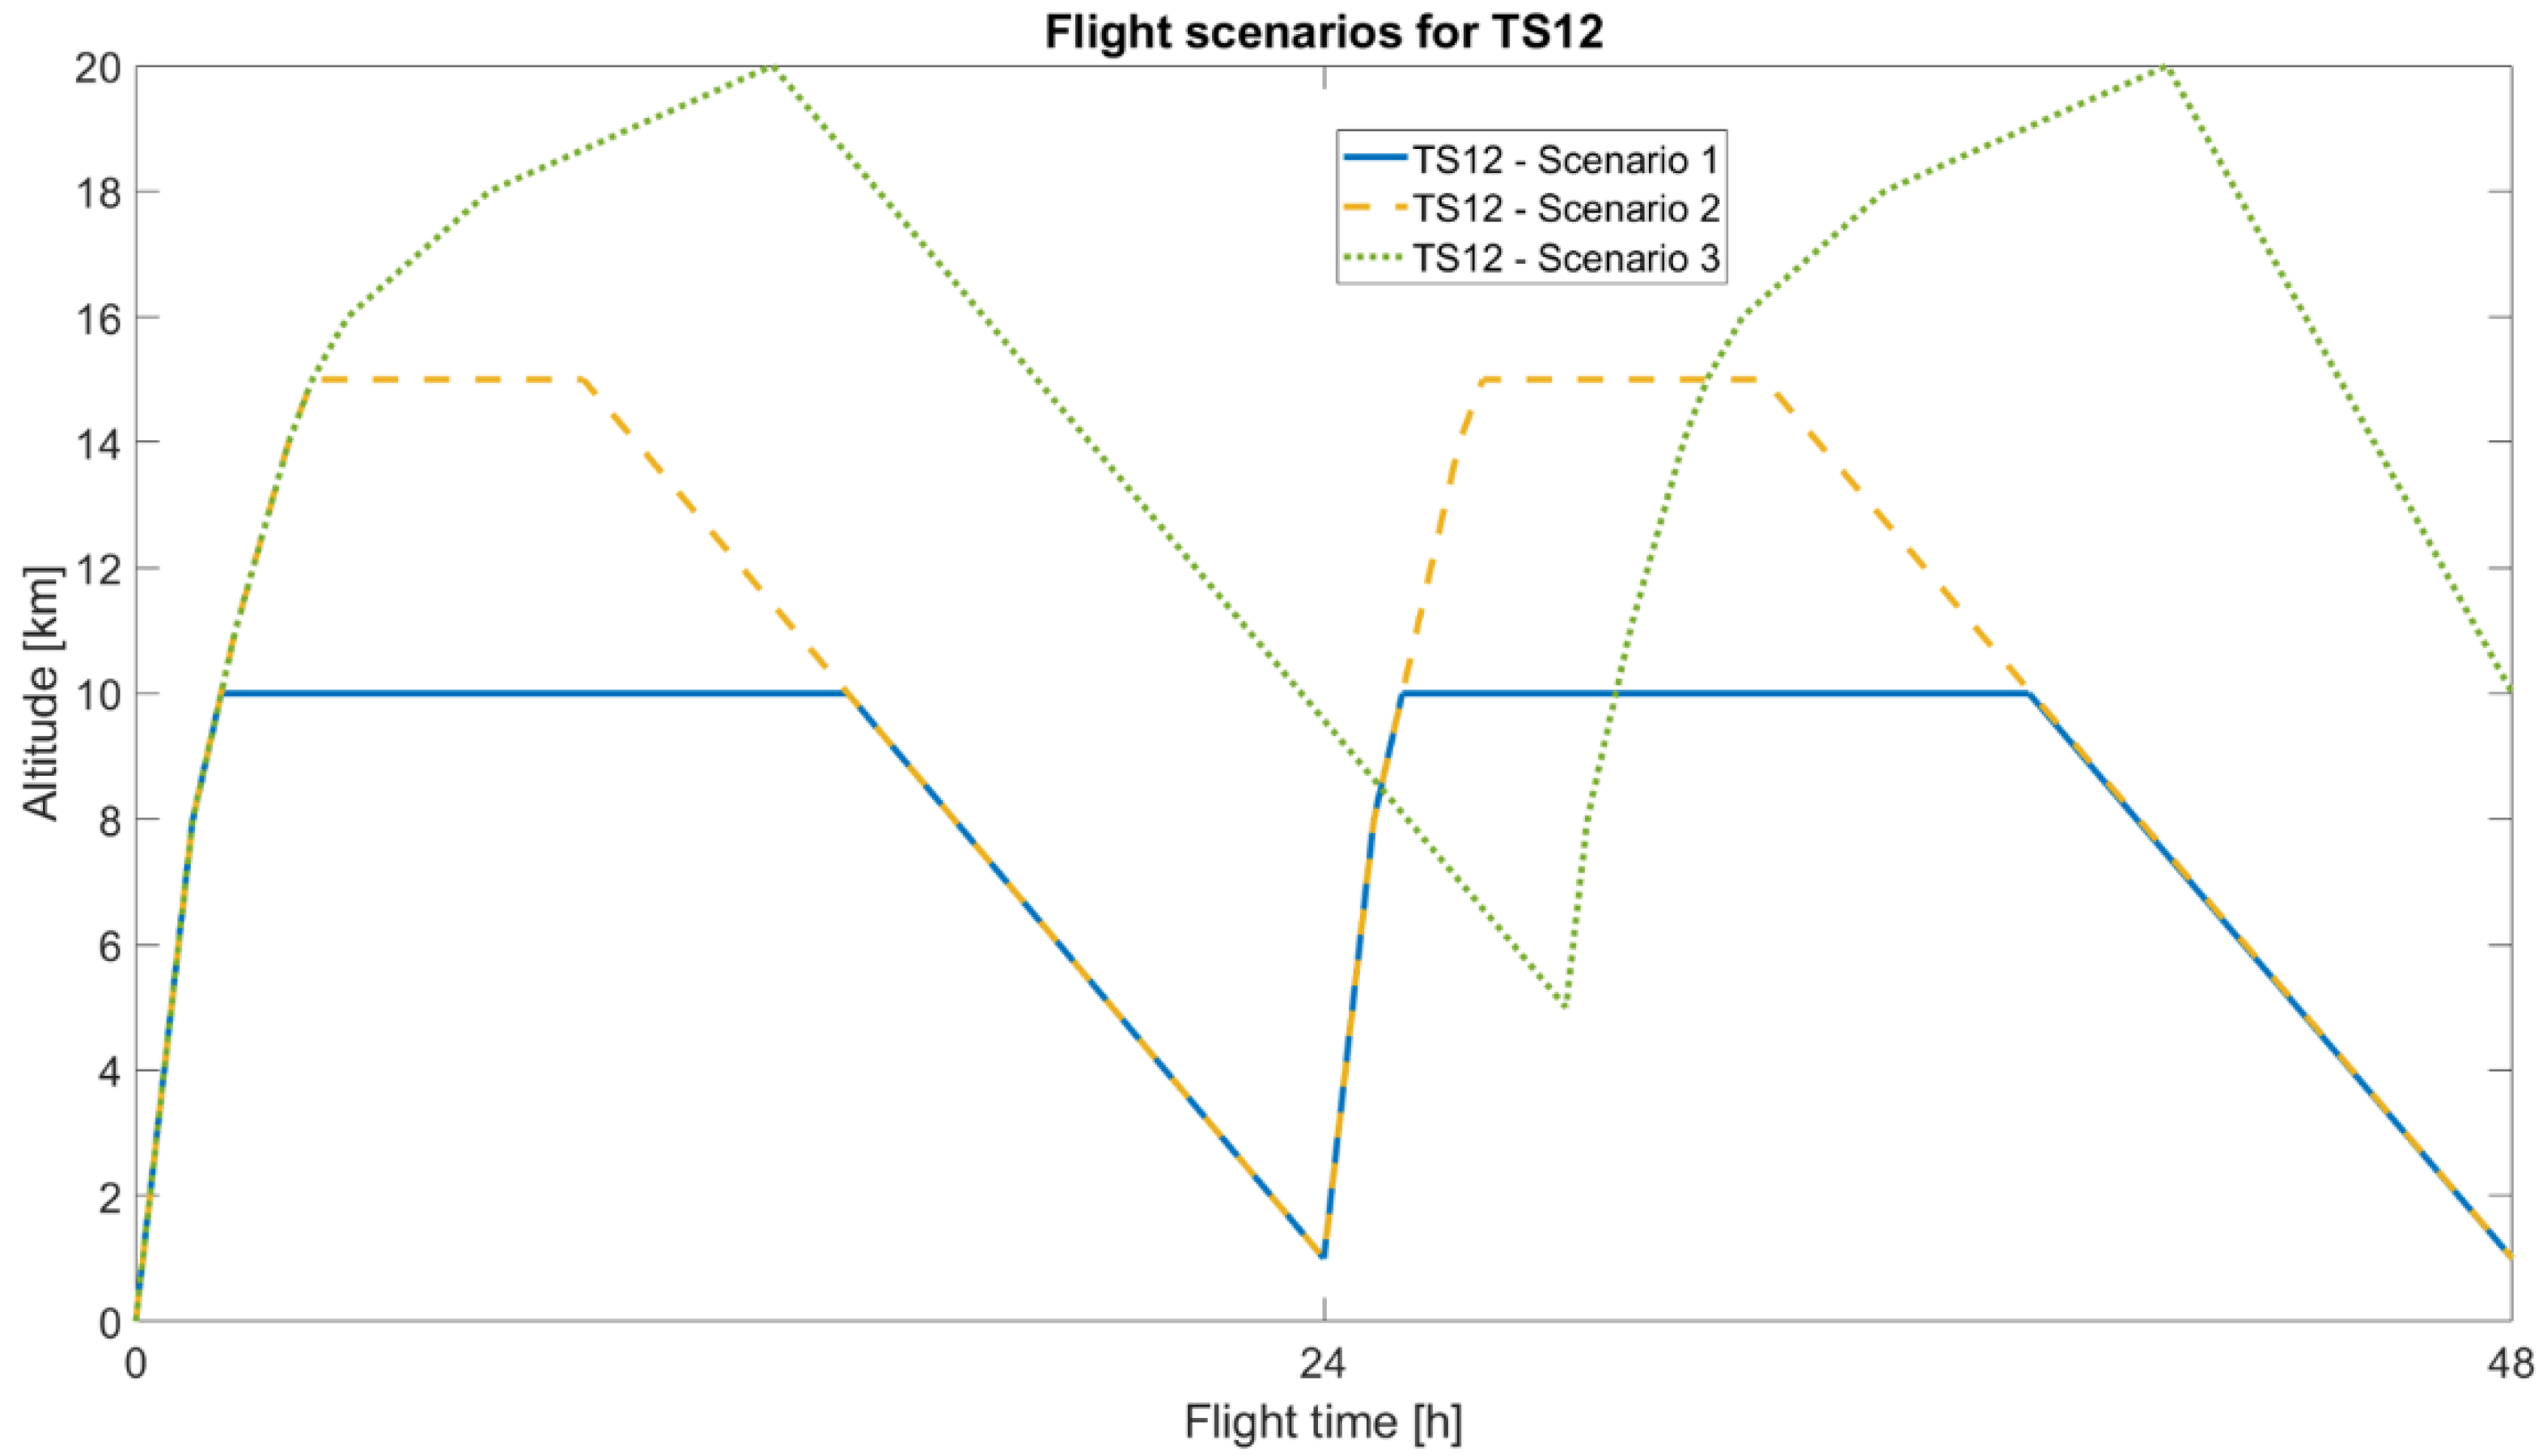
3.4. Scenarios of Path of Flight
- Ascending to a height of 5 km and then holding that ceiling. We start gliding to 1 km in this way to finish gliding in 24 h from the take-off
- Ascending to a height of 8 km and then holding that ceiling. We start gliding to 1 km in this way to finish gliding in 24 h from the take-off
- Ascending to a height of 10 km and then holding that ceiling. We start gliding to 1 km in this way to finish gliding in 24 h from the take-off.
- Ascending to a height of 15 km and then holding that ceiling. We start gliding to 1 km in this way to finish gliding in 24 h from the take-off.
- Ascending to a height of 20 km and then gliding to 1 km.

4. Results and Discussion
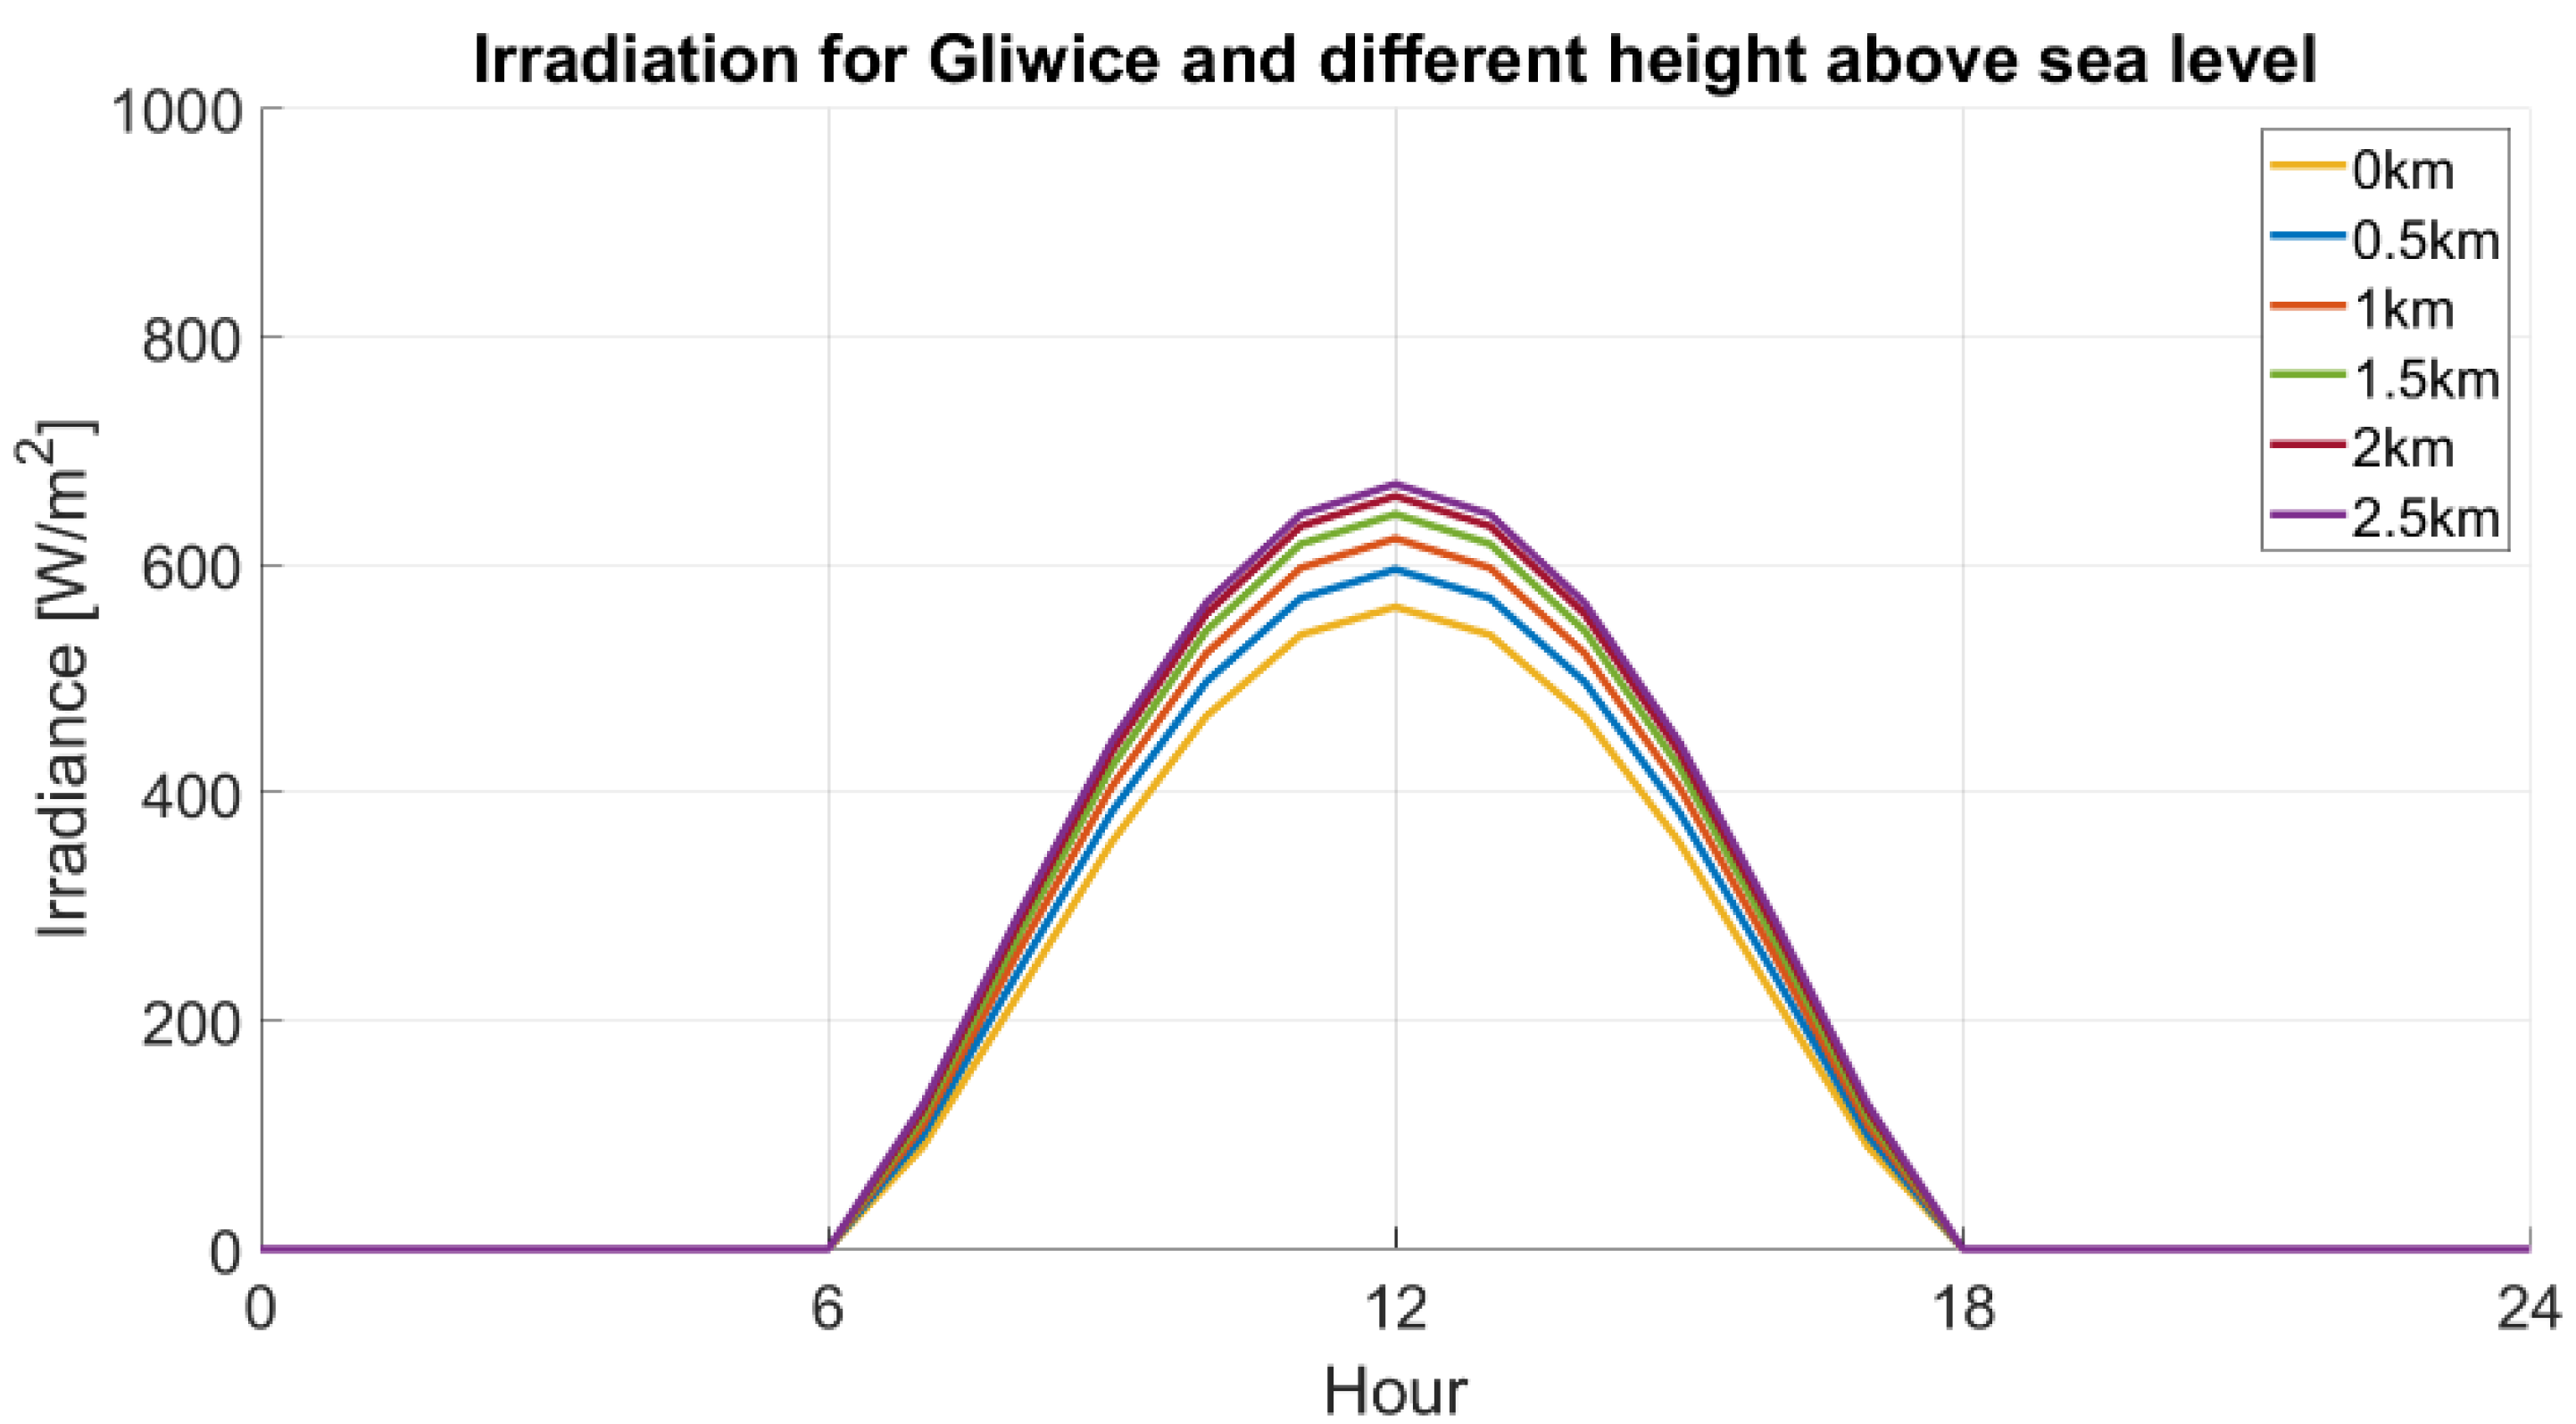
4.1. Irradiation Value in the Model
- Ny-Ålesund—latitude: 78°55′0″ N; longitude: 11°56′0″ E;
- Gliwice—latitude: 50°17′32″ N; longitude: 18°40′3″ E;
- Rome—latitude: 41°53′0″ N; longitude: 12°29′0″ E;
- Mexico City—latitude: 19°26′0″ N; longitude: 99°8′0″ W;
- Nairobi—latitude: 1°16′0″ S; longitude: 36°48′0″ E;
- 0 km—563 W/m2
- 0.5 km—596 W/m2
- 1 km—623 W/m2
- 1.5 km—644 W/m2
- 2 km—660 W/m2
- 2.5 km—670 W/m2

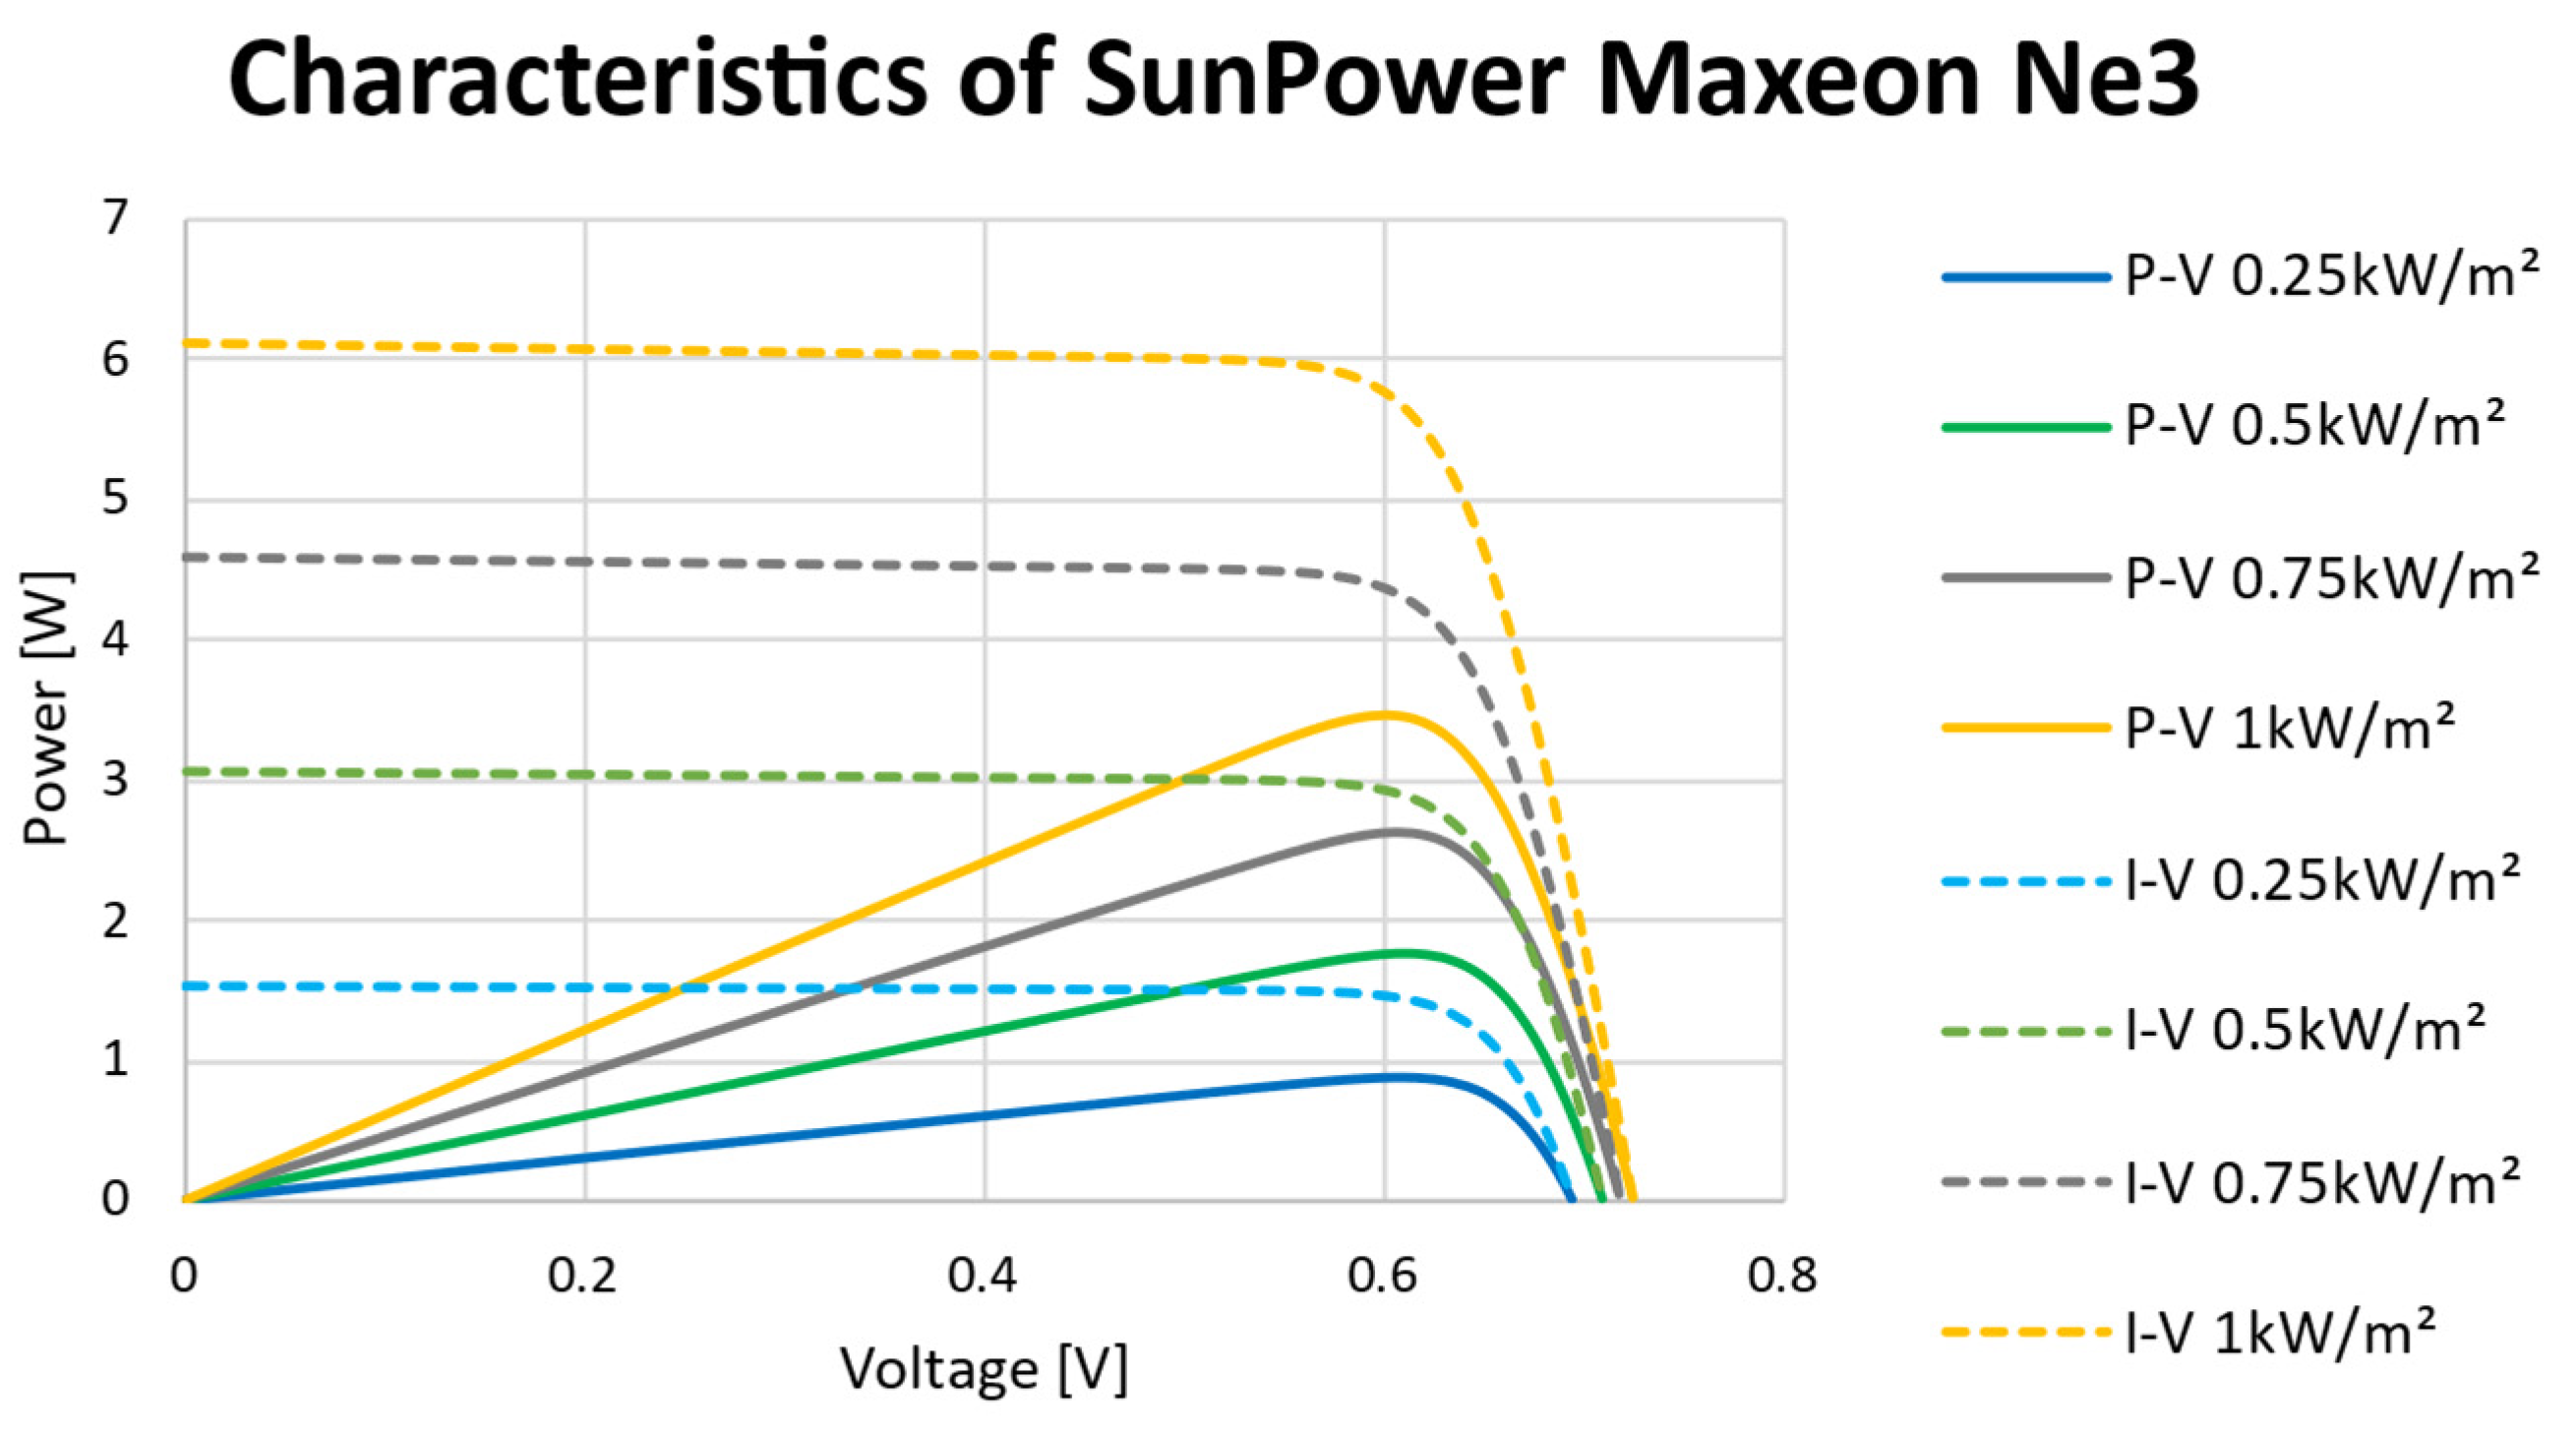
4.2. Solar cells
4.3. Power Consumption
4.4. Battery Cell
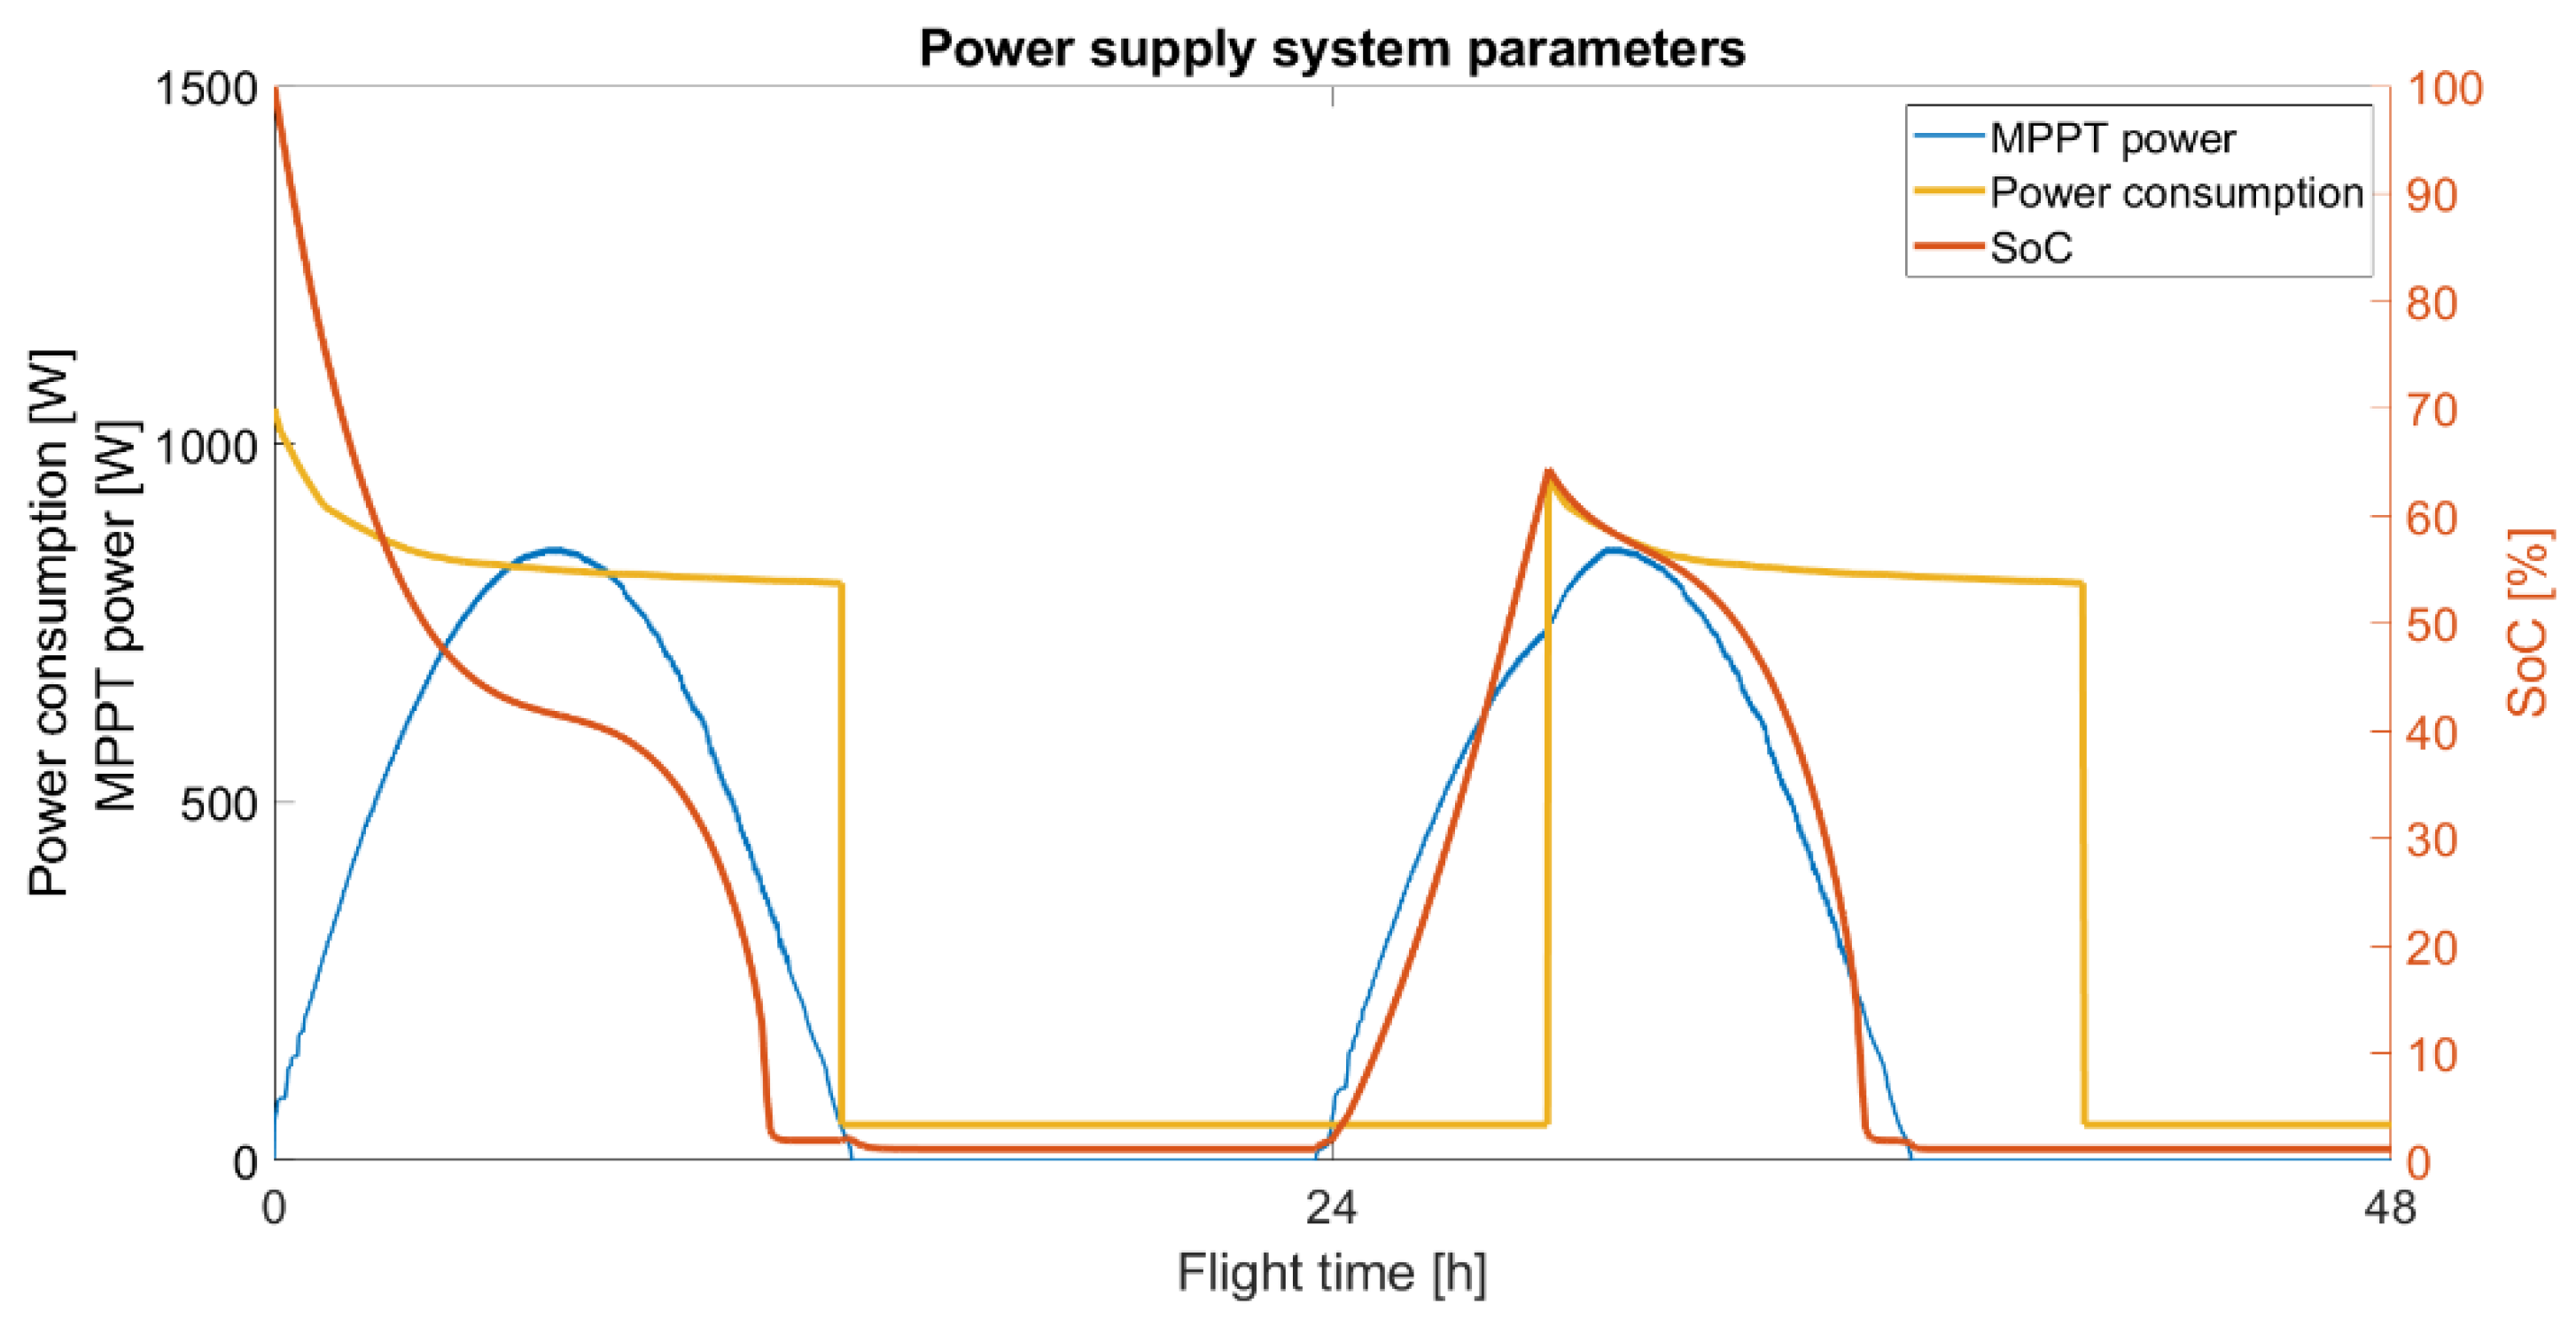
4.5. Power Supply System Simulation Model
4.5.1. Twin Stratos 17
4.5.2. Twin Stratos 12
5. Conclusions
- The flight begins at sunrise. Take-off and climb are the stages that consume the most energy, so it is good to compensate for high energy consumption with energy produced from the photovoltaic system;
- The potential energy accumulated in the form of height should be used as a time buffer, which is best used at night, when the photovoltaic system does not produce energy and the drive system does not consume energy from the power supply system;
- Continuous, gradual increase in altitude during the day and keeping the altitude as high as possible until sunset or even more depending on the type of mission;
- Commencement of the UAV gliding stage with sunset or supporting a specific altitude in such a way as to complete the stage of gliding to a given altitude with sunrise or later depending on the type of mission;
- Flight sustain should be performed at the highest altitudes due to the lower energy demand of UAV propulsion systems;
- When it is not possible to obtain a long endurance flight for the UAV, it may be necessary to change the flight duration, location, time of flight, or flight path;
- If it is not possible to obtain flight-long endurance for the key set parameters, it may be necessary to change the design of the UAV, the number of solar cells, the capacity of the battery, or the weight of the payload.
Author Contributions
Funding
Data Availability Statement
Acknowledgments
Conflicts of Interest
Abbreviations
| δ | Declination angle |
| θz | Zenith angle |
| φ | Latitude angle |
| τb | Ratio of the transmitted direct radiation to the total radiation incident at the top of the atmosphere |
| τd | Ratio of the transmitted diffuse radiation to the total radiation incident at the top of the atmosphere. |
| ω | Hour angle |
| A | Altitude of the site above sea level |
| AGV | Automated Guided Vehicle |
| AM | Air mass |
| AoA | Angle of Attack |
| BMS | Battery Management System |
| DSSC | Dye-sensitized solar cell |
| FCM | Flight Control Module |
| Gc | Total radiation |
| Gcb | Beam radiation |
| Gcd | Diffuse radiation |
| Gon | Irradiation on surface |
| GSC | Solar constant |
| GaAs | Gallium arsenide |
| Ho | Daily radiation |
| HR | Relative height of the flight in meters, |
| Ic | Hourly radiation on a horizontal surface |
| Imp | Optimum Operating Current |
| Io | Hourly radiation |
| Isc | Short Circuit Current |
| I-V | Current-Voltage |
| MBD | Model-Based Design |
| n | Day of the year |
| N | Day length |
| Pmpp | Nominal Maximum Power |
| P-V | Power-Voltage |
| PV | Photovoltaics |
| PVC | Polyvinyl Chloride |
| r0, r1, rk | Coefficients for climate type |
| ROC | Rate of Climb |
| ROD | Rate of Descent |
| SoC | State of Charge |
| TC | Current temperature on the height of the flight |
| TD | Temperature drop |
| TI | Temperature on the ground |
| TS12 | TwinStratos 1:2 |
| TS17 | TwinStratos 1:7 |
| UAV | Unmanned Aerial Vehicle |
| Voc | Open Circuit Voltage |
| Vmp | Optimum Operating Voltage |
References
- Li, X.; Yang, L. Design and Implementation of UAV Intelligent Aerial Photography System. In Proceedings of the 2012 4th International Conference on Intelligent Human-Machine Systems and Cybernetics, Nanchang, China, 26–27 August 2012; pp. 200–203. [Google Scholar]
- Chadwick, S.; Miller, C.R. Military Unmanned Aerial Vehicles and Diversification Opportunities. Mississippi Defense Diversification Initiative. 2018, pp. 1–70. Available online: https://aquila.usm.edu/fac_pubs/16830 (accessed on 2 November 2022).
- Doskocz, J.; Kardasz, P.; Hejduk, M.; Wiejkut, P. The possibilities of using drones in the courier services. World Sci. News 2016, 48, 119–132. [Google Scholar]
- Papež, N.; Dallaev, R.; Ţălu, Ş.; Kaštyl, J. Overview of the Current State of Gallium Arsenide-Based Solar Cells. Materials 2021, 14, 3075. [Google Scholar] [CrossRef] [PubMed]
- Oettershagen, P.; Melzer, A.; Mantel, T.; Rudin, K.; Lotz, R.; Siebenmann, D. A Solar-Powered Hand-Launchable UAV for Low-Altitude Multi-Day Continuous Flight. In Proceedings of the IEEE International Conference on Robotics and Automation (ICRA), Seattle, DC, USA, 26–30 May 2015; pp. 3986–3993. [Google Scholar]
- Oettershagen, P.; Melzer, A.; Mantel, T.; Rudin, K.; Stastny, T.; Wawrzacz, B.; Hinzmann, T.; Leutenegger, S.; Alexis, K.; Siegwart, R. Design of small hand-launched solar-powered UAVs: From concept study to a multi-day world endurance record flight. J. Field Robot. 2017, 34, 1352–1377. [Google Scholar] [CrossRef]
- Zephyr-UAV-Airbus. Available online: https://www.airbus.com/defence/uav/zephyr.html (accessed on 1 November 2022).
- Solar Impulse. Available online: https://aroundtheworld.solarimpulse.com/ (accessed on 1 November 2022).
- PHASA-35 First Flight|Newsroom|BAE Systems|International. 2020. Available online: https://www.baesystems.com/en/article/ground-breaking-solar-powered-unmanned-aircraft-makes-first-flight (accessed on 1 November 2022).
- High Altitude, Ultra-Long Endurance, Pseudo-Satellite—HAPS—Odysseus—Aurora Flight Sciences. Available online: https://www.aurora.aero/odysseus-high-altitude-pseudo-satellite-haps/ (accessed on 1 November 2022).
- Rydh, C.J.; Sandén, B.A. Energy analysis of batteries in photovoltaic systems Part II: Energy return factors and overall battery efficiencies. Energy Convers. Manag. 2005, 46, 1980–2000. [Google Scholar] [CrossRef]
- Rydh, C.J.; Sandén, B.A. Energy analysis of batteries in photovoltaic systems. Part I: Performance and energy requirements. Energy Convers. Manag. 2005, 46, 1957–1979. [Google Scholar] [CrossRef]
- Omazic, A.; Oreski, G.; Halwachs, M.; Eder, G.C.; Hirschl, C.; Neumaier, L.; Pinter, G.; Erceg, M. Relation between degradation of polymeric components in crystalline silicon PV module and climatic conditions: A literature review. Sol. Energy Mater. Sol. Cells 2019, 192, 123–133. [Google Scholar] [CrossRef]
- Xue, B.; Li, F.; Song, M.; Shang, X.; Cui, D.; Chu, J.; Dai, S. Crack Extraction for Polycrystalline Solar Panels. Energies 2021, 14, 374. [Google Scholar] [CrossRef]
- Li, X.; Li, P.; Wu, Z.; Luo, D.; Yu, H.Y.; Lu, Z.H. Review and perspective of materials for flexible solar cells. Mater. Rep. Energy 2021, 1, 100001. [Google Scholar] [CrossRef]
- Blakers, A.W.; Armour, T. Flexible silicon solar cells. Sol. Energy Mater. Sol. Cells 2009, 93, 1440–1443. [Google Scholar] [CrossRef]
- Li, J.; Aierken, A.; Zhuang, Y.; Xu, P.Q.; Wu, H.Q.; Zhang, Q.Y.; Wang, X.B.; Mo, J.H.; Yang, X.; Chen, Q.Y.; et al. 1 MeV electron and 10 MeV proton irradiation effects on inverted metamorphic GaInP/GaAs/InGaAs triple junction solar cell. Sol. Energy Mater. Sol. Cells 2021, 224, 111022. [Google Scholar] [CrossRef]
- Kim, S.; Hoang, V.Q.; Bark, C.W. Silicon-Based Technologies for Flexible Photovoltaic (PV) Devices: From Basic Mechanism to Manufacturing Technologies. Nanomaterials 2021, 11, 2944. [Google Scholar] [CrossRef]
- Szindler, M.; Szindler, M.; Drygała, A.; Lukaszkowicz, K.; Kaim, P.; Pietruszka, R. Dye-Sensitized Solar Cell for Building-Integrated Photovoltaic (BIPV) Applications. Materials 2021, 14, 3743. [Google Scholar] [CrossRef]
- Ezhov, A.; Zhdanova, K.A.; Bragina, N.A.; Mironov, A.F. Approaches to Improve Efficiency of Dye-Sensitized Solar Cells. Macroheterocycles 2016, 9, 337–352. [Google Scholar] [CrossRef]
- Kokkos, S.; Morfidis, E. Aerodynamic Design and Analysis of Solar Powered UAV (Unmanned Aerial Vehicle); University of Thessaly: Volos, Greece, 2020. [Google Scholar]
- Tsach, S.; Ankri, L.; Cohen, M.; Ehrlich, Y.; Goldenberg, T.; Levy, H.; Regev, I.; Vladimirsky, A.; Weider, A.; Yossef, Z. Sunsailor: Solar Powered UAV. In Proceedings of the 47th Israel Annual Conference on Aerospace Sciences, Tel Aviv, Israel, 21–22 February 2007. [Google Scholar]
- Sousa, J.C. Solar System for a Long Endurance Electric UAV. Master’s Thesis, University of Beira Interior, Covilhã, Portuguese, 2015. [Google Scholar]
- Oettershagen, P. Solar-Powered Unmanned Aerial Vehicles: Design and Environment-Aware Navigation for Robust Low-Altitude Multi-Day Continuous Flight. Ph.D. Thesis, ETH Zurich, Zurich, Switzerland, 2018. [Google Scholar]
- Polymers Aiding Solar Impulse 2’s Round-the-World Adventure. Available online: https://knowledge.ulprospector.com/4541/polymers-aiding-solar-impulse-2s-round-world-adventure/ (accessed on 1 November 2022).
- Miao, Y.; Hynan, P.; von Jouanne, A.; Yokochi, A. Current Li-Ion Battery Technologies in Electric Vehicles and Opportunities for Advancements. Energies 2019, 12, 1074. [Google Scholar] [CrossRef]
- Horiba, T. Lithium-Ion Battery Systems. Proc. IEEE 2014, 102, 939–950. [Google Scholar] [CrossRef]
- Verma, D.; Nema, S.; Shandilya, A.M.; Dash, S.K. Maximum power point tracking (MPPT) techniques: Recapitulation in solar photovoltaic systems. Renew. Sustain. Energy Rev. 2016, 54, 1018–1034. [Google Scholar] [CrossRef]
- Hannan, M.A.; Hoque, M.M.; Hussain, A.; Yusof, Y.; Ker, P.J. State-of-the-art and energy management systems of Li-ion batteries in EV applications: Issues and recommendations. IEEE Access 2018, 6, 19362–19378. [Google Scholar] [CrossRef]
- Pham, K.L.; Leuchter, J.; Bystricky, R.; Andrle, M.; Pham, N.N.; Pham, V.T. The Study of Electrical Energy Power Supply System for UAVs Based on the Energy Storage Technology. Aerospace 2022, 9, 500. [Google Scholar] [CrossRef]
- Skarka, W. Methodology for The Optimization of An Energy Efficient Electric Vehicle. In Proceedings of the IRF 2018 6th International Conference Integrity-Reliability-Failure, Lisbon, Portugal, 22–26 July 2018. [Google Scholar]
- Mateja, K.; Skarka, W. Towards energetic autonomy of UAV. In Proceedings of the 27th ISTE International Conference on Transdisciplinary Engineering, Warsaw, Poland, 6–10 July 2020; pp. 423–432. [Google Scholar]
- Niestrój, R.; Rogala, T.; Skarka, W. An Energy Consumption Model for Designing an AGV Energy Storage System with a PEMFC Stack. Energies 2020, 13, 3435. [Google Scholar] [CrossRef]
- Targosz, M.; Skarka, W.; Przystałka, P. Model-based optimization of velocity strategy for lightweight electric racing cars. J. Adv. Transp. 2018, 2018, 3614025. [Google Scholar] [CrossRef]
- Peciak, M.; Skarka, W. Assessment of the Potential of Electric Propulsion for General Aviation Using Model-Based System Engineering (MBSE) Methodology. Aerospace 2022, 9, 74. [Google Scholar] [CrossRef]
- Kalogirou, S. Solar Energy Engineering: Processes and Systems; Elsevier: Amsterdam, The Netherlands; Academic Press: Burlington, MA, USA, 2009. [Google Scholar]
- Page, J. Chapter IIA-1-The Role of Solar-Radiation Climatology in the Design of Photovoltaic Systems. In Practical Handbook of Photovoltaics, 2nd ed.; Academic Press: Cambridge, MA, USA, 2012; pp. 573–643. [Google Scholar] [CrossRef]
- Aktaş, A.; Kirçiçek, Y. Chapter 13-Examples of Solar Hybrid System Layouts, Design Guidelines, Energy Performance, Economic Concern, and Life Cycle Analyses. In Solar Hybrid Systems; Academic Press: Cambridge, MA, USA, 2021; pp. 331–349. [Google Scholar] [CrossRef]
- Duffie, J.A.; Beckman, W.A. Solar Engineering of Thermal Processes, 4th ed.; John Wiley & Sons, Inc.: Hoboken, NJ, USA, 2013. [Google Scholar] [CrossRef]
- Hottel, H.C. A simple model for estimating the transmittance of direct solar radiation through clear atmospheres. Solar Energy 1976, 18, 129–134. [Google Scholar] [CrossRef]
- Zhang, L.; Li, J.; Wu, Y.; Lv, M. Analysis of attitude planning and energy balance of stratospheric airship. Energy 2019, 183, 1089–1103. [Google Scholar] [CrossRef]
- Cloud Classifications and Characteristics. Available online: https://www.weather.gov/media/lmk/soo/cloudchart.pdf (accessed on 1 November 2022).
- Wacker, S.; Gröbner, J.; Zysset, C.; Diener, L.; Tzoumanikas, P.; Kazantzidis, A.; Vuilleumier, L.; Stöckli, R.; Nyeki, S.; Kämpfer, N. Cloud observations in Switzerland using hemispherical sky cameras. J. Geophys. Res. 2015, 120, 695–707. [Google Scholar] [CrossRef]
- Smith, C.J.; Bright, J.M.; Crook, R. Cloud cover effect of clear-sky index distributions and differences between human and automatic cloud observations. Solar Energy 2017, 144, 10–21. [Google Scholar] [CrossRef]
- Myers, D.R. Solar Radiation: Practical Modeling for Renewable Energy Applications; CRC Press: Boca Raton, FL, USA, 2017. [Google Scholar]
- Most Efficient Solar Panels 2022. Available online: https://www.cleanenergyreviews.info/blog/most-efficient-solar-panels (accessed on 1 November 2022).
- Layers of the Atmosphere. Available online: https://www.weather.gov/jetstream/layers (accessed on 1 November 2022).
- Hemond, H.F.; Fechner, E.J. Chapter 4-The Atmosphere. In Chemical Fate and Transport in the Environment, 3rd ed.; Academic Press: Cambridge, MA, USA, 2015; pp. 311–454. [Google Scholar] [CrossRef]
- Horrein, L.; Bouscayrol, A.; Delarue, P.; Verhille, J.N.; Mayet, C. Forward and Backward simulations of a power propulsion system. IFAC Proc. Vol. 2012, 45, 441–446. [Google Scholar] [CrossRef]
- Datasheet SunPower Maxeon Ne3. Available online: https://www.makeyoursolar.com/ (accessed on 8 December 2022).
- Mateja, K.; Skarka, W.; Drygała, A. Efficiency Decreases in a Laminated Solar Cell Developed for a UAV. Materials 2022, 15, 8774. [Google Scholar] [CrossRef]
- IEC 60904-3; Photovoltaic devices—Part 3: Measurement Principles for Terrestrial Photovoltaic (PV) Solar Devices with Reference Spectral Irradiance Data. IEC: Geneva, Switzerland, 2019.
- IEC 60904-1; Photovoltaic Devices—Part 1: Measurement of PV Current-Voltage Characteristics. IEC: Geneva, Switzerland, 2019.


| Climate Type | Sample location | |||
|---|---|---|---|---|
| Tropical | 0.95 | 0.98 | 1.02 | Nairobi |
| Midlatitude summer | 0.97 | 0.99 | 1.02 | Rome |
| Subarctic summer | 0.99 | 0.99 | 1.01 | Ny-Ålesund |
| Midlatitude winter | 1.03 | 1.01 | 1.00 | Gliwice |
| Parameter | TS17 | TS12 |
|---|---|---|
| Mass [kg] | 9.4 | 45 |
| Wingspan [m] | 3.6 | 12.4 |
| Payload [kg] | 2.5 | 2.5 |
| Wing area [m2] | 0.896 | 8.6 |
| Rate of Climb (ROC) [m/s] | 0.999 | 1.5 |
| Rate of Descent (ROD) [m/s] | 0.41 | 0.26 |
| Climb speed [m/s] | 13.3 | 11.1 |
| Cruise speed [m/s] | 13 | 13.9 |
| Descend speed [m/s] | 6.5 | 9.5 |
| Angle of Attack range [°] | −3 to 8 | −3 to 5 |
| Maximum altitude [km] | 8 | 20 |
| Power supply system parameters—described in the below subchapters | ||
| Battery capacity [kWh] | 0.622 | 2.797 |
| Battery connection | 4S12P | 12S18P |
| Battery mass [kg] | 2.4 | 10.8 |
| Number of solar cells | 40 | 350 |
| Solar cell connection | 40S1P | 70S5P |
| Altitude [km] | TS17 | Altitude [km] | TS12 |
|---|---|---|---|
| From 0 to 2 | 3° | From 0 to 10 | 5° |
| From 2 to 5 | 2° | From 10 to 15 | 4° |
| From 5 to 6 | 1° | From 15 to 17 | 2° |
| From 6 to 8 | 0.5° | From 17 to 20 | 1° |
| Data | Manufacturer Data (Non-Laminated) | Non-Laminated | Laminated (100 μm Film) |
|---|---|---|---|
| Voc [V] | >0.731 | 0.733 | 0.726 |
| Isc [A] | >6.382 | 6.330 | 6.061 |
| Vmp [V] | >0.625 | 0.627 | 0.624 |
| Imp [A] | >6.050 | 5.92 | 5.747 |
| Pmpp [Wp] | >3.77 | 3.71 | 3.589 |
| Efficiency [%] | >24.34 | 24.29 | 23.33 |
| Laminated SunPower Maxeon Ne3 | ||||
|---|---|---|---|---|
| Irradiation [W/m2] | Voltage [V] | Current [A] | Power [W] | Fill Factor [%] |
| 1000 | 0.624 | 5.748 | 3.588 | 81 |
| 750 | 0.622 | 4.317 | 2.684 | 61 |
| 500 | 0.618 | 2.872 | 1.776 | 40 |
| 250 | 0.606 | 1.437 | 0.871 | 19.8 |
| Laminated SunPower Maxeon Ne3 | ||||
|---|---|---|---|---|
| Temperature | Voltage [V] | Current [A] | Power [W] | Fill Factor [%] |
| 0 | 0.671 | 5.706 | 3.827 | 87 |
| 25 | 0.624 | 5.748 | 3.588 | 81 |
| 50 | 0.578 | 5.779 | 3.343 | 76 |
| 75 | 0.532 | 5.813 | 3.092 | 70.2 |
| Stage of Flight | TS17 | TS12 |
|---|---|---|
| Cruise flight | 0.28 A | 0.25 A |
| Climbing | ~1.1 A | ~1.1 A |
| Descend—without work of electric motors (avionics) | 0.11 A | 0.06 A |
Disclaimer/Publisher’s Note: The statements, opinions and data contained in all publications are solely those of the individual author(s) and contributor(s) and not of MDPI and/or the editor(s). MDPI and/or the editor(s) disclaim responsibility for any injury to people or property resulting from any ideas, methods, instructions or products referred to in the content. |
© 2023 by the authors. Licensee MDPI, Basel, Switzerland. This article is an open access article distributed under the terms and conditions of the Creative Commons Attribution (CC BY) license (https://creativecommons.org/licenses/by/4.0/).
Share and Cite
Mateja, K.; Skarka, W.; Peciak, M.; Niestrój, R.; Gude, M. Energy Autonomy Simulation Model of Solar Powered UAV. Energies 2023, 16, 479. https://doi.org/10.3390/en16010479
Mateja K, Skarka W, Peciak M, Niestrój R, Gude M. Energy Autonomy Simulation Model of Solar Powered UAV. Energies. 2023; 16(1):479. https://doi.org/10.3390/en16010479
Chicago/Turabian StyleMateja, Krzysztof, Wojciech Skarka, Magdalena Peciak, Roman Niestrój, and Maik Gude. 2023. "Energy Autonomy Simulation Model of Solar Powered UAV" Energies 16, no. 1: 479. https://doi.org/10.3390/en16010479
APA StyleMateja, K., Skarka, W., Peciak, M., Niestrój, R., & Gude, M. (2023). Energy Autonomy Simulation Model of Solar Powered UAV. Energies, 16(1), 479. https://doi.org/10.3390/en16010479