1. Introduction
The power industry accounts for 40% of China’s total carbon emissions. Under the dual-carbon goal, the existing power system urgently needs to be transformed into a new power system with new energy as the main body [
1,
2], it will require a high proportion of renewable energy to be connected to the grid. However, it also brings new challenges to the grid to balance supply and demand [
3,
4]. Therefore, we must pay more and more attention to the “ballast stone” role of thermal power plants in a power system [
5]. In terms of the advantages and disadvantages of various energy forms, the disadvantages of renewable energy are randomness, volatility, uncontrollability, and anti-peaking [
6,
7,
8], but the advantage is zero carbon emissions. However, the advantage of thermal power is that it is stable and controllable, but the disadvantage is that it emits a lot of carbon. Therefore, the construction of a new power system must comprehensively consider the characteristics of stability, flexibility [
9,
10,
11,
12], and low-carbon environmental protection.
The Energy Internet is an important way for the green and low-carbon transformation of energy, and it is also the best practice and link for building a new power system with new energy as the main body [
13,
14]. The form of the Energy Internet directly determines the carbon reduction and emission reduction mechanism of a new power system. It needs to start with the four links of “source-grid-load-storage” and the model of “source-load interaction” [
15,
16]. It needs to specifically analyze the carbon emission factors, the carbon control model and low-carbon evaluation system, and their differences in different links, so as to actively guide different subjects in the four major links of “source-grid-load-storage” to actively take carbon emission reduction measures. In terms of importance, the source end is the most important thing in the power system, followed by the grid end, and the energy storage end. On the load side, the power system needs to guide users to use energy efficiently based on social responsibility. Therefore, the key link in the study of carbon reduction and emission reduction in a new power system lies in the source, and the most important thing is the thermal power plant represented by coal-fired power plants.
When a new power system gradually increases the access ratio of new energy, it also faces many challenges, such as the random load peak, dynamic security and frequency stability, and market price fluctuation [
17]. Therefore, coal-fired power plants have made an indelible contribution to the stability of the power system to a large extent. The literature [
18] believes that in the future, the installed capacity and generating capacity of synchronous power sources such as thermal power and nuclear power will continue to decline, but still occupy a considerable proportion. Coal power will play a role of supporting the bottom from “capacity increase and capacity control” and “capacity control and capacity reduction” to capacity reduction. The literature [
19] holds that there is a huge scale of coal power in China, and the transformation and development of coal power in the future will be the key to construct a new power system with new energy as the main. According to the literature [
20], under the condition that the proportion of new energy gradually increases, the decommissioning of coal power units will cause the shortage of power generation and insufficient flexibility of the system. The literature [
21,
22] points out that during the “14th Five-Year Plan” period, the construction of a new power system needs to clarify the positioning of coal power. While limiting the construction of coal power, the development of new energy will no longer take the single pursuit of improving the utilization rate of new energy power generation as the only measurement index. According to the literature [
23], thermal power units are still the main power supply structure in China at the present stage, and the utilization of thermal power units to adjust the capacity to achieve renewable energy consumption is still the main choice of the current power grid. The literature [
24,
25] considers that the existing resources of the Chinese electric power system are the largest with the capacity of conventional thermal power units, which has the potential to become flexible resources. According to the literature [
26], the access of a high proportion of renewable energy and the demand for green development of the power system have put forward higher requirements for the regulatory performance and carbon emission control of the existing conventional thermal power units. In combination with the development planning, future form, and system architecture of the new power system, the above literature studied and analyzed the future positioning of coal and electricity, the production limit of coal and electricity, the carbon reduction of coal and electricity, and the low-carbon operation of coal and electricity, but did not deeply study the carbon emission model and evaluation system of a new power system.
Therefore, this paper first studies and analyzes the energy efficiency coefficient and carbon emission factors of the four major links of “source-grid-load-storage” in the Energy Internet under a new power system. Furthermore, this paper builds a carbon control model. Secondly, this paper studies the five electricity-carbon coupling dimensions of power consumption, power generation structure, low-carbon economy, environmental governance, and power generation water consumption of coal-fired power plants at the source. Additionally, this paper focuses on building a low-carbon evaluation index system for coal-fired power plants. Finally, this paper proposes a subjective and objective index fusion weighting method based on CRITIC-G1, using the ideal solution–gray relational method to carry out a multi-dimensional evaluation of the specified samples. Finally, this paper verifies the effectiveness and feasibility of the implementation of a carbon control evaluation index system for coal-fired power plants.
2. Carbon Emission Control Model of the Energy Internet under a New Power System
2.1. Carbon Emission Reduction Characteristics of All Links of the Energy Internet
Building a new power system with new energy as the main body is an important direction for the transformation and upgrading of China’s power system. Additionally, it is also a key way to achieve the goal of carbon peak and carbon neutrality [
27]. Under the dual-carbon target, different subjects of the “source-grid-load-storage” links of the Energy Internet have great differences in the specific necessity, urgency, mode, and power point of carbon emission reduction, which cannot be generalized. The details are shown in
Table 1.
The Energy Internet is a complex ecosystem of multi-energy integration, information physical integration, and multi-market integration, which has a profound impact on the future of energy production, transmission, consumption, and storage. The clear boundary between traditional sources, grids, loads, and storage is gradually blurred, and the coupling between different energy links is gradually enhanced [
28]. Therefore, it is necessary to study and analyze the carbon emission reduction characteristics of different subjects of the Energy Internet and the dimensions of each subject object, explore the carbon emission reduction mode and power point, and realize efficient and accurate carbon emission control oriented to the Energy Internet.
(1) The source end is the main contributor of social carbon emissions, which has a high necessity and urgency to reduce carbon emission. While reducing the installed capacity of coal power and increasing the access to renewable energy, the power generation efficiency of all kinds of energy can be improved by gradually converting coal power into flexible power supply, taking multi-source complementarity as the carbon reduction power point, and by improving the prediction accuracy of new energy cluster, cogeneration of cold and hot power (CCHP), overall resource allocation, and deep peak regulation.
(2) The grid end is the carrier of the coupling of energy flow and information flow, so it is necessary and urgent to reduce carbon emission. It is necessary to accelerate the consumption of new energy, reduce line loss, and coexist with a variety of power grids [
29] as the power point of reducing carbon emissions, a new power system based on new energy should be built, and technologies such as HVDC transmission should be adopted to improve transmission efficiency.
(3) The load end is a general term for the consumption side of all electrical equipment in the whole system, and the load forms are diversified. New loads such as user demand response and electric vehicles are constantly involved, and the necessity and urgency of carbon reduction are medium. By promoting electrification of energy consumption, saving energy, and vigorously building micro-grids, etc., it will be used as a starting point for carbon reduction. At the same time, the research and development of energy-saving devices for civil industry, the promotion of energy-saving appliances for residents, the use of digital process energy saving, low temperature waste heat recovery, and other measures are necessary to achieve the purpose of reducing energy consumption and improving energy efficiency.
(4) The energy storage end is an indispensable part of the power system dominated by renewable energy. The distributed energy storage system and the centralized large-scale energy storage system play an important role in the peak regulation and frequency modulation of the power system in the future, and will be used to smooth the instability, variability, and intermittency of the output power to improve the reliability and security of the power system. The necessity and urgency of carbon reduction is relatively low, and the effective combination, complementary application, and energy conversion of multiple types of energy storage facilities such as electricity storage, heat storage, gas storage, and hydrogen storage can reduce energy storage loss [
30,
31] as the power point of reducing carbon emissions. At the same time, the energy storage capacity should increase to achieve multi-mode complementarity.
2.2. Carbon Emission Model of Energy Internet
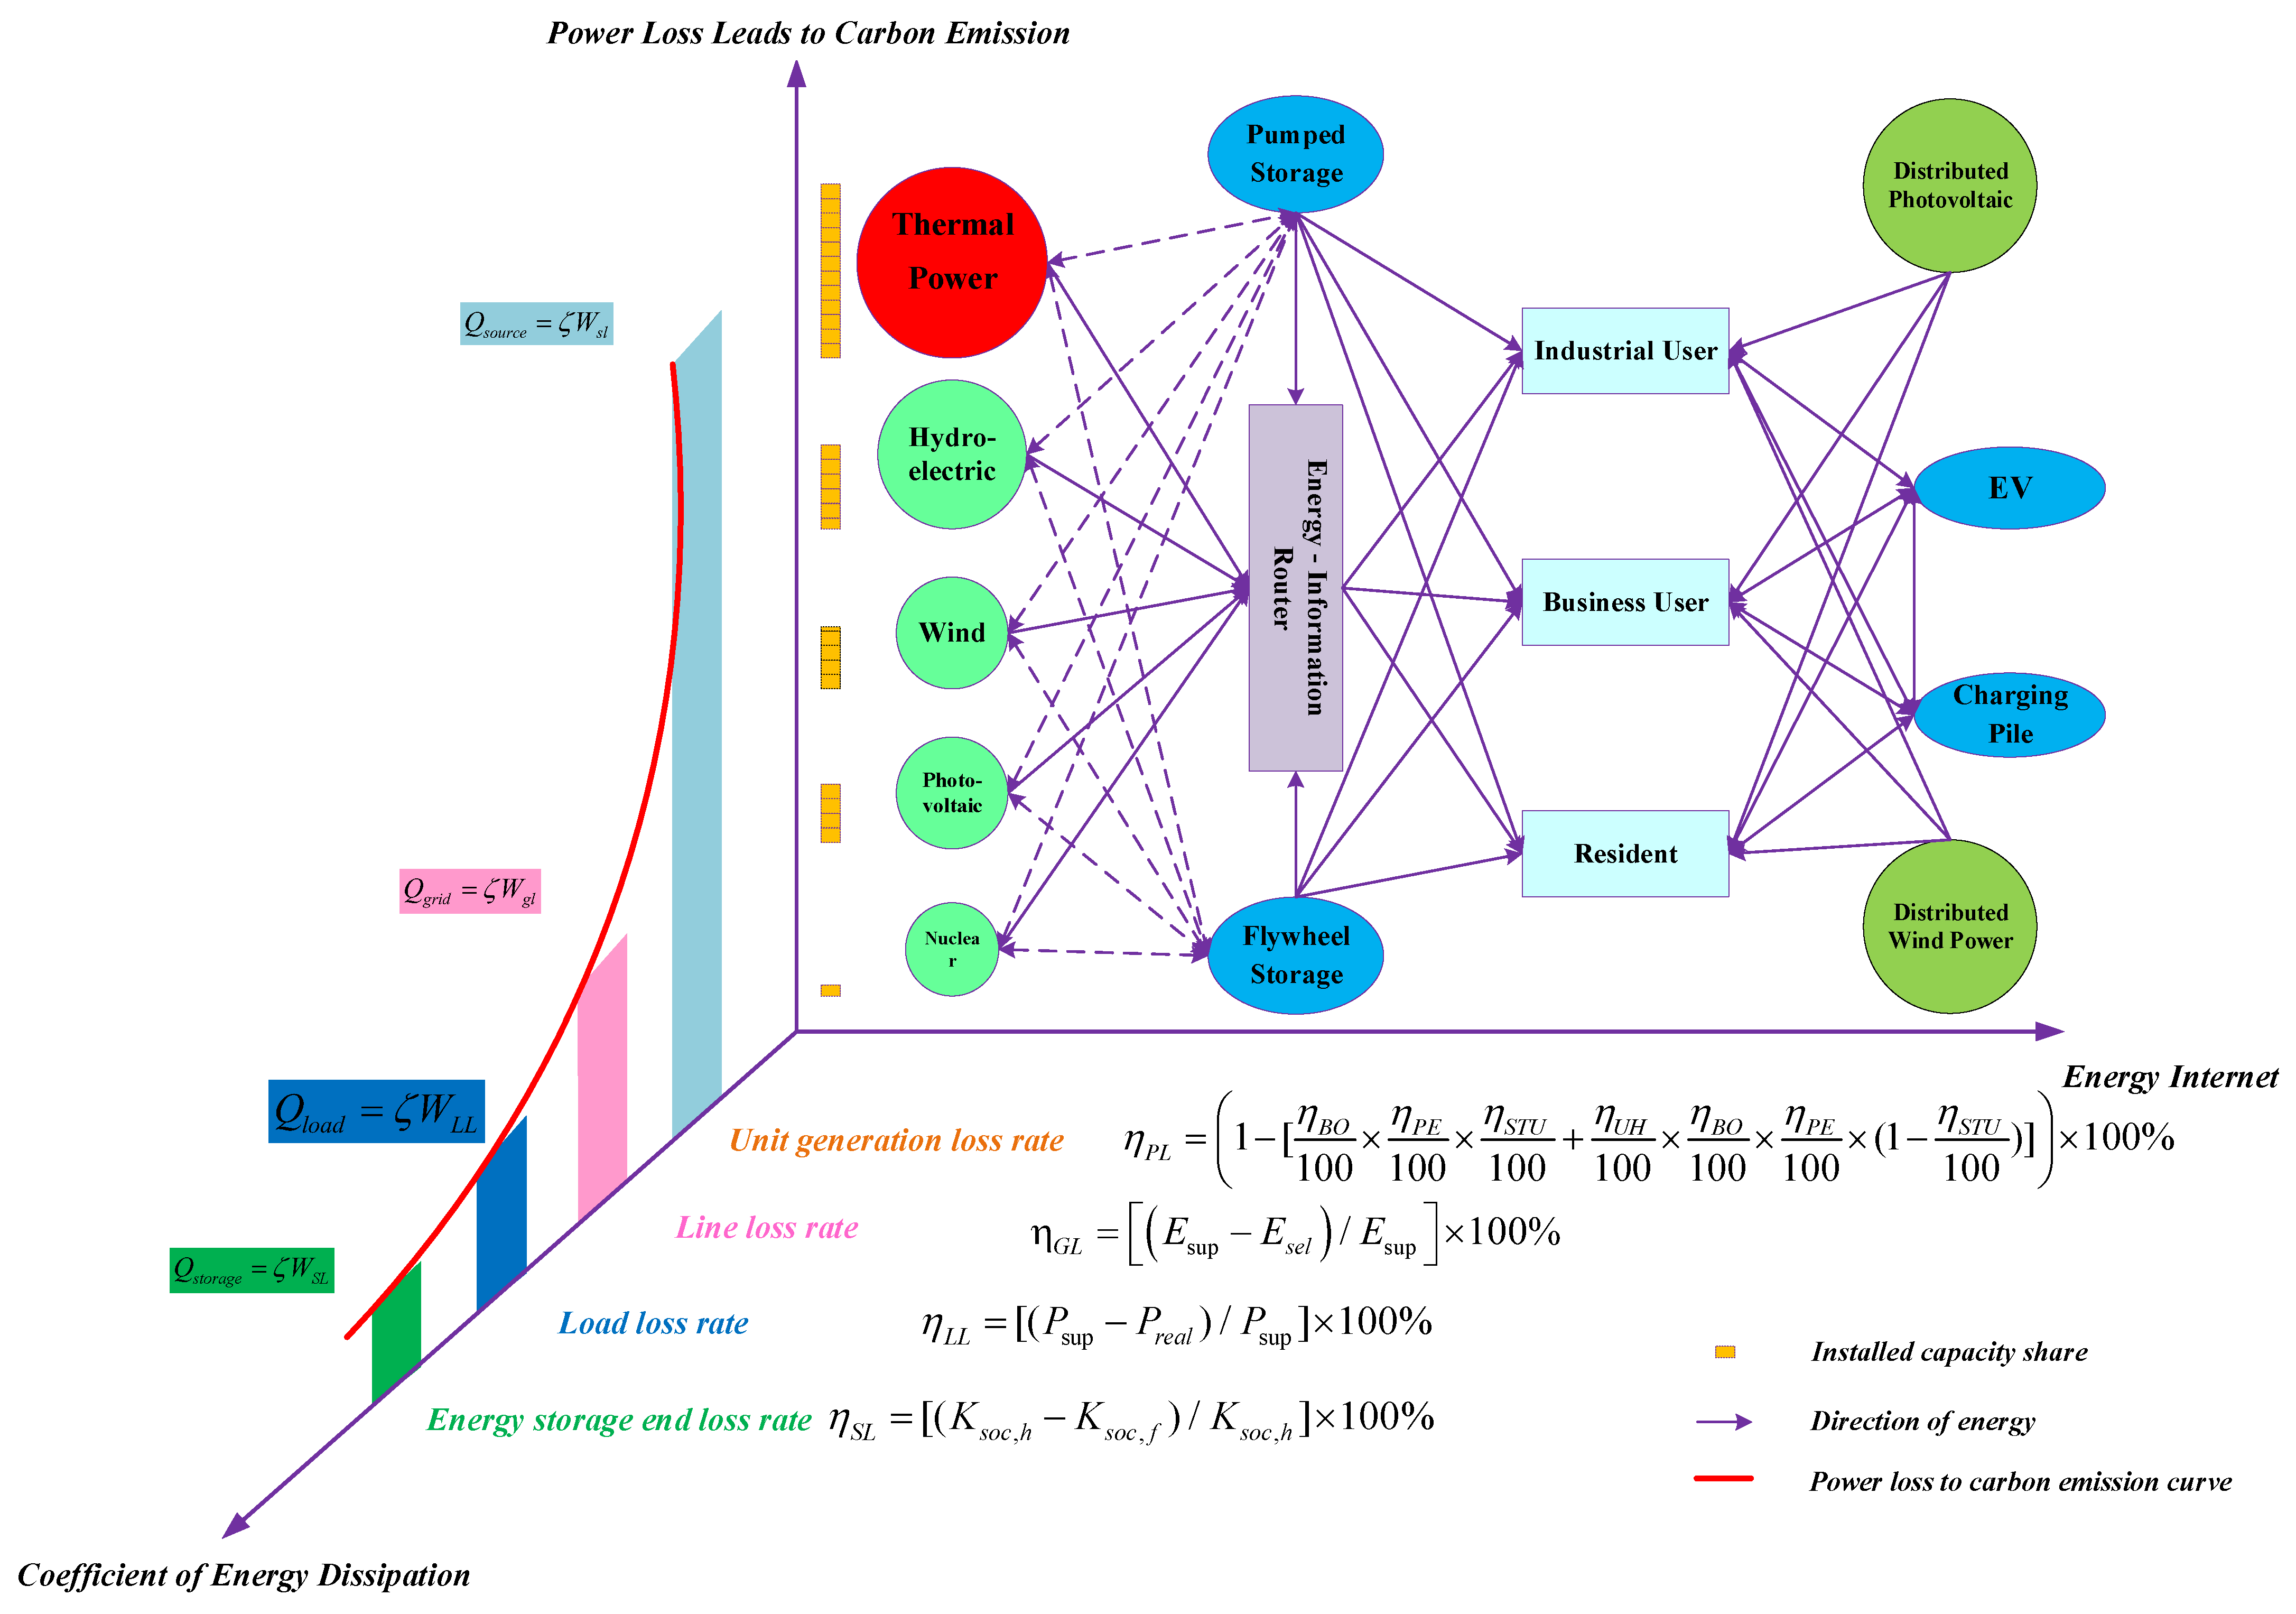
Each link of the “source-grid-load-storage” of the Energy Internet will cause energy loss and carbon emission in the process of production and operation. However, there are differences as follows: (1) At the source end, due to the overall efficiency of the generator set, energy will be wasted in the process of power generation, and the carbon emissions generated by this waste of energy are the carbon emissions caused by power generation loss; (2) at the grid end, due to a certain line loss, power loss is generated in the transmission process of electric energy, and this part of the loss of electric energy will be converted into carbon emissions caused by line loss; (3) at the load end, in the context of the power consumption of large industrial and commercial users and residents, due to the existence of certain power efficiency problems, there will be power consumption loss, and this part of the power loss can be converted into carbon emissions caused by power consumption; (4) the energy storage end contains a large amount of battery energy storage. In the process of battery power storage and discharge, the problem of power loss will be generated, and this part of power loss can be converted into energy storage loss and carbon emission.
Figure 1 shows a multi-dimensional analysis model composed of power loss coefficient and carbon emission caused by loss at a spatial scale with a longitudinal source, grid, load, and storage of the Energy Internet.
(1) Generation loss coefficient of source-end unit:
The generation efficiency of a thermal generating set usually refers to the utilization rate of the heat energy of the boiler, steam turbine, and the generator and its system in the process of power generation and heating.
The generating efficiency of the unit can be expressed as
where,
denotes the generating efficiency of the unit;
represents the thermal efficiency of the boiler;
represents pipeline efficiency;
represents the heating ratio of the unit;
represents the thermal efficiency of a turbo-generator set.
where,
is the heat loss rate of boiler exhaust;
is the heat loss rate of complete combustion of the combustible gas in the boiler;
is the heat loss rate of incomplete combustion of solid in the boiler;
is the boiler heat loss rate;
is the sensible heat loss rate of boiler ash;
represents the total input heat of steam turbine unit;
represents the total heat output of the boiler;
represents the external heat supply of steam turbine unit;
represents the total input heat of steam turbine unit;
is the electrical power of the outgoing end.
According to the generation efficiency of the generator set
, the loss rate of the generator set can be written as
(2) Line loss coefficient of grid end:
The power system provides electric energy to the load terminal through four links: generation, transmission, transformation, and distribution. In the process of transmission, transformation and distribution, various electrical components of the grid, such as transformers, transmission lines, compensation, and adjustment equipment, will lose part of the electric energy, which can be recorded as the line loss of the grid.
The line loss rate at the network end can be expressed as
where,
represents line loss rate;
represents the electricity supply measured by an electricity meter;
represents the amount of electricity sold by the meter.
(3) Load end power loss coefficient:
The total load of a power system is the total power consumed by all the electrical equipment in the system. The combined load of a power system is obtained by adding all the power consumed by industry, agriculture, commerce, and urban and rural residents. Due to factors such as consumption habits and electrical equipment, all the above electrical loads will have a certain use loss, which can be unified as the power loss at the load end.
The power loss at the load end can be expressed as
where,
denotes the actual power used by the load end,
and denotes the power absorbed by the load end.
(4) Energy loss coefficient at the energy storage end:
Energy storage is the process of storing electric energy through a medium or related equipment and releasing it when there is a demand for electric energy. In practical application, according to the attenuation mechanism of battery, the energy storage end will inevitably have some self-discharge phenomenon and dynamic loss.
Generally, the loss rate of the energy storage end can be expressed as
where,
denotes the expected state of charge of the energy storage battery, and
denotes the state of charge when the energy storage battery discharges.
The above loss coefficients are calculated for electric energy loss, so set the carbon emission coefficient as
, and the carbon emission caused by the loss can be obtained as
where,
is the loss power obtained by the loss coefficient of each link. According to the installed capacity ratio of each generation type, the generation efficiency of each generation type, and the loss coefficient of the grid end, load end, and energy storage end, the conclusion can be drawn that the power loss at the source end is greater than the sum of the line loss of the network end, the power loss of load end, and energy storage loss, namely
The detailed derivation process can be seen in the
Appendix A. It can be concluded that the carbon emissions generated by the generator set at the source end are greater than the sum of the carbon emissions caused by the loss of the other three, i.e.,
According to the above equation, the loss ratio of the source end is the largest in the whole power system, so the source end should also occupy the largest proportion in the carbon emission assessment of the power system. Among the various types of power generation at the source end, thermal power occupies the first place for a long time and has a huge installed capacity. The high carbon emission caused by thermal power is the most significant feature in the power industry. Therefore, it is of great significance to carry out carbon emission assessment for thermal power.
3. Carbon Emission Evaluation Index System of Coal Power Enterprises at the Source End
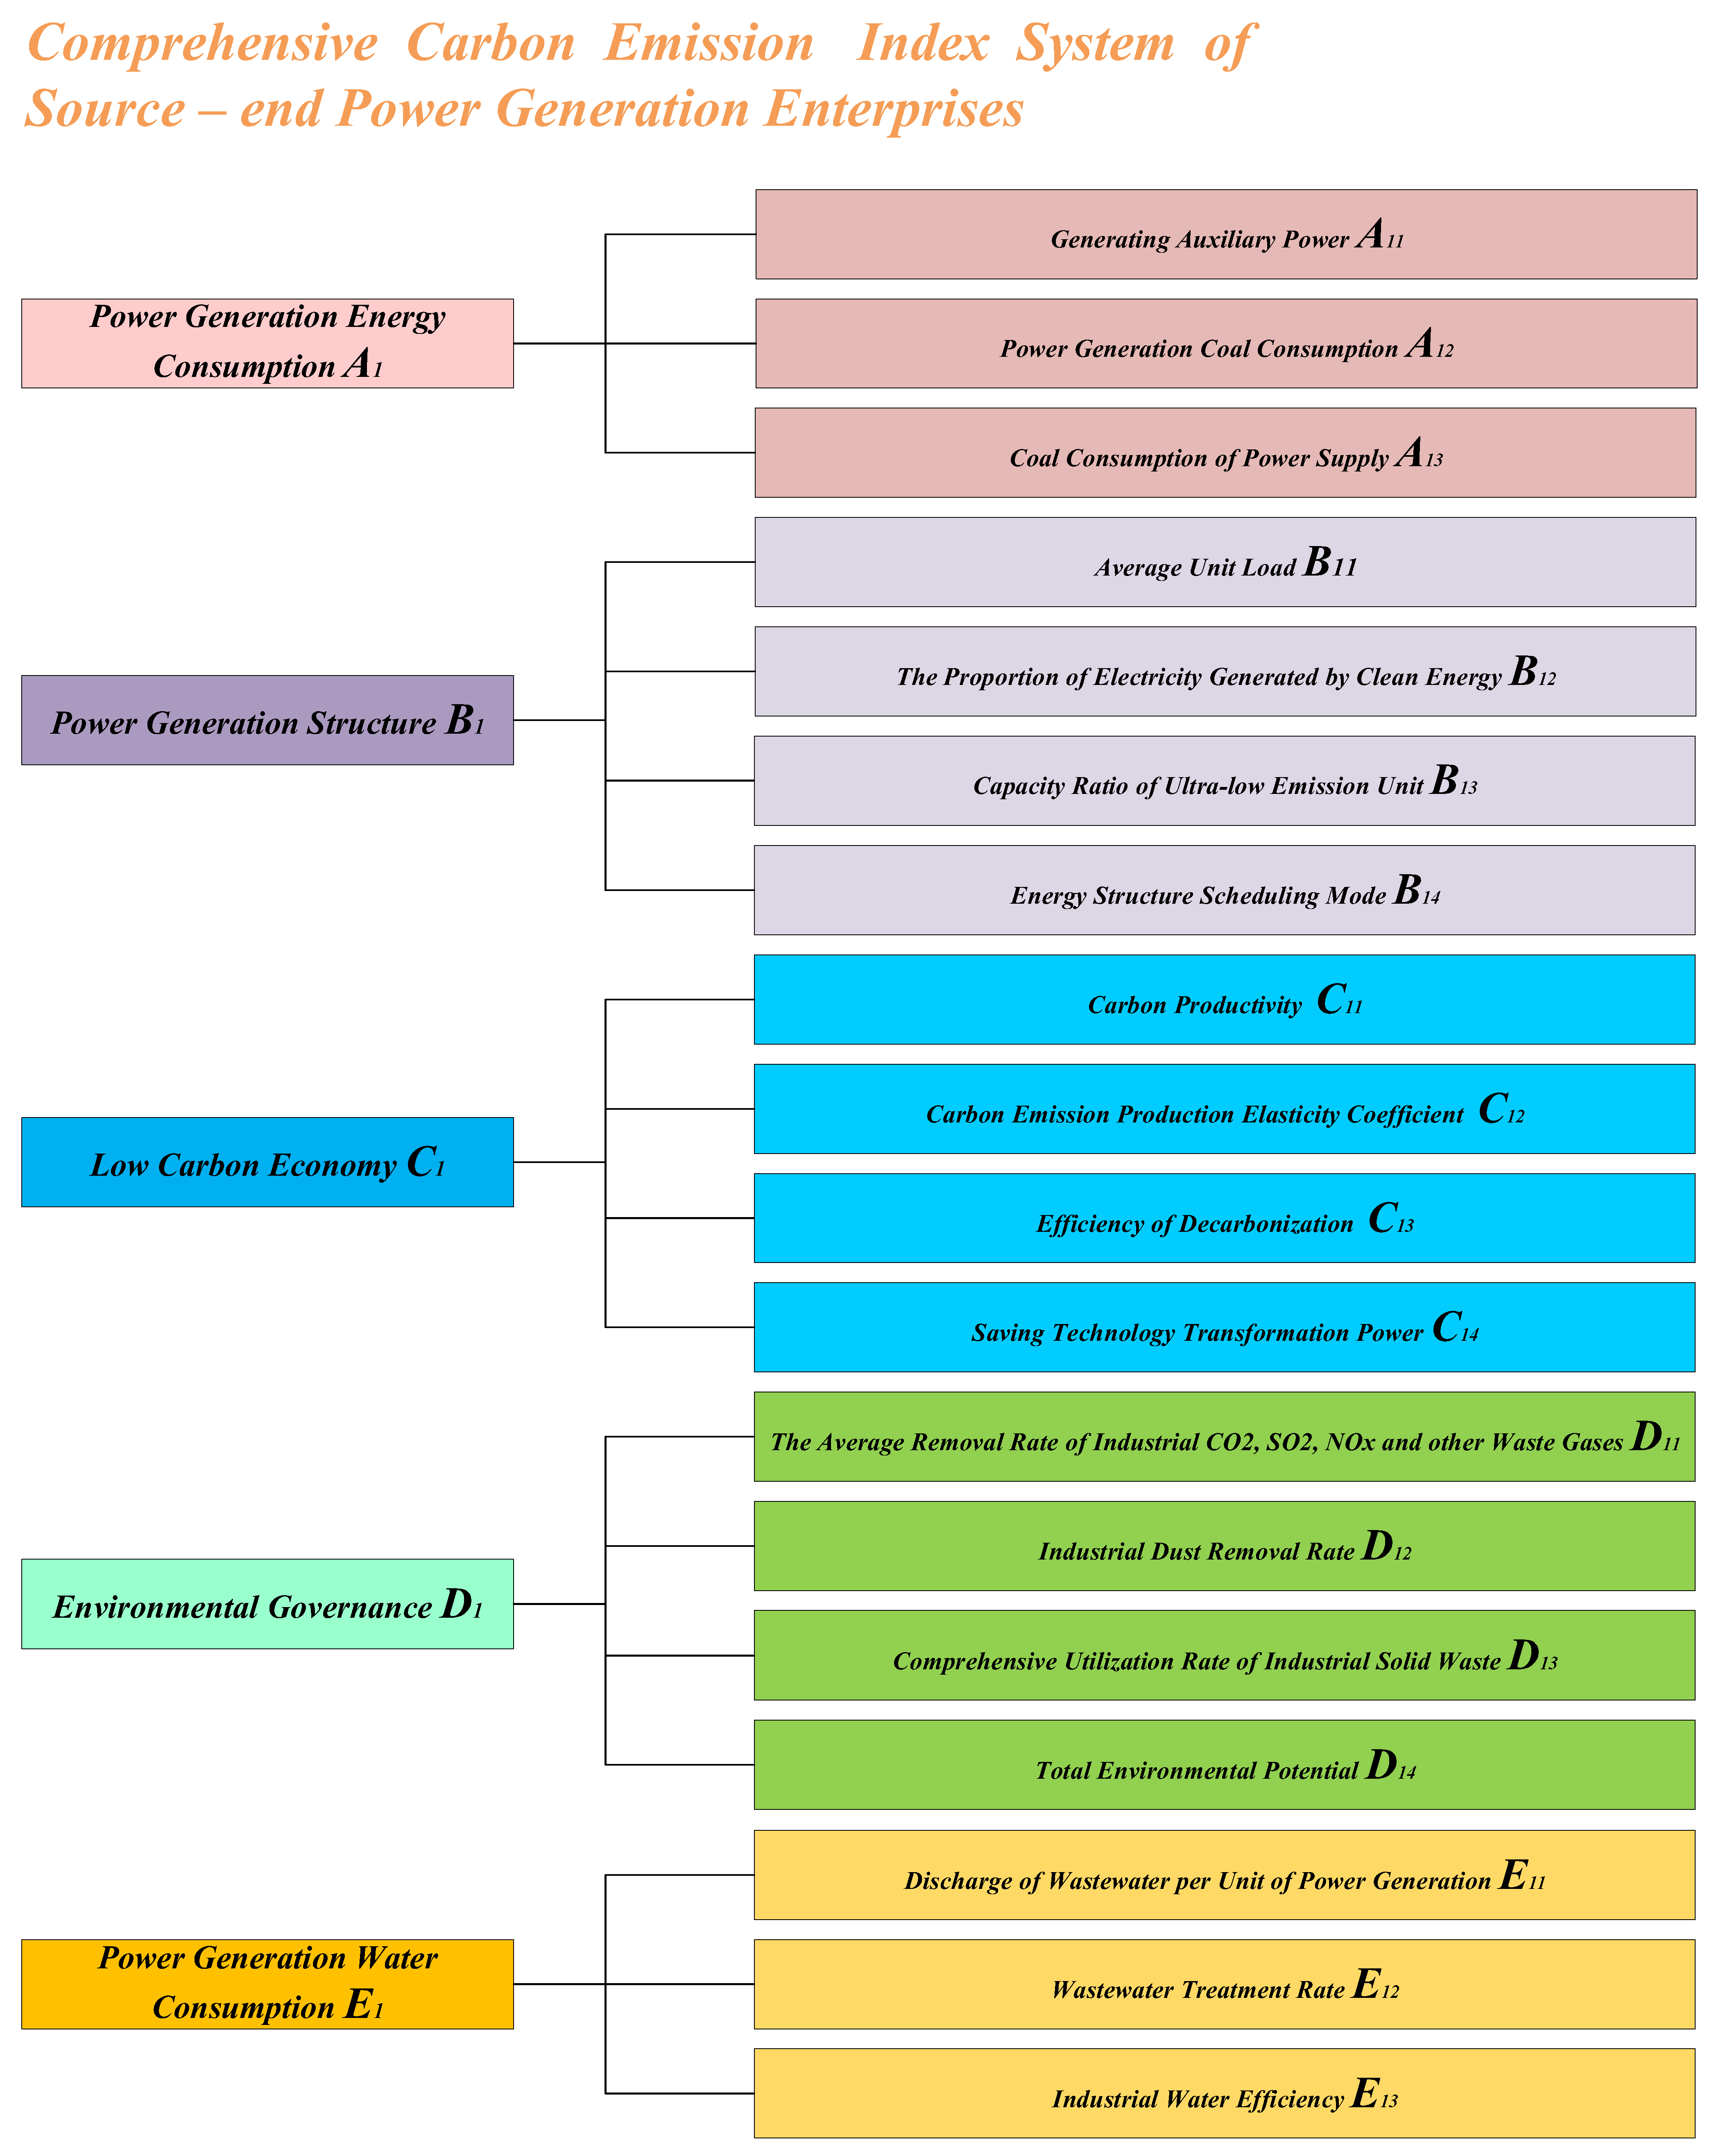
The assessment of the carbon emission intensity of coal-fired power enterprises at the source end needs to be coordinated from the comprehensive perspective of coal power enterprises at the source end. It is more convincing to ensure that the corresponding indicator system is established, and it meets the needs for a comprehensive evaluation of a system. Based on this, this paper constructs a first-level index considering the energy consumption, power generation structure, low-carbon economy, environmental governance, and power generation water consumption, etc., and determines the second-level index carbon emission index system by splitting and refining the first-level indexes of the five dimensions.
Figure 2 shows the source-end coal power carbon emission comprehensive index system.
(1) Electricity consumption rate of power plant
Power generation rate refers to the percentage of the power consumed by the plant and the power generated during the statistical period.
where,
is the power consumption of the plant, and
is the power generation.
(2) Power generation coal consumption
Power generation coal consumption refers to the average amount of standard coal consumed per 1 kW·h of power generated by a generator set during the statistical period. (g/kW·h)
where,
represents the fuel amount converted from the fuel consumed for production to standard coal during the statistical period, and
represents the heating ratio.
(3) Power supply coal consumption
Power supply coal consumption refers to the average amount of standard coal consumed per 1 kW·h of electricity supplied by a generator set during the statistical period. (g/kW·h)
- 2.
Power generation structure index
(1) Unit average load
Unit average load refers to the ratio of generating capacity of a generator set to operating hours during the statistical period.
where,
is the operating hours of the unit in the statistical period.
(2) Clean energy generation rate
Clean energy generation rate refers to the proportion of clean energy generation in the total power generation of the system.
where,
is the electricity generated by clean energy.
(3) Capacity ratio of ultra-low emission unit
The capacity ratio of ultra-low emission units refers to the ratio of generating units whose emission concentration of air pollutants basically meets the emission limits of gas units to the total generating capacity of the system by adopting the integrated system technology of efficient collaborative removal of various pollutants in the process of power generation operation and terminal treatment of coal-fired boilers in coal-fired power plants.
(4) Energy structure scheduling capacity
Energy structure scheduling capacity refers to the optimal power generation mode under the dual constraints of power generation cost and emission reduction cost through load regulation for different power generation modes in a single power generation enterprise, such as thermal power units, wind power units and solar power units.
- 3.
Low carbon economic indicators
(1) Carbon productivity
Carbon productivity is the amount of gross domestic product produced per unit of carbon emissions (yuan/t).
where,
is the gross domestic product of a certain region, and
is the carbon emission.
(2) Carbon emission production elasticity coefficient
The elastic coefficient of carbon emission production is the ratio of the growth rate of carbon emission to the growth rate of industrial added value.
where,
is the growth rate of carbon emission and
is the growth rate of industrial added value.
(3) Efficiency of decarbonization
Decarbonization efficiency refers to the ratio between the amount of carbon removed and the number of emissions that should have been emitted in the whole power generation enterprise, including the generation, power supply, and maintaining the normal operation of the whole enterprise.
where,
is the amount of carbon removal.
(4) Energy-saving technology transformation power
Energy-saving technical transformation force refers to the transformation of the entire power generation system based on the overall planning and planning and design of the entire system development of coal-fired power plants, and the actual development of coal-fired power plants. For example, the transformation and management methods such as optimizing the internal wiring scheme of coal-fired power plants, developing cogeneration, promoting large-capacity units, and strictly implementing energy-saving control in the production link are adopted to improve the energy-saving performance of the system and improve the energy utilization rate.
- 4.
Environmental governance indicators
(1) Industrial CO2, SO2. The average removal rate of NOx and other exhaust gases
The average removal rate of industrial CO
2, SO
2, NOx and other waste gases refers to the average of the ratio between the removal amount of various industrial waste gases and the initial emissions of various industrial waste gases.
where,
is the removal rate of an industrial waste gas, and
is the initial emission of an industrial waste.
(2) Industrial dust removal rate
The removal rate of industrial dust refers to the ratio of the amount of industrial dust removed to the initial discharge of industrial dust.
(3) Comprehensive utilization rate of industrial solid waste
The comprehensive utilization rate of industrial solid waste refers to the percentage of the comprehensive utilization of industrial solid waste in the output of industrial solid waste.
where,
is the comprehensive utilization amount of industrial solid waste,
is the production amount of industrial solid waste, and
is the storage amount of industrial solid waste for comprehensive utilization in previous years.
(4) Total environmental potential
The total potential of environmental protection refers to a series of measures taken by coal-fired power plants, such as transforming environmental protection facilities, increasing investment in environmental protection funds, strengthening environmental protection management, etc., in order to achieve the best purpose of energy conservation and emission reduction. An intuitive appearance of the total potential of environmental protection can be obtained through the evaluation and scoring of the above measures.
- 5.
Power generation water consumption index
(1) Discharge of wastewater per unit of power generation
The discharge of wastewater per unit of power generation refers to the ratio of power generation to the amount of wastewater discharged during the statistical period.
where,
is waste water discharge.
(2) Wastewater treatment rate
Wastewater treatment rate refers to the ratio of wastewater treatment capacity to the initial discharge of wastewater.
where,
is the amount of wastewater treated.
(3) Water use efficiency
Water use efficiency is the ratio of actual water use to theoretical water use.
4. Comprehensive Evaluation Method of Low Carbonization Difference of Coal Power at the Source End
Most existing systematic evaluation studies tend to be subjective empowerment or objective empowerment. (1) Representative subjective weighting methods include AHP, ANP, BWM, etc., whose attribute weights are determined by the decision-making experts in the field of the evaluated object through their own experience scoring, which is a representation of the importance of the system index itself and is not affected by the value of attributes. However, such evaluation methods only depend on the subjective experience analysis of experts. The process is easy and arbitrary, so it will cause some error influence on the evaluation results. (2) Representative objective weighting methods include the entropy weighting method, coefficient of variation method, correlation coefficient method, DEA method, etc., whose attribute weights are usually obtained from the original data of indicators after series processing, and the results are actual values, so they have strong objectivity and high accuracy. However, such evaluation methods are generally disturbed by evaluation objects. For example, the number of selected indicators is small, the index data is not perfect, and there are other problems; compared with the subjective evaluation method, the stability is poor. In view of the above statements, we can see that both subjective and objective weighting methods are based on their own basis of weighting, so the combination of subjective and objective weighting methods can not only make up for their own shortcomings, but also take into account their advantages.
In this paper, through the comprehensive evaluation of the influence factors of source-end carbon emissions, on the basis of avoiding the congenital defects of the single weighting method, the CRTIC-G1 method [
32,
33] is proposed to achieve the combination weighting of the influence factors of source-end carbon emissions, and the comprehensive evaluation results are obtained by combining the ideal solution with the gray correlation analysis method.
Figure 3 shows the comprehensive evaluation process of low-carbonization difference of coal power at the source end.
4.1. Index Portfolio Empowerment
4.1.1. Index Standardization
The comprehensive carbon emission index of source-end coal power enterprises includes a qualitative index and quantitative index. Qualitative indicators cannot be quantified by a mathematical model, but can only be scored by qualitative index grade and corresponding comment set to achieve quantitative qualitative indicators. The evaluation value of quantitative index can be determined by the corresponding membership function. Considering that comprehensive indicators have certain directional attributes, they can be divided into positive indicators and negative indicators. Among them, the larger the value of positive indicators is, the better the event corresponding to the indicators, while the larger the value of negative indicators is, the better the event corresponding to the indicators. The attribute set of comprehensive carbon emission index of the source-end power generation enterprises is shown in
Table 2.
The process of index standardization:
- (1)
Suppose there are
evaluation objects
and
evaluation indexes, and the value of the
th index of the
th evaluation object can be denoted as
, thus generating an original data matrix
of the evaluation object
.
- (2)
In order to eliminate the dimensional influence, the positive and negative indicators are normalized, respectively.
where,
is the index value before the standardization of the
th index of the
th evaluation object;
is the index value of the
th index of the
th evaluation object after the same trend standardization.
- (3)
The matrix
can be obtained after standardized processing.
4.1.2. Objective Indicator Weighting Based on CRITIC Method
The CRITIC method calculates the standard deviation by evaluating the contrast strength and the features of conflict between the indicators, and presents the contrast strength and conflict successively as a calculation method of weights for objective indicators. The steps are as follows:
- (1)
Determine the standard deviation of the standardized matrix
.
where,
is the average value of index
among
evaluation objects.
- (2)
Calculate the correlation coefficient between each index.
where,
is the average index value of all objects of the index
;
is the average index value of all objects of the index
;
is the correlation coefficient between indicators
and
.
- (3)
Calculate the objective weight.
The information contained in the fourth index is
where, the larger
is, the greater the information contained in the index is reflected, that is, the greater the weight of the index in the whole index evaluation system.
Therefore, the proportion of the information of the
index in the total information can be taken as the objective weight of this index, i.e.,
4.1.3. Subjective Index Weighting Based on the G1 Method
The G1 method is highly subjective and can well reflect the ideas of experts or the experience of evaluators. The G1 method is a method that first ranks evaluation indicators, and then compares and judges the importance of adjacent indicators. The steps are as follows:
If the interference effectiveness indexes and have relative to the evaluation criteria, it indicates that is more important than . Construct the evaluation index set , select the most important index from the indexes and mark it as , select the most important index from the remaining indexes and mark it as , and so on, repeat the above process for times, and then obtain the ranking relation among evaluation indexes, namely .
- (2)
Importance judgment of adjacency.
Suppose that the expert makes a rational judgment on the ratio of the importance of
to
the evaluation index, namely:
where,
is the relative importance degree between the
th index and the
th index;
and
represents the weight coefficient of
and
.
Table 3 shows the assignment reference and explanation of
.
- (3)
Calculation of weight coefficient.
Hence, if we take the product by definition of
, we obtain
The sum of
from 2 to
Because
, we can obtain
Therefore, the weight of the
th evaluation index is
where,
represents the relative importance between adjacent indicators
and
.
Through the above formula, the weight value of all indicators can be obtained as
According to the order relation in the above formula, the weight vector of the evaluation index vector
can be obtained, i.e.,
4.1.4. Combination Weight Calculation Based on CRITIC-G1
According to the combination weighting principle of the multiplication synthesis method, the combination weight of the 𝑗 index is,
It can be obtained from the above that the objective weight is
, and the subjective weight is
, so the comprehensive weight of the index 𝑗 is,
Therefore, the comprehensive weight vector of the index can be obtained as,
4.2. Ideal Solution–Gray Correlation Method Evaluation Model
The gray correlation method is a method to measure the degree of correlation among system factors evolved from gray system theory. The gray correlation is a measure of the degree of correlation that changes from time to time or from different objects for factors between two systems. Specifically, in the development process of the system, if the change trend of the two factors is consistent, that is, the degree of synchronous change is high, then the degree of correlation between them is high. On the contrary, if the change trend of the two factors is different, that is, the degree of synchronous change is low, then the degree of correlation between the two factors is low. Therefore, the gray correlation method can provide quantitative measurement for the development and change of a system and is suitable for dynamic process analysis [
34].
The TOPSIS method is used to evaluate the system based on the standardized data screening to find a sort approach to the ideal solution, which is used to distinguish the merits and demerits of multiple evaluation objects. However, its relative defect is that it cannot distinguish the degree of difference of all factors between the evaluation object and the ideal object in detail. Therefore, this paper uses the ideal solution and gray correlation method to eliminate the shortcomings of TOPSIS, aiming to more accurately describe the approximation between the object to be evaluated and the ideal object, so as to sort the advantages and disadvantages of the assessment object and provide the basis for the final decision. The steps of comprehensive evaluation of source-end carbon emissions based on the ideal solution and gray correlation method are as follows: Firstly, on the basis of obtaining the combined weight of indicators by reusing CRITIC-G1, the corresponding weighted standardization matrix is listed. Secondly, the positive ideal solution and negative ideal solution of the evaluation object are determined, and the Euclidean distance and gray correlation degree between the evaluation object and the positive and negative ideal object are obtained. Finally, the optimal arrangement of evaluation objects is obtained by calculating the relative approximation degree. The specific calculation steps are as follows:
- (1)
Weighted standardization of index matrix.
By multiplying the matrix
obtained after standardization with the corresponding index combination weight, the weighted standardized matrix
can be written as
- (2)
Determine positive ideal solutions and negative ideal solutions.
The maximum and minimum values of each index set are found respectively, and the index set of positive ideal solutions is formed by the maximum value of positive index and the minimum value of negative index, and the index set of negative ideal solutions is formed by the minimum value of positive index and the maximum value of negative index.
where,
and
respectively represents positive indicator and negative indicator.
- (3)
Determine the Euclidean distance between each evaluation object and the positive ideal solution and the negative ideal solution.
- (4)
Determine the gray correlation coefficient between the evaluation object and the positive ideal solution and the negative ideal solution.
The gray correlation coefficient between the
th evaluation object and the index set of positive ideal solution or the index set of negative ideal solution with respect to the
th index is determined by the weighted standardized matrix
where,
represents the absolute value of the difference between the
th evaluation object and the index set of positive ideal solutions or the index set of negative ideal solutions in the
th index;
is the minimum value of the absolute difference between all evaluation objects and the index set of positive ideal solutions or the index set of negative ideal solutions in the
th index;
is the maximum value of the absolute difference between all evaluation objects and the index set of positive ideal solutions or the index set of negative ideal solutions in the
th index;
is the resolution coefficient, and
, usually, 0.5.
- (5)
Determine the gray correlation coefficient matrix between each evaluation object and the positive ideal index set and the negative ideal index set.
- (6)
Gray relational degree coefficient matrix is used to determine the gray relational degree of each evaluation object.
where,
.
- (7)
Dimensionless processing of Euclidean distance
and gray correlation degree
.
where,
i = 1,2,…,m;
represents
;
represents the dimensionless value
.
- (8)
According to TOPSIS and the gray correlation method, the dimensionless Euclidean distance and gray correlation degree are comprehensively considered.
The larger the value of
, the closer the corresponding evaluation object is to the negative ideal index set; the larger the value of
, the closer the corresponding evaluation object is to the positive ideal index set. After comprehensive consideration of the dimensionless Euclidean distance and gray correlation degree, we can obtain:
where,
and
reflects the decision-maker’s preference degree for position and shape, and
. The decision maker takes the value respectively according to his own preference, which is usually taken
;
and
respectively reflect the close degree of the evaluation object to the positive ideal index set and the negative ideal index set.
- (9)
Determine the relative approximation degree of each evaluation object to the positive ideal index set and the negative ideal index set in the situation change.
- (10)
Determine the optimal arrangement of evaluation objects according to the calculation results of relative approximation degree.
If the value of relative approximation is larger, it means that the evaluated object is closer to the positive ideal index set, which reflects the better the evaluated object is. If the value of relative approximation is smaller, it means that the evaluated object is closer to the negative ideal index set, which reflects the worse the evaluated object is.
5. Results and Discussion
We selected five operating 600 MW coal-fired power units in a certain area as the research object to carry out comprehensive evaluation research on coal-fired power. Furthermore, we invite four scholars in this field to form an expert evaluation team to fully ensure the objectivity and comprehensiveness of the evaluation results.
5.1. Determine the Weight of the Combination
According to the CRITIC-G1 method, the original data is screened first, positive indicators and negative indicators are distinguished, and the standard matrix Y is obtained by using Equations (25)–(27) for indicator standardization, and the weights of all indicators are calculated.
(1) Determine the objective weight by CRITIC method.
Through Formulas (28)–(31), the weight of the indicator based on CRITIC method can be calculated as follows:
(2) The G1 method is used to determine index weights .
It is assumed that there are four experts involved, and the first and second level indicators are sorted independently according to their knowledge and experience, and the relative importance ratio among indicators is given. Then, the subjective weight based on the G1 method can be calculated according to Equations (32)–(38).
(3) Calculate the comprehensive weight of indicators according to the multiplicative vector method.
Through Equation (40), the comprehensive weight of the index is
It can be seen that the comprehensive weighting method based on CRITIC-G1 not only makes efficient use of objective data for actual calculation, but also adopts experts’ opinions, which greatly offsets the limitation of a single weighting method.
5.2. The Calculation Flow of the Fusion Weighting Method Model Evaluation Results and Analysis Based on Ideal Solution–Gray Correlation Method
Through Equations (42)–(56), the relative approximation degree of each evaluation object to the positive ideal index set and the negative ideal index set on the situation change can be obtained, i.e.,
To facilitate the comparison of each value, the relative approximation degree line chart is drawn, as shown in
Figure 4.
According to the selected evaluation method, it can be seen that if the relative approximation degree is larger, the evaluated object is closer to the positive ideal index set, and the evaluated object is better. According to the figure above, the optimal arrangement of the five samples selected can be intuitively shown as
Since the selected research objects are samples with the same conventional installed capacity in stable operation and have the objectivity of a single variable, they are suitable for the evaluation of different indicators. After the optimal arrangement of comprehensive evaluation of carbon emissions of different samples is known, the samples can be analyzed. The first index in the index system is still chosen as the starting point for analysis. Construct the radar map of first-level indicator importance, as shown in
Figure 5.
According to the comprehensive weighting of indicators and the intuitive expression in
Figure 5, the ranking of the first-order index importance (
Im) of the samples is
For the different samples selected, the above five dimensions are used as first-level indicators for evaluation. It can be seen that the indicators of power generation energy consumption, power generation structure, and environmental governance are of high importance, and there are great differences among different samples in power generation energy consumption, power generation structure, and environmental governance. In fact, the main factors of carbon emissions generated by typical coal power companies in the process of power generation are the coal consumption of conventional units, the proportion of different types of installed capacity, and the exhaust gas containing CO2 removal rate in the generation statistics period. When the above index data is too high, the comprehensive evaluation score of the sample carbon emission is low, which proves that the selected sample should be improved by selecting the inferior index from the index set. For the coal consumption dimension of power generation, the generator set should be improved, the generation efficiency should be improved, and the coal consumption of power generation and power supply should be reduced. In view of the power generation structure, the installed capacity of clean energy and ultra-low emission units should be increased, and different types of power sources should be rationally deployed, so that the advantages of multiple sources can complement each other. For the dimension of environmental governance, improving the removal rate of waste gas can effectively inhibit carbon emissions. For power generation water consumption and low-carbon economy, the importance of the indicators is relatively low, and the differences between different samples for the three dimensions of power generation water consumption and low-carbon economy are relatively weak. However, they play a crucial role in the economic and social responsibility of power generation companies, and can also be used as the indicators of the comprehensive carbon emission evaluation system.
5.3. Feasibility Analysis of Model Evaluation Based on Ideal Solution–Gray Correlation Method
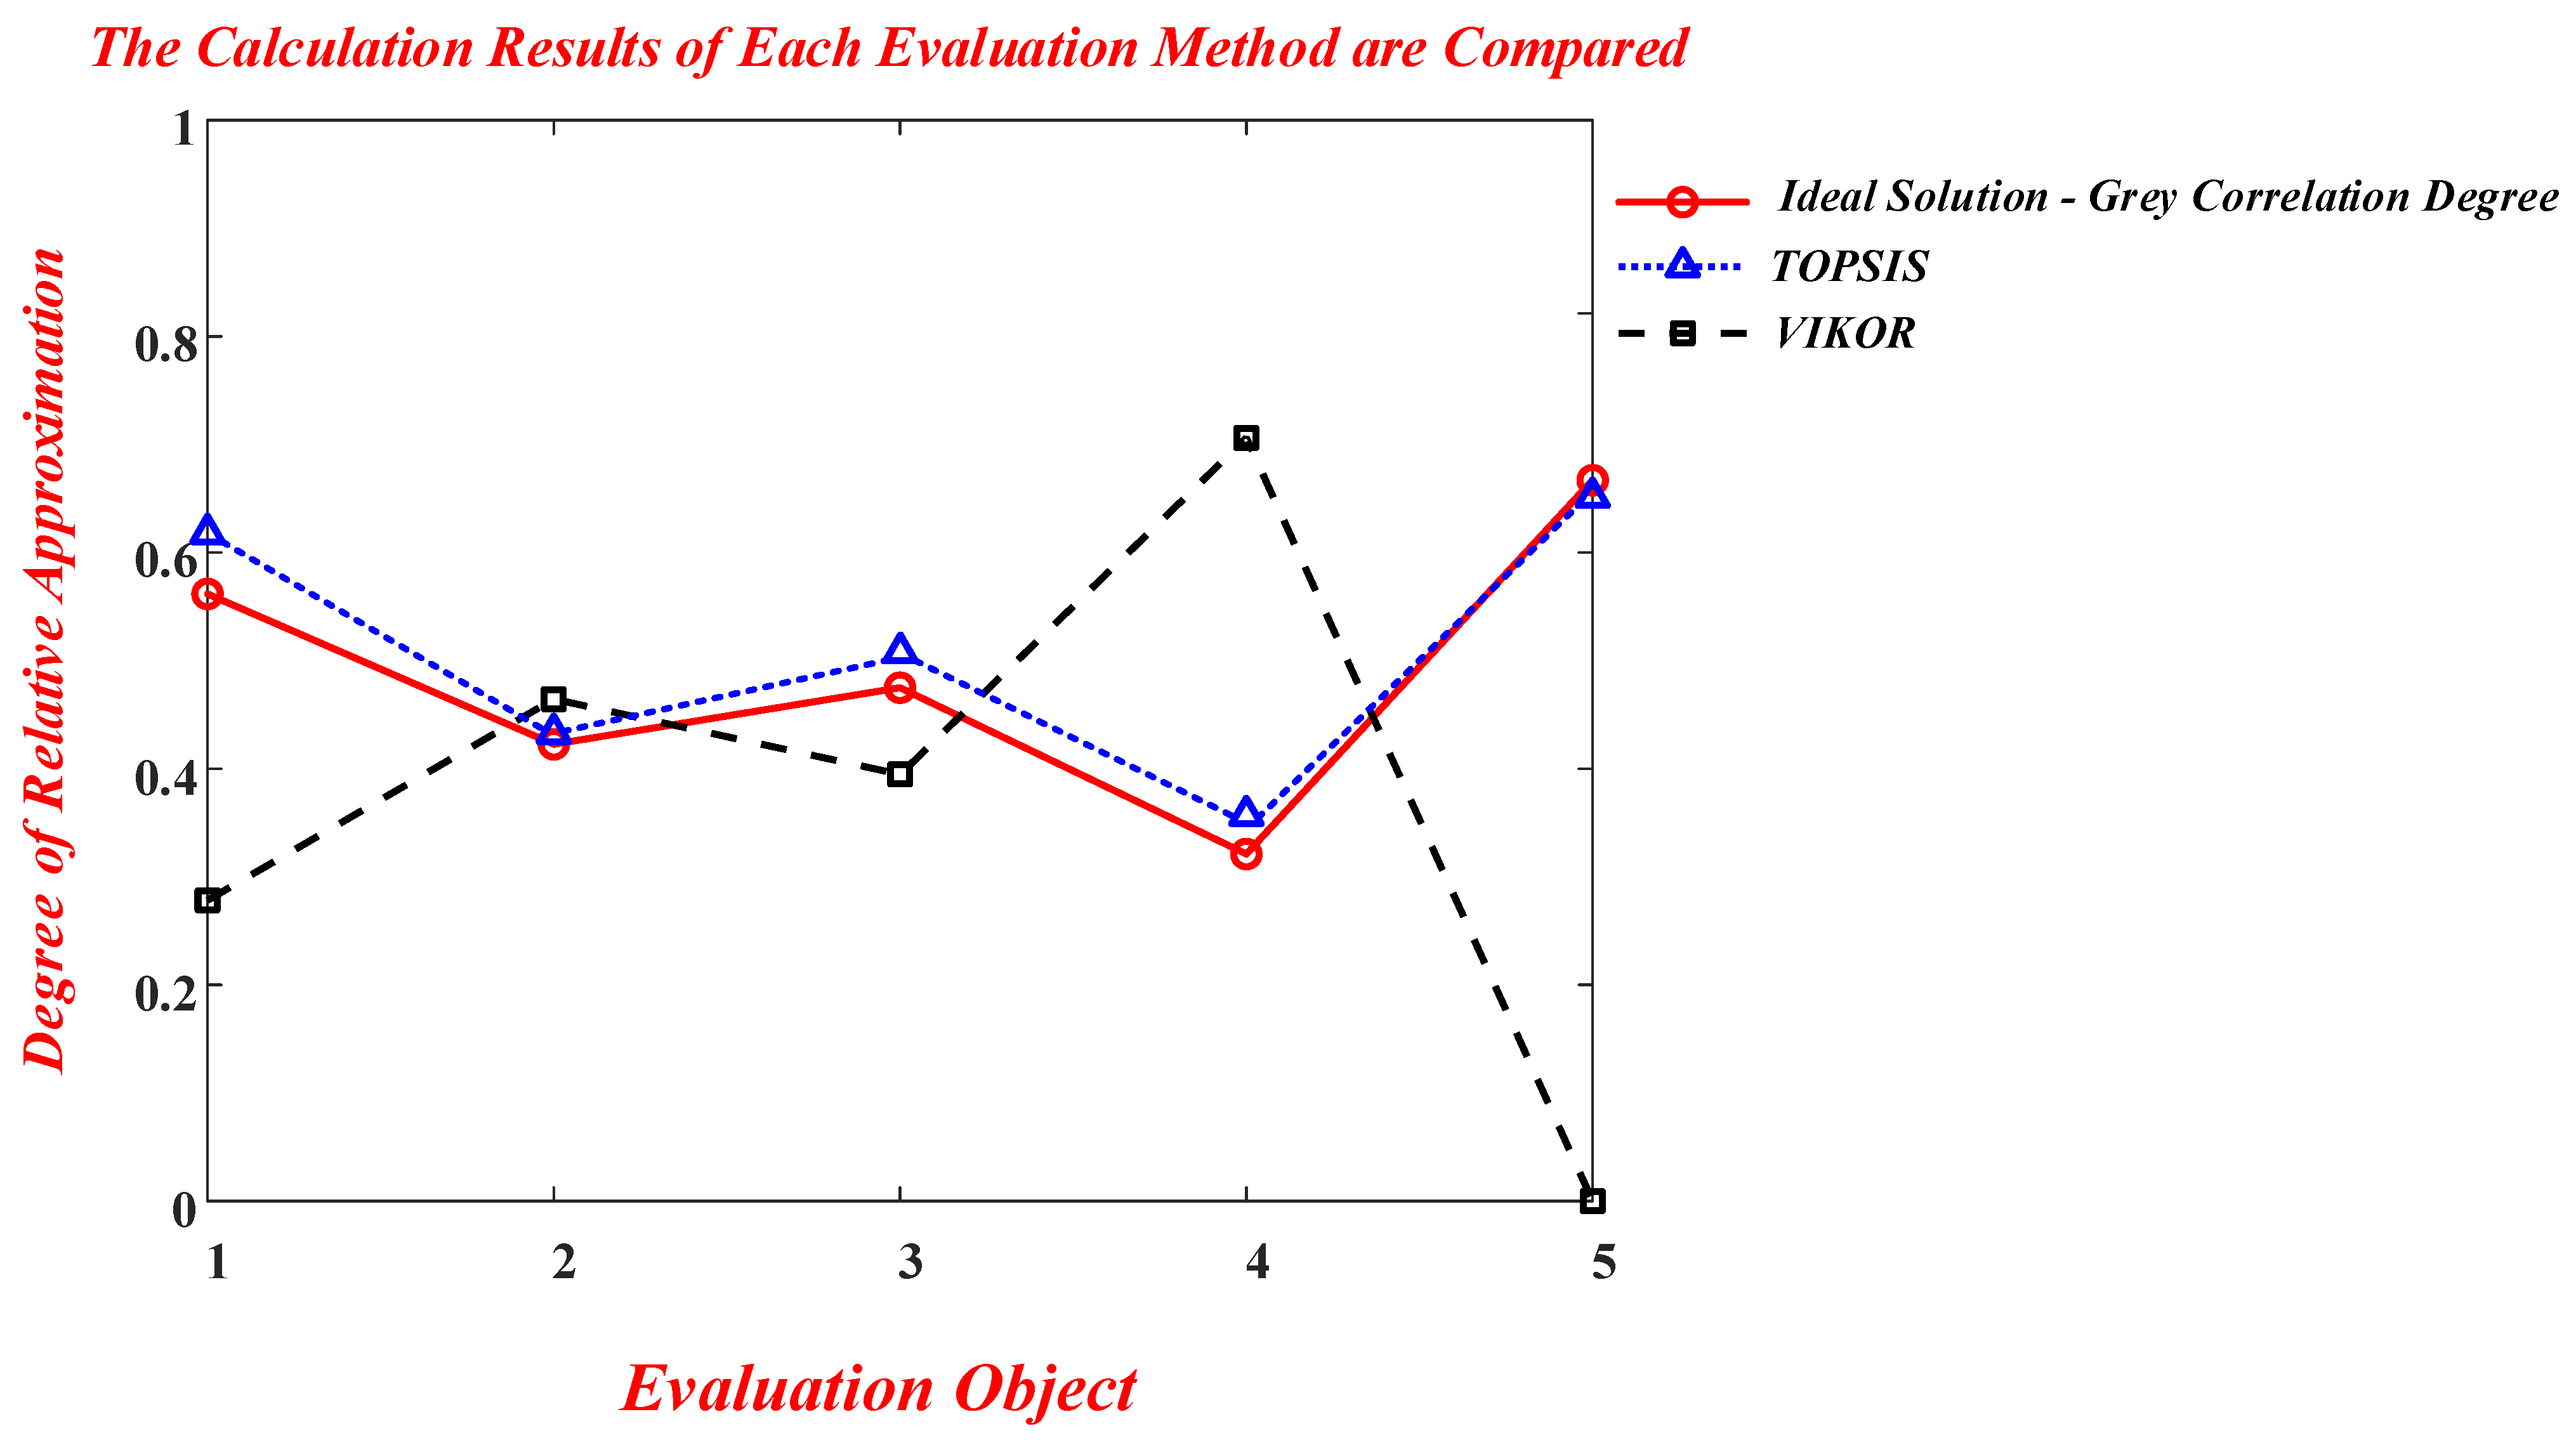
In order to verify the feasibility and superiority of the evaluation method of the ideal solution–gray correlation method, the TOPSIS method and the evaluation results obtained by the selected method were compared and analyzed one by one. In addition, the multi-criterion compromise solution ranking method (VIKOR) with the priority compromise scheme was selected to compare with the ideal solution–gray correlation method. The comparison of evaluation results among various methods is shown in
Table 4.
According to the ranking in
Table 4, the results obtained by the ideal solution–gray relational degree method are consistent with those obtained by the other two methods. The rationality and effectiveness of the method applied in this paper is effectively verified. In order to rationally express the superiority of the method, a line chart comparing the results of different evaluation methods is drawn, as shown in
Figure 6.
The figure above can directly reflect the degree of fit and correlation between different methods. TOPSIS basically fits the method used in this paper, but its value has higher fluctuation, which is higher than the results obtained by the ideal solution–gray correlation method. This is because the TOPSIS evaluation is to find a ranking method close to the ideal solution. However, it cannot distinguish the degree of difference of all factors between the evaluation object and the ideal object in detail. Because VIKOR calculated the value of the decision index based on the comprehensive result of the group utility value and the individual regret value, the smaller the index value, the better the scheme will be. Therefore, the curve presented by this method is exactly opposite to the other two when it is consistent with the results obtained by other methods.
Both the TOPSIS method and the VIKOR method need to determine positive and negative ideal solutions. The VIKOR method proposes a compromise scheme with a dominant rate on the basis of TOPSIS method. In the TOPSIS method, not only the closest distance from the positive ideal solution, but also the longest distance from the negative ideal solution should be taken into account to determine the optimal solution to maximize the benefit. However, these distances in TOPSIS are simply summed up without considering their relative importance, while in VIKOR, decision makers will determine their importance according to their own needs, and then compare the evaluation value of the alternative scheme, and choose the best according to the distance from the ideal index value. VIKOR method has one more decision mechanism coefficient compared with the TOPSIS method. It enables decision makers to make more radical or conservative decisions, so that the evaluation results are not unique. However, the TOPSIS method does not include any subjective factors, so it is more suitable for the decision-making environment requiring completely objective results. In conclusion, the improvement of the TOPSIS method by adding the idea of the gray correlation degree can consider the consistency and difference of the changing trends of different factors, take into account the advantages of the above two methods, and make up for their defects, so as to make the evaluation value more objective, accurate, and reliable, and effectively show the complete situation of the comprehensive evaluation index system of carbon emissions.
6. Conclusions
In the process of building a clean, low-carbon, safe, and efficient energy system and a new power system integrating “source, grid, load and storage”, it is necessary to integrate a high proportion of renewable energy, but the importance of traditional coal-fired power units cannot be ignored. This paper first analyzes the characteristics and models of carbon emission reduction in each link of the Energy Internet, and builds a carbon control model for the Energy Internet. Secondly, in order to effectively prove the plasticity of carbon emissions from coal-fired power at the source, this paper establishes a comprehensive evaluation index system for carbon emissions from coal-fired power at the source. Then, this paper uses the combined weighting-comprehensive evaluation method to optimize the ranking of the evaluation objects. Finally, through examples to achieve practical analysis and argumentation, this paper draws the following conclusions:
(1) Through the analysis of the carbon emission status of the new power system dominated by new energy, the four links of “source, network, load and storage” of the Energy Internet are the top priority. Through the calculation and demonstration of the necessity and urgency of carbon reduction in the four major links, it is proven that the source is the most critical part of carbon emission reduction. Moreover, carbon emissions from traditional coal power output account for the largest proportion, so research on carbon emissions from coal power is imminent.
(2) In the process of constructing a comprehensive index system of carbon emissions at the source, fully examine the five dimensions of power generation energy consumption, power generation structure, low-carbon economy, environmental governance, and power generation water consumption, and extract specific secondary index points from them. Use the CRITIC-G1 subjective and objective fusion weighting method to further quantify to bridge the one-sided objectivity and one-sided subjectivity of the single empowerment law and obtain the final ideal index weight value.
(3) Based on the index combination weighting, using the ideal solution–gray relational degree model, evaluate the selected sample. According to the relative proximity of each evaluation object in the situation change, then determine the preferred ranking. Combine the line chart of the carbon emission comprehensive indicator evaluation results and the first-level indicator importance radar chart to analyze which indicators are more affected by different samples, and put forward improvement plans and suggestions. Finally, by comparing the method used in this paper with the results obtained by the VIKOR and TOPSIS methods, demonstrate the rationality and superiority of the ideal solution–gray relational degree model.


