Article

Determination of the Self-Ignition Behavior of the Accumulation of Sludge Dust and Sludge Pellets from the Sewage Sludge Thermal Drying Station

by
Adriana Dowbysz
1,
Bożena Kukfisz
2,*,
Mariola Samsonowicz
1,* and
Jan Stefan Bihałowicz
3
1
Department of Chemistry, Biology and Biotechnology, Bialystok University of Technology, Wiejska 45A Street, 15-351 Bialystok, Poland
2
Faculty of Security Engineering and Civil Protection, The Main School of Fire Service, Slowackiego Street 52/54, 01-629 Warsaw, Poland
3
Institute of Safety Engineering, The Main School of Fire Service, Slowackiego Street 52/54, 01-629 Warsaw, Poland
*
Authors to whom correspondence should be addressed.
Energies 2023, 16(1), 46; https://doi.org/10.3390/en16010046
Submission received: 22 November 2022 / Revised: 14 December 2022 / Accepted: 19 December 2022 / Published: 21 December 2022
(This article belongs to the Special Issue Water and Wastewater Treatment- Energy Efficiency)

Abstract

:
Sewage sludge may pose a fire risk. The safe storage of biomass waste is a challenge due to self-heating processes. This study aims to assess the propensity to spontaneously combust of sewage sludge in order to determine safe storage and transport conditions. The evaluation of spontaneous ignition hazard was assessed according to EN 15188, by the determination of the self-ignition temperature. Certain parameters assumed to affect the inclination of sewage sludge to self-ignite, including the moisture content, bulk density, elemental composition, and particle size, were discussed. The results showed the risk of self-ignition during the storage and transport of sludge dust and pellets. The usage of the smallest basket volume resulted in the highest self-ignition temperatures, which were 186 °C and 160 °C for sludge pellets and dust, respectively. The comparison of the two forms of thermally dry sludge showed, that despite sludge pellets being easier to store and handle issues, the more favorable conditions for the management in terms of fire risk is sludge dust. Its temperatures for safe storage are slightly higher. The results highlighted that future research should focus on the hazards of silo fires and explosions in terms of silo fire prevention and management.

1. Introduction

The reasonable price and rich resources of biomass attracts researchers’ interest. Biomass, being a rich resource of bio-based compounds, is used in many applications. It may be used as a substratum for the production of chemicals [1] and polymers, including bio-based polyesters and epoxy resins, fuels for transportation, and carbon materials [2].
Sewage sludge is a by-product of wastewater treatment plants. The highly valuable organic and inorganic content enables its usage as a biomass feedstock for energy and resource recovery [3]. Depending on the season, technology applied in treatment plants, and specification of the source area, the composition of sewage sludge may vary. After drying, it may contain 50–70% of organic matter, 30–50% of mineral components, including carbon (from 1% to 4%), 3.4–4.0% of nitrogen, and 0.5–2.5% of phosphorus, and some other nutrients [4].
The water content of raw sludge may be up to 99%; thus, dewatering and drying are essential in order to prepare it for further usage and utilization [5]. However, the storage and transport of dry sludge may pose a risk of self-ignition. The reduction in water content to 10% or less adversely affects fire safety [6].
The increase in interest in biomass utilization has attracted attention to the economic and environmental concerns that arise with biomass storage. The disposal of sewage sludge may pose problems due to the emission of odor emission, possible risk of pathogenic organisms [7], and hazardous and toxic substances content, including dioxins or heavy metals [8]. The levels of environmental contamination vary geographically. However, the release of wastewater residues into rivers is one of the most important routes of the contamination of aquatic resources by As, Cd, Cr, Cu, Hg, Mn, Ni, Pb, and Zn [9]. Heavy metal removal in terms of electrokinetic processes, supercritical fluid extraction, ion-exchange treatment [10], adsorption [11], or other treatments needs to be provided for the safe further processing of sewage sludge.
Several sewage sludge management strategies include its application in agriculture, wet oxidation, pyrolysis, incineration, and landfilling [7]. Thickening is essential in some processes, including agriculture applications, wet oxidation, or pyrolysis [12]. Although sewage sludge exhibits comparatively low calorific value, the co-pelletizing and, therefore, co-combustion with other fuels enhances its performance [13]. The pelleting process is widely used in biomass densification by compression under high pressure. The life-cycle assessment of the pelleting process reveals that its decentralization and the usage of renewable energy resources reduce the environmental impact in all studied impact categories [14].
The self-heating processes and dust explosions of biomass are of particular concern due to the necessity of developing strategies for the safe storage of waste biomass [15]. In the presence of oxygen and/or an ignition source, a higher potential for fire or explosion incidents occurs [16]. Biomass, while stockpiled and stored, maintains contact with air during, in which slow or intensive oxidation may take place, resulting in fires and explosions [17].
Previous studies on fire and explosion characteristics revealed that thermally dried sewage sludge dust poses an explosion hazard, as is classified in the St 1 dust explosion class, according to EN 14034-1 Determination of explosion characteristics of dust clouds Part 1: Determination of the maximum explosion pressure pmax of dust clouds [18] and EN 14034-2 Part 2: Determination of the maximum rate of explosion pressure rise (dp/dt)max of dust clouds [19]. The results showed that the maximum ignition temperature for the 5 mm thick layer of sludge dust and the minimum ignition temperature of the cloud, according to ISO/IEC 80079-20-2 Explosive atmospheres Part 20-2: Material characteristics: Combustible dusts test methods [20] were 270 °C and 490 °C, respectively. The minimum explosible concentration according to EN 14034-3 Part 3: Determination of the lower explosion limit LEL of dust clouds [21] was found to be 60 g/m3. A limiting oxygen concentration of 20% and a minimum ignition energy of more than 1000 mJ were obtained according to EN 14034-4 Part 4: Determination of the limiting oxygen concentration LOC of dust clouds [22] and ISO/IEC 80079-20-2 Explosive atmospheres Part 20-2: Material characteristics: Combustible dusts test methods [20], respectively. The achieved results suggest that studied sludge dust may pose a risk when stored in insufficient conditions.
Dust explosions pose a significant threat to industrial processes. There are various methods of preventing explosions of dust–air mixtures, including methods involving partial inerting with inert gases, such as nitrogen or carbon dioxide, which can be used to mitigate the effects of an explosion inside the equipment [23,24].
According to reports [25,26], 137 combustible dust incidents occurred worldwide in 2021, including 57 fires and 80 explosions. The latest sludge dust fires and explosions were reported in wastewater treatment plants in, i.a., San Francisco (USA, 2021), Bristol (UK, 2020), Hamilton (Canada, 2020), and Koziegłowy (Poland, 2019).
Spontaneous ignition is a complex phenomenon, which occurs as a result of exothermic reactions of material taking place without external heat or other sources of ignition [27]. It is a possible cause of fires and explosions. The self-heating of powders, including coal, metals, biomass, and waste [28], may occur during processing, transportation, or storage [29].
A process safety culture is essential for incidents and accident prevention. In addition to conducting interviews, drawing up questionnaires, controlling behavior, and preparing documents, extending the knowledge of the occurring process significantly affects the level of safety culture [30]. Risk assessments in industrial plants should be based on the characteristics of produced and stored materials in order to achieve a complete scenario of hazard [28]. The risk of spontaneous ignition may be evaluated under adiabatic, isothermal, or isoperibolic conditions. The latter is used in the European standard EN 15188, describing the determination of the self-ignition temperature of dust accumulation or granular materials dependent on their volume. The extrapolation of results is performed afterward, in order to assess the safe storage conditions [31].
A proper understanding of the self-heating behavior of the thermally dried sewage sludge may prevent fires and explosions that occur in wastewater treatment plants. An awareness of all potential fire hazards will enable us to effectively perform risk assessments and fire safety plans. Therefore, this study aims to assess the propensity to spontaneously combust of thermally dried sludge dust and pellets from a municipal wastewater treatment plant in order to determine the safe storage and transport conditions. Moreover, the role of the moisture content, bulk density, elemental composition, and particle size distribution in the self-ignition behavior of thermally dried sludge was investigated.

2. Materials and Methods

2.1. Materials

The study was carried out on selected sludge dust and sludge pellets. Materials were obtained from the thermal sludge drying station of the municipal sewage treatment plant in Spain, Europe. Sludge treatment included mechanical and anaerobic biological processes.

2.2. Methods

2.2.1. Moisture Content Analysis

The moisture content was measured according to the standard drying procedure by the use of a moisture analyzer (Radwag, Radom, Poland) with a readability of 0.001 g. The measurement was conducted by the simultaneous weighing and drying of a sample (2 ± 0.01 g) at a temperature of 120 °C.
The moisture content analysis was determined by the loss on drying. The moisture content was calculated according to the equation:
M = m 0 m m 0 · 100 % ,
where M is the moisture content [wt. %], m0 is the sample mass before drying [g], and m is the sample mass after drying [g]. Because a single measurement is not representative, the measurements were conducted in three repetitions. The arithmetic mean was chosen as the most reliable estimator of a population mean that minimizes the possible impact of fluctuations/uncertainties/random errors [32].

2.2.2. Bulk Density Analysis

The bulk density was determined by measuring a volume of a known mass of the sample introduced into the graduated cylinder (100 cm3). The bulk density was calculated according to the following equation:
ρ = m m 0 V ,
where ρ is the bulk density [g/cm3], m is the mass of the sample [g], m0 is the mass of the graduated cylinder [g], and V is the sample volume [cm3]. Measurements were conducted in two and four repetitions for the sludge dust and sludge pellets, respectively, obtaining the average bulk density. The measurements were repeated for the same reason as the moisture content analysis.

2.2.3. Elemental Analysis

The CHNS determination by a thermal conductivity detector (TCD) was performed with the use of an elemental analyzer (Elementar, Langenselbold, Germany). The combustion of samples was performed at 1200 °C. The measurements were conducted in two repetitions to obtain the average value, similar to previous cases.

2.2.4. Particle Size Distribution

The laser particle sizer (Fritsch, Idar-Oberstein Germany) with a measuring range from 0.01 µm to 3800 µm and highest accuracy was used to assess the particle size distribution of the sludge dust. The measurements were conducted in three repetitions.

2.2.5. Spontaneous Ignition Behavior

The self-ignition temperature (TSI) of sludge dust and sludge pellets was determined as a function of volume by a hot storage experiment, according to EN 15188:2020 Determination of the spontaneous ignition behavior of dust accumulations.
In the work, the pseudo-Arrhenius empiric method of determining TSI was used. In this method, the non-ignition and ignition regions are separated by the curve (3):
V A = α e β T
where V A is the ratio of volume to the area, T is temperature, e is the base of the natural logarithm, and α , β are fit constants. For the purpose of fitting, (3) was log-transformed to represent the form of the linear dependence of the logarithm of V A on inverse temperature. This approach was widely used in the investigations, according to EN 15188, as well as in research papers [33,34,35,36]. The fitting was conducted using the Python [37] Numpy polyfit routine [38].
Samples were filled into three mesh wire baskets with a volume of 21.21 cm3 (this volume corresponds to the volume of a cylinder with a diameter equal to a height of 3 cm), 50.27 cm3 (this volume corresponds to the volume of a cylinder with a diameter equal to a height of 4 cm), and 98.17 cm3 (this volume corresponds to the volume of a cylinder with a diameter equal to a height of 5 cm), and were placed in the center of the furnace for the self-heating of solid materials (ANKO, Warszawa, Poland). The baskets of different volumes were used in order to carry out an assessment of the self-heating behavior of larger dust and pellet volumes by extrapolation. The measurements were taken until the highest furnace temperature, at which the dust did not ignite (TSI), and the lowest furnace temperature, at which the dust ignited was determined with an accuracy of 2 °C [39].

3. Results and Discussion

3.1. Moisture Content Analysis

The results of the moisture content analysis are presented in Table 1. The sludge pellets had a higher average moisture content (9.974 ± 0.414%) compared to the sludge dust (6.067 ± 0.193%). However, it is still low in both materials and consistent with the thermal drying treatment. The moisture content of sewage sludge may vary from 5.60% to 79.54%. Dry sewage sludge is expected to be more reactive, because the steam may support the early production of highly reactive hydrogen and carbon monoxide via exothermic reforming [40].
Although water is one of the initiators of self-heating processes and is involved in exothermic processes, in which it can act as a reactant or oxygen carrier, on the other hand, its evaporation can act as a temperature regulator of the system [41].

3.2. Bulk Density Analysis

The results of the bulk density analysis are presented in Table 2.
Pelletization enables the efficient handling and transportation of biomass. Besides obtaining a definite size and shape, densified biomass has a greater bulk density [42]. A significant increase in the average bulk density of sludge pellets (0.621 g/cm3) was observed compared to sludge dust (0.427 g/cm3). Schwarzer et al. [43] reported that the increase in the bulk density of biomass dust results in a reduction in the critical temperature. However, a greater influence on the self-ignition temperatures and the heat transfer within the particle bed is exerted by the sample size.

3.3. Elemental Analysis

The results of the elemental analysis are presented in Table 3. The elemental analysis showed that the carbon, hydrogen, nitrogen, and sulfur contents of the studied dried sludge were in the range of values of these components, according to the elemental analyses results of a few sewage sludges from different treatment facilities, included in the Environment Protection Agency (EPA) report [44]. However, only the carbon content was below the mean value (31.17%). The contents of hydrogen, nitrogen, and sulfur were higher than the mean values (3.94%, 3.84%, and 1.32%, respectively).
The greatest difference was noted in the elemental content of carbon, which was 4.05% higher for the sludge pellets. A slightly higher hydrogen content of 0.66% was also assigned in the sludge pellets. The nitrogen (5.17 ± 0.04%) and the sulfur contents (1.579 ± 0.004%) were inconsiderably higher in the sludge dust compared to sludge pellets.
The hydrogen content is one of the parameters that influence the first stage of the self-heating process. The higher hydrogen content of sludge pellets results in a faster appearance of the initial exothermic reactions (slow oxidation). However, hydrogen is not the only element that affects self-heating behavior [6]. The sulfur content, which is marginally lower in the sludge pellets, increases flammability due to its oxidation tendency [45].

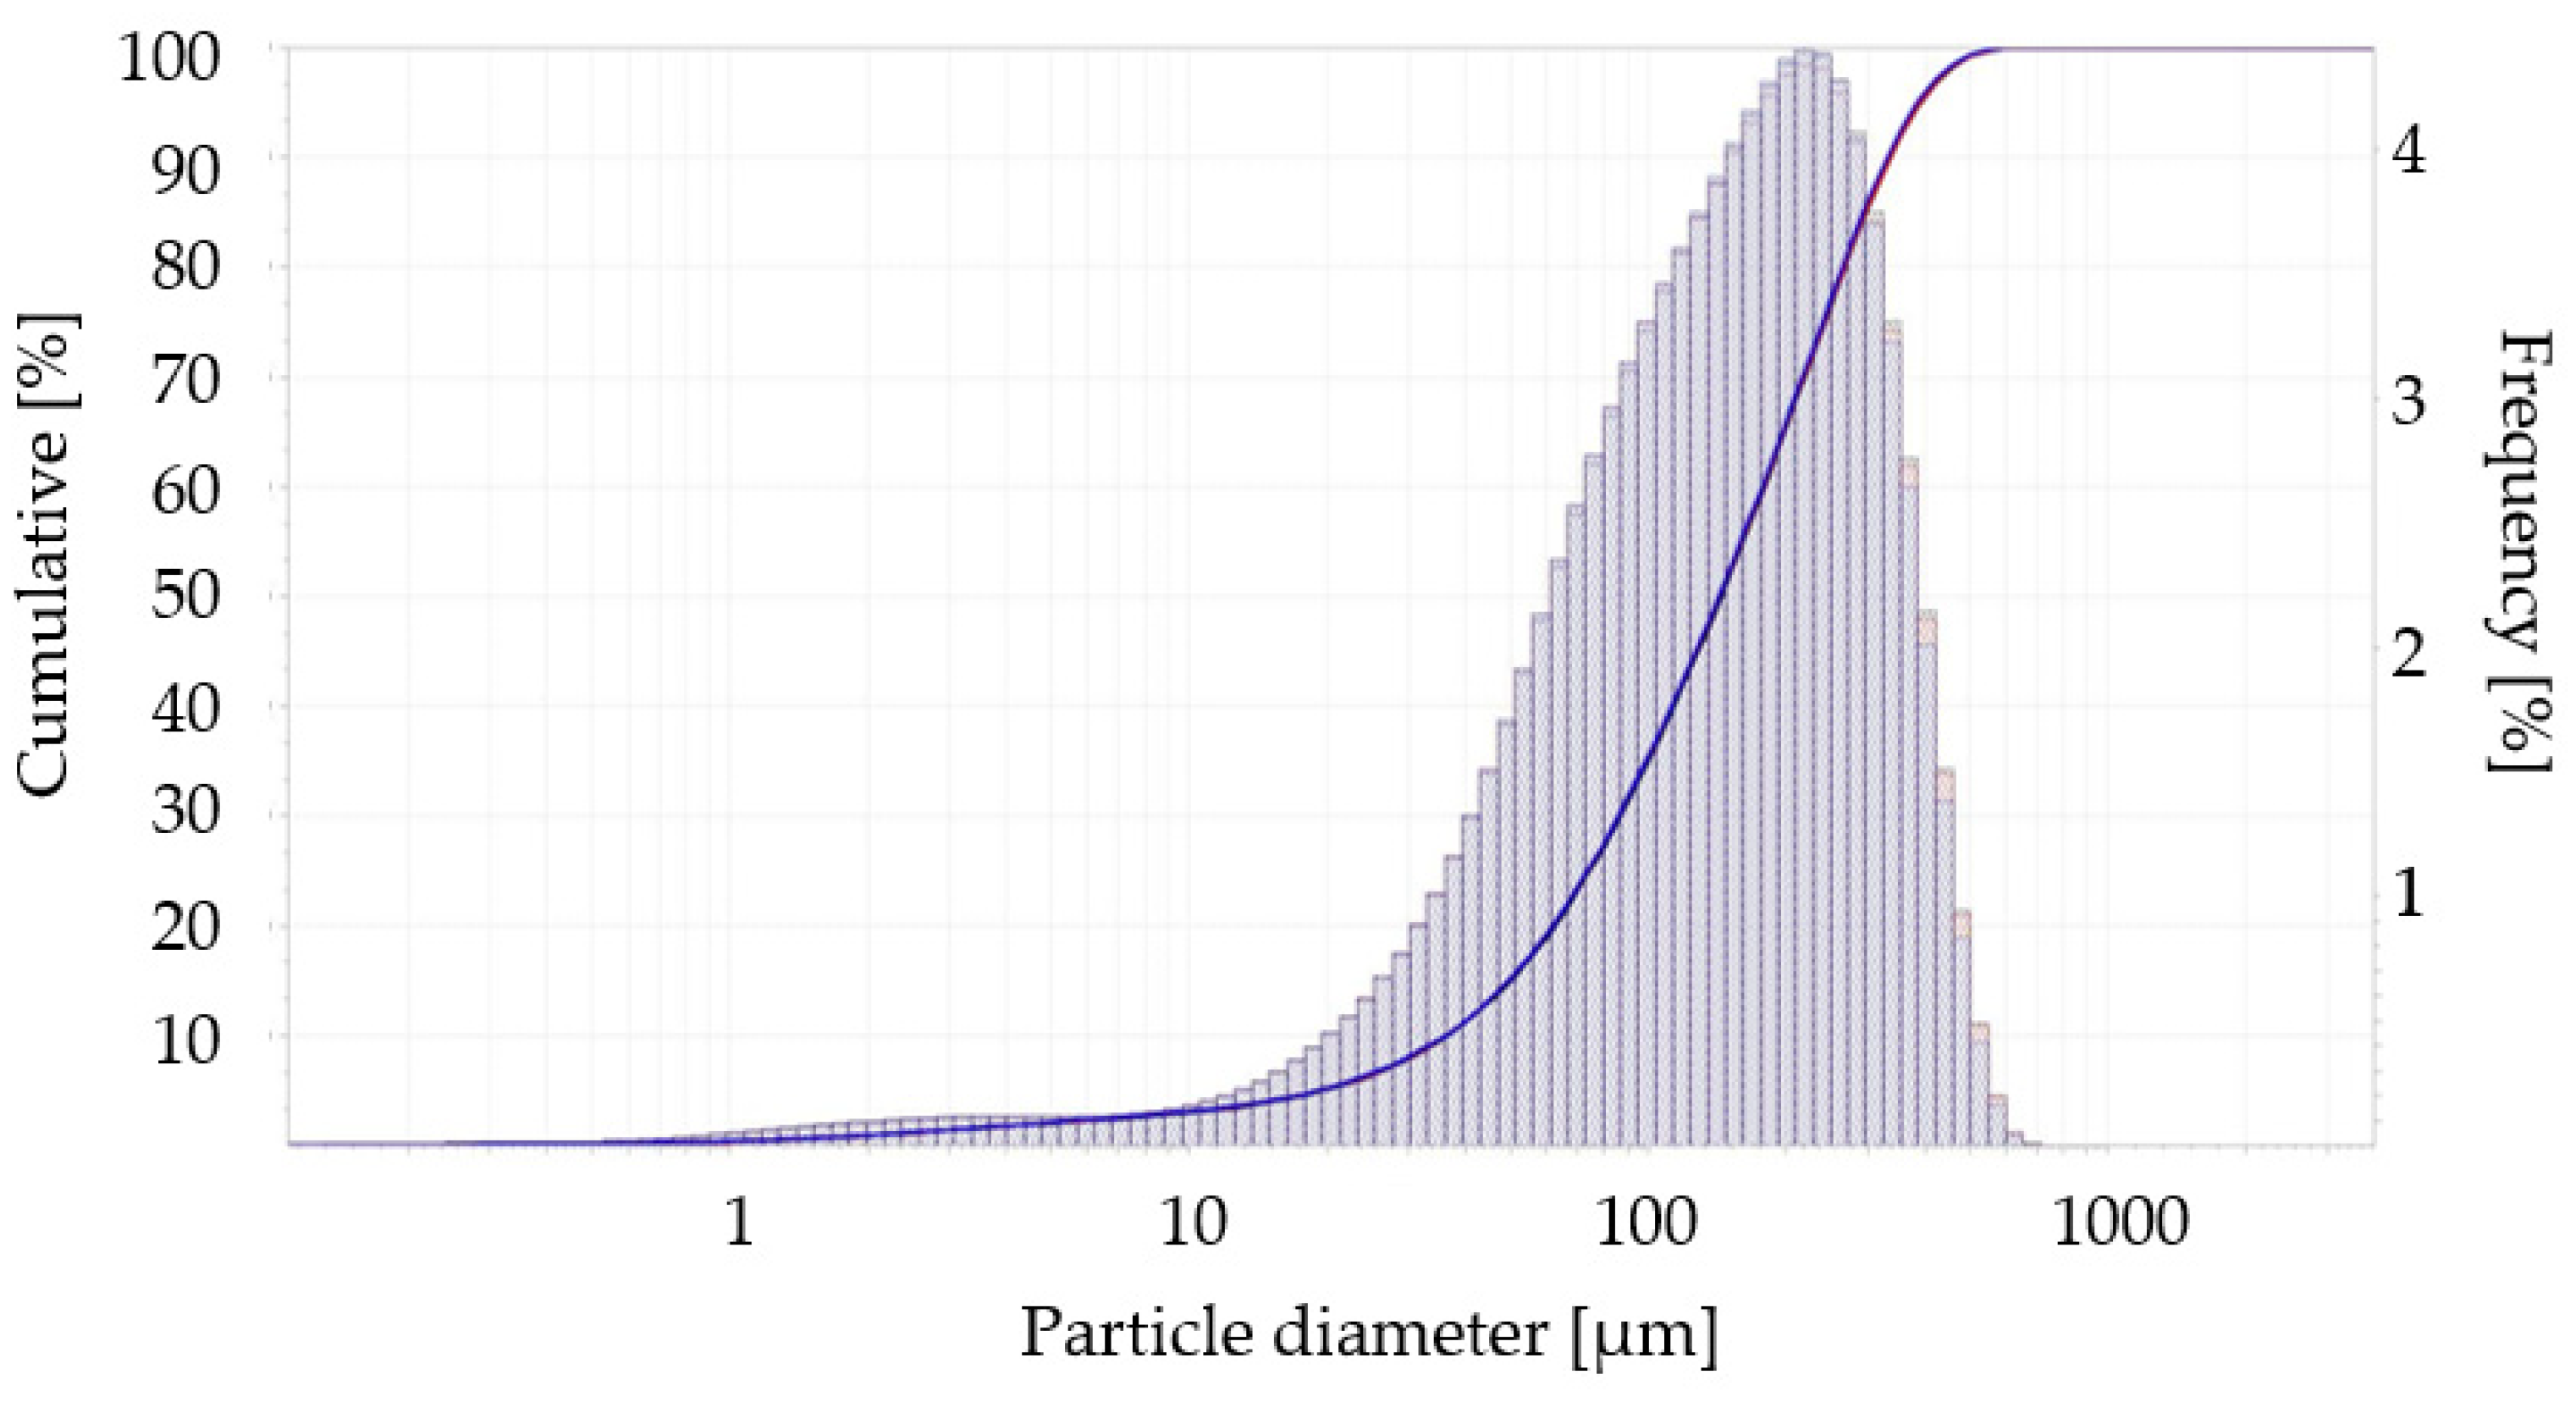
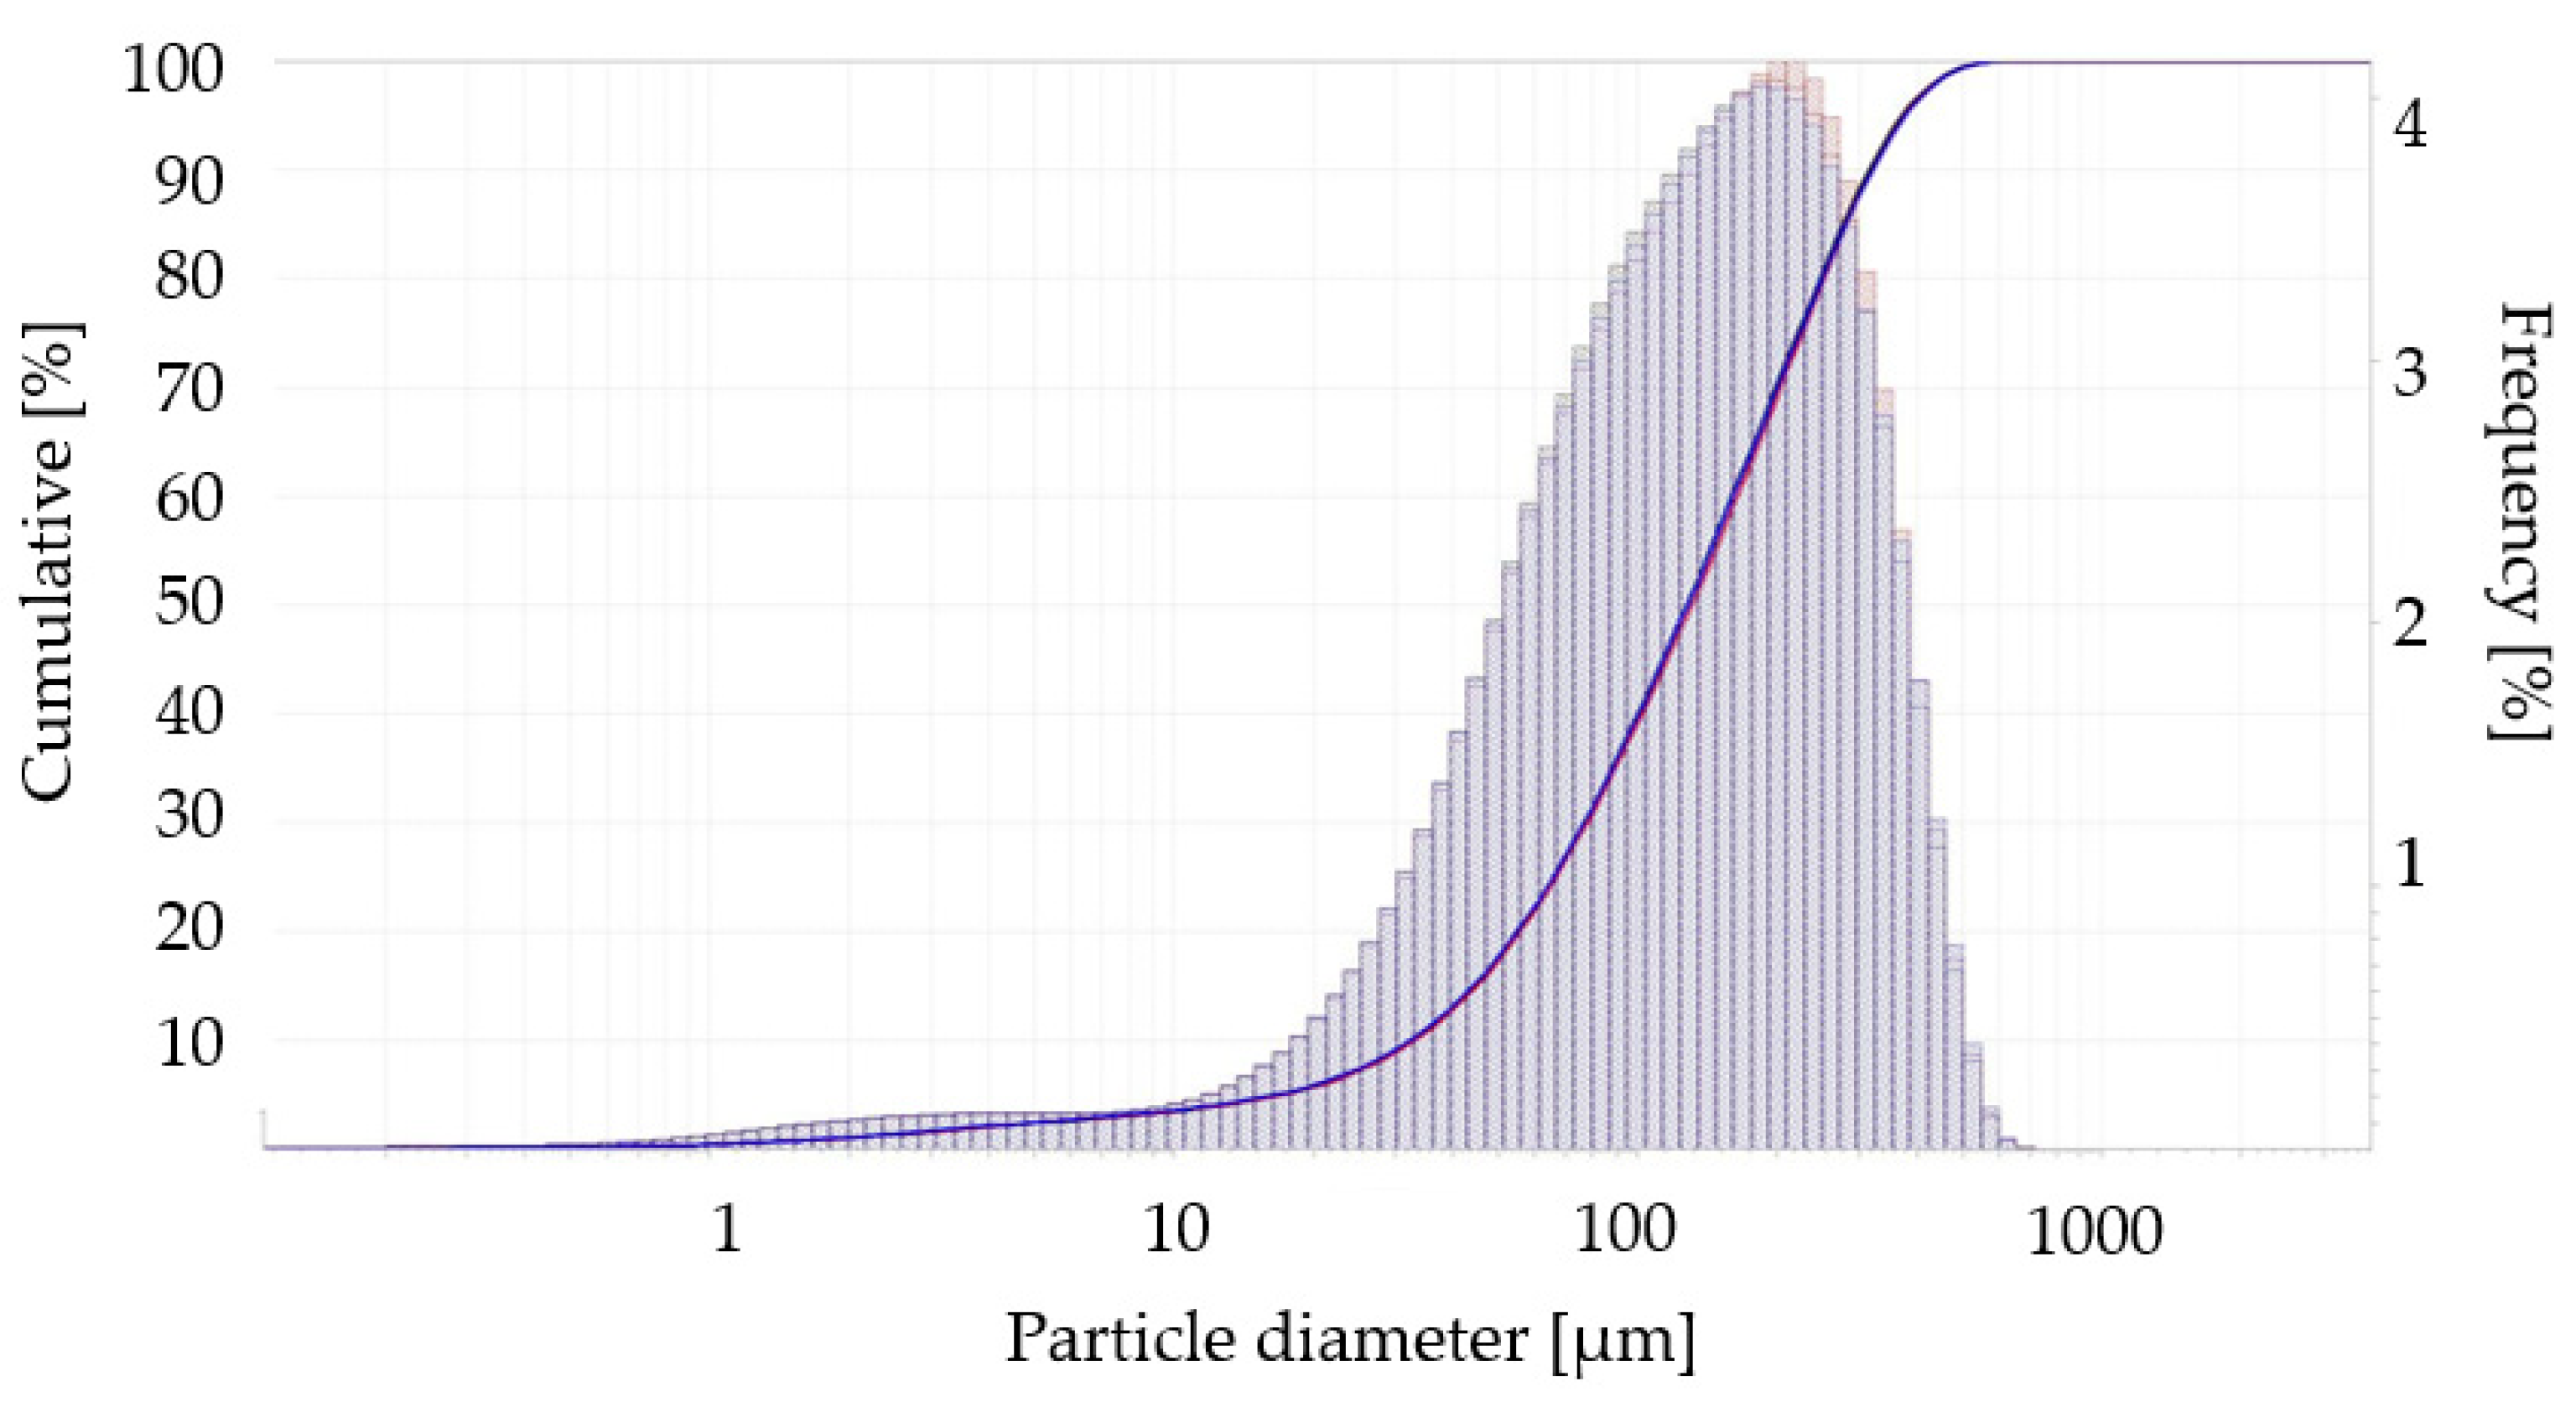
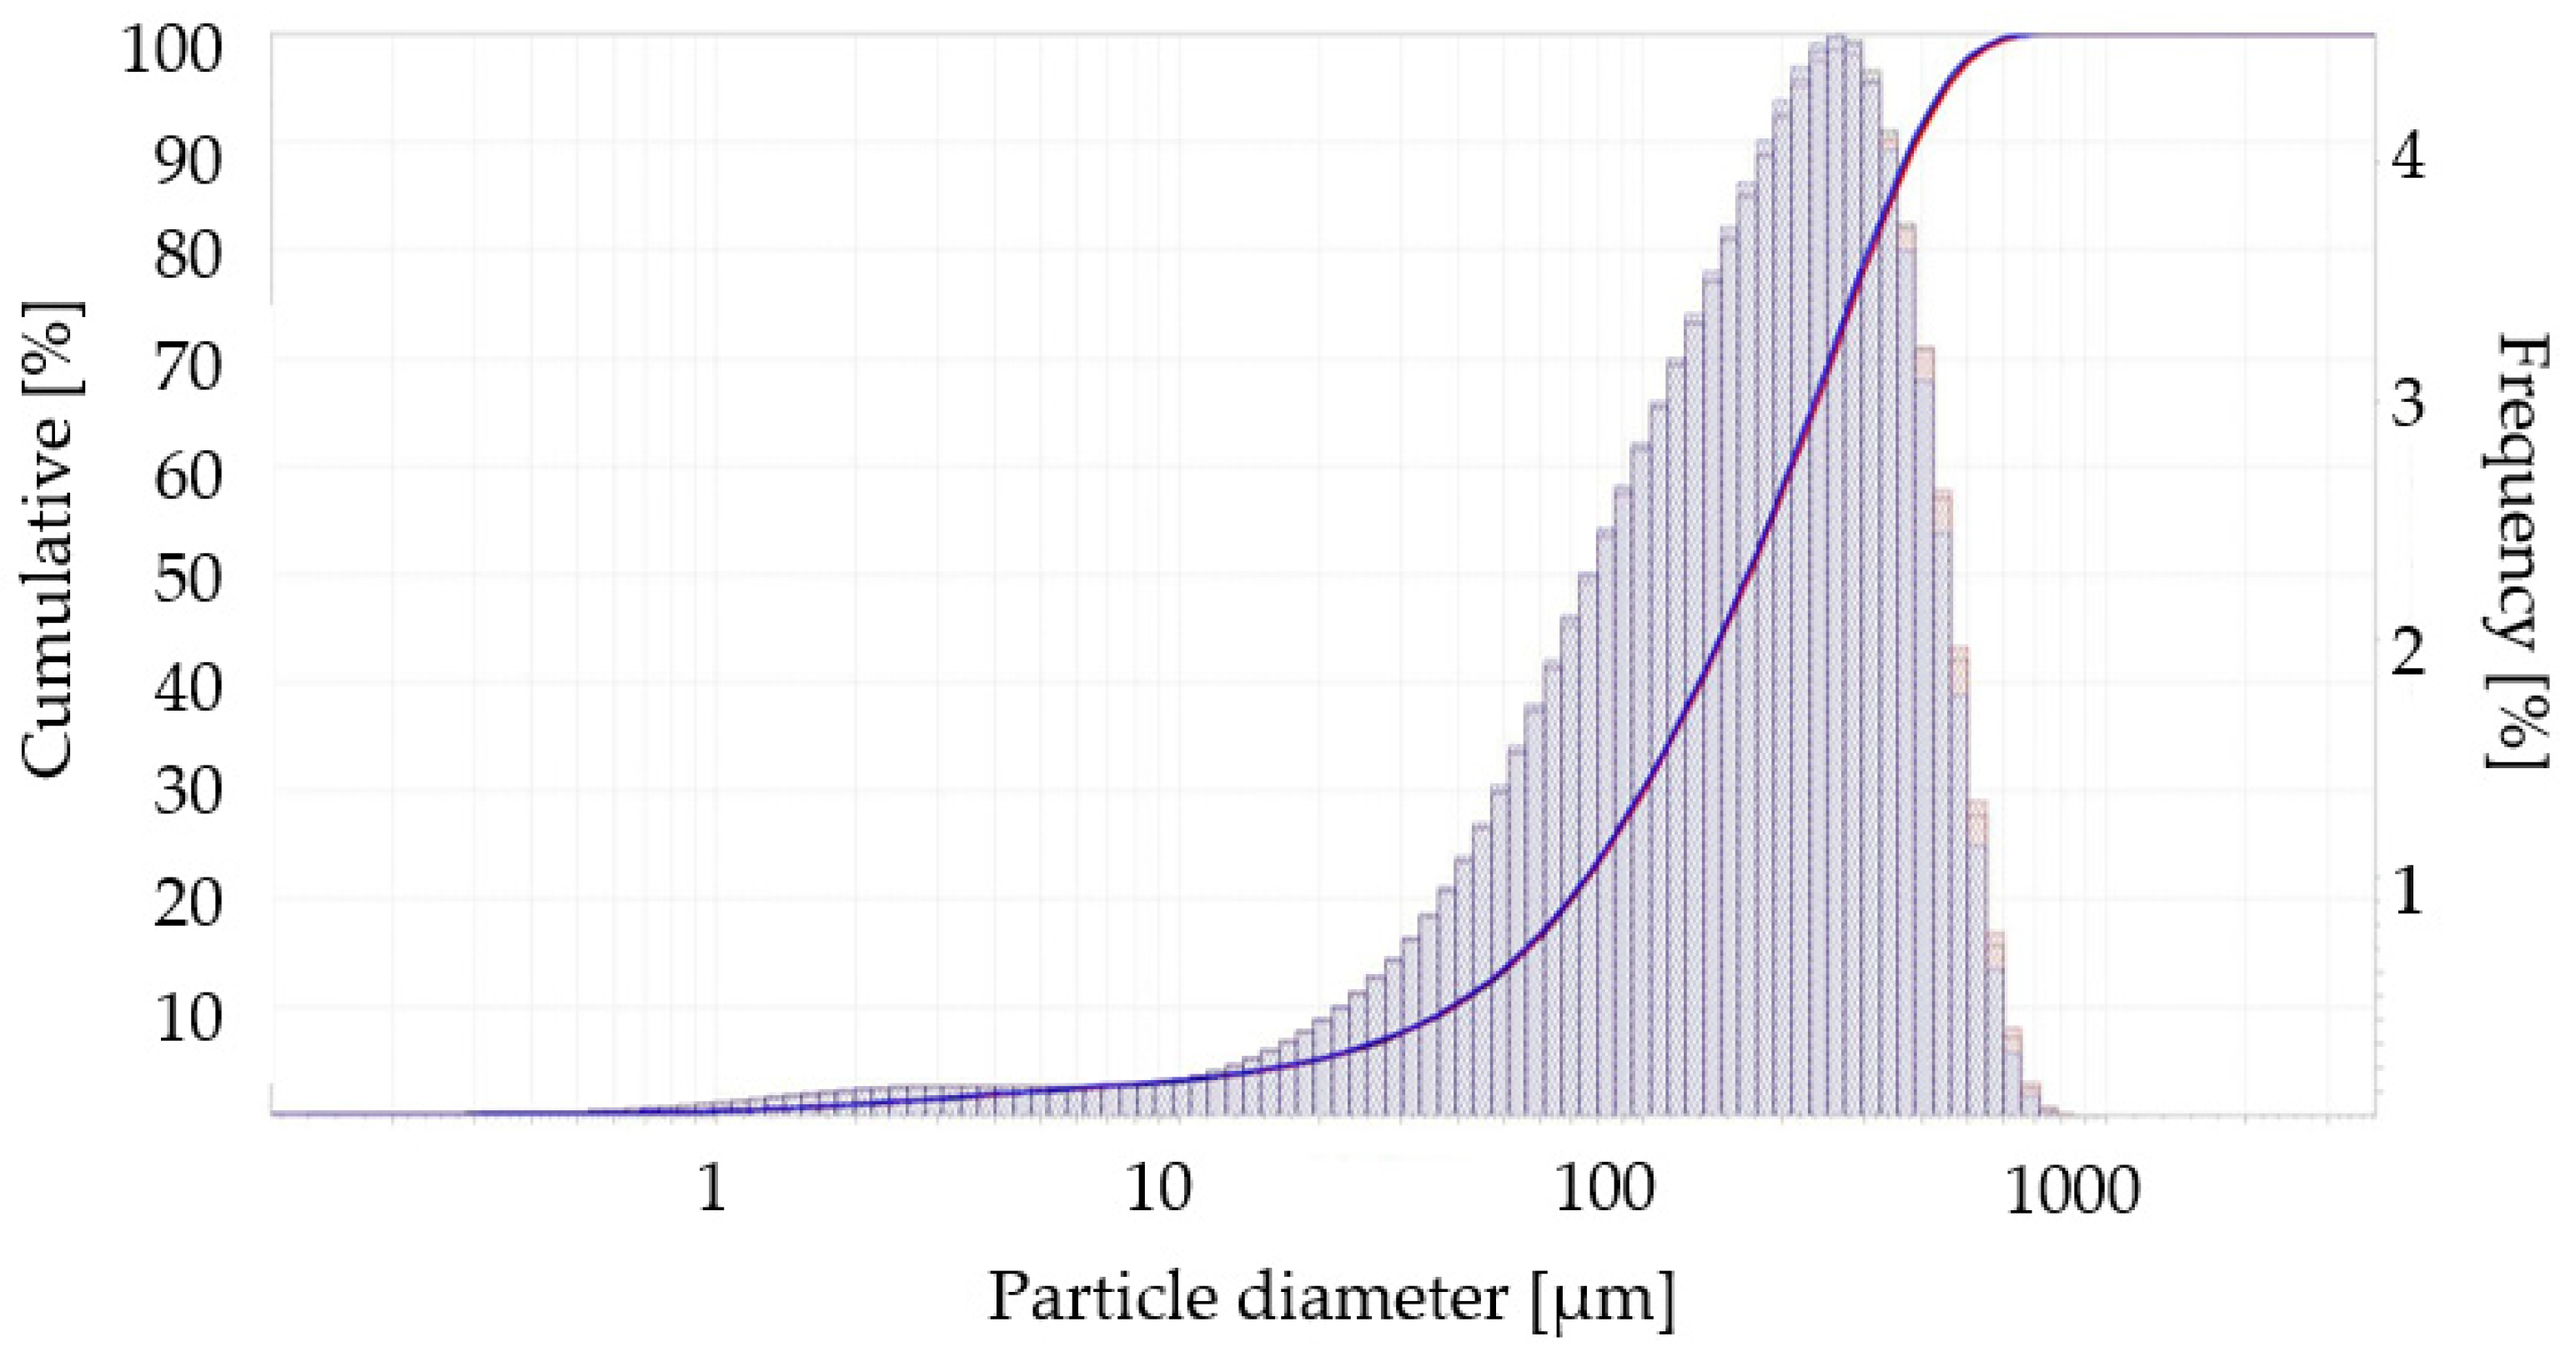
3.4. Particle Size Distribution Analysis

The results of the particle size distribution analysis, in terms of cumulative frequency, are presented in Table 4, Table 5, Table 6 and Table 7. The frequency distribution and cumulative frequency of the particle size distribution of sludge dust are presented in Figure 1, Figure 2 and Figure 3.
The particle size distribution analysis showed that the minimum particle size is 0.6 µm and the maximum is 720 µm. The particles in a size range of 710–1000 µm represent 0.013% of dust, which is the rarest frequency of particle sizes. The most frequent particle sizes are in the range of 100–150 µm (16,270%).
Particle size influences the self-ignition temperature. The decrease in the TSI with the decrease in the particle size of the wheat biomass was observed by Restuccia et al. [46]. The results showed that the self-ignition temperature slightly decreases with the particle size. However, the higher bulk density of the sludge pellets may be a reason for the offsetting particle size effect due to the larger amount of fuel for a given basket volume.

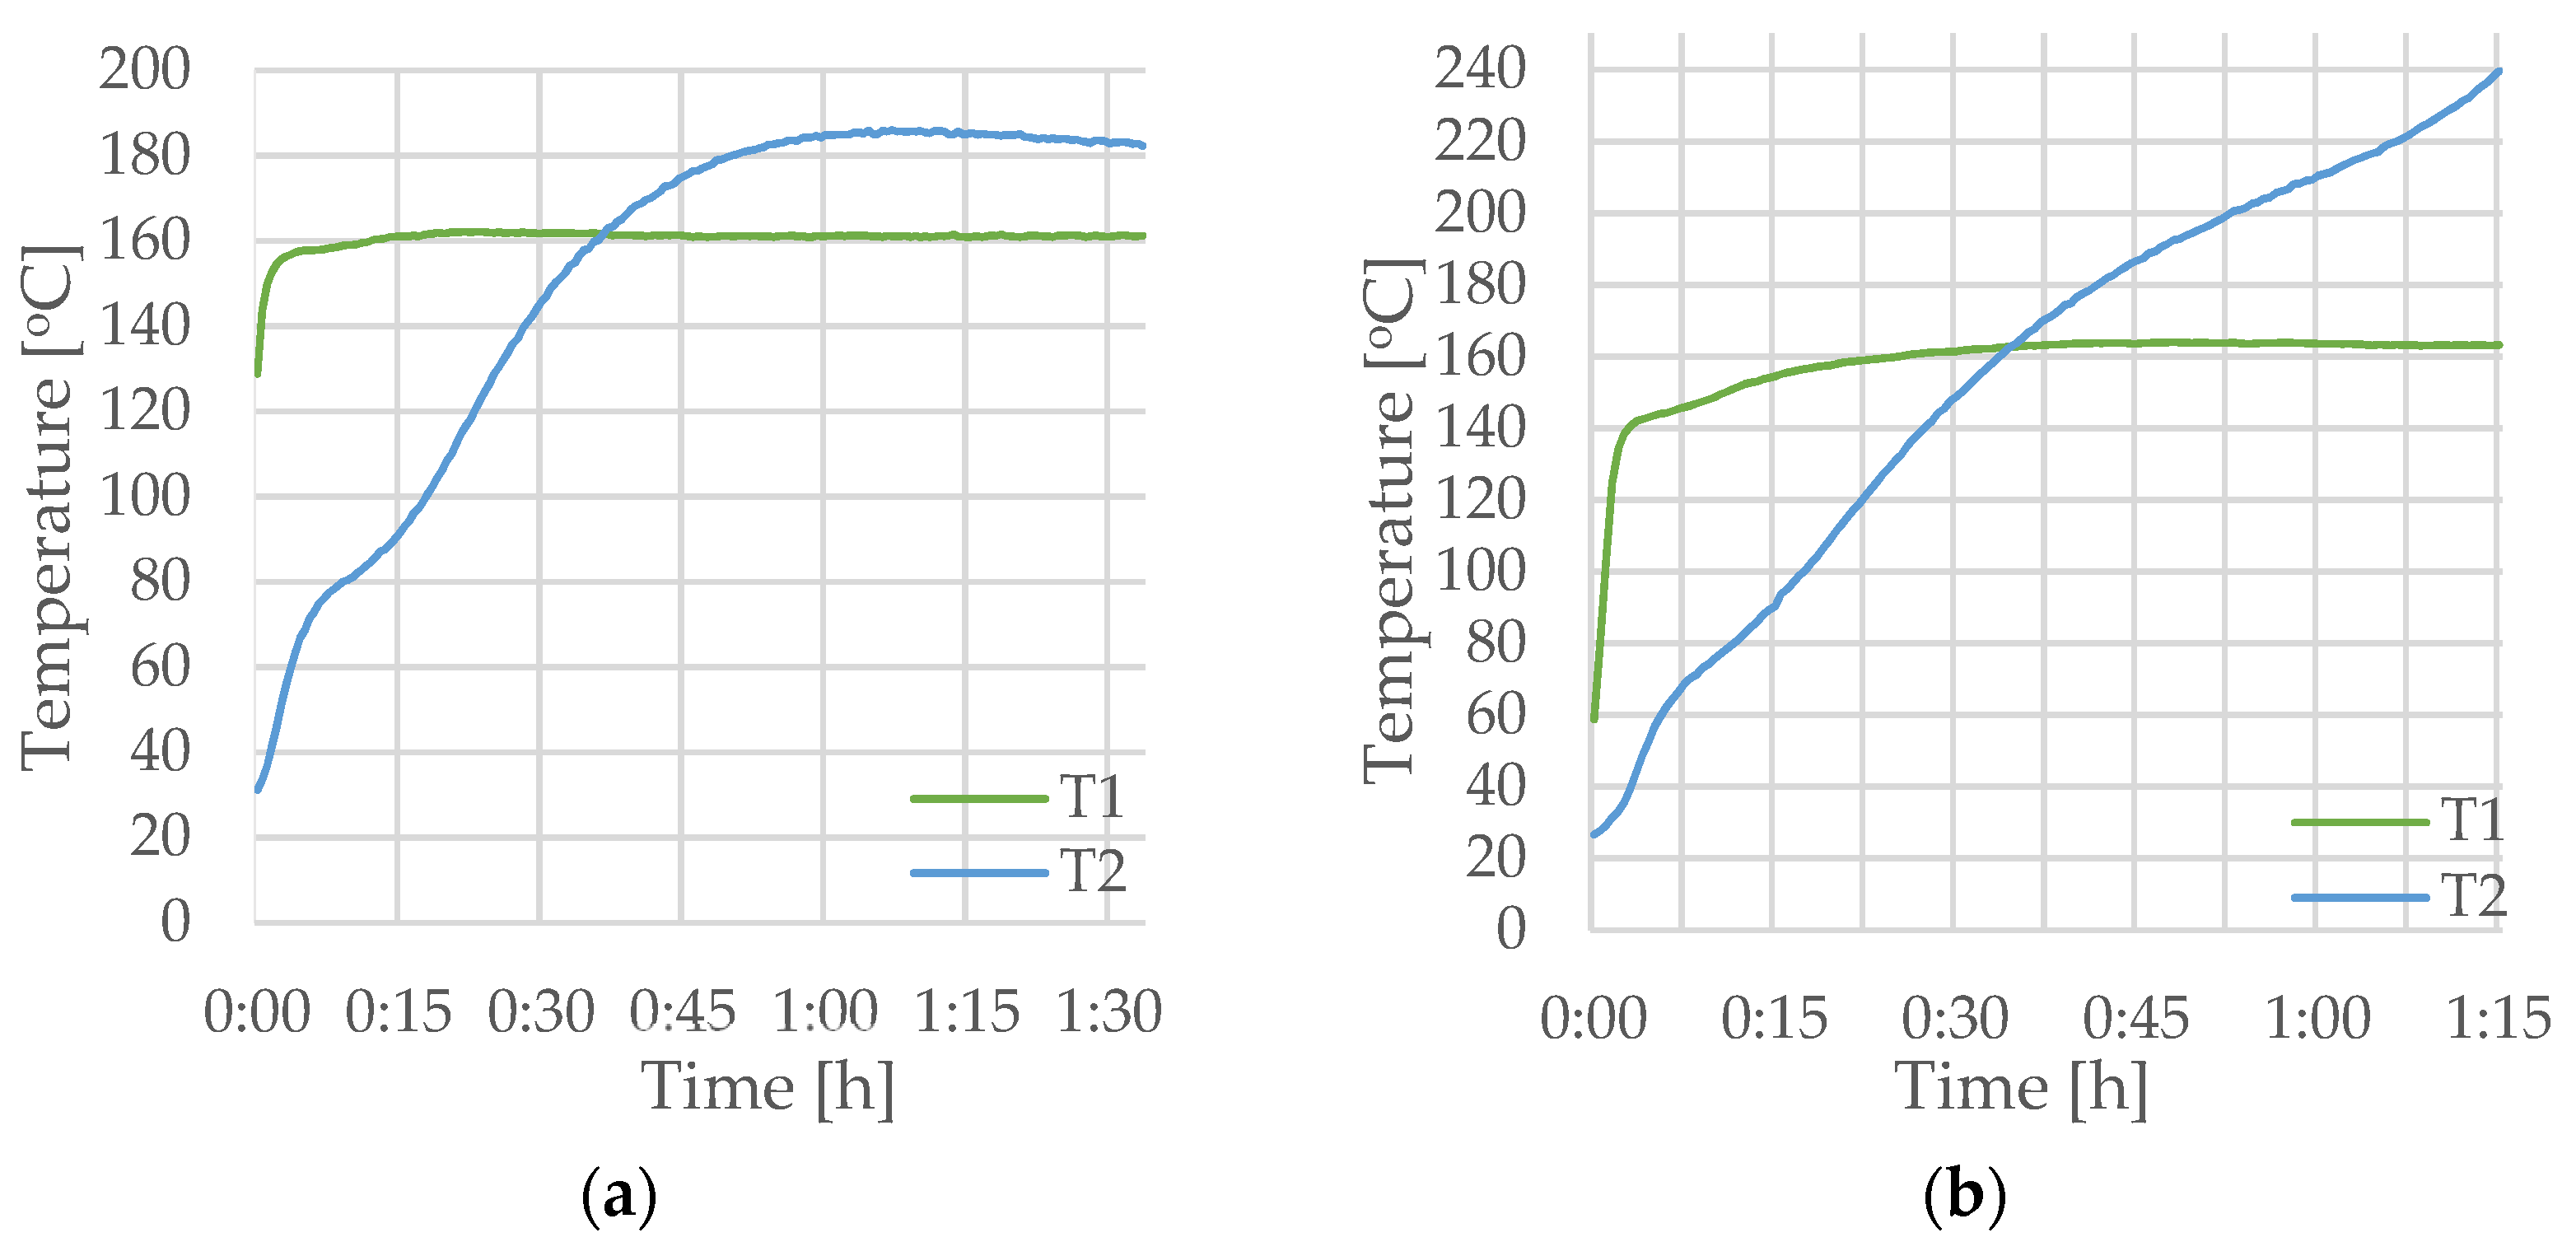
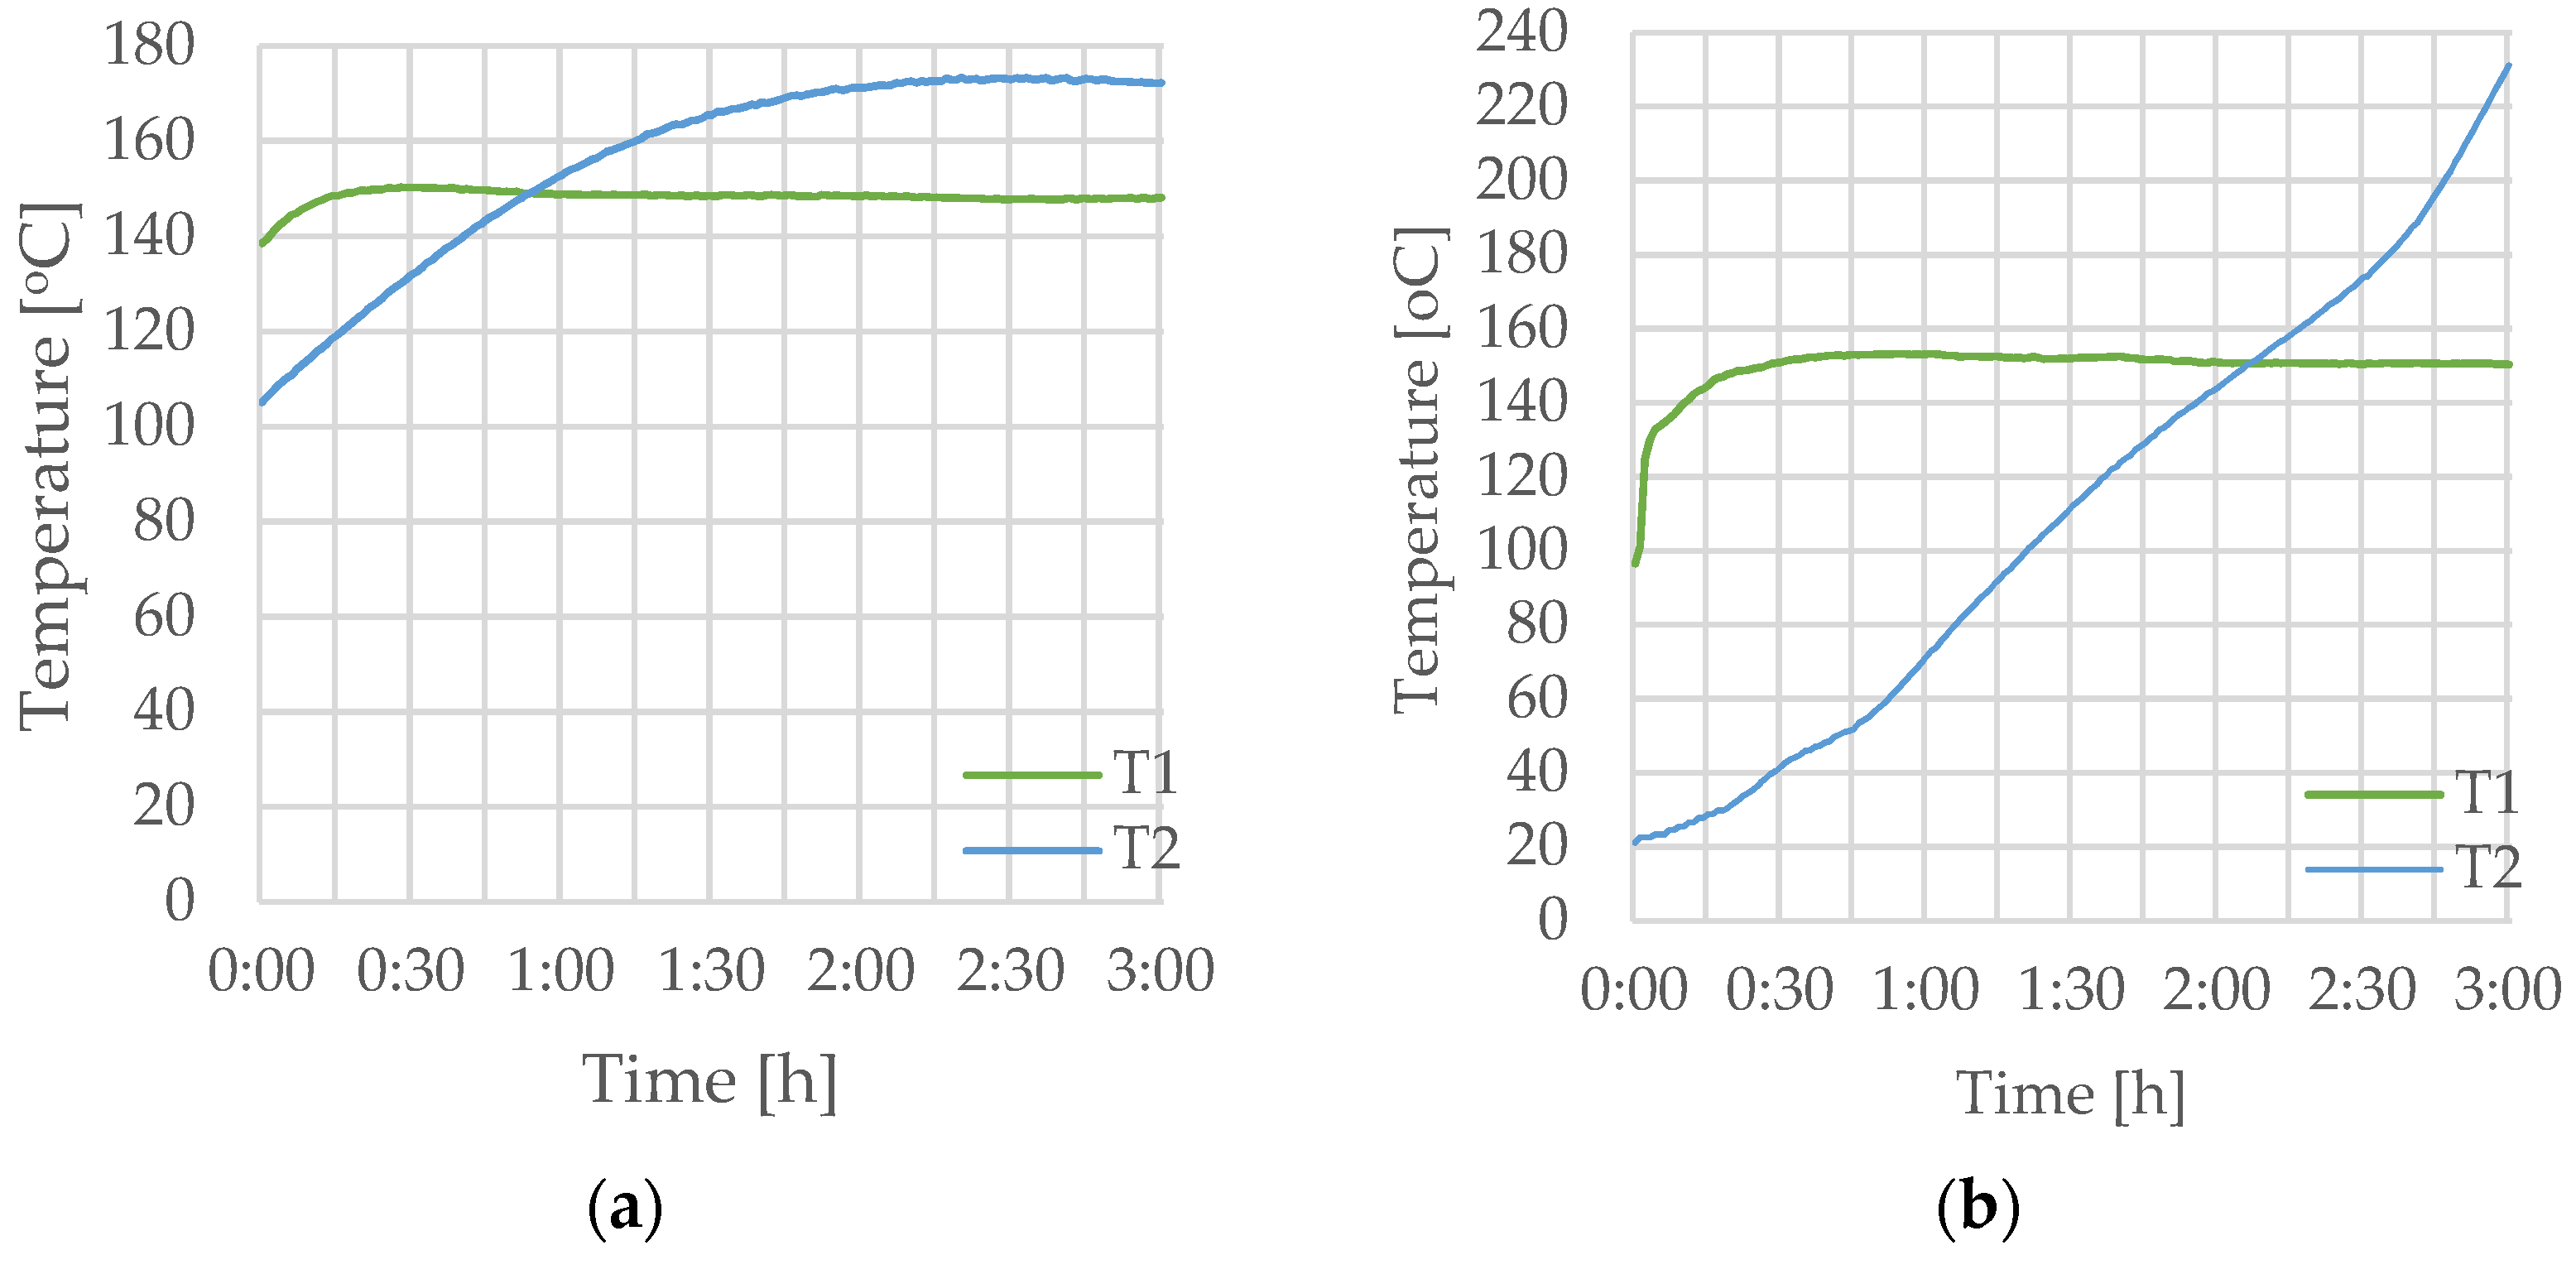
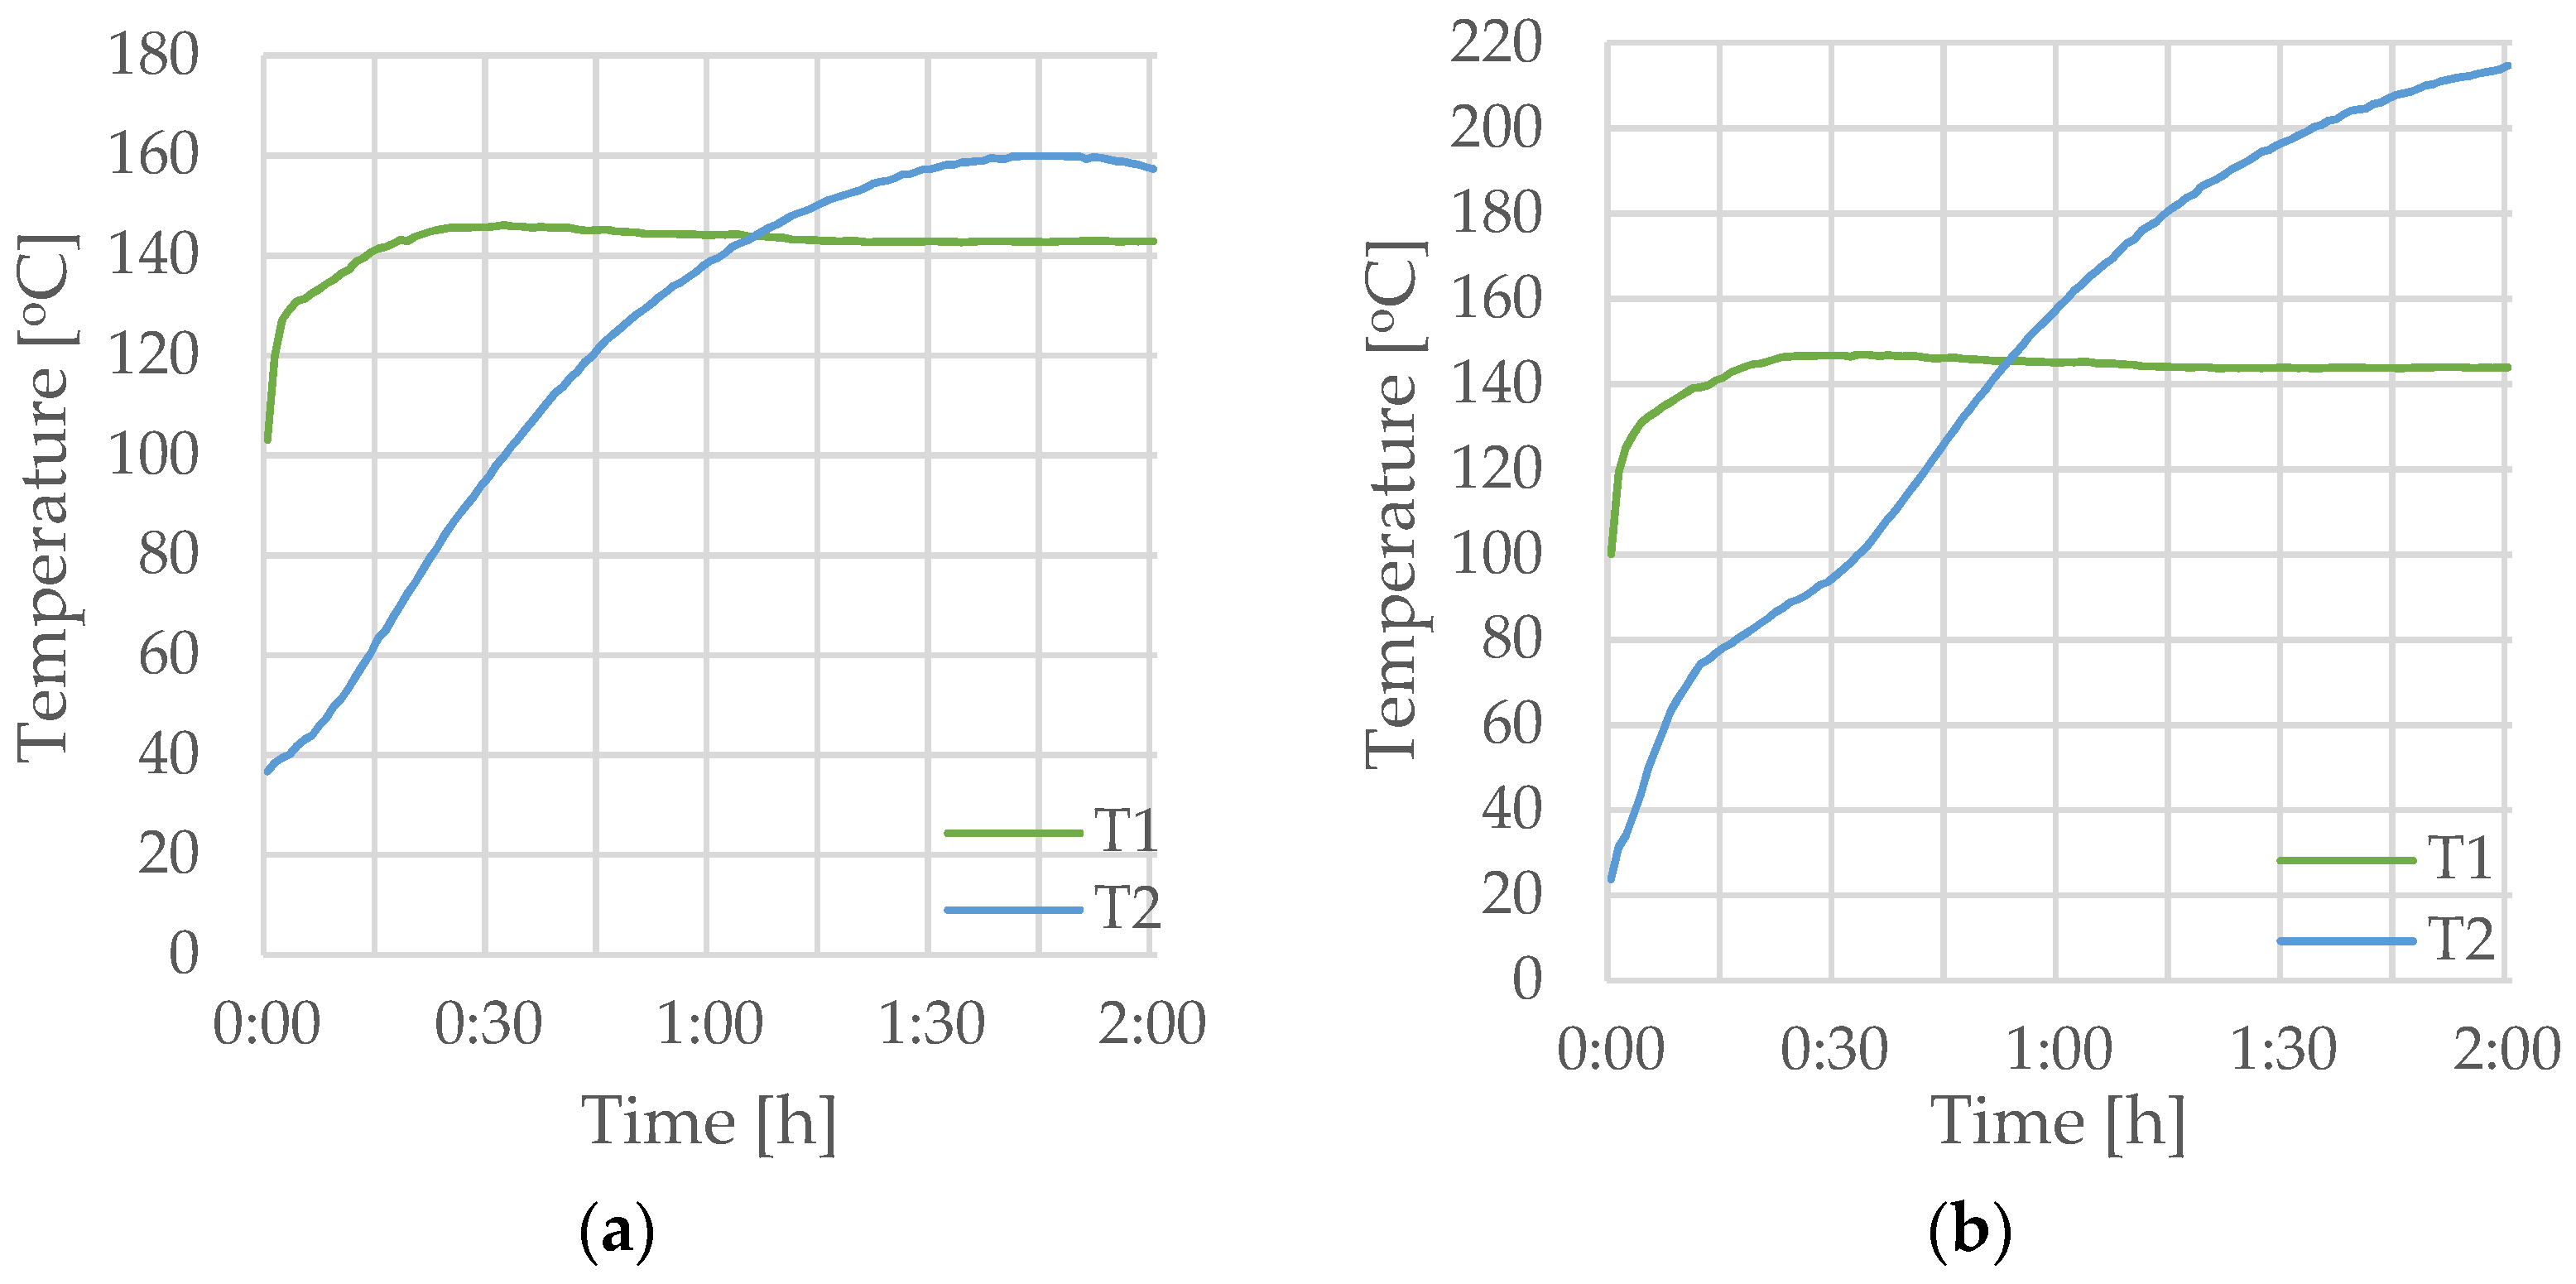
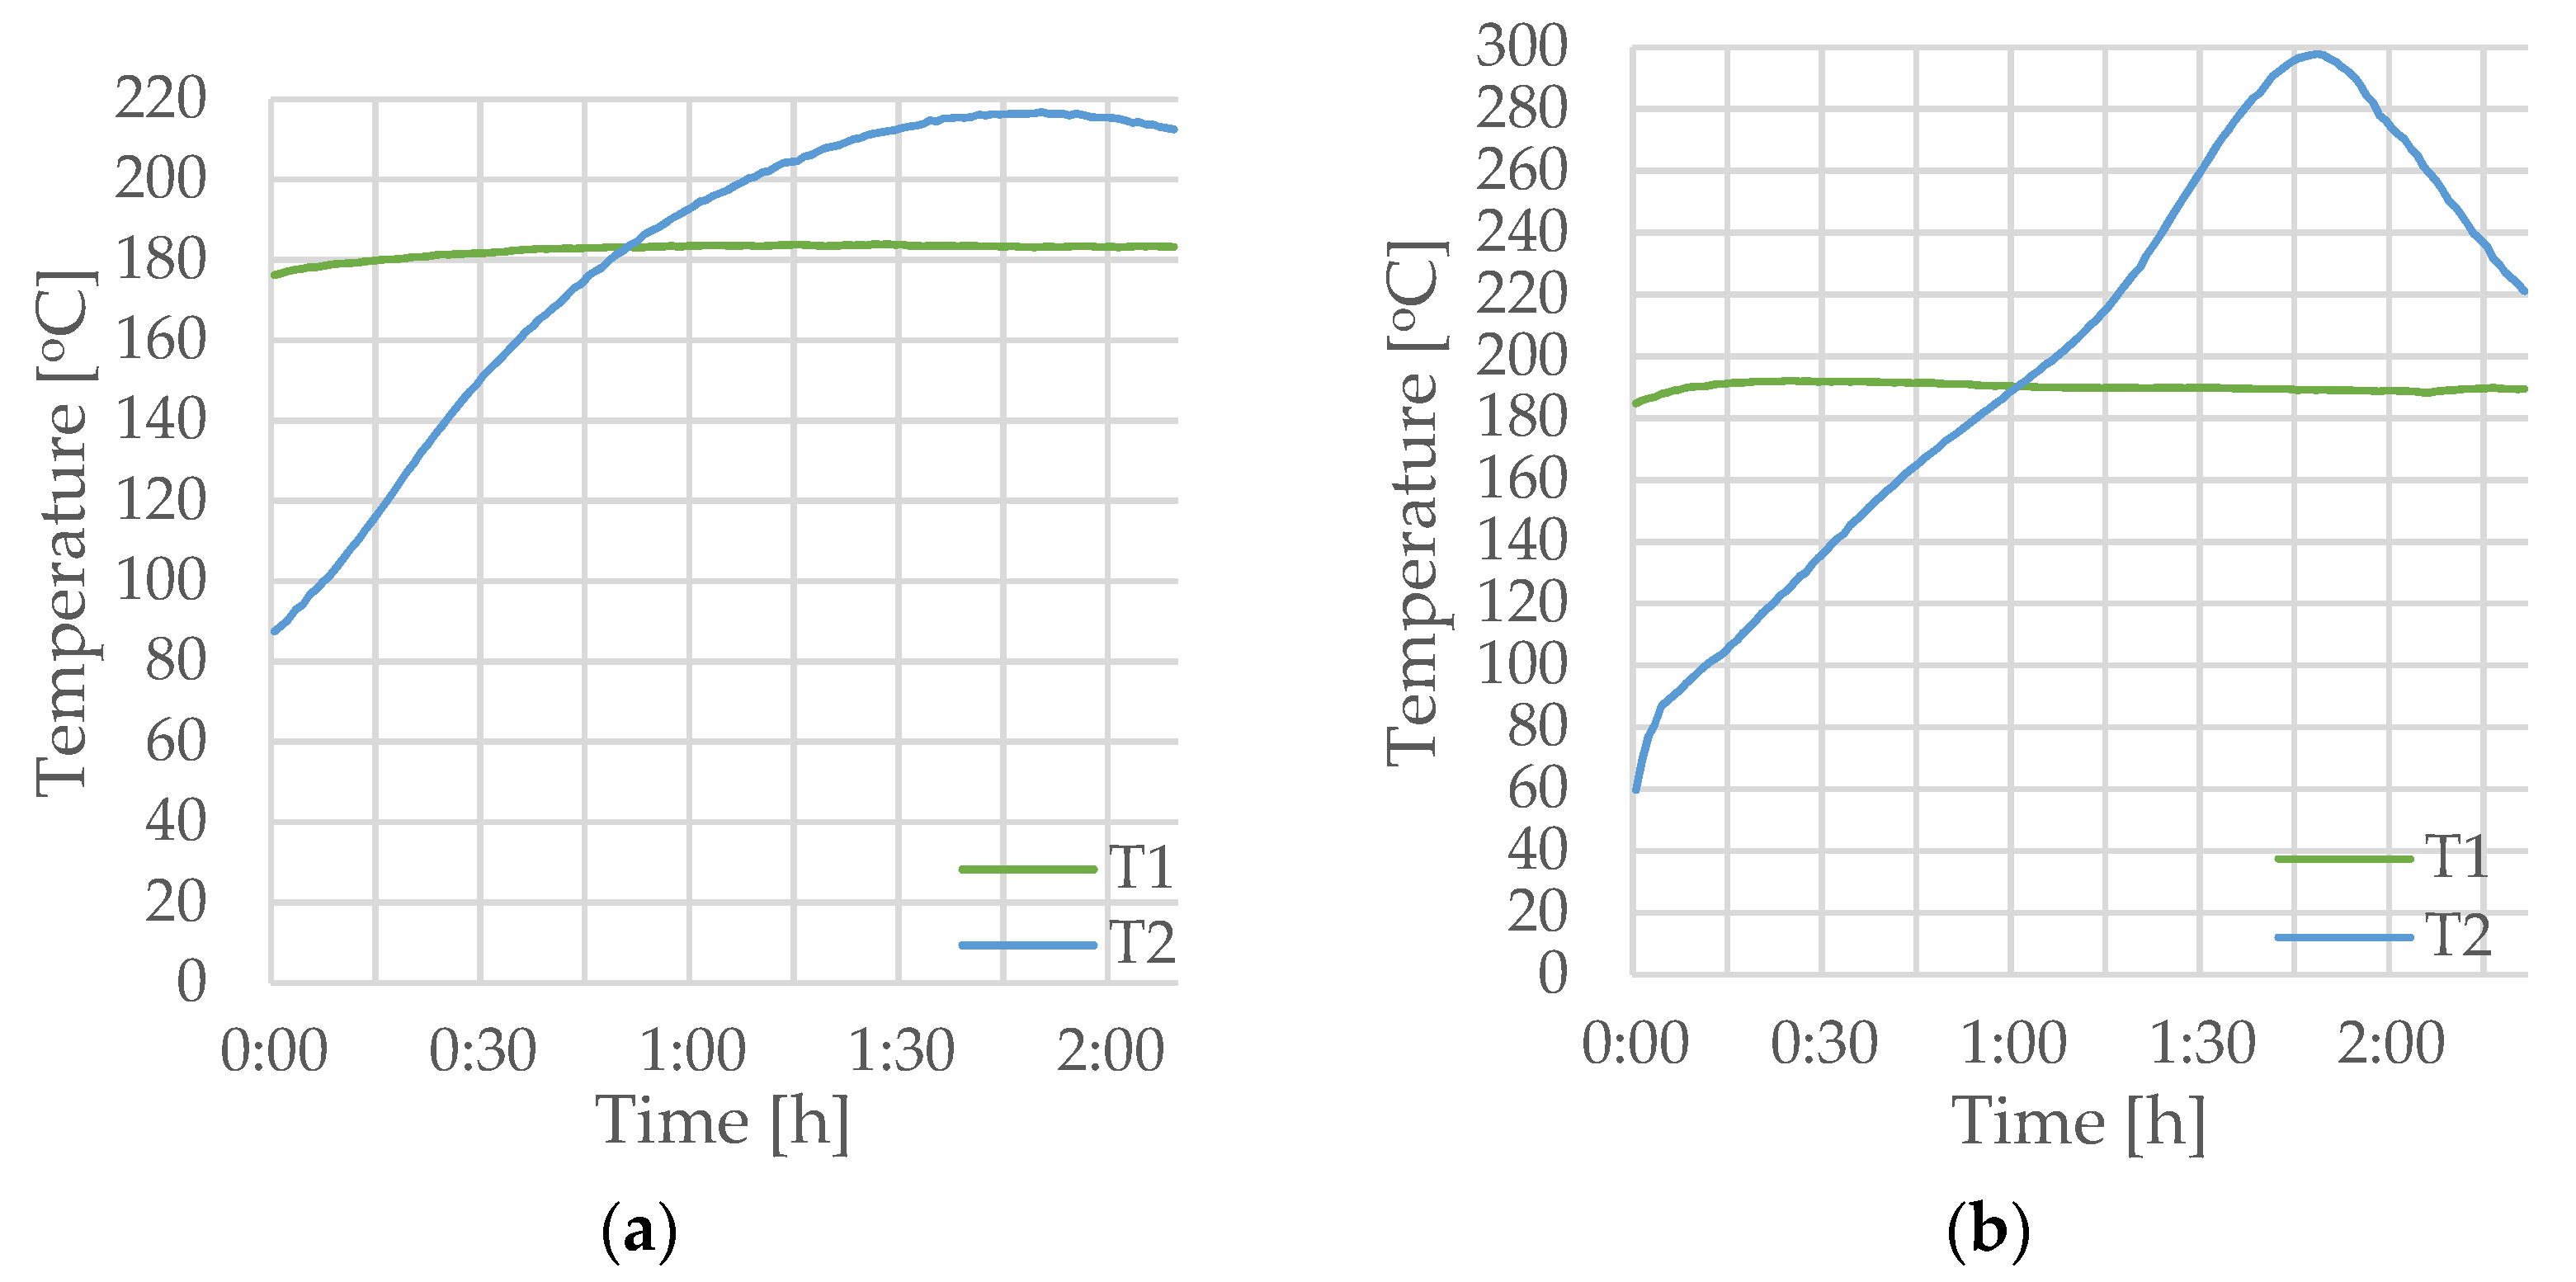
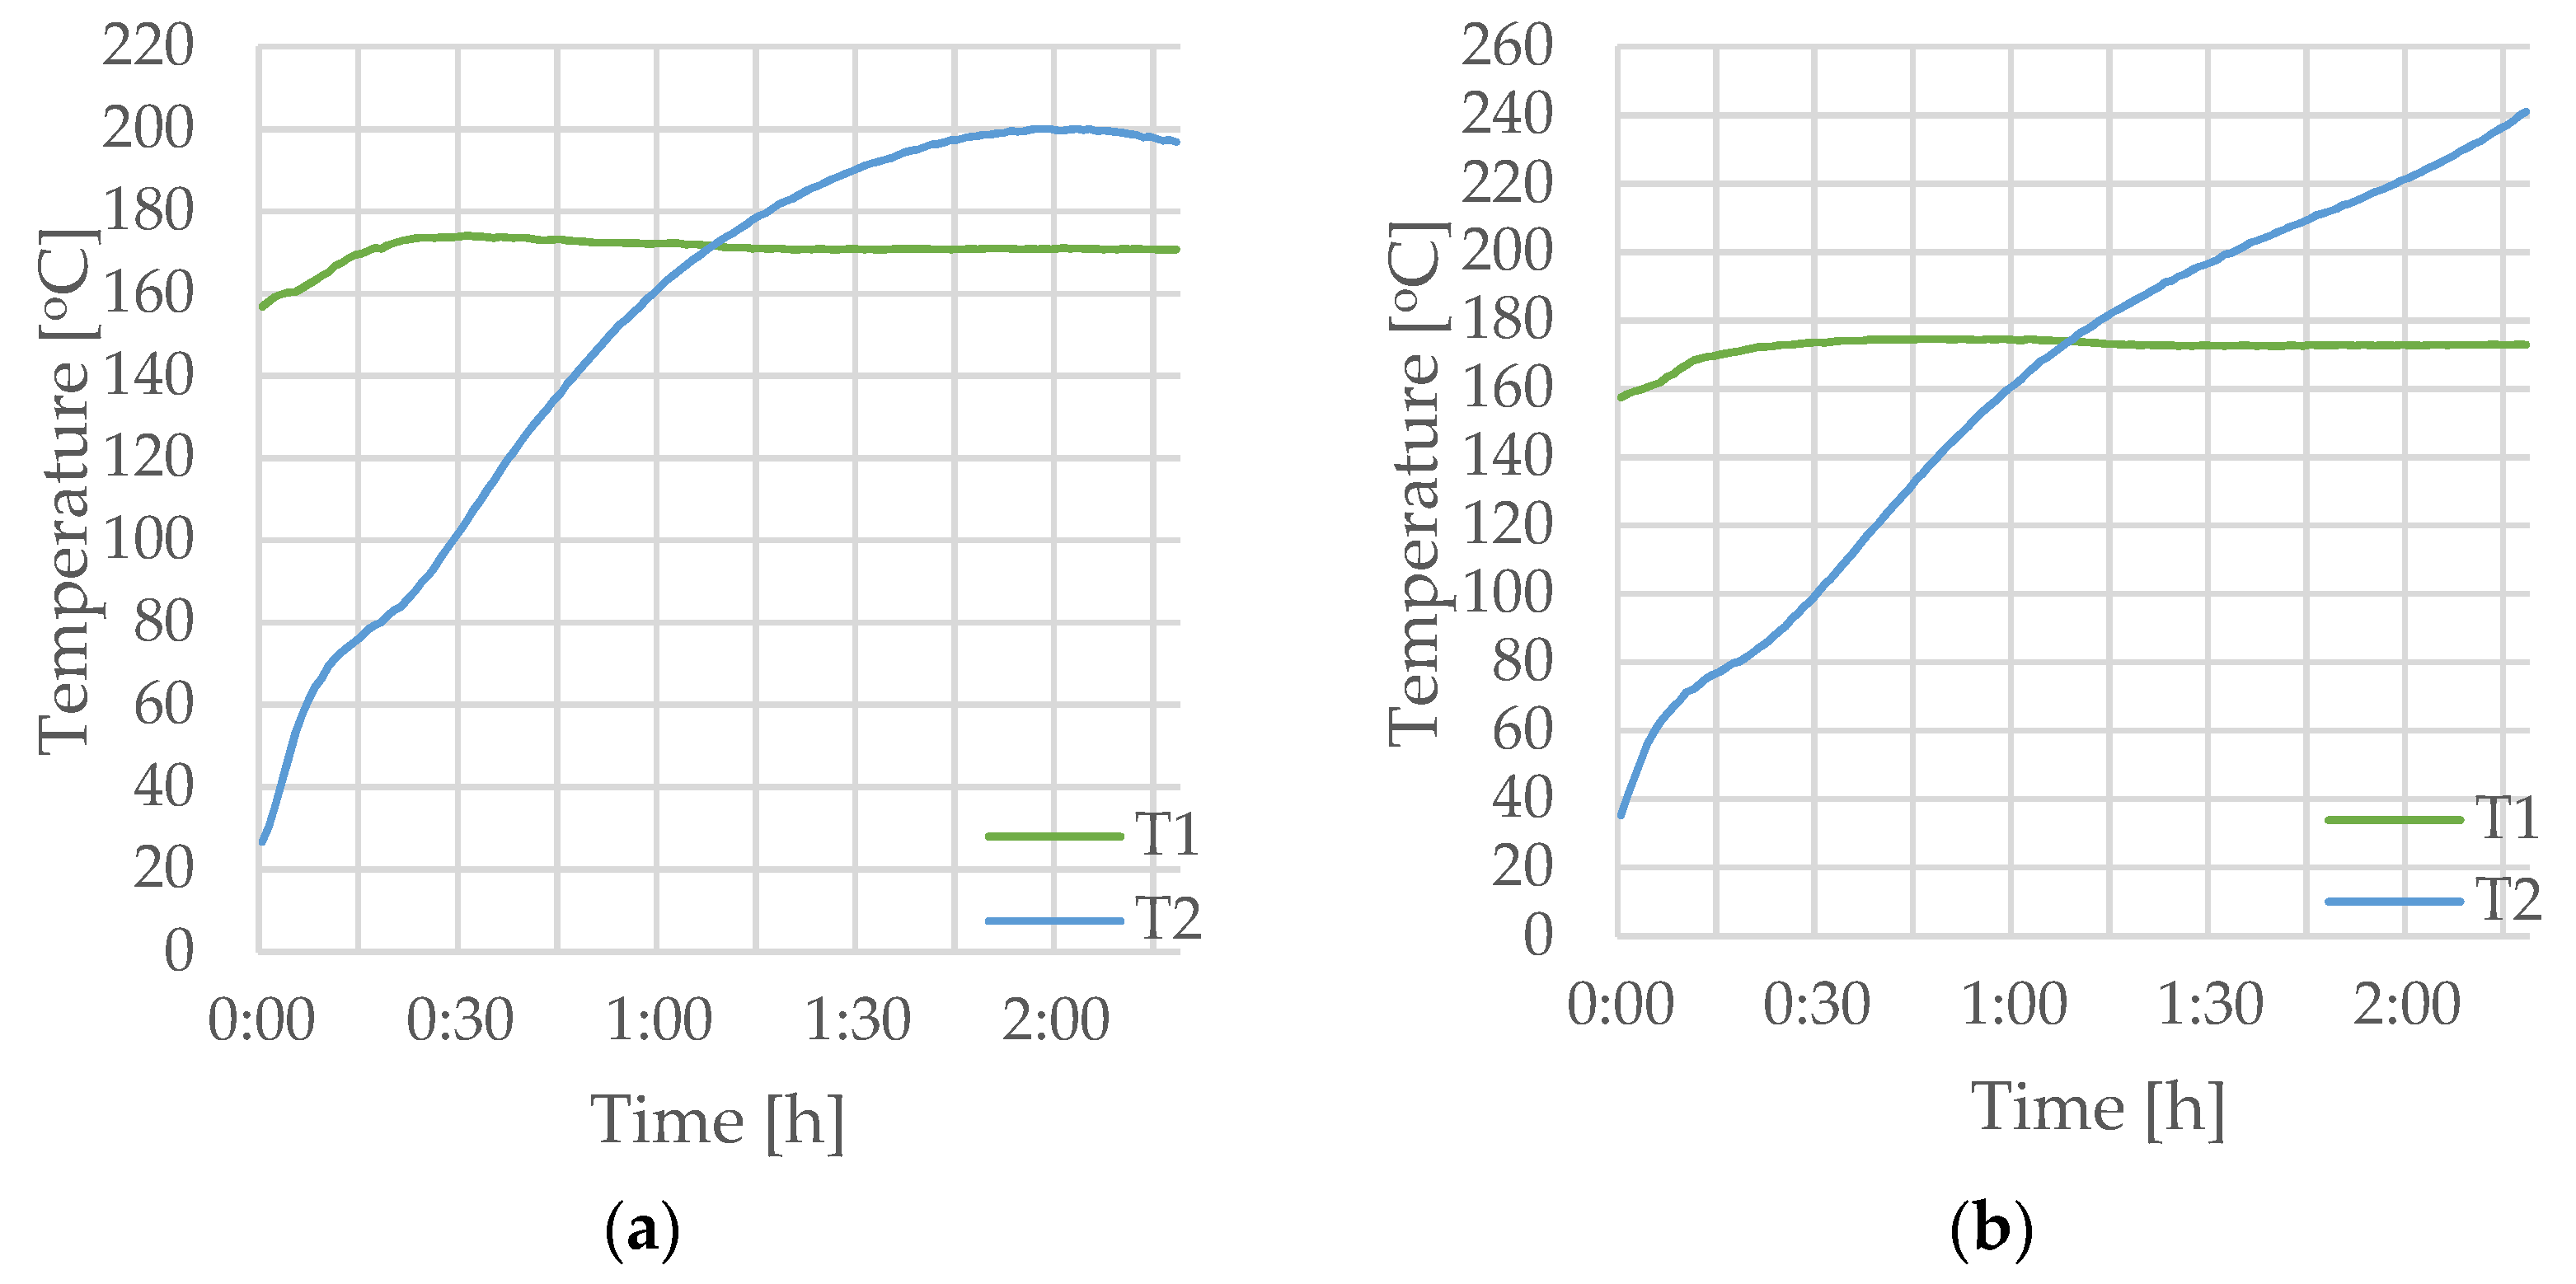
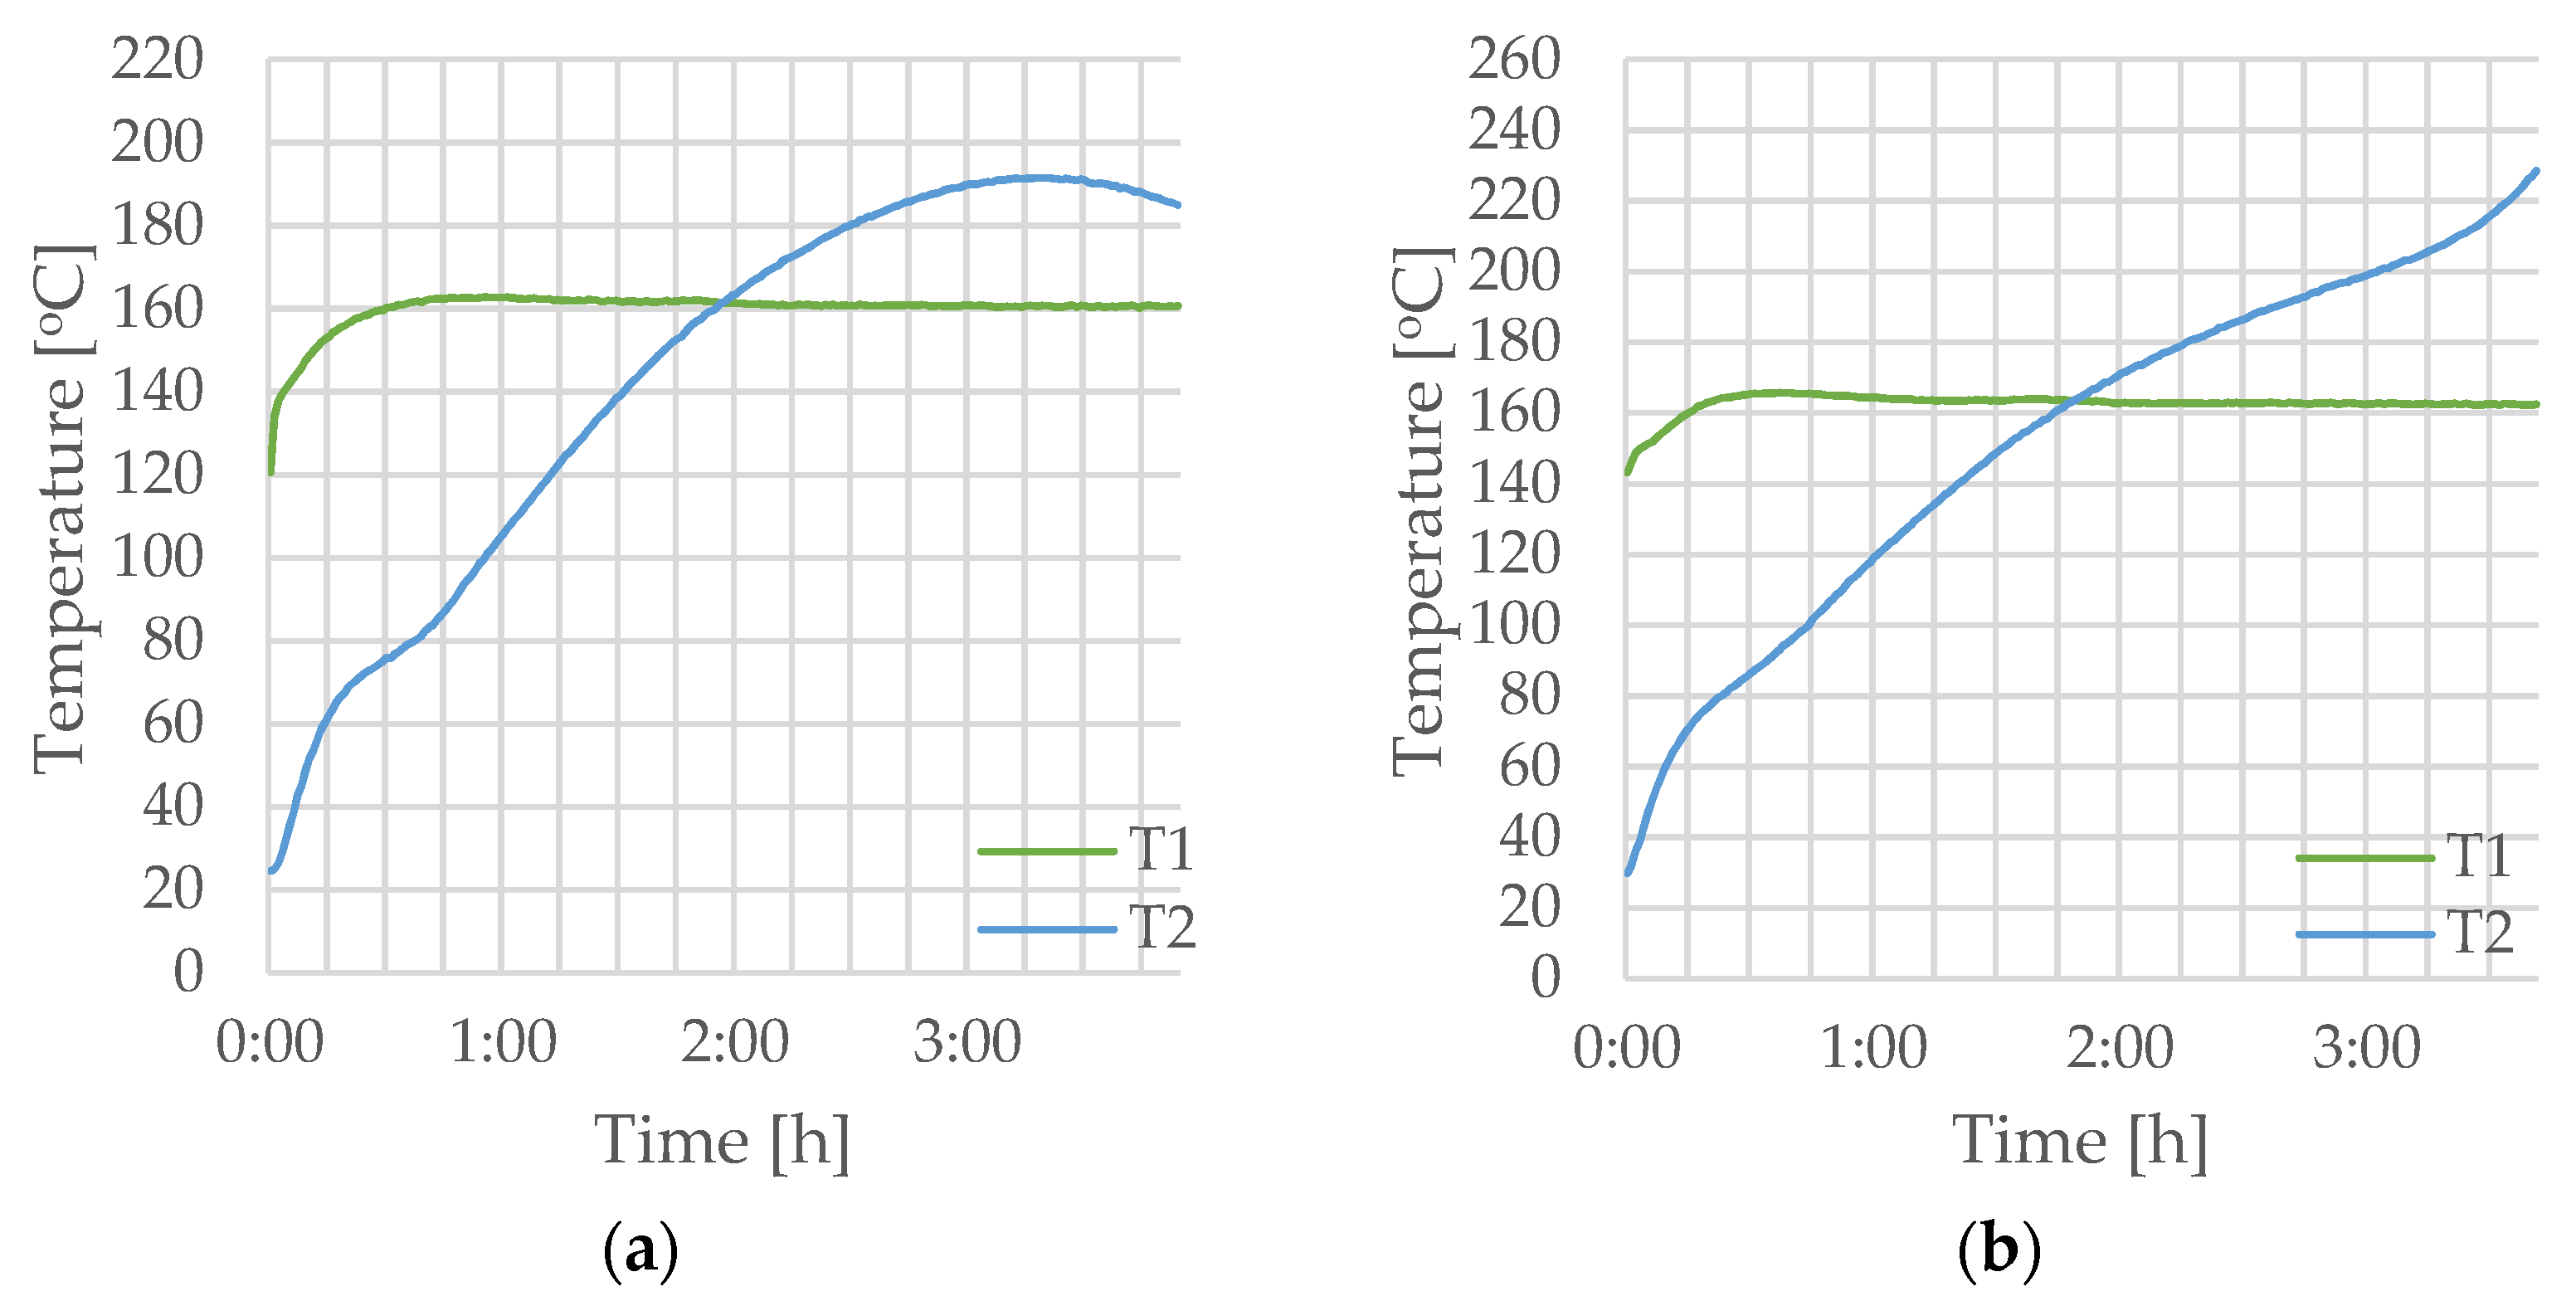
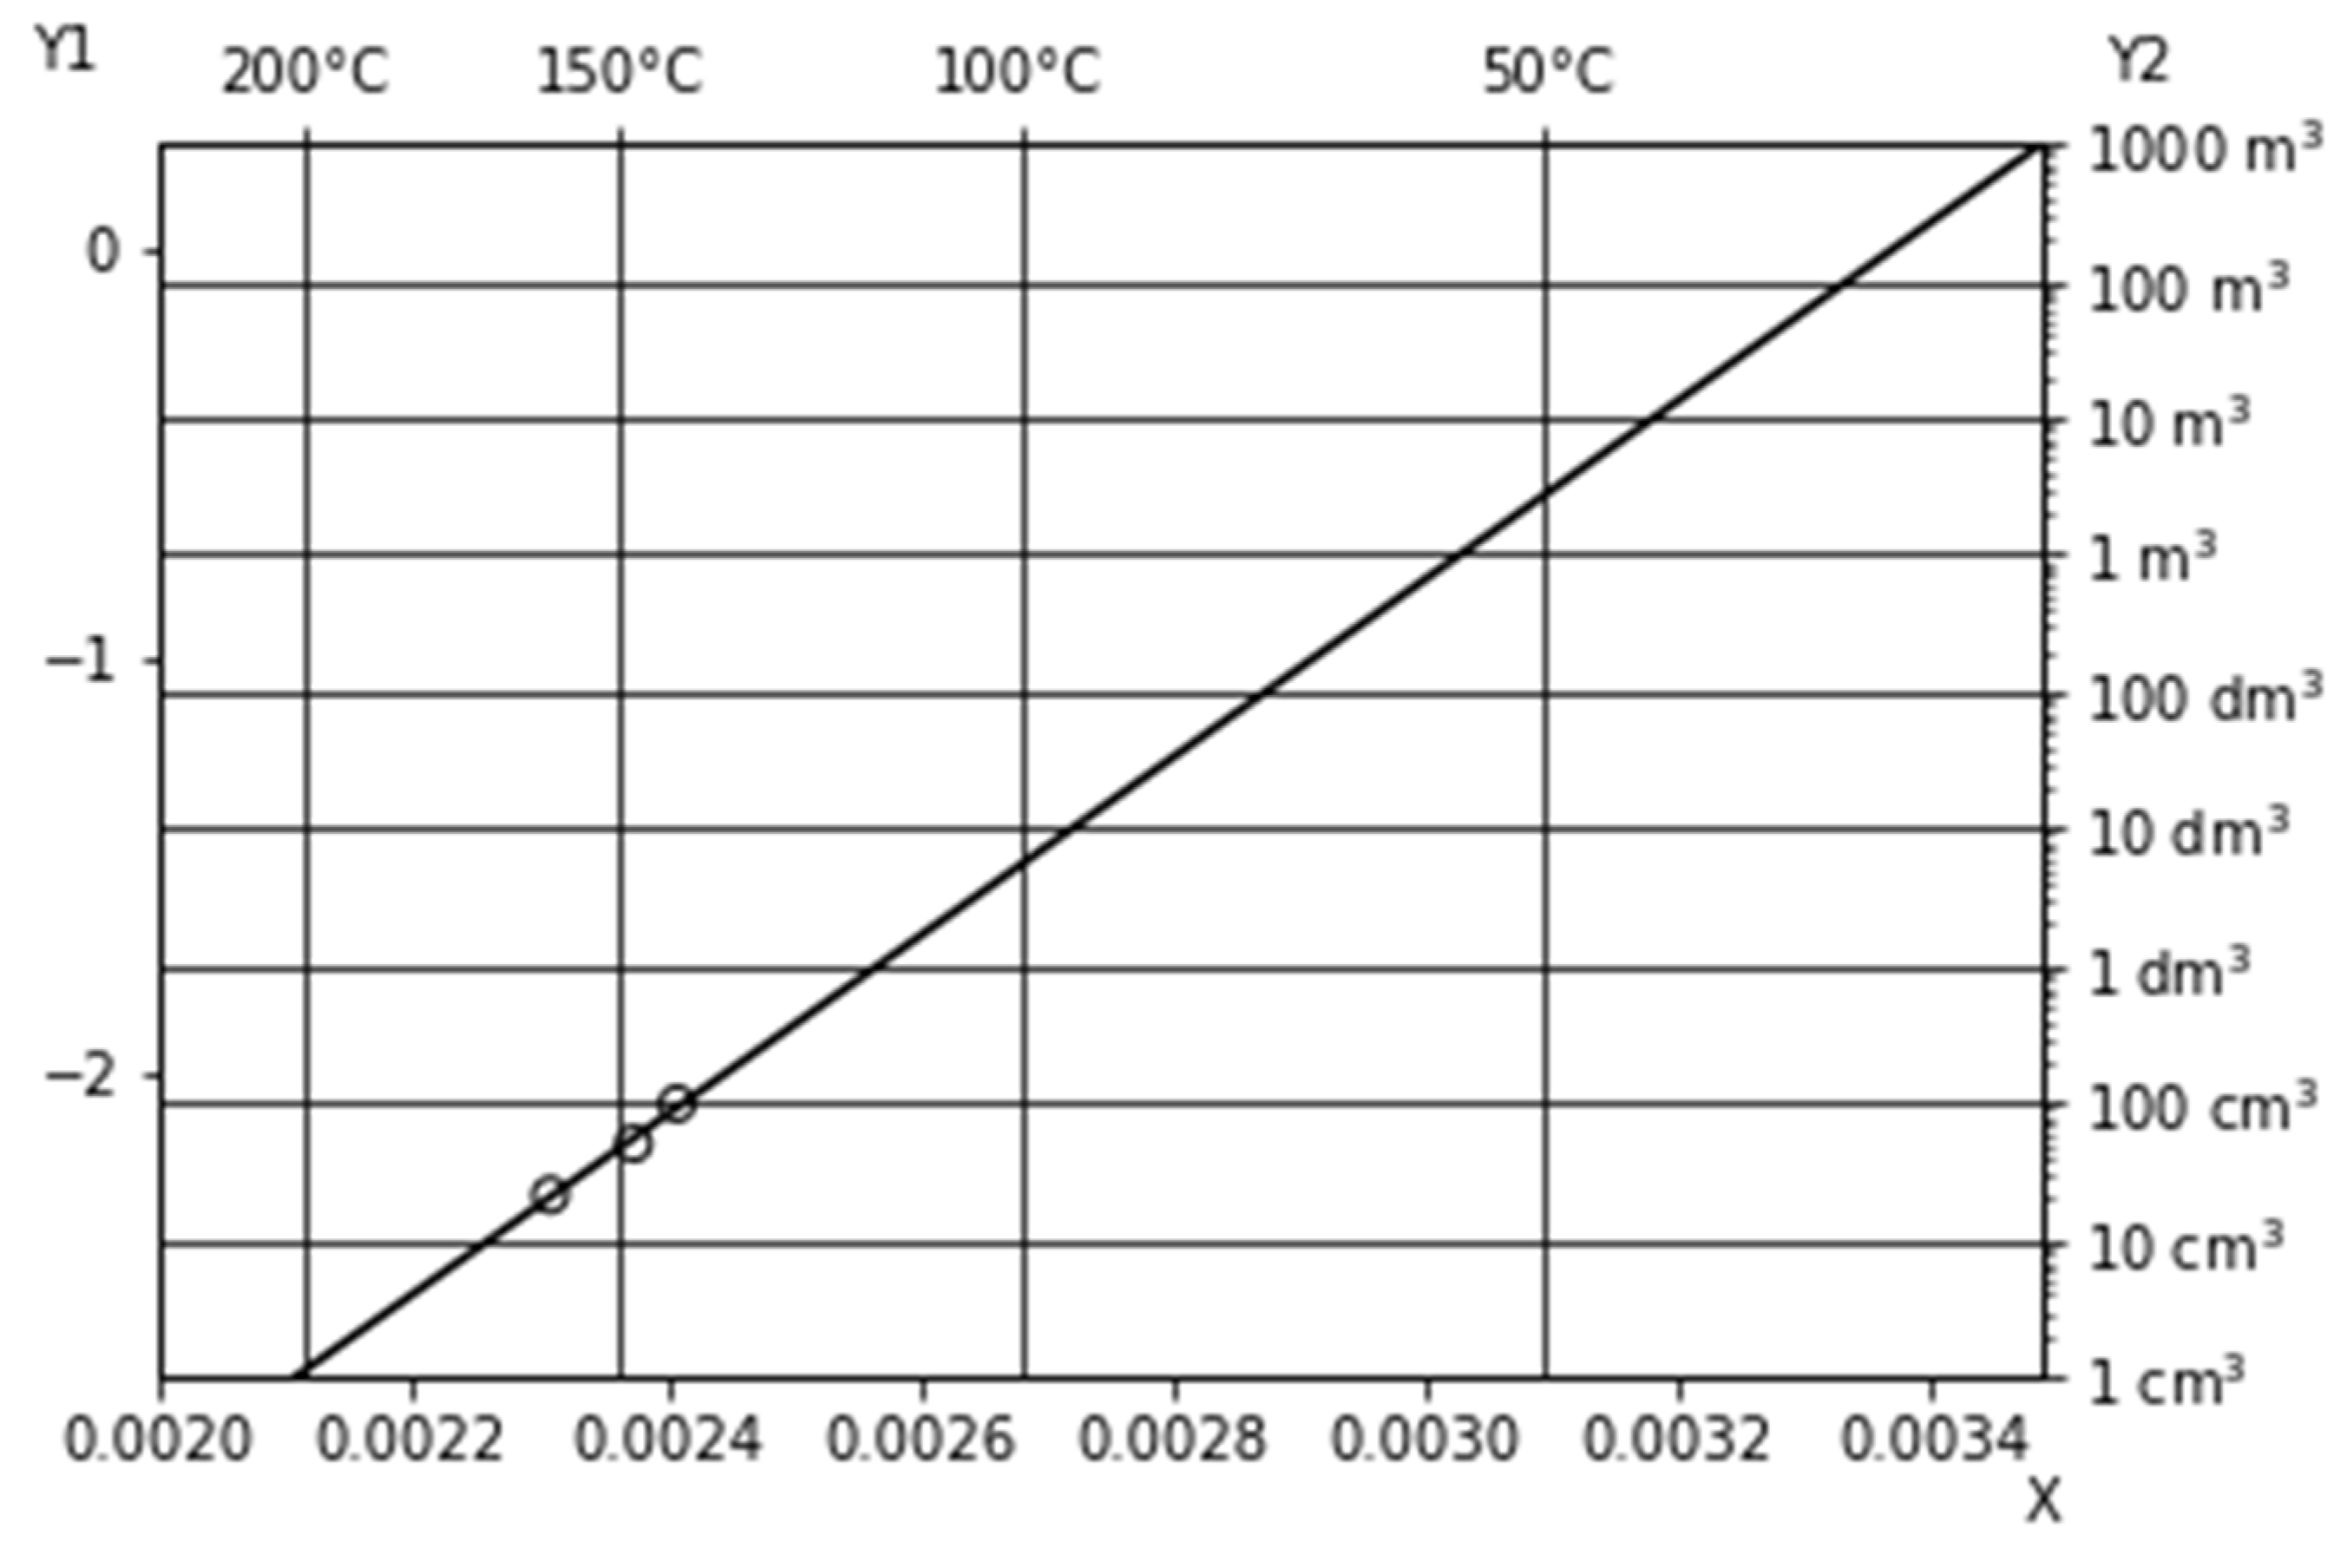
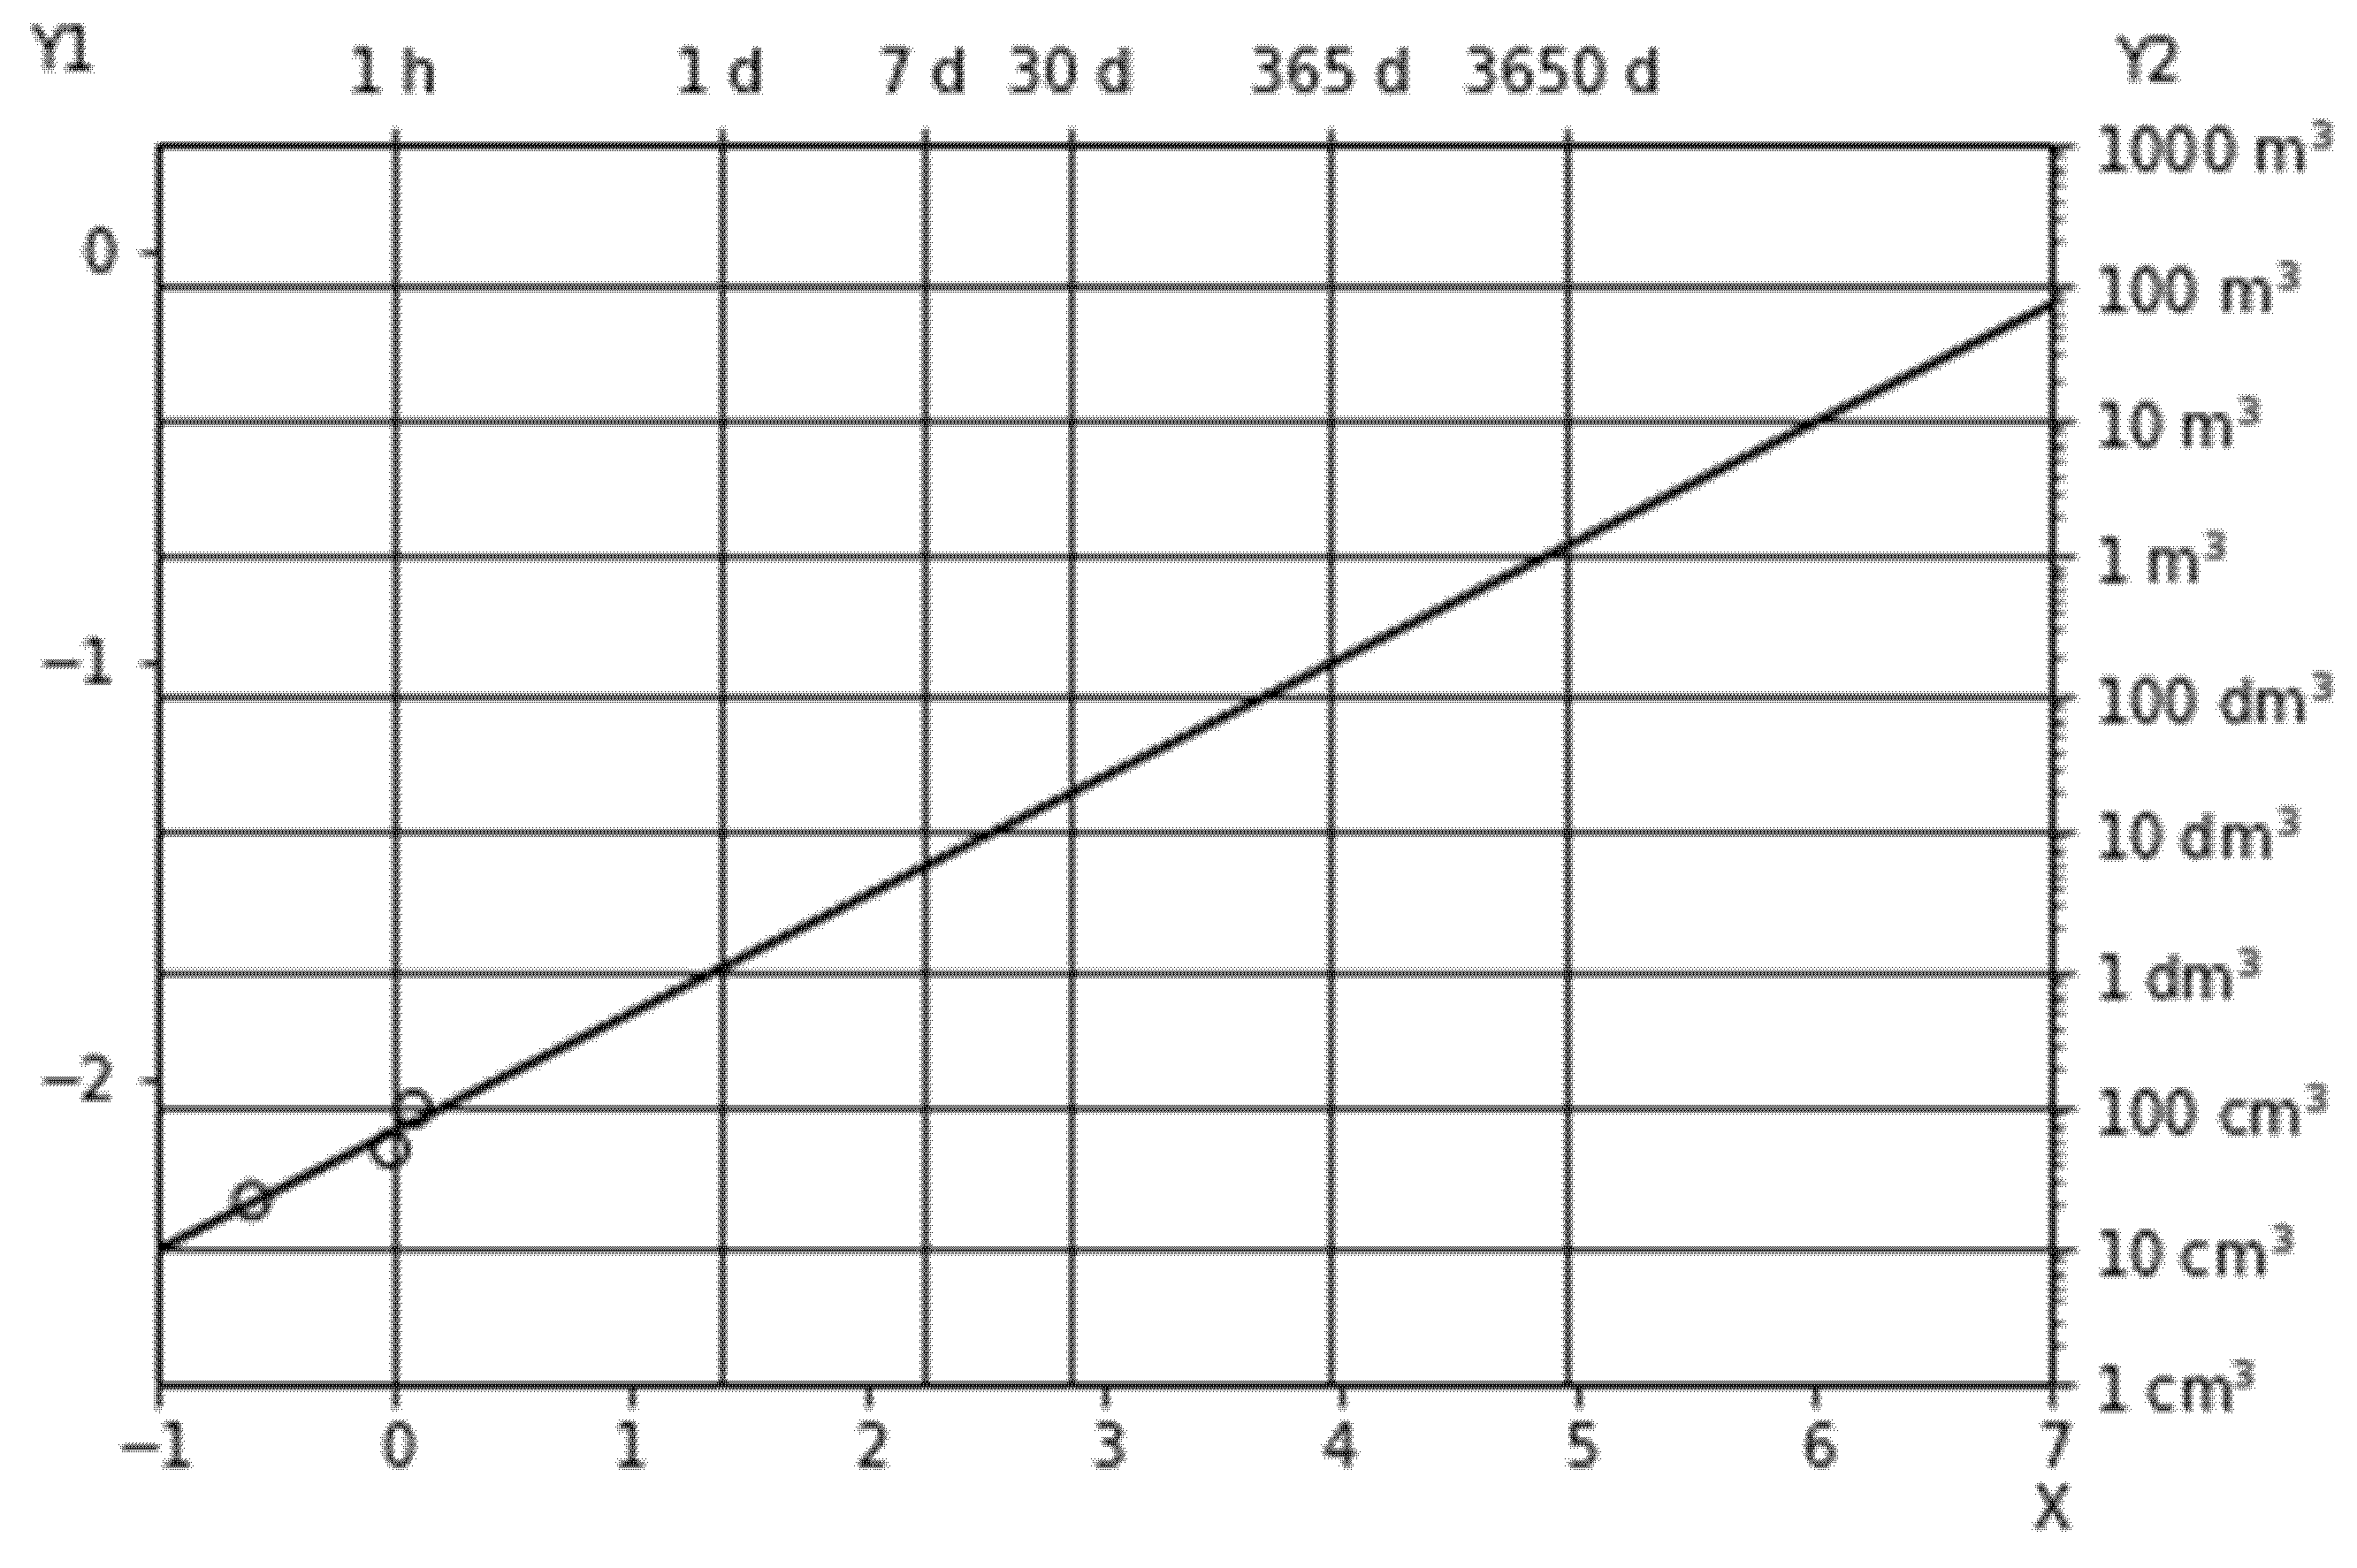
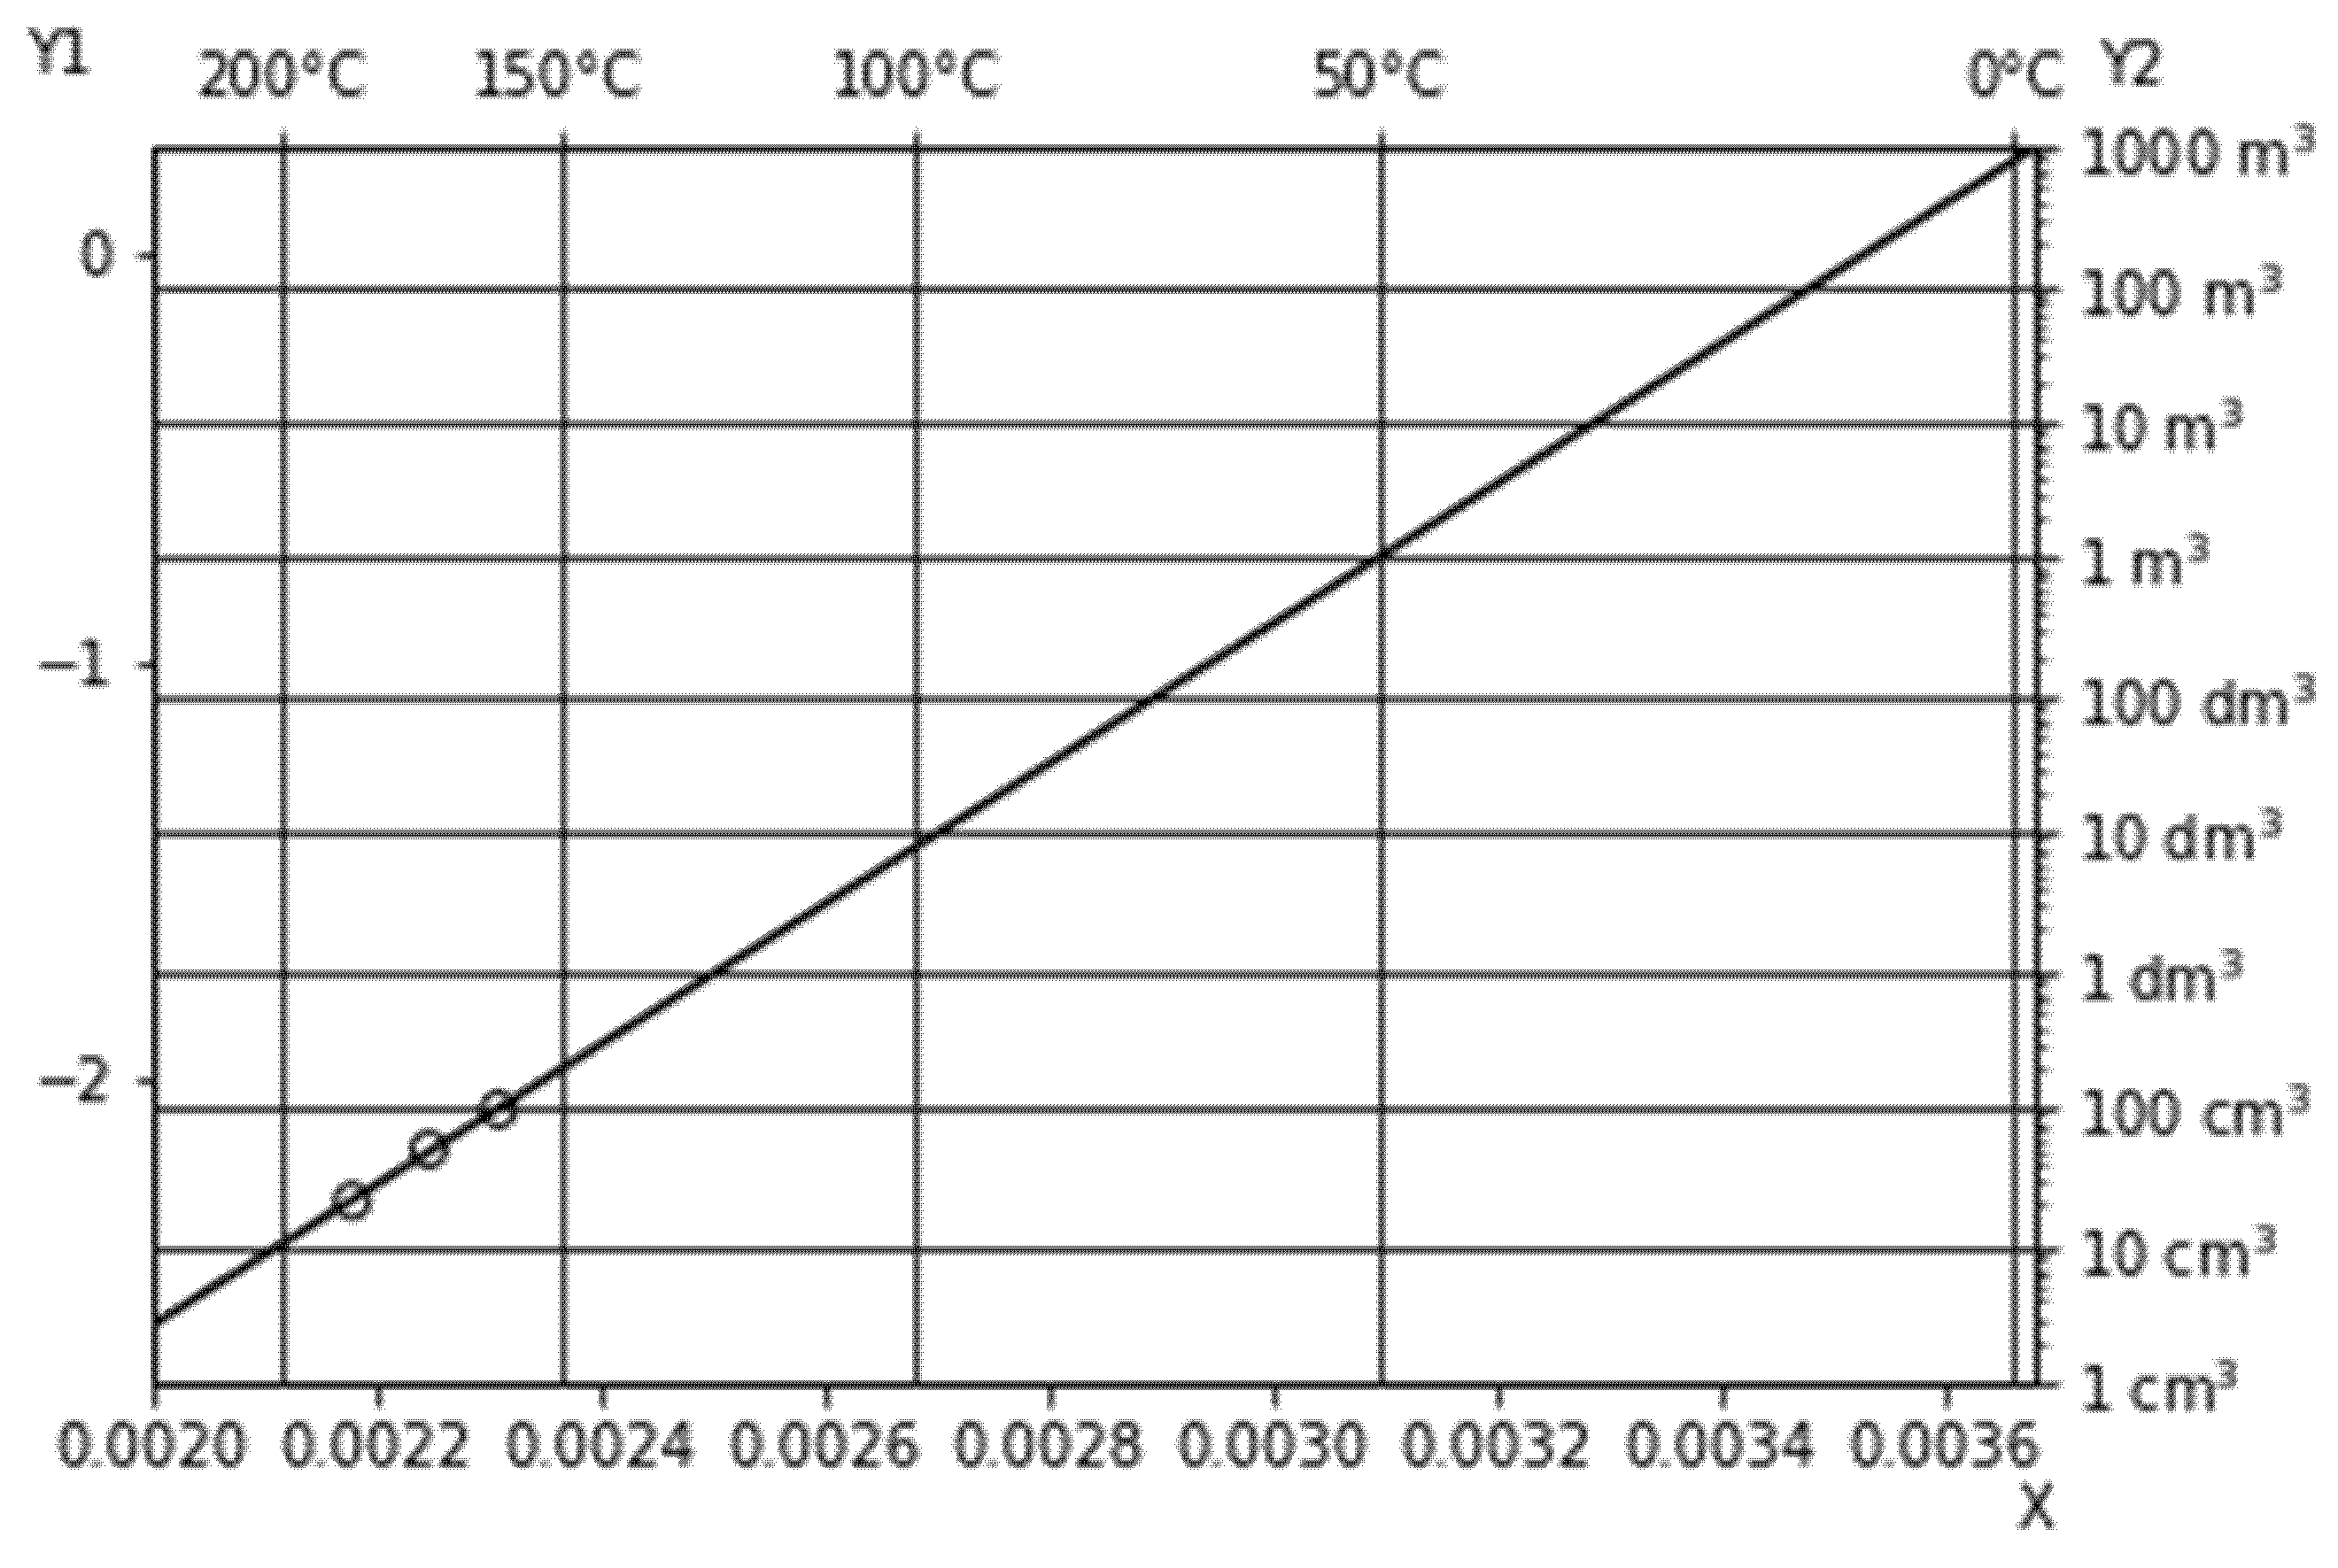
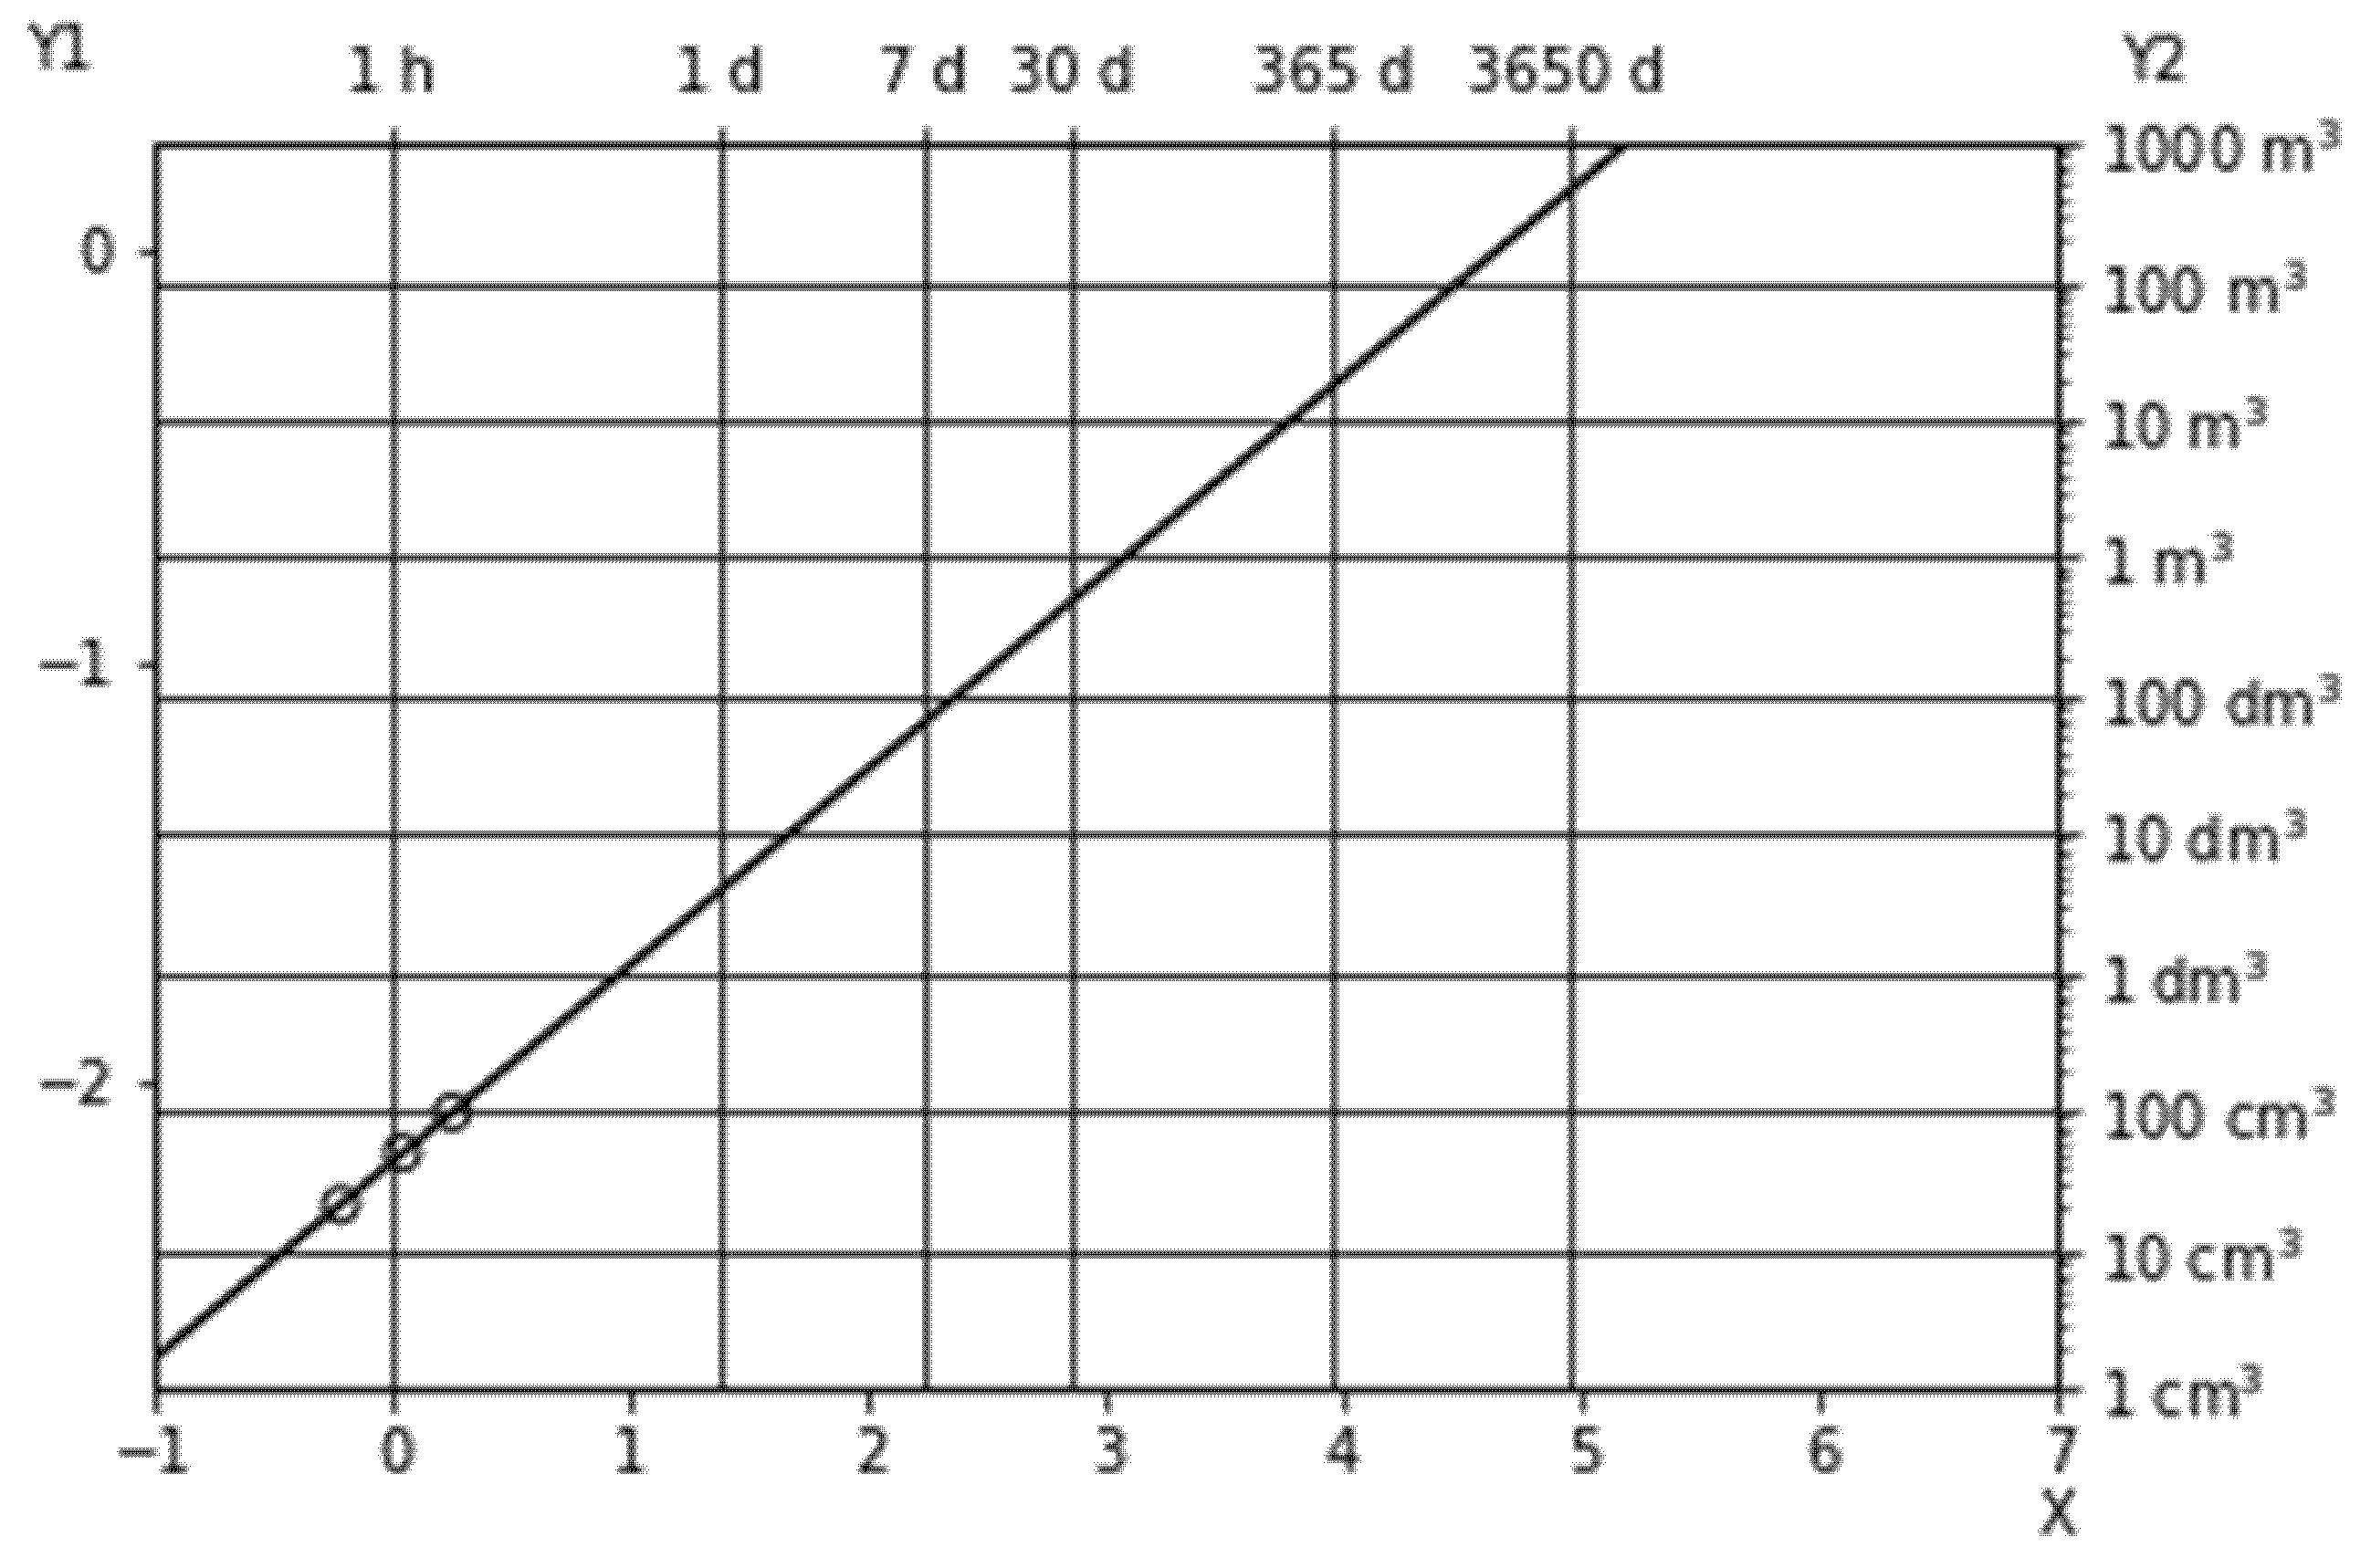
3.5. The Spontaneous Ignition Behavior Analysis

The results of hot storage experiments for the sludge dust and sludge pellets are presented in Table 8. The induction time ti, defined as the time between reaching the storage temperature and the start of ignition of a sample, was higher for the sludge pellets compared to sludge dust. The most significant value differences were observed for the sample baskets of the volume of 21.21 cm3, 50.27 cm3, and 98.17 cm3. The self-ignition temperatures were also higher for the sludge pellets. The greatest increase in TSI was observed for the sample basket of a volume of 21.21 cm3, from 160 °C for the sludge dust to 186 °C for the sludge pellets.
The temperature of sludge dust in different sample baskets and the furnace temperature are presented in Figure 4, Figure 5, Figure 6, Figure 7, Figure 8 and Figure 9. The T1 curve stands for the furnace temperature and the T2 curve for the sample temperature.
The temperature of sludge pellets in different sample baskets and the furnace temperature are presented in Figure 7, Figure 8 and Figure 9.
A pseudo-Arrhenius graph of the sludge-dust spontaneous-combustion temperatures is shown in Figure 10. A line through the TSI values separates areas representing stable (below the line) and unstable (above the line) dust volume behavior. Self-ignition of the sludge dust occurs in the area above the line.
The dependence of the induction time of the combustion (ti) on the volume/surface ratio of the sludge dust is shown in Figure 11. It yields the determination of the time needed for a sample to undergo spontaneous combustion when stored at temperatures slightly higher than TSI by an extrapolation method. A line through the ti values separates areas representing stable (above the line) and unstable (below the line) dust behavior.
Big-bag-type containers (1 m3), tank chambers (10 m3), containers (45 m3), and silo vehicles (60 m3) are used for the storage and transport of sludge dust. The critical conditions are summarized in Table 9.
A pseudo-Arrhenius graph of the sludge pellets’ spontaneous combustion temperatures is shown in Figure 12.
The dependence of the induction time of the combustion (ti) on the volume/surface ratio of the sludge pellets is shown in Figure 13.
The maximum volume of silo for the storage of sludge pellets is 100 m3; thus, the critical values of the temperature and time are 13.8 °C and 1280 days, respectively.
The pseudo-Arrhenius plots of the self-ignition temperature for the sludge dust and sludge pellets show that the sludge in the form of pellets has more favorable storage conditions.
It is also associated with the particle size and the specific surface area. The sludge dust, as a finer material, is distinguished by the reduced mass and heat transfer through the bed, which results in the development of higher local temperatures. The higher the specific surface area of sludge dust, the greater surface exposed to the air, thus increasing the reaction rate. The intraparticle oxygen permeability may be reduced via pelletization, which may lower the hazard of self-heating [47].

4. Conclusions

The higher induction times and higher self-ignition temperatures of sludge pellets compared to sludge dust confirms that sludge after pelletization is safer for storage for long periods. The highest self-ignition temperatures were obtained for the smallest basket volume. For the sludge pellets, the value of 186 °C was achieved, whereas for the sludge dust, it was 26 °C lower. The obtained TSI values decrease with the reduction in material volume and are the lowest for the highest basket volume (160 °C and 142 °C for the sludge pellets and sludge dust, respectively).
The moisture content of both dust and pellets is low. However, slightly higher results were obtained for the sludge pellets (9.974 ± 0.414%) compared to the sludge dust (6.067 ± 0.193%). The low moisture content and the small difference in these values indicate its negligible impact in consideration of both materials. Sludge pellets have a higher bulk density (0.621 ± 0.005 g/cm3) compared to sludge dust (0.427 ± 0.008 g/cm3). Apart from the positive influence on increasing the critical temperature, the higher bulk density of materials affects their storage and handling. The elemental analysis showed that the sludge dust has a higher hydrogen content (5.235 ± 0.053%) compared to sludge dust (4.575 ± 0.008%), which may result in a faster appearance of the initial exothermic reactions. The most frequent particle sizes of sludge dust are in the range of 100–150 µm, which are significantly lower than pellet size. Lower particle sizes have been shown to reduce self-ignition temperatures.
The obtained information on safe storage volumes, corresponding temperatures, and times revealed that, despite the sludge pellets being easier in terms storage and handling issues and having a more favorable particle size and bulk density, sludge dust is more favorable for the management of studied sewage sludge in terms of fire risk.
Further work on the impact of the pellet size, as well as ash content, would be of interest. Future research into the hazards of silo fires and explosions is needed to better understand the process of self-heating of dried sewage sludge. Silo fire prevention and management should also be a following area of research.

Author Contributions

Conceptualization, A.D. and B.K.; methodology, A.D. and B.K.; validation, M.S. and J.S.B.; formal analysis, M.S.; writing—original draft preparation, A.D.; writing—review and editing, B.K., M.S. and J.S.B.; supervision, B.K. and M.S.; funding acquisition, B.K. All authors have read and agreed to the published version of the manuscript.

Funding

This research was supported by the Polish Ministry of Education and Science.

Data Availability Statement

Not applicable.

Conflicts of Interest

The authors declare no conflict of interest. The funders had no role in the design of the study; in the collection, analyses, or interpretation of data; in the writing of the manuscript; or in the decision to publish the results.

References

  1. Dowbysz, A.; Samsonowicz, M.; Kukfisz, B. Recent Advances in Bio-Based Additive Flame Retardants for Thermosetting Resins. Int. J. Environ. Res. Public Health 2022, 19, 4828. [Google Scholar] [CrossRef] [PubMed]
  2. Serrano-Ruiz, J.C. Biomass: A Renewable Source of Fuels, Chemicals and Carbon Materials. Molecules 2020, 25, 5217. [Google Scholar] [CrossRef] [PubMed]
  3. Hu, M.; Ye, Z.; Zhang, H.; Chen, B.; Pan, Z.; Wang, J. Thermochemical conversion of sewage sludge for energy and resource recovery: Technical challenges and prospects. Environ. Pollut. Bioavailab. 2021, 33, 145–163. [Google Scholar] [CrossRef]
  4. Rorat, A.; Courtois, P.; Vandenbulcke, F.; Lemiere, S. Sanitary and environmental aspects of sewage sludge management. In Industrial and Municipal Sludge; Elsevier: Amsterdam, The Netherlands, 2019; pp. 155–180. [Google Scholar]
  5. Di Giacomo, G.; Romano, P. Evolution and Prospects in Managing Sewage Sludge Resulting from Municipal Wastewater Purification. Energies 2022, 15, 5633. [Google Scholar] [CrossRef]
  6. Medic Pejic, L.; Fernandez Anez, N.; García Torrent, J.; Ramírez-Gómez, Á. Determination of spontaneous combustion of thermally dried sewage sludge. J. Loss Prev. Process Ind. 2015, 36, 352–357. [Google Scholar] [CrossRef]
  7. Đurđević, D.; Žiković, S.; Blecich, P. Sustainable Sewage Sludge Management Technologies Selection Based on Techno-Economic-Environmental Criteria: Case Study of Croatia. Energies 2022, 15, 3941. [Google Scholar] [CrossRef]
  8. Jiang, L. Co-pelletization of sewage sludge and biomass: The density and hardness of pellet. Bioresour. Technol. 2014, 166, 435–443. [Google Scholar] [CrossRef]
  9. Agoro, M.A.; Adeniji, A.O.; Adefisoye, M.A.; Okoh, O.O. Heavy Metals in Wastewater and Sewage Sludge from Selected Municipal Treatment Plants in Eastern Cape Province, South Africa. Water 2020, 12, 2746. [Google Scholar] [CrossRef]
  10. Geng, H.; Ying, X.; Zheng, L.; Gong, H.; Dai, L.; Dai, X. An overview of removing heavy metals from sewage sludge: Achievements and perspectives. Environ. Pollut. 2020, 266, 115375. [Google Scholar] [CrossRef]
  11. Jia, L. Study on the Hg(0) removal characteristics and synergistic mechanism of iron-based modified biochar doped with multiple metals. Bioresour. Technol. 2021, 332, 125086. [Google Scholar] [CrossRef]
  12. Houillon, G.; Jolliet, O. Life cycle assessment of processes for the treatment of wastewater urban sludge: Energy and global warming analysis. J. Clean. Prod. 2005, 13, 287–299. [Google Scholar] [CrossRef]
  13. Häggström, G.; Hannl, T.K.; Hedayati, A.; Kuba, M.; Skoglund, N.; Öhman, M. Single Pellet Combustion of Sewage Sludge and Agricultural Residues with a Focus on Phosphorus. Energy Fuels 2021, 35, 10009–10022. [Google Scholar] [CrossRef]
  14. Kylili, A.; Christoforou, E.; Fokaides, P.A. Environmental evaluation of biomass pelleting using life cycle assessment. Biomass Bioenergy 2016, 84, 107–117. [Google Scholar] [CrossRef]
  15. Sheng, C.; Yao, C. Review on Self-Heating of Biomass Materials: Understanding and Description. Energy Fuels 2022, 36, 731–761. [Google Scholar] [CrossRef]
  16. Díaz, E.; Pintado, L.; Faba, L.; Ordóńez, S.; González-LaFuente, J.M. Effect of sewage sludge composition on the susceptibility to spontaneous combustion. J. Hazard. Mater. 2019, 361, 267–272. [Google Scholar] [CrossRef]
  17. Kukfisz, B. Analysis of minimum ignition temperature of pellet dust layer and cloud due to adding BC and ABC fire extinguishing powders. MATEC Web Conf. 2018, 247, 00003. [Google Scholar] [CrossRef]
  18. EN 14034-1; Determination of Explosion Characteristics of Dust Clouds. Part 1: Determination of the Maximum Explosion Pressure pmax of Dust Clouds. CEN: Brussels, Belgium, 2004.
  19. EN 14034-2; Determination of Explosion Characteristics of Dust Clouds. Part 2: Determination of the Maximum Rate of Explosion Pressure Rise (dp/dt)Max of Dust Clouds. CEN: Brussels, Belgium, 2006.
  20. ISO/IEC 80079-20-2; Explosive Atmospheres. Part 20-2: Material Characteristics—Combustible Dusts Test Methods. ISO: Geneva, Switzerland, 2016.
  21. EN 14034-3; Determination of Explosion Characteristics of Dust Clouds. Determination of the Lower Explosion Limit LEL of Dust Clouds. CEN: Brussels, Belgium, 2006.
  22. EN 14034-4; Determination of Explosion Characteristics of Dust Clouds. Part 4: Determination of the Limiting Oxygen Concentration LOC of Dust Clouds. CEN: Brussels, Belgium, 2004.
  23. Kukfisz, B.; Półka, M.; Woliński, M. Experimental Investigations of Nitrogen Content Influence on Spontaneous Ignition Behaviour of Dust Accumulations. Adv. Mater. Res. 2013, 718, 74–79. [Google Scholar] [CrossRef]
  24. Kukfisz, B.; Półka, M.; Salamonowicz, Z.; Woliński, T. Study on inertization of dust-air mixtures. Chem. Ind. 2014, 93, 103–106. [Google Scholar]
  25. Cloney, C. Combustible Dust Incident Report; Dust Safety Science: Bristol, UK, 2021; pp. 1–47. [Google Scholar]
  26. Cloney, C. Combustible Dust Incident Report; Dust Safety Science: Bristol, UK, 2022; pp. 1–52. [Google Scholar]
  27. Hrušovský, I.; Martinka, J.; Rantuch, P.; Balog, K. Investigation of spontaneous combustion tendency of vegetable oils by the means of differential thermal analysis. Trans. VSB-TUP. Saf. Eng. Ser. 2015, 10, 8–12. [Google Scholar] [CrossRef] [Green Version]
  28. Bertani, R.; Biasin, A.; Canu, P.; Della Zassa, M.; Refosco, D.; Simionato, F.; Zerlottin, M. Self-heating of dried industrial tannery wastewater sludge induced by pyrophoric iron sulfides formation. J. Hazard. Mater. 2016, 305, 105–114. [Google Scholar] [CrossRef]
  29. Mannan, S. Fire. In Lees’ Process Safety Essentials; Mannan, S., Ed.; Butterworth-Heinemann: Oxford, UK, 2014; pp. 201–256. [Google Scholar]
  30. Siuta, D.; Kukfisz, B.; Kuczyńska, A.; Mitkowski, P.T. Methodology for the Determination of a Process Safety Culture Index and Safety Culture Maturity Level in Industries. Int. J. Environ. Res. Public Health 2022, 19, 2668. [Google Scholar] [CrossRef] [PubMed]
  31. Skrizovska, M.; Veznikova, H.; Roupcova, P. Inclination to self-ignition and analysis of gaseous products of wood chips heating. Acta Chim. Slov. 2020, 13, 88–97. [Google Scholar] [CrossRef]
  32. Hughes, I.; Hase, T. Measurements and Their Uncertainties; Oxford University Press: Oxford, UK, 2010. [Google Scholar]
  33. Wu, D.; Schmidt, M.; Berghmans, J. Spontaneous ignition behaviour of coal dust accumulations: A comparison of extrapolation methods from lab-scale to industrial-scale. Proc. Combust. Inst. 2018, 37, 4181–4191. [Google Scholar] [CrossRef]
  34. Lohrer, C.; Schmidt, M.; Krause, U. A study on the influence of liquid water and water vapour on the self-ignition of lignite coal-experiments and numerical simulations. J. Loss Prev. Proc. Ind. 2005, 18, 167–177. [Google Scholar] [CrossRef]
  35. García-Torrent, J.; Ramírez-Gómez, Á.; Querol-Aragón, E.; Grima-Olmedo, C.; Medic-Pejic, L. Determination of the risk of self-ignition of coals and biomass materials. J. Hazard Mater. 2012, 213, 230–235. [Google Scholar] [CrossRef] [PubMed]
  36. Frost, K.; Lüth, P.; Schmidt, M.; Simon, K.; Uhlig, S. Evaluation of the Interlaboratory Test 2015–2016 on the Method DIN EN 15188:2007 Determination of the Spontaneous Ignition Behaviour of Dust Accumulations; Bundesanstalt für Materialforschung und-prüfung (BAM): Berlin, Germany, 2016; p. 107. [Google Scholar]
  37. Van Rossum, G.; Drake, F.L. Python 3 Reference Manual; CreateSpace: Scotts Valley, CA, USA, 2009. [Google Scholar]
  38. Harris, C.R.; Millman, K.J.; van der Walt, S.J.; Gommers, R.; Virtanen, P.; Cournapeau, D.; Wieser, E.; Taylor, J.; Berg, S.; Smith, N.J. Array programming with NumPy. Nature 2020, 585, 357–362. [Google Scholar] [CrossRef]
  39. EN 15188; Determination of the Spontaneous Ignition Behaviour of Dust Accumulations. CEN: Brussels, Belgium, 2020.
  40. Ronda, A.; Della Zassa, M.; Gianfelice, G.; Iáñez-Rodríguez, I.; Canu, P. Smouldering of different dry sewage sludges and residual reactivity of their intermediates. Fuel 2019, 247, 148–159. [Google Scholar] [CrossRef]
  41. Krause, U.; Schmidt, M. The influence of initial conditions on the propagation of smouldering fires in dust accumulations. J. Loss Prev. Process Ind. 2001, 14, 527–532. [Google Scholar] [CrossRef]
  42. Tumuluru, J.S. Effect of pellet die diameter on density and durability of pellets made from high moisture woody and herbaceous biomass. Carbon Resour. Convers. 2018, 1, 44–54. [Google Scholar] [CrossRef]
  43. Schwarzer, L.; Jensen, P.A.; Wedel, S.; Glarborg, P.; Karlström, O.; Holm, J.K.; Dam-Johansen, K. Self-heating and thermal runaway of biomass—Lab-scale experiments and modeling for conditions resembling power plant mills. Fuel 2021, 294, 120281. [Google Scholar] [CrossRef]
  44. Report on the Elemental Analyses of Samples from the Targeted National Sewage Sludge Survey; U.S. Environmental Protection Agency: Washington, DC, USA, 2021; pp. 1–21.
  45. Fernandez-Anez, N.; Garcia-Torrent, J.; Medic-Pejic, L. Flammability properties of thermally dried sewage sludge. Fuel 2014, 134, 636–643. [Google Scholar] [CrossRef]
  46. Restuccia, F.; Fernandez-Anez, N.; Rein, G. Experimental measurement of particle size effects on the self-heating ignition of biomass piles: Homogeneous samples of dust and pellets. Fuel 2019, 256, 115838. [Google Scholar] [CrossRef]
  47. Della Zassa, M.; Ronda, A.; Gianfelice, G.; Zerlottin, M.; Canu, P. Scale effects and mechanisms ruling the onset of wastewater sludges self-heating. Fuel 2019, 256, 115876. [Google Scholar] [CrossRef]
Figure 1. The frequency distribution and cumulative frequency of particle size distribution of sludge dust (measurement 1).
Energies 16 00046 g001
Figure 2. The frequency distribution and cumulative frequency of particle size distribution of sludge dust (measurement 2).
Energies 16 00046 g002
Figure 3. The frequency distribution and cumulative frequency of particle size distribution of sludge dust (measurement 3).
Energies 16 00046 g003
Figure 4. The temperature of sludge dust in a 21.21 cm3 basket: (a) at a furnace temperature of 160 °C with no evidence of dust ignition, (b) at a furnace temperature of 162 °C with a dust ignition.
Energies 16 00046 g004
Figure 5. The temperature of sludge dust in a 50.27 cm3 basket: (a) at a furnace temperature of 148 °C with no evidence of dust ignition, (b) at a furnace temperature of 150 °C with a dust ignition.
Energies 16 00046 g005
Figure 6. The temperature of sludge dust in a 98.17 cm3 basket: (a) at a furnace temperature of 142 °C with no evidence of dust ignition, (b) at a furnace temperature of 144 °C with a dust ignition.
Energies 16 00046 g006
Figure 7. The temperature of sludge pellets in a 21.21 cm3 basket: (a) at a furnace temperature of 186 °C with no evidence of dust ignition, (b) at a furnace temperature of 188 °C with a dust ignition.
Energies 16 00046 g007
Figure 8. The temperature of sludge pellets in a 50.27 cm3 basket: (a) at a furnace temperature of 170 °C with no evidence of dust ignition, (b) at a furnace temperature of 172 °C with a dust ignition.
Energies 16 00046 g008
Figure 9. The temperature of sludge pellets in a 98.17 cm3 basket: (a) at a furnace temperature of 160 °C with no evidence of dust ignition, (b) at a furnace temperature of 162 °C with a dust ignition.
Energies 16 00046 g009
Figure 10. Pseudo-Arrhenius graph of the self-ignition temperature of the sludge dust.
Energies 16 00046 g010
Figure 11. Dependence of the induction time of the combustion (ti) on the volume/surface ratio of the sludge dust.
Energies 16 00046 g011
Figure 12. Pseudo-Arrhenius graph of the self-ignition temperature of the sludge pellets.
Energies 16 00046 g012
Figure 13. Dependence of the induction time of the combustion (ti) on the volume/surface ratio of the sludge pellets.
Energies 16 00046 g013
Table 1. The moisture content analysis results.
MaterialDrying Time [s]Sample MassMoisture Content [%]Average Moisture Content [%]
Before Drying [g]After Drying [g]
Sludge dust5202.0031.8786.2416.067 ± 0.193
4052.0001.8786.100
4551.9971.8805.859
Sludge pellets9602.0011.8019.9959.974 ± 0.414
11162.0001.8099.550
12662.0041.79610.378
Table 2. The bulk density analysis results.
MaterialVolume [cm3]Sample Mass [g]Bulk Density [g/cm3]Average Bulk Density [g/cm3]
Sludge dust4619.880.4320.427 ± 0.008
4619.360.421
Sludge pellets5030.910.6180.621 ± 0.005
5031.180.623
5031.320.626
5030.810.616
Table 3. The elemental analysis results.
MaterialC [%]H [%]N [%]S [%]
Sludge dust26.844.5815.201.581
26.694.5695.141.576
Average26.77 ± 0.114.575 ± 0.0085.17 ± 0.041.579 ± 0.004
Sludge pellets30.665.2724.791.580
30.975.1974.851.559
Average30.82 ± 0.225.235 ± 0.0534.82 ± 0.0421.570 ± 0.015
Table 4. Results of the first particle size distribution analysis in terms of cumulative frequency.
Particle Size [µm]Sample 1 [%]Sample 2 [%]Sample 3 [%]Average [%]CV * [%]
<5014.93615.23215.23515.1340.926
<7023.10923.50323.51623.3760.807
<10035.01035.52835.57735.3720.725
<15051.79152.34852.48852.2090.577
<20065.44365.88766.20265.8440.473
<27581.20481.45781.99081.5500.401
<37093.21793.32893.78293.4420.262
<52099.42199.43999.52699.4620.046
<71099.99899.99999.99999.9990
<10001001001001000
<15001001001001000
<20001001001001000
* CV—coefficient of variation.
Table 5. Results of the second particle size distribution analysis in terms of cumulative frequency.
Particle Size [µm]Sample 1 [%]Sample 2 [%]Sample 3 [%]Average [%]CV * [%]
<5017.51117.29117.68617.4960.924
<7026.99326.57127.04326.8690.788
<10040.03139.22639.85539.7040.870
<15057.28956.03456.95656.7600.935
<20070.46169.22570.05769.9140.736
<27584.71283.92084.16784.2670.393
<37094.85294.54794.37994.5930.207
<52099.62899.59699.53199.5850.040
<71099.99999.99999.99999.9990.000
<10001001001001000
<15001001001001000
<20001001001001000
* CV—coefficient of variation.
Table 6. Results of the third particle size distribution analysis in terms of cumulative frequency.
Particle Size [µm]Sample 1 [%]Sample 2 [%]Sample 3 [%]Average [%]CV * [%]
<5013.29413.41013.63713.4471.060
<7019.92019.98020.34820.0830.943
<10029.88329.85630.38930.0430.817
<15044.74044.73045.40944.9590.707
<20057.54857.56258.42157.8440.706
<27573.57973.46274.58573.8750.682
<37087.91887.64688.72188.0950.518
<52098.01697.85198.29798.0550.188
<71099.96199.95199.97699.9630.010
<10001001001001000
<15001001001001000
<20001001001001000
* CV—coefficient of variation.
Table 7. The average particle size distribution analysis in terms of cumulative frequency.
Particle Size [µm]Analysis 1
[%]
Analysis 2
[%]
Analysis 3
[%]
Average [%]CV * [%]
<5015.13417.49613.44715.3590.132
<7023.37626.86920.08323.4430.145
<10035.37239.70430.04335.0390.138
<15052.20956.76044.95951.3090.116
<20065.84469.91457.84464.5340.095
<27581.55084.26773.87579.8970.067
<37093.44294.59388.09592.0430.038
<52099.46299.58598.05599.0340.009
<71099.99999.99999.96399.9870
<10001001001001000
<15001001001001000
<20001001001001000
* CV—coefficient of variation.
Table 8. The spontaneous ignition behavior analysis results.
MaterialSample BasketCorresponding SilosInduction Time ti [h:min:s]Self-Ignition Temperature TSI [°C]
Volume [cm3]Diameter [cm]Height [cm]
Sludge dust21.213300:15:00160
50.274400:57:51148
98.175501:12:04142
Sludge pellets21.213300:36:21186
50.274401:06:00172
98.175501:47:12160
Table 9. The critical values of time and temperature for storage and transport of the sludge dust.
MaterialVolume [m3]Temperature [°C]Time [days]
Big-bag188.363.6
Tank chamber1075.7346
Container4568.91043
Silo vehicle6066.51289
Disclaimer/Publisher’s Note: The statements, opinions and data contained in all publications are solely those of the individual author(s) and contributor(s) and not of MDPI and/or the editor(s). MDPI and/or the editor(s) disclaim responsibility for any injury to people or property resulting from any ideas, methods, instructions or products referred to in the content.

