Abstract
When evaluating the energy efficiency of buildings and implementing the necessary measures to increase energy efficiency levels, thermal technical characteristics are determined. For this purpose, in situ measurements of the thermal resistance of external enclosing structures were carried out. One of the methods most often used by researchers is the non-destructive method—the heat flow meter (HFM) method regulated by ISO 9869. In the case of surveying a building with a high level of thermal resistance, researchers are faced with low-density heat flux measurements, which is always a difficult task due to significant fluctuations and the influence of external factors on the measurement results. This is due to the fact that it is difficult to determine what is a useful signal and what is a consequence of the effects of non-stationarity and heat transfer conditions. The article provides an example of low-density heat flux measurements when determining the thermal resistance of a building and proposes a data pre-processing procedure that allows for the reduction of heat flux fluctuations, which has a significant impact on the final result at low density. The proposed use of wavelet analysis in the pre-processing of low-density heat flux measurement data makes it possible to reconstruct them or reduce disturbances that occur during research. A comparison of the obtained results with the results of the calculation according to ISO 9869-1 showed a decrease in the standard deviation of the measurements from 5.74 to 2.81%. The results of this study can be used to reduce the noise of low-density heat flux and, as a result, reduce the standard deviation of the measurement when applying the HFM method of determining the thermal resistance of external enclosing structures.
1. Introduction
Today, more than ever before, the problem of saving energy resources has become acute. According to the data of the European Parliamentary Research Service, the largest consumers of energy in Europe are households, the final energy consumption of which is 28% of total energy consumption by all sectors [1]. For this reason, the efforts of scholars are directed toward the realization of resource-saving activities by using modern energy efficiency technologies [2,3,4] in households and buildings.
In order to determine the degree of energy efficiency of buildings, in situ measurements of the thermal resistance of buildings are usually performed. In most cases, these measurements are dealt with by analysing low-density heat flux.
It should be noted that measuring low-density heat flux is difficult for researchers due to the high deviation (up to 20%) of the heat flux during the experiment. Such difficulties are caused by various factors, one of the main ones being high-intensity heat exchange. In addition, such measurements require the use of heat flow meters with high sensitivity and special calibration for such a measurement range. As is well known, the metrological aspects of the measurements are very important and should be taken into account when determining and improving the parameters of the objects under investigation [5].
In practice, low-density heat fluxes frequently appear due to the small temperature differences or high thermal insulation of construction [6].
In this case, it is possible to use a calculation method for the thermal resistance of the building’s structural elements if the types of structural materials and their thickness are known exactly [7]. This being so, calculations were carried out according to [8]. The principle of the calculation method is to obtain the thermal resistance of each thermally homogeneous part of the building element. Another approach consists of conducting in situ measurements of the thermal performance of the building. This method allows for obtaining reliable information about the current thermal state of the building and its structure, as well as determining the possibility of its further safe operation, taking into account the requirements for compliance with current energy conservation standards. When studying a new building, the in situ method allows for establishing the conformity of the achieved energy efficiency of an already constructed building with that planned in the project documentation [9,10]. In addition, non-destructive control is extremely relevant for the study of historic buildings [11,12].
Numerous researchers have explored the in situ thermal performance evaluation methods of building walls by complying with steady-state techniques [13,14,15,16]. The crucial part of a steady-state method involves the acquisition of data on heat flux and temperature, which covers two aspects: signal measurements and data processing.
Data measurements, particularly surface heat flux density, are usually performed using heat flow meters (the so-called HFM method) according to standard ISO 9869 [6,17,18,19,20]. Numerous studies conducted to date have addressed factors that may affect the accuracy of HFM measurements. Thus, in works [17,18,19], it is shown that the influence of the geometric dimensions and location of the heat flow meters lead to measurement errors at levels from 26% to 30%. C. Hoffmann and A. Geissler [20] have established that the factors related to the weather conditions before and during a test can lead to an error of up to 42%. According to ISO 9869, an in situ measurement period of more than 10 days is required. K. Gaspar et al. [21] found that ISO criteria are required for a longer test duration to provide more accurate results. However, the duration of the test could be reduced by applying quality data and providing the stability of weather conditions.
In data processing, the methods used strongly affect the results and may cause a measurement error of up to 20% in a dataset [22,23]. This is especially important when measuring low-density heat flux.
This paper provides an example of a low-density heat flux measurement when determining the thermal resistance of a building and proposes a data pre-processing procedure using wavelet analysis in order to reduce fluctuations in the heat flux.
Wavelet analysis is a method widely used in solving the problems of signal decomposition, reconstruction, and denoising [24,25,26]. For example, in [24], the authors present a new approach to the problem of measurement signal denoising. They propose an optimal signal decomposition scale, according to which each measurement can be processed individually on an optimal decomposition scale.
The issue of heat flux has been discussed in many scientific papers. Reference [26] presents the application of the multi-resolution expression using the orthogonal Daubechies 3 wavelet to reconstruct the heat flux. The flux was measured using temperature sensors placed on a multidimensional solid. However, in [27], the Morlet wavelet was used to analyse the heat flux signals of instability waves in the hypersonic boundary layer. It was shown that the use of the wavelet transform contributes to the recognition of second modes. Wavelet decomposition using Meyer’s wavelet in [28] was used to solve the problem of determining the surface heat flux on the basis of temperature measurements. Another example is in reference [29], where the temperature measurement data were analysed with the Daubechies 11 wavelet in order to reduce the interference before determining the heat flux of the hot wall. Then, the data were used to determine the inverse estimation of the heat flux using non-linear artificial neural networks.
Luca Pagliarini and other authors in [30] presented the application of the Morlet wavelet analysis to assess the dominant frequency of the heat flux of a multiturn pulsating heat pipe between the wall and the fluid. The main frequencies were defined on the basis of amplitude scalograms determined from the wavelet transform. In the next example, the wavelet transform was used to analyse the frequency of heat exchange in a micropulsating heat pipe. Based on the Morlet wavelet analysis, an amplitude scalogram was determined on the basis of which the main vibration frequencies of this phenomenon were identified [31].
In the literature one can find many solutions using wavelet transforms in solving numerical problems. For example, using wavelet analysis, numerical studies were performed on nanofluid compression between two parallel plates. The authors of [25] proved that the use of the Harr wavelet contributed to obtaining calculation results that are more accurate than the numerical results available in the literature. Reference [32] presents the prediction of the heat load of residential buildings using a hybrid model, which includes the following methods: discrete wavelet transform and tree-based collaborative training. The heat load was distributed using the Daubechies 4 wavelet transform. On the other hand, numerical studies presented in reference [33] were carried out in order to solve non-linear differential equations occurring in the heat transfer process, taking into account the variable-specific heat coefficient. It has been proven that the Hermite wavelet method is comparable to other methods and is suitable for solving heat transfer problems. Another example of numerical research on the subject of heat transfer is in reference [34], where, by using the Haar wavelet quasi-linearisation method, a solution to the problem of non-linear heat transfer for fins was proposed. Reference [35] presents a numerical solution to the problem of one-dimensional heat transfer in a wall. The Haar wavelet collocation method was used to solve the reverse exchange problem. In addition, the wavelet transform was used to reduce the noise of real heat transfer data, which were then compared with numerical calculations. Reference [36] also discusses the problem of heat transfer and other parameters in the convective flux of nanofluid occurring in the convective boundary layer. The authors proved that the use of the Haar wavelet for calculations of the mathematical model of the task gives satisfactory results.
Various types of wavelets are used in the analysis of heat flux and heat transfer issues. The use of wavelet analysis in the processing of measurement data allows their reconstruction or reduction of disturbances occurring in them. In addition, wavelets are also used in numerical calculations in the field of heat transfer. Thus, the wavelet analysis was chosen as a tool for data processing in low-density heat flux measurements, which were conducted during an in situ non-destructive study of the thermal resistance of buildings.
The aim of this work is to improve the process of the data analysis of signals obtained during in situ measurements of low-density heat fluxes in order to reduce the deviation of measurement results.
The main novelty of this work lies in reducing the deviation of measurement signals and at the same time keeping the accuracy of measurement. The results presented in this paper demonstrate the possibility of a wavelet application for denoising the low-density heat flux and show how this approach can be used in practice.
2. Materials and Methods
2.1. Methodology of Evaluating Thermal Resistance
Standard ISO 9869-1 [6] suggests evaluating the thermal resistance of walls (often called Rc-value) by the heat-flow meter (HFM) method.
This method recommends finding appropriate locations of sensors using thermography (in accordance with ISO 6781:1983) to avoid thermal bridges, cracks, or similar sources of errors. Sensors were mounted to ensure a result that is representative of the whole element. Several HFMs were installed to obtain an average of the result. The sensors were installed to insure good thermal contact with the surface. For this task, thermal greases were used.
The electrical data from the HFM and temperature sensors were recorded at fixed intervals.
The current values of the measured heat flux density are calculated as the product of current readings of measured signals of heat flux sensors and the calibration coefficient of heat flux of sensors using the following expression:
where E is the signal parameter (voltage) generated by the heat flux sensor, mV; K is the calibration coefficient of the heat flux of the sensor, W/(mV·m2); index is the sensor’s number.
In most cases, the averaged value of heat flux was used during the calculations. In the present work, we propose adding the wavelet analysis to reduce the deviation of the signals of heat flux sensors, taking into account the positive experiences that the authors of [37] obtained when processing the results of measuring the thermal conductivity of thermal insulation materials.
After that, the average method for data analysis is applied. The mean values of the heat fluxes ( crossing the walls and the internal and external surface temperatures (Tsi and Tse) are measured. The thermal resistance value can be calculated by the following expression:
where RHFM is the value obtained by using the measured data of heat flux and temperature.
In order to compare the calculated and measured values the sampling method according to ISO 9869-1 Annex C (examination of the structure of the element) was used [6].
The samples of materials were taken from the building under study and investigated in the system based on the heat flow meter apparatus according to ISO 8301 [38]. The obtained values of heat conductivity and thickness of layers were used for the calculation of the thermal resistance theoretical value ().
A flow chart of the methodology used is shown in Figure 1.
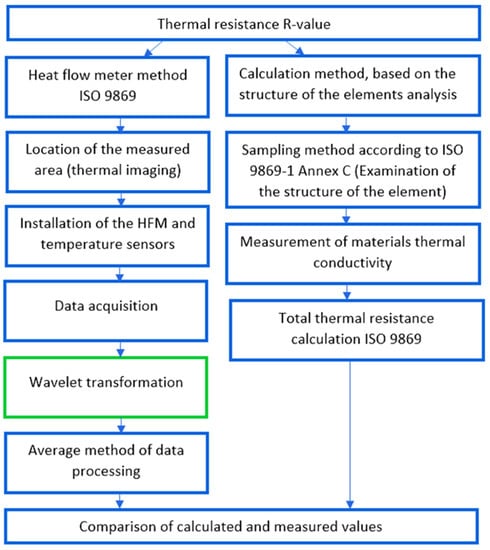
Figure 1.
Methodology for evaluating the thermal resistance.
Generally, the level of correlation between the measured and calculated R-values varies widely, and the degree of discrepancy depends very much upon the type of construction examined [14]. According to the ISO 9869-1 standard, the uncertainty of in situ measurements obtained by the HFM method ranges from 14% to 28% [6]. To evaluate the accuracy of the HFM method measurement procedure, the deviation of the results obtained with the HFM method from theoretical values is calculated as a relative value using the following expression:
where Rc is the theoretical value calculated according to ISO 9869 [6].
Usually, the signals of sensors at measurements of low-density heat fluxes are disturbed by external impact factors, such as heat exchange. Thus, taking into account the positive experience that the authors of [37] obtained when processing the results of measuring the thermal conductivity of thermal insulation materials using wavelet analysis, in this work, it was also decided to apply the wavelet transformation to denoise the signals.
2.2. Methods of Data Processing
The method of the wavelet transform in the analysis of real measurements allows for considering the signal in the time-frequency domain. Discrete inverse wavelet transform of signal f(t) is defined by the following dependency [39]:
where are the wavelet coefficients, is the wavelet, is the signal, m is the scale factor, and n is the shift factor.
The discrete wavelet transform is the scalar product of the signal f and the function sequence . The wavelet coefficients represent the common features of the signal f and the wavelet . The m parameter allows the specification at the scale level or the frequency range, according to which the frequency spectrum can be analysed. On the other hand, parameter n allows us to specify the moment when the signal can be examined.
For the wavelet analysis of problems related to the heat flux, wavelets such as Haar [25], Daubechies [26], Morlet [27], or Meyer [28] are used. The Daubechies wavelet (db) is an almost symmetrical, orthogonal, and compactly supported wavelet [40]. The Haar wavelet belongs to the Daubechies family and is equal to the db1 wavelet. The Meyer wavelet is characterised by compact support in the frequency domain and is a rapidly decreasing function [39,41].
The problem of removing disturbances in measurement signals using wavelet transforms is widely discussed in the literature [24,29]. In this work, the signals of heat flux sensors were subjected to a denoising process. This process is carried out in three stages. The first of them consists of selecting the type of wavelet and then performing the signal decomposition. The wavelet selection process includes determining the order and level of decomposition. A properly selected wavelet correlates with the original signal (s) [39,42]. The signal decomposition (s) consists in decomposing a signal into low-frequency components (approximations) and high-frequency components (details). This process is iterative on many levels of decomposition, e.g., signal (s) is decomposed into approximation a1 and detail d1, then approximation a1 is decomposed into approximation a2 and detail d2. Such signal decomposition (s) lasts at all decomposition levels that are determined at the wavelet selection stage. The next step in the process of removing the noise from the signal (s) is to perform soft or hard thresholding. The use of soft thresholding avoids the occurrence of discontinuities. The third step is to reconstruct the signal on the basis of the x-level approximations and the detail coefficients on the levels from 0 to x [39,42].
3. Results and Discussion
The experiment (data set recording) was carried out for 8 h by the in situ testing on a 5-storey building, the external view of which is shown in Figure 2. It should be noted that the climatic conditions were stable for three days prior to the tests and remained unchanged during the experiment.
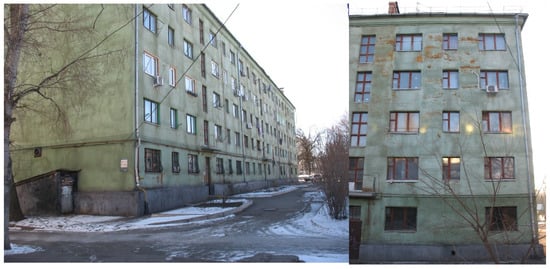
Figure 2.
External view of the 5-storey building under investigation.
The heat flux was measured by the bimetal heat flux sensors (Ni-Const). L-type thermocouples were used for temperature measurements. Calibration of heat flux sensors was performed by the radiation method [43]. The L-type thermocouples with individual calibration were used as sensors for external temperature measurements.
The information measuring system with the following characteristics was used for the registration of the temperature and heat flux sensor signals [44]:
- An 8-channel ADC; 16 bits; a conversion rate of 10 Hz;
- Dynamic range setting and calibration;
- Support for industrial interface RS-485 and addressing, which makes it possible to create a measuring network.
The time of a single measuring cycle was set to 30 s.
In addition to experimental measurements by the in situ method, the tests of elements of enclosure construction of the building were carried out using the sampling method according to ISO 9869-1 Annex C (examination of the structure of the element). In this aim, the sample of polyurethane foam (PUF), which was taken from the building under investigation, was studied in the system based on the heat flow meter apparatus according to ISO 8301 [38]. The results are given in Table 1.

Table 1.
Characteristics of the materials of the building’s enclosure construction.
Before the installation of the heat flux sensors, the qualitative analysis of the building was carried out by the thermal imaging method according to standards ISO 6781 [45] and EN 13187 [46]. Thermal images of the external side of the building where the sensors were placed are given in Figure 3, and the corresponding thermal images of the internal side of the building are presented in Figure 4.

Figure 3.
Thermal images of the external side of the building.
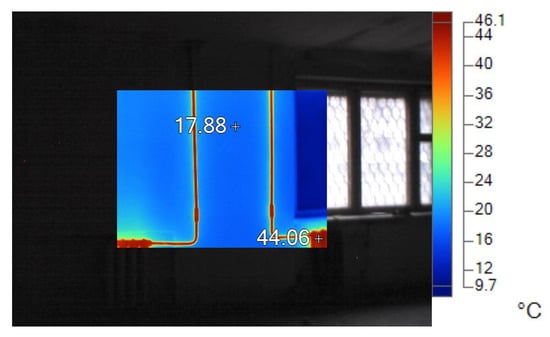
Figure 4.
Thermal images of the external side of the building before installing heat flux sensors.
The heat flux sensors were placed on the wall using the contact thermal grease in order to reduce the influence of the thermal contact resistance (Figure 5). Sensors q9, q11, and q12 were placed in one vertical line from the bottom to the top. Sensor q10 was intentionally placed at some distance for the analysis of the heat source’s influence on the measurement results. The scheme of placing the heat flux sensors is shown in Figure 5. The corresponding external temperature sensors were placed on the outer side of the wall.
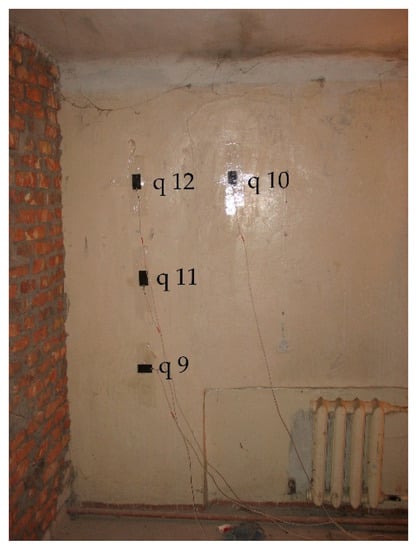
Figure 5.
Photo of the scheme of placing the heat flux sensors on the outer side of the building wall under investigation.
With the temperature control of the wall surface performed by the thermal IR Camera Fluke TI 50 with absolute error ±2 K, the temperature values from 17 to 17.9 °C were registered. After installation of the heat flux sensors the built-in L-type thermocouple with absolute error ±1 K was used. The measured temperature values varied from 17.4 to 17.9 °C.
All four different signals of heat flux sensors q9-q12 were analysed by the classical averaged method according to ISO 9869-1 and the wavelet denoising method. The first stage of the measurement data evaluation was the analysis of selected statistical parameters and the creation of histograms for visualizing the data distribution of the q9–q12 signals. The chosen statistical parameters were evaluated for each signal. The results are presented in Table 2.

Table 2.
Chosen statistical values for the q9–q12 heat flux signals.
The histograms (Figure 6) show the frequency distribution of changes in the signals of heat flux sensors q9–q12. The graphs were obtained for 12 bins. Regardless of the type of signal, the histograms are characterised by right-skewed distribution. An asymmetric distribution may indicate that some interference occurred in the signals and should be further analysed.
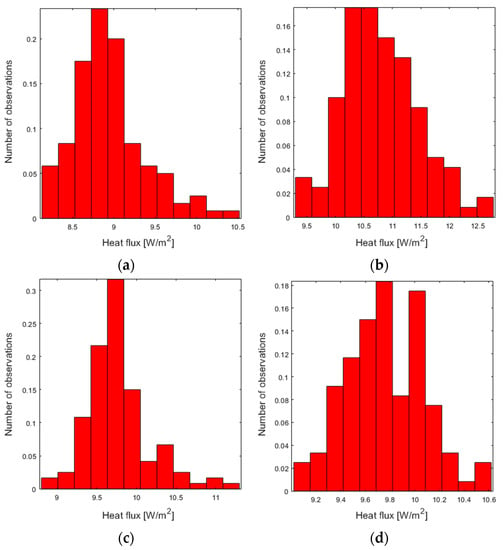
Figure 6.
Heat flux histograms for sensor signals: (a) q9, (b) q10, (c) q11, (d) q12.
In the next stage of research, in order to obtain detailed information about the q9–q12 signals, the denoising process of the signals was used. The Daubechies wavelet was adopted for the multi-resolution analysis and then its order was determined by analysing individual wavelets from db1 to db5. The order of the wavelet should be selected in such a way as to ensure the appropriate smoothness of the waveform while not blurring the analysis result [32,47].
Figure 6 shows the comparison of the signal (s) with the results of the db1–db5 wavelets for each of the q9–q12 signals. The cycles in Figure 7, Figure 8 and Figure 9 are equal to 30 s. Based on the waveforms, it was found that the applications of the base functions of the db1–db3 wavelets were not sufficient enough to smooth the signal. This is directly related to the shapes of the 1–3 Daubechies wavelets [47]. The db4 wavelet was adopted, which well reflected the trend of changes in the signals (s) for all heat fluxes. Then, the decomposition level of the db4 wavelet was chosen for the q9–q12 signals.
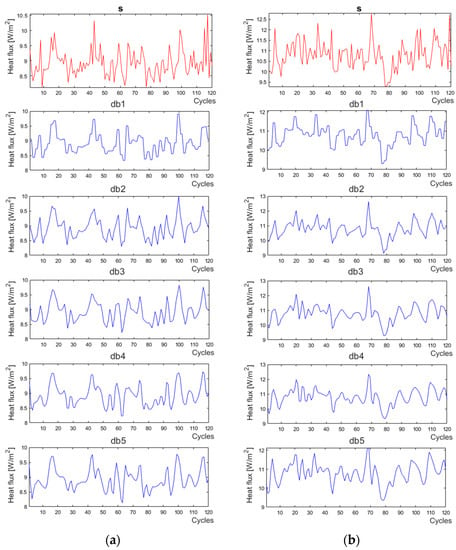
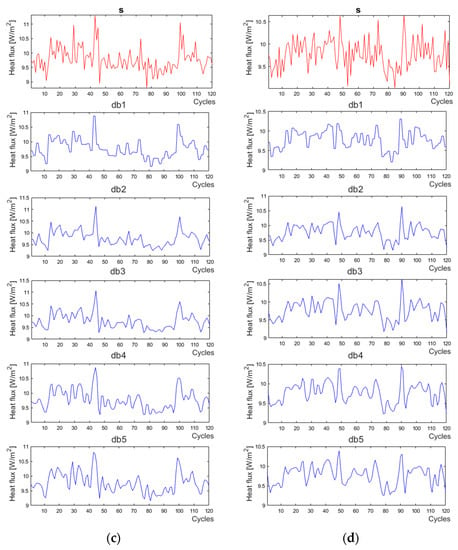
Figure 7.
Signal (s) (red lines) and Daubechies 1–5 wavelets (blue lines) for the heat flux sensors: (a) q9, (b) q10, (c) q11, (d) q12.
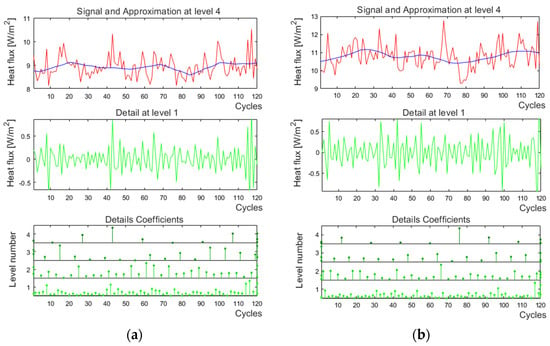
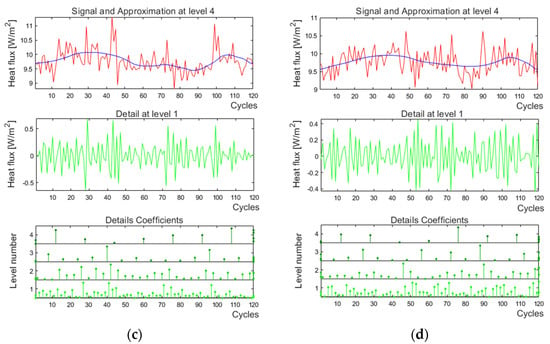
Figure 8.
Decomposition of heat flux sensor signals using Daubechies 4 wavelet at decomposition level 4 for (a) q9, (b) q10, (c) q11, (d) q12.
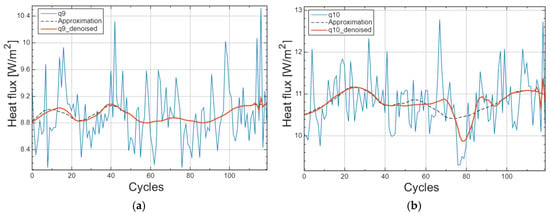
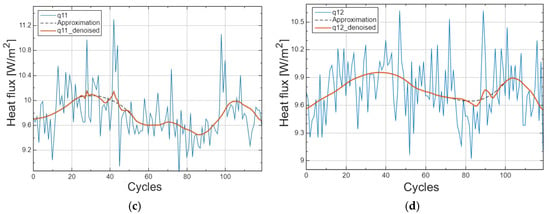
Figure 9.
Denoising of heat flux sensor signals using the Daubechies 4 wavelet at decomposition level 4 for (a) q9, (b) q10, (c) q11, and (d) q12.
An increase in the decomposition level causes a decrease in the content of details in the approximation of the signal (s) and the contribution of the high-frequency component. The decomposition level was chosen at such a value that details could be omitted [38]. The Daubechies 4 wavelet at decomposition level 4, which is optimal for all signals of heat flux sensors, was chosen. Four approximations a1–a4 and four details d1-d4 were obtained for each signal.
Thresholds were then set at all detail levels of the signal (s). The soft threshold method was used. At the end of the process of denoising the heat flux sensor signals, the signal was reconstructed taking into account the a4 approximation of the signal and the detail coefficients after thresholding.
In Figure 9, the following are marked as follows: red colour—denoised signal, blue—heat flux waveform, and dashed line—approximation a4. In addition, a statistical analysis of the denoised signals was carried out, the results of which are presented in Table 3. In Table 4, the average values of the heat flux and temperature for both approaches of processing measurement data are given.

Table 3.
Standard deviation values for signals of heat flux sensors.

Table 4.
Measurement results for both approaches of processing measurement data.
Based on the values given in Table 4, RHFM was calculated for each zone, where the heat flux sensors were placed, using Equation (2) for both approaches of processing measurement data (denoised and averaged methods). The results of these calculations (see Table 5) showed that when processing the data using the averaging method for the measured data, in three out of four cases, the RHFM value was higher than when the heat flux sensor signals were denoised.

Table 5.
Results of conductive thermal resistance calculations.
To verify the obtained results, theoretical values of thermal resistance were calculated based on the sampling method according to recommendations of ISO 9869-1 Annex C (examination of the structure of the element) [6] and their comparison was carried out.
The deviation of the results from the theoretical value obtained by using data processing denoised from averaged methods of measurement was calculated for all zones using expression (4). The results are given in Table 6.

Table 6.
The deviation of RHFM from the theoretical Rc-value.
Based on the comparison, deviation values ranging from 2.81% to 5.74% were obtained. At the same time, after applying the wavelet analysis when processing the signals of all four heat flux sensors, the standard deviations were reduced in relation to the deviations during the averaging by at least 2.2 times.
Thus, the denoised method has proven to be very effective and promising for the processing of low-density heat flux measurement data, because the deviation of the RHFM-values, calculated by using the denoised data, turned out to be lower than the ±5% limit, which corresponds to the recommendations of the standard ISO 9869-1 [6].
From a practical point of view, the proposed approach allows researchers to obtain satisfactory accuracy of the results of in situ measurements carried out at a small temperature difference, due to the reduction of heat flux fluctuations by pre-processing the measured dataset. In addition, this approach does not require changing the measuring equipment.
4. Conclusions
The measured values of low-density heat fluxes have significant fluctuations. Thus it is difficult to determine what is a useful signal and what is a consequence of the impact of non-stationarity and heat transfer conditions. This can be seen in the example of measuring the thermal resistance of a building. In practice, it is quite common to encounter cases where the temperature difference (between the inside and outside of the building) is small and, as a result, the heat fluxes have low densities. In addition, it takes place when the thermal resistance of the building is high, and heat losses are small.
One of the possible ways to improve the data processing of the low-density heat flux is to apply the additional module for denoising the signals.
This paper proposes wavelet analysis in data processing aimed at reducing the deviation of the signals of heat flux sensors. The signals of heat flux sensors were used as experimental data during the in situ measurements. The heat flux was measured by four sensors. The obtained values varied between 8 and 12 W/m2, while in each case their fluctuations reached 2 W/m2, which is about 16% to 25%. It was shown that the application of the Daubechies wavelets with decomposition level 4 well reflects the trend of changes in the signals for all heat flux sensors. As a result of data processing by the wavelet analysis, a reduction of the standard deviation of measurement results of at least 2.2 times was achieved.
The results of this study allow us to recommend the use of wavelet analysis in processing the data of low-density heat flux measurements. This paper is limited to processing data in certain conditions by using the proposed wavelet analysis method. Additional experiments in different conditions will allow studying the wavelet analysis applicability in processing heat flux measurement results.
Author Contributions
Conceptualisation, O.H., S.K. and O.D.; methodology, S.K. and V.B.; validation, Ż.G. and O.D.; formal analysis, O.H.; investigation, S.K. and O.D.; data curation, S.K. and O.D.; writing—original draft preparation, O.H., S.K., O.D. and Ż.G.; writing—review and editing, O.H., S.K., O.D. and J.S.; visualisation, Ż.G.; supervision, O.H., S.K. and O.D.; project administration, O.H. All authors have read and agreed to the published version of the manuscript.
Funding
This research was supported by the Lublin University of Technology, grant number: FD-20/EE-2/306.
Conflicts of Interest
The authors declare no conflict of interest.
Nomenclature
| E | signal parameter (voltage) generated by heat flux sensor (mV) |
| K | calibration coefficient of heat flux sensor (W/(mV·m2)) |
| qi | heat flux density (W/m2) |
| Tsi | internal surface temperature (°C) |
| Tse | external surface temperature (°C) |
| Rc | theoretical value of thermal resistance calculated according to ISO 9869 (m2 K W−1) |
| thermal resistance obtained by heat flow meter (HFM) method (m2 K W−1) | |
| f(t) | discrete inverse wavelet transform of signal |
| wavelet | |
| signal | |
| m | scale factor |
| n | shift factor |
References
- Final Energy Consumption by Sector. Report of the European Parliamentary Research Service. Available online: https://epthinktank.eu/2022/06/16/monitoring-the-energy-situation-in-the-eu-june-2022/final-energy-consumption-by-sector/ (accessed on 20 November 2022).
- Ch, K.R.; Porpandiselvi, S.; Vishwanathan, N. A three-leg resonant converter for two output LED lighting application with independent control. Int. J. Circ. Theory Appl. 2019, 47, 1173–1187. [Google Scholar] [CrossRef]
- Devara, V.B.; Vishnuram, N.; Maity, T.; Shunmugam, P. Capacitor-sharing two-output series-resonant inverter for induction cooking application. IET Power Electron. 2016, 9, 2240–2248. [Google Scholar] [CrossRef]
- Vishnuram, P.; Ramachandiran, G. A simple multi-frequency multiload independent power control using pulse density modulation scheme for cooking applications. Int. Trans. Electr. Energ. Syst. 2021, 31, e12771. [Google Scholar] [CrossRef]
- Mroczka, J. The cognitive process in metrology. Measurement 2013, 46, 2896–2907. [Google Scholar] [CrossRef]
- ISO 9869-1; Thermal Insulation—Building Elements—In-Situ Measurement of Thermal Resistance and Thermal Transmittance—Part 1: Heat Flow Meter Method. ISO: Geneva, Switzerland, 2014.
- Lucchi, E. Thermal transmittance of historical brick masonries: A comparison among standard data, analytical calculation procedures, and in situ heat flow meter measurements. Energy Build. 2017, 134, 171–184. [Google Scholar] [CrossRef]
- ISO 6946; Building Components and Building Elements—Thermal Resistance and Thermal Transmittance—Calculation Method. ISO: Geneva, Switzerland, 2007.
- De Wilde, P. The gap between predicted and measured energy performance of buildings: A framework for investigation. Autom. Constr. 2014, 41, 40–49. [Google Scholar] [CrossRef]
- Danielski, I. Large variations in specific final energy use in Swedish apartment buildings: Causes and solutions. Energy Build. 2012, 49, 276–285. [Google Scholar] [CrossRef]
- Raposo, P.C.; Andrade, M.; Correia, J.A.F.O.; Salavessa, M.E.; Reis, C.; Oliveira, C.; de Jesus, A. Non-destructive structural wood diagnosis of a medieval building. Procedia Struct. Integr. 2017, 5, 1147–1152. [Google Scholar] [CrossRef]
- Costamagna, E.; Santana Quintero, M.; Bianchini, N.; Mendes, N.; Lourenço, P.B.; Su, S.; Paik, Y.M.; Min, A. Advanced non-destructive techniques for the diagnosis of historic buildings: The Loka-Hteik-Pan temple in Bagan. J. Cult. Herit. 2020, 43, 108–117. [Google Scholar] [CrossRef]
- Soares, N.; Martins, C.; Goncalves, M.; Santos, P.; da Silva, L.S.; Costa, J.J. Laboratory and in-situ non-destructive methods to evaluate the thermal transmittance and behavior of walls, windows, and construction elements with innovative materials: A review. Energy Build. 2019, 182, 88–110. [Google Scholar] [CrossRef]
- Teni, M.; Krstić, H.; Kosiński, P. Review and comparison of current experimental approaches for in-situ measurements of building walls thermal transmittance. Energy Build. 2019, 203, 109417. [Google Scholar] [CrossRef]
- Bienvenido-Huertas, D.; Moyano, J.; Marín, D.; Fresco-Contreras, R. Review of in situ methods for assessing the thermal transmittance of walls. Renew. Sustain. Energy Rev. 2019, 102, 356–371. [Google Scholar] [CrossRef]
- Ahmad, A.; Maslehuddin, M.; Al-Hadhrami, L.M. In situ measurement of thermal transmittance and thermal resistance of hollow reinforced precast concrete walls. Energy Build. 2014, 84, 132–141. [Google Scholar] [CrossRef]
- Meng, X.; Yan, B.; Gao, Y.; Wang, J.; Zhang, W.; Long, E. Factors affecting the in situ measurement 383 accuracy of the wall heat transfer coefficient using the heat flow meter method. Energy Build. 2015, 86, 754–765. [Google Scholar] [CrossRef]
- Cucumo, M.; Ferraro, V.; Kaliakatsos, D.; Mele, M. On the distortion of thermal flux and of surface temperature induced by heat flux sensors positioned on the inner surface of buildings. Energy Build. 2018, 158, 677–683. [Google Scholar] [CrossRef]
- Evangelisti, L.; Guattari, C.; Asdrubali, F. Comparison between heat-flow meter and Air-Surface Temperature Ratio techniques for assembled panels thermal characterization. Energy Build. 2019, 203, 109441. [Google Scholar] [CrossRef]
- Hoffmann, C.; Geissler, A. The prebound-effect in detail: Real indoor temperatures in basements and measured versus calculated U-values. Energy Procedia 2017, 122, 32–37. [Google Scholar] [CrossRef]
- Gaspar, K.; Casals, M.; Gangolells, M. Review of criteria for determining HFM minimum test duration. Energy Build. 2018, 176, 360–370. [Google Scholar] [CrossRef]
- Gori, V.; Elwell, C.A. Estimation of thermophysical properties from in-situ measurements in all seasons: Quantifying and reducing errors using dynamic grey-box methods. Energy Build. 2018, 167, 290–300. [Google Scholar] [CrossRef]
- Evangelisti, L.; Guattari, C.; Asdrubali, F. Influence of heating systems on thermal transmittance evaluations: Simulations, experimental measurements and data postprocessing. Energy Build. 2018, 168, 180–190. [Google Scholar] [CrossRef]
- Tao, T.; Ji, C.; Han, C.; Wang, J.; Sun, W. Study on the noise contents of different measurements in industrial process and their impact on process monitoring. Comput. Aided Chem. Eng. 2022, 51, 1057–1062. [Google Scholar] [CrossRef]
- Mittal, R.C.; Pandit, S. Numerical simulation of unsteady squeezing nanofluid and heat flow between two parallel plates using wavelets. Int. J. Therm. Sci. 2017, 118, 410–422. [Google Scholar] [CrossRef]
- Massa, L. Multiresolution Reconstruction of the Hypersonic Heat Flux. Int. J. Heat Mass Transf. 2022, 190, 122772. [Google Scholar] [CrossRef]
- Kegerise, M.A.; Rufer, S.J. Unsteady heat-flux measurements of second-mode instability waves in a hypersonic flat-plate boundary layer. Exp. Fluids 2016, 57, 130. [Google Scholar] [CrossRef]
- Chuli, F.; Chunyu, Q. Wavelet and error estimation of surface heat flux. J. Comput. Appl. Math. 2003, 150, 143–155. [Google Scholar] [CrossRef]
- Wang, H.; Zhu, T.; Zhu, X.; Yang, K.; Ge, Q.; Wang, M.; Yang, Q. Inverse estimation of hot-wall heat flux using nonlinear artificial neural networks. Measurement 2021, 181, 109648. [Google Scholar] [CrossRef]
- Pagliarini, L.; Cattani, L.; Bozzoli, F.; Mameli, M.; Filippeschi, S.; Rainieri, S.; Marengo, M. Thermal characterization of a multi-turn pulsating heat pipe in microgravity conditions: Statistical approach to the local wall-to-fluid heat flux. Int. J. Heat Mass Transf. 2021, 169, 120930. [Google Scholar] [CrossRef]
- Iwata, N.; Bozzoli, F.; Pagliarini, L.; Cattani, L.; Vocale, P.; Malavasi, M.; Rainieri, S. Characterization of thermal behavior of a micro pulsating heat pipe by local heat transfer investigation. Int. J. Heat Mass Transf. 2022, 196, 123203. [Google Scholar] [CrossRef]
- Gong, M.; Wang, J.; Bai, Y.; Li, B.; Zhang, L. Heat load prediction of residential buildings based on discrete wavelet transform and tree-based ensemble learning. J. Build. Eng. 2020, 32, 101455. [Google Scholar] [CrossRef]
- Kumbinarasaiah, S.; Raghunatha, K.R. The applications of Hermite wavelet method to nonlinear differential equations arising in heat transfer. Int. J. 2021, 9, 100066. [Google Scholar] [CrossRef]
- Aznam, S.M.; Ghani, N.A.C.; Chowdhury, M.S.H. A numerical solution for nonlinear heat transfer of fin problems using the Haar wavelet quasilinearization method. Results Phys. 2019, 14, 102393. [Google Scholar] [CrossRef]
- Jahangiri, A.; Mohammadi, S.; Akbari, M. Modeling the one-dimensional inverse heat transfer problem using a Haar wavelet collocation approach. Phys. A Stat. Mech. Its Appl. 2019, 525, 13–26. [Google Scholar] [CrossRef]
- Awati Vishwanath, B.; Kumar, N.M.; Wakif, A. Haar wavelet scrutinization of heat and mass transfer features during the convective boundary layer flow of a nanofluid moving over a nonlinearly stretching sheet. Partial. Differ. Equ. Appl. Math. 2021, 4, 100192. [Google Scholar] [CrossRef]
- Hotra, O.; Kovtun, S.; Dekusha, O.; Grądz, Ż. Prospects for the Application of Wavelet Analysis to the Results of Thermal Conductivity Express Control of Thermal Insulation Materials. Energies 2021, 14, 5223. [Google Scholar] [CrossRef]
- ISO 8301; Thermal Insulation—Determination of Steady-State Thermal Resistance and Related Properties—Heat Flow Meter Apparatus. ISO: Geneva, Switzerland, 1991.
- Białasiewicz, J.T. Falki i Aproksymacje; WNT: Warszaw, Poland, 2000. [Google Scholar]
- Lina, J.-M.; Turcotte, P.; Goulard, B. Complex Dyadic Multiresolution Analyses. In Advances in Imaging and Electron Physics; Hawkes, P.W., Ed.; Elsevier: Amsterdam, The Netherlands, 1999; Volume 109, pp. 163–197. [Google Scholar] [CrossRef]
- Shen, X.; Walter, G. Meyer wavelet regularization. Numer. Funct. Anal. Optim. 2006, 23, 195–215. [Google Scholar] [CrossRef]
- Mallat, S.G. A theory for multiresolution signal decomposition: The wavelet representation. IEEE Trans. Pattern Anal. Mach. Intell. 1989, 11, 674–693. [Google Scholar] [CrossRef]
- Hotra, O.; Kovtun, S.; Dekusha, O. Analysis of the characteristics of bimetallic and semiconductor heat flux sensors for in-situ measurements of envelope element thermal resistance. Measurement 2021, 182, 109713. [Google Scholar] [CrossRef]
- Babak, V.; Dekusha, O.; Kovtun, S.; Ivanov, S. Information-measuring system for monitoring thermal resistance. CEUR Workshop Proc. 2019, 2387, 102–110. Available online: http://ceur-ws.org/Vol-2387/20190102.pdf (accessed on 25 November 2022).
- ISO 6781; Thermal Insulation—Qualitative Detection of Thermal Irregularities in Building Envelopes—Infrared Method. ISO: Geneva, Switzerland, 2015.
- EN 13187; Thermal Performance of Buildings—Qualitative Detection of Thermal Irregularities in Building Envelopes—Infrared Method. CEN: Brussels, Belgium, 2000.
- Ding, Y.; Zhang, Q.; Yuan, T.; Yang, K. Model input selection for building heating load prediction: A case study for an office building in Tianjin. Energy Build. 2018, 159, 254–270. [Google Scholar] [CrossRef]
Disclaimer/Publisher’s Note: The statements, opinions and data contained in all publications are solely those of the individual author(s) and contributor(s) and not of MDPI and/or the editor(s). MDPI and/or the editor(s) disclaim responsibility for any injury to people or property resulting from any ideas, methods, instructions or products referred to in the content. |
© 2022 by the authors. Licensee MDPI, Basel, Switzerland. This article is an open access article distributed under the terms and conditions of the Creative Commons Attribution (CC BY) license (https://creativecommons.org/licenses/by/4.0/).