Review

Review of the Impact of Biofuels on U.S. Retail Gasoline Prices

by
Karel Janda
1,
Eva Michalikova
2,
Luiz Célio Souza Rocha
3,
Paulo Rotella Junior
1,4,*,
Barbora Schererova
1 and
David Zilberman
5
1
Faculty of Finance and Accounting, Prague University of Economics and Business, 11000 Prague, Czech Republic
2
Faculty of Business and Management, Brno University of Technology, 60190 Brno, Czech Republic
3
Management Department, Federal Institute of Education, Science and Technology—North of Minas Gerais, Almenara 39900-000, Brazil
4
Department of Production Engineering, Federal University of Paraíba, João Pessoa 58051-900, Brazil
5
Department of Agricultural and Resource Economics, University of California, Berkeley, CA 94720, USA
*
Author to whom correspondence should be addressed.
Energies 2023, 16(1), 428; https://doi.org/10.3390/en16010428
Submission received: 10 December 2022 / Revised: 23 December 2022 / Accepted: 26 December 2022 / Published: 30 December 2022

Abstract

:
This study aims to provide a review of the state-of-the-art literature regarding the impacts and contributions of corn ethanol on retail gasoline prices in the US. For this, a systematic literature review following PRISMA statement was carried out, seeking to answer four research questions: (1) What are the main characteristics of the literature regarding the impact and contributions of ethanol on US retail gasoline prices? (2) What are the main article clusters identified in the evaluated literature? (3) What was the numerical impact of the Volumetric Ethanol Excise Tax Credit/Renewable Fuel Standard (VEETC/RFS) mandate on the price of gasoline and what are the main methods used for calculation in the literature? (4) What are the main trends and possibly new research directions for this literature? As a result of the characterization of the sample, driving themes, such as energy policy, costs, price dynamics, trade and energy market, were identified. Furthermore, three main clusters were identified in the sample: (i) impacts of biofuels on commodity prices and general price dynamics; (ii) impacts of public policies on the implementation of ethanol and flexibility in formulating fuel blends; and (iii) impact of biofuels on environmental aspects. As a practical implication, the prevailing result in the analyzed literature is that the addition of ethanol reduces the price of gasoline at the pump, and estimates range from no effect to nearly 10% off the price of gasoline. Finally, the topic on the impacts of biofuels on commodity prices and on the general dynamics of prices is the most relevant research line and the trend suggested by the proposed research agenda.

1. Introduction

The biofuel industry has been significantly growing in recent years around the world, most prominently in USA, EU, and Brazil. Originally, biofuels sparked the interest of agricultural economists and policymakers in the last century in the context of replacing fossil fuels and providing energy security, and later also to address climate change, food security, and rural development [1]. Since the turn of the century, biofuels have become a controversial topic in the public domain and in agricultural and energy research, which evolves into two main trends. The first main body of literature concerns food security and crop prices [2,3], since the primary use of agricultural production has been food consumption. The second concerns ecology and environmental topics [4,5,6,7], such as greenhouse gas emissions (GHG), use of land and water compared to just using conventional fossil fuels, and leaving land for food production or provision of environmental services.
The literature on commodity food prices is mostly concerned with econometric analysis and investigates relationships and common dynamics between the prices of food and biofuels. The main concern is that using agricultural production as a feedstock for biofuels rather than food consumption drives food prices up and causes nutrition crises, particularly in low-income countries. The food crisis between 2008 and 2010 motivated extensive research on this topic [8,9,10,11]. The literature generally finds that the relationship between food and ethanol prices is relatively weak, but ethanol prices are affected by both food and fuel prices. Reference [12] offers a comprehensive review of studies and critically compares their results. The authors of [12] argue that standard time-series analysis does not capture the effect of biofuels on food well and that the impact is, in fact, quite heterogeneous across crops and geographical locations. The presented review further argues that the impact of biofuels on food commodities is, in fact, lower than the impact of economic growth and can be well offset by using genetically modified crops.
Condon et al. [13] provides a meta-analysis of estimates of corn-ethanol on corn prices and shows that increasing the production of corn-ethanol by one billion gallons increases corn prices by three to four percent. Persson [14] then presents a systematic review of the literature similar to ours but explores the effect of biofuels’ energy demand on agricultural commodities, whereas we focus on the so far much-less-investigated effect of ethanol on gasoline prices.
Recently, Lark et al. [15] assessed the environmental effects of the Renewable Fuel Standard (RFS) program, which is the main policy driver behind the increased biofuel production since 2005, even more so after the expansion of the program in 2007. Lark et al. [15] calculated that the mandates motivated higher use of fertilizers and reduced the diversity of U.S. soil by reducing rotation in favor of producing corn. This, in turn, produced substantially greater GHG emissions. Additionally, Lark et al. [15] estimated that higher demand for corn caused inflation of soybean and wheat prices and disputed the potential of the current corn-ethanol production in mitigating climate change. This study, along with [16,17], forms strong criticism of the RFS program, which is well summarized in [18]. These studies argue that while corn-ethanol provides profits for corn farmers and ethanol producers, it comes at a much greater expense to the U.S. taxpayer in the form of financing the subsidies, higher gasoline and food prices, and the overall high costs of climate change and other environmental damage, such as that to water and air quality. Those recent studies presented contradictory conclusions to the meta-analysis presented by [19]. Consider also the GHG discussion in [20]. One of the substantial changes in time between the studies is the shift in the U.S. position from a net oil importer to an exporter in 2020, which according to [18], reduces the necessity of the RFS program.
The biofuel policy debate is ongoing and evolving rapidly and substantially. We take the rich discussion presented above as evidence not only of the complexity of the biofuel topic but also of the evolution of results over time. In this article, we add to the discussion on price impacts; more specifically, we review the literature concerning the impact of blending ethanol into gasoline in the U.S. Our systematic literature review identifies the methods used in the research and their contribution to modeling ethanol’s effect. This study aims to provide a review of the state-of-the-art literature regarding the impact and contributions of corn ethanol on retail gasoline prices in the US. To assist in achieving this goal, we propose four research questions (RQ):
1.
What are the main characteristics of the literature regarding the impact and contributions of ethanol on US retail gasoline prices?
2.
What are the main article clusters identified in the evaluated literature?
3.
What was the numerical impact of Volumetric Ethanol Excise Tax Credit/Renewable Fuel Standard (VEETC/RFS) mandate on the price of gasoline, and what are the main methodologies used for calculation in the literature?
4.
What are the main trends and possibly new research directions for this literature?
This article is structured into four sections. In Section 2, we present the used methodology, along with the descriptors. Each step of the methodology and the descriptors are carefully explained. The results and a discussion are presented in Section 3, which is divided into four subsections. Finally, conclusions and corresponding recommendations are provided in Section 4.

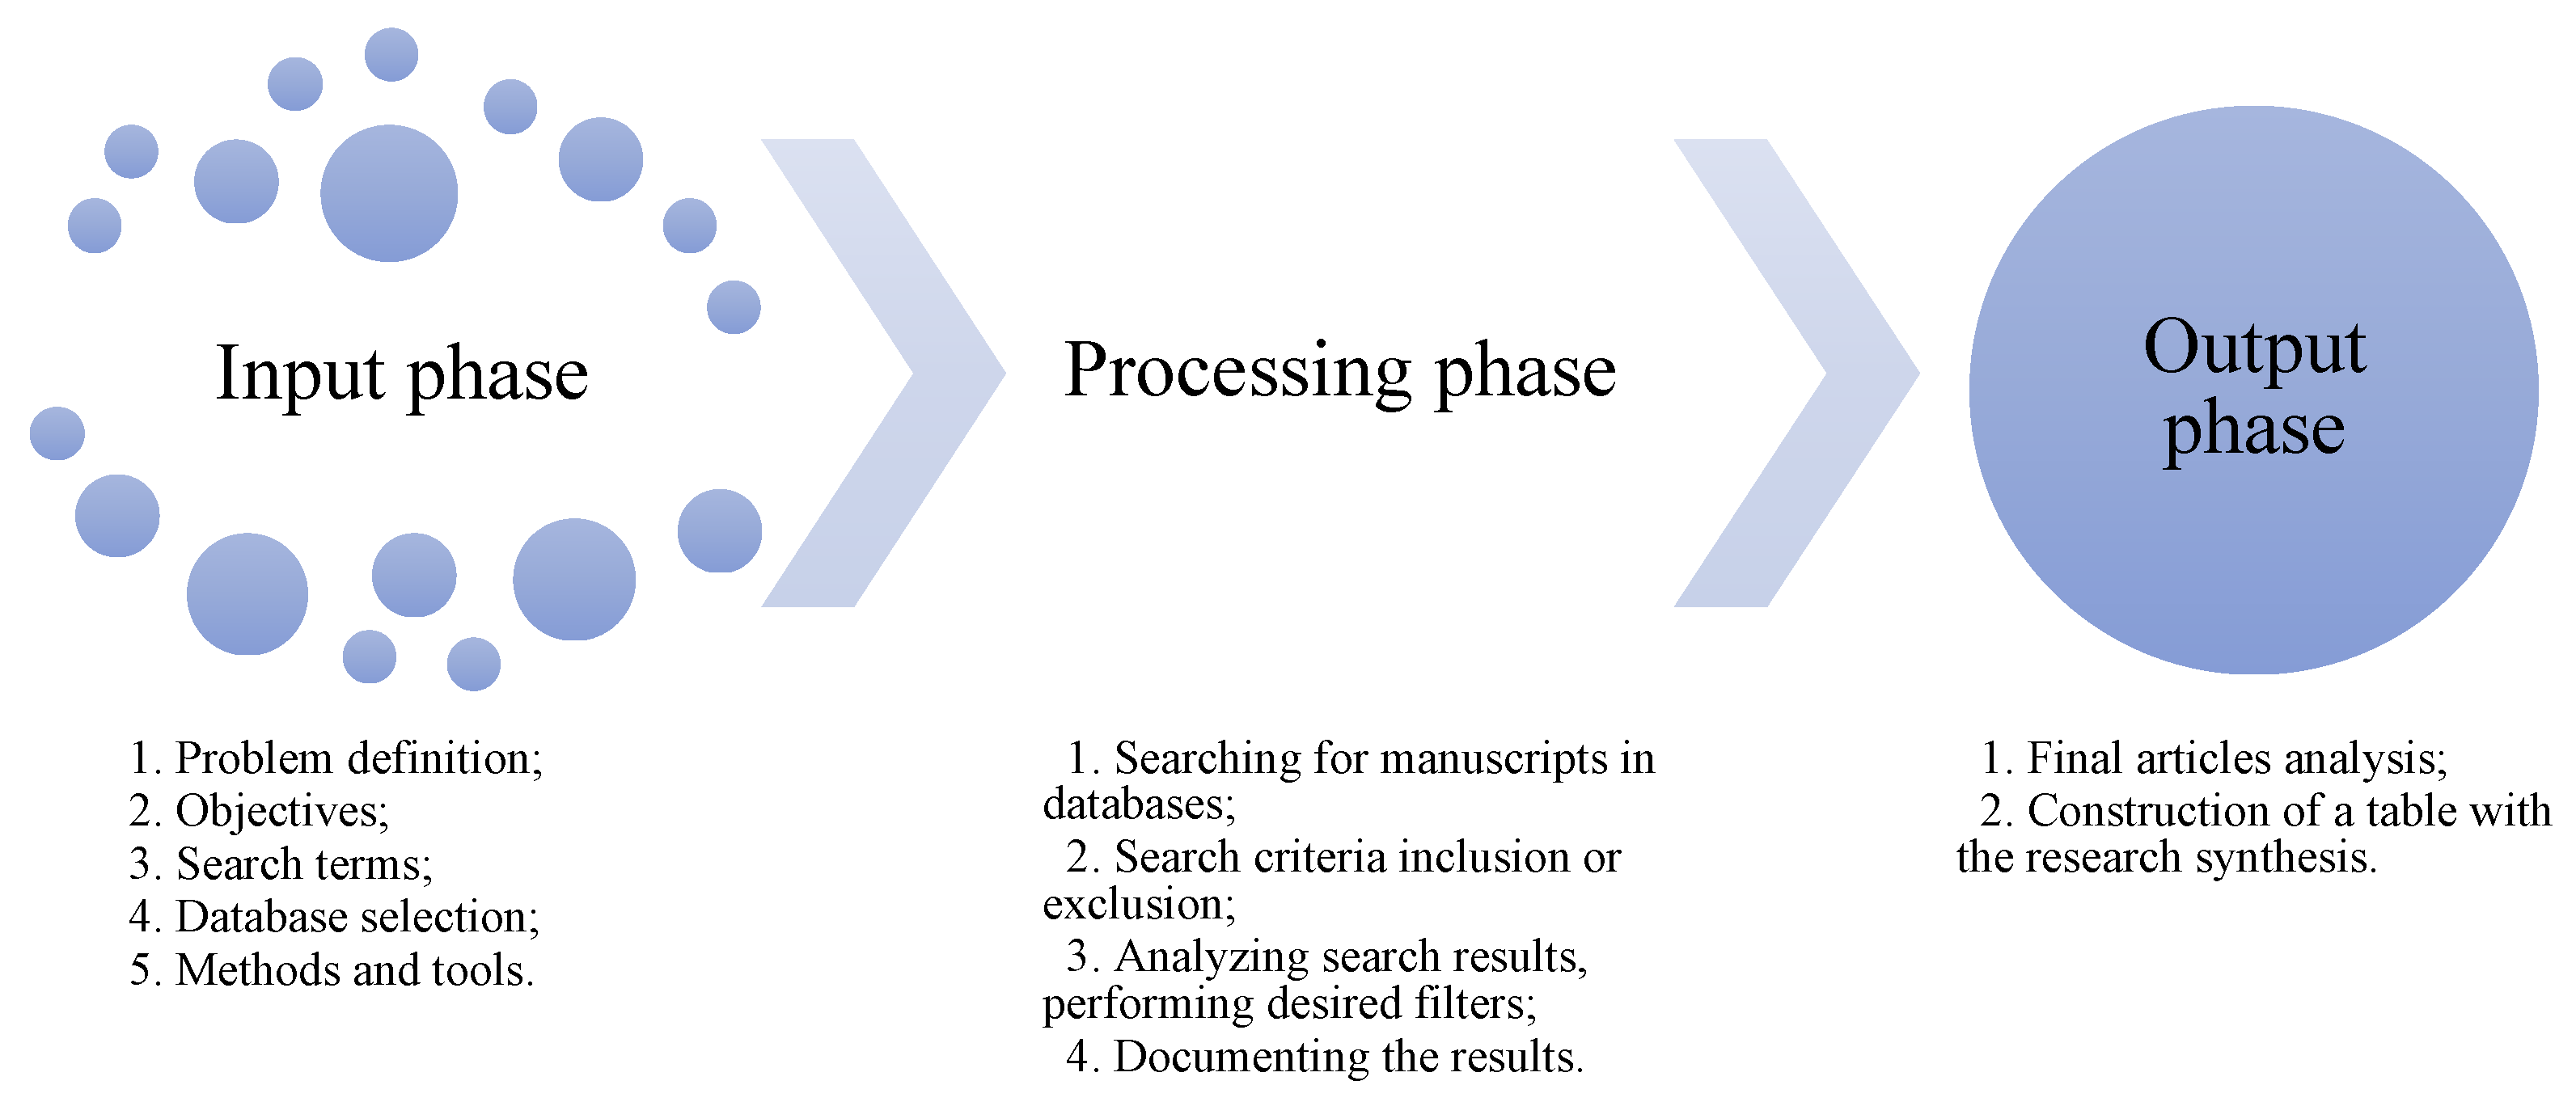
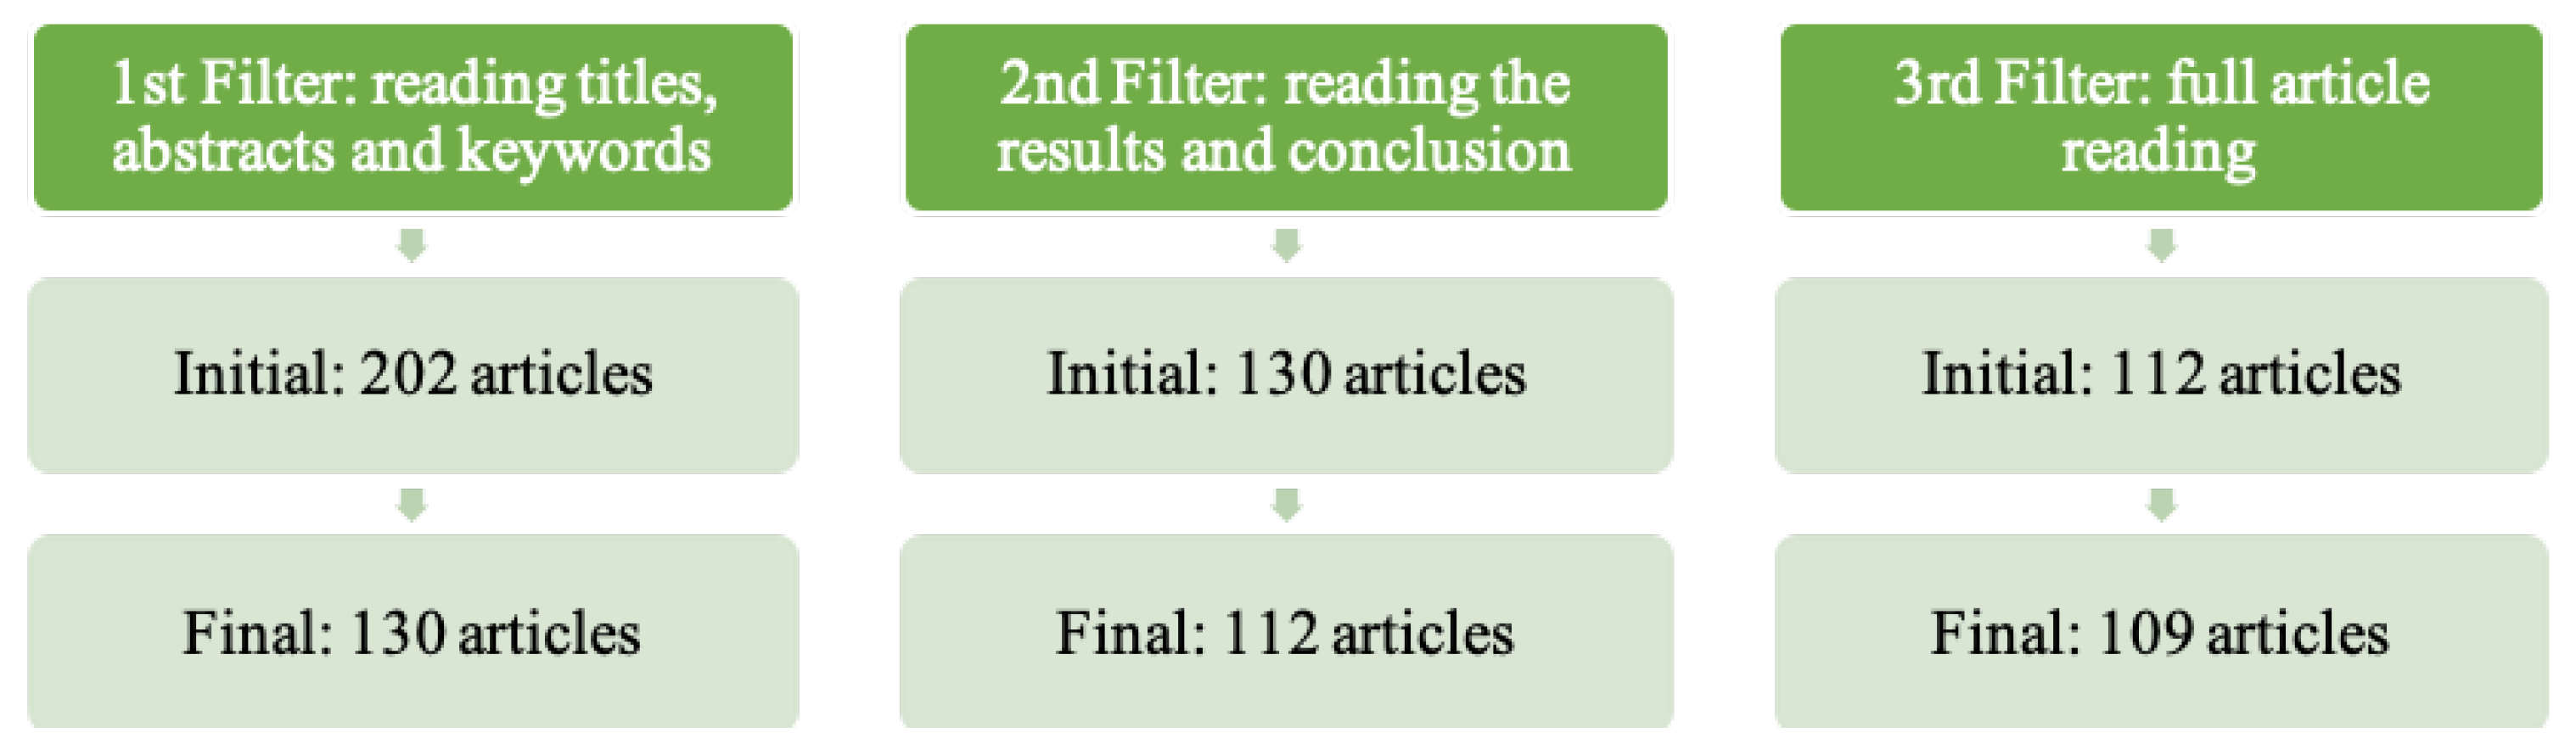
2. Materials and Methods

The systematic literature review (SLR) can be defined as a structured review process that allows others to replicate and validate the research conducted and exactly follow the path chosen for the research [21]. In this way, SLR differs from a traditional exploratory review, reducing the researcher’s subjectivity, and resulting in a scientific, transparent, and replicable process [22]. In the SLR proposed in this study, we followed the instructions of the PRISMA statement, in addition to five steps recommended in the literature [23]:
(a)
Formulate research questions that can guide the study.
(b)
Identify the most relevant studies from the literature of interest.
(c)
Evaluate the quality and relevance of the articles.
(d)
Identify and summarize the scientific evidence.
(e)
Interpret the results found.
In simple terms, SLR can be defined as a systematic process composed of three phases: input (i), processing (ii), and output (iii) [24,25]; as shown in Figure 1. In the input phase, we define the research problem and objectives. During the processing part, we search for studies in the databases, construct search strings, and define exclusion or inclusion criteria, using which, we then apply filters to assist us in the analysis of results. We then proceed to document the results. In the output phase, we produce tables and figures which summarize the obtained results.
This section is dedicated to providing a detailed description of the steps we followed in conducting the SLR used to answer the research questions (RQ) presented in the previous section.
In the Input phase, we define the research problem and its objectives along with studies relevant to the literature. We identify the main keywords of the publications that would contribute to the discussion about the appropriate search strings for performing the SLR. It is important to note that the proposed research questions serve to guide the development of the research and the presentation of results. For this, due to its sufficient acceptance and breadth, the Scopus database (from Elsevier) was selected.
After carrying out exploratory attempts, we adopted the search strings presented below, considering the Boolean logic “and” between levels (1.), (2.), and (3.). The use of the symbol “ ” guarantees the exact sequence of words. Finally, some variations as plural and singular were considered.
1.
Title (“ethanol” or “biofuel” or “bioethanol” or “renewable fuel”)
2.
Paper title, keywords or abstract (“U.S” or “US” or “USA” or “U.S.A” or “United States” or “Midwest” or “corn”)
3.
Paper title, keywords or abstract (“gasoline price” or “fuel price” or “gas price” or “petrol price” or “petroleum price” or “retail price” or “gasoline market” or “fuel market” or “gas market” or “petrol market” or “petroleum market” or “petroleum product market” or “wholesale” or “price support”)
It is pertinent to point out that we used the term “corn”, since the research focuses on North American ethanol, along with the use of “Midwest”. In this way, we used the term “corn” in the geographic section of the filter to capture studies that deal with corn ethanol and that, for some reason, do not have the U.S. (or similar) as a descriptor in the title, abstract, or keywords. We used the bibliometric analysis software VOSviewer and the R package Bibliometrix [27]; for evaluation, synthesis of results and information, and graphical interpretation of the results, we used Microsoft Excel.
In the processing phase, we proceeded to define the eligibility criteria while ensuring that the sample responds adequately to the formulated RQs. The inclusion and exclusion filtering procedure was conducted by all co-authors of this study in sequence, thereby ensuring the quality of the final sample.
Figure 2 illustrates the delimiting filters of the sample used. In a search carried out in September 2022, the search strings resulted in 202 publications in the Scopus database. After reading the title, abstract, keywords, and search results, we reduced the list to 130 articles, since part of the initial sample was outside the scope of the research. After an initial read of the results and conclusions, we applied the second filter and obtained a sample of 112 articles. Finally, the articles were subjected to a complete reading, and we narrowed down the sample to 109 articles.
We list the most important exclusion criteria used in the processing phase:
(a)
Studies from foreign countries (such as Brazil, Argentina, Mexico, EU, Thailand, etc.) whose ethanol comes primarily from sugar-related feedstocks;
(b)
Evaluation of different biofuel feedstock (cellulosic, lignocellulosic, agricultural biomass, oilseeds, etc.);
(c)
Studies focused on other issues (food price impact, greenhouse gas impact, ethanol blending, government impact and opinions about subsidies, etc.);
(d)
Studies of other fields (chemistry, the technology of production, etc.).
The output phase is dedicated to the analysis and synthesis of the results, which we interpret and discuss in detail in the following section.

3. Results and Discussion

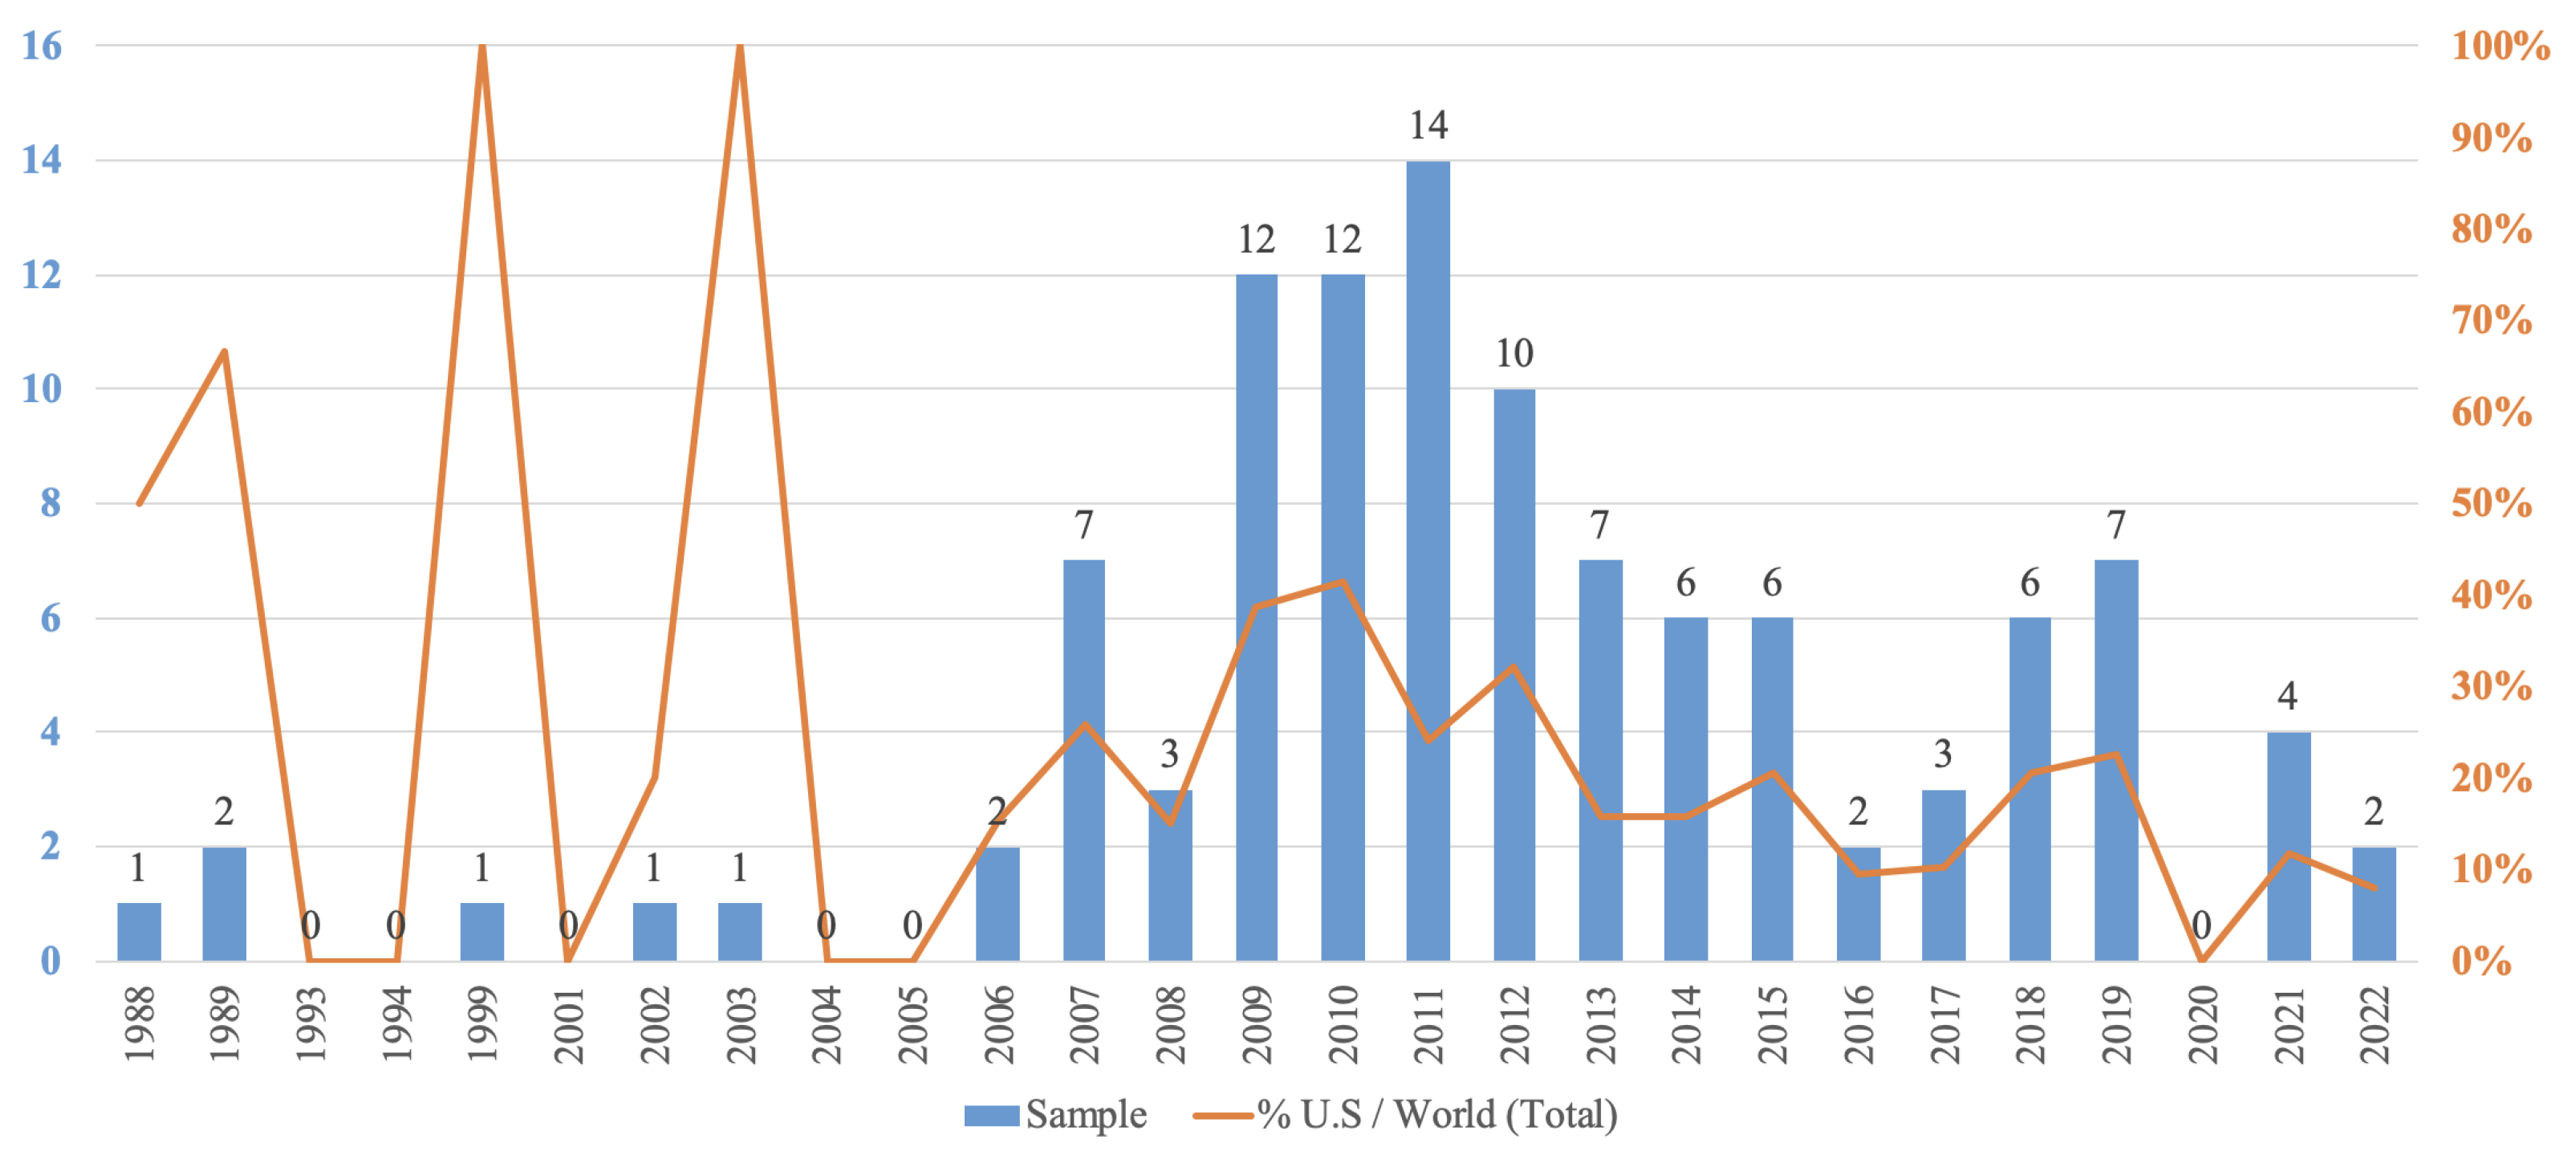
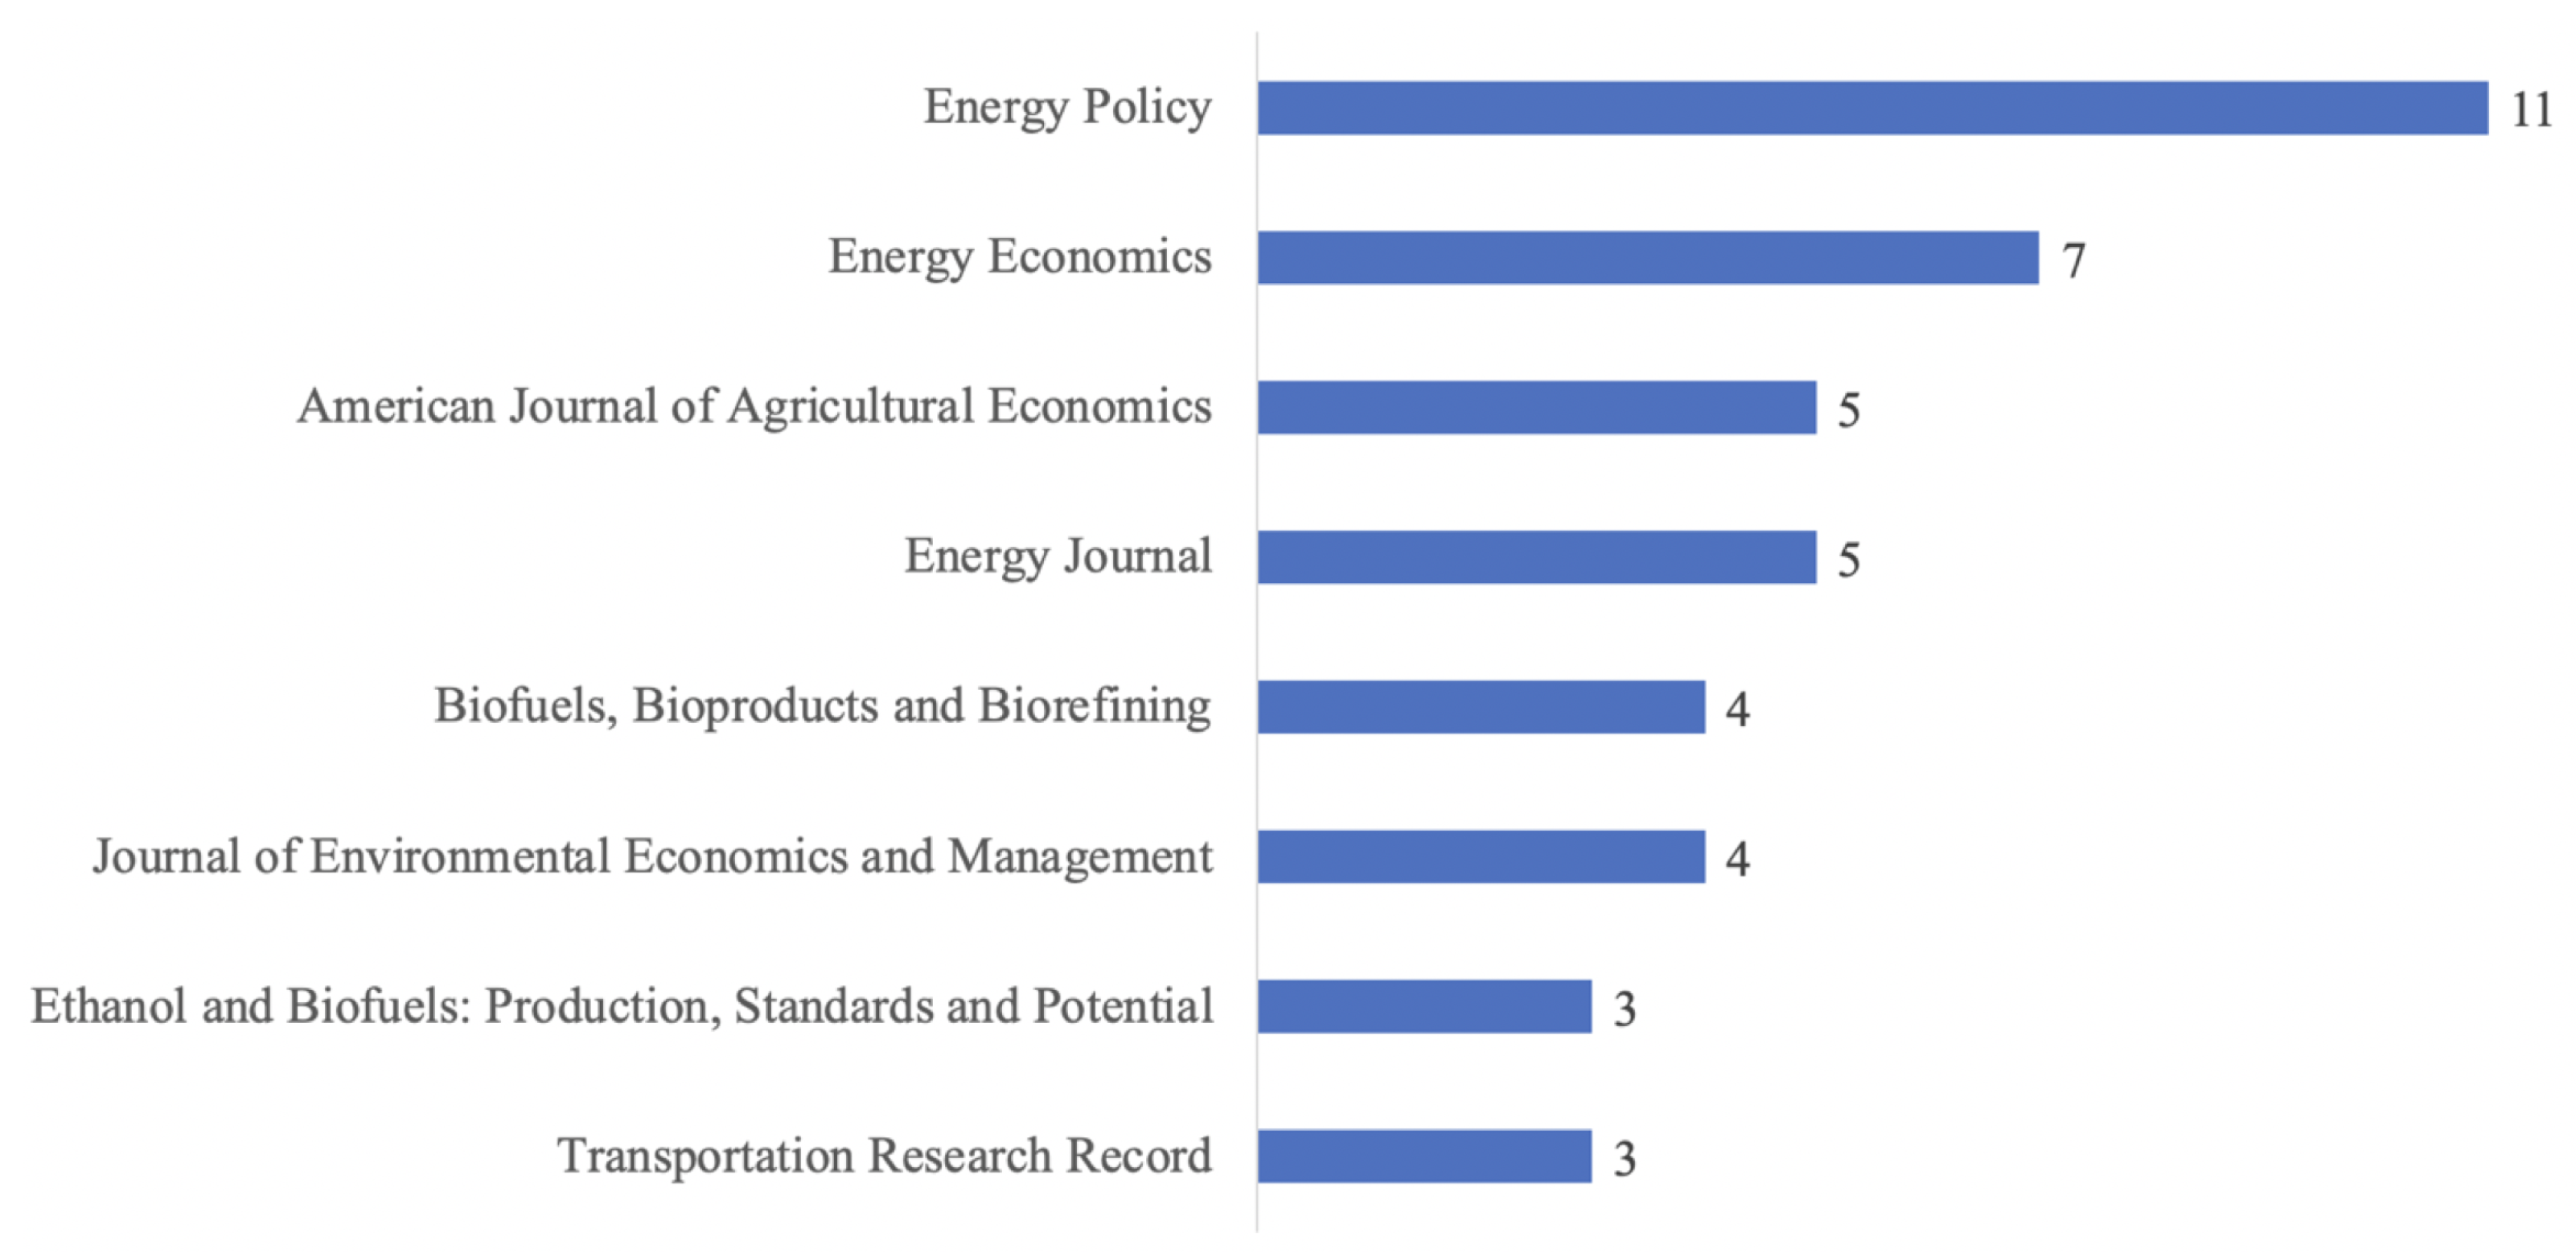
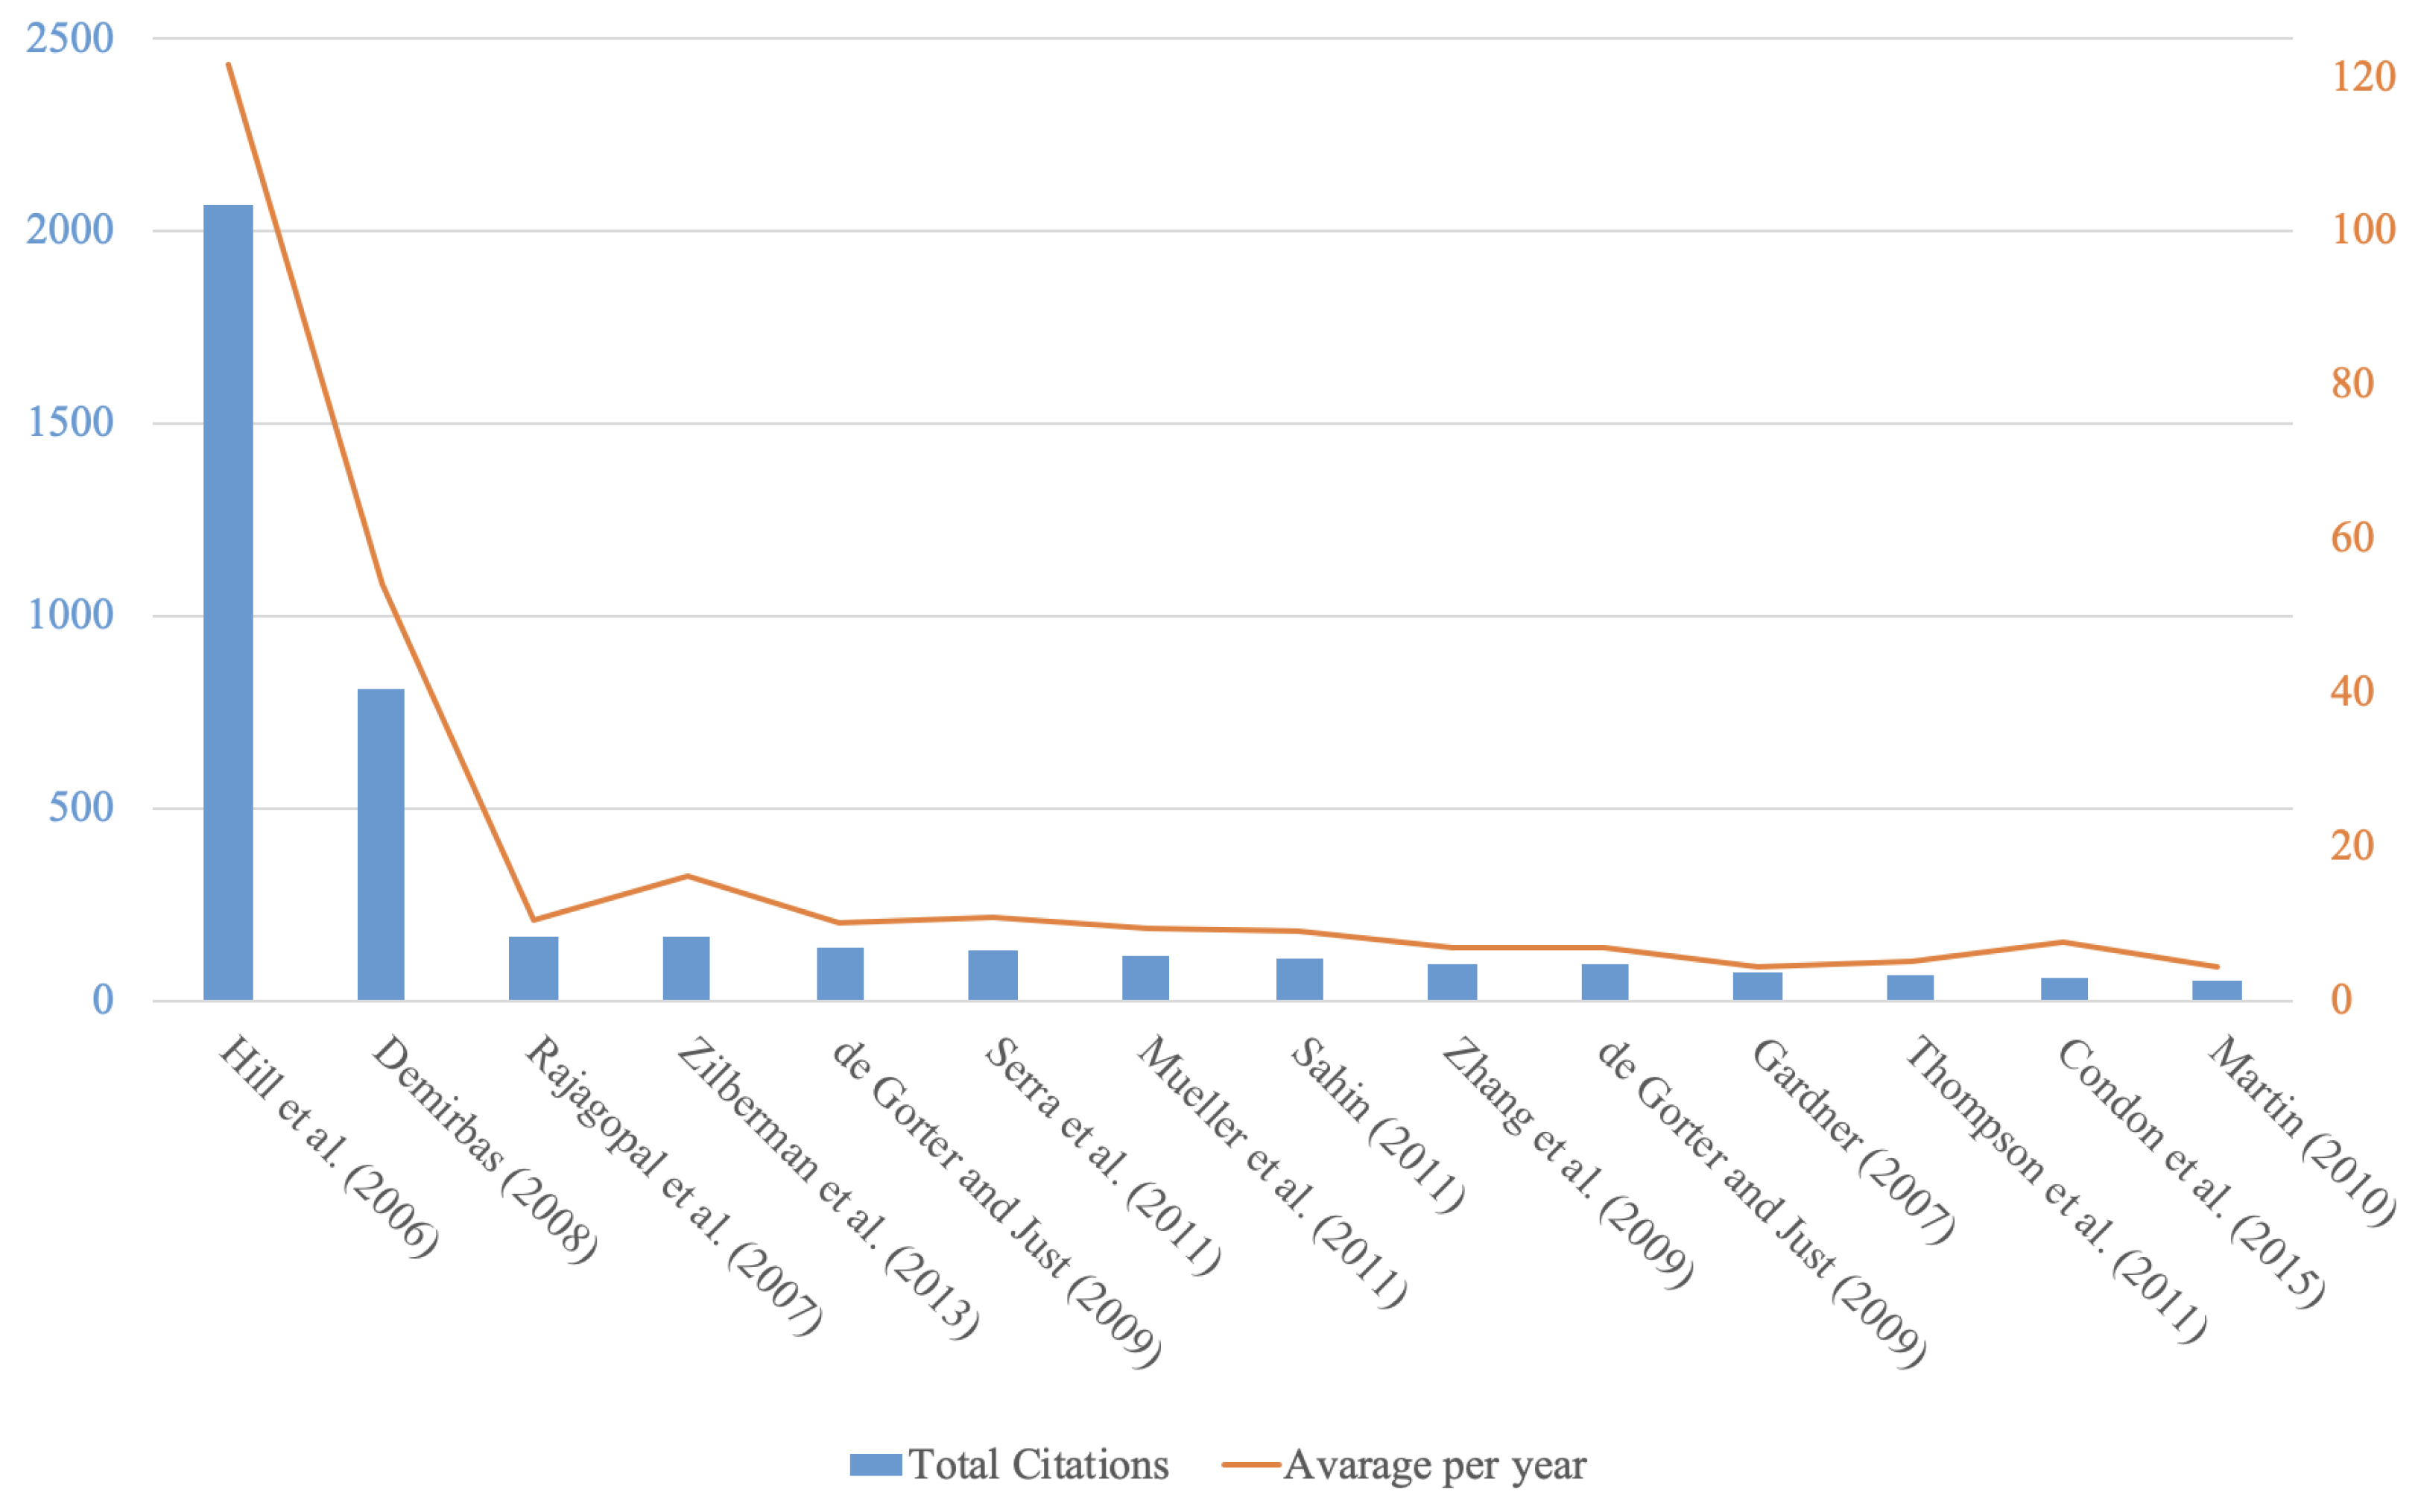
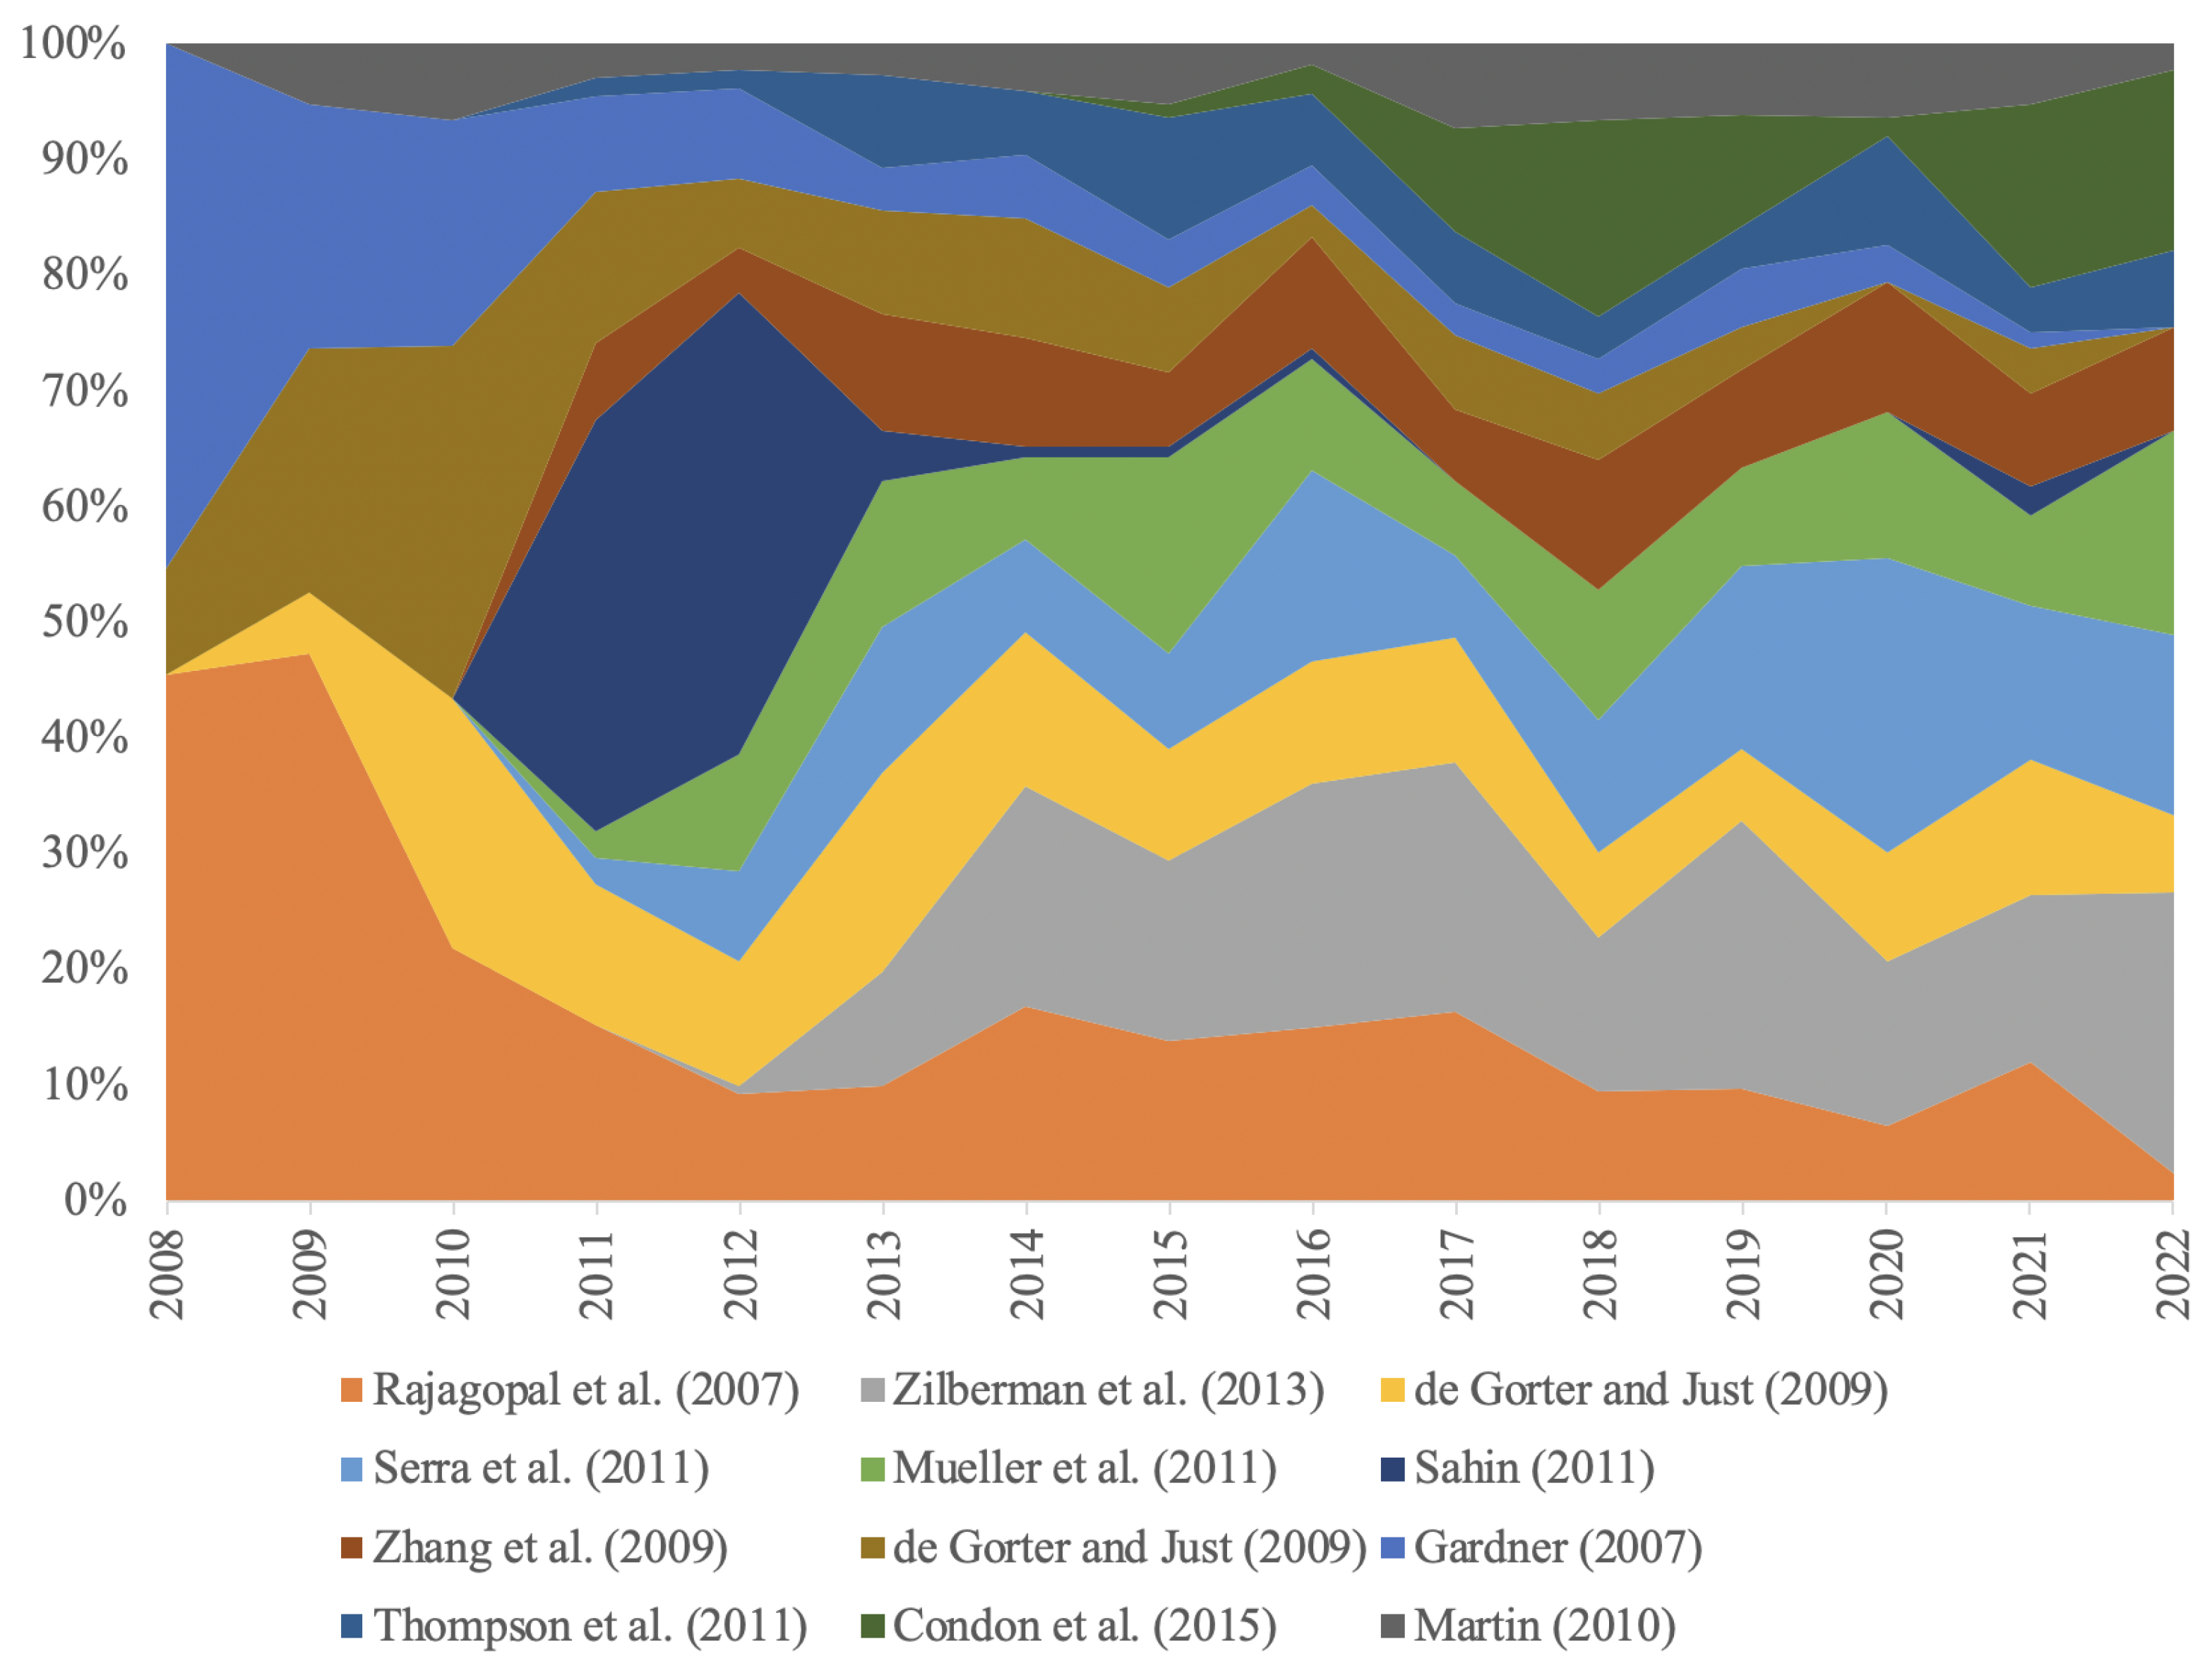
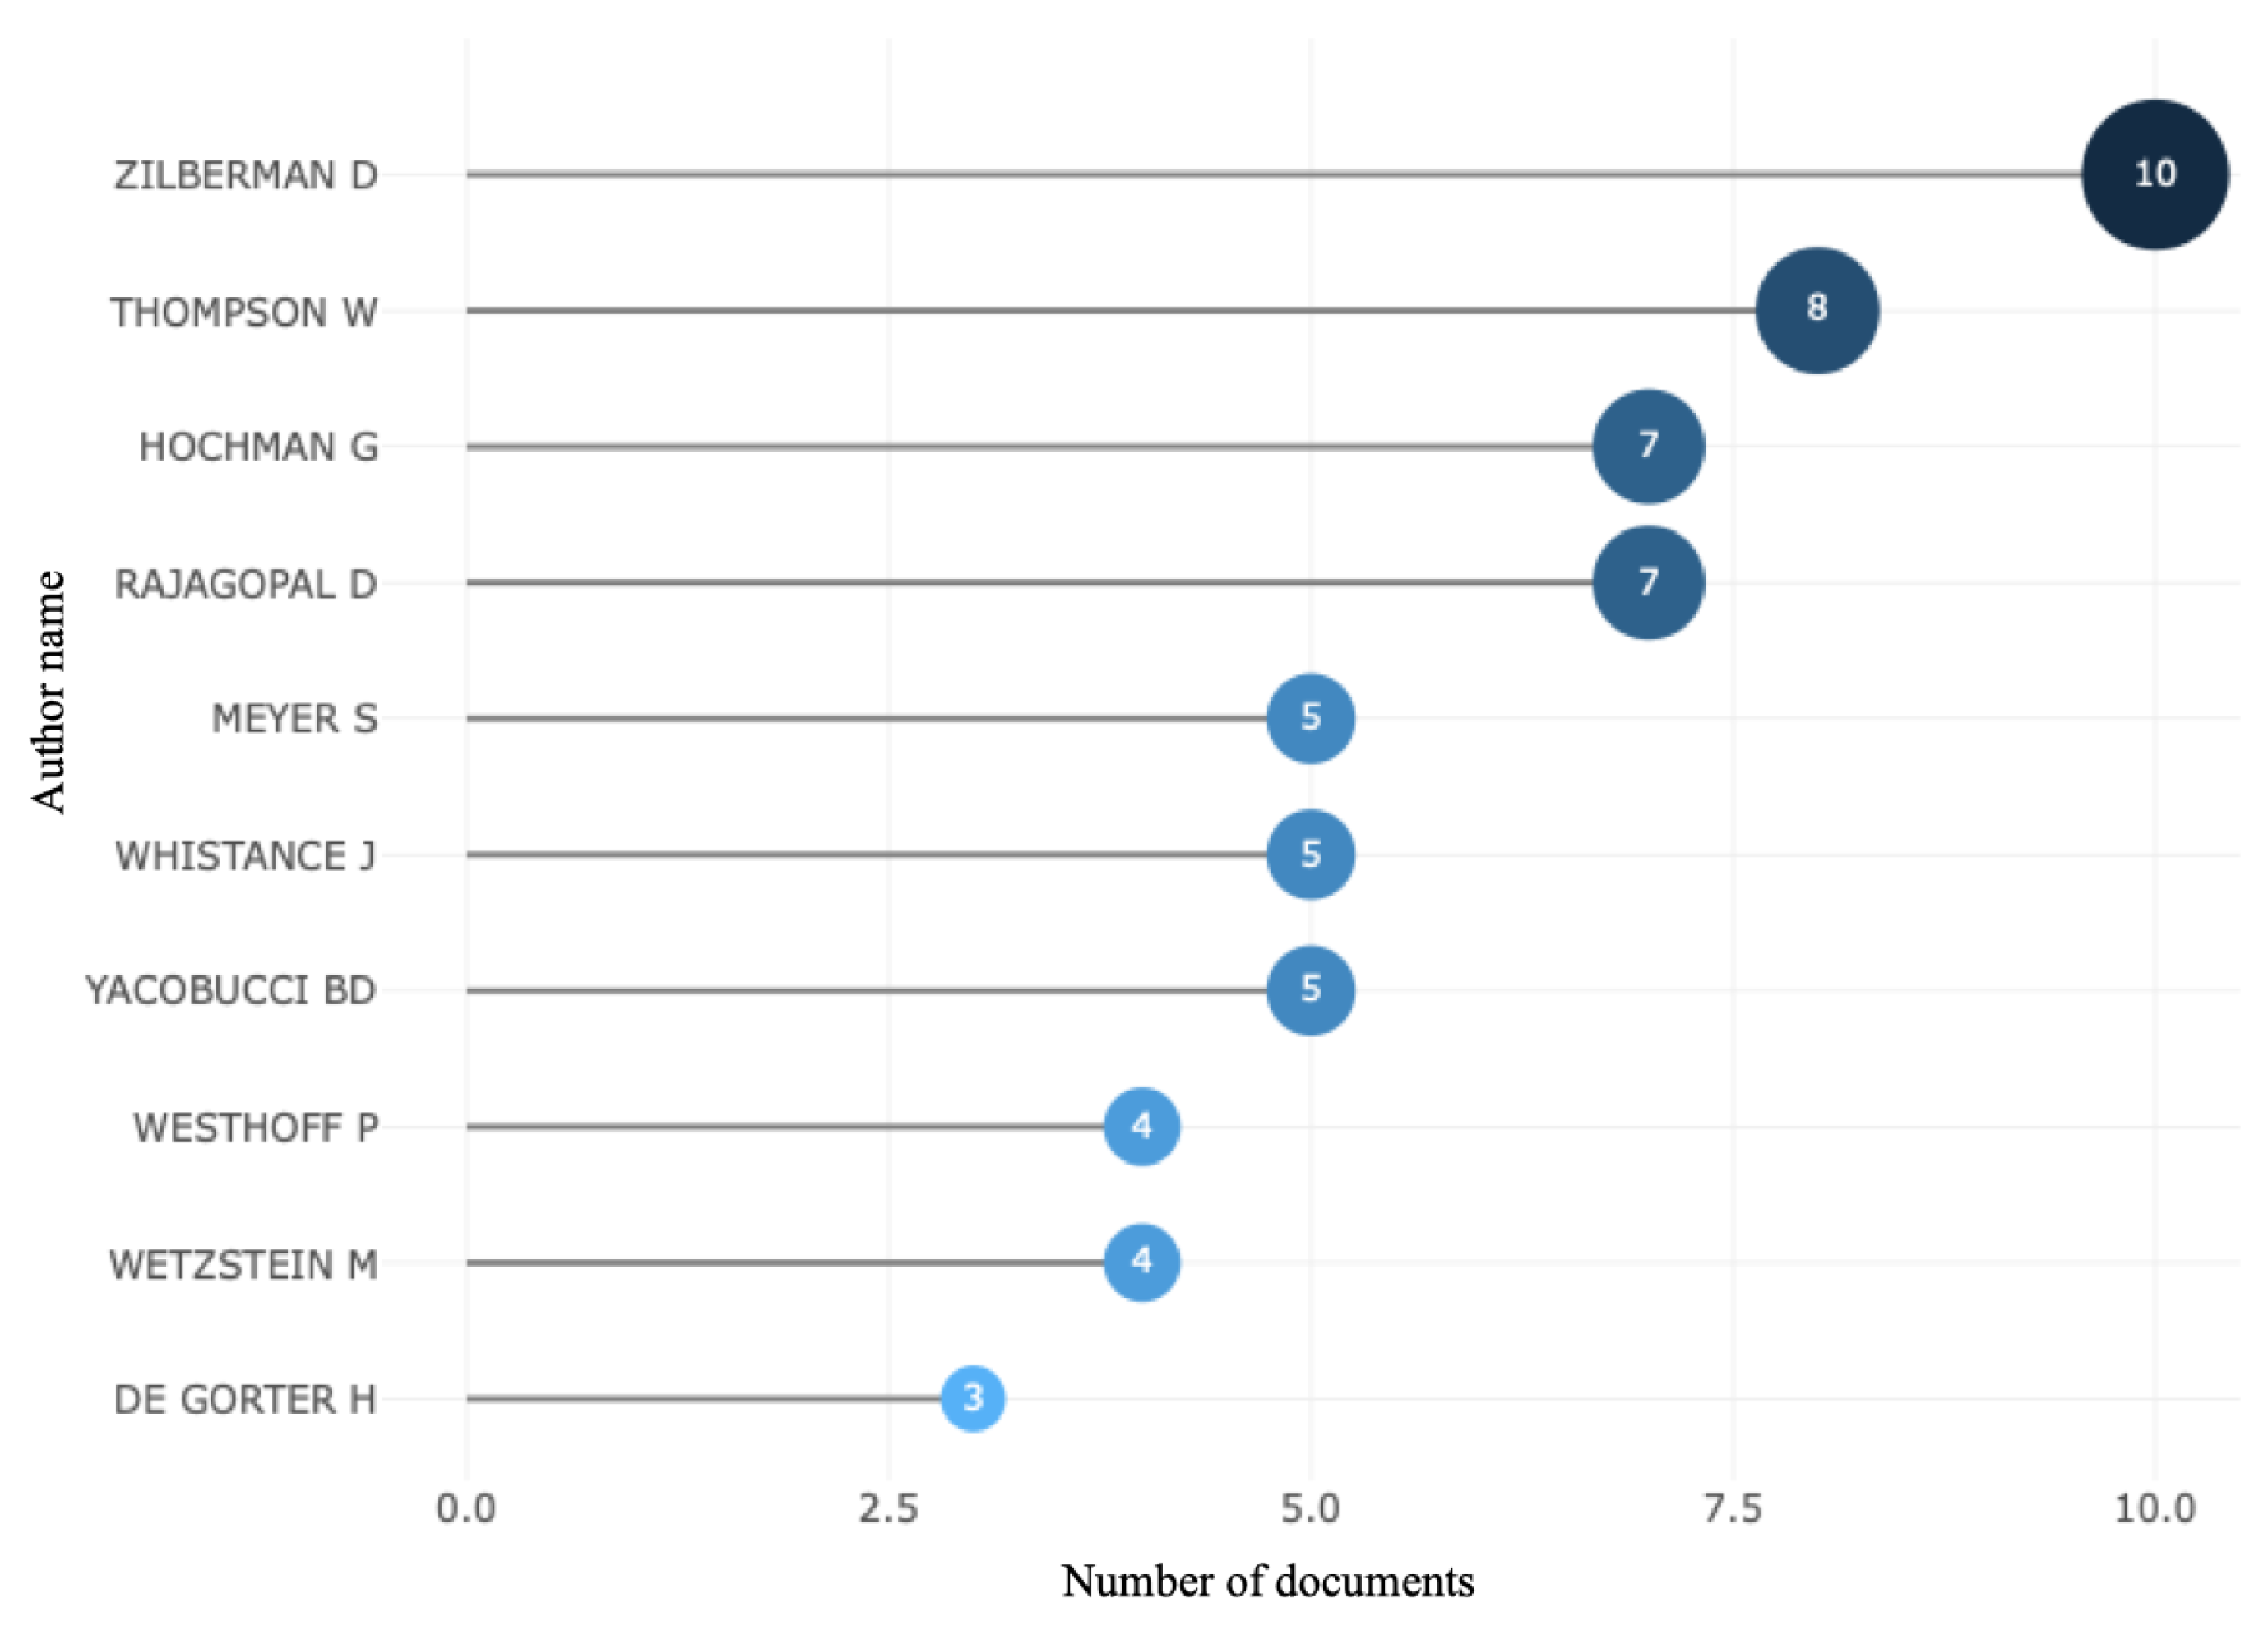
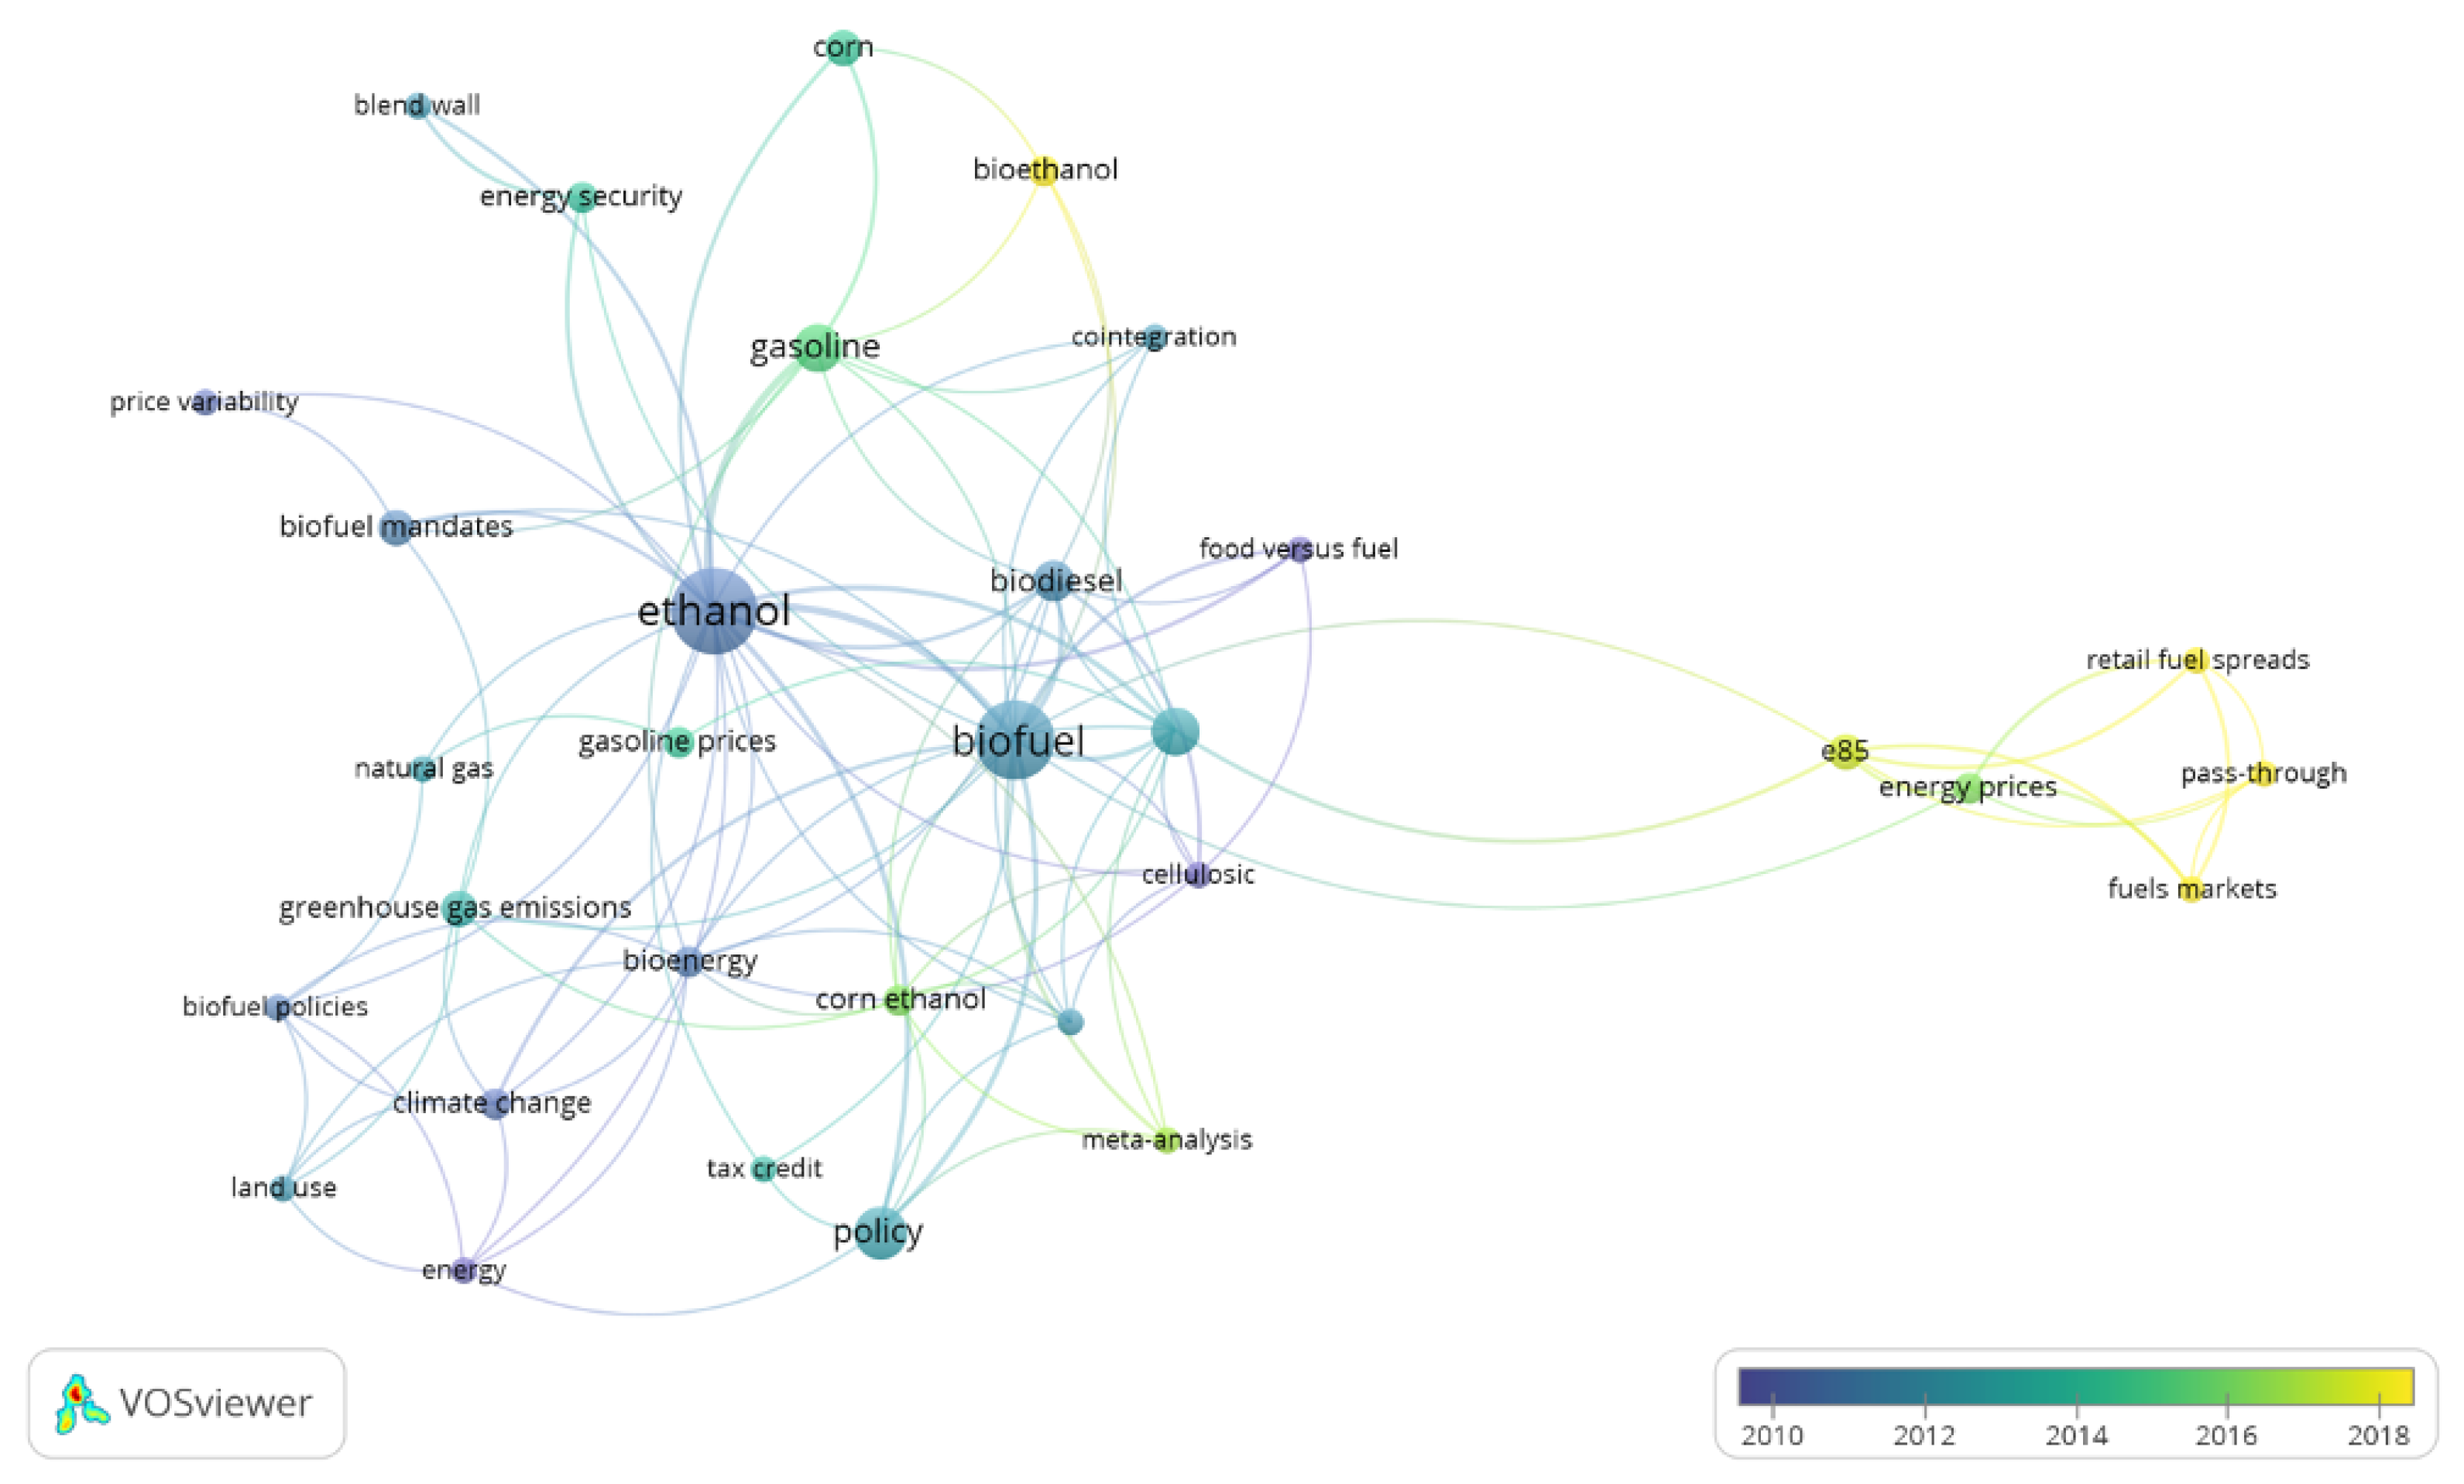
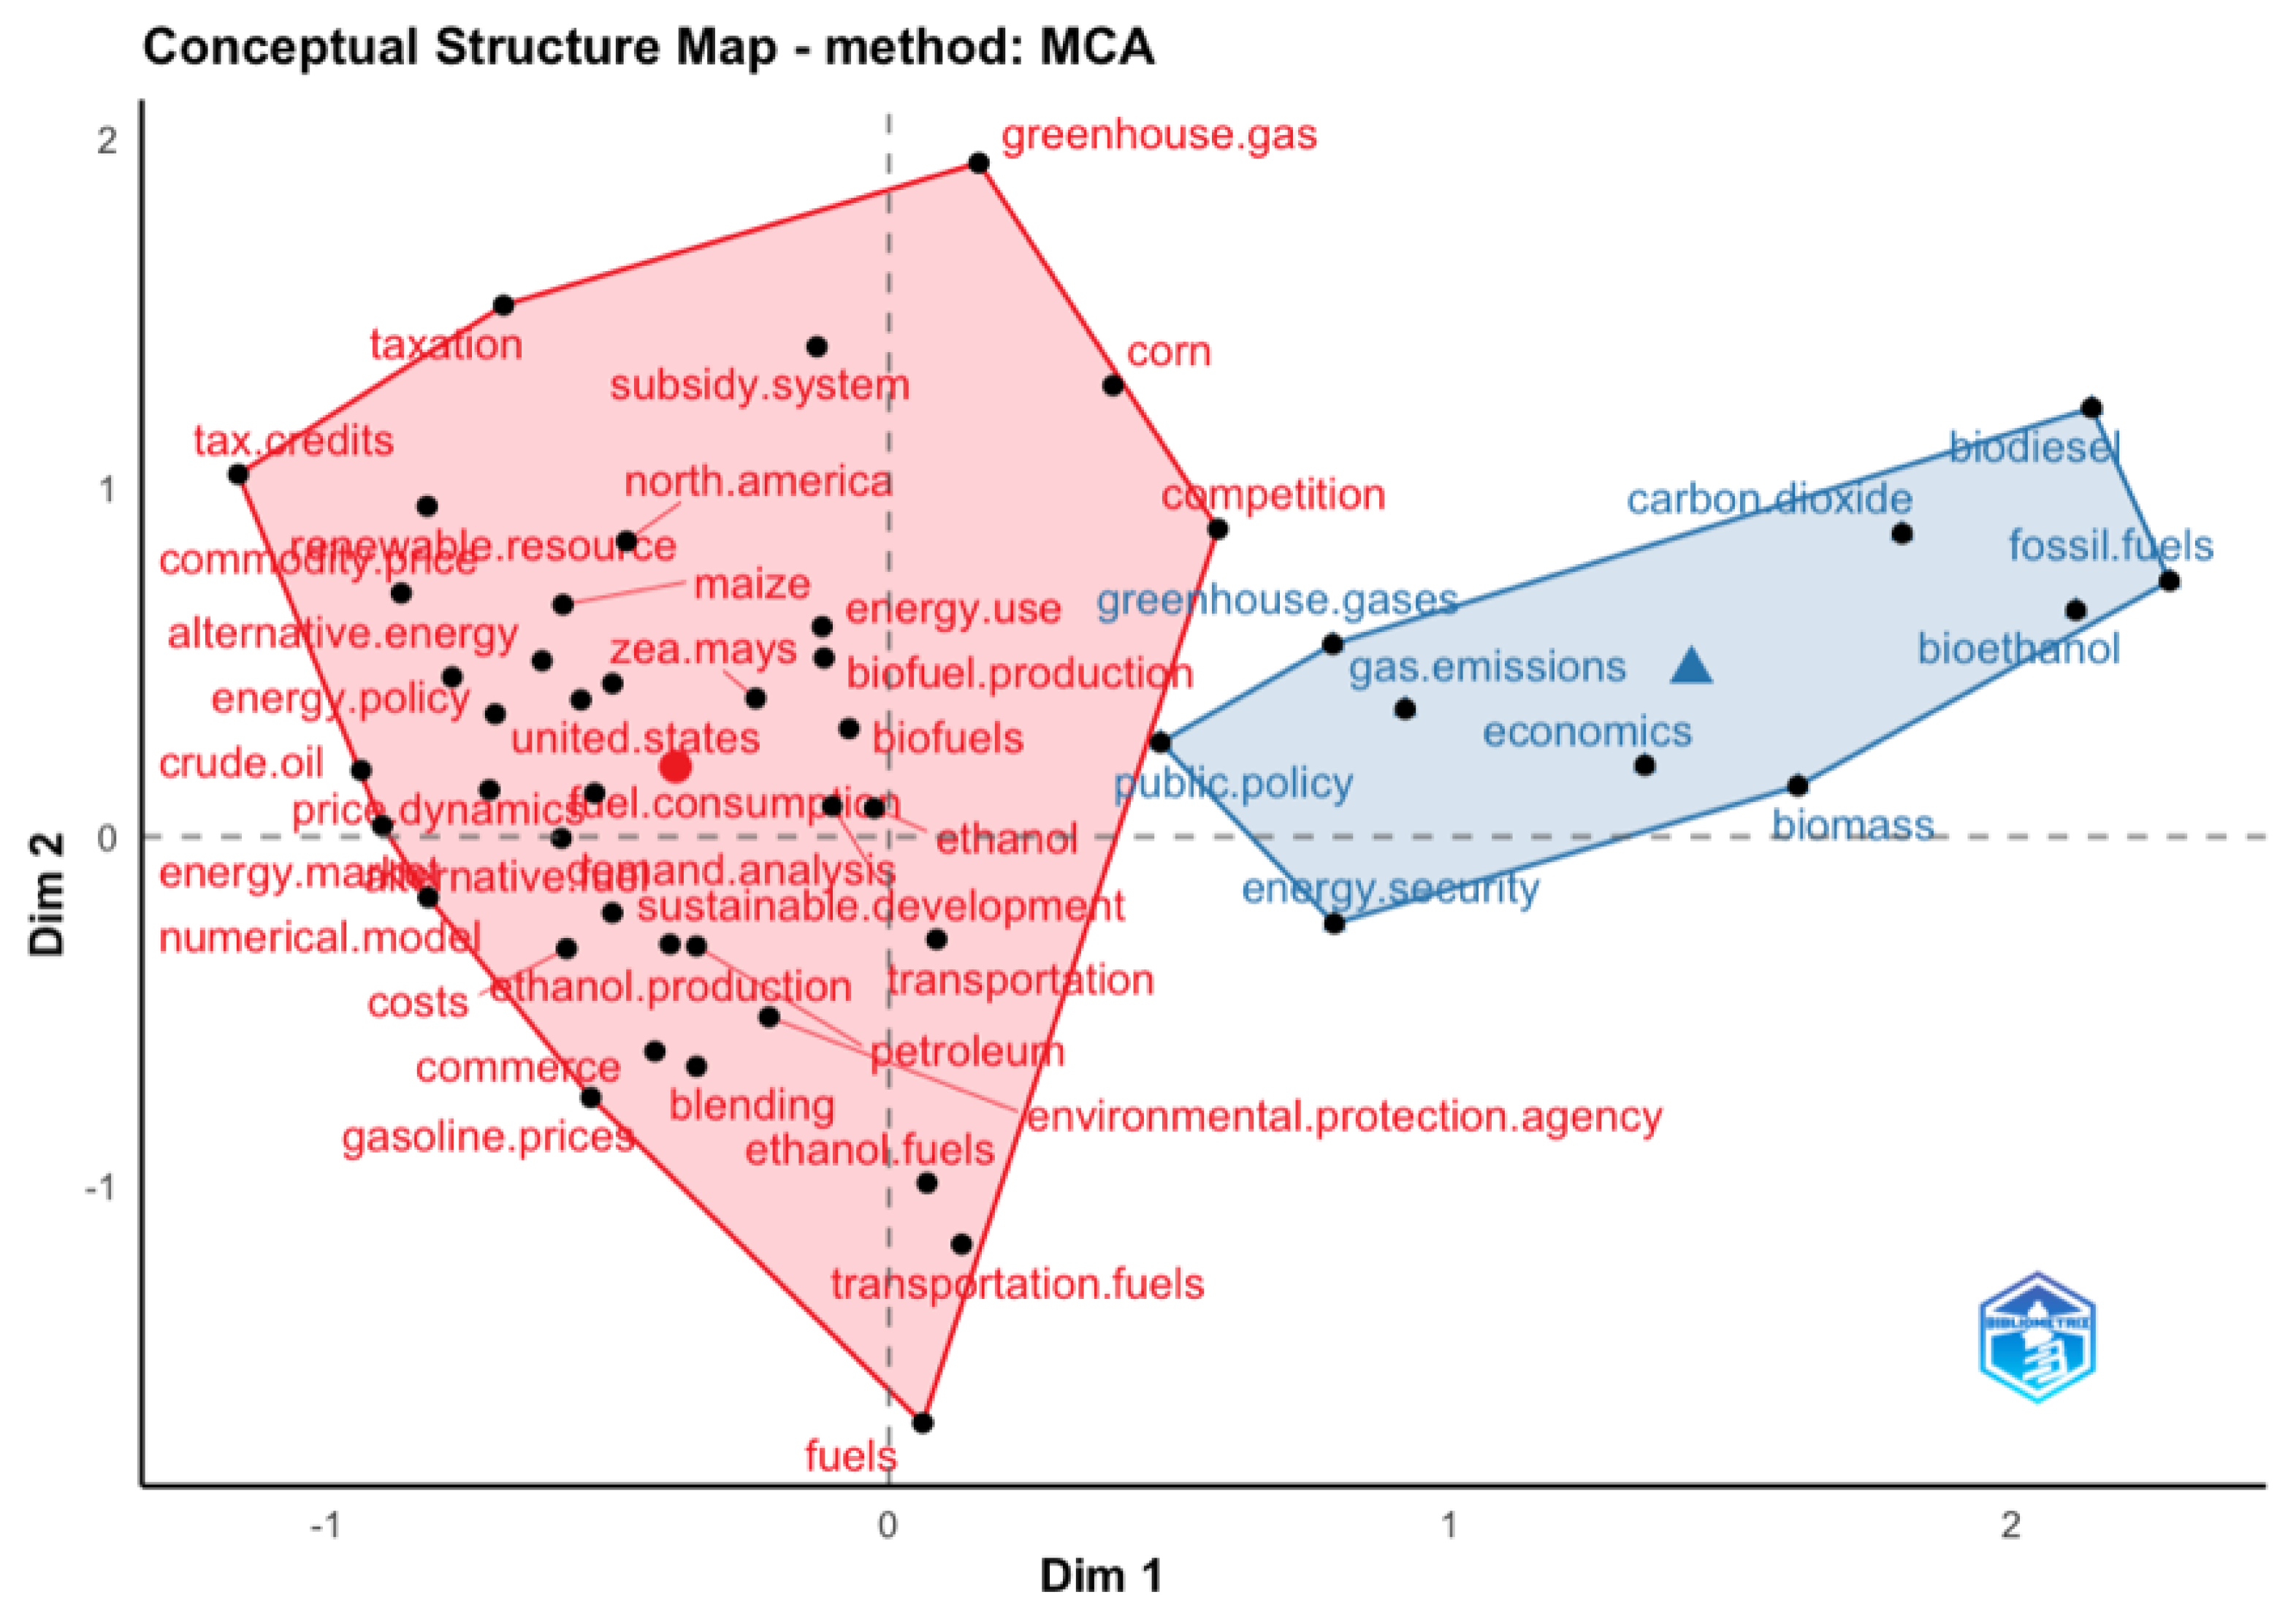
3.1. Sample Characterization

To answer RQ1 (what are the main characteristics of the literature regarding the impact and contributions of ethanol on US retail gasoline prices), we start with the temporal distribution of the articles. Figure 3 presents the annual distribution of articles in the sample. This figure also displays the percentage of the sample in the general literature on the topic, that is, when search string (ii) is removed, without any restriction by country or area (obtaining the ratio of the publications related to the U.S. to the World). It is important to highlight the interest in the subject in the U.S. in comparison to the worldwide literature. Even though we can observe a greater interest in the topic between 2009 and 2012, the following analysis will show that this topic is still very relevant and important to researchers.
Figure 4 presents the main scientific journals that have at least three articles present in our sample. The journals with the highest number of publications are Energy Policy, Energy Economics, and the American Journal of Agricultural Economics. There is an evident dominance of journals in the area of energy, agriculture, and others more specific to ethanol and biofuels. Interestingly, the shortlists also include the Journal of Environmental Economics and Management, which has a broader scope and is not exclusively focused on the above-mentioned areas.
Figure 5 represents the fourteen most cited articles in the sample. The average citation per year provides a view of citations over time and interprets the results in a way that shows the most recently published articles. he authors Hill [6] and Demirbas [7] dominate the figure, surpassing more than 2000 and 800 citations, respectively. Studies as Zilberman [12] and De Gorter and Just [28] are also very relevant, with over 140 citations each.
In view of the extensive number of citations of the articles presented in Figure 5, we present below a brief summary of their contents. These include different scopes, such as existing relationships and the impact of biofuels on commodity food prices [12,29,30,31], the environmental impacts of biofuels [6,32,33], policy issues and their implications [13,34].
  • [6] · The study carried out an environmental and economic assessment of energy costs and the benefits of biodiesel and ethanol biofuels. Through life cycle assessment, the study evaluated corn ethanol and soybean biodiesel. The main finding is that compared to fossil fuels, biofuels have a lower environmental impact. However, no biofuel had the ability to replace oil without affecting food supplies, and subsidies are needed to make biofuels profitable.
  • [7] · The manuscript presents definitions, details, compositions, production information, use, and future perspectives that address biofuel sources, biofuel policy, biofuel economy, and global biofuel projections. The study considers scenarios of the impacts of biomass on the world economy.
  • [35] · The authors argue using the conceptual model with back-of-the-envelope estimates that ethanol subsidies in the short run actually pay for themselves and that the impact of the production of biofuels from food feedstock will be bigger on food prices rather than energy prices.
  • [12] · The study used time series econometrics to assess the impact of biofuels on commodity food prices. The main finding is that the price of ethanol increases as the prices of corn and gasoline increase. The study also found that ethanol prices are positively related to sugar and oil prices in equilibrium.
  • [28] · The study presents a conceptual framework that allows analyzing the economics of a mandate for biofuels and evaluates the economic implications of the combination with a tax credit. Results indicate that tax credits result in lower fuel prices than under a mandate for the same level of biofuel production. If tax credits are implemented along with mandates, tax credits would subsidize fuel consumption instead of biofuels, thereby creating a contrary effect to the energy policy objectives.
  • [29] · The study evaluated price relationships and transmission patterns in the US ethanol industry between 1990 and 2008. The research describes the relationships between corn, ethanol, gasoline, and oil prices. Overall, the results indicate a strong relationship between food prices and energy.
  • [36] · In an extensive literature review, the article assesses the impacts of biofuel production and other supply and demand factors on rising food prices. The results indicate that the production of biofuels had a smaller contribution to the increase in the prices of food commodities until 2008.
  • [32] · The study assessed the environmental impacts of biofuels. The results indicate that ethanol produced from biomass offers environmental and economic benefits and is considered a cleaner and safer alternative than fossil fuels.
  • [30] · The study proposes a multivariate modeling framework to assess short and long-term relationships among corn, soybean, ethanol, gasoline, and oil prices. The paper evaluates if these relationships change over time. The results indicate that in recent years, there have been no long-term relationships between agricultural commodity prices and fuel prices.
  • [34]· This study proposes a framework to assess the effects of a tax exemption on the biofuel consumer and the interaction effects with a price-contingent agricultural subsidy. The authors found that the tax credit reduces the costs of the loan fee program, but this increased the costs of the tax credit.
  • [37] · This study analyzed whether farmers prefer a direct subsidy for corn production or rather a subsidy for the ethanol produced from corn. The study used a vertical model of ethanol, byproducts, and corn and found that farmers are better off with direct corn subsidies.
  • [33] · The authors propose the use of economic models applied especially in the US to assess the effects of biofuel policies on petroleum product markets and their consequences for greenhouse gas emissions.
  • [13] · The study proposes a literature review and a meta-analysis model to assess the impacts of ethanol policy on corn prices between 2007 and 2014. The results indicate that an expansion of the corn ethanol mandate can lead to an increase of 3 to 4 percent in next year’s corn prices.
  • [31] · The study, through a literature review, evaluated the corn ethanol industry, its impacts on food prices, and the role of biotechnology in the U.S. Among their findings, the authors identified that biotechnology had little impact on the biofuel sector.
We consider a number of citations of each publication in Figure 6, where the Citation Treemap presents hierarchical data (structured tree) as a set of nested rectangles. The area of each rectangle is proportional to the number of citations the manuscript has in the sample. This map aims to visually represent the disproportion in the number of citations of the two most cited articles in the sample and the other included studies.
The discrepancy shown in Figure 6 justifies the removal of the studies proposed by [6,7] for the elaboration of Figure 7, whose objective is to present the distribution of citations over time of the most cited articles in the sample, complementing the information provided in the enumeration above. For example, authors such as Rajagopal et al. [35] de Gorter and Just [28,34] have high numbers of absolute citations but have lost their influence in more recent publications, given the reduction in citations per year. Another example is a study by [32], which received a large number of citations in 2011 and 2012, establishing itself among the most cited in the sample. However, in recent years, it has received a low number of citations. At the same time, other authors, such as [29,36], have maintained their influence in recent publications. Finally, ref. [12], and more recently ref. [13], has stood out in recent years.
Differently from the previous graphs that were dedicated to publications, Figure 8 presents the authors or co-authors (individually) most representative in the sample with the largest number of publications. Among these, Zilberman D. and Thompson W. stand out, with ten and eight articles each, respectively. In the sequence, Hochman G., and Rajagopal D., present in seven publications each, are identified.
Figure 9 shows the tree-field plot, establishing relationships between the most frequent journals in the sample, the main authors, and the keywords. Thompson, one of the most relevant authors in the sample, has had his studies published in journals such as Energy Policy, Eurochoices, and The Economics of Alternative Energy Sources and Globalization. This author has used terms such as “ethanol”, “greenhouse gas emissions”, “renewable fuel standard”, “biofuel mandates”, and “gasoline” as keywords in his studies. From the same perspective, Zilberman, another relevant author on the topic, has published in journals such as Agricultural Economics, the American Journal of Agricultural Economics, and Agbioforum. The main keywords included in his works are “biofuels”, “greenhouse gas emissions”, “energy prices”, “energy policy”, “climate change”, and “corn ethanol”.
Figure 10 represents the thematic mapping, allowing the visualization of different types of themes [38]. In the thematic map, we use keywords of the articles in the sample, where the keywords are defined by a semi-automated algorithm under the responsibility of Thomson Reuter’s specialists, which is capable of capturing the content of an article with greater variety and depth [39].
The upper right quadrant of Figure 10 represents themes with a higher degree of development (density) and relevance (centrality), seen as key themes in the literature, among which “Energy Policy” and “costs” stand out. As expected, another key theme found in this analysis was “United States”, defined as one of the keywords in the search strings. Apart from those, other driving themes are “price dynamics”, “commerce”, and “energy market”. Declining or emerging themes are located in the lower left quadrant. In this research, the results suggest that the topic “energy utilization” is an emerging topic. The lower-right quadrant shows sample basic themes. These themes refer to general themes in the different areas of investigation. They include “ethanol”, “biofuel”, “zea mays”, “biomass”, “carbon dioxide”, and “biodiesel” from our sample. Finally, the upper-left quadrant shows themes of high density but of lesser importance to the sample or limited importance to the field (low centrality). Within these themes, “agriculture”, “economic development”, “energy independence”, “energy security”, “Environmental Protection Agency”, and “fuel prices” are the ones that stand out.
In sequence, we created Figure 11 using the VOSviewer software, and it is based on the co-occurrence information of the authors’ keywords [40]. In this figure, the node sizes represent the number of times these keywords were used by the articles in the sample; the connecting lines indicate that these keywords were used in the same publication, and the colors are related to the year of publication. The relevance of the topics “Renewable Fuel Standard” and “policy” protrudes, even though they were not included in the search strings. This network also allows the identification of trending topics for the area, as they represent interests in recent research, such as “retail fuel spreads”, “pass-through”, “fuel markets”, “E85”, or even “energy prices” and “meta-analysis”.
Finally, Figure 12 was elaborated from a multiple correspondence analysis, an exploratory multivariate technique of the keywords and the articles that make up the sample. The conceptual structure map identifies clusters from articles that express interrelated concepts [27].
The results of this figure are to be interpreted based on the distribution of points and their positions along the dimensions. The closer the keywords are in the figure, the greater their similarities in distribution. The figure allows the identification of new latent variables from the formation of clusters in a set of categorical variables. In this way, we identify two distinct clusters. The first cluster (in red), seems to be more relevant due to its size and centrality in relation to dimensions. The red cluster contains important keywords, such as “price dynamics”, “commodity price”, “gasoline prices”, “blending”, “taxation”, and “subsidy system”, which are terms associated with the price and market dynamics of biofuels in the U.S. In the second cluster (in blue), keywords such as “economics”, “energy security”, “public policy”, and “gas emissions” are highlighted as terms associated with the development of public policies for the implementation of biofuels and their environmental impact. This split corresponds to the exploratory and introductory review we provide in the Introduction.

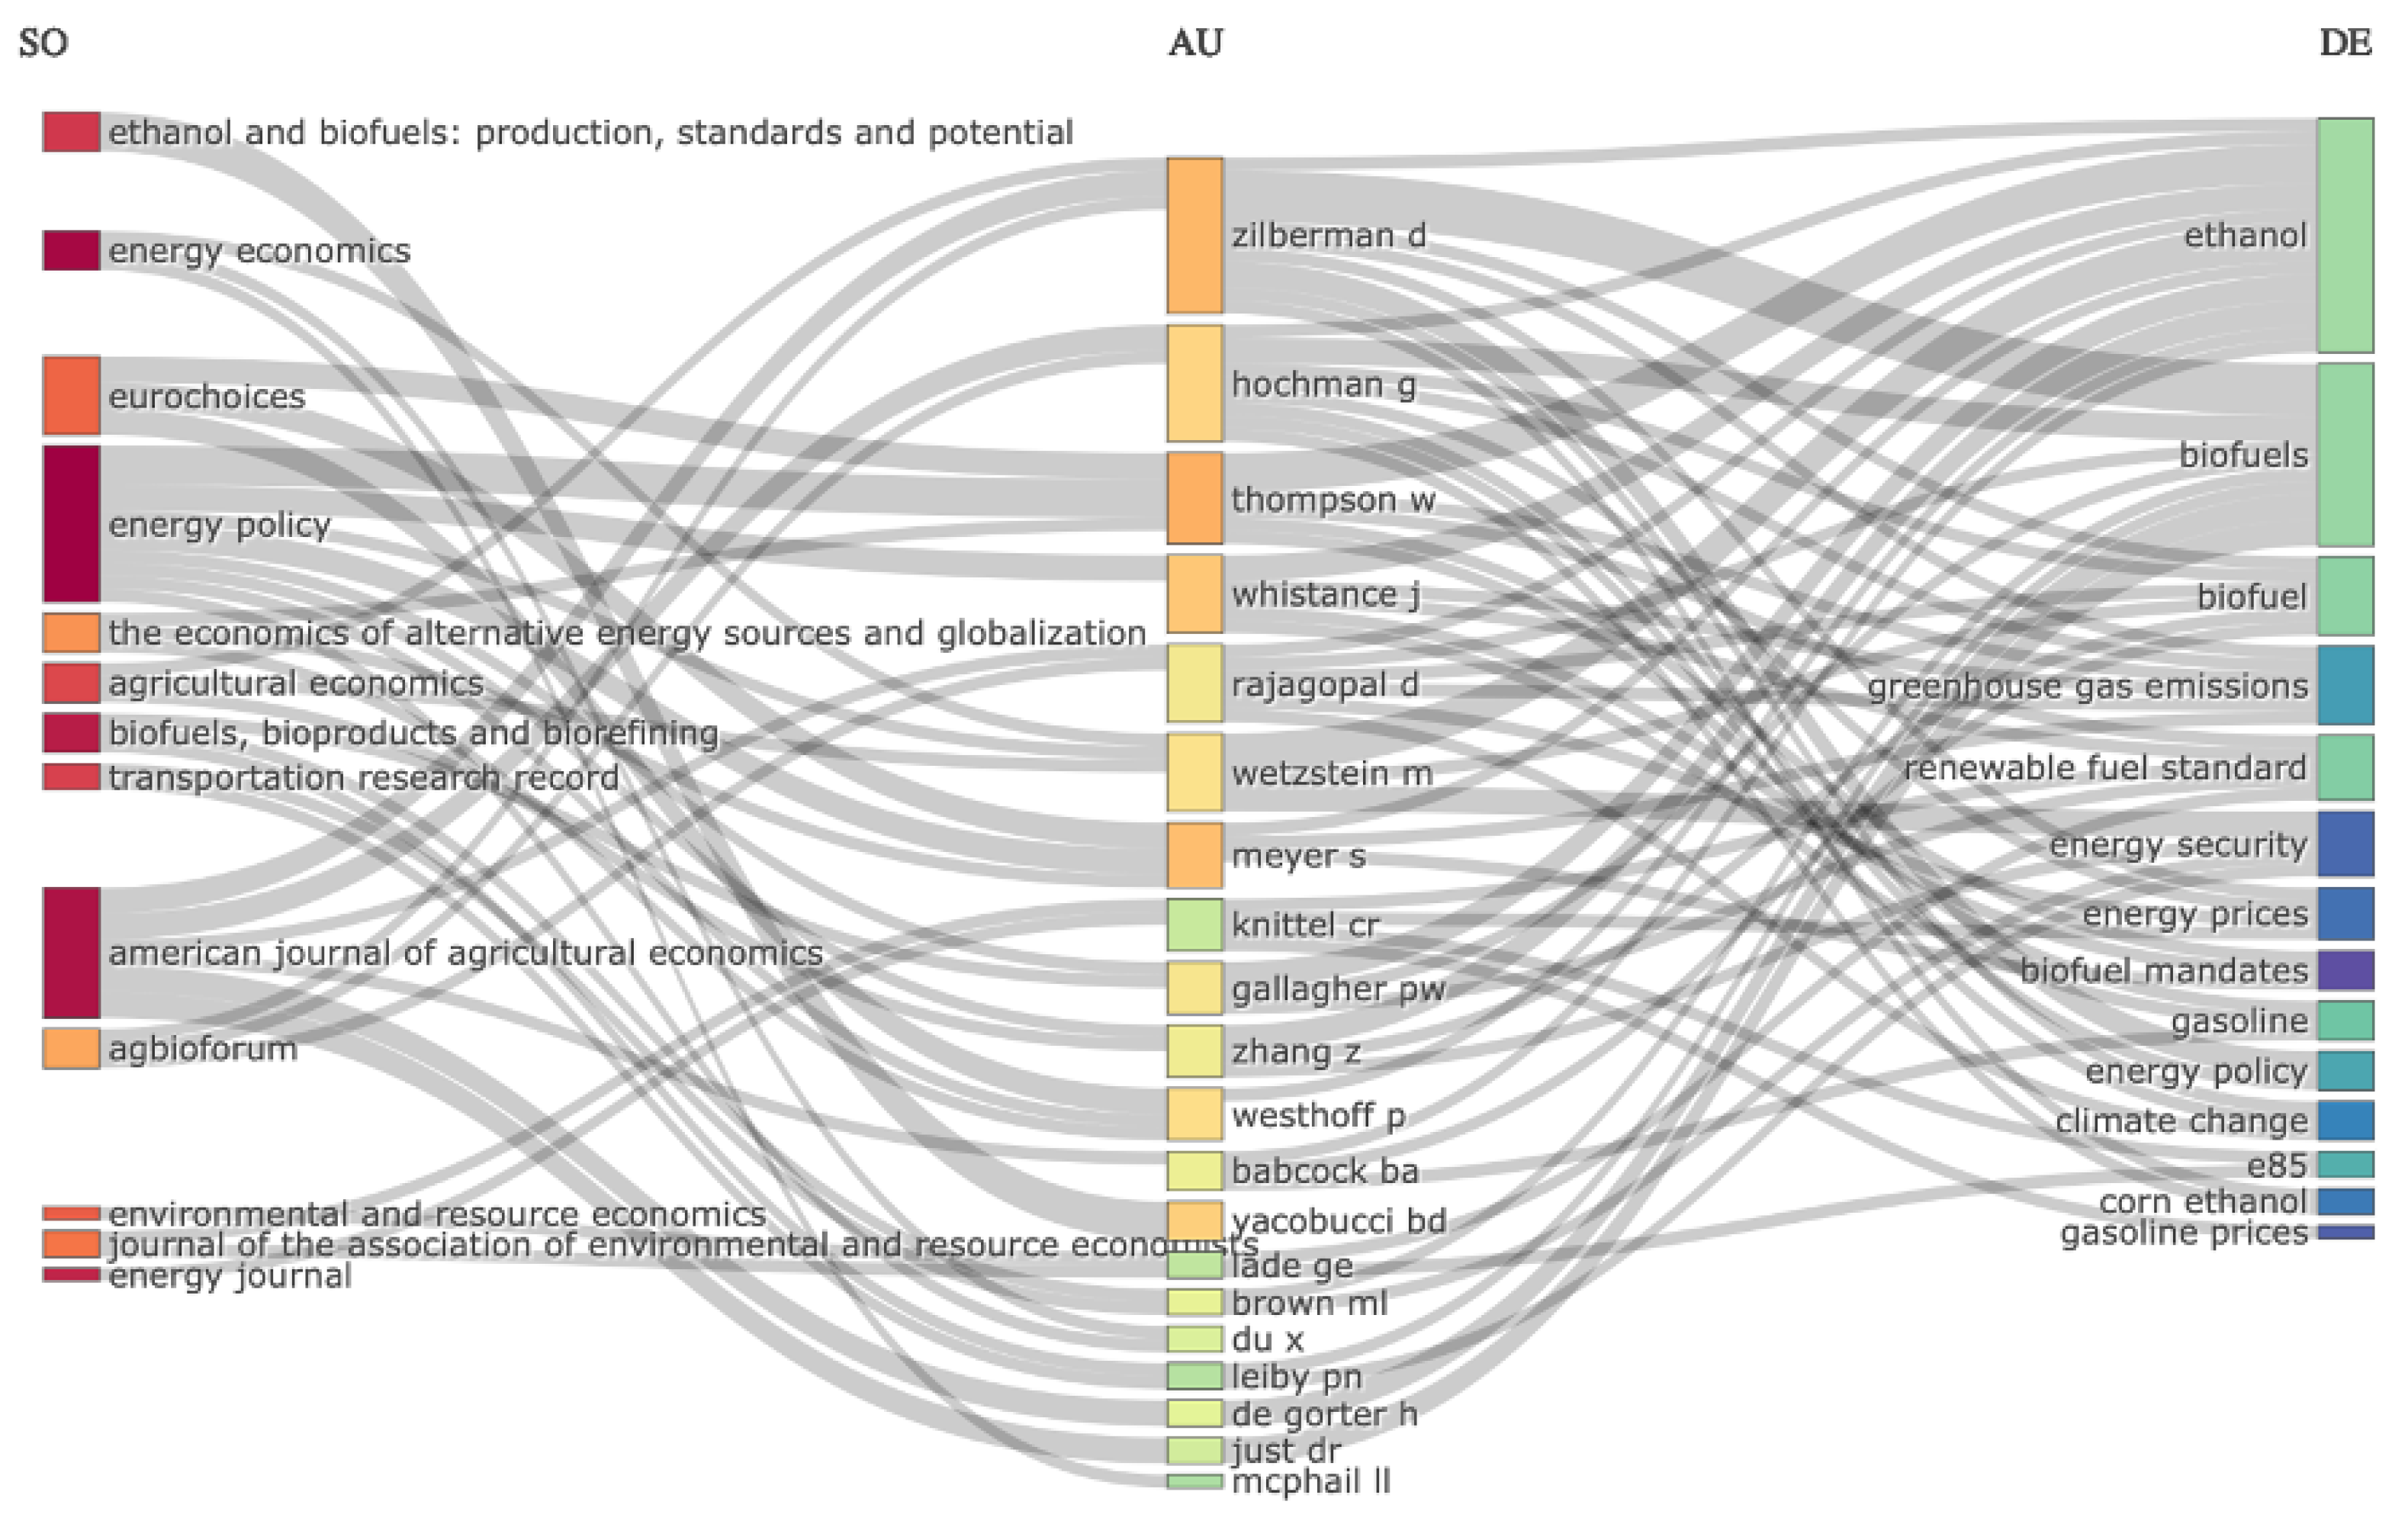
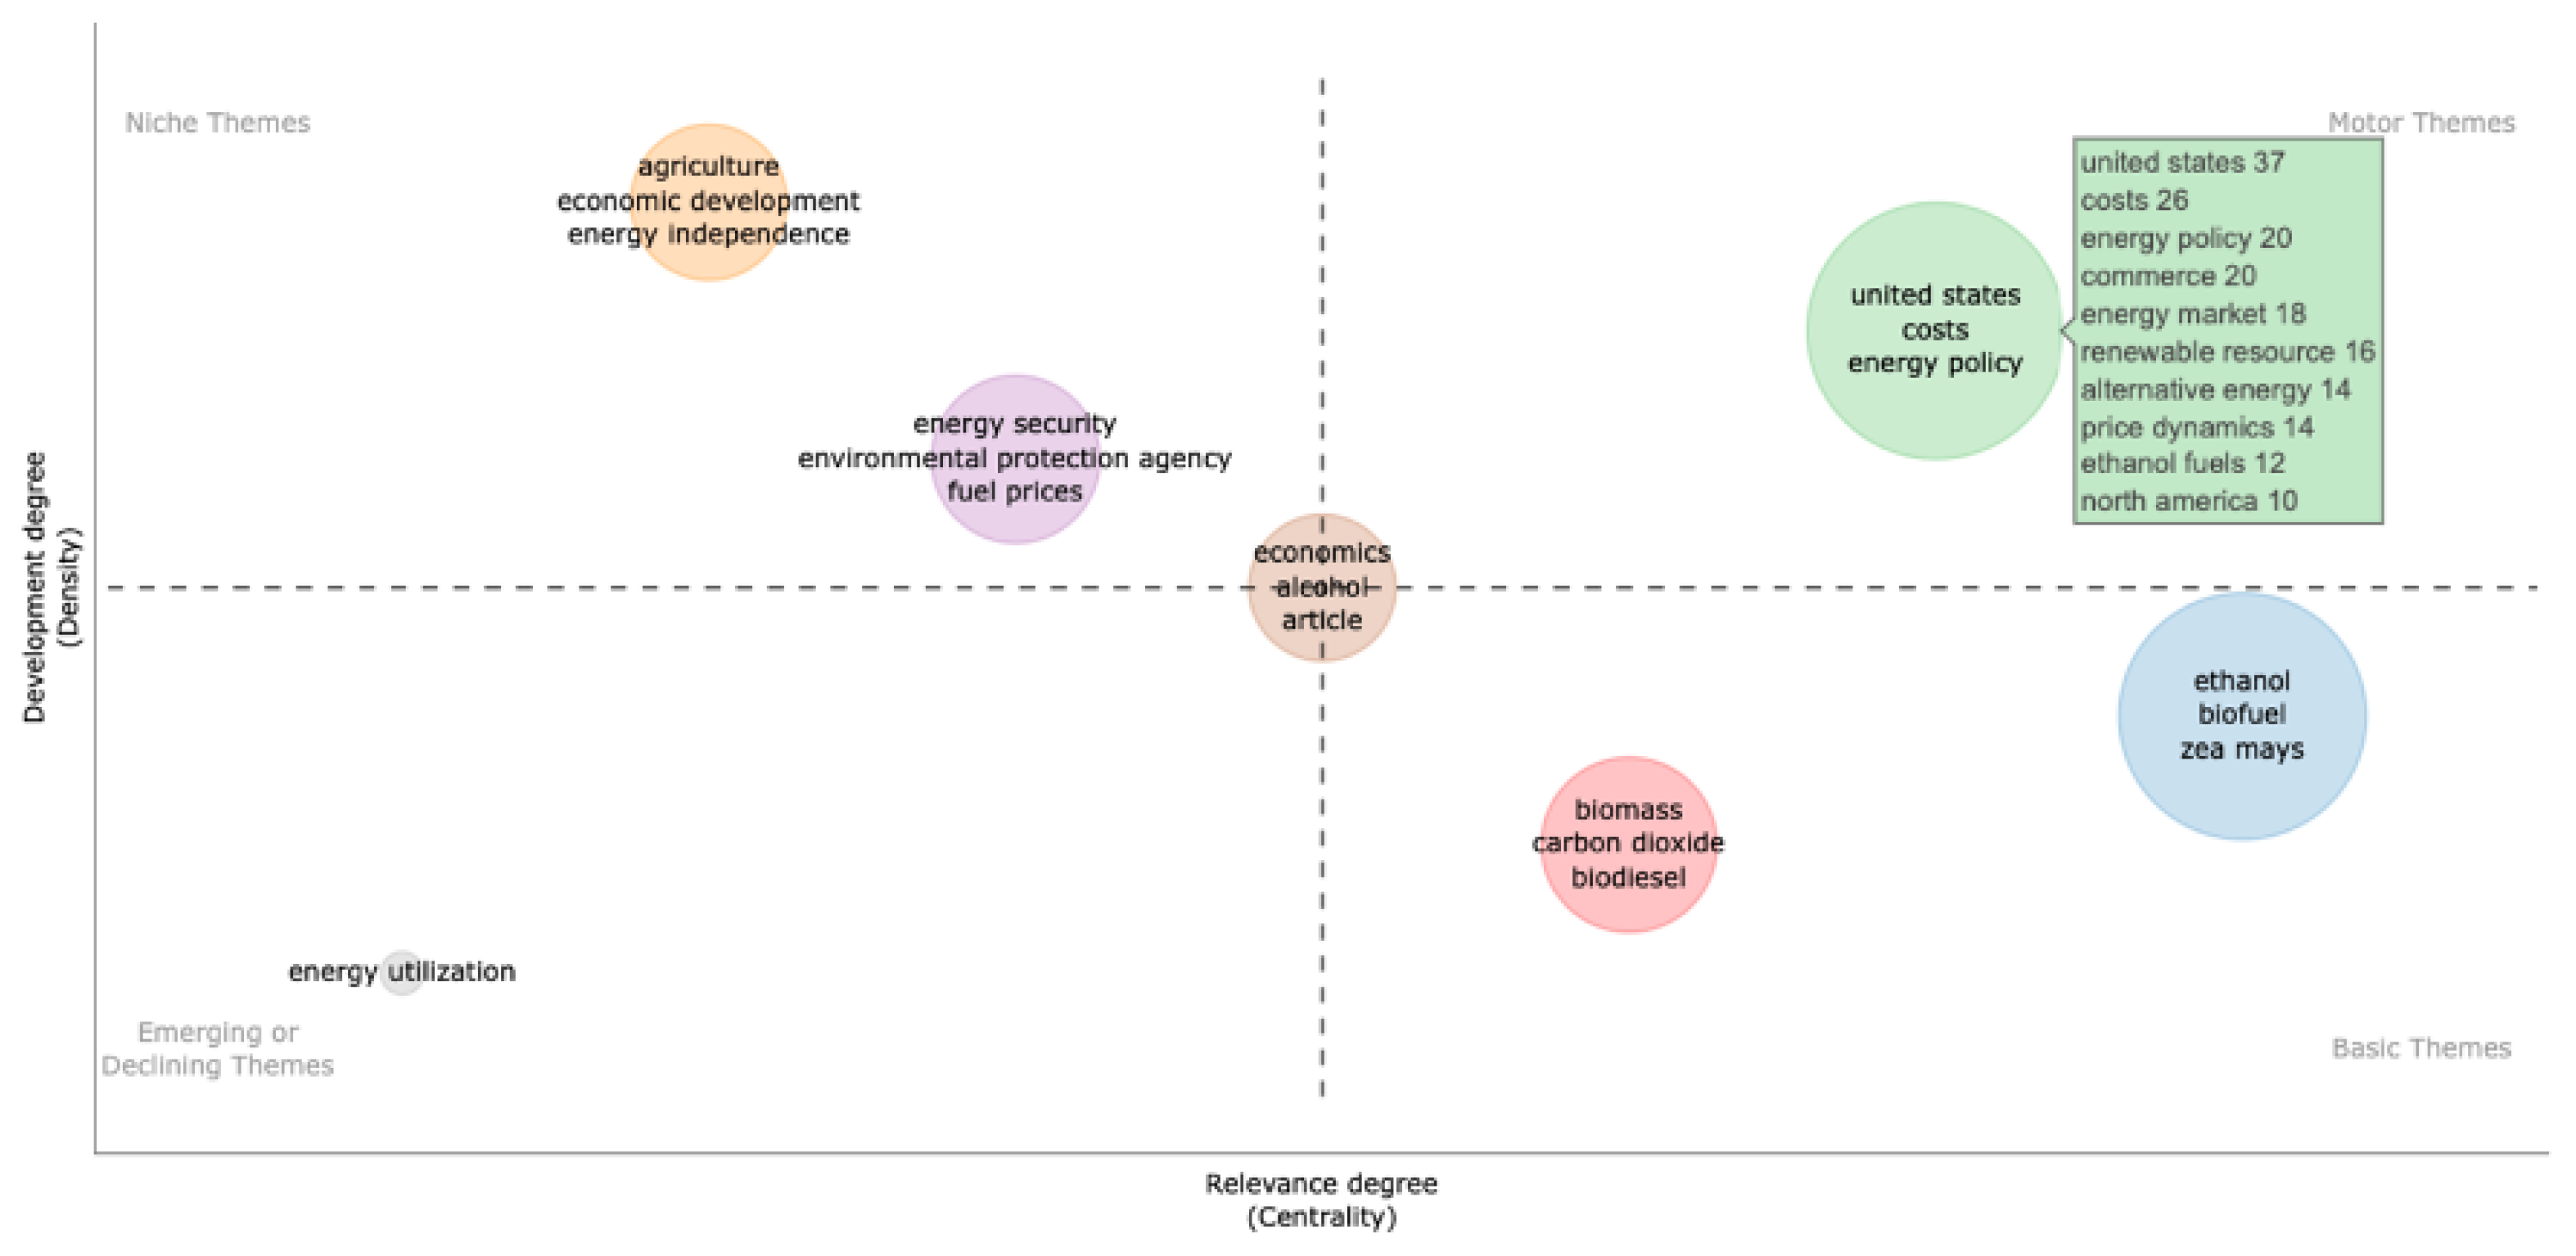
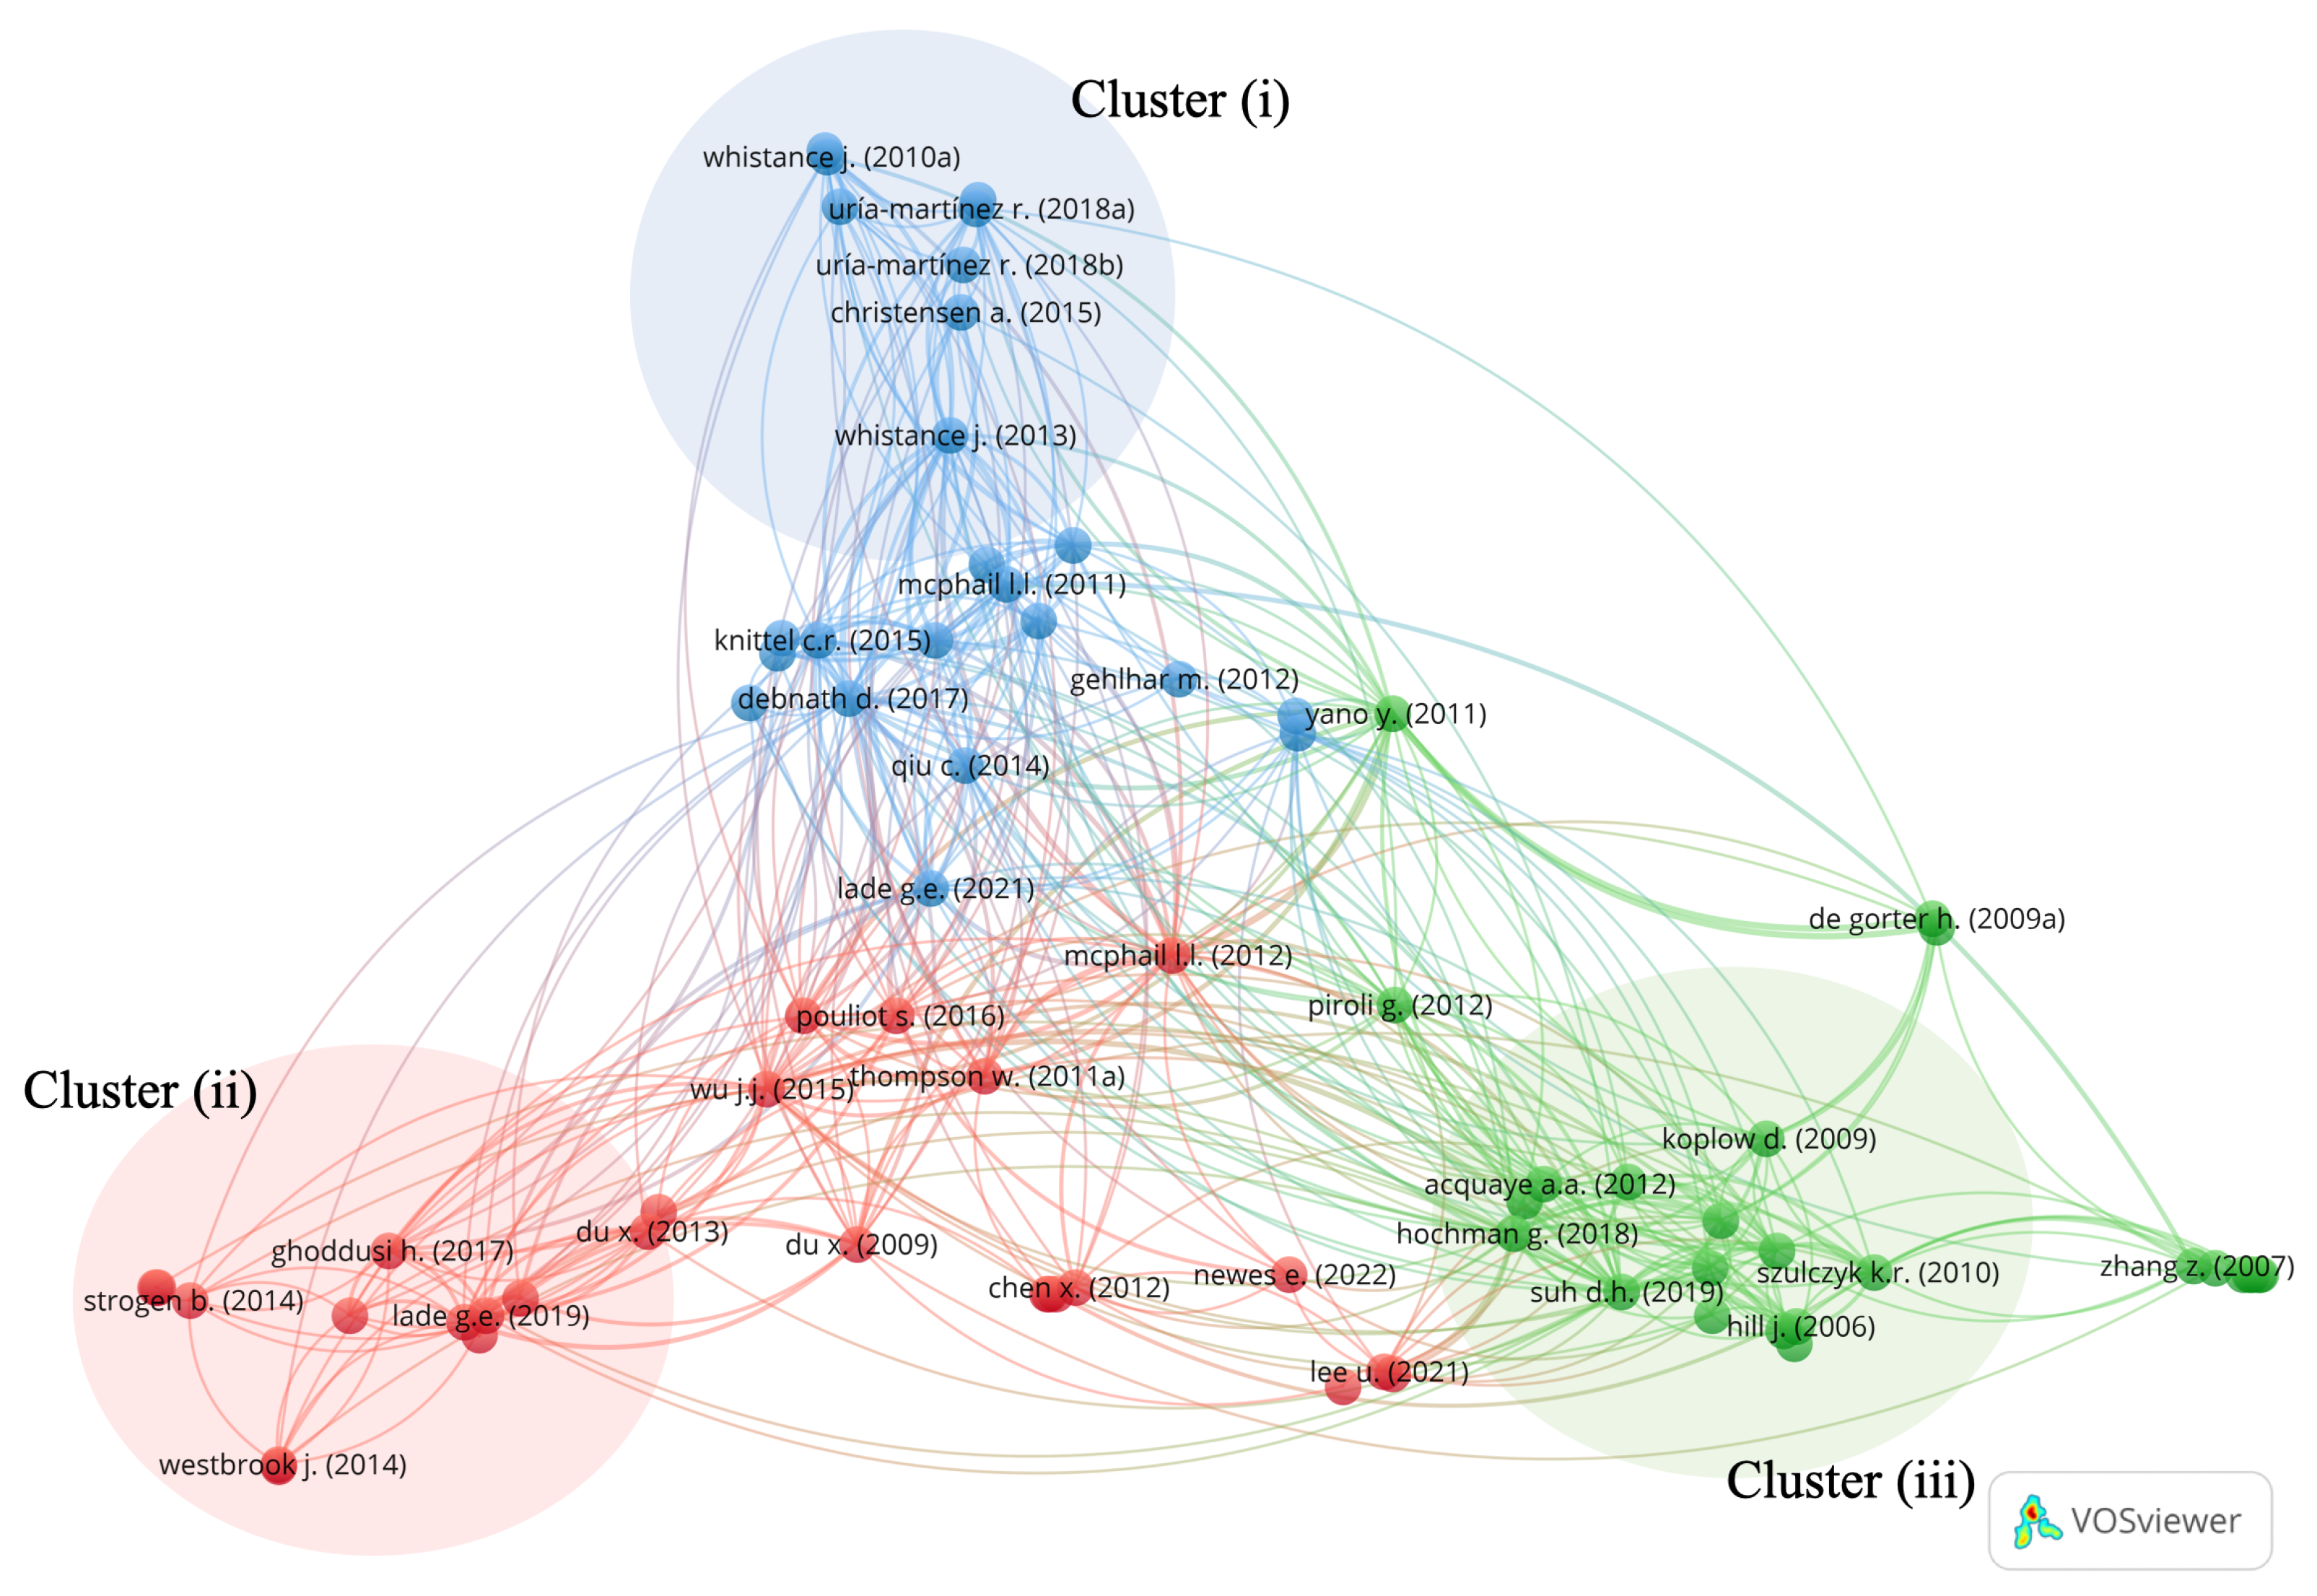
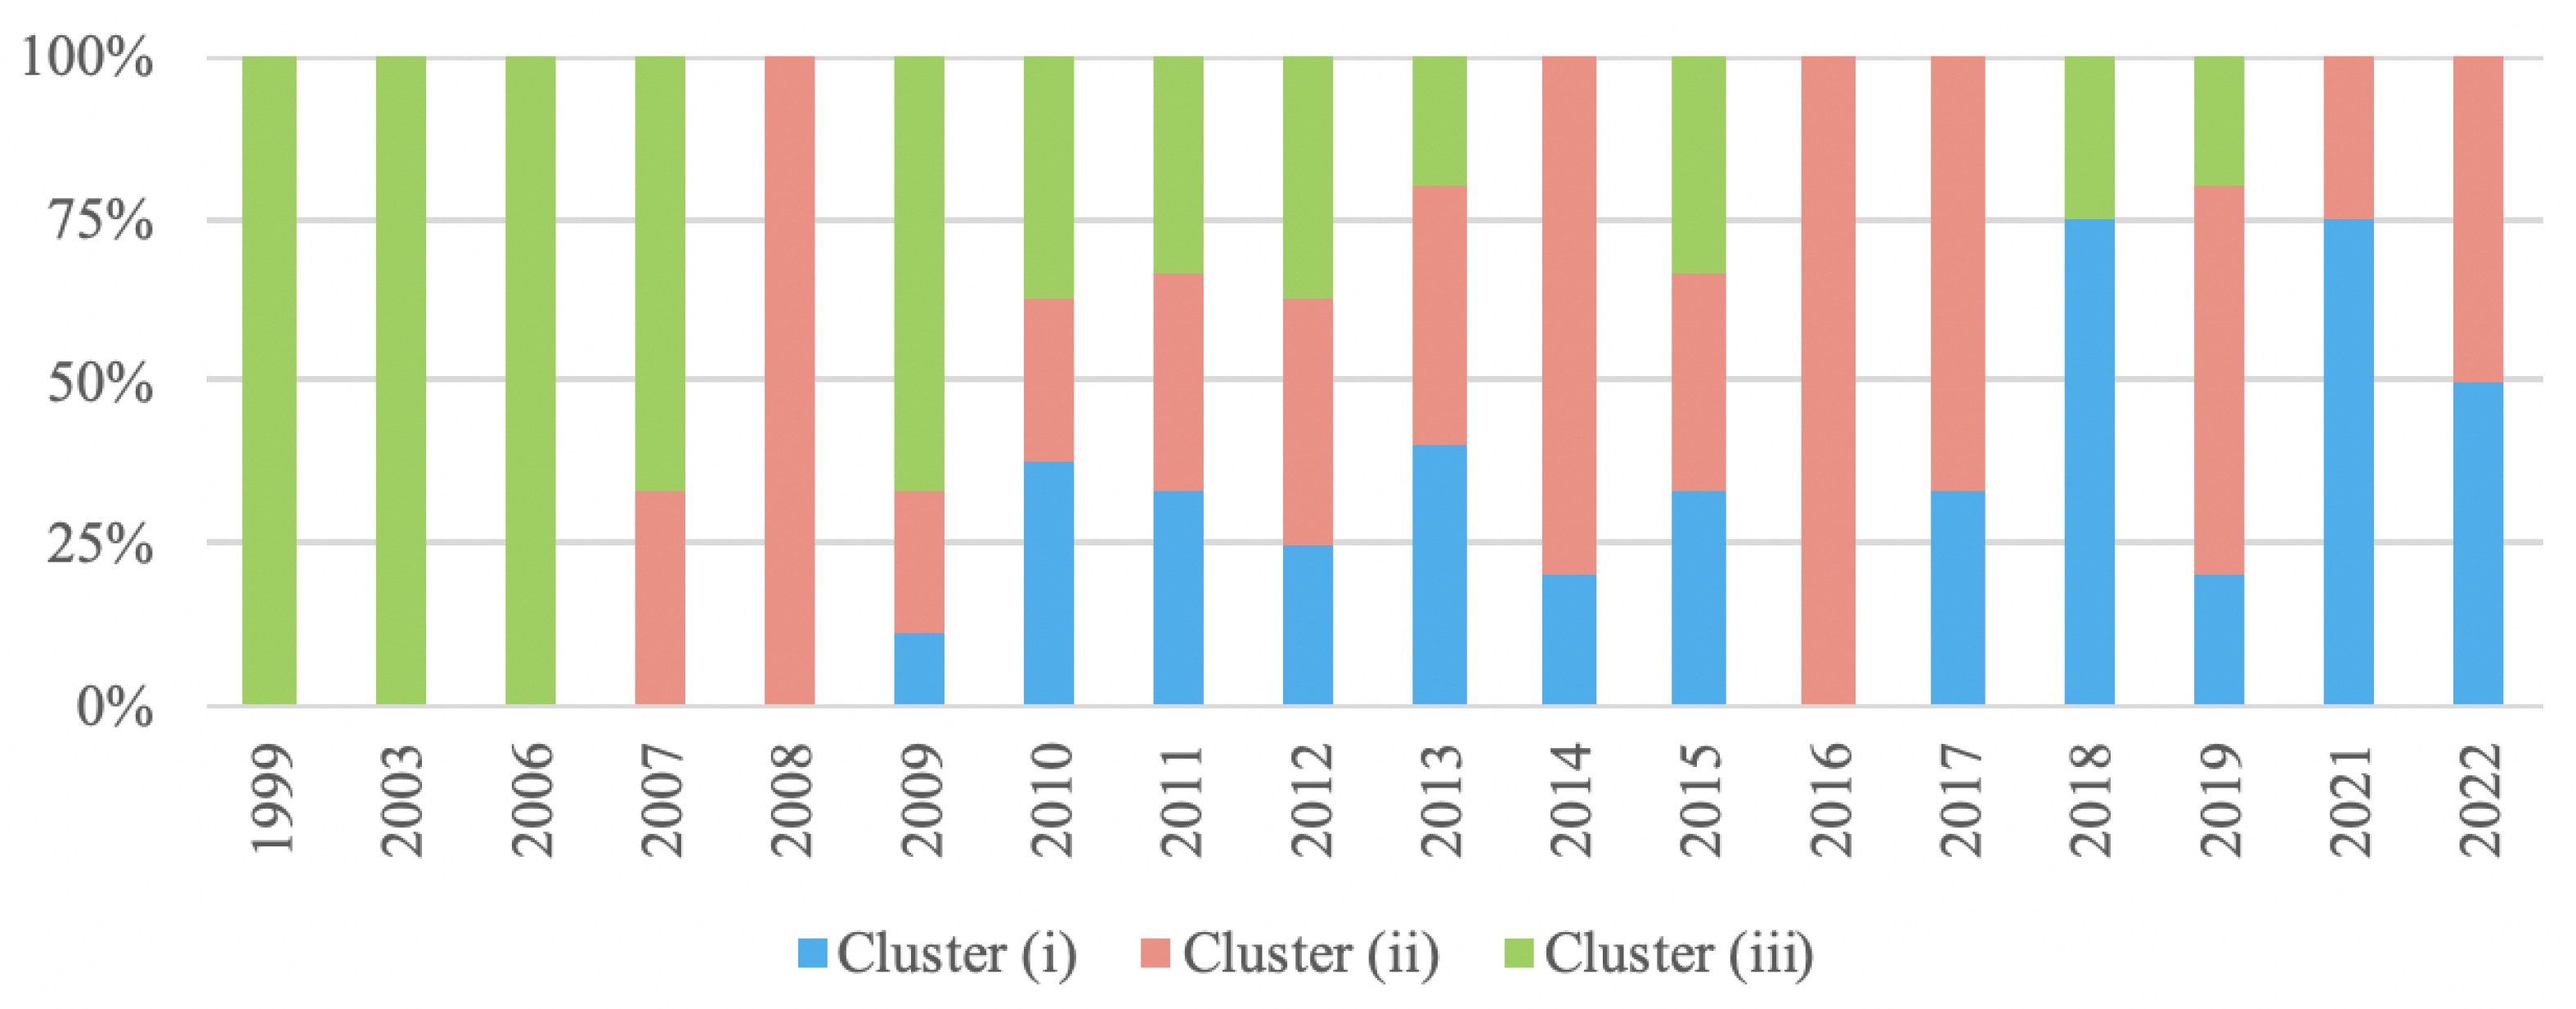
3.2. Predominant Cluster Structure

In order to answer RQ2 (what are the main article clusters identified in the evaluated literature?), content analysis and mapping and clustering techniques were used, as they are frequently used in SLR studies [41,42].
Through the use of clustering techniques, it is possible to present a map that highlights areas corresponding to the clusters of nodes identified. Using VOSviewer software, we calculated a bibliographic coupling network (for more, see [41]), whose graphical results are shown in Figure 13. In this analysis, the relationship between studies was determined based on the degree to which these articles are cited in the same publication.
Upon establishing the clusters, we analyzed the content of the articles and focused on the title, abstract, introduction, and conclusion. This analysis aims to identify common interests and themes, from which the following predominant clusters were identified:
  • Impacts of biofuels on commodity prices and overall price dynamics;
  • Impacts of public policies on the implementation of ethanol and flexibility in the formulation of fuel blending;
  • Impact of biofuels on environmental aspects.
It is important to note that, as the clustering technique was elaborated from the use of coincidental references, articles located in the transition region between the main clusters can be dedicated to evaluating themes inherent to more than one cluster.

3.2.1. Impacts of Biofuels on Commodity Prices and Overall Price Dynamics

Among the authors of the first cluster, those of [43] considered the North American scenario and evaluated how the increase in corn-ethanol production impacts natural gas prices. The authors presented a two-stage least squares structural model for projecting two scenarios: (i) current policies, including tariffs, tax credits, and mandates, were disregarded; (ii) established the production of ethanol only for the use of mandatory additives. The results indicate that the price of natural gas can be increased by up to 0.25% and 0.5% for the first and second scenarios, respectively.
In another study, Whistance et al. [44] analyzed the effects of the ethanol policy on the prices and quantity of natural gas, especially focusing on the impacts of the ethanol tariff, mandates, and tax credits. The results indicated an increase in corn production, which will consequently tend to raise natural gas prices.
Zilberman et al. [12] investigated the relationship between food and fuel markets. According to the authors, the ethanol market provides a strong link between the corn and energy markets, and the price of ethanol increases as corn and gasoline prices increase. Finally, the study concludes that ethanol prices are positively related to sugar and oil prices.
Whistance and Thompson [45] also analyzed the price relationship between ethanol and that between gasoline and between corn and gasoline in the scenarios of a mandatory and non-mandatory RFS. The authors found evidence that price relationships are weaker when RFS is mandatory.
Another example of a study that makes up this cluster is that of [46], which assesses the impacts on fuel prices and compliance costs associated with the RFS. In this article, a regional market model is proposed to quantify the impacts of prices for several market variables. Among the results, Christensen and Siddiqui [46] identified that the RFS does not have a substantial impact on the retail prices of gasoline and diesel.

3.2.2. Impact of Public Policies for the Implementation of Ethanol and Flexibility in the Formulation of Fuel Blending

Based on the second cluster identified, Liu and Greene [47] argues that a good understanding of the factors that affect demand for E85 is needed in order to develop effective policies for promoting E85 and to develop models that predict sales of this product in the U.S. In this way, the authors estimated the sensitivity of aggregate demand for E85 to the prices of E85 and gasoline, and the relative availability of E85 versus gasoline, and concluded that the latest data allow for a better estimation of demand and indicate that the price elasticity of E85 is substantially higher than previously estimated.
Lade and Bushnell [48] studied the pass-through of the E85 subsidy to U.S. retail fuel prices. The authors argued that the RFS relies on taxes and subsidies to be passed on to consumers to stimulate demand for biofuels and decrease demand for gasoline and diesel. They concluded that between 50% and 75% of the E85 subsidy was passed on to consumers and that the pass-through takes approximately 6 to 8 weeks, with retailers’ market structure influencing both the speed and level of pass-through.
Ghoddusi [49], through a quantitative assessment, measured the risks of price changes for biofuel producers in a deregulated market. The authors presented a set of risk management strategies that are fully applicable to the protection of the biofuels sector.
From a different perspective, Westbrook et al. [50] assessed whether the U.S. is able to meet the RFS targets without an enforcement mechanism. The authors proposed a parametric analysis of ethanol use for the domestic vehicle sector. The results indicate that the RFS program’s goals to reduce fossil-fuel consumption, and consequently, GHG emissions, can be achieved by improving vehicle efficiency.

3.2.3. Impact of Biofuels on Environmental Aspects

Allocated to the third cluster, Sexton et al. [51] analyzed the impacts of increased production of biofuels on food and fuel markets. They argue that the current production of biofuels generates a conflicting relationship between food and fuel, as it generates an increase in the cost of food and a reduction in the cost of gasoline. In this way, the study concludes that agriculture has to provide food and fuel, generating a need for constant improvement in its productivity. They argue that biotechnology has a fundamental role in allowing the achievement of this improvement.
Acquaye et al. [52] used four scenarios to analyze the potential of biofuels to reduce UK emissions. The authors used a hybrid lifecycle assessment developed in a multi-regional input–output (MRIO) framework and concluded that in order to achieve the emission reduction determined by the Low Carbon Transition Plan (LCTP), it would be necessary that 23.8% of the transport fuel market would be served by biofuels by the year 2020.
Piroli et al. [53] applied a time-series analysis for the five main agricultural commodities, the cultivated area, and the price of crude oil in order to study the impacts of changes in land use caused by the production of biofuels in the US. The authors conclude that the markets for crude oil and cultivated agricultural land are interdependent. Apart from that, the authors claim that the increase in biofuel production causes changes in land use, which subsequently causes food commodities to be replaced by crops intended for biofuel production.
More recently, Suh [54] examined the effects of replacing fossil fuels with biofuels on carbon dioxide emissions in the U.S. transportation sector. The author proposes that ethanol is a substitute for oil and a complement to natural gas, while natural gas is a substitute for oil. Furthermore, the author concludes that the price-induced substitution of fossil fuels for biofuels is a critical factor in predicting biofuel-related carbon-dioxide emissions.

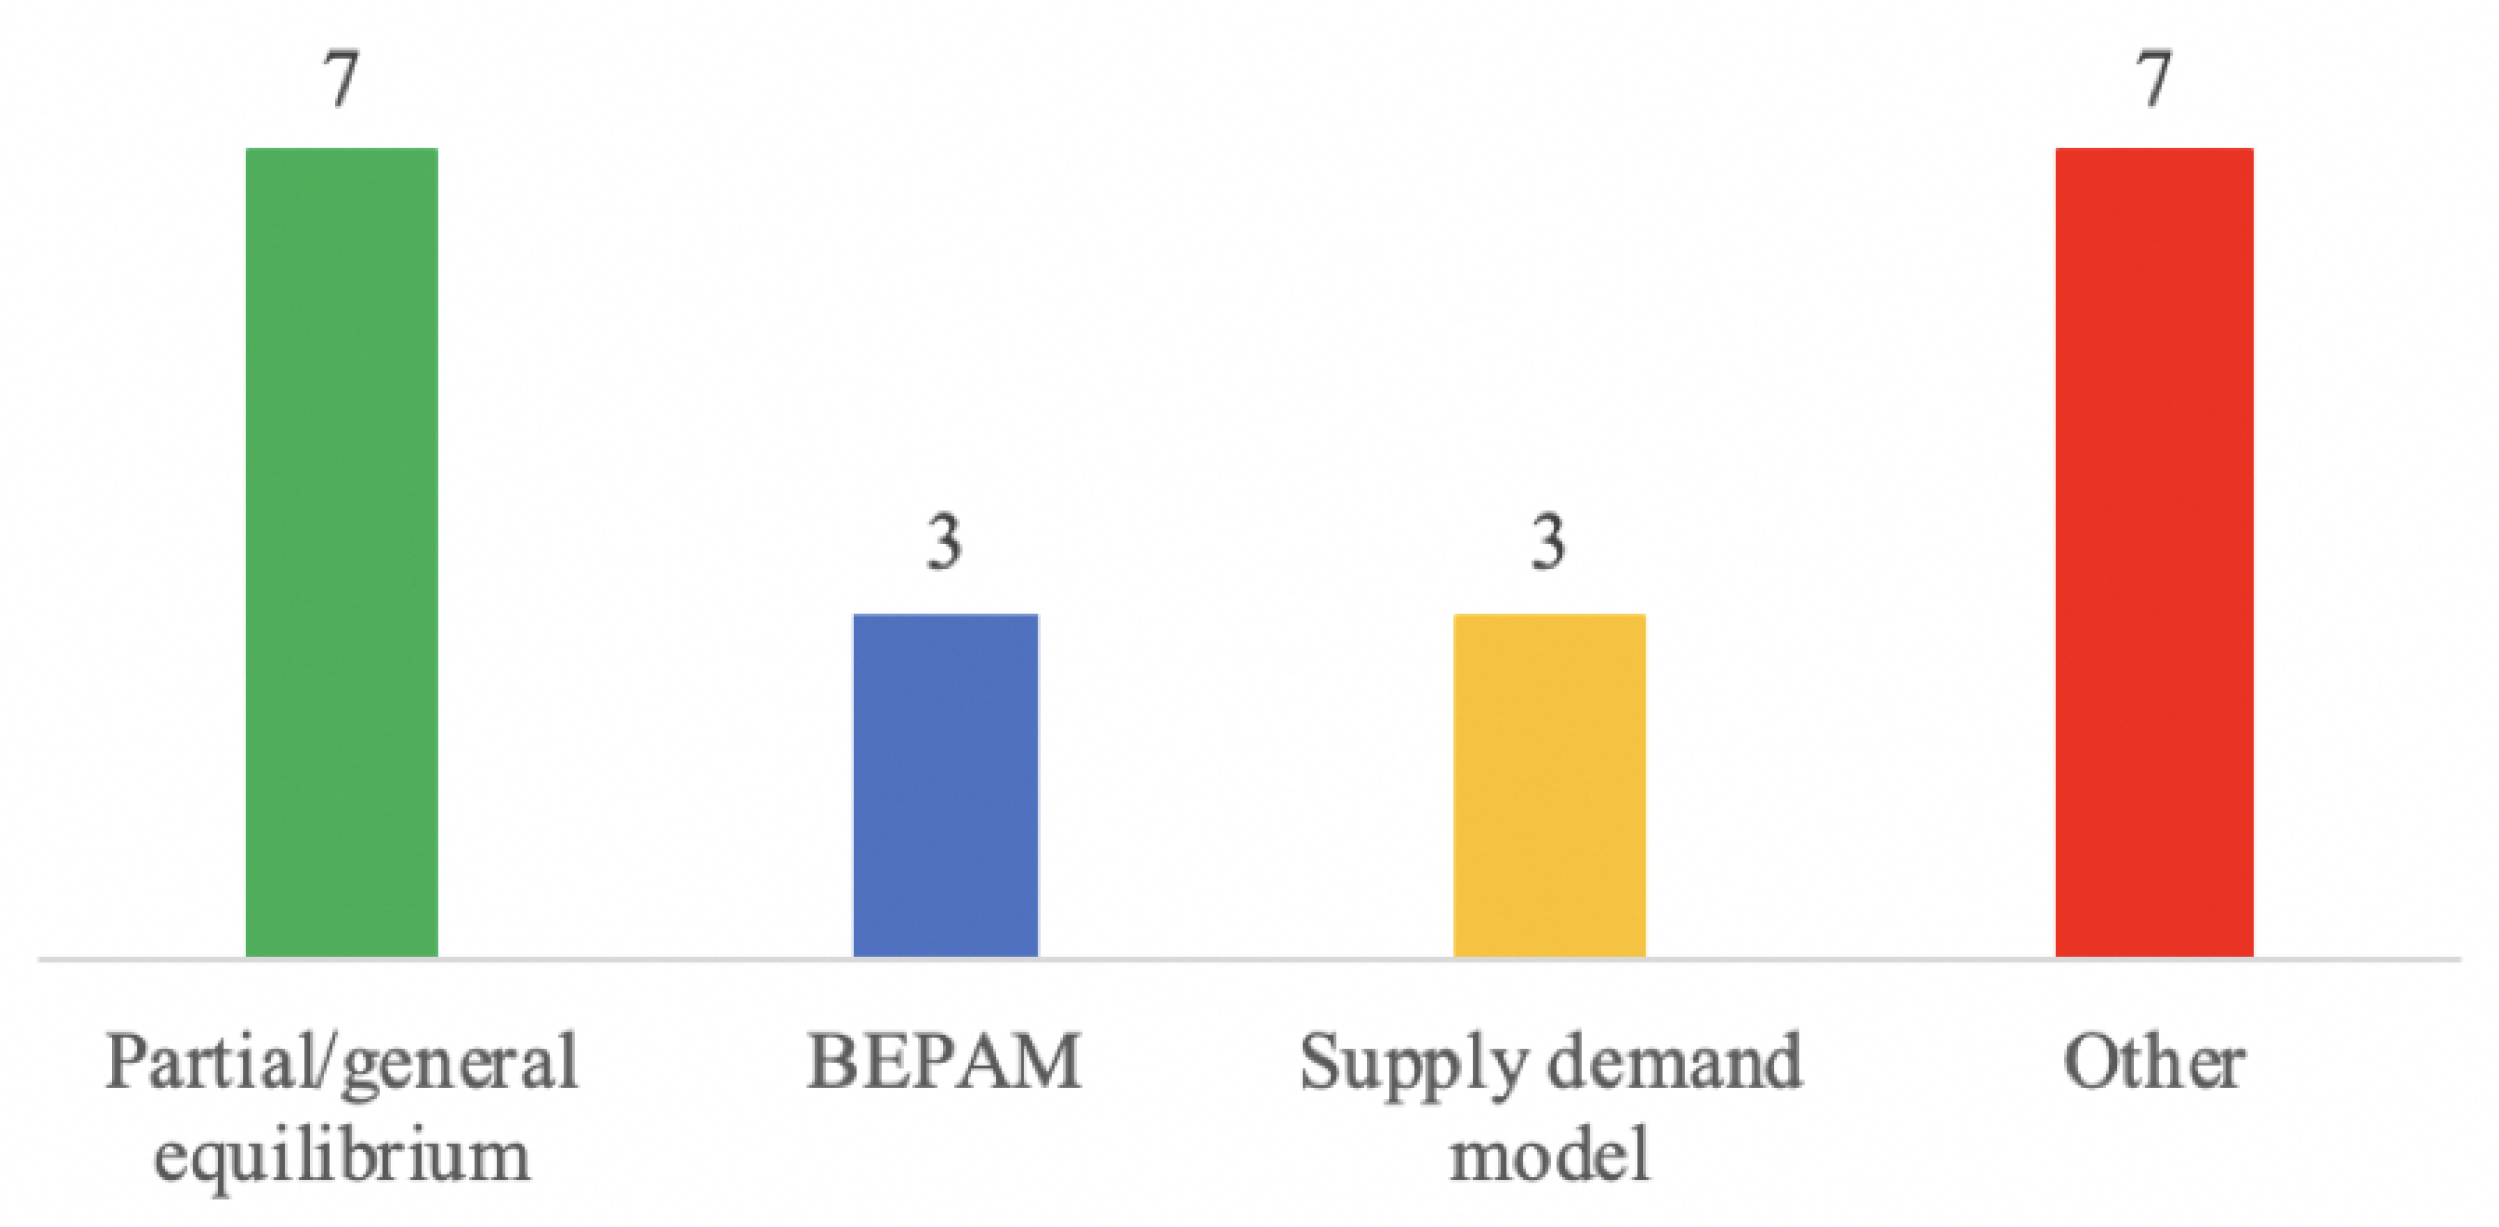
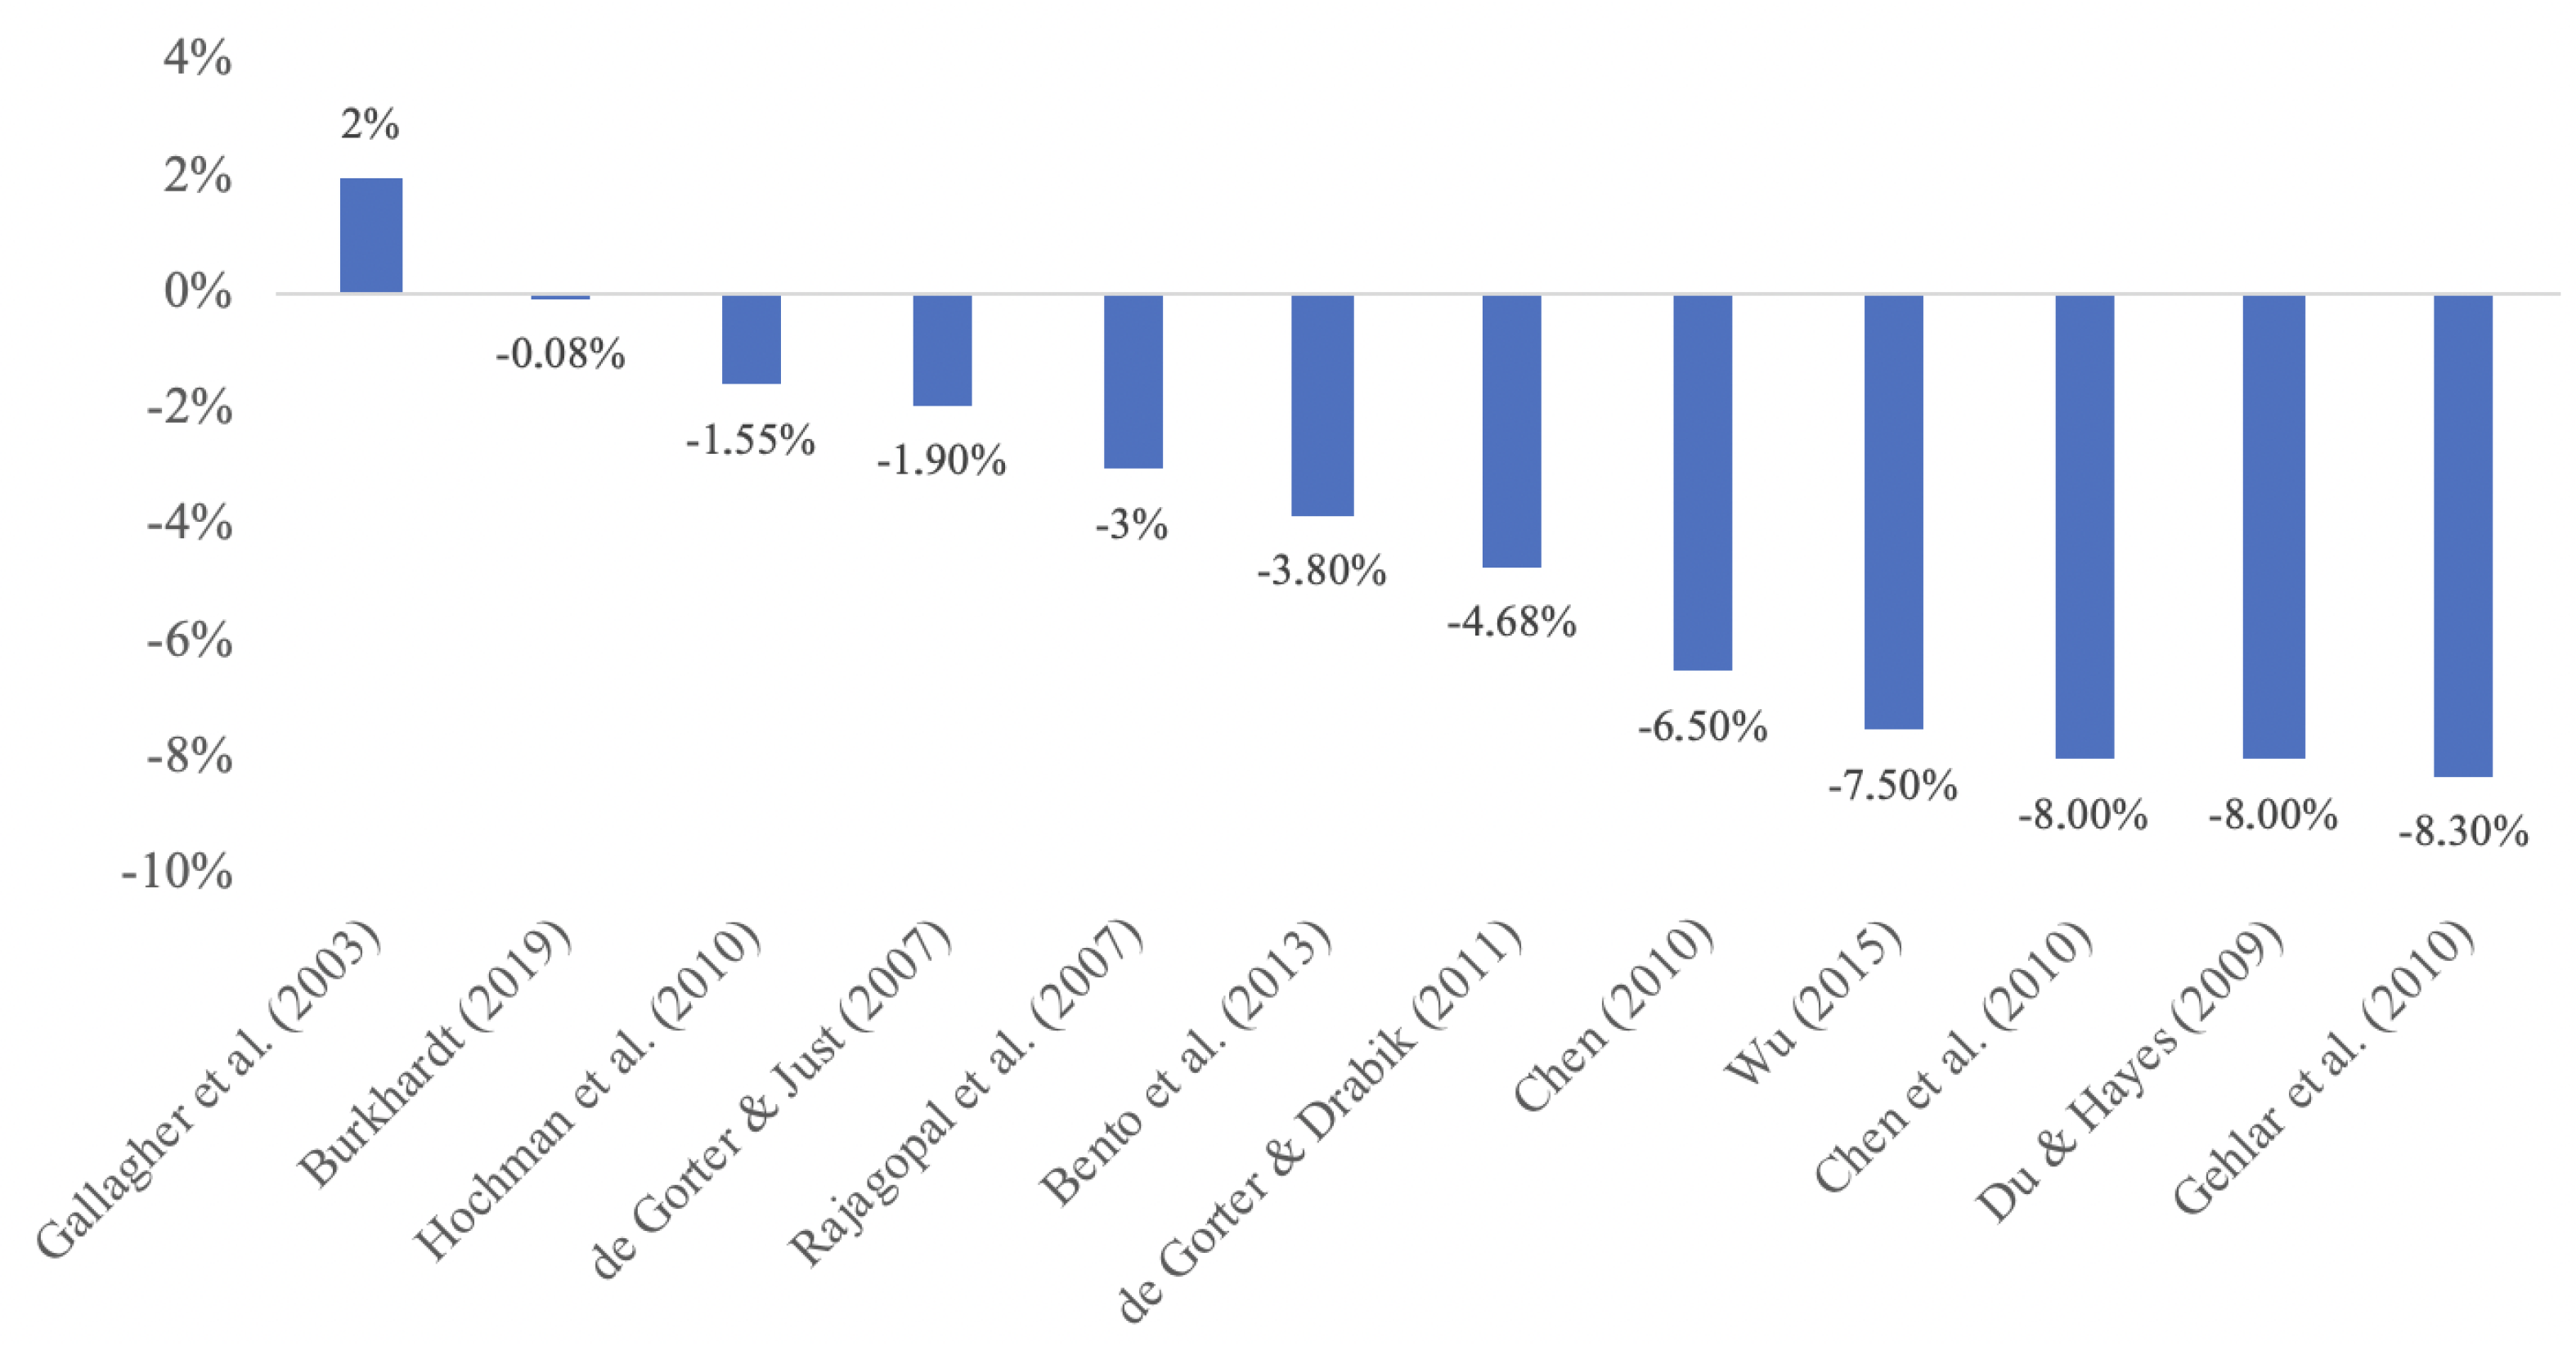
3.3. Numerical Estimates

We now turn to our sample to analyze numerical estimates of changes in gasoline prices caused by changes, or rather a lack of changes, to ethanol mandates. We extracted 20 articles that provide numerical results that relate to our research question. After the initial inspection, we noticed many of the articles included in our sample are also included in the meta-analysis article by [19]. Consequently, we have decided to include four missing articles that were not a part of our sample but were included in [19] to further our understanding of the numerical interpretation of the results. It is important to highlight that these four studies are relevant and recognized for the field of research, but they were not identified in the search due to the fact that they were not present in the Scopus database.
First, we briefly discuss the approach, methodologies and models that were used in the aforementioned articles. Figure 14 shows the most frequent models used. The most popular are general and partial equilibrium models, biofuel and environmental policy analysis models (BEPAM), and supply–demand models.
When it comes to the policies that affect the price of gasoline, the articles mostly use the Volumetric Ethanol Excise Tax Credit (VEETC) created by the American Jobs Creation Act of 2004 and the Renewable Fuel Standard for corn ethanol established in 2007 as the driver of the change in the price of gasoline. Some studies, such as [55], inspected many possible outcomes based on different scenarios where either there are no mandates in place for the baseline price or where VEETC or RFS or their combination are introduced, changing the outcome by 1–2 percentage points. Some other articles, such as [56], took into account only the RFS ethanol mandate and its impact on gasoline prices.
Overall, we managed to identify 13 papers that provide us with exact numerical results for the answer to our research question RQ3 (what was the numerical impact of VEETC/RFS mandate on the price of gasoline and what are the main methodologies used for calculation in the literature). Detailed information about the papers in our sample coming from SCOPUS database is summarized in Table 1, and Table 2 presents the four papers not included in the SCOPUS database.
The prevailing result is that the addition of ethanol cuts down the price of gasoline at the pump. However, there is no direct consensus on the discount being provided, not even in proportional expression. The estimates vary from no effect up to an almost 10% discount in the gasoline price, as shown in Figure 15.

3.4. Research Agenda

To answer RQ4 (what are the main trends and research opportunities for this literature?), we propose a possible open research agenda based on the results of our SLR. We notice that the term bioethanol has been present in the analyzed sample since 2012, remaining until now, especially when associated with the use of the terms “commerce” and “energy market”, which shows that this type of study is still interesting to the current research. Corroborating this statement, Figure 10 (thematic map) presented the driving themes of the studied area, which include, in addition to the terms “commerce” and “energy market” already mentioned, “costs”, “energy policy”, “price dynamics”, and “renewable resource”. In this way, it is possible to mention some research topics that have been little explored and that have started to draw attention more recently, standing out as hot topics for future research. It is possible to propose the development of research focused on advanced biofuels, biofuels supply chains, transportation biofuels, and issues of budget control and cost management, both in production and in the management of the biofuels supply chain. Additionally, an analysis of the thematic evolution allows the identification of research opportunities that involve the control of greenhouse gas emissions, and other environmental and climatic aspects.
Still discussing research trends, Figure 11 (keyword co-occurrence map) corroborates previous discussions and opens horizons for new research opportunities on retail fuel spreads and on the e85 composition.
Moreover, Figure 12 (conceptual structure map) points out opportunities for research in public policies related to climatic and environmental issues, and energy security. Topics such as sustainable development, price dynamics, blending, demand analysis and biofuel production have greater centrality—that is, they tend to continue to be study opportunities.
A clear possible research opportunity of filling a noticeable and perspective gap in the literature is indicated by what is rather missing in the keywords discovered by our search. It is an issue of electro-mobility. The analysis of interplay between biofuels and electrical vehicles should belong to the “environmental”, cluster 3 in Figure 13. As we already noted, this “environmental” cluster temporarily precedes the other two clusters. This expresses the shifting emphasis from the beliefs on the strong positive environmental impact of biofuels to a rather skeptical evaluation of this impact of biofuels. Additionally, the missing connection between biofuels and electric cars is caused by a fact that the focus on electric cars is rather a recent phenomenon, not overlapping in time with the early biofuel literature assembled in cluster 3 in Figure 13. However, the research questions of possible synergies in combination of advantages of renewable biofuels provided by agriculture and advantages of electric cars definitely deserve research attention.
Another interesting research opportunity indicated by missing connections in our bibliometric figures is an issue of bioethanol as a dominant technological fuel additive. While technologically oriented literature clearly shows that ethanol is a dominant gasoline oxygenate, there is still missing (not written so far) a potentially sizeable body of literature dealing with the question of what is the technological and economical lower bound on the share of ethanol in the U.S. car fuels if the ethanol would be used mainly as an oxygenate.
Finally, Figure 16 shows the evolution of the representativeness of each cluster over time. We note that at the beginning of the research on the subject, the most influential cluster was the one that addressed the impact of biofuels on environmental aspects (cluster (iii)). However, this scenario has changed, and the figure makes it possible to identify that studies that assess the impacts of biofuels on commodity prices and overall price dynamics (cluster (i)) have been of greatest recent interest, followed by the assessment of the impacts of public policies on the implementation of ethanol and flexibility in the formulation of fuel blending (cluster (ii)). In this way, the topics associated with clusters (i) and (ii) will represent the greatest opportunities for future research.

4. Conclusions

This article proposes a review of the state-of-the-art of the literature regarding the contributions of ethanol to retail gasoline price changes in the US. For this, we conducted a systematic literature review which follows guidelines from the literature. We extracted a sample of 109 articles and analyzed it using bibliometric quantitative techniques associated with qualitative content analysis. The novelty of this article is evident, since no systematic literature review with the objective of evaluating the impact of ethanol on the retail price of gasoline was identified.
At first, a characterization of the sample was presented through bibliometric techniques, allowing the identification of trends in the explored topic. Furthermore, thematic, conceptual, and co-occurrence maps were constructed and analyzed, in which topics such as energy policy, costs, price dynamics, commerce, and energy market stand out. Additionally, the most significant terms recently have been “retail fuel spreads”, “fuel markets”, “E85”, and even “energy prices” and “meta-analysis”.
Second, considering the selected sample and based on grouping techniques, the predominant cluster structures were identified and briefly analyzed, which led to three lines of research: (i) impacts of biofuels on commodity prices and overall price dynamics; (ii) impacts of public policies on the implementation of ethanol and flexibility in the formulation of fuel blending; and (iii) impact of biofuels on environmental aspects. The definitions of these clusters are not given a priori, neither in the specific literature, nor even through the use of software, demanding an in-depth analysis of the articles present in the sample.
Third, the general and partial equilibrium model stood out in the sample as the most used to capture changes in gasoline prices caused by changes in ethanol mandates. There is no consensus on the impact of ethanol on the price of gasoline in the US retail market; however, the most frequent results show that the addition of alcohol reduces the price of gasoline at the pump.
In a fourth moment, we show that currently, the topic concerning the impacts of biofuels on commodity prices and overall price dynamics is the most relevant and trending avenue of research suggested by the analysis of our sample of publications.
Finally, the limitations of the present study involved methodological choices, such as: (1) only one database for extracting articles and (2) the definition of search strings that could exclude works relevant to the study. These limitations were minimized by the following strategies: (1) by choosing the largest database of academic works in the world (Web of Science), and (2) using many attempts to adapt the search strings to the most relevant works for the studied topic. Another limitation is related to the inclusion and exclusion criteria of each article to form the final sample, which we sought to mitigate with the participation of four different researchers.

Author Contributions

Conceptualization, K.J. and D.Z.; methodology, P.R.J., L.C.S.R. and B.S.; software, P.R.J. and L.C.S.R.; validation, K.J., E.M., P.R.J. and L.C.S.R.; formal analysis, P.R.J., L.C.S.R. and B.S.; investigation, P.R.J., L.C.S.R. and B.S.; resources, K.J., P.R.J., L.C.S.R. and B.S.; data curation, P.R.J., L.C.S.R. and B.S.; writing—original draft preparation, P.R.J., L.C.S.R. and B.S.; writing—review and editing, K.J., P.R.J. and L.C.S.R.; visualization, K.J., E.M., P.R.J., L.C.S.R. and D.Z.; supervision, K.J., D.Z. and P.R.J.; project administration, K.J. and D.Z.; funding acquisition, K.J., E.M., P.R.J. and L.C.S.R. All authors have read and agreed to the published version of the manuscript.

Funding

This paper is part of a project GEOCEP that has received funding from the European Union’s Horizon 2020 research and innovation programme under the Marie Sklodowska–Curie grant agreement no. 870245. The research leading to these results was financially supported by the Czech Science Foundation (grant number 19-26812X) and the Internal project of Czech Technical University (VUT FP-S-22-7977). For financial support and research incentive, P.R.J. and L.C.S.R would like to thank the Brazilian National Council for Scientific and Technological Development—CNPq Brazil (grants 308021/2019-3, 302751/2020-3, 424173/2021-2). The views expressed here are those of the authors and do not necessarily those of our institutions. All remaining errors are solely our responsibility.

Institutional Review Board Statement

Not applicable.

Informed Consent Statement

Not applicable.

Data Availability Statement

Not applicable.

Conflicts of Interest

The authors declare no conflict of interest.

References

  1. Lade, G.E.; Lin Lawell, C.Y.C.; Smith, A. Policy shocks and market-based regulations: Evidence from the renewable fuel standard. Am. J. Agric. Econ. 2018, 100, 707–731. [Google Scholar] [CrossRef]
  2. Khanna, M.; Crago, C.L. Measuring indirect land use change with biofuels: Implications for policy. Annu. Rev. Resour. Econ. 2012, 4, 161–184. [Google Scholar] [CrossRef] [Green Version]
  3. Hochman, G.; Rajagopal, D.; Timilsina, G.; Zilberman, D. Quantifying the causes of the global food commodity price crisis. Biomass Bioenergy 2014, 68, 106–114. [Google Scholar] [CrossRef] [Green Version]
  4. Oehlschlaeger, M.A.; Wang, H.; Sexton, M.N. Prospects for biofuels: A review. J. Therm. Sci. Eng. Appl. 2013, 5, 021006. [Google Scholar] [CrossRef]
  5. Rajagopal, D.; Plevin, R.J. Implications of market-mediated emissions and uncertainty for biofuel policies. Energy Policy 2013, 56, 75–82. [Google Scholar] [CrossRef]
  6. Hill, J.; Nelson, E.; Tilman, D.; Polasky, S.; Tiffany, D. Environmental, economic, and energetic costs and benefits of biodiesel and ethanol biofuels. Proc. Natl. Acad. Sci. USA 2006, 103, 11206–11210. [Google Scholar] [CrossRef] [Green Version]
  7. Demirbas, A. Biofuels sources, biofuel policy, biofuel economy and global biofuel projections. Energy Convers. Manag. 2008, 49, 2106–2116. [Google Scholar] [CrossRef]
  8. Abbott, P.C.; Hurt, C.; Tyner, W.E. What is Driving Food Prices? Technical Report; Farm Foundation: Oak Brook, IL, USA, 2008. [Google Scholar] [CrossRef]
  9. Rosegrant, M.W. Biofuels and Grain Prices: Impacts and Policy Responses; International Food Policy Research Institute: Washington, DC, USA, 2008. [Google Scholar]
  10. Trostle, R. Global Agricultural Supply and Demand: Factors Contributing to the Recent Increase in Food Commodity Prices; Diane Publishing: Collingdale, PA, USA, 2010. [Google Scholar]
  11. Janda, K.; Kristoufek, L.; Zilberman, D. Biofuels: Policies and impacts. Agric. Econ. 2012, 58, 372–386. [Google Scholar]
  12. Zilberman, D.; Hochman, G.; Rajagopal, D.; Sexton, S.; Timilsina, G. The impact of biofuels on commodity food prices: Assessment of findings. Am. J. Agric. Econ. 2013, 95, 275–281. [Google Scholar] [CrossRef]
  13. Condon, N.; Klemick, H.; Wolverton, A. Impacts of ethanol policy on corn prices: A review and meta-analysis of recent evidence. Food Policy 2015, 51, 63–73. [Google Scholar] [CrossRef]
  14. Persson, U.M. The impact of biofuel demand on agricultural commodity prices: A systematic review. In Advances in Bioenergy: The Sustainability Challenge; Wiley: Hoboken, NJ, USA, 2016; pp. 465–482. [Google Scholar]
  15. Lark, T.J.; Hendricks, N.P.; Smith, A.; Pates, N.; Spawn-Lee, S.A.; Bougie, M.; Booth, E.G.; Kucharik, C.J.; Gibbs, H.K. Environmental outcomes of the US renewable fuel standard. Proc. Natl. Acad. Sci. USA 2022, 119, e2101084119. [Google Scholar] [CrossRef] [PubMed]
  16. Chen, L.; Debnath, D.; Zhong, J.; Ferin, K.; VanLoocke, A.; Khanna, M. The economic and environmental costs and benefits of the renewable fuel standard. Environ. Res. Lett. 2021, 16, 034021. [Google Scholar] [CrossRef]
  17. National Research Council. Renewable Fuel Standard: Potential Economic and Environmental Effects of US Biofuel Policy; National Academies Press: Washington, DC, USA, 2012. [Google Scholar]
  18. Hill, J. The sobering truth about corn ethanol. Proc. Natl. Acad. Sci. USA 2022, 119, e2200997119. [Google Scholar] [CrossRef] [PubMed]
  19. Hochman, G.; Zilberman, D. Corn ethanol and US biofuel policy 10 years later: A quantitative assessment. Am. J. Agric. Econ. 2018, 100, 570–584. [Google Scholar] [CrossRef]
  20. Rajagopal, D.; Zilberman, D. Environmental, economic and policy aspects of biofuels. Found. Trends® Microeconomics 2008, 4, 353–468. [Google Scholar] [CrossRef] [Green Version]
  21. Tranfield, D.; Denyer, D.; Smart, P. Towards a methodology for developing evidence-informed management knowledge by means of systematic review. Br. J. Manag. 2003, 14, 207–222. [Google Scholar] [CrossRef]
  22. Pires, A.L.G.; Rotella Junior, P.; Morioka, S.N.; Rocha, L.C.S.; Bolis, I. Main trends and criteria adopted in economic feasibility studies of offshore wind energy: A Systematic Literature Review. Energies 2021, 15, 12. [Google Scholar] [CrossRef]
  23. Moher, D.; Liberati, A.; Tetzlaff, J.; Altman, D.G.; PRISMA Group. Preferred reporting items for systematic reviews and meta-analyses: The PRISMA statement. PLoS Med. 2009, 6, e1000097. [Google Scholar] [CrossRef] [PubMed] [Green Version]
  24. Levy, Y.; Ellis, T.J. A systems approach to conduct an effective literature review in support of information systems research. Inf. Sci. 2006, 9, 181–212. [Google Scholar] [CrossRef] [Green Version]
  25. de Oliveira Azevêdo, R.; Rotela Junior, P.; Rocha, L.C.S.; Chicco, G.; Aquila, G.; Peruchi, R.S. Identification and analysis of impact factors on the economic feasibility of photovoltaic energy investments. Sustainability 2020, 12, 7173. [Google Scholar] [CrossRef]
  26. Rocha, L.C.S.; Rotella Junior, P.; Aquila, G.; Janda, K. Utility-scale energy storage systems: World condition and Brazilian perspectives. J. Energy Storage 2022, 52, 105066. [Google Scholar] [CrossRef]
  27. Aria, M.; Cuccurullo, C. bibliometrix: An R-tool for comprehensive science mapping analysis. J. Inf. 2017, 11, 959–975. [Google Scholar] [CrossRef]
  28. de Gorter, H.; Just, D.R. The economics of a blend mandate for biofuels. Am. J. Agric. Econ. 2009, 91, 738–750. [Google Scholar] [CrossRef]
  29. Serra, T.; Zilberman, D.; Gil, J.M.; Goodwin, B.K. Nonlinearities in the U.S. corn-ethanol-oil-gasoline price system. Agric. Econ. 2011, 42, 35–45. [Google Scholar] [CrossRef]
  30. Zhang, Z.; Lohr, L.; Escalante, C.; Wetzstein, M. Ethanol, corn, and soybean price relations in a volatile vehicle-fuels market. Energies 2009, 2, 320–339. [Google Scholar] [CrossRef] [Green Version]
  31. Martin, M.A. First generation biofuels compete. New Biotechnol. 2010, 27, 596–608. [Google Scholar] [CrossRef] [PubMed]
  32. Sahin, Y. Environmental impacts of biofuels. Energy Educ. Sci. Technol. Part A-Energy Sci. Res. 2011, 26, 129–142. [Google Scholar]
  33. Thompson, W.; Whistance, J.; Meyer, S. Effects of US biofuel policies on US and world petroleum product markets with consequences for greenhouse gas emissions. Energy Policy 2011, 39, 5509–5518. [Google Scholar] [CrossRef]
  34. de Gorter, H.; Just, D.R. The welfare economics of a biofuel tax credit and the interaction effects with price contingent farm subsidies. Am. J. Agric. Econ. 2009, 91, 477–488. [Google Scholar] [CrossRef]
  35. Rajagopal, D.; Sexton, S.E.; Roland-Holst, D.; Zilberman, D. Challenge of biofuel: Filling the tank without emptying the stomach? Environ. Res. Lett. 2007, 2, 044004. [Google Scholar] [CrossRef]
  36. Mueller, S.A.; Anderson, J.E.; Wallington, T.J. Impact of biofuel production and other supply and demand factors on food price increases in 2008. Biomass Bioenergy 2011, 35, 1623–1632. [Google Scholar] [CrossRef]
  37. Gardner, B. Fuel ethanol subsidies and farm price support. J. Agric. Food Ind. Organ. 2007, 5. [Google Scholar] [CrossRef]
  38. Caust, J.; Vecco, M. Is UNESCO World Heritage recognition a blessing or burden? Evidence from developing Asian countries. J. Cult. Herit. 2017, 27, 1–9. [Google Scholar] [CrossRef]
  39. Della Corte, V.; Del Gaudio, G.; Sepe, F.; Sciarelli, F. Sustainable tourism in the open innovation realm: A bibliometric analysis. Sustainability 2019, 11, 6114. [Google Scholar] [CrossRef] [Green Version]
  40. van Eck, N.J.; Waltman, L. Software survey: VOSviewer, a computer program for bibliometric mapping. Scientometrics 2010, 84, 523–538. [Google Scholar] [CrossRef] [Green Version]
  41. Perianes-Rodriguez, A.; Waltman, L.; van Eck, N.J. Constructing bibliometric networks: A comparison between full and fractional counting. J. Informetr. 2016, 10, 1178–1195. [Google Scholar] [CrossRef] [Green Version]
  42. Rotella Junior, P.; Rocha, L.C.S.; Morioka, S.N.; Bolis, I.; Chicco, G.; Mazza, A.; Janda, K. Economic analysis of the investments in battery energy storage systems: Review and current perspectives. Energies 2021, 14, 2503. [Google Scholar] [CrossRef]
  43. Whistance, J.; Thompson, W. How does increased corn-ethanol production affect US natural gas prices? Energy Policy 2010, 38, 2315–2325. [Google Scholar] [CrossRef]
  44. Whistance, J.; Thompson, W.W.; Meyer, S.D. Ethanol policy effects on US natural gas prices and quantities. Am. Econ. Rev. 2010, 100, 178–182. [Google Scholar] [CrossRef]
  45. Whistance, J.; Thompson, W. A critical assessment of RIN price behavior and the implications for corn, ethanol, and gasoline price relationships. Appl. Econ. Perspect. Policy 2014, 36, 623–642. [Google Scholar] [CrossRef] [Green Version]
  46. Christensen, A.; Siddiqui, S. Fuel price impacts and compliance costs associated with the Renewable Fuel Standard (RFS). Energy Policy 2015, 86, 614–624. [Google Scholar] [CrossRef]
  47. Liu, C.; Greene, D.L. Consumer choice of E85 denatured ethanol fuel blend. Transp. Res. Rec. 2014, 2454, 20–27. [Google Scholar] [CrossRef]
  48. Lade, G.; Bushnell, J. Fuel subsidy pass-through and market structure: Evidence from the renewable fuel standard. J. Assoc. Environ. Resour. Econ. 2019, 6, 563–592. [Google Scholar] [CrossRef] [Green Version]
  49. Ghoddusi, H. Price risks for biofuel producers in a deregulated market. Renew. Energy 2017, 114, 394–407. [Google Scholar] [CrossRef]
  50. Westbrook, J.; Barter, G.E.; Manley, D.K.; West, T.H. A parametric analysis of future ethanol use in the light-duty transportation sector: Can the US meet its Renewable Fuel Standard goals without an enforcement mechanism? Energy Policy 2014, 65, 419–431. [Google Scholar] [CrossRef]
  51. Sexton, S.; Zilberman, D.; Rajagopal, D.; Hochman, G. The role of biotechnology in a sustainable biofuel future. AgBioForum 2009, 12, 130–140. [Google Scholar]
  52. Acquaye, A.A.; Sherwen, T.; Genovese, A.; Kuylenstierna, J.; Koh, S.L.; McQueen-Mason, S. Biofuels and their potential to aid the UK towards achieving emissions reduction policy targets. Renew. Sustain. Energy Rev. 2012, 16, 5414–5422. [Google Scholar] [CrossRef]
  53. Piroli, G.; Ciaian, P.; Kancs, D. Land use change impacts of biofuels: Near-VAR evidence from the US. Ecol. Econ. 2012, 84, 98–109. [Google Scholar] [CrossRef] [Green Version]
  54. Suh, D.H. Interfuel substitution effects of biofuel use on carbon dioxide emissions: Evidence from the transportation sector. Appl. Econ. 2019, 51, 3413–3422. [Google Scholar] [CrossRef]
  55. Bento, A.M.; Klotz, R.; Landry, J.R. Are there carbon savings from US biofuel policies? The critical importance of accounting for leakage in land and fuel markets. Energy J. 2015, 36. [Google Scholar] [CrossRef]
  56. Chen, X.; Huang, H.; Khanna, M.; Önal, H. Meeting the mandate for biofuels: Implications for land use, food, and fuel prices. In The Intended and Unintended Effects of US Agricultural and Biotechnology Policies; University of Chicago Press: Chicago, IL, USA, 2011; pp. 223–267. [Google Scholar]
  57. McPhail, L.L.; Babcock, B.A. Impact of US biofuel policy on US corn and gasoline price variability. Energy 2012, 37, 505–513. [Google Scholar] [CrossRef]
  58. Pouliot, S.; Babcock, B.A. Compliance path and impact of ethanol mandates on retail fuel market in the short run. Am. J. Agric. Econ. 2016, 98, 744–764. [Google Scholar] [CrossRef]
  59. Koto, P.S. Are retail prices of ethanol, gasoline and natural gas in the midwest cointegrated? An asymmetric threshold cointegration analysis. J. Econ. Bus. 2015, 77, 79–93. [Google Scholar] [CrossRef]
  60. Burkhardt, J. The impact of the Renewable Fuel Standard on US oil refineries. Energy Policy 2019, 130, 429–437. [Google Scholar] [CrossRef]
  61. Du, X.; Hayes, D.J. The impact of ethanol production on US and regional gasoline markets. Energy Policy 2009, 37, 3227–3234. [Google Scholar] [CrossRef] [Green Version]
  62. McPhail, L.L. Assessing the impact of US ethanol on fossil fuel markets: A structural VAR approach. Energy Econ. 2011, 33, 1177–1185. [Google Scholar] [CrossRef]
  63. Drabik, D.; de Gorter, H. Biofuel policies and carbon leakage. AgBioForum 2011, 14, 104–110. [Google Scholar]
  64. Gehlhar, M.; Somwaru, A.; Dixon, P.B.; Rimmer, M.T.; Winston, A.R. Economywide implications from US bioenergy expansion. Am. Econ. Rev. 2010, 100, 172–177. [Google Scholar] [CrossRef]
  65. Hochman, G.; Rajagopal, D.; Zilberman, D. The effect of biofuels on crude oil markets. AgBioForum 2010, 13, 112–118. [Google Scholar]
  66. Rajagopal, D.; Sexton, S.; Hochman, G.; Roland-Holst, D.; Zilberman, D. Model estimates food-versus-biofuel trade-off. Calif. Agric. 2009, 63, 199–201. [Google Scholar] [CrossRef] [Green Version]
  67. Wu, J.; Langpap, C. The price and welfare effects of biofuel mandates and subsidies. Environ. Resour. Econ. 2015, 62, 35–57. [Google Scholar] [CrossRef]
  68. Chakravorty, U.; Hubert, M.H.; Marchand, B.U. Food for fuel: The effect of US energy policy on Indian poverty. Quant. Econ. J. Econom. Soc. 2019, 10, 1153–1193. [Google Scholar] [CrossRef]
  69. Chen, X. A Dynamic Analysis of US Biofuels Policy Impact on Land Use, Greenhouse Gas Emissions and Social Welfare. Ph.D. Dissertation, Agricultural and Consumer Economics, University of Illinois Champaign-Urbana, Urbana, IL, USA, 2010. [Google Scholar]
  70. de Gorter, H.; Just, D.R. The Law of Unintended Consequences: How the U.S. Biofuel Tax Credit with a Mandate Subsidizes Oil Consumption and Has no Impact on Ethanol Consumption. 2008. Available online: https://ssrn.com/abstract=1024525 (accessed on 30 July 2022).
Figure 1. Model for conducting a systematic literature review. Adapted from [25,26].
Energies 16 00428 g001
Figure 2. Summary of articles filtering after reading.
Energies 16 00428 g002
Figure 3. Annual distribution of publications from 1988 to September 2022.
Energies 16 00428 g003
Figure 4. Most frequent journals in the sample.
Energies 16 00428 g004
Figure 5. Main and most cited publications in the sample.
Energies 16 00428 g005
Figure 6. Citation Treemap (References numbers).
Energies 16 00428 g006
Figure 7. Distribution of citations over time for ten of the most cited articles in the sample.
Energies 16 00428 g007
Figure 8. Distribution of citations over time for ten of the most cited articles in the sample.
Energies 16 00428 g008
Figure 9. Tree-Field plot (Authors × sources × keywords).
Energies 16 00428 g009
Figure 10. Thematic map (development degree × relevance degree).
Energies 16 00428 g010
Figure 11. Keyword co-occurrence map.
Energies 16 00428 g011
Figure 12. Conceptual structure map.
Energies 16 00428 g012
Figure 13. Predominant clusters identified through bibliographic coupling.
Energies 16 00428 g013
Figure 14. Count of models used in the literature.
Energies 16 00428 g014
Figure 15. Ethanol’s relative effects reported in the literature.
Energies 16 00428 g015
Figure 16. Evolution of the number of publications by clusters.
Energies 16 00428 g016
Table 1. This table summarizes publications providing numerical estimates of the impact of ethanol on fuel price. The first column references the publication and the second column the inspected time period. The third column reports on the model used, and the Relation column suggests whether ethanol and gasoline are considered to be substitutes (Sub), complements (Comp), or perfect substitutes (pSub).
PublicationPeriodModelRelationResult
[57]2006
2010
Stochastic partial equilibriumSubGasoline CV → from 0.21 to 0.26 CV
[58]2015Open economy partial equilibriumn/aIncrease in biofuel mandate up to 16.6% results in 1.46% decrease in gasoline price
[59]10/2006
12/2013
TAR, M-TAR, M-TVECMComplRetail prices of gasoline and ethanol are cointegrated. There exists a bi-directional Granger causality between them. Shocks to ethanol prices have lasting effects on gasoline prices rather than vice versa.
[60]2012
2014
Primary fixed effects modeln/a1 cent per gallon increase in the RIN tax obligation resulted in a 0.971 cent/gallon increase in gasoline prices and a 0.781 cent/gallon increase in USD prices, respectively. (approx. 0.08%)
[61]1995
2008
The crack ratio ( p C R )SubEthanol production lowers gasoline prices by $0.14/gallon (average of 8%)
[62]1994
2010
Joint structural VARn/aEthanol demand expansion indicates stronger support for biofuels and more competition for crude oil demand, which leads to a decrease in oil prices.
[55]2009
2015
General equilibrium modelpSubPolicies cause gasoline price to decrease from 2.8% to 4.8% (averages)
[63]2007
2022
BEPAMn/aTax credit leads to 3.8% decrease in world gasoline price; RFS mandates lead to a decrease from 5.2 to 5.9% in world gasoline price; RFS and tax credit lead to a 4.9–5.2% decrease in world gasoline price
[64]2005
2022
General equilibrium modelSubRFS2 in 2022 causes gasoline price to decrease by 9.8% if the petroleum import supply elasticity is 2 and by 6.8% if the elasticity is 5.5
[65]2007Cartel-of-Nations model (CON)SubEthanol causes oil prices in importing countries to decline by 1.07–1.10%
[35]2006Conceptual model of supply and demandn/aEthanol causes decrease in fuel price by 3%
[66]2007Partial-equilibrium multimarket frameworkn/aWithout ethanol supplies, gasoline prices would be between 2.4% and 1.4% higher
[67]1976
2005
General equilibrium modelpSubRFS Ethanol mandates and subsidies lowered the price of gasoline by 5–10%
Table 2. This table summarizes publications in the analysis of [12] concerned with the impact of ethanol on fuel price or welfare. The first column references the publication, and the second column the inspected time period. The third column reports on the model used. The Relation column suggests whether ethanol and gasoline are considered to be perfect or imperfect substitutes, and Results summarizes the respective study.
PublicationPeriodModelRelationResult
[68]2005
2011
Simple partial equilibrium dynamic modelPerfect substitutesRFS ethanol mandate leads to a reduction in poverty in rural areas by approximately 4.8 ppt, and an increase in poverty in urban areas by approximately 1.04 ppt.
[56]2007
2022
BEPAMImperfect substitutesRFS ethanol mandate reduces the price of gasoline by 8% in 2022
[69]2007
2022
BEPAMImperfect substitutesEthanol mandate reduces gasoline consumption by 5–8%.
[70]2006
2015
Stylized supply-demand modelSubstitutesRFS mandate decreases gasoline price by 1.4% in 2006, RFS mandate decreased gasoline price by 1.7% in 2015
Disclaimer/Publisher’s Note: The statements, opinions and data contained in all publications are solely those of the individual author(s) and contributor(s) and not of MDPI and/or the editor(s). MDPI and/or the editor(s) disclaim responsibility for any injury to people or property resulting from any ideas, methods, instructions or products referred to in the content.

