Article

Dielectric Performance of Natural- and Synthetic-Ester-Based Nanofluids with Fullerene Nanoparticles

1
Faculty of Electrical Engineering and Informatics, Technical University of Košice, Letná 9, 04200 Košice, Slovakia
2
Institute of Experimental Physics SAS, Watsonova 47, 04001 Košice, Slovakia
3
Department of Electrical Power Engineering FEEC, Brno University of Technology, Technická 10, 61600 Brno, Czech Republic
*
Authors to whom correspondence should be addressed.
Energies 2023, 16(1), 343; https://doi.org/10.3390/en16010343
Submission received: 23 November 2022 / Revised: 22 December 2022 / Accepted: 23 December 2022 / Published: 28 December 2022
(This article belongs to the Special Issue Industrial Applications of Nanofluids in the Energy Sector)

Abstract

:
According to the latest research, nanofluids as a possible future substitution for high-voltage equipment insulation have the potential to enhance the heat transfer and insulation properties of their base fluids. Dielectric properties are represented by breakdown strength (AC, DC, lightning) and dielectric performance as a set of quantities including dissipation factor, permittivity, and volume resistivity. In this study, natural and synthetic esters were mixed with C60 nanoparticles. Samples were examined for dissipation factor, relative permittivity, and volume resistivity at temperatures between 25 °C and 140 °C to monitor changes in dielectric performance with rising temperature, in accordance with IEC 60247. In addition, the samples were tested for AC breakdown voltage (using mushroom-like electrodes with a gap distance of 1 mm) and evaluated using the Weibull distribution statistical method. These measurements allowed complex evaluation of the examined mixtures and the determination of optimal concentration for each ester-based nanofluid.

1. Introduction

High-voltage equipment using insulating oils as heat transfer and insulating media is of crucial importance in electrical engineering. In particular, power transformers need reliable and efficient insulation. Insulating oils have evolved over the centuries and their properties have gradually improved as they have developed to their current form [1,2]. Owing to sustainable development goals, environmentally friendly materials are now used more often, mainly natural esters (NEs) and synthetic esters (SEs). However, mineral oil (MO) is still the most frequently used insulating oil because of its dielectric strength, dielectric performance, and price. In current research, there is an effort to prove that biodegradable materials can match the properties of mineral oil by enhancing their properties using nanoparticles [3,4,5,6,7,8,9]. In this study, mixtures of an NE/SE and fullerene (C60) nanoparticles were examined in terms of AC breakdown voltage (AC BDV) and dielectric performance (dissipation factor, relative permittivity, volume resistivity) at different temperatures between 25 °C and 140 °C.
Huang et al. [10] examined NEs and MO with fullerene nanoparticles (with a diameter of 4 nm to 6 nm) in terms of dissipation factor and electrical resistivity. According to this research, the dissipation factor of NEs with fullerene nanoparticles decreased by 20.1% at a concentration of 100 mg/L. The maximal enhancement of resistivity of this combination was 23.3% at the same concentration of nanoparticles (100 mg/L). The results for the MO and C60 nanofluid were not so significant, however; at the optimal concentration (50 mg/L), the dissipation factor decreased from around 0.26% to around 0.18%. The resistivity decreased with increasing concentration except for the 50 mg/L concentration, which showed an insignificant enhancement. They also conducted AC BDV tests and the results showed that the optimal concentration of fullerene nanoparticles in NEs was the same (100 mg/L), with an enhancement of 8.6%.
Mentlik et al. [11] mixed NEs with TiO2 nanoparticles and examined the dissipation factor and volume resistivity thermal dependence from 25 °C to 90 °C. According to this research, the volume resistivity of nanofluids was higher than that of pure oils at all measured temperatures. Maximal values throughout the experiment were reached by the nanofluid with a 0.25 wt% concentration of nanoparticles. The lowest (0.05 wt%) and the highest (1 wt%) concentrations of nanoparticles showed approximately halved enhancement of volume resistivity in comparison to the mentioned concentration of 0.25 wt%. Dissipation factor measurement confirmed the optimal concentration of 0.25 wt%, with the lowest values of tan δ among the examined samples. The differences between pure oils and nanofluids decreased with increasing temperature in the case of volume resistivity measurement, and in contrast, when measuring the dissipation factor, the differences increased with increasing temperature.
Szcześniak and Przybylek [12] mixed fullerene nanoparticles with the NE FR3 and examined AC BDV and dielectric performance before and after ageing. Before ageing, there was a decrease of around 5% and 10% in AC BDV value for concentrations of 250 mg/L and 500 mg/L, respectively. After ageing, the enhancement of AC BDV for the sample with nanoparticles at a concentration of 500 mg/L was around 23%. The increase of permittivity was around 1% and 3% at concentrations of 250 mg/L and 500 mg/L, respectively. The volume resistivity of the nanofluid with a concentration of 250 mg/L was almost unchanged; however, the volume resistivity of the sample with 500 mg/L of fullerene was found to be enhanced by around 13%. The dissipation factor value increased with concentration and the increase reached values around 76% and 107% at concentrations of 250 mg/L and 50 mg/L, respectively.
Beroual and Duzkaya [13] examined AC BDV in the NE MIDEL eN 1204 and compared the results to those of nanofluids based on that oil and fullerene nanoparticles. Lower concentrations of nanoparticles in the NE caused decreases in the AC BDV value from −5.2% (0.2 g/L) to −12.6% (0.05 g/L). With higher concentrations, there was an enhancement of 5.1% at the concentration of 0.3 g/L and of 7.8% at the concentration of 0.4 g/L. They ascribed the improvement of AC BDV to the photon absorption capacity and strong electron trapping capability of fullerene nanoparticles, which have a higher dielectric constant than the NE [14,15].
This paper offers a complex evaluation of two kinds of base fluids (an NE and an SE) with fullerene nanoparticles from the point of view of AC BDV and dielectric performance. The experimental measurements are used to suggest optimal concentrations of nanoparticles in the examined fluids from different perspectives according to the reported results.

2. Materials and Methods

The nanofluids in this experiment were prepared using the base oils NE MIDEL eN 1204 (rapeseed-based oil) and SE MIDEL 7131. The physicochemical properties of the base fluids are listed in Table 1.
Nanofluids with C60 fullerene nanoparticles were prepared using fullerene powder with a purity of 99.5% (Merck) without any further treatment. The powder was dispersed homogeneously in base oils using ultrasound at a temperature of 60 °C for 4 h. For each oil, three samples were prepared with concentrations from 0.01% w/v to 0.03% w/v. The good solubility of C60 fullerene in nonpolar solvents allowed the preparation of stable nanofluid samples. A classical bottle test was applied to verify the stability, wherein transparent bottles filled with the investigated nanofluids were placed on a flat table for visual observation. No sedimentation was observed over 72 h. The nanofluids with fullerene nanoparticles were produced at the Institute of Experimental Physics SAS in Košice. The concentrations of individual samples are shown in Table 2.

3. Experimental Methods

For both experiments (AC BDV, dielectric performance), the required amount of nanofluid from one manufactured set was used.

3.1. AC Breakdown Voltage Measurement

A BAUR Dieltest DTA device with the maximum test voltage UAC-max = 100 kV was used to measure the AC breakdown voltage (AC BDV) of the insulating liquids. The distance between the mushroom-like electrodes during the measurement was kept at d = 1 mm (± 0.025 mm). According to ASTM D1816, the mushroom-like electrodes are normally separated with a 2 mm gap. However, if breakdown does not occur at 2 mm, the gap can be reduced to 1 mm. In the measurement setup employed in this study (BAUR Dieltest DTA), the breakdown was not reached in the investigated samples tested with a 2 mm electrode gap, and therefore we performed the breakdown measurements with a 1 mm gap between the electrodes. During the measurement, a voltage increase step of ΔU = 2.5 kV/s was chosen. The measurement was repeated 30 times with a pause of t = 2 min between consecutive measurements.

3.2. Dielectric Performance Measurement

Examination of dissipation factor, volume resistivity, and relative permittivity was executed following IEC 60247 2004. Nanofluid samples of 40 mL volume were used for the experiment in a HAEFELY TEST AG 2903 H test cell. A Tettex 2830 Precision Oil and Solid Dielectric Analyzer was used for the measurements. For the determination of thermal dependence of dissipation factor, volume resistivity, and relative permittivity, samples were tested at temperatures between 25 °C and 140 °C with a step of 10 °C.

4. Experimental Results

4.1. AC Breakdown Voltage Test Results

The investigation of the AC BDVs of the studied liquids is presented in this section, along with the breakdown probability analysis. Weibull distribution was used for this statistical evaluation of electrical breakdown in dielectrics at different voltage levels. Probabilities of 1%, 10%, and 50% were used to describe the reliability and equipment design. To verify the conformity of measured data with the specified distribution, Anderson–Darling (A-D) statistical testing was applied. A-D test results represent how well examined data fit a given distribution. Typically, with a higher A-D, the distribution fits the examined data worse. To perform the test, the confidence of 95% was used, corresponding to α = 0.05. If the value of alpha is higher than the p-value, the null hypothesis was rejected (H0: the data come from the distribution used). Form (1) shows the equation of Weibull probability distribution (P):
P B D V ; η , β = 1 e B D V η β
where BDV is the AC BDV value, η is the scale parameter, and β is the shape parameter.
Data evaluation at the basic level included calculation of changes in AC BDV, comparing the average values of the nanofluid samples and pure carrier liquid (in the following text written as Change) and the standard deviation.
Values U ¯ N F and U ¯ P F stand for the mean values of breakdown voltage in the nanofluid samples and the pure carrier liquid, respectively. Then, the percentage change of the AC BDV after nanoparticle addition is
C h a n g e = U ¯ N F U ¯ P F U ¯ P F 100 %
A negative percentage change represents a decrease in the AC BDV, while a positive one represents its enhancement (increase). The mean value of AC BDV U ¯ and the standard deviation σ were calculated using the following general forms:
U ¯ = 1 n i = 1 n U i
σ = 1 n i = 1 n U i U ¯ 2
where n, i, and U i are the number of measurements, the measurement index, and a particular breakdown voltage, respectively.
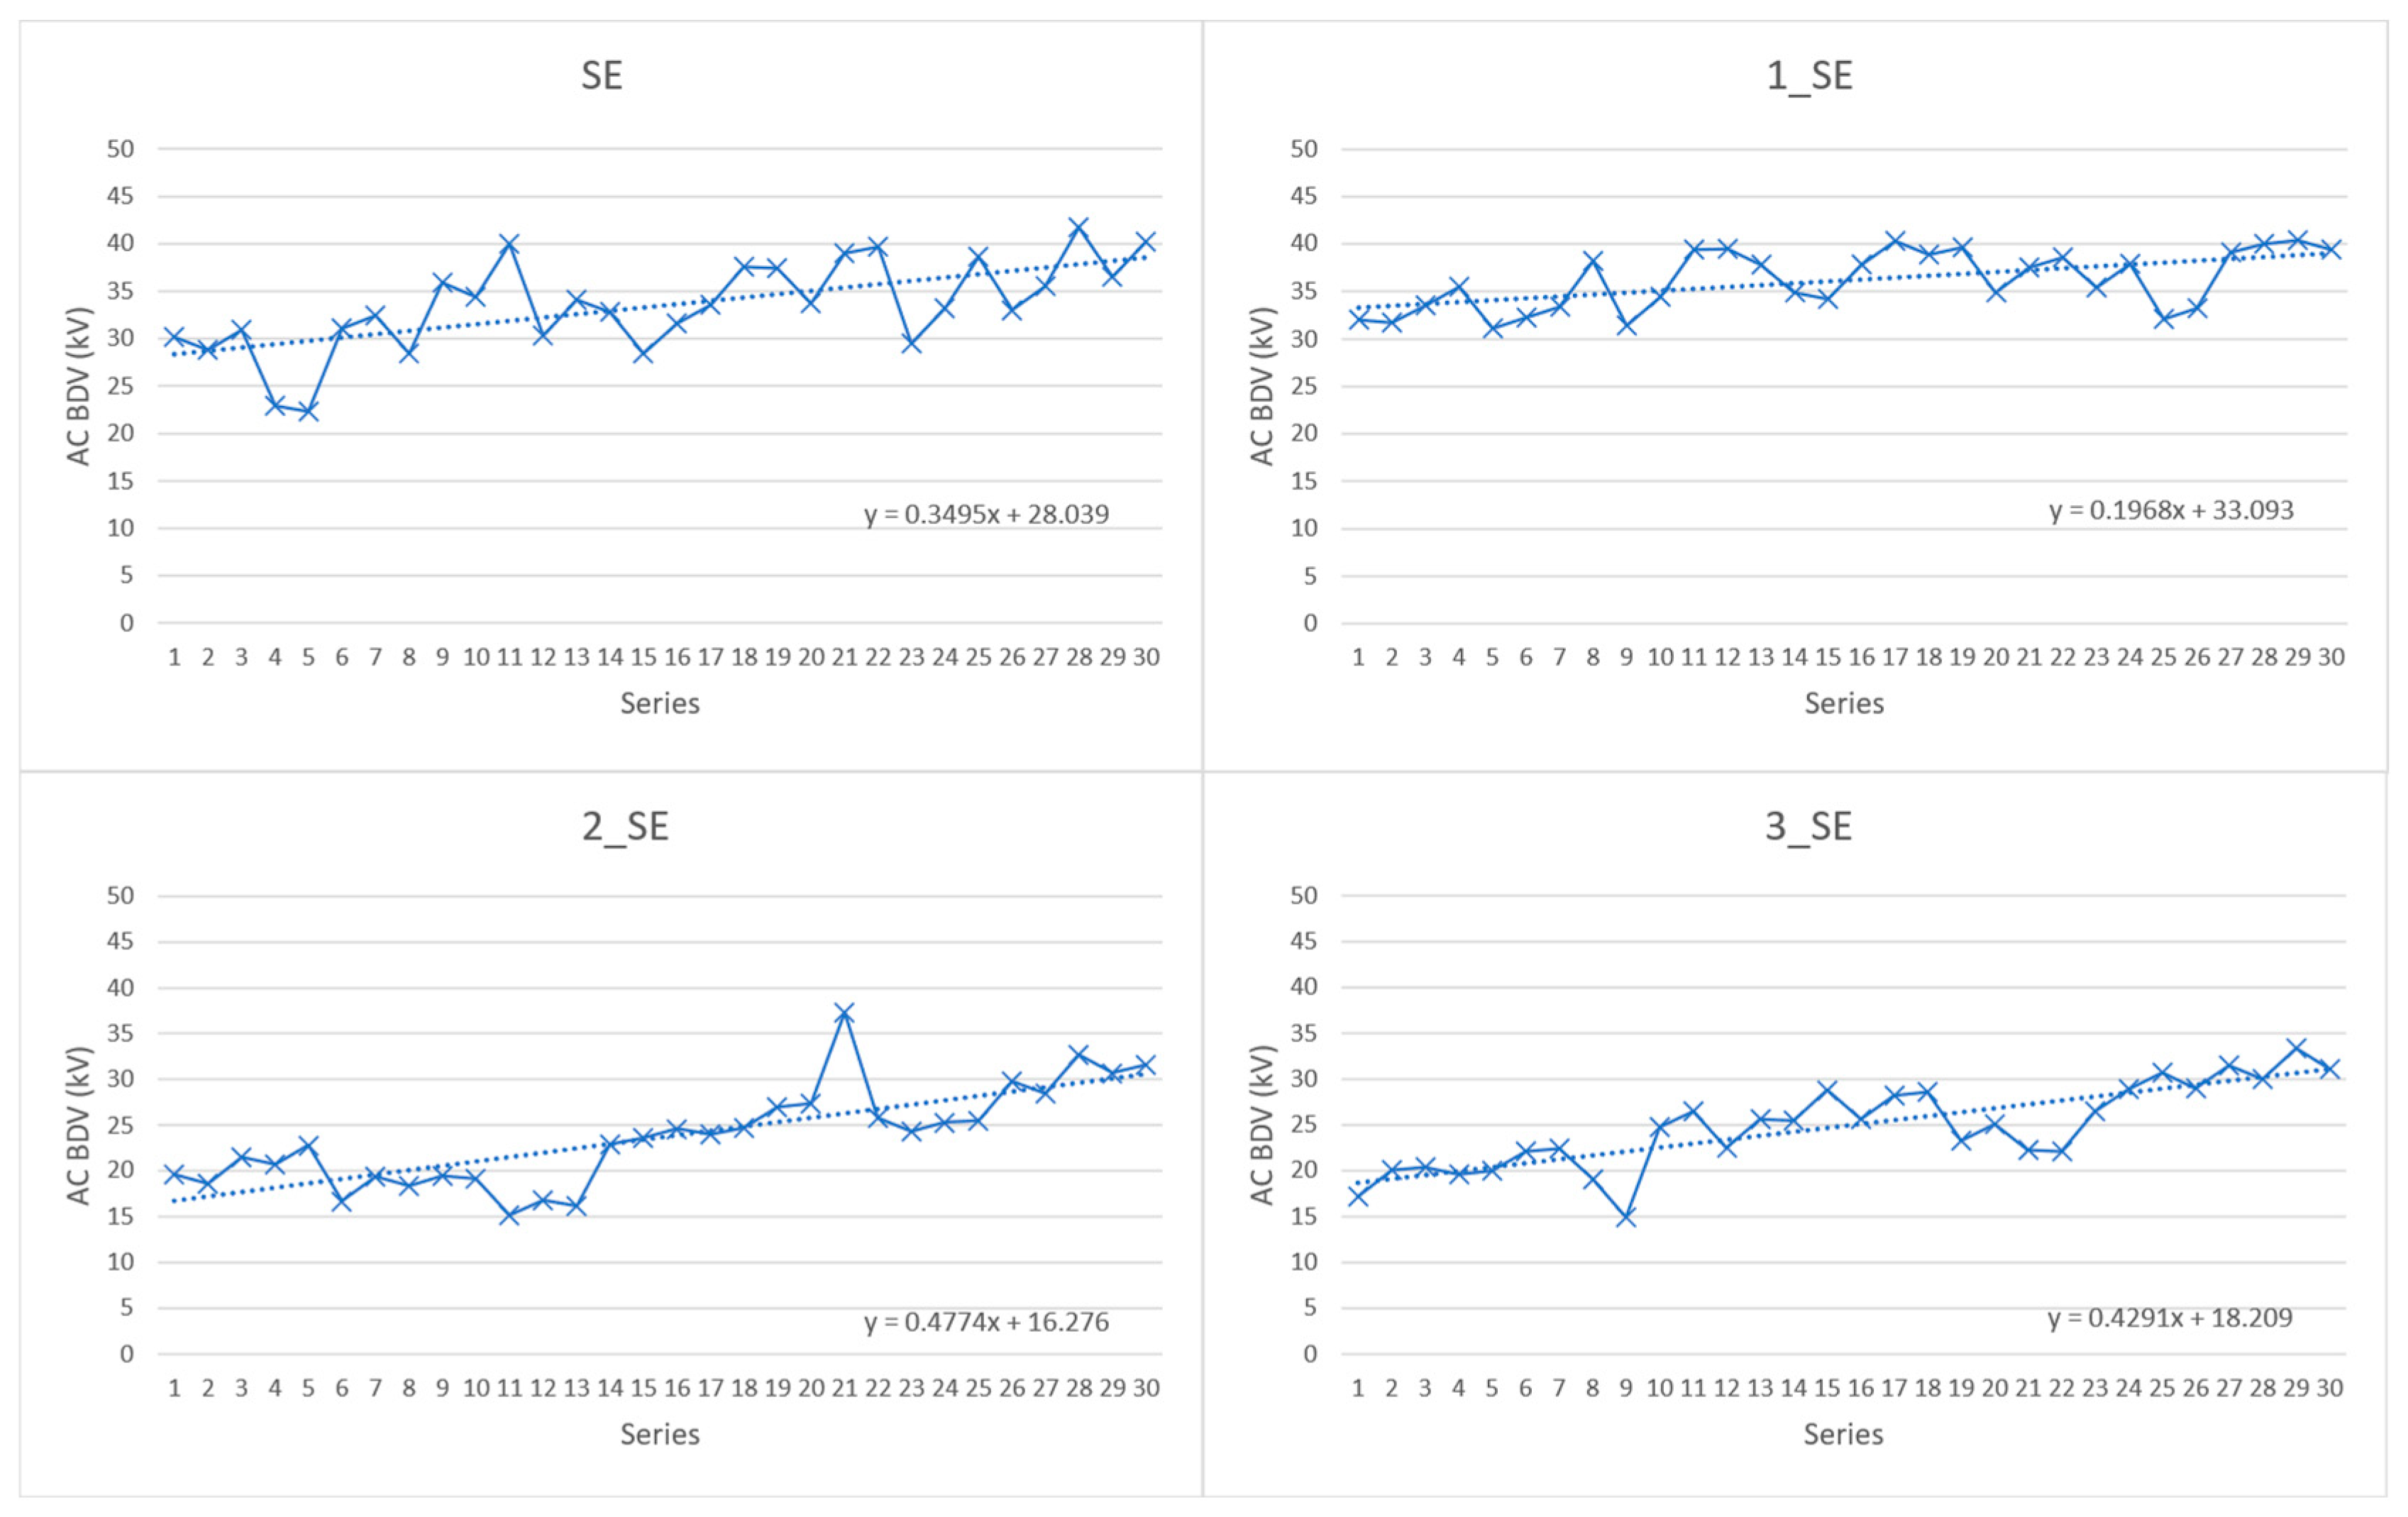
Table 3 represents the results of the AC BDV measurements and Figure 1 and Figure 2 graphically show the results of the individual measurements of AC BDV.
Figure 1 and Figure 2 show a set of measurements in the order they were taken.
For the natural ester MIDEL eN 1204, the addition of nanoparticles resulted in the deterioration of the AC breakdown voltage values for all nanofluid samples that shared the natural ester as the base fluid. Based on the Ū, it can be observed that at a concentration of 0.01% w/v, the change in breakdown voltage was −9% compared to the pure ester MIDEL eN 1204. The decrease of AC BDV value of the natural ester with a 0.02% w/v concentration of fullerene nanoparticles was 21.3%, which was the highest decrease among the NE samples. The nanofluid with a nanoparticle concentration of 0.03% w/v reached a 19.3% decrease in Ū compared to the pure natural ester.
The synthetic ester MIDEL 7131 showed increased values of AC BDV upon the addition of fullerene nanoparticles at a 0.01% w/v concentration compared to pure synthetic ester. The value of the breakdown voltage at this concentration was increased by 8.01% compared to pure SE MIDEL 7131. Samples of nanofluids with concentrations of 0.02% w/v and 0.03% w/v showed changes of −41.3% and −34.59%, respectively.
Among all the tested samples of nanofluids, the SE MIDEL 7131 sample with C60 nanoparticles at a concentration of 0.01% w/v showed the highest resistance to the applied alternating voltage. The synthetic ester MIDEL 7131 with fullerene nanoparticles at a concentration of 0.02% w/v achieved the lowest breakdown voltage values of all tested natural and synthetic ester samples. The big difference between the AC BDV values of two consecutive concentrations highlights the importance of specifying the optimal concentrations of nanofluids.
The graphical dependencies shown in Figure 1 represent how the BDV values developed across the individual measurements. The measured points of the curve of each nanofluid sample were fitted with a trending linear straight line for which the mathematical equation is included in the graphs. The trend line with the minimum value of the straight line indicates that the development of the BDV values had a stable character. Despite the low value of the angular coefficient of the fitting line (0.0703) of sample 3_NE, the measured values did not have a stable character, as confirmed by the statistical parameter of the standard deviation (4.64 kV). The jump voltage values periodically oscillated above or below the fitting line at the end of the measurement, which caused a low value of the angular coefficient.
The straight line of the trend with the maximum value among the different concentrations of nanofluids indicated a growing trend, i.e., increasing values of the breakdown voltage with increasing number of applied tests. In our case, this was a sample of the synthetic ester MIDEL 7131 with a 0.02% w/v concentration of nanoparticles. For this sample, it was assumed that with an increasing number of breakdowns, the AC BDV values of the nanofluid would increase.
A comparison of the development of breakdowns between the concentrations of the natural ester MIDEL eN 1204 and the synthetic ester MIDEL 7131 indicated that for the synthetic ester at nanoparticle concentrations of 0.02% w/v and 0.03% w/v, a significant increase was recorded in the BDV values concerning the number of applications in comparison to identical concentrations of fullerene with a different base liquid, MIDEL eN 1204
Timoshkin et al. reported an evaluation of values of BDV in SE MIDEL 7131 using trend lines in a previous publication [17]. The experiment described in this publication involved measurements taken in a test cell with spherical electrodes and an interelectrode distance of 1 mm for the pure synthetic ester MIDEL 7131. By mutual comparison, it can be concluded that our ester sample showed a gradual growth in BDV with the measurement iteration, while the measured data in the publication culminated with no indication of an increasing trend.
In NE MIDEL eN 1204 and its nanofluids, the pure ester reached a maximum AC BDV value of 43 kV. The lowest value among the NE samples with fullerene nanoparticles, 17 kV, was reached by the nanofluid with a concentration of 0.03% w/v. The maximum value among the NE nanofluids, 37.4 kV, was measured in the sample with a 0.01% w/v concentration of C60 nanoparticles.
Pure SE MIDEL 7131 reached the highest AC BDV value among the samples with this base fluid, 41.7 kV. The lowest value of AC BDV, 14.9 kV, was reached by a sample with a nanoparticle concentration of 0.03% w/v. Among the nanofluids with SE as the base fluid, the maximal value of 40.4 kV was recorded in the sample with a nanoparticle concentration of 0.01% w/v.
Figure 3 clearly shows the complex evaluation of the AC BDV results of the examined nanofluid samples. The order of the measured data points for both sets of samples can be followed using the color scale on the right side of the figure. The red color is associated with the first measurement, while the blue color corresponds to the last one. This color spectrum highlights the fact that breakdown in insulating liquid is a random phenomenon with varying results. The positions of the blue and red dots prove that the examined liquids were not exposed to degradation during individual consecutive measurements.

4.2. Weibull Probability Statistical Evaluation

Figure 4 shows the Weibull distributions divided by the base fluid. Weibull function parameters such as shape and scale were calculated for each sample from the measured values (Table 4). The shape represents the value that describes the slope of the line that fit the Weibull probability plot. The scale value describes the mean failure probability value [18]. AC BDV values at low concentrations (0.01% w/v) of fullerene nanoparticles in both esters were visibly higher in comparison to pure oils at lower levels of probability (Figure 4).
Table 4 presents a test of conformity to Weibull distribution results. Only sample 1_SE was not accepted (the null hypothesis was rejected).
Table 5 shows the values of AC BDV calculated from the Weibull distribution at 1%, 10%, and 50% probability levels. The lower limit of 1% estimates the minimum value of the breakdown voltage at which there is a chance of a breakdown in the liquid, and this value can reveal the level of reliability of the insulating liquid. The lowest value and the highest decrease among all samples was reached by sample 2_SE at the probability level of 1%. The value of AC BDV (at 1% probability) was 9.73 kV, with a decrease of 52.54% in comparison to the pure insulating liquid. All samples negatively influenced by nanoparticles (2_SE, 3_SE, 2_NE, 3_NE) showed less difference at higher probabilities in comparison to their base oil. Enhancement of AC BDV values was observed in samples 1_SE (all levels of probability) and 1_NE (probability levels 1% and 10%). Sample 1_NE reached an enhancement of 18.75% at the 1% probability level, 7.7% at the 10% probability level, and a decrease of 0.4% at the 50% probability level. The highest values of AC BDV at different probabilities were observed for sample 1_SE. Enhancement moved from 7.65% at the 50% probability level to 38.93% at the 1% probability level. Both samples (1_SE and 1_NE) showed better results than their base oil at lower probability levels.

4.3. Dissipation Factor Test Results

Dielectric loss is primarily connected with oxidation derivates, the content of moisture in a liquid, and the presence of impurities. It is represented by a quantity called dissipation factor (also called tanδ). The dissipation factor is used to determine the quality and level of degradation of insulating oils [12].
In general, the dissipation factor of insulating oils rises with temperature. With higher temperatures, the differences between various samples grew and showed the quality of dielectric performance. Pure NE in comparison with pure SE had lower values of the dissipation factor at all temperatures. The dissipation factor values of SE were around 10 times higher than those of NE throughout the experiment. At 90 °C, the value of SE was about 12 times higher than that of NE. Figure 5 shows that there were significant differences between the pure oils and the esters with fullerene.
The dielectric performance of the esters with fullerene nanoparticles was enhanced at various temperatures. Figure 5 shows two groups of curves around pure SE and NE. All samples of NE mixed with fullerene had lower dissipation factor values than the mixtures of SE and C60 nanoparticles. The influence of fullerene nanoparticles on decreasing the tanδ values of SE nanofluids was apparent at all temperatures. The decrease of the dissipation factor at 90 °C (relative to pure SE oil) for samples 1_SE, 2_SE, and 3_SE was around 54%, 152%, and 133%, respectively. According to the average values, the optimal concentration of fullerene nanoparticles in SE was 0.02% w/v, with around a 135% average decrease of tanδ values.
Fullerene nanofluids with NE showed different results. Only sample 3_NE had lower dissipation factor values than pure NE at all examined temperatures. This fact suggests the concentration of 0.03% w/v to be optimal according to tanδ values. The dissipation factor at 90 °C decreased only for sample 3_NE (26.6%), and for samples 1_NE and 2_NE it increased by 6.5% and 0.8%, respectively.
To sum up, according to the dissipation factor thermal dependence, fullerene nanoparticles are suitable for insulating oil enhancement at optimal concentrations.

4.4. Relative Permittivity Test Results

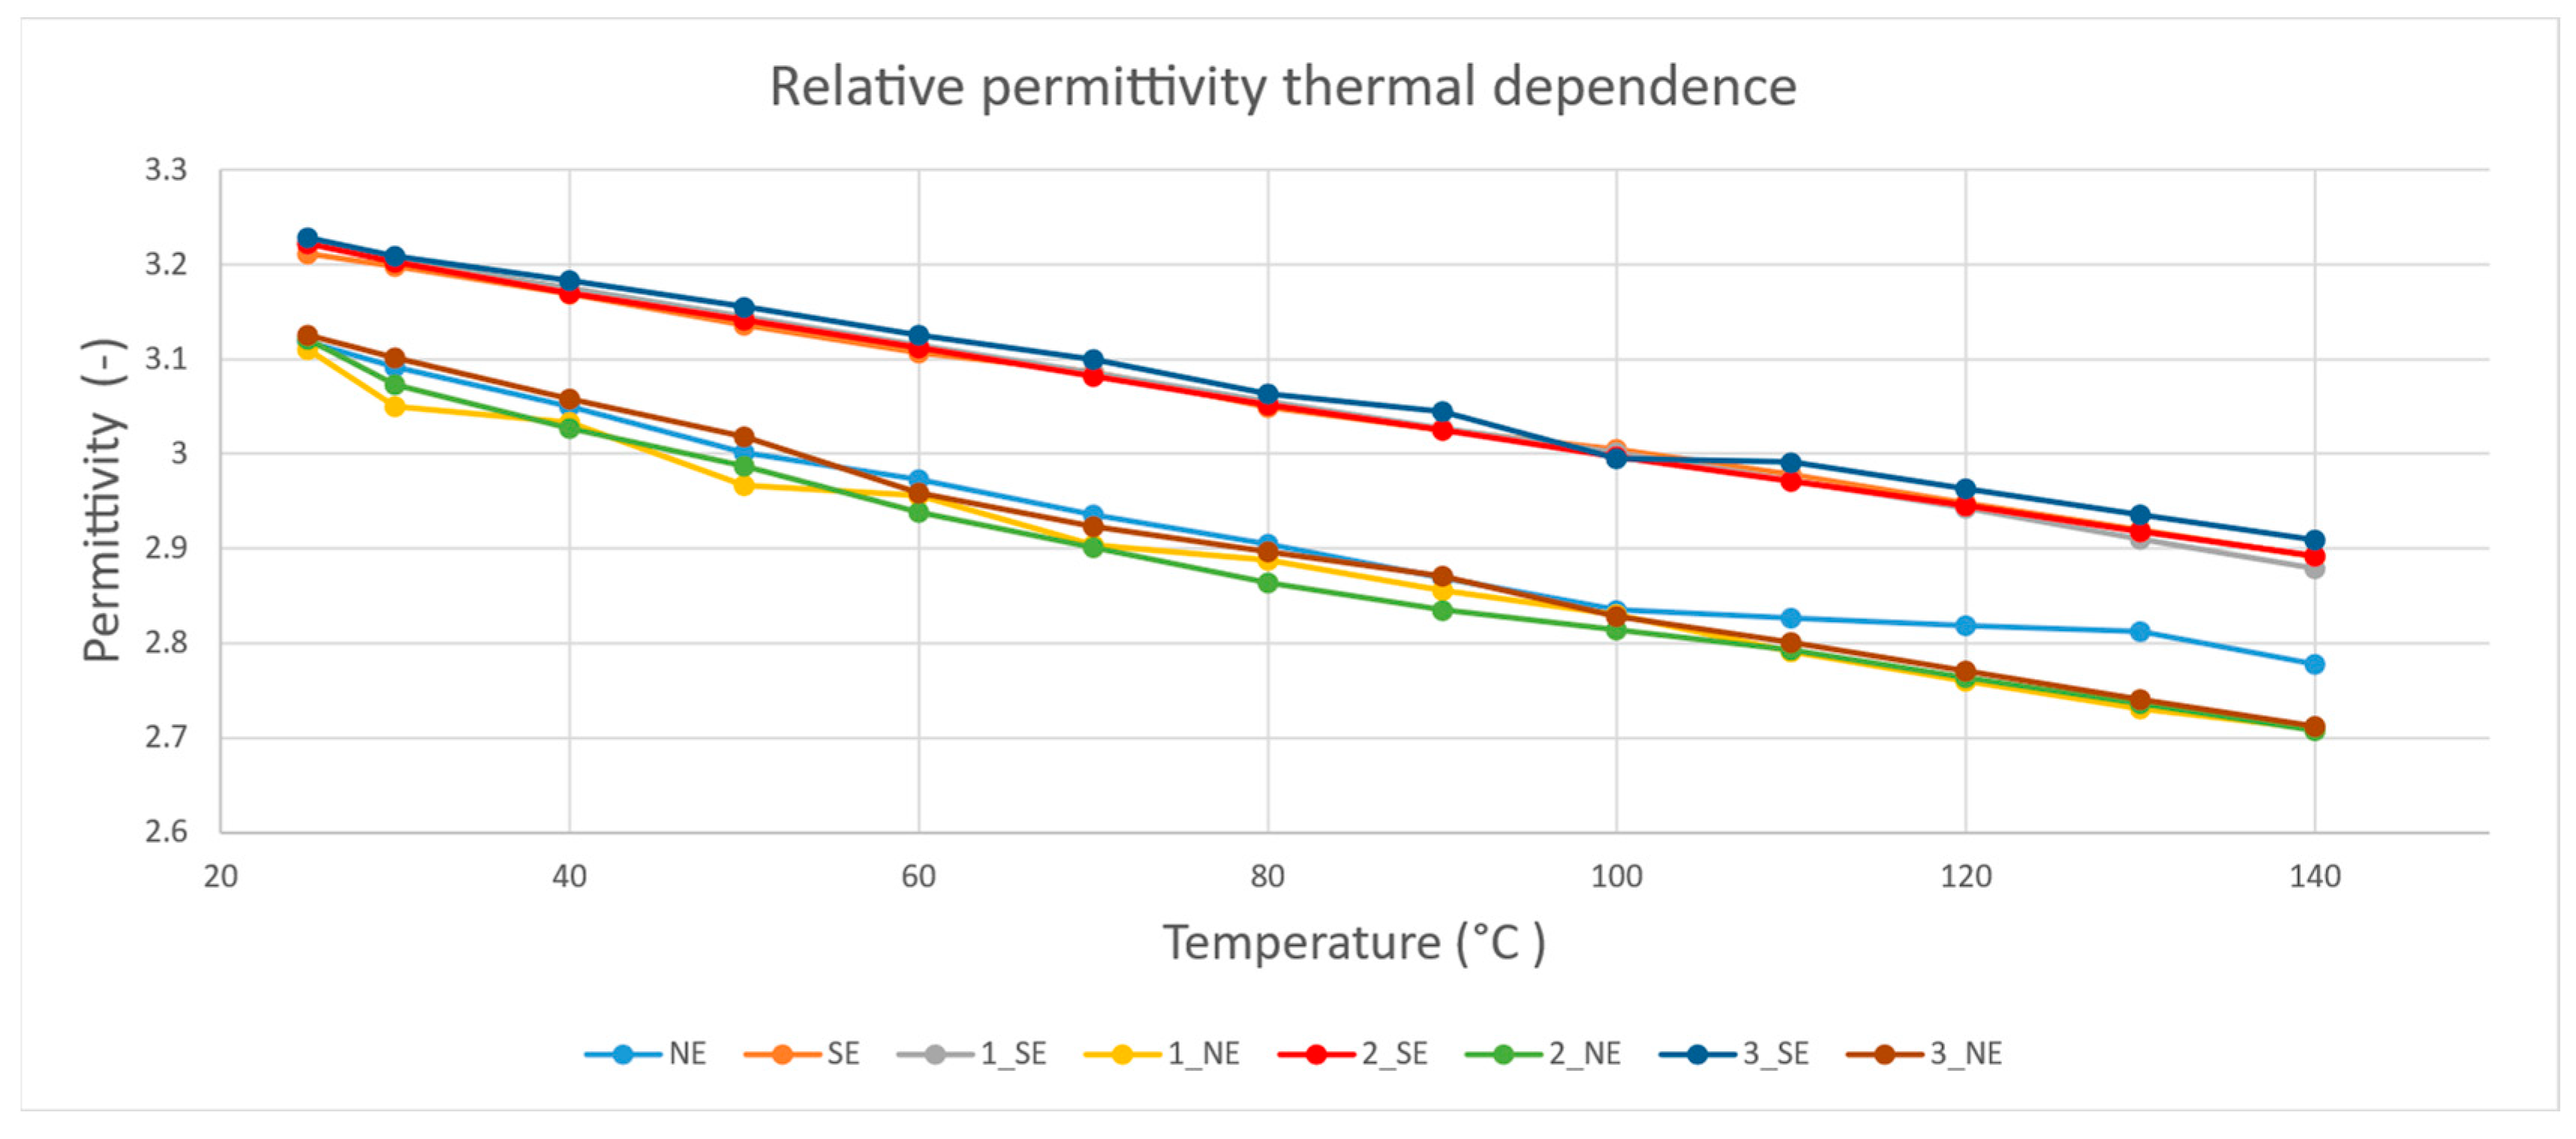
The relative permittivity, for which results are shown in Figure 6, determines the degree of polarization in response to an applied electric field, and is also called the dielectric constant [4].
The relative permittivity of the examined insulating oils, as shown in Figure 6, suggested two groups around NE and SE. Values of relative permittivity in NE were lower in comparison to SE at all examined temperatures, and the differences moved from 3% to 6%.
Nanofluids made of NE and fullerene nanoparticles showed decreased values of relative permittivity in comparison to pure NE. Samples 1_NE and 2_NE showed lower values throughout the experiment. The differences between pure NE and sample 1_NE moved from 0.2% at a temperature of 100 °C to around 3% at 130 °C, and those between NE and sample 2_NE moved from 0% to 2.8%.
Nanofluids made of SE (fullerene and magnetic nanoparticles) all showed around 1% difference in comparison to the pure oil. The differences were not significant throughout the experiment. The average percentage difference between pure oil and nanofluid was between −0.48% and 0.06%. Even though the permittivity differences found were greater than the accuracy of the employed measuring device (0.02%, as stated by the manufacturer), it can be concluded that relative permittivity was not significantly affected by the nanoparticles used and their concentration.

4.5. Volume Resistivity Test Results

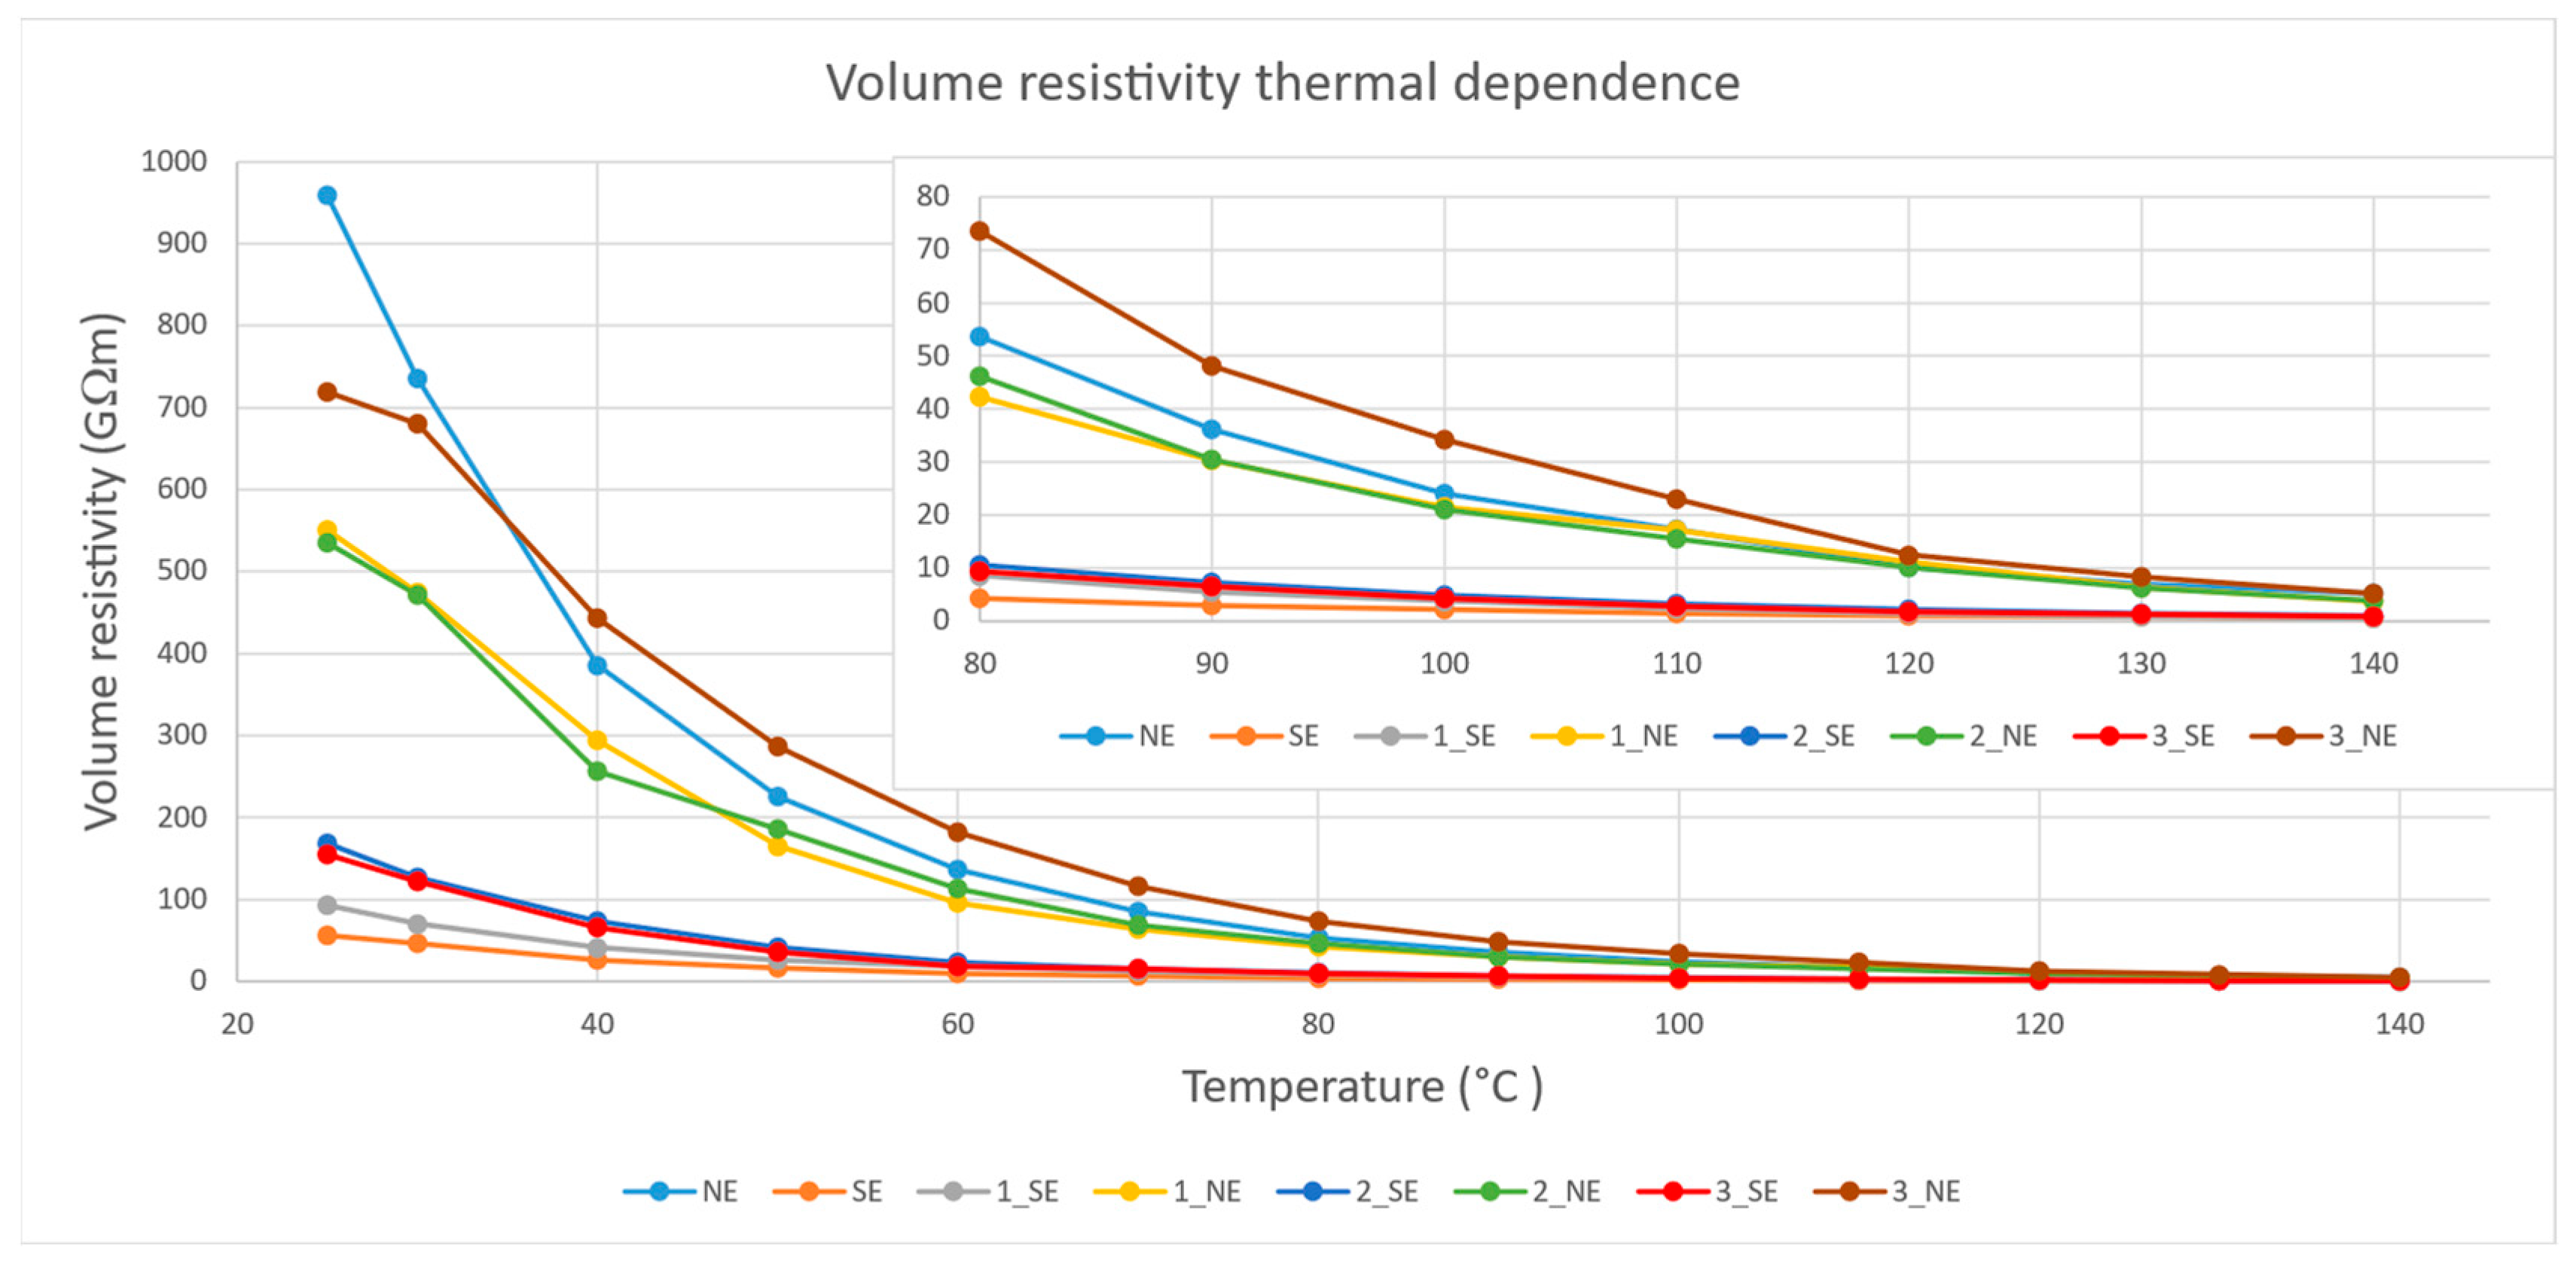
The volume resistivity (or DC resistivity) of a material represents how strongly the examined material opposes the flow of electric current through the volume of a cubic specimen, and it is reciprocal of the electrical conductivity [19]. Graphical representations of the obtained results are shown in Figure 7.
Enhancement of volume resistivity by fullerene nanoparticles in NE was observed only at the highest examined concentration, 0.03% w/v, at temperatures higher than 40 °C. Enhancement of resistivity in sample 3_NE compared to pure NE (at temperatures between 40 and 140 °C) moved from around 1.1% at 140 °C to around 42% at 100 °C. Samples 1_NE and 2_NE reached similar values throughout the experiment and showed a decrease in volume resistivity.
Fullerene nanoparticles positively influenced the DC resistivity of SE except for one value recorded at 140 °C (sample 1_SE), where the nanofluid showed a decrease of resistivity by around 18%. Enhancement of volume resistivity moved from around 4% (sample 1_SE at 25 °C) to 201% (sample 2_SE at 25 °C). Sample 2_SE can be considered the optimal concentration according to the average enhancement of volume resistivity, with 2.33-fold higher values in comparison to pure SE throughout the experiment.

5. Discussion

5.1. Experimental Data Integrity

The “not accepted” sample (1_SE) did not follow a Weibull distribution according to the p-value. To confirm the integrity of the data from the measurement of this sample, the Grubb’s test shown in Figure 8 was used. The graph clearly shows the integrity of the measured values, which are bounded by 0.05 level lines with no outlier throughout the course of the experiment. These facts are in accordance with recent scientific reports [20,21,22].

5.2. Dielectric Performance

Research on nanofluids is advancing, and it is therefore important to investigate different combinations of insulating fluids and different concentrations of nanoparticles. The variety of experiments is important, whether measurements are carried out at different frequencies and voltages or, as in this article, at different temperatures. According to IEC 60247, measurement of the quantities described in this paper should be executed at a temperature of 90 °C. In practice, high-voltage equipment works at various temperatures depending on the surrounding environment, load level, and changes caused by various failures that can influence insulation performance.
Dissipation factor, unlike relative permittivity and volume resistivity, increased with temperature, which was related to the deterioration of dielectric performance. The lowest influence of temperature increase was observed for NE and its mixtures with fullerene nanoparticles (samples 1_NE, 2_NE, and 3_NE). The optimal concentration of 0.03% w/v had the lowest average dissipation factor values, making this sample suitable for dielectric performance enhancement according to tanδ. Nevertheless, all samples of SE with fullerene nanoparticles had higher values than the NE samples. C60 nanoparticles enhanced the dielectric performance according to tanδ at all concentrations and temperatures. The optimal concentration of fullerene nanoparticles in SE was 0.02% w/v, with the lowest values of tanδ among the SE-based samples.
The relative permittivity of nanofluids according to these measurements can be divided into two groups around the curve of pure NE and the curve of pure SE. The group of NE and mixtures of NE and fullerene nanoparticles reached lower values of permittivity throughout the experiment. The differences among the remaining samples, with values around 0.1 higher, did not reach significance. It can be concluded that relative permittivity is not significantly affected by the concentration of nanoparticles and the difference is related to the kind of insulating fluid.
Volume resistivity was significantly influenced by increasing temperature. The group of NE and nanofluids with NE and fullerene nanoparticles showed higher values of DC resistivity in comparison to remaining samples, which were observed mainly at low temperatures. The optimal concentration of fullerene nanoparticles in NE was 0.03% w/v, with the highest values of resistivity at temperatures from 40 °C to 140 °C. Fullerene nanoparticles enhanced resistivity values at all concentrations up to 100 °C, and with higher temperatures, the differences between individual samples were not that significant.
When considering the examined dielectric performance measurements, it was found that NE nanofluids with fullerene nanoparticles had better dielectric performance than SE nanofluids. According to the dielectric performance, sample 3_NE reached better values than the remaining samples and can be considered an optimal concentration of fullerene nanoparticles in NE. The optimal concentration of fullerene nanoparticles in SE was 0.02% w/v.

5.3. AC Breakdown Voltage

The AC BDV results presented herein can be compared with our results obtained using a different experimental setup, which were recently published in [9]. In the published paper, the Haefely Hipotronics AC test set was employed to measure the AC BDV values of the nanofluids. The electrode separation distance was set to 2.5 mm, according to IEC60156. When comparing the two experiments, it was found that the experiment based on the BAUR Dieltest DTA device with an electrode separation distance of 1 mm (employed in this study) did not confirm the BDV performance reported in [9]. There, all C60 nanofluids based on SE (1_SE, 2_SE, 3_SE) exhibited deteriorated AC BDV values, as compared with the pure SE. However, in the present paper, we found that sample 1_SE exhibited greater AC BDV than the base SE by 8%. On the other hand, this study revealed deteriorated AC BDV performance of all NE-based samples, while the previously published study found slight improvements in AC BDV for samples 2_NE and 3_NE. It was suggested that the AC BDV enhancement could be associated with the electron capture ability and the photon absorption capacity of C60 nanoparticles. Now, presenting the different results obtained using the same batch of the SE and NE samples, we assume that the AC BDV of these nanofluids is rather stochastic and its mechanism is apparently dependent on the electrode separation distance or the sample volume confined between the electrodes. At the smaller electrode separation distance (1 mm gap), we did not find AC BDV enhancement to the same degree as was found with a 2.5 mm gap. One can assume that these different AC BDV behaviors are associated with the number of C60 nanoparticles present between the electrodes. In a larger sample volume, due to the greater electrode separation distance, there is a higher probability of an ejected electron being trapped by C60 nanoparticles. This assumption is based on the fact that along the shorter streamer path, the electron encounters fewer nanoparticles than on the longer path due to the greater electrode separation distance. However, this assumption requires further evidence-based experimental study supported by numerical simulation.
Besides the contradiction revealed in our experiments, the results obtained by measuring the AC BDV of samples of MIDEL eN 1204 nanofluids with nanoparticles in previously described concentrations had the opposite character to the measured values published in [13]. Beroual et al. concluded that concentrations of 0.1 g/L and 0.2 g/L decreased the mean value of AC BDV, but a concentration of 0.3 g/L enhanced it. Khelifa et al. [23] achieved an ideal scaling of the intermediate values of breakdown voltages for the synthetic ester MIDEL 7131, where C60 nanoparticles in any concentration contributed to the improvement of the AC BDV values of the nanofluids. The publication by Khelifa includes AC BDV results for different interelectrode distances—0.1 mm, 0.3 mm, 0.5 mm, 1 mm, 1.5 mm, and 2 mm—i.e., the values given in this publication can be directly compared with our measured values given in this paper.
Khelifa et al. also described Weibull characteristics in which an increase of AC BDV was observed at a breakdown probability of 1% in the range of +20.7%, +33.16%, and +26.48% for nanofluids with concentrations of C60 nanoparticles of 0.1 g/L, 0.2 g/L, and 0.3 g/L, while for the same probability, our values corresponded to differences of +18.75%, −22.98%, and −26.19%. Thus, the analogy was only observed for 0.01% w/v MIDEL eN 7131 nanofluid with fullerene nanoparticles. At a 50% breakdown probability, the evolution of values reported by Khelifa was +7.72%, +9.68%, and +13.41% for 0.1 g/L, 0.2 g/L, and 0.3 g/L concentrations of C60 nanoparticles, while for the same breakdown probabilities, our values corresponded to differences of −0.40%, −17.41% and −14.97%. No analogy can be observed from these values. When comparing the breakdown voltage values from the Weibull characteristic in this work and the data from the paper by Khelifa, note that in his publication, Weibull distribution was calculated from data measured with an interelectrode distance of 2 mm, while our values were measured at 1 mm.

6. Conclusions

According to the described results of AC BDV and dielectric performance measurement in SE- and NE-based nanofluids, the following can be concluded:
  • According to the presented AC BDV test, the optimal concentration of fullerene nanoparticles in SE and NE nanofluids is 0.01% w/v;
  • Only sample 1_SE showed enhancement in AC BDV (mean values). At a Weibull probability level of 1%, two samples (1_SE and 1_NE) reached increased values in comparison to their base oils of 32.93% and 18.75%, respectively;
  • Comparison with previously published results indicates that the AC BDV performance of the studied nanofluids depends on the electrode separation and the related sample volume;
  • According to the dielectric performance measurements, sample 3_NE returned the best and most complex results in comparison to the rest of the examined samples;
  • Sample 2_SE returned better results in comparison to pure SE and other SE-based nanofluids from the dielectric performance point of view;
  • NE and NE-based nanofluids showed better dielectric performance than SE and SE-based nanofluids; however, the AC BDV test showed opposite results, with higher values in SE and SE-based nanofluids.

Author Contributions

Conceptualization, M.Š. and J.K.; methodology, M.Š. and J.K.; validation, M.R., J.K.; investigation, M.A., M.Š. and M.K.; data curation, M.Š.; writing—original draft preparation, M.Š.; writing—review and editing, M.Š., J.K. and M.R.; visualization, J.K.; supervision, J.K.; project administration, M.Š.; funding acquisition, J.K. and M.R. All authors have read and agreed to the published version of the manuscript.

Funding

This work was supported in part by the Slovak Academy of Sciences and The Ministry of Education, Science, Research and Sport of the Slovak Republic in the framework of projects VEGA 2/0011/20, and VEGA 1/0154/21; and Slovak Research and Development Agency under the contract No. APVV-18-0160; and in part by the Ministry of Education, Youth and Sports of the Czech Republic under the project No. FEKT-S-20-6449.

Data Availability Statement

Data are contained within the article.

Acknowledgments

The authors acknowledge Katarína Paulovičová for the nanofluid preparation and the Centre for Research and Utilization of Renewable Energy, Brno University of Technology, Czech Republic, for providing the CVVOZEPowerLab Research Infrastructure. This publication is also the outcome of the project implementation: Innovative Testing Procedures for 21st Century Industry ITMS: 313011T565, by Operational Programme Integrated Infrastructure (OPII) funded by the ERDF.

Conflicts of Interest

The authors declare no conflict of interest.

References

  1. Rafiq, M.; Lv, Y.Z.; Zhou, Y.; Ma, K.B.; Wang, W.; Li, C.R.; Wang, Q. Use of Vegetable Oils as Transformer Oils—A Review. Renew. Sustain. Energy Rev. 2015, 52, 308–324. [Google Scholar] [CrossRef]
  2. Rozga, P.; Beroual, A.; Przybylek, P.; Jaroszewski, M.; Strzelecki, K. A Review on Synthetic Ester Liquids for Transformer Applications. Energies 2020, 13, 6429. [Google Scholar] [CrossRef]
  3. Šárpataky, M.; Kurimský, J.; Rajňák, M. Dielectric Fluids for Power Transformers with Special Emphasis on Biodegradable Nanofluids. Nanomaterials 2021, 11, 2885. [Google Scholar] [CrossRef] [PubMed]
  4. Havran, P.; Cimbala, R.; Kurimský, J.; Dolník, B.; Kolcunová, I.; Medveď, D.; Király, J.; Kohan, V.; Šárpataky, Ľ. Dielectric Properties of Electrical Insulating Liquids for High Voltage Electric Devices in a Time-Varying Electric Field. Energies 2022, 15, 391. [Google Scholar] [CrossRef]
  5. Khaled, U.; Beroual, A. AC Dielectric Strength of Synthetic Ester-Based Fe3O4, Al2O3 and SiO2 Nanofluids—Conformity with Normal and Weibull Distributions. IEEE Trans. Dielectr. Electr. Insul. 2019, 26, 625–633. [Google Scholar] [CrossRef]
  6. Charalampakos, V.P.; Peppas, G.D.; Pyrgioti, E.C.; Bakandritsos, A.; Polykrati, A.D.; Gonos, I.F. Dielectric Insulation Characteristics of Natural Ester Fluid Modified by Colloidal Iron Oxide Ions and Silica Nanoparticles. Energies 2019, 12, 3259. [Google Scholar] [CrossRef] [Green Version]
  7. Koutras, K.N.; Naxakis, I.A.; Pyrgioti, E.C.; Charalampakos, V.P.; Gonos, I.F.; Antonelou, A.E.; Yannopoulos, S.N. The Influence of Nanoparticles’ Conductivity and Charging on Dielectric Properties of Ester Oil Based Nanofluid. Energies 2020, 13, 6540. [Google Scholar] [CrossRef]
  8. Olmo, C.; Méndez, C.; Ortiz, F.; Delgado, F.; Ortiz, A. Titania Nanofluids Based on Natural Ester: Cooling and Insulation Properties Assessment. Nanomaterials 2020, 10, 603. [Google Scholar] [CrossRef] [PubMed] [Green Version]
  9. Šárpataky, M.; Kurimský, J.; Rajňák, M.; Paulovičová, K.; Krbal, M.; Pelikán, L. Synthetic and Natural Ester-Based Nanofluids with Fullerene and Magnetite Nanoparticles—An Experimental AC Breakdown Voltage Study. J. Mol. Liq. 2022, 368, 120802. [Google Scholar] [CrossRef]
  10. Huang, Z.; Wang, F.; Wang, Q.; Yao, W.; Sun, K.; Zhang, R.; Zhao, J.; Lou, Z.; Li, J. Significantly Enhanced Electrical Performances of Eco-Friendly Dielectric Liquids for Harsh Conditions with Fullerene. Nanomaterials 2019, 9, 989. [Google Scholar] [CrossRef] [PubMed]
  11. Mentlik, V.; Trnka, P.; Hornak, J.; Totzauer, P. Development of a Biodegradable Electro-Insulating Liquid and Its Subsequent Modification by Nanoparticles. Energies 2018, 11, 508. [Google Scholar] [CrossRef] [Green Version]
  12. Szcześniak, D.; Przybylek, P. Oxidation Stability of Natural Ester Modified by Means of Fullerene Nanoparticles. Energies 2021, 14, 490. [Google Scholar] [CrossRef]
  13. Beroual, A.; Duzkaya, H. AC and Lightning Impulse Breakdown Voltages of Natural Ester Based Fullerene Nanofluids. IEEE Trans. Dielectr. Electr. Insul. 2021, 28, 1996–2003. [Google Scholar] [CrossRef]
  14. Chen, J.; Sun, P.; Sima, W.; Shao, Q.; Ye, L.; Li, C. A Promising Nano-Insulating-Oil for Industrial Application: Electrical Properties and Modification Mechanism. Nanomaterials 2019, 9, 788. [Google Scholar] [CrossRef] [PubMed] [Green Version]
  15. Wang, Y.; Wang, F.; Li, J.; Liang, S.; Zhou, J. Electronic Properties of Typical Molecules and the Discharge Mechanism of Vegetable and Mineral Insulating Oils. Energies 2018, 11, 523. [Google Scholar] [CrossRef] [Green Version]
  16. Duzkaya, H.; Beroual, A. Statistical Analysis of AC Dielectric Strength of Natural Ester-Based ZnO Nanofluids. Energies 2020, 14, 99. [Google Scholar] [CrossRef]
  17. Timoshkin, I.V.; Fouracre, R.A.; Given, M.J.; MacGregor, S.J.; Mason, P.; Clephan, R. Dielectric Properties of Diala D, MIDEL 7131 and THESO Insulating Liquids. In Proceedings of the 2008 Annual Report Conference on Electrical Insulation and Dielectric Phenomena, Quebec City, QC, Canada, 26–29 October 2008; pp. 622–625. [Google Scholar]
  18. Galar, D.; Kumar, U. Chapter 6—Prognosis. In eMaintenance; Galar, D., Kumar, U., Eds.; Academic Press: Cambridge, MA, USA, 2017; pp. 311–370. ISBN 978-0-12-811153-6. [Google Scholar]
  19. Volume Resistivity: Electrical Resistivity of Plastic. Available online: https://omnexus.specialchem.com/polymer-properties/properties/volume-resistivity (accessed on 21 March 2022).
  20. Fasehullah, M.; Wang, F.; Jamil, S.; Bhutta, M.S. Influence of Emerging Semiconductive Nanoparticles on AC Dielectric Strength of Synthetic Ester Midel-7131 Insulating Oil. Materials 2022, 15, 4689. [Google Scholar] [CrossRef]
  21. Beroual, A.; Khaled, U. Effect of Nanoparticles’ Mixtures on AC Breakdown Voltage of Mineral Oil. IEEE Trans. Dielectr. Electr. Insul. 2021, 28, 1216–1222. [Google Scholar] [CrossRef]
  22. Khelifa, H.; Beroual, A.; Vagnon, E. Effect of Conducting, Semi-Conducting and Insulating Nanoparticles on AC Breakdown Voltage and Partial Discharge Activity of Synthetic Ester: A Statistical Analysis. Nanomaterials 2022, 12, 2105. [Google Scholar] [CrossRef] [PubMed]
  23. Khelifa, H.; Vagnon, E.; Beroual, A. AC Breakdown Voltage and Partial Discharge Activity in Synthetic Ester-Based Fullerene and Graphene Nanofluids. IEEE Access 2022, 10, 5620–5634. [Google Scholar] [CrossRef]
Figure 1. AC BDV distribution of NE-based nanofluids. The symbols indicate individual data points from successive measurements. The experimental data were fitted with a trending linear straight line by the equation displayed in the right bottom corner.
Energies 16 00343 g001
Figure 2. AC BDV distribution of SE-based nanofluids. The symbols indicate individual data points from successive measurements. The experimental data were fitted with a trending linear straight line by the equation displayed in the right bottom corner.
Energies 16 00343 g002
Figure 3. The box plot of AC BDV data defined by the first and third quartiles. The data are presented for the pure esters and nanofluids with fullerene nanoparticles. The medians are shown in the graph as a thick line and the mean value position is portrayed as a square inside each data box. The line segments which pass by each box represent the standard deviation σ, and kernel density is displayed as a curve on the right side of each box. Dots with colors from red to blue represent the first and last measurements of AC BDV, respectively.
Energies 16 00343 g003
Figure 4. Weibull distribution graphs showing the particular breakdown probabilities. Colored points represent the measured data, and the thick lines show the fits to the theoretical distribution (estimated at significance alpha 0.05) given by formula (1). The graphs are presented as semi-log graphs, and therefore the fitted lines appear as straight lines. (a) NE-based nanofluids and pure NE, (b) SE-based nanofluids and pure SE.
Energies 16 00343 g004
Figure 5. Dissipation factor thermal dependence (from 25 °C to 140 °C) of all examined fluids. The samples showed a monotonically increasing dissipation factor with temperature. Detailed curves at lower temperatures are shown in the upper left corner.
Energies 16 00343 g005
Figure 6. Relative permittivity thermal dependence (from 25 °C to 140 °C) of all examined fluids. The permittivity was measured at 50 Hz frequency with an electrical stress of 1 kV/mm.
Energies 16 00343 g006
Figure 7. Volume resistivity thermal dependence (from 25 °C to 140 °C) of all examined fluids. Detailed curves at higher temperatures are shown in the upper right corner. The value of electrical stress was 0.305 kV/mm.
Energies 16 00343 g007
Figure 8. Graphical representation of Grubb’s test of sample 1_SE. Red and blue lines represent limit values of AC BDV at alpha 0.05 and individual measurements are marked as square symbols. The dotted line represents the mean value of AC BDV of the tested sample.
Energies 16 00343 g008
Table 1. The physicochemical properties of the base fluids [5,16].
PropertiesMIDEL 7131MIDEL eN 1204
Density at 20 °C (g/cm3)0.970.92
Kinematic viscosity at 40 °C (mm2/s)298
Pour temperature (°C)−56−31
Flash point (°C)260>315
Fire point (°C)316>350
Total acid number (mg KOH/g)<0.03 mg0.04
Table 2. Fullerene concentrations in examined samples.
Base OilConcentration of C60 NanoparticlesSample Name
NE-NE
NE0.01% w/v1_NE
NE0.02% w/v2_NE
NE0.03% w/v3_NE
SE-SE
SE0.01% w/v1_SE
SE0.02% w/v2_SE
SE0.03% w/v3_SE
Table 3. Mean values, standard deviation, and change of examined nanofluids.
SampleMean Values of AC BDV (kV)St.Dev (kV)Change (%)
SE33.464,80-
NE32.524.38-
1_SE36.143.128.01
2_SE23.685.39−41.30
3_SE24.864.62−34.59
1_NE32.232.94−9.00
2_NE26.814.12−21.30
3_NE27.264.64−19.30
Table 4. Test of conformity to Weibull distribution of executed samples.
SampleShapeScalep-ValueConformity to Weibull Distribution
SE8.31835.463>0.25Accepted
NE8.35234.370.248Accepted
1_SE14.14737.539<0.01Not accepted
2_SE4.68925.817>0.25Accepted
3_SE6.29426.743>0.25Accepted
1_NE13.01833.519>0.25Accepted
2_NE7.30528.565>0.25Accepted
3_NE6.68129.1910.236Accepted
Table 5. Mean values, standard deviation, and change of examined nanofluids.
SampleAC BDV Probability 1% (kV)AC BDV Probability 10% (kV)AC BDV Probability 50% (kV)
Increase/Decrease (%)Increase/Decrease (%)Increase/Decrease (%)
SE20.527.1234
---
NE19.8926.2532.86
---
1_SE27.2532.6436.6
+32.93+20.35+7.65
2_SE9.7316.0424.53
−52.54−40.86−27.85
3_SE13.1318.7125.89
−35.95−31.01−23.85
1_NE23.6228.2732.73
+18.75+7.7−0.4
2_NE15.322127.14
−22.98−20−17.41
3_NE14.6820.9827.94
−26.19−20.08−14.97
Disclaimer/Publisher’s Note: The statements, opinions and data contained in all publications are solely those of the individual author(s) and contributor(s) and not of MDPI and/or the editor(s). MDPI and/or the editor(s) disclaim responsibility for any injury to people or property resulting from any ideas, methods, instructions or products referred to in the content.