Abstract
The lubricating oil industry is widespread in the world, but getting rid of the used oils has become an environmental concern. Lubricating oils are used in industries and cars but potentially contaminate groundwater after use. This research uses montmorillonite clay to refine old oil treated with acetic acid. Compared to more conventional procedures, the suggested strategy for treating waste oil is more cost-effective due to the relatively inexpensive cost of the acid and the modest process conditions. Water content, sediment content, density, flash and fire points, viscosity, viscosity index, total acid and base number, pour points, and refractive index were among the physicochemical parameters of the treated oil that were examined as a result of this treatment. We analyzed the oils using Fourier transform infrared spectroscopy (FTIR) and atomic absorption spectrometry (AAS). New oil (10w 40), old oil, oil treated with acetic acid, and montmorillonite clay were all put through their paces in a battery of tests. The therapy’s physical and chemical alterations were examined across all fields. The findings demonstrated the efficiency of montmorillonite clay due to the strength of the acid to separate the sludge and the lack of compounds hazardous to the environment. The process described here enables recycled oil to be reclaimed as base oil.
1. Introduction
Everybody wants to live a better life. Advances in technology over the last two centuries have led to significant enhancements in the field of transportation. As a result, modern applications need well defined upkeep, especially for lubricants. The latter helps ensure that the metal components of an internal combustion engine do not become too hot by rubbing against one another. The lubricants comprised base oil (80–90%) and additives (10–20%). Additionally, these substances have been included to enhance oils’ performance. The main objective of this section is to present the use of used lubricating oils as a possible base oil source to avoid groundwater pollution.
Using lubricating oils can be a cost-effective way to produce base oils for industrial purposes. This would allow the production of high-quality products without using any new raw materials and without affecting groundwater [1]. To provide a cheaper alternative to diesel and paraffin for the South African industrial heating fuel market, researchers in that country looked into the manufacturing of light oil 10 (LO10) fuel from spent vehicle lubricating oil. The physical parameters of old automobile lubricating oil are different from the specified requirements for light oil 10 fuel. Hence the two must undergo processing to converge on those values [2].
Viscosity and density, two lubricating qualities, are lost when a lubricant degrades at high heat. To keep the motors in tip-top shape, they must be replaced at regular intervals. Because of technological advancements, there are now more cars on the road. Thus, the oil-changing process generates massive amounts of waste oil, estimated at several million tons annually. According to Algeria’s primary provider of lubricating oils, NAFTAL (National Company of Refining and Distribution of Petroleum Products), 89.64% of waste oils are not collected yearly. Some oil companies dispose of their waste by dumping it into wetlands connected to larger bodies of water. Therefore, oily residue from runoff is also entering the water supply [1].
The susceptibility, shown by several studies [3], is to chemical contamination from the seepage of waste oils into the earth. There is a one-to-one infection rate between used oil and water [1], meaning that one liter of oil may contaminate a million gallons of water. The waste oils also pose a severe threat to both ecosystems and human health. These dangers are both direct and indirect. Consumption of polluted water causes immediate intoxication. Results from life cycle assessments [4] reveal that regeneration has a lesser environmental footprint than making new base oil from crude oil. However, in several effect categories, LCA studies disagree on whether or not regeneration is the best choice. The lubricant industry, energy consumption, distance to treatment facilities, operation expenses, end product quality, and technological advancement are all factors that should be considered when deciding on a treatment path.
The removal of WLO into the climate might represent a high gamble of harm to the environment. Concerning the board of waste produced [4], EU nations show a move for reusing WLO, with a rivalry among recovery and energy healing. Even with market tension for utilizing WLO as fuel, EU regulation recommends the acquaintance of arrangements with elevated recovery in inclination to coordinate consumption or creation of fills.
Additionally, possible contamination in the food chain is an indirect risk factor. Because of their composition, used oils should no longer be disposed of in landfills. Therefore, it is imperative to find a suitable recycling solution. Besides, this recycling promotes the recovery of used lubricating oil. It avoids depletion of the natural source of the base oil.
Natural resources are not infinite, and we should do our best to make them last longer. One way to do that is by recycling the used lubricating oils as a base oil source, which will prevent groundwater contamination.
There are many examples of how recycled oils can be used, for instance, in producing biofuel, an alternative energy source that can replace fossil fuels. The biofuel production process converts organic matter, such as vegetable oil or animal fat, into biodiesel and other compounds through a chemical process called transesterification (the cycle where fat or oil responds with liquor to frame esters and glycerol) [5].
Recycling lubricating oil using acids and clay is one of the oldest methods used in this field. This method is still used today, providing good results regarding oil quality and recovery percentage [6]. Udonne and Bakare altered the nature of the acid (sulfuric acid, hydrochloric acid, and nitric acid) and clay (three different samples of clay deposits) [7]. They used 10% of each acid type and 30 g of clay to treat 100 mL. Further, these three clay samples had high adsorption properties, which allowed waste oil to remove impurities and the black color. Suppose the cost of treating 1 L of waste oil must be calculated. In this case, the amounts will be as follows: 100 mL of each acid’s type, sulfuric acid (€11.6 EUR), hydrochloric acid (€19 EUR), and nitric acid (€35.2 EUR), in addition to about 30 g of clay (approximately €16 EUR). The results are as follows (the cost to treat 1 L of oil with sulfuric acid is €27.6 EUR; on the other hand, hydrochloric acid is €35 EUR, and nitric acid for €51.2 EUR) [7]. After experimenting, the highest yield was obtained using sulfuric acid. This method formed a sludge texture, and an environmental drawback remains due to this composition. Hamawand used acetic acid because it did not react or reacted little with essential oils [8]. The results obtained in this study show that recycled oil treated with acetic acid is comparable to oil produced by other basic methods. This method is optimal for recycling waste oil at room temperature and atmospheric pressures. In this study, 0.8 mL of glacial acetic acid was used to treat 10 mL of oil, while 4 g of kaolinite was used for only 1 mL of oil, which is very large compared with other operations. The cost of treating 1 L of used oil in this process was calculated as follows: 80 mL of glacial acetic acid was €6.496 EUR, along with 4000 g of kaolinite, which was €214.4 EUR, making a total of €220.9 EUR, which is a very high cost [8].
Many methods were introduced earlier. The life cycle assessment (LCA) and ReCiPe 2016 impact assessment methodologies were used to evaluate the various WLO treatment techniques (re-refining used oil for base oil recovery, using WLO as a replacement for fossil fuels in cement kilns, and burning WLO in waste in-cinerators with energy recovery) [9]. Based on the findings of the LCA, there is not a single WLO treatment technique that consistently has fewer environmental consequences than the others.
Additionally, another study found that between 2015 and 2019, Serbia promoted over 22,000 metric tons of additional oil yearly. Less than twenty percent of waste grease oil (WLO) was managed, with the remainder being uncollected or disposed of improperly. The results indicate [9] that, even if the worst-case WLO scenario for the CEOs in Serbia is considered, the country might save up to 22,100 tCO2 and 34,300 t oil equivalent each year. In addition to the acids mentioned earlier, Abu-Elella et al. [10] also tested formic acid treatment. Then, a treatment process was used to produce clay and formic acid. Later, the oxidized oil particles were still present, even after clay and formic acid formation. Besides, this clay–acid process has many drawbacks, such as the quality of the recovered oil, the TAN, which was higher than that in other treatments, and the appearance of other components according to FTIR analysis. Quantitatively, 10% acid and 10% activated clay were used in this study [11]. Thus, the cost of treating 1 L of waste oil is €9.42 EUR for formic acid and about €5.7 EUR for activated clay (approximately €15.12 EUR) [10]. It indicates that other methods have proven to be effective. The solvent extraction process used replaced the acid treatment. The solvent selectively dissolves unwanted aromatics (extraction) and isolates (refining) the desired saturated components, particularly alkanes. The extracted oils are treated with clay, and in this process, often the solvents are recovered, which is considered one of the most important for waste oil recovery. Still, the problem of large quantities of waste solvents remains an obstacle [11].
The other two recycling methods in the experiment use engine oil for vacuum distillation and hydrogenation. Kinetics Technology International (KTI) combines vacuum distillation and hydro-finishing. The main disadvantage of using this method is investing in high costs [1]. Hence, the optimal solution for recycling waste oils is an energy-efficient process that uses non-toxic and economical materials.
Research by Constantinescu M. further shows that fuels created by pyrolytic methods employing plastic wastes are in the family of alternative fuels [12].
The oil’s greater heating value was in the 40.17–45.35 MJ/kg range, making it suitable for a diesel engine fuel substitute. Further, the obtained oil’s sulfur level is within the permitted limits (10 mg/L). Therefore, it does not pose any environmental risks [13].
Therefore, this study aims to provide all the integral elements for recycling waste oils into base oils with low environmental impact and high energy performance.
2. Materials and Methods
The concentrated materials were greasing up oil and utilized greasing up endlessly oil treated with acidic corrosive. Further, the greasing-up crude was treated with Montmorillonite K10 Earth (surface area 220–270 m2/g. Al2H2O12Si4. M: 360.31 sigma Aldrich company made in US ). The new greasing-up oil used in this study was Naftilia (10W-40), made in Algeria
The climate security group, the Blacksmith Institute, has observed that countless utilized greasing-up oils are disposed of or spilled every year. This is a vast natural issue because of the harmful synthetics in these oils. The Metal Forger Establishment accepts that this can be settled by re-refining and reusing these oils into diesel fuel.
Greasing up oils is often just great for seriously greasing up oil. However, with the re-refining process, it can likewise make diesel fuel and even black-top fuel. Nonetheless, one of the fundamental issues is how to safeguard against spills in plants. All of the waste oils were collected from car engines. Oil changes in the vehicles were performed after traversing 10,000 to 10,200 km.
Moreover, the samples were homogenized and transferred to a suitable tank. They were protected from light at room temperature for 24 h to allow the large suspended particles to settle by gravity. In other words, this study used the acid–clay process to recycle used engine oils. It is less expensive than other methods because glacial acetic acid separates suspended substances from the oil. In addition, it does not relatively affect the environment [8].
First, samples were heated to 120 °C for one hour at atmospheric pressure to remove traces of water. After cooling to room temperature, glacial acetic acid was added to the solution. Additionally, 99% of glacial acetic acid (Sigma Aldrich: 60.05 g/mol) was used for this procedure. To determine the ideal percentage of acid required for waste oil pretreatment, the acid to waste oil weight ratio varied from 5 to 15%, i.e., 5%, 7%, 9%, 11%, 13%, and 15%. Then, acid and oil were mixed for 30 min without any temperature change. Afterward, the mixture was left to rest for 12 h. Grease and sludge were observed in two phases. The higher the percentage of acid added, the greater the quantity of sludge.
Nevertheless, from 12% acid, the quantities of separated oil and sludge did not vary anymore; 19.5 mL ge and 92.5 mL oil were considered. The volume percentage of sludge obtained was approximately 17.41%. A vacuum pump was used to remove the treated oil, and Montmorillonite K10 clay was added to the oil. The clay was added to eliminate oxidation-specific oil components’ dark color and odor. Further, the clay was added at 40 °C to decrease oil viscosity and facilitate the clay–oil mixture. The proportions used were 4 g of K10 clay per 100 mL oil. The combination was then stirred for 15 min in a closed container and filtered under a vacuum. In this study, the porosity of the filter paper was 110 mm. This operation removed most of the clay that interacts with the oil. The filtrate was then transferred to tubes with a capacity of 15 mL.
It was then centrifuged for 30 min (SIGMA 3-30K, made in Germany). The speed of rotation used was 10,000 revolutions per minute to remove clay particles suspended in the oil. This process produces a light-yellow base oil and sludge. The base oil recovered from this process is a transparent yellow oil, whose color is very close to the color of the new oil. The mass of the sludge was close to the initial weight of the K10 clay. This method leads to getting rid of the acid residues suspended in the oil, noting that the previous step (separating the oil from the sludge) is to keep the bulk of the acid with the sludge.
Sludge may pose another environmental problem, but not as much as the problem of used oil due to its small quantity, but the best way to eliminate it remains to dry it. These materials can also be used by pyrolysis to save energy and eliminate them permanently, as this method is a safe solution to this problem [14].
2.1. Analytical Methods
2.1.1. Physical Characterization Methods
Flash and Fire Point ASTM D 92-11
The flash point measures the tendency of a material to form an explosive mixture with air under controlled laboratory conditions. It is only one of the many properties to consider when assessing overall flammability risk. The flash point also indicates the potential presence of highly volatile and flammable materials in relatively nonvolatile or nonflammable materials. Besides, the fire point provides information on the ability of a material to sustain combustion [15]. The flash and fire points were determined according to ASTM D 92-11. This dynamic method is primarily used for viscous materials with a flash point of 79 °C or higher that will sustain combustion for at least 5 s. Following the standard, the Cleveland open-cup device was used to perform the measurements.
The sample (70 mL) required for each test was placed in a clean and dry cup. It was heated at a rate such that the temperature indicated on the thermometer increased from 5 °C to 17 °C/min. When the sample temperature was approximately 56 °C below the expected flash point, the heat input was reduced so that the temperature only increased by 5 to 6 °C/min. At regular intervals corresponding to temperature differences of 3 °C, a flame was directed onto the sample pan with a stable and continuous movement as soon as the sample temperature was approximately 28 °C below the expected flash point. The flash point is the lowest temperature of the liquid at which the application of the flame causes the sample to vaporize to ignite. The test continued until the flame’s application caused it to ignite and burn for at least 5 s to determine the flash point [16]. Flashpoints are characteristic of the device configuration and the operating procedure performed. No reasonable correlation was guaranteed between the results obtained with the different test devices.
Apparent Viscosity ASTM D2196
The apparent viscosity of a fluid is a measure of its resistance to deformation at a specified speed. It is obtained by measuring the torque of a modulus rotating in a material at a given constant rotational speed. The apparent viscosity can be designed to measure the frictional force between adjacent fluid layers in relative motion [17]. It was determined according to ASTM D2196, which determines the thixotropic properties of non-Newtonian materials. Measurements were performed using a Brookfield Model LVDV-III U (made in France) viscometer (with a Spindle no. 1 and a torque between 10 and 20%) coupled to a computer. The temperature was controlled using a Heidolph EKT Hei-Con (made in China) digital thermometer. After stabilizing the measurement, Rheocalc software provided the calculated values in mPas.
Viscosity Index ASTM D2270
The viscosity index characterizes the variation in kinematic viscosity of a petroleum product with temperature. It allows for classification into different categories. It was determined according to the ASTM D2270 standard and based on the kinematic viscosity variation measured at 40°C and 100°C. The viscosity index of the oil was calculated using Equation (1).
where L is the viscosity of the oil at 40 °C having 0 viscosity index with the same kinematic viscosity at 100 °C as the viscosity index of fat to be calculated. However, Y is the viscosity at 100 °C of the viscosity index oil to be calculated, and H is the viscosity at 40 °C of a viscosity index 0 oil having the same kinematic viscosity at 100 °C as the viscosity index oil to be calculated [18].
VI = [(L − U)/(L − H)] × 100
Pour Point ASTM D97
The pour point represents the lowest temperature at which oil movement was still observed. This value was determined according to ASTM D97. Further, the pour point of an oil sample is a temperature index that indicates its lowest utility in particular applications [19]. It was first heated to 9 °C above the expected pour point without agitation and then placed in a freezer for cooling. An Ebro TFI 500 class II thermocouple was used to monitor the core temperature of the samples. At each decrease of 3 °C, it was removed from the freezer. Due to limited visibility, the surface was wiped with clean paper soaked in alcohol. The sample container was tilted to verify the appearance of the sample and its flow characteristics. The process should be carried out for 3 s only.
Refractive Index ASTM D1747
The refractive index is a fundamental physical property that can be used, along with other properties, to characterize hydrocarbons and their mixtures. The refractive index in correlative methods for determining the crude composition of oils often requires high-temperature measurements. It also predicts physical results, such as molecular weight [20]. The refractive index (RI) was determined according to ASTM D1747. A precision refractometer (Abbe NOVEX HOLLAND made in Netherlands) capable of measuring refractive index between 1.30 and 1.7 was used for this study. After cleaning the prism faces, a sample of at least 0.5 mL was placed on the prism and analyzed. This sample should be free of suspended solids, water, or other materials that interact with light. Measurements were made at a test temperature of 20 °C ± 0.2 °C and performed twice for each sample.
Density ASTM D 1481
The density of the oil, often recorded in technical documents, is the ratio between the mass of a particular volume of oil at a given temperature (usually 15 °C or 20 °C) and the same volume of water at 4 °C. It is referred to as d (15/4) or d (20/4). The density governs the quality of crude oils. However, density can help predict the composition of hydrocarbons, and the heat of combustion is correlated with other properties. Density is an important quality indicator for automotive, aviation, and marine fuels and affects storage, handling, and discharge.
The oil density was determined according to ASTM D 1481 [21]. A volume of 10 mL oil was obtained using a graduated pipette. The oil was stirred to homogenize the sample. The test sample was then placed in a beaker that was previously measured (M0) using a precision balance (Sartorius). All of this was then weighed (M) on the same ratio. The temperature of the samples was monitored using a thermometer (Heidolph EKT Hei-Con). Density was measured 23 times for each model. The oil density is then obtained using Equation (2):
where M − M0 is the sample mass in g and V is the sample volume (10 mL).
ρ(kg m−3)= (M − M0)/V
2.2. Chemical Characterization Methods
2.2.1. Water Content ASTM D 4007
The water content in engine oil depends on the quality of the oil, its physicochemical properties, the processing technology, and the conditions of storage and use. Since oil is hygroscopic, it can absorb water from the air or condensation, oxidation, and neutralization. If the engine oil has high water and sediment content, this can cause corrosion problems and negatively affect the machinery [22]. An equal volume of crude oil and water-saturated toluene is placed in a conical centrifuge tube. Afterward, centrifugation, water density, and sediment at the bottom can be read. The Froilabo Firlabo SW9 (made in France) centrifuge was used.
2.2.2. Total Acid Number (TAN) ASTM D974−14
New oils are inspected to determine if the oil’s acidity has changed. An increase in acidity could have adverse consequences, such as wearing certain engine parts due to high acid. Concentration: a calculation of the sum of acid compounds in a petrochemical specimen is a total acid number, TAN. It is determined according to ASTM D974-14 [23]. This number is used as a reference in lubricating oil formulation quality control. Sometimes, it is also used to measure the deterioration of lubricants. TAN is the number of milligrams of potash required to neutralize the acids in 1 g of oil. The standard method for determining the TAN value of a sample is titration. Then, it is dissolved in a mixture of toluene and isopropyl alcohol containing a small amount of water. The resulting single-phase solution is titrated with a standard alcohol base at room temperature. In this titration method, p-naphtolbenzein (Sigma Aldrich 374.43 g/mol) is used as an indicator. The acid number of oil is obtained from Equation (3):
where A is the amount of KOH solution (ml) required for the sample titration, B is the amount of KOH solution (ml) required for the blank titration, M is the molarity of the KOH solution, and W is the weight of the sample (g). Total base number (TBN) is also considered.
Total acid number(mg KOH/g) = [(A − B) M × 56.1]/W
Oils and lubricants contain essential compounds to neutralize the acids produced during combustion. They prevent corrosion of engine components, and a low TBN means that the oil must be changed.
The total base index is also obtained using ASTM D974 14 [23]. The standard method for determining the TBN value is titration. Then, toluene, isopropyl alcohol, and a touch of water dissolve it. A 0.1 M hydrochloric acid solution titrates the single-phase solution at room temperature. In this titration method, the color indicator is methyl orange. The oil total base number is then obtained from Equation (4):
where E is the HCl (37%) solution volume needed for the sample (mL) titration, where the molarity of the HCl solution is denoted by “m.” Instead, F is the volume of KOH (in mL) required for the acid number blank titration, M is the molarity of the KOH solution, and W is the mass of the sample (g). Infrared spectrum analysis is also conducted.
Total base number(mg of KOH/g) = [(Em + FM) × 56.1]/W
Fourier transform infrared spectroscopy (FTIR) plays an essential role in lubricant condition monitoring, with its ability to analyze various associated functional groups. This technique can identify chemical changes in lubricants. However, while FTIR oil analysis provides helpful detail, the results are expressed in qualitative and arbitrary terms related to the porous nature of the compounds [24].
The infrared analysis was performed following the ASTM E2412-10 standard. Fourier transforms infrared (FT-IR) spectroscopy gives direct information on molecular species of interest, such as additives, fluid decay products, and external contaminants, for the molecular analysis of lubricants. FTIR spectra were acquired with a SHIMADZU FTIR (made in China) instrument (IR Prestige-21). A transmission mode was used, and the spectra were collected in the region of 4000 cm−1–400 cm−1 with a spectral resolution of 4 cm−1. We used the Blank KBr holder for placing samples on it. The spectrum (KBr) was removed from the oil spectra.
2.2.3. Atomic Absorption Spectrometer (AAS) Metal Analysis (ASTM D-5863)
Base engine oils are generally free of metals, indicating their purity. Some metals are added to crude oils to improve performance. The amounts of metals range from a few 100 to 1.000 ppm in engine oil blends, and their concentrations increase as the engine oil boiling points or API gravity decreases. The metallic elements in engine oils are bound to heavy compounds and are primarily found in the residue. These compounds are corrosive to metal parts [25].
Analytical procedures for determining metals in crude oils and residual fuels by flame atomic absorption spectrometry are outlined in the ASTM D-5863 standard (AAS). Instrumental sensitivity, sample size, and dilution volume all have a role in determining the concentration ranges that may be tested using these techniques. Flame AAS analyzes an organic solvent-diluted sample. To calibrate this test for dissolved metals, oil-soluble metals are used. The PerkinElmer Atomic Absorption Spectrometer Analyst 400 was used to determine the presence of metals in oils. V-SOLV ™ ICP (VHG USA) solvent was used for dilution (VHG standards). In other words, a blank is required for the FAAS. It is obtained from 75 CST Base Oil Blank (VHG standards) mineral (USA). This oil was mixed with organometallic prototypes (V21 Wear Metals −100 µg/g (VHG standards LGC standards company made in USA) that cover the concentration ranges specified to establish standard curves for the different elements to be analyzed.
NB: After obtaining the calibration curves, the oils were analyzed. the calibration curve Figure 1 represent the Lead and Figure 2 represent the Chrome, Figure 3 is the Magnesium, Figure 4 is Iron, Figure 5 and Figure 6 is the Copper and Cadmium.
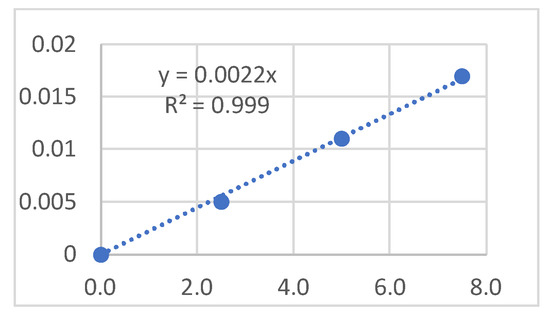
Figure 1.
Pb calibration graphs.
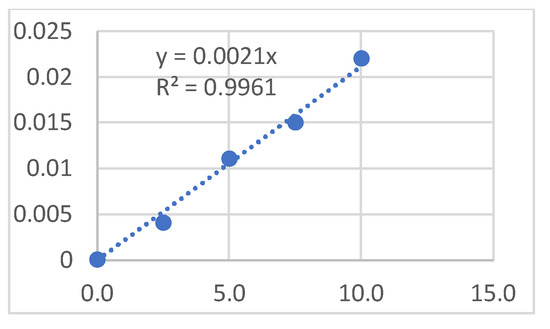
Figure 2.
Cr calibration graphs.
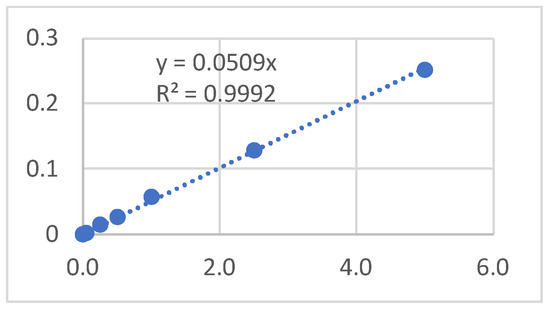
Figure 3.
Mg calibration graphs.
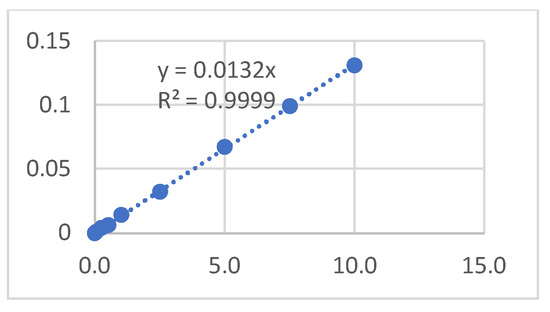
Figure 4.
Fe calibration graphs.
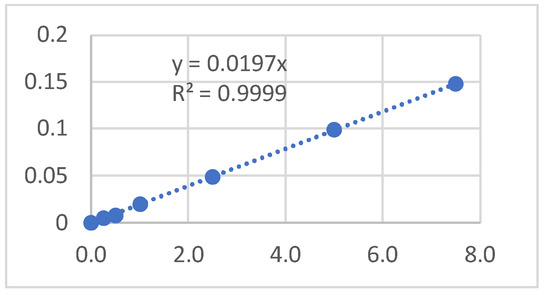
Figure 5.
Cu calibration graphs.
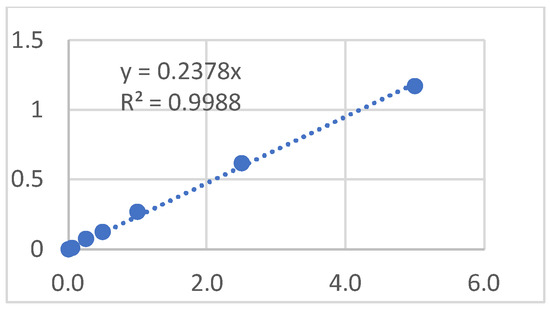
Figure 6.
Cd calibration graphs.
They illustrate calibration graphs for each element.
3. Results
Table 1 presents the results of the physical analyzes that were carried out for the oils and water content and Total acid and base number.

Table 1.
Results of the analysis of oil’s physical and chemical properties.
- FTIR analysis
Figure 7 is an example of the spectra obtained. The analysis of the peaks makes it possible to identify the class of the link and determine to which component it corresponds (Table 2).
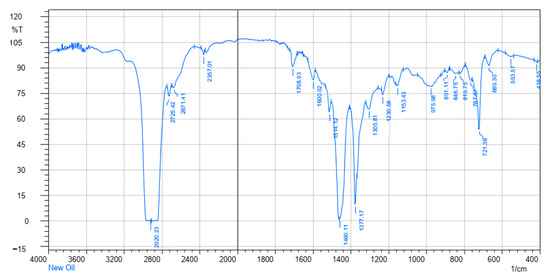
Figure 7.
IR spectra of the new oil.
Table 2.
Analyses of IR spectra (new oil).
The Table 3 present the analysis of metals by atomic absorption spectrometer (AAS).
Table 3.
Results of metal analysis of atomic absorption spectrometer (AAS).
4. Discussion
4.1. Physical Properties
- Flash and fire points
The same observations can be made for these two physical properties of the oils. The flash point of the new oil (NAFTILIA 10W40) is 253 °C. The slight difference observed between the measured flash point of the new oil and that given by the supplier (Table 1) is due to the measurement conditions used and the error rate in the laboratory. The flash point of the engine oil (224 °C) is lower than that of the new oil, but it is higher than that of the oil treated with K10 clay or acetic acid. A shallow flash point for engine oil indicates that the oil is contaminated with substances such as gasoline [8]. The decrease observed between the flash point of engine oil (224 °C) and that of new oil is undoubtedly due to pollution by fuel and oxidants. However, a slight increase is observed after adding acetic acid. The acid eliminates certain substances that reduce the oil’s purity. As far as the fire point is concerned, it is ten degrees above the flash point.
- Apparent viscosity and viscosity index
A significant difference is observed between laboratory and factory results in measuring new oil viscosity. It is due to the method adopted to calculate its degree. The manufacturer uses the ASTM D445 method [26], and the laboratory measurement is under ASTM D2196 [17]. Regardless of the oil category, the viscosity and the value of the measurement temperature are mutually related. Since the temperature of the engine oil increases, the thickness decreases. Comparison of the results presented in Table 1 shows that oil induces a decrease in viscosity regardless of the temperature. Viscosity measurements provide information on the presence and nature of contaminants in used engine oil [27]. However, oxidized and polymerized products dissolved and suspended in the oil can cause an increase in oil viscosity. In contrast, a decrease in engine oil viscosity indicates fuel contamination. Thus, the decline in thickness observed between new and used oil confirms that used oil is polluted by fuel [28].
Furthermore, the results show that the viscosity of the treated oils is lower than that of the waste oils. The waste oils lose their properties during use, and the additives can no longer perform their functions properly. Moreover, it is likewise confirmed by the acid and clay treatment. The viscosity gradually decreases as the oil loses the number of additives in it. Viscosity index enhancers are among the standard additives that increase oil performance. However, engine oil tends to degrade more quickly with a high level of added viscosity index enhancers. The scarcity of aromatic and volatile compounds results in a high viscosity index. It also means good thermal stability and moderate low-temperature behavior [29]. The results summarized in Table 1 indicate that the new oil has a slightly higher viscosity index than the used oil. When acid is added, the viscosity index decreases further. It then increases after the final treatment of the oil with clay. The procedure has finally removed the oil of acidic compounds and unwanted substances.
- Pour point
An important variable is the pour point at which engine oil is poured, especially when starting the engine in cold weather. The oil must flow through the oil pump and then be pumped, even at low temperatures, to the various areas of the machine [27]. Most base engine oils contain waxes and kerosene that solidify at low temperatures. For engine oils with a high kerosene content, the duration of fluid movement is prolonged compared to those without these substances. The viscosity of the oils largely determines the pour point, and high flow rates characterize the high density of engine oils. However, the pour point of new oils (Table 1) is almost equal to that given by the manufacturer, considering the laboratory error rate. After using the oil, it can be noticed that the pour point is increased. It is due to the refining loss of the oils. The oils must have acquired a percentage of kerosene or wax, freezing at a higher temperature. It can be noticed that the pour point of oil increases at each stage of the treatment process. The pour point of new oil is equal to −24. However, after use, the pour point rises to −16. After treating the used oil with acid, the pour point increases to −14. After the final treatment the pour point reaches −11. This increase is due to the loss of materials during different treatments, especially the loss of the additive responsible for the degree of oil pouring
- Refractive index
Low refractive index values indicate that the oils are pure, and high values suggest the existence of aromatic compounds and thus confirm the contamination of the oils [30]. From the results (Table 1), the refractive index of the new oil is relatively low compared to the refractive index of the other oils. This result is an indication of the purity and validity of the oil. After the oil is used, the refractive index is observed due to contamination of the oil. Used oils contain many aromatic compounds. After treating the oil with acid, a decrease in the refractive index is observed. This lower value indicates that many materials suspended in the oil were removed. Furthermore, the measured refractive index hardly changes after the final treatment with clay, confirming the removal of aromatic compounds in the oil after its use.
- Density
The density is affected by the chemical composition of the oil. Increasing the aromatics volume in oils leads to a rise in the specific gravity of the saturated compounds and a decrease in the specific gravity. The base size of the added solids, sulfur content, carbon residue, viscosity, and temperature are relatively unrelated.
As expected, the density of used oil (0.861) is higher than that of new oil (0.7874). This is because of the acquisition by the oil of substances such as aromatics and heavy metals from the engine. After the acid and K10 clay treatments, the specific gravity decreases. The values obtained are even lower than the density of new oil. Additionally, this is because the new oils contain additives that are minerals in specific proportions. These additives are used to improve the performance of the oils. Furthermore, they are gone when the oil is used and cannot be regenerated by oil treatments.
4.2. Chemical Analysis
4.2.1. Analysis of Water Content, TAN and TBN
According to the results obtained and reported in Table 1, no trace of water is present in the new oil. On the other hand, used oil contains some traces of water. Since oil is hygroscopic, the water can be obtained by absorbing moisture from the air or condensation, oxidation, and neutralization. After the acid treatment, the amount of water decreased. Its reason is the drying process at a temperature of 120 °C, which precedes the acid treatment in total acid number (TAN). Chemical acids and heavy metal soaps are the main ingredients of these materials. The oxidation mechanism occurs because engine oils are exposed to high temperatures, and the formation of organic acids in the engine oil results from oxidation.
The (TAN) has been considered a significant indicator of engine oil additive content, especially in defining oxidation [31]. However, the reaction can lead to carbonyl products, further oxidized to create carboxylic acids that increase the TAN value. Over time, the oxidation products lead to sludge deposition, which reduces oil performance and causes unnecessary wear [31]. According to the results, the percentage of TAN in new oil is relatively low (1.570). However, after use, there is an increase in this number (2.496). This increase is naturally due to oxidation and the appearance of acids during use. After acid treatment, there is a significant increase in TAN. Then, after treatment with clay, the TAN decreased (1.556), and most of the acids disappeared. It is confirmed by infrared spectroscopy analysis.
Internal combustion engine oils are manufactured with the additive kit with a solid alkaline base to neutralize the structure of acidic elements. The total base number is an indicator that should be used to know the replacement period of the engine oil. As the oil is used, the TBN decreases because the essential substances are depleted over time due to increased acidity. Higher TBN values in oils are more effective at neutralizing acids for extended periods. The additive uptake rate indicates the oil’s life [31].
4.2.2. FTIR Analysis
In this study, the spectral superposition allowed us to highlight the changes in functions between each type of oil.
- Between new and used oil
Some functions in the new oil, which were present initially, disappeared during use, as shown in Figure 8 (superposition of IR spectra: new and used oil). For example, the alkyl halide at 669.30 cm−1, a known additive, depletes after use. It is also the case that alkane at 891.11 cm−1 represents kerosene. The same observation is made for C-O at 1230.58 cm−1) and aromatics at 1514.12 cm−1. These numerous changes highlight the deterioration of the oils in the engine. The other reason for the inability of the oil to perform its duties properly is the acquisition of undesirable substances or so-called suspended substances.
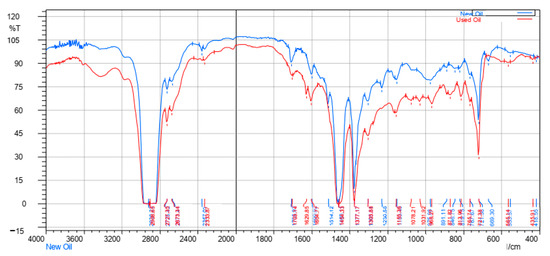
Figure 8.
Superposition of IR spectra: new and used oil.
These substances come in the engine due to the fuel’s heat and quality. The appearance of the aromatic function (peak at 871.82 cm−1) is due to mixing with the fuel in the engine. The aromatic band, observed around 1629 cm−1, is further evidence of oil and fuel mixing. The presence of the C-O function (peaks at 1031 cm−1 and 1078 cm−1) is clear evidence of acid formation in the medium. The TAN measurement corroborates this result. The existence of haloalkane at 1303 also indicates the presence of acid.
- Between used oil and oil treated with acetic acid
After treating the waste oil with acid, the spectra have further changed, as shown in Figure 9 (superposition of IR spectra: used oil and oil treated with acetic acid). A halogenated alkane is evidenced by the new presence of peaks at 478 cm−1 and 626 cm−1. It is due to the interaction of the acid with the oils. However, the peak appearance at 1232 cm−1, characteristic of the C-O function, and those of carbonylated compounds represent the presence of acids. The property peaks of the aromatic process (871 cm−1) and C-O elongation (1031 cm−1 and 1078 cm−1) also disappeared.
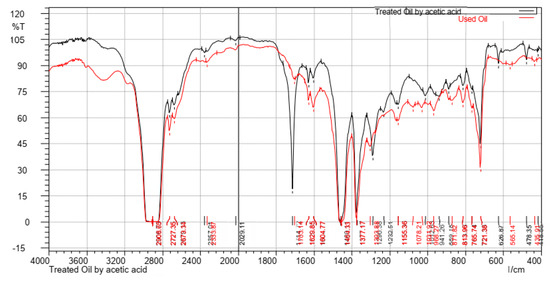
Figure 9.
Superposition of IR spectra: used oil and oil treated with acetic acid.
- Between oil treated with acetic acid and oil treated with montmorillonite K10 clay
In the final step, Figure 10: superposition of IR spectra: oil treated with acetic acid and K10 clay, shows the oil was treated with montmorillonite K10 clay. It affected the functional properties of the oil. Many representative peaks disappeared, including C-I and C-Cl halogenoalkanes (peaks at 478 cm−1 and 626 cm−1), the C-O function (at 1232 cm−1), as well as those of carbonylated compounds (at 1714 cm−1).
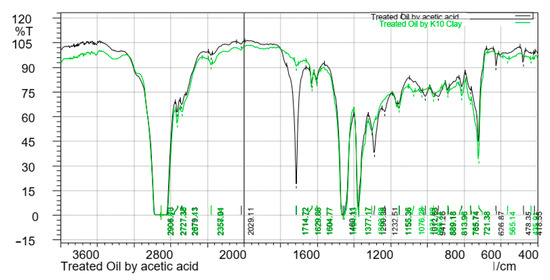
Figure 10.
Superposition of IR spectra: oil treated with acetic acid and oil treated with K10 clay.
- Between oil treated with montmorillonite K10 clay and new oil
Note that the oil treated with montmorillonite K10 clay is close to the base oil from Figure 11 (superposition of IR spectra: oil treated with K10 clay and new oil). The treated oil is free of all additives and contaminants such as the latter. It is sufficient to add a certain amount of dope to an engine, as with any engine oil. The spectral superposition between the new and treated oil shows that some of the functions, which were not in the base oil, were added only to improve oil working in the engine. Different peaks representation: 669 cm−1 (alkylated halides), 1230 cm−1 (function C-O) and 1514 cm−1 (aromatic bond).
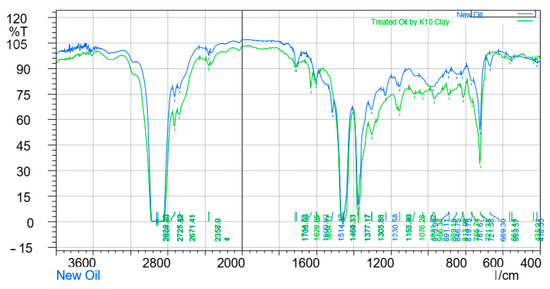
Figure 11.
Superposition of IR spectra: oil treated with K10 clay and new oil.
4.2.3. Analysis of Metals by Atomic Absorption Spectrometer (AAS)
Base oil contains metal elements that belong to the products added to the oil to improve its efficiency. However, after the oil is used, these metals are considered pollutants that must be removed entirely to produce a suitable base oil for developing a new engine oil [32]. Based on the heavy metal analysis results shown in Table 3, the effectiveness of K10 clay in absorbing the minerals can be seen. Some metals are entirely absorbed after using a small amount of clay, such as manganese and nickel. A significant decrease in iron concentration is also observed. After treatment with clay, this concentration equals 18.94 µg/g of oil. This value is lower than the concentration of new oil. The high concentration of lead in the oil is due to the gasoline used in this engine, as gasoline untreated from lead was used due to its low price in the market.
5. Conclusions
This study investigated the feasibility of recycling used engine oil after treatment with glacial acetic acid followed by treatment with montmorillonite K10 clay has yielded exciting results. These two treatments combined produce a base oil that presents better results than oils treated by other traditional methods, according to the various analyses carried out in the laboratory. The results obtained are interesting from an environmental point of view. The process is based on combining simple unitary operations, such as boiling, poring, centrifugation, and mixing with montmorillonite at room temperature and atmospheric pressure. Unlike other acid–clay treatments based on sulphuric acid, hydrochloric, nitric, phosphoric, or formic acid, treatment with glacial acetic acid and montmorillonite K10 clay results in a better quality base oil. Adding acetic acid to used oil does not affect the basic structure of the oil. The action of the acid only affects suspended matter, such as heavy metals; most suspended matter was removed. This action was completed by absorbing a small amount of Montmorillonite K10 clay.
Moreover, from an economic point of view, about 12% glacial acetic acid was used, and the final treatment was conducted with only 4 g of K10 clay. This is a tiny amount compared to other processes. For the treatment of 1 L of waste oil, the cost is as follows: €9.7 EUR for glacial acetic acid (120 mL) + (€2.38 EUR for 40 g of montmorillonite K10 clay), i.e., a total of €12.08 EUR. Moreover, it can be reused in engines after adding the necessary additives. The cost calculation was carried out according to prices on the laboratory scale, not the factory scale. It is after the total elimination of lead. In addition, the amount of waste generated during both treatments is relatively tiny. This work was the main objective so that the process would not cause secondary damage to the environment. In addition, other studies that have also used acetic acid oil treatment in their recycling process have all shown that this oil treatment does not emit toxic gases into the atmosphere, such as sulfur dioxide.
Author Contributions
Methodology, H.B., N.M., X.P., K.B.-H. and R.M.D.; Software, K.J.H.; Validation, R.M.D.; Data curation, A.G.; Writing—original draft, A.M.B.; Writing—review & editing, R.M.D.; Visualization, N.C. and R.M.D.; Supervision, R.M.D.; Project administration, N.C.; funding acquisition, The Ministry of Higher Education and Scientific Research of Algeria. All authors have read and agreed to the published version of the manuscript.
Funding
This work was supported by The Ministry of Higher Education and Scientific Research of Algeria (Grant numbers [316; 2019–2020]). BENDJERAD Abdelmadjid Mahfoudh has received research support from The Ministry of Higher Education and Scientific Research of Algeria.
Data Availability Statement
Not applicable.
Acknowledgments
The author thanks the EPROAD (Eco-Processes, Optimization, and Decision Support) Laboratory Director, Hifi Mhand, from Picardie Jules Verne University.
Conflicts of Interest
The authors declare no conflict of interest.
References
- Audibert, F. Waste Engine Oils. In Rerefining and Energy Recovery; Elsevier Science & Technology Books: London, UK, 2006. [Google Scholar]
- Zyl, V. Valorisation of Used Automotive Lubrication Oil. Ph.D. Thesis, Durban University of Technology, Durban, South Africa, 2019. [Google Scholar]
- Belabbas, A.; Boutoutaou, D.; Segaï, S.; Segni, L. Soil contamination by petroleum products. In Southern Algerian Case AIP Conference Proceedings; AIP Publishing LLC: Melville, NY, USA, 2016; Volume 1758, p. 030040. [Google Scholar]
- Pinheiro, C.T.; Quina, M.J.; Gando-Ferreira, L.M. Management of waste lubricant oil in Europe: A circular economy approach. Crit. Rev. Environ. Sci. Technol. 2020, 51, 2015–2050. [Google Scholar] [CrossRef]
- Kpokpoya, C.C. Contribution à L’etude de la Production et de la Gestion des Huiles Usagées Dans la Ville de Cotonou. DEA Thesis, Abomey-Calavi University, Bénin, 2007. [Google Scholar]
- Rahman, M.; Siddique, T.; Samdani, S.; Kabir, K. Effect of operating variables on regeneration of base-oil from waste oil by conventional acid-clay method. Chem. Eng. Res. Bull. 2008, 12, 24–27. [Google Scholar] [CrossRef]
- Udonne, J.D.; Bakare, O. Recycling of used lubricating oil using three samples of acids and clay as a method of treatment. Int. Arch. Appl. Sci. Technol. 2013, 4, 8–14. [Google Scholar]
- Hamawand, I.; Yusaf, T.; Rafat, S. Recycling of waste engine oils using a new washing agent. Energies 2013, 6, 1023–1049. [Google Scholar] [CrossRef]
- Duđak, L.; Milisavljević, S.; Jocanović, M.; Kiss, F.; Šević, D.; Karanović, V.; Orošnjak, M. Life Cycle Assessment of Different Waste Lubrication Oil Management Options in Serbia. Appl. Sci. 2021, 11, 6652. [Google Scholar] [CrossRef]
- Abu-Elella, R.; Ossman, M.E.; Farouq, R.; Abd-El, M. Used Motor Oil Treatment: Turning Waste Oil Into Valuable Products. Int. J. Chem. Biochem. Sci. 2015, 7, 57–67. [Google Scholar]
- Gul, S.; Irfan, M.; Bilal, H.; Khan, U. Recycling of used engine oil using solvent extraction and distillation. J. Eng. Appl. Sci. 2014, 33, 39–46. [Google Scholar]
- Marius, C.; Felicia, B.; Eusebiu, I.I.; Daniela, I.; Claudia, S.; Anca, Z.; Florian, M.; Marius Gheorghe, M.; Violeta, C.; Smona, O.; et al. From Plastic to Fuel—New Challenges. Mater. Plast. 2019, 56. [Google Scholar]
- Marius, C.; Felicia, B.; Roxana-Elena, I.; Violeta-Carolina, N.; Eusebiu, I.I.; Anca, Z.; Simona, O.; Marius, G. Comparative Study on Plastic Materials as a New Source of Energy. Mater. Plast. 2019, 56. [Google Scholar]
- Li, D.; Shan, R.; Jiang, L.; Gu, J.; Zhang, Y.; Yuan, H.; Chen, Y. A review on the migration and transformation of heavy metals in the process of sludge pyrolysis. Resour. Conserv. Recycl. 2022, 185. [Google Scholar] [CrossRef]
- Lenoir, J. Predict flash points accurately. Hydrocarb. Process. 1975, 54, 153–158. [Google Scholar]
- ASTM D 92-18; Standard Test Method for Flash and Fire Points by Cleveland Open Cup Tester. ASTM International: West Conshohocken, PA, USA, 2018.
- ASTM 2196; Standard Test Methods for Rheological Properties of Non-Newtonian Materials by Rotational (Brookfield type) Viscometer 1. ASTM International: West Conshohocken, PA, USA, 2015.
- ASTM D2270; Standard Practice for Calculating Viscosity Index from Kinematic Viscosity at 40 °C and 100 °C. ASTM International: West Conshohocken, PA, USA, 2016.
- ASTM Standard D97-05; Standard Test Method for Pour Point of Petroleum Products. ASTM International: West Conshohocken, PA, USA, 2018.
- ASTM D1747; Standard Test Method for Refractive Index of Viscous Materials. ASTM International: West Conshohocken, PA, USA, 2019.
- ASTM D 287-12B; Standard Test Method for API Gravity of Crude Petroleum and Petroleum Products (Hydrometer Method). ASTM International: West Conshohocken, PA, USA, 2016.
- ASTM D 4007; Water and Sediment in Crude Oil by the Centrifuge Method (Laboratory Procedure). ASTM International: West Conshohocken, PA, USA, 2017.
- ASTM D974 -21; Standard Test Method for Acid and Base Number by Color-Indicator Titration 1. ASTM International: West Conshohocken, PA, USA, 2021.
- ASTM E2412; Standard Practice for Condition Monitoring of In-Service Lubricants by Trend Analysis Using Fourier Transform Infrared (FT-IR). ASTM International: West Conshohocken, PA, USA, 2018.
- ASTM D5863-00A; Standard Test Methods for Determination of Nickel, Vanadium, Iron, and Sodium in Crude Oils and Residual Fuels by Flame Atomic Absorption. ASTM International: West Conshohocken, PA, USA, 2016.
- ASTM D 445-06; Standard Test Method for Kinematic Viscosity of Transparent and Opaque Liquids (and Calculation of Dynamic Viscosity). ASTM International: West Conshohocken, PA, USA, 2009.
- Mohammadi, S.; Amin Sobati, M.; Sadeghi, M.T. Viscosity Reduction of Heavy Crude Oil by Dilution Methods: New Correlations for the Prediction of the Kinematic Viscosity of Blends. J. Oil Gas Sci. Technol. 2019, 8, 60–77. [Google Scholar]
- Forsthoffer, W.E. Forsthoffer’s Best Practice Handbook for Rotating Machinery; Elsevier Science & Technology: Oxford, UK, 2013; Volume 53. [Google Scholar]
- Gulati, I.B.; Singh, H. Influence of base oil refining on the performance of viscosity index improvers. Wear 1987, 118, 33–56. [Google Scholar]
- Riazi, M.R.; Roomi, Y.A. Use of the refractive index in the estimation of thermophysical properties of hydrocarbons and petroleum mixtures. Ind. Eng. Chem. Res. 2001, 40, 1975–1984. [Google Scholar] [CrossRef]
- Fox, M.F.; Pawlak, Z.; Picken, D.J. Acid-base determination lubricating oils. Tribol. Int. 1991, 24, 335–340. [Google Scholar] [CrossRef]
- Silva, M. Analytical Methods Determination of Fe, Cr and Cu in used lubricating oils by ET AAS using a microemulsion process for sample preparation. R. Soc. Chem. 2015, 7, 3363–3371. [Google Scholar]
Disclaimer/Publisher’s Note: The statements, opinions and data contained in all publications are solely those of the individual author(s) and contributor(s) and not of MDPI and/or the editor(s). MDPI and/or the editor(s) disclaim responsibility for any injury to people or property resulting from any ideas, methods, instructions or products referred to in the content. |
© 2022 by the authors. Licensee MDPI, Basel, Switzerland. This article is an open access article distributed under the terms and conditions of the Creative Commons Attribution (CC BY) license (https://creativecommons.org/licenses/by/4.0/).