
Low-Cost/High-Precision Smart Power Supply for Data Loggers


 , and
, and 
Abstract
1. Introduction
2. Methods and Materials
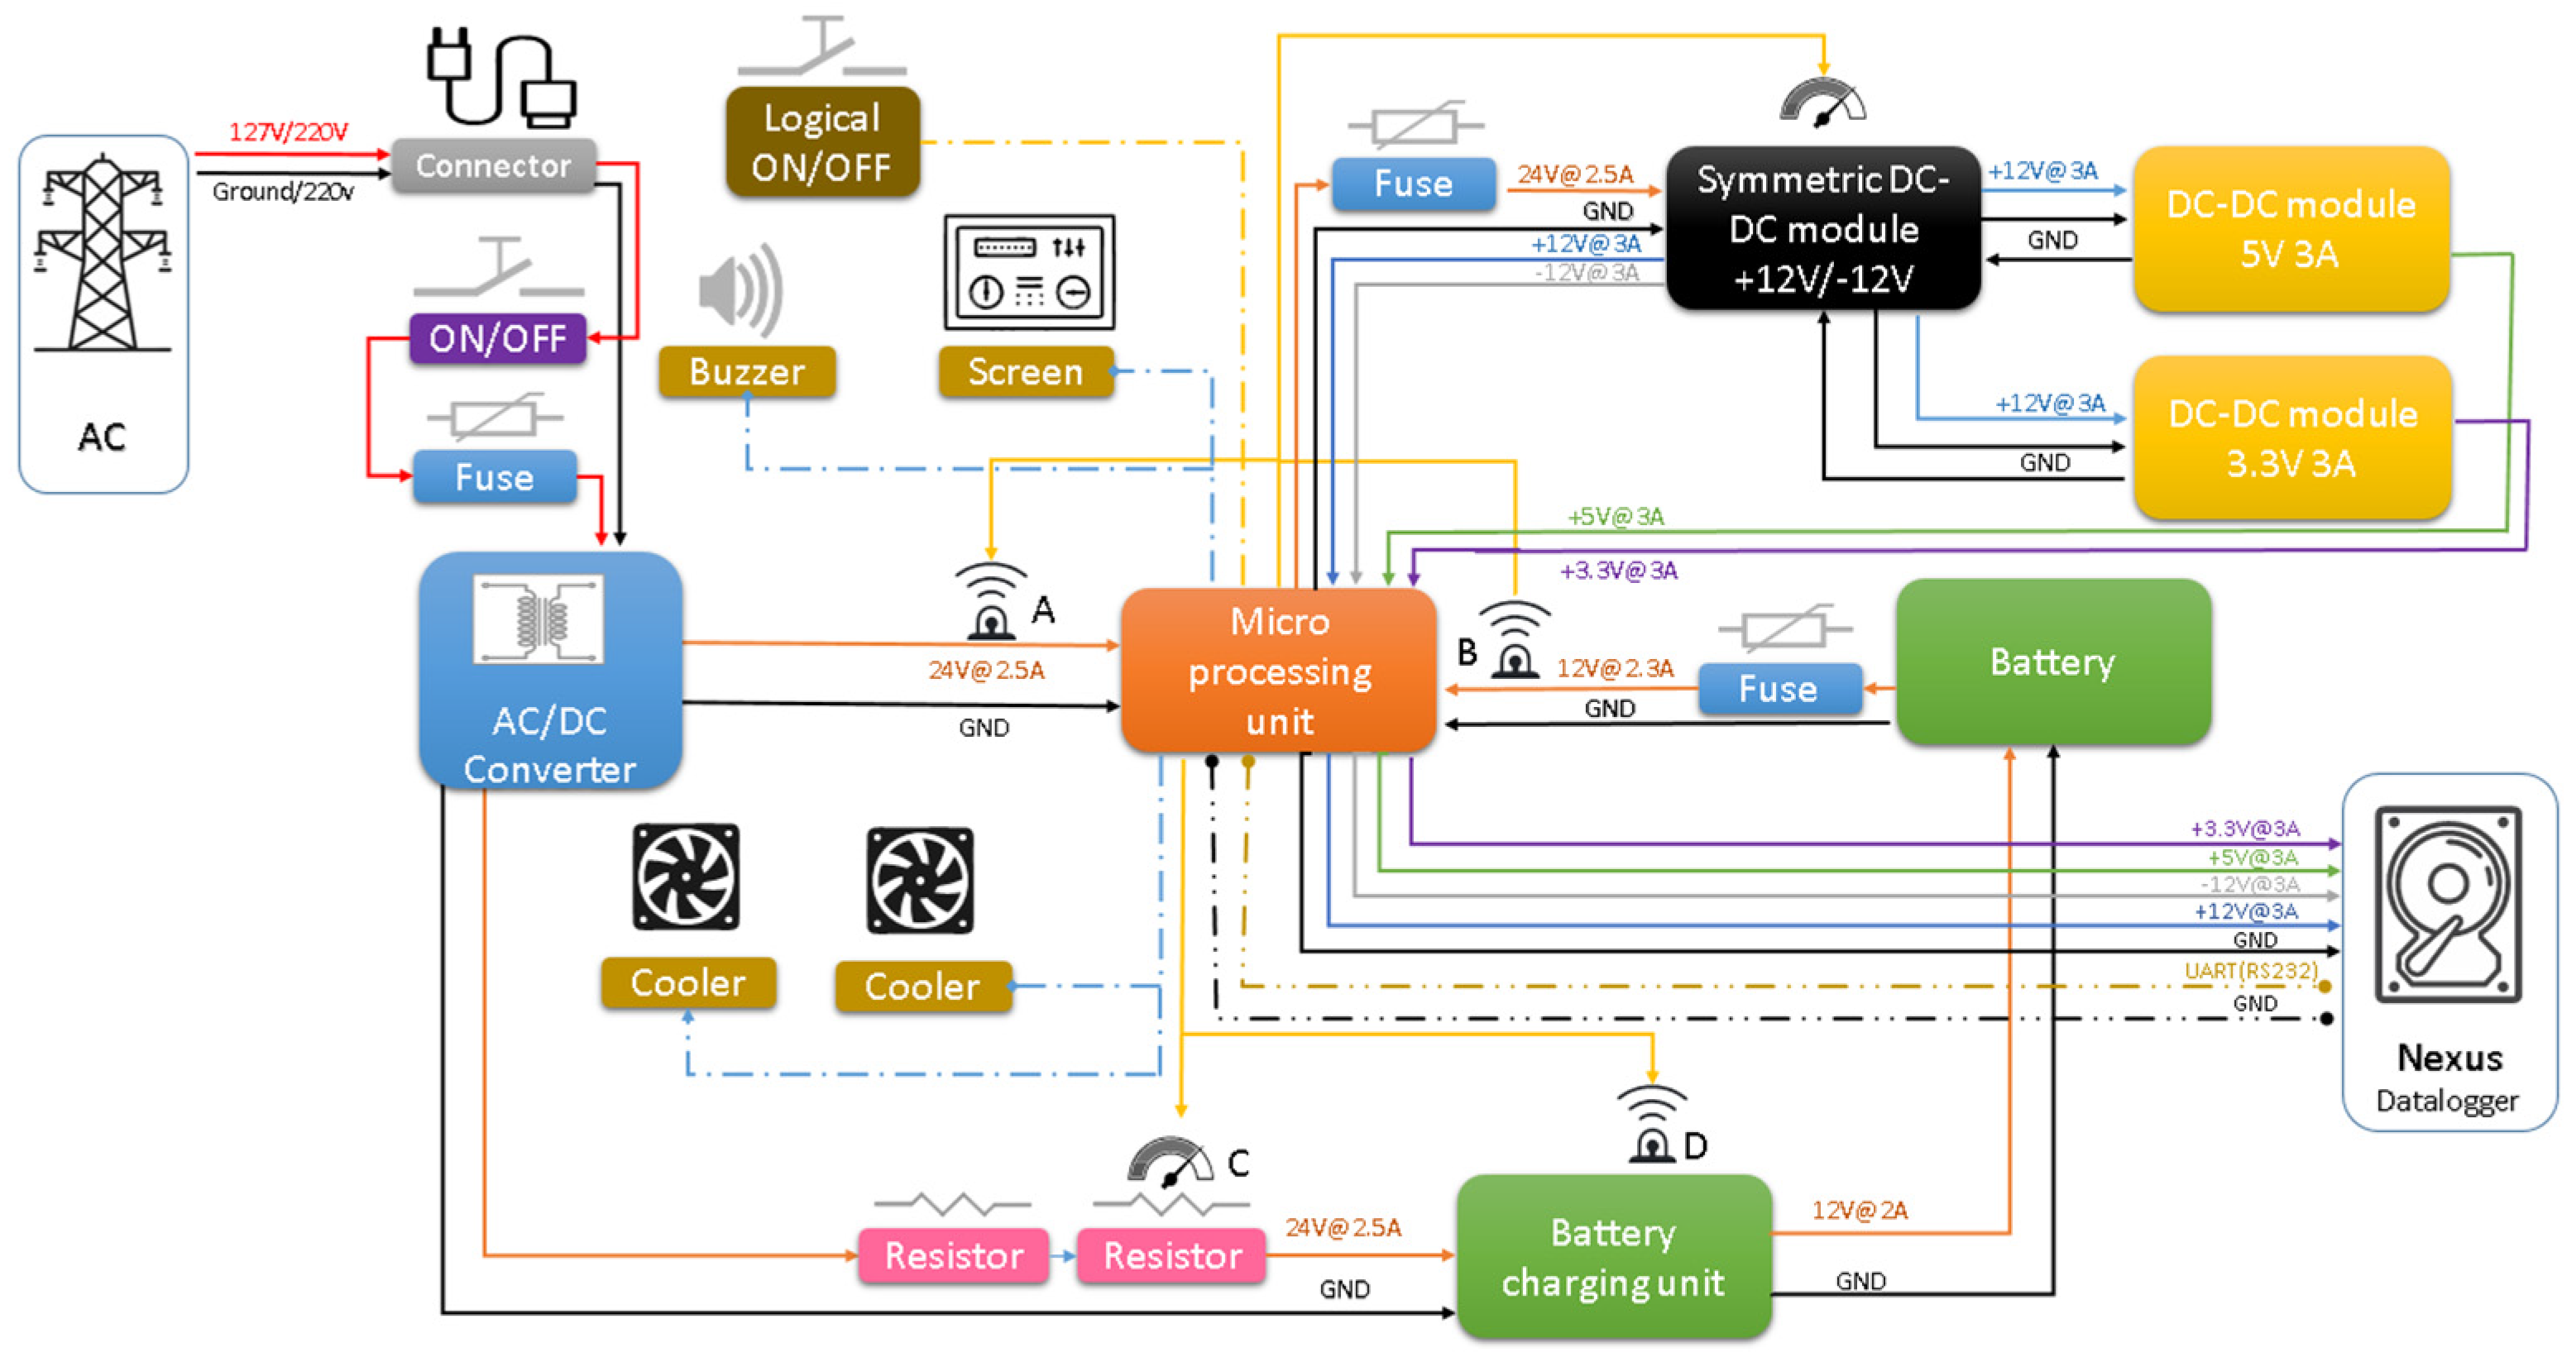
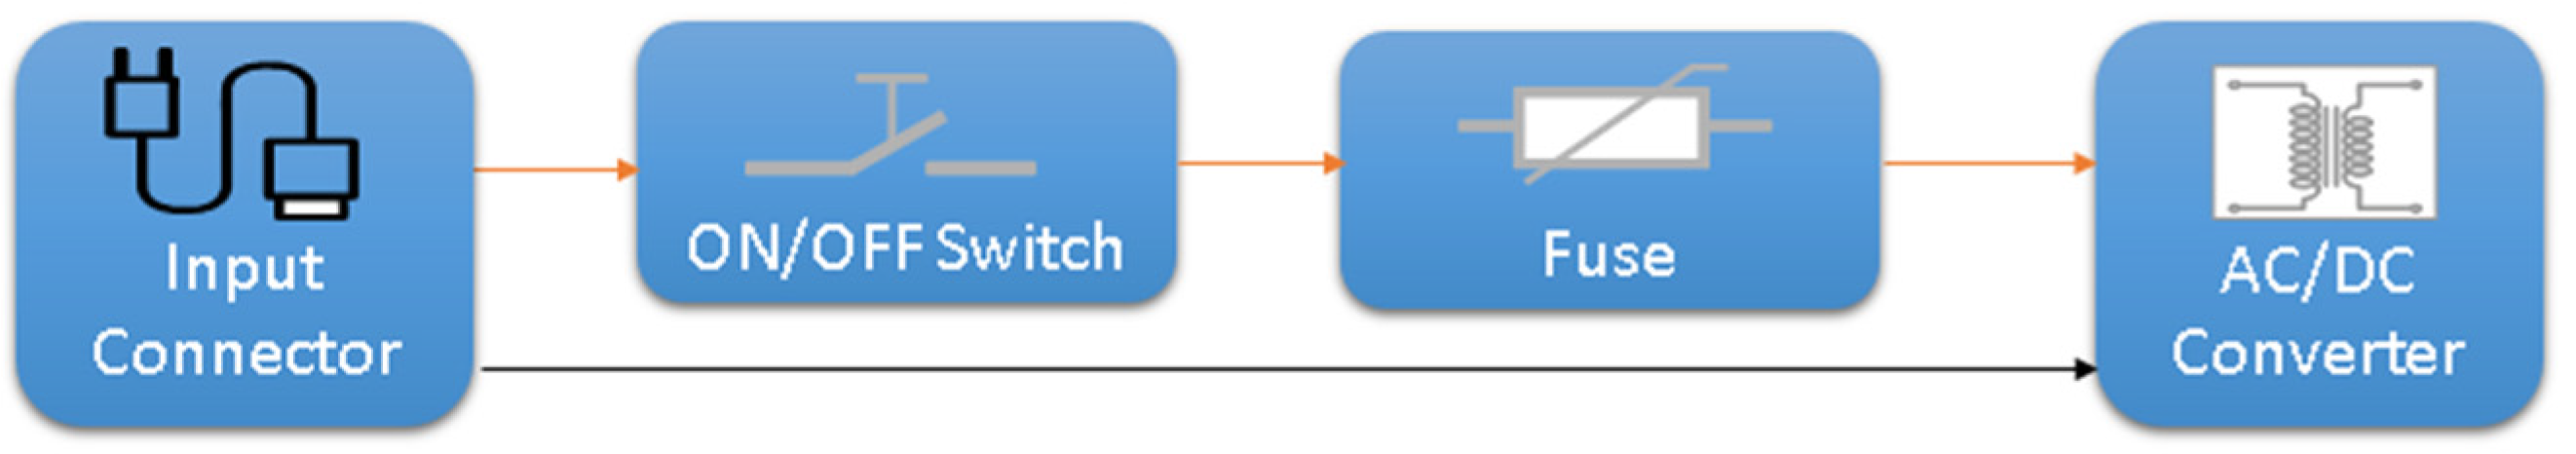
2.1. System Architecture Design
2.2. Firmware Design
3. Power Supply Fabrication
3.1. Electronic Assembly
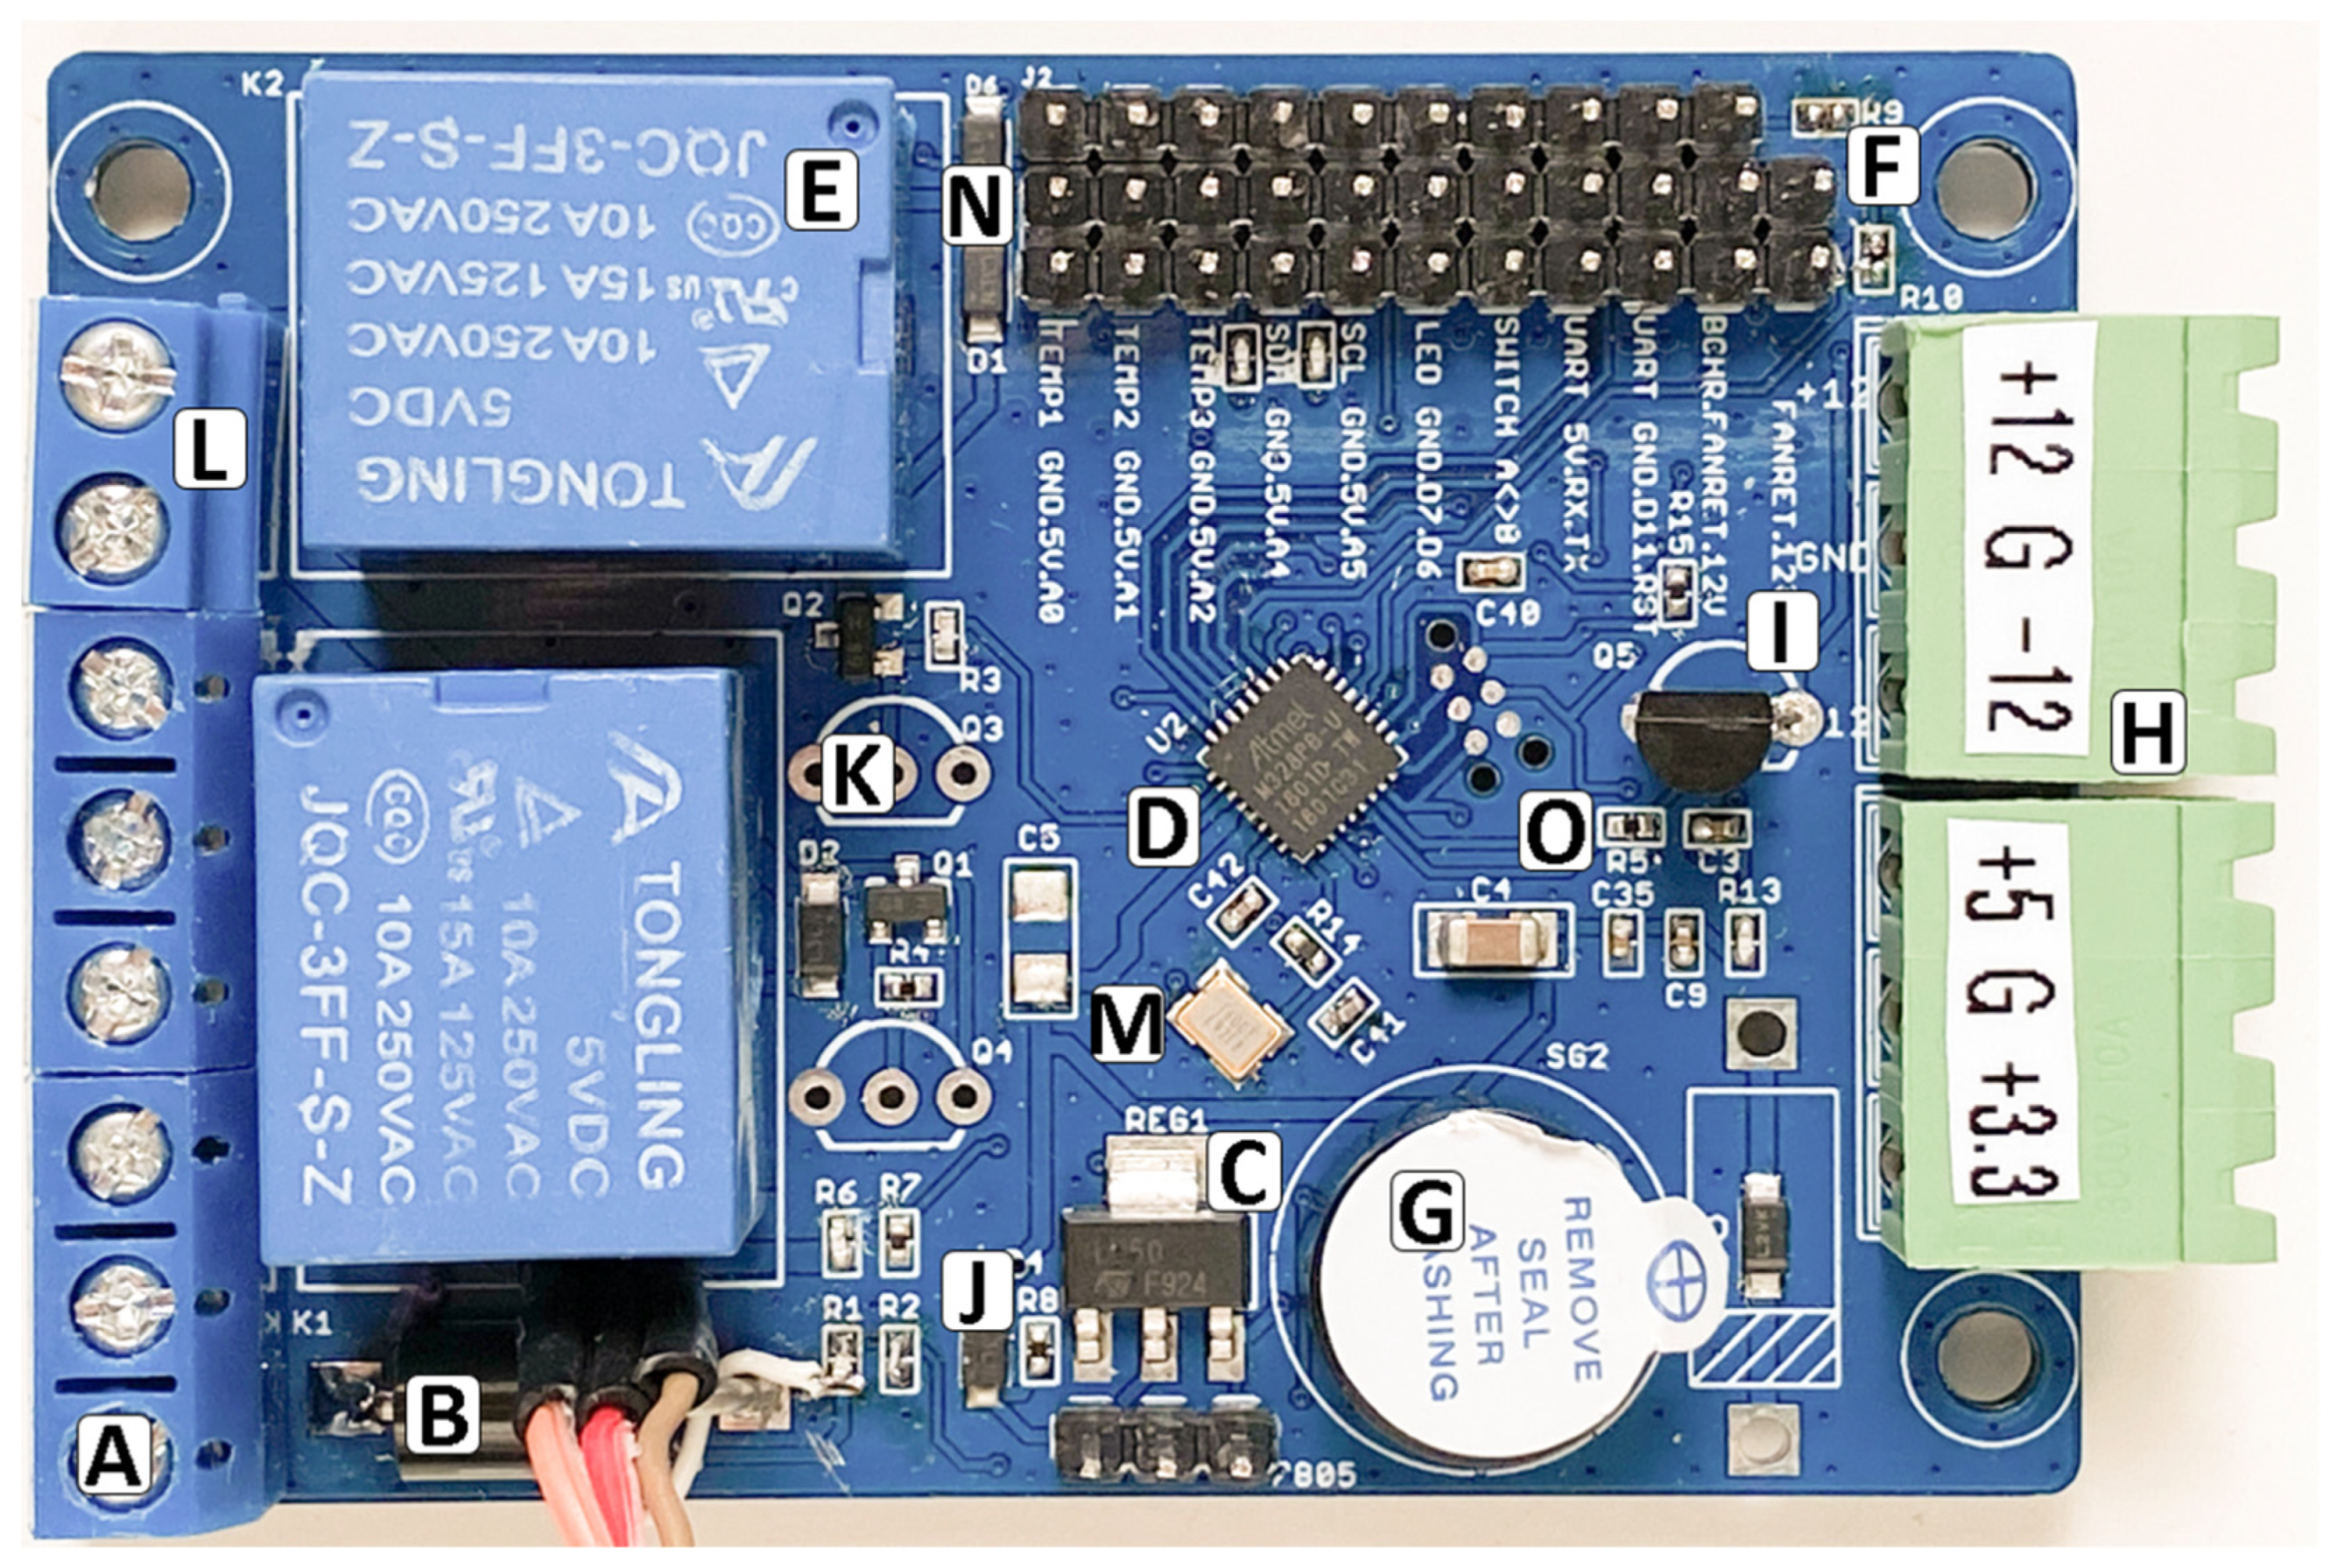
3.2. MCU Board
3.3. Mechanical Project
4. Experiment Results
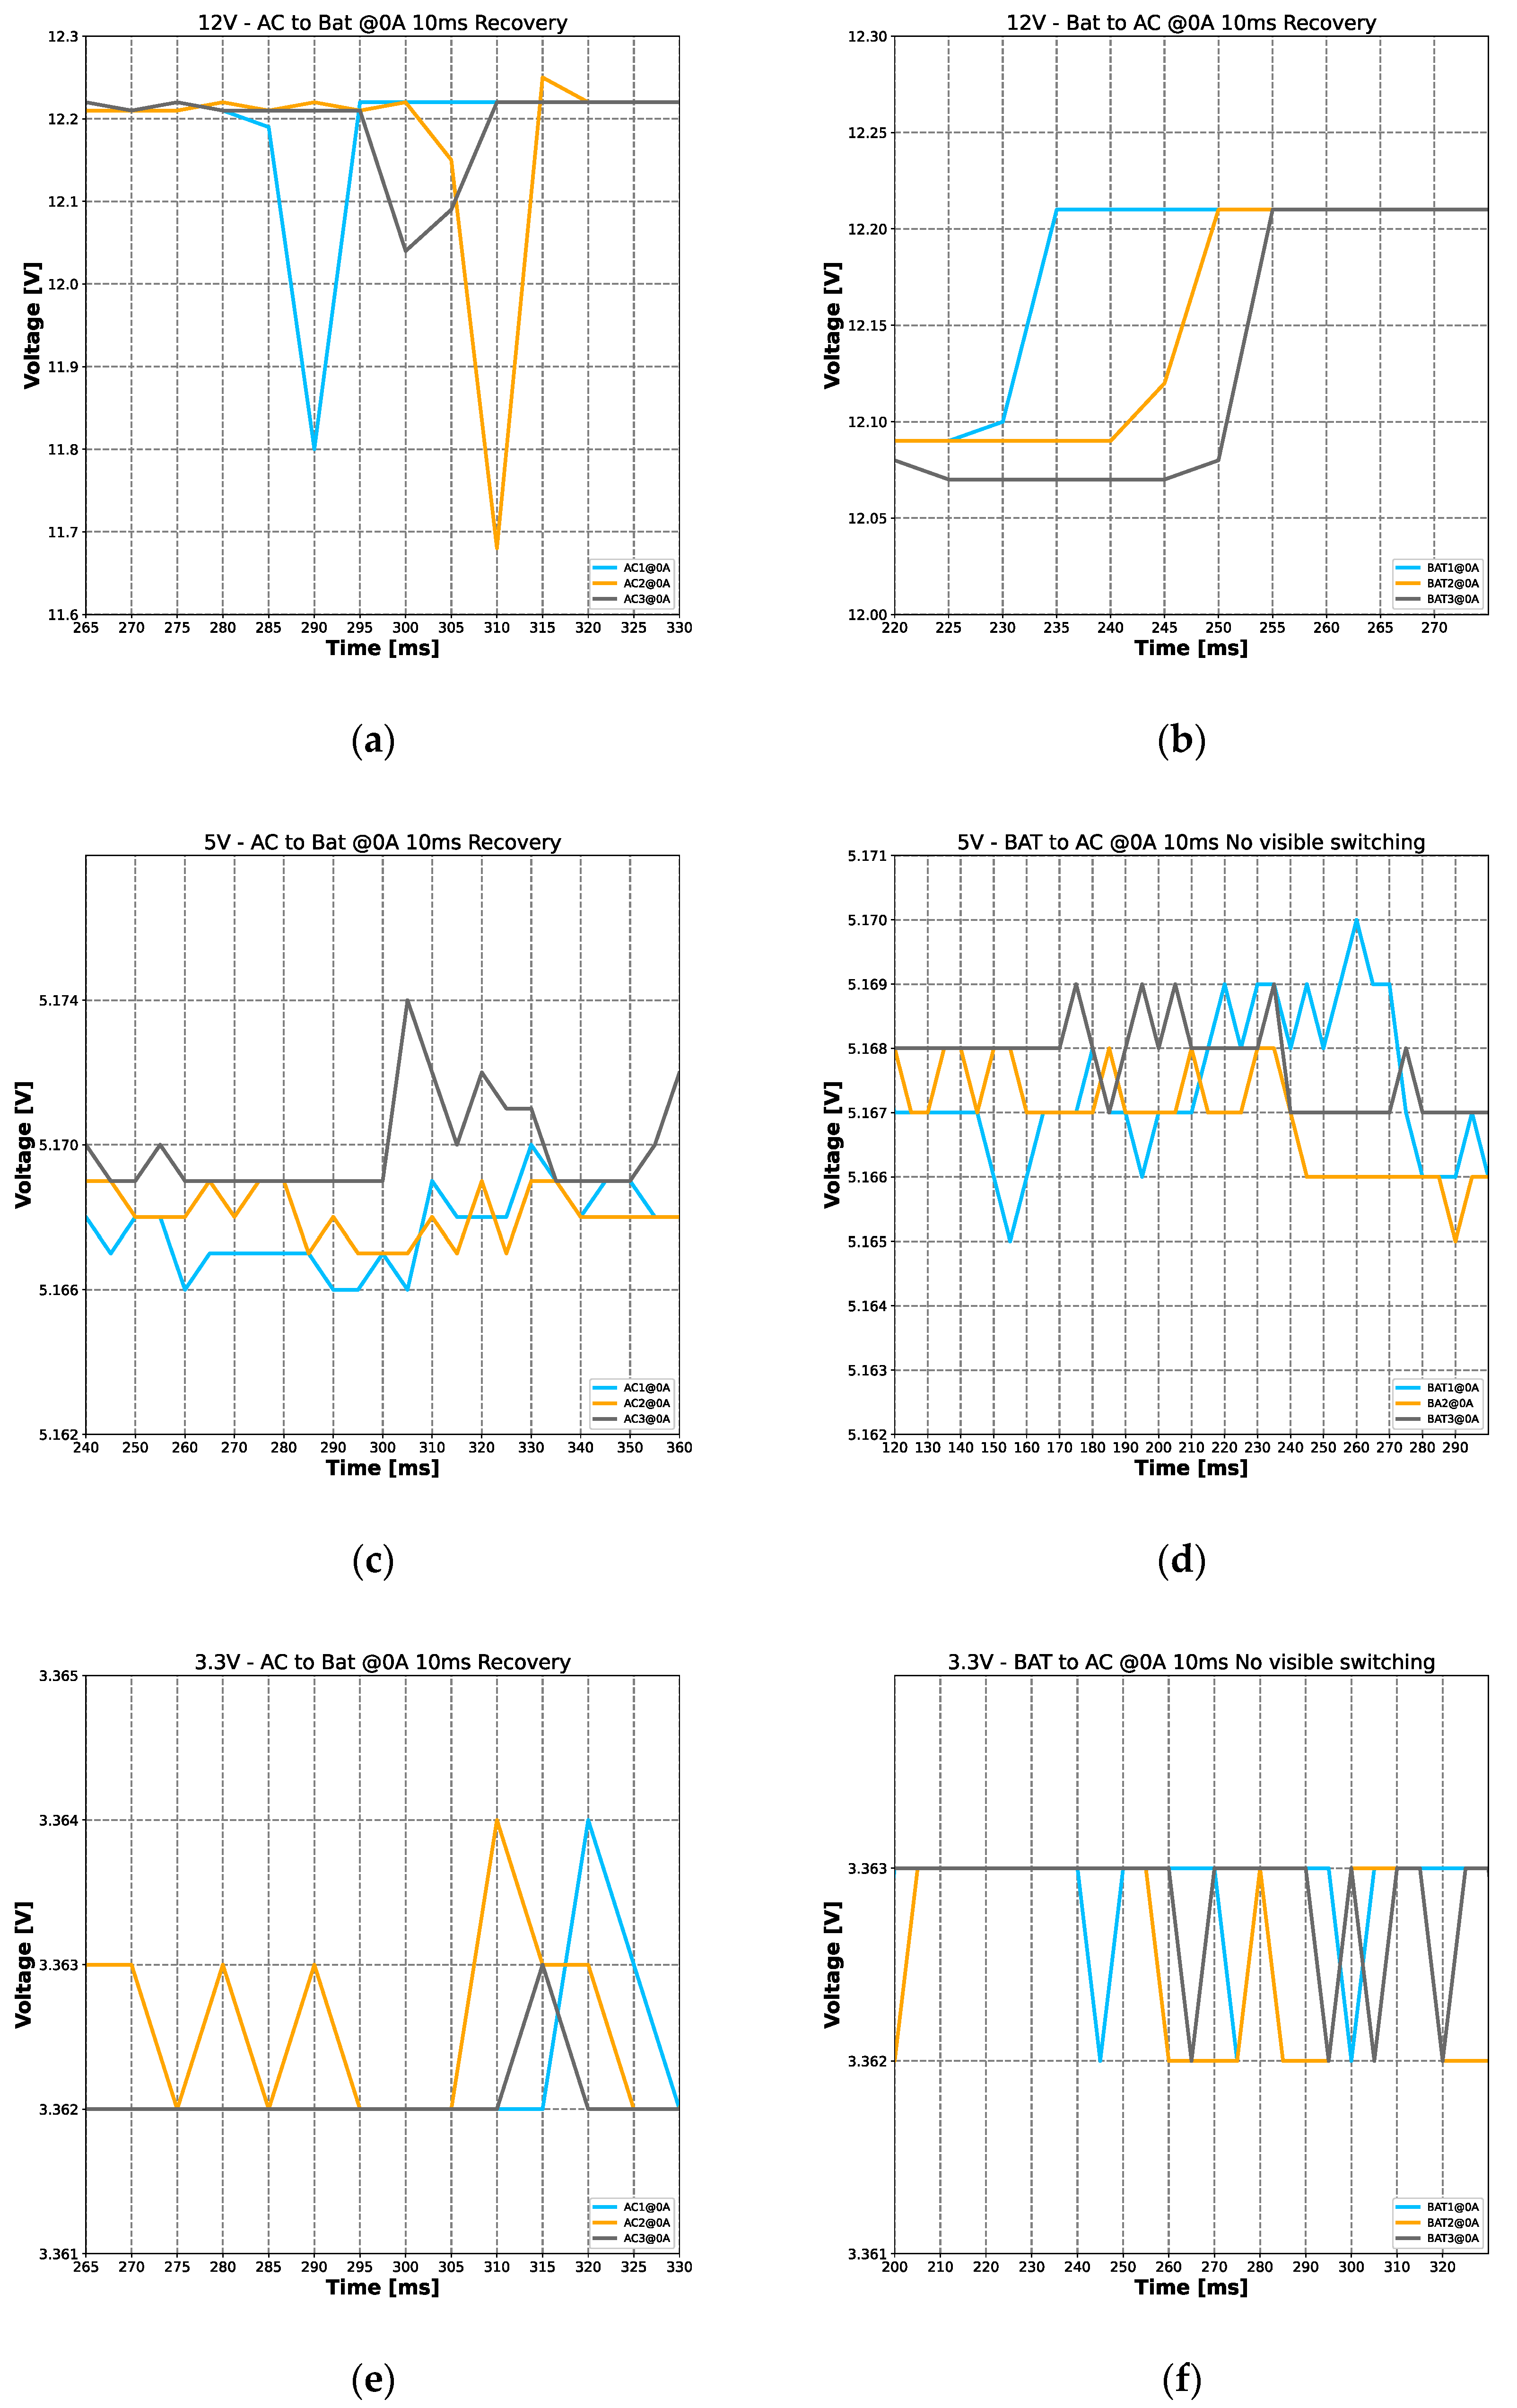
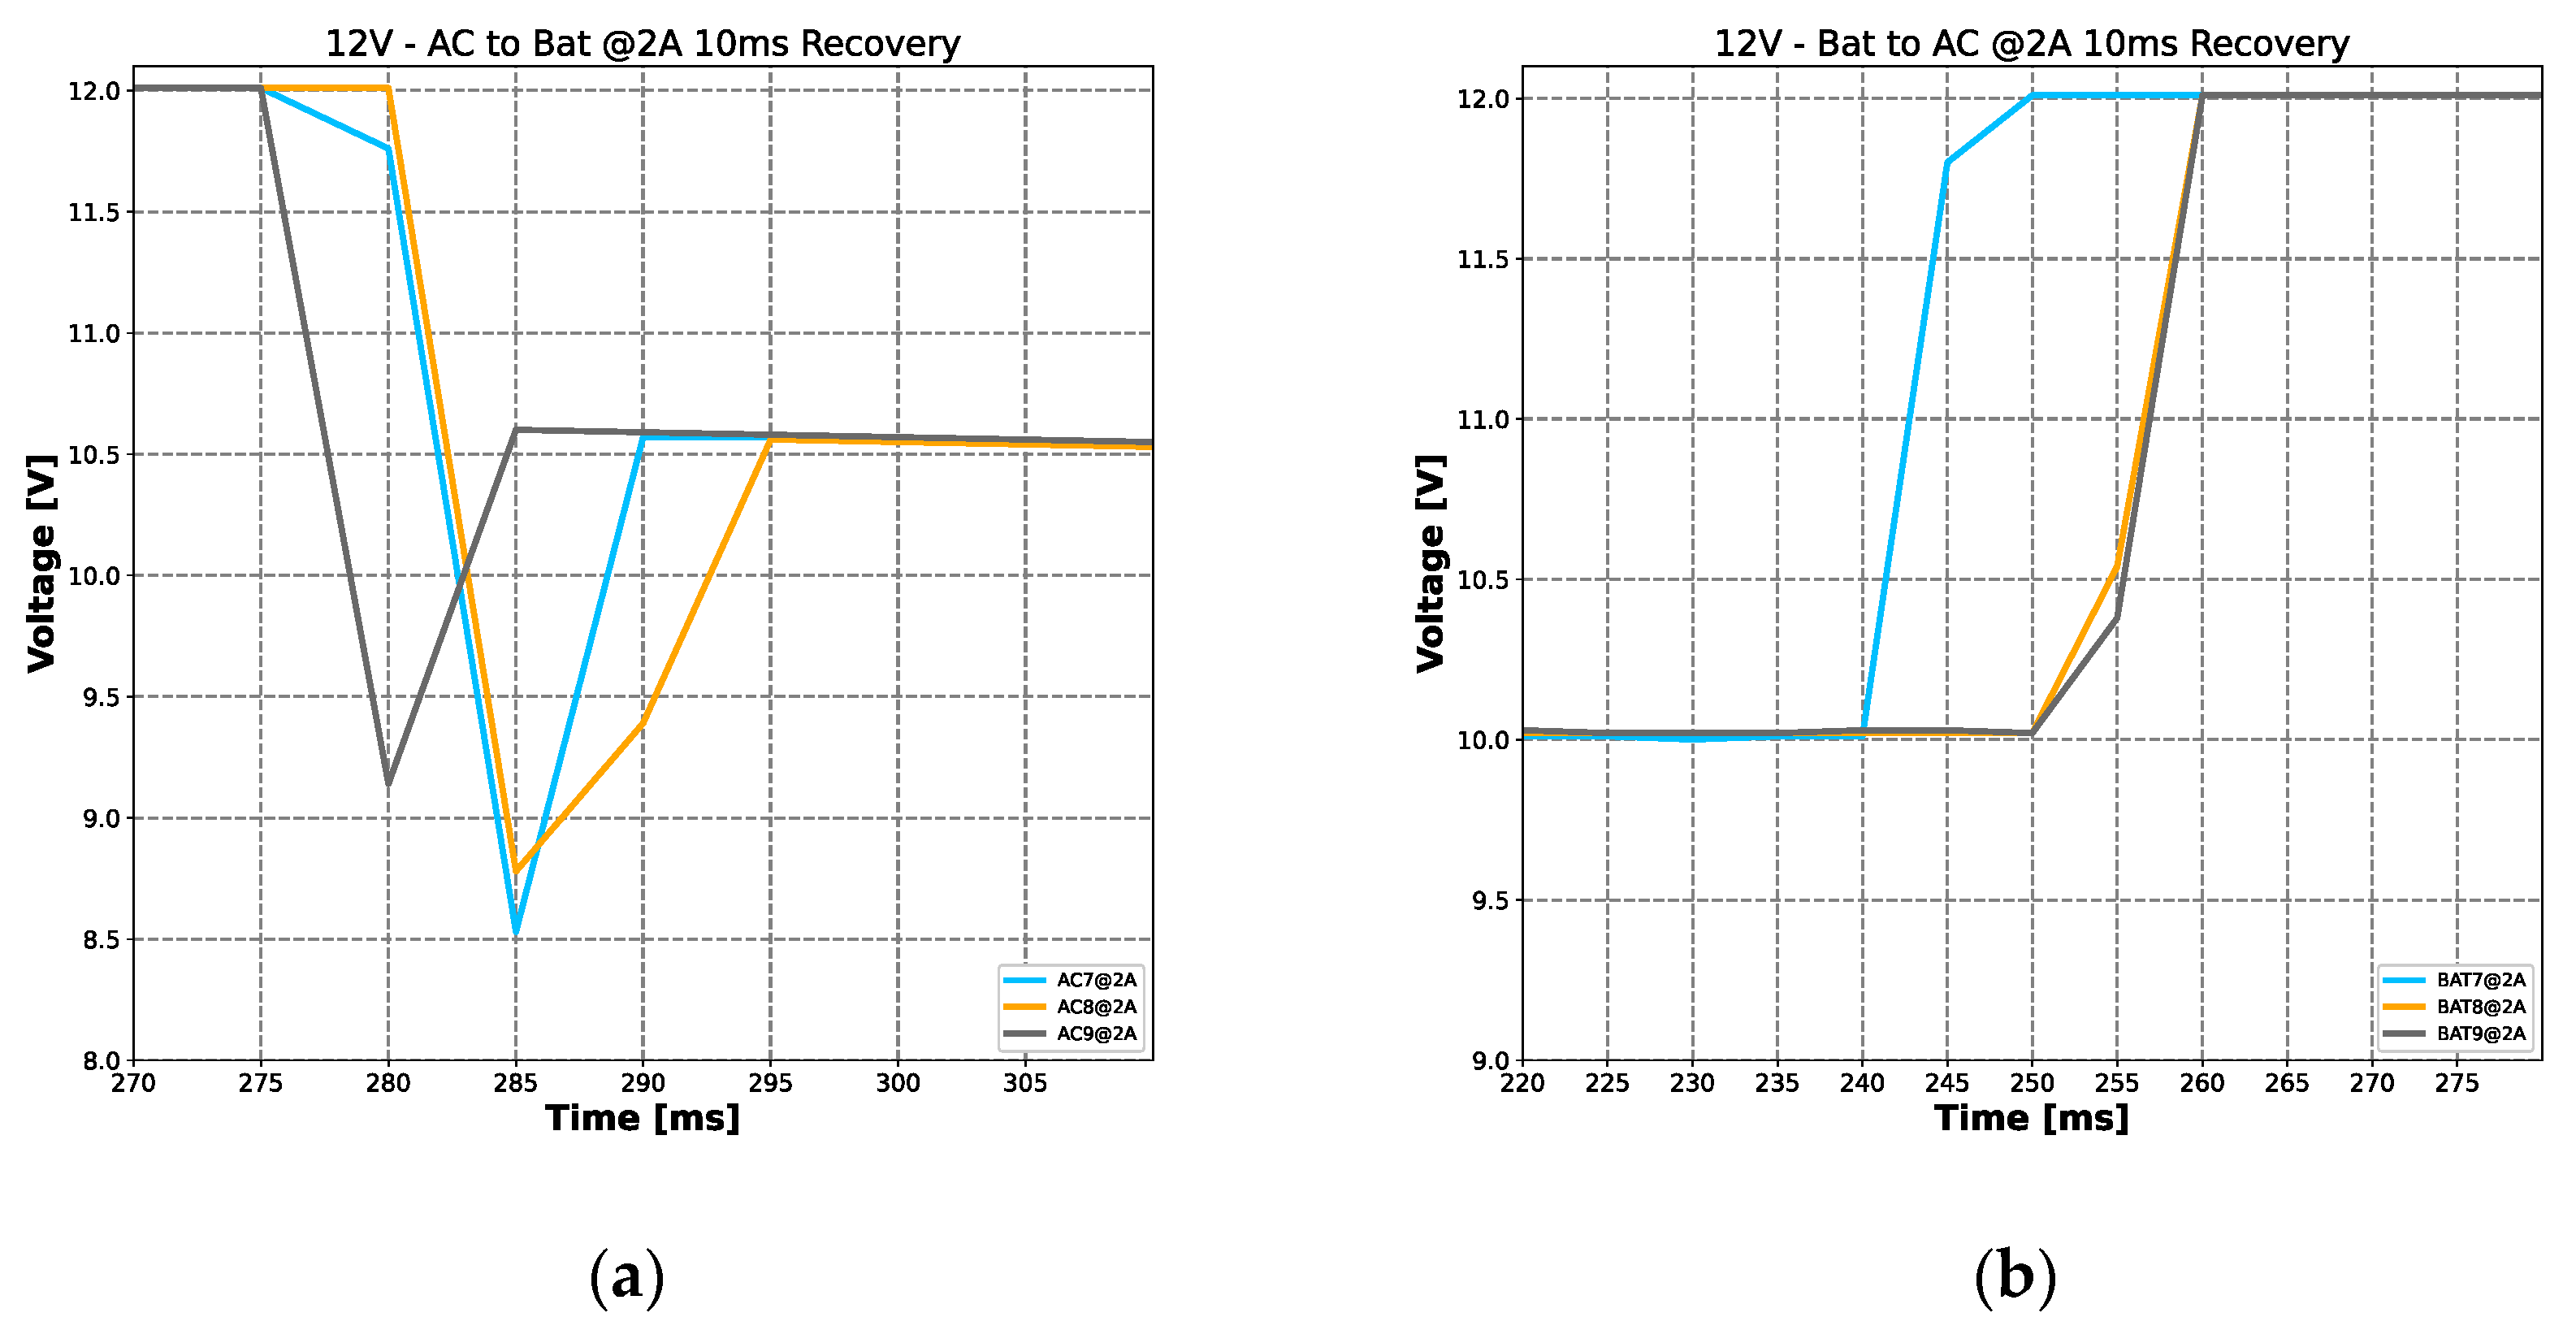
4.1. Switching Time
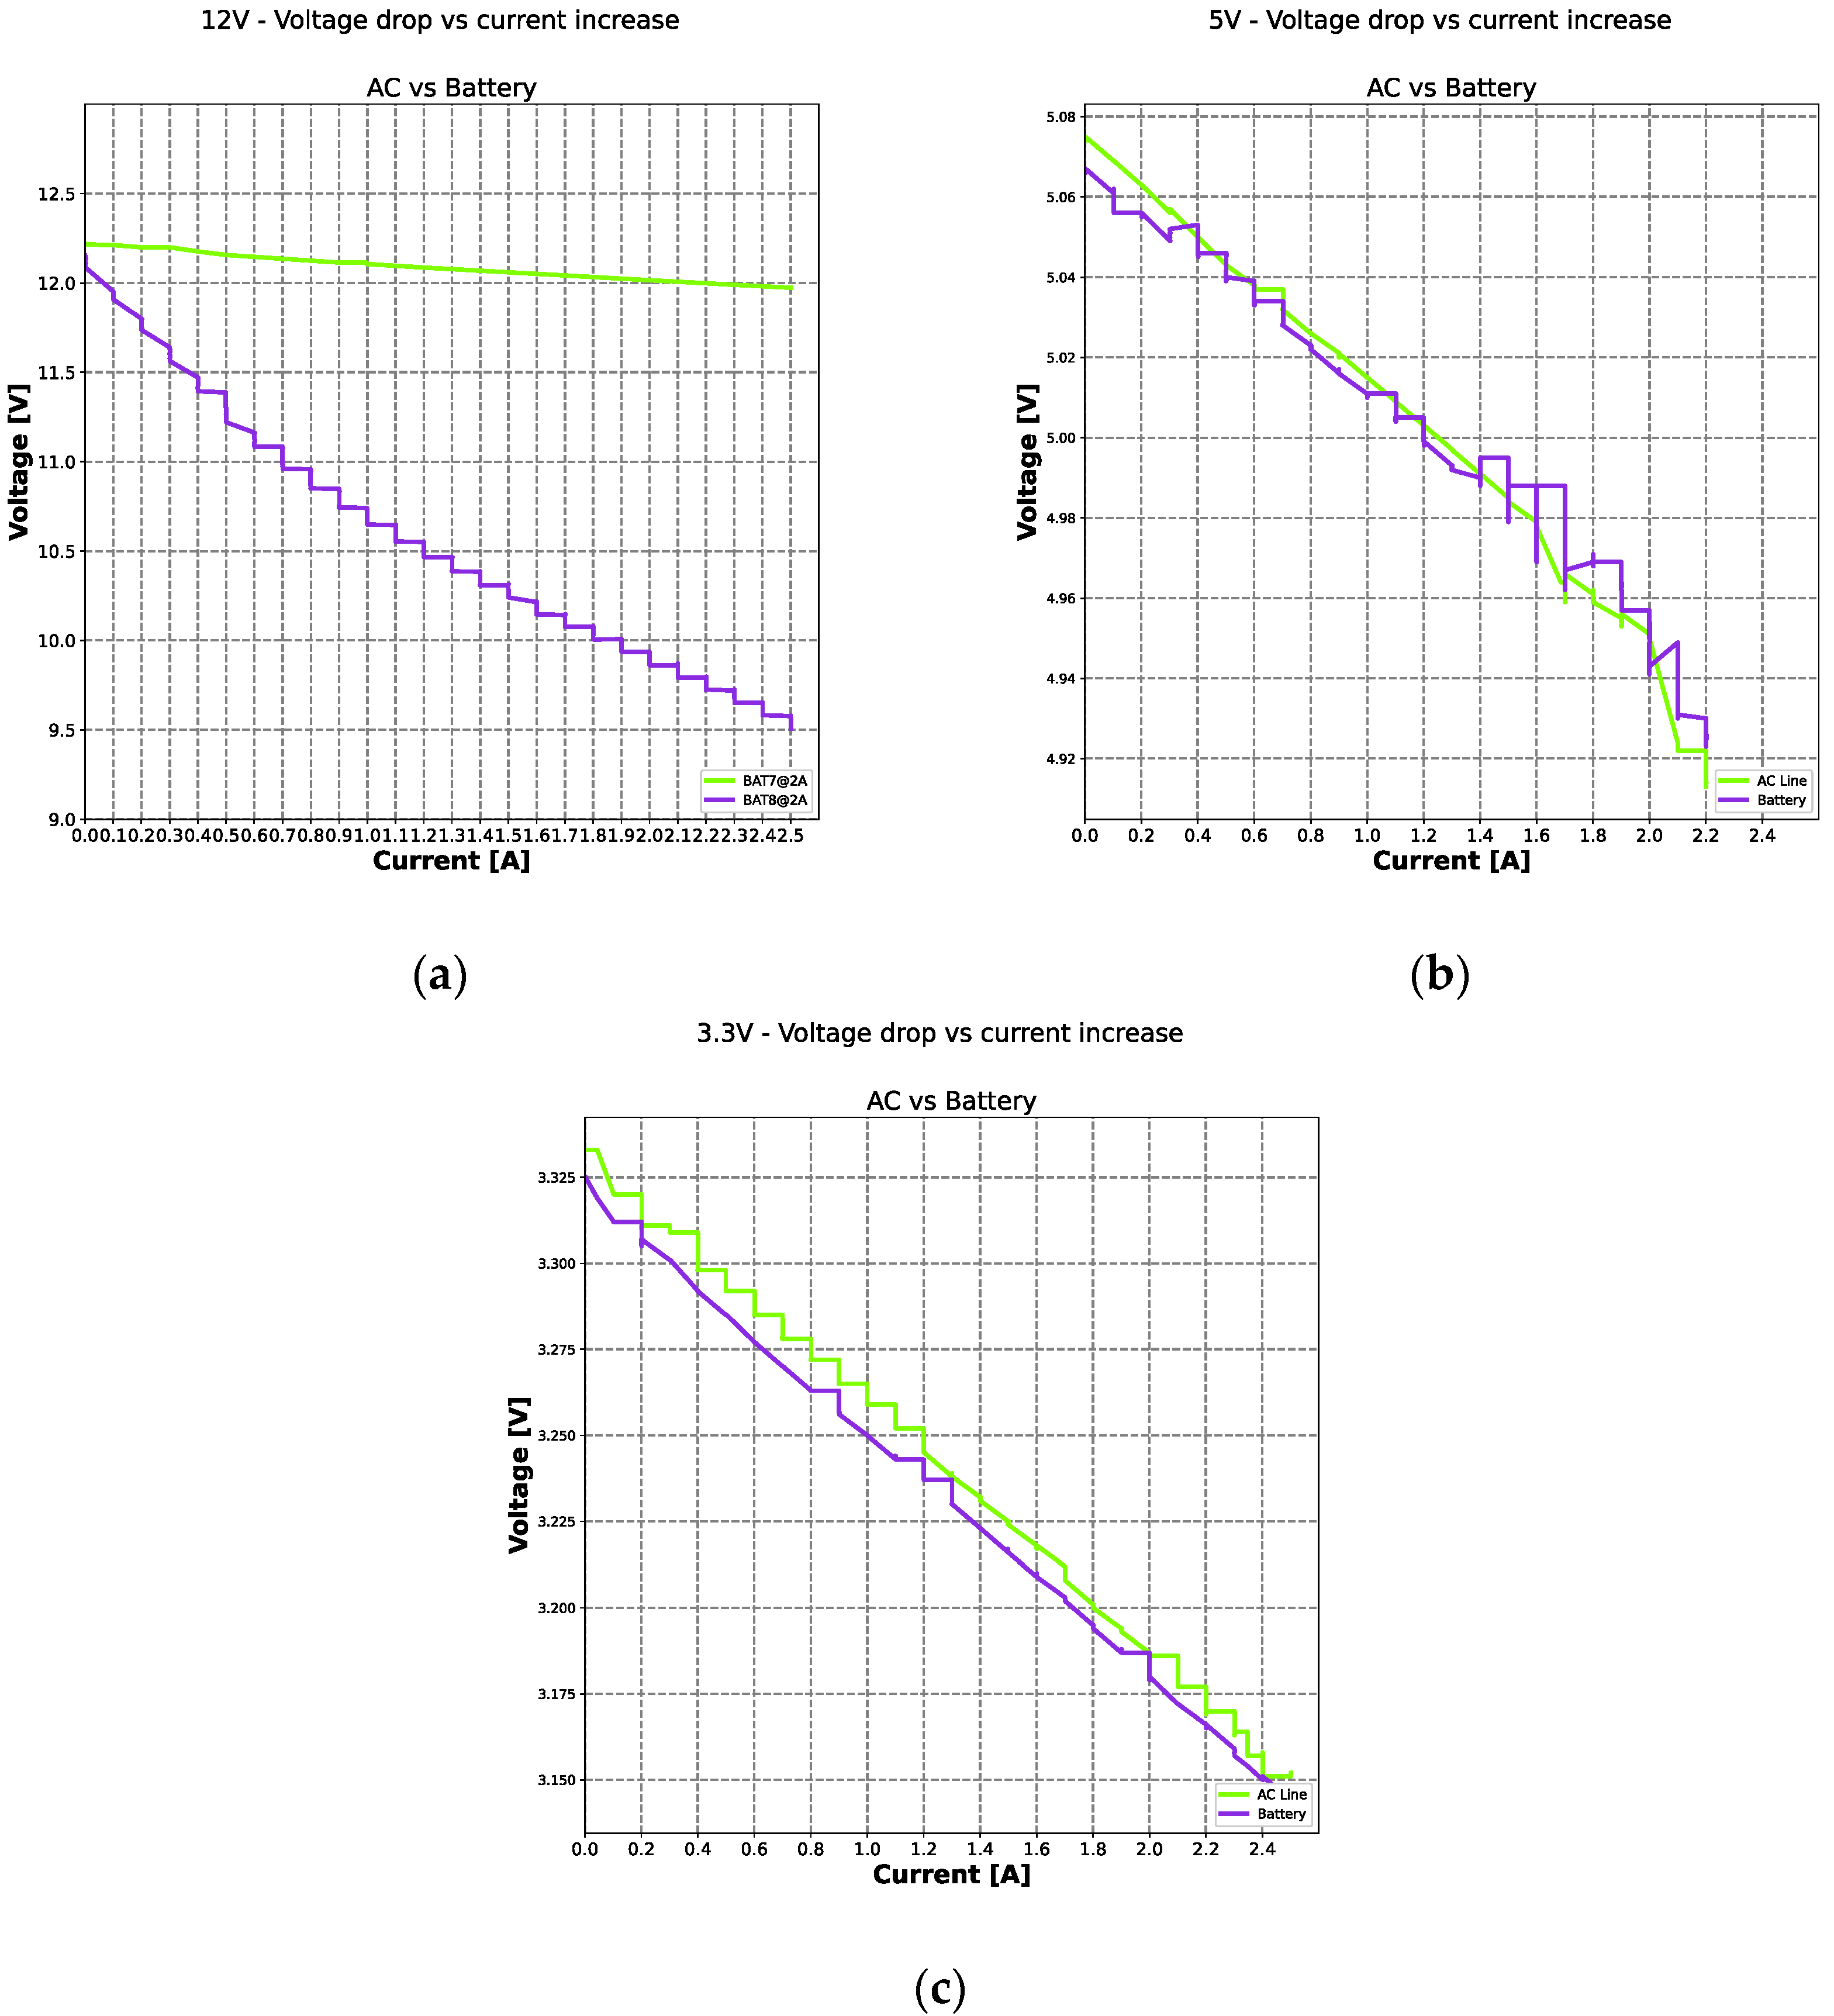
4.2. Voltage Curve
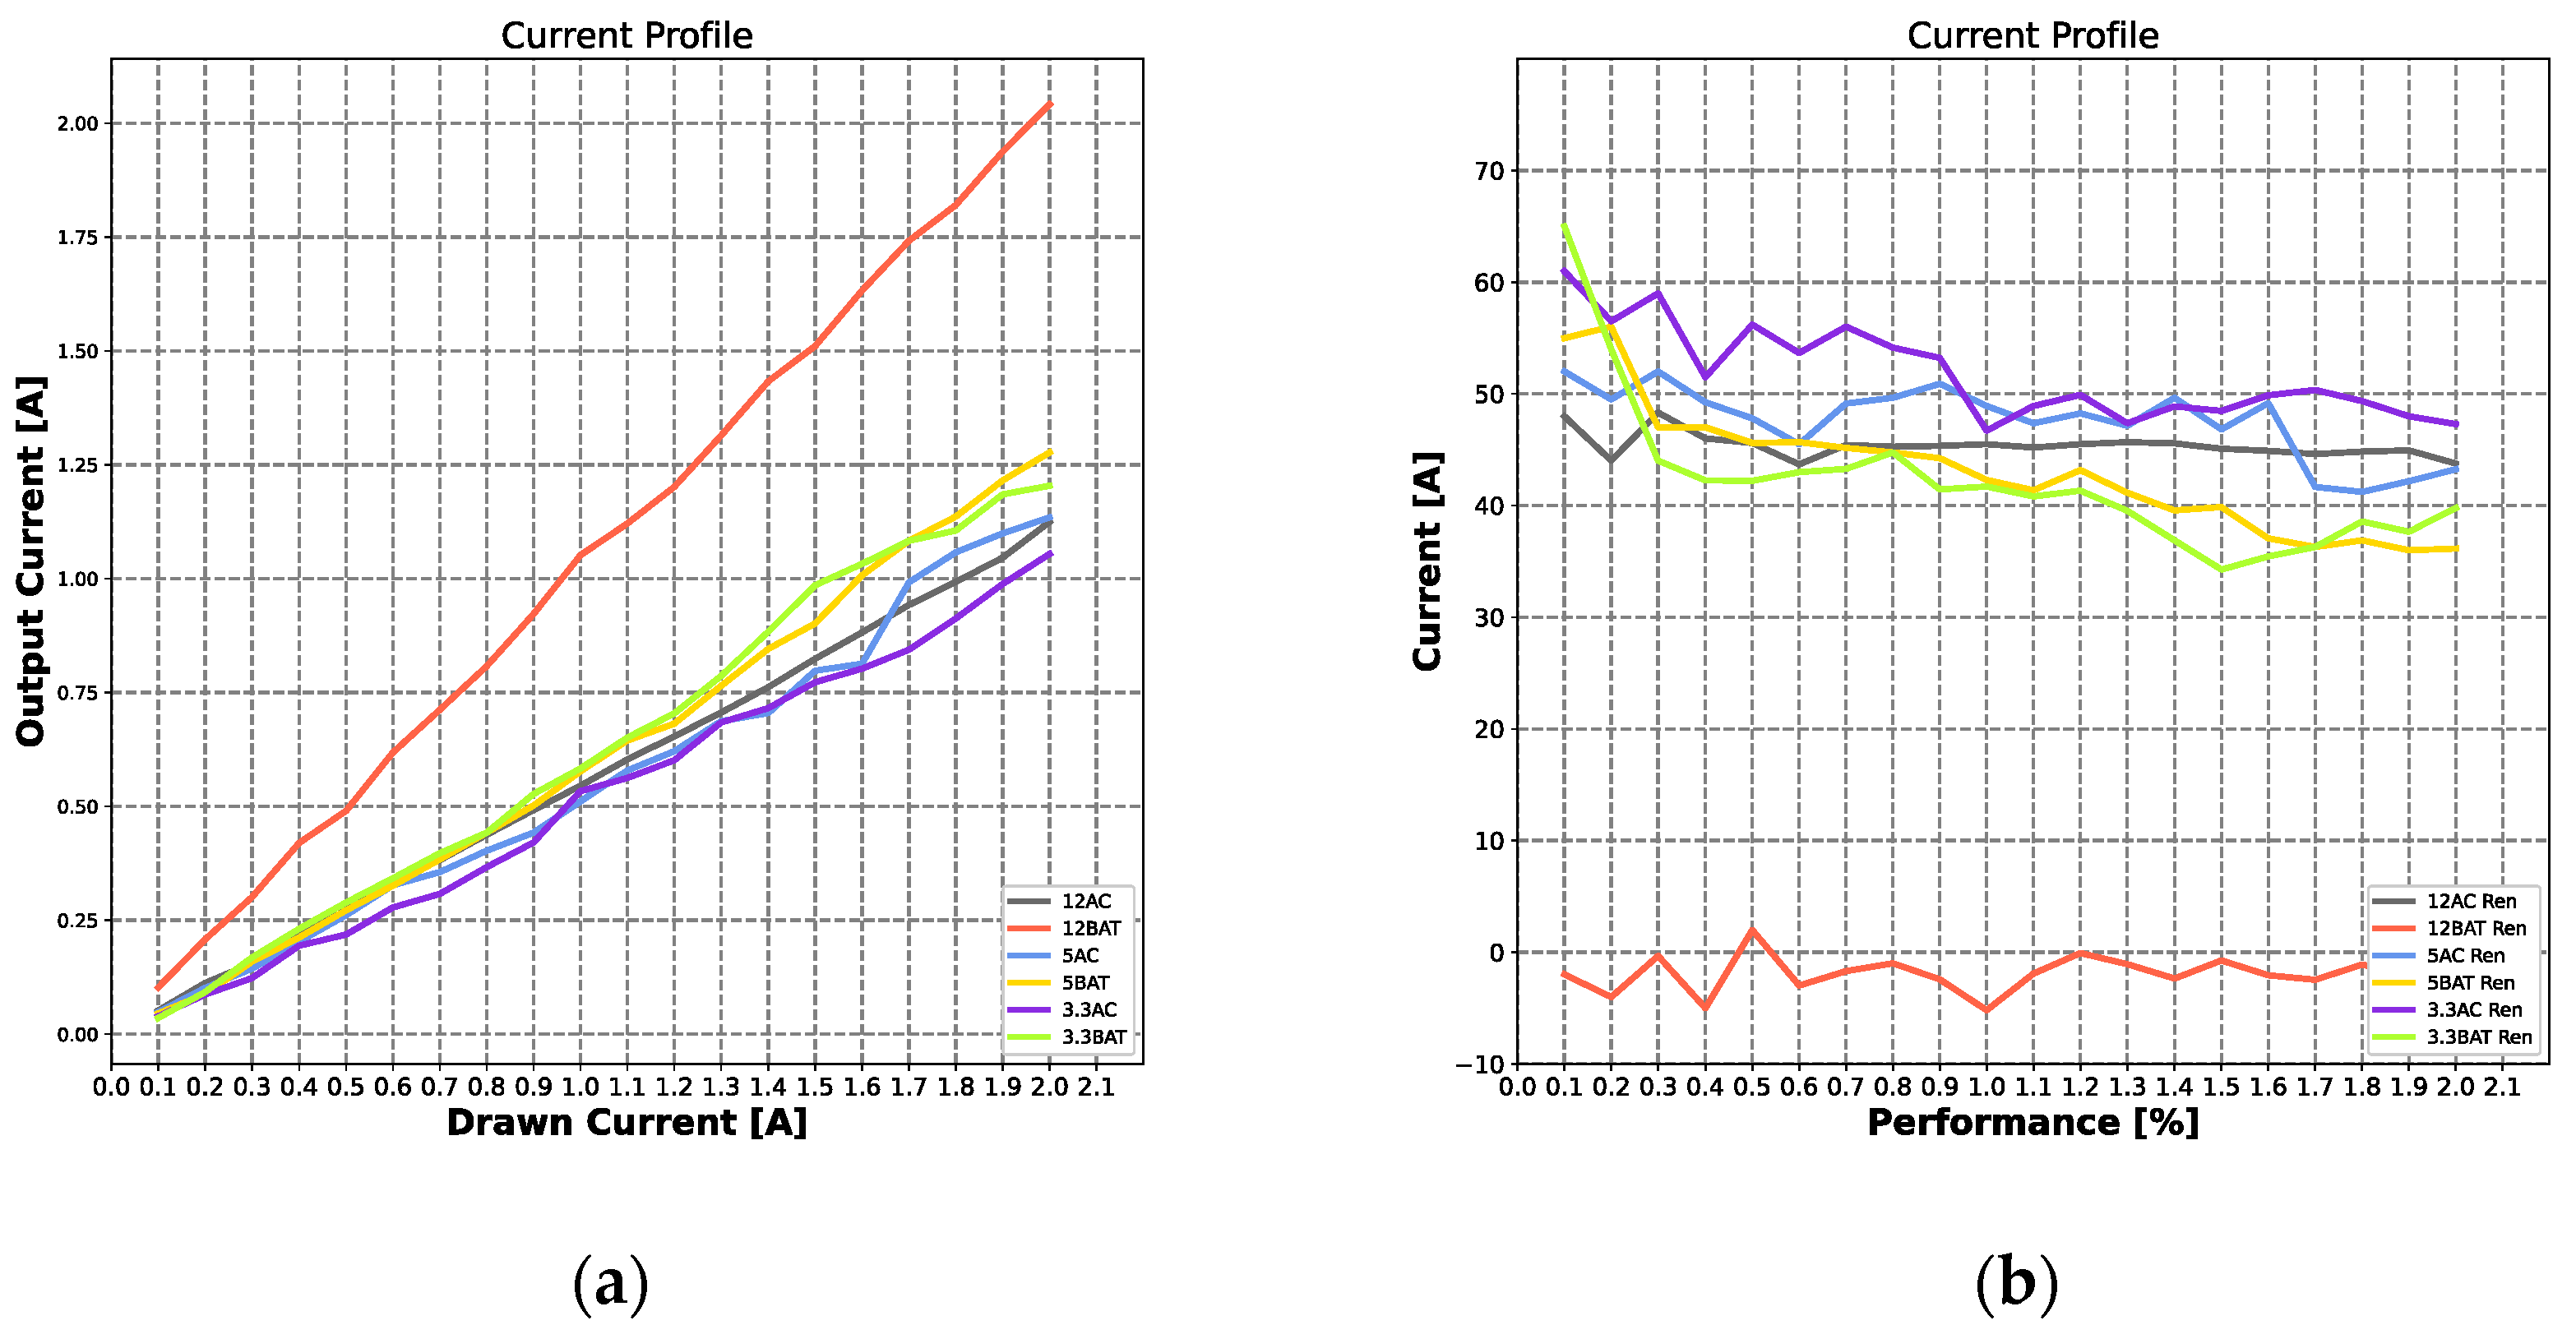
4.3. Current Profile
4.4. Battery Performance
4.5. Charging Time
4.6. Serial Communication
5. Conclusions
- The highest power drop after the maximum switching was 12% when operating at 12 V from AC to battery and providing 2 A to the load. The power drop during the switching was 30% and took 10 ms, not affecting the supply of energy. The remaining switching tests showed smaller drops and, in some cases, it was not possible to observe any voltage change during the switch.
- In the measurements when selecting 12 V as the nominal output voltage and keeping the power supply connected to the AC grid, the drop in the output voltage was less than 1% for an output current increased up to 2 A. The drop was less than 20% for the same current variation provided only by the battery.
- For the nominal voltages of 5 V and 3.3 V, the regulators presented an approximate drop of less than 3% both with the power provided only by the battery or by the AC network.
- The behavioral test of the current profile shows the joint behavior between pulling and delivering current from the regulator. The most favorable case occurred for the nominal voltage of 3.3 V with the regulator pulling 1.1 mA and delivering 2 A. The most unfavorable case occurred for the nominal voltage of 12 V with the battery pulling 2 A and delivering 2 A.
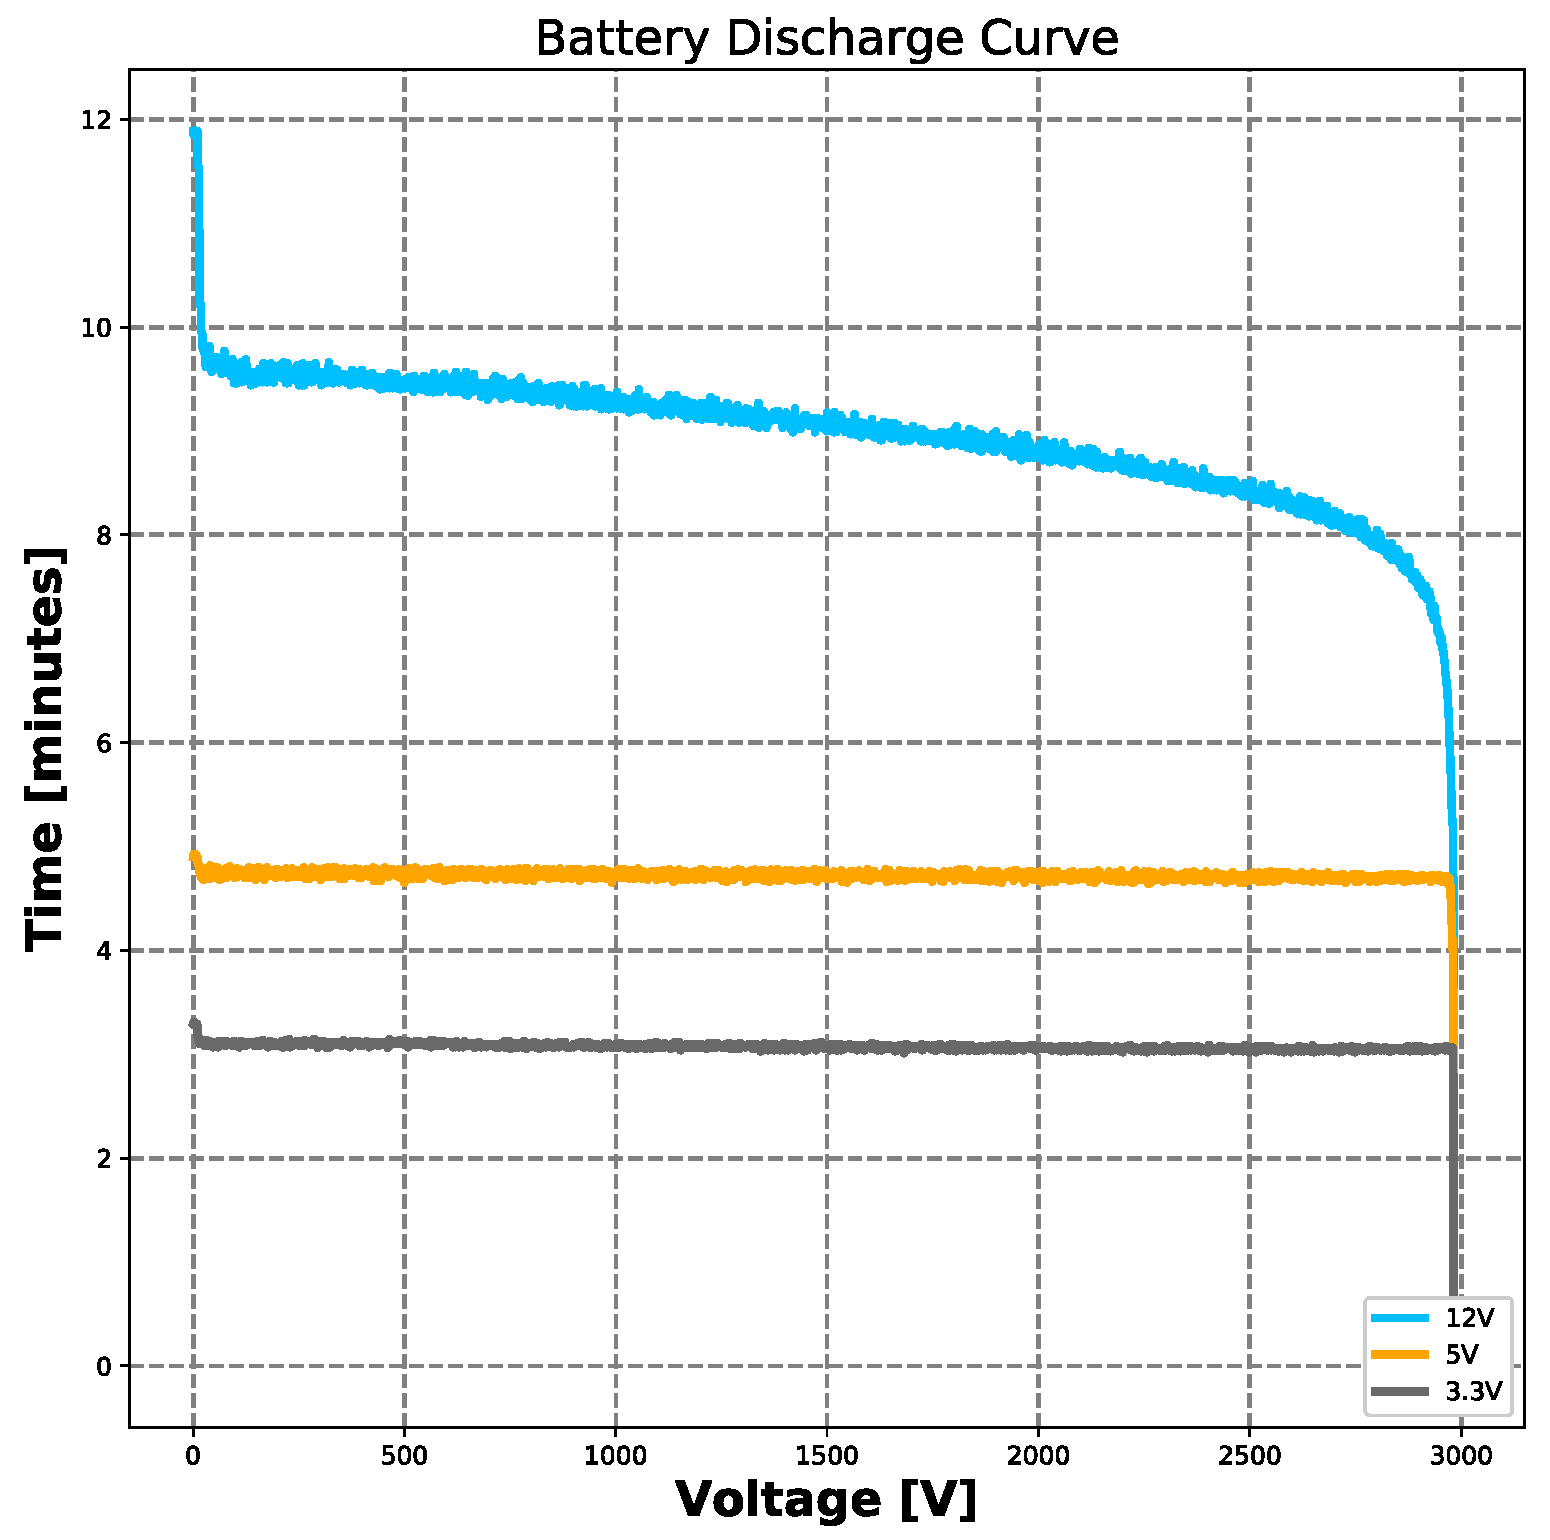
- The output voltage of the 12 V regulator dropped from 12 V to 9.5 V during a period of a few minutes and then it remained constant until the power supply was switched off.
- The power supply was able to charge 80% of the battery on a fast recharge of 1 h, and the remaining 20% on a slow recharge of 2 h. The current allocated to the battery did not affect the operation of the power supply.
- The power supply was able to serially transmit to external computers relevant information about its operation.
- The relevant information includes the voltages at the battery and at the output of voltage regulators, the voltage level of the AC network, the level of the battery charge or if it was being recharged, the current being used, the internal temperatures at two locations (one measured on the resistor that limits battery charge and another measured on the output diode of the regulators), and whether the cooling system is being used.
Author Contributions
Funding
Data Availability Statement
Acknowledgments
Conflicts of Interest
References
- Daniel, K.; Kütt, L.; Iqbal, M.N.; Shabbir, N.; Rehman, A.U.; Shafiq, M.; Hamam, H. Current Harmonic Aggregation Cases for Contemporary Loads. Energies 2022, 15, 437. [Google Scholar] [CrossRef]
- Ross, D. Power struggle [power supplies for portable equipment]. IEE Rev. 2003, 49, 34–38. [Google Scholar] [CrossRef]
- Moghaddam, A.F.; Bossche, A.V.D. A Smart High-Voltage Cell Detecting and Equalizing Circuit for LiFePO4 Batteries in Electric Vehicles. Appl. Sci. 2019, 9, 5391. [Google Scholar] [CrossRef]
- Seyezhai, R.; Ammaiyappan, A.B.S.; Heera, N.; Keerthana, P.; Srinivasan, M. Simulation and hardware development of AC-DC power converter for Off- board charger of EV. Mater. Today Proc. 2022, 62, 1189–1196. [Google Scholar] [CrossRef]
- Perinov; Marzuki, A.; Wibisono, G.; Hudaya, C. Design of Single Input Multiple Output Full Bridges DC-DC Converters For Personal Computer Power Supply. In Proceedings of the IEEE International Conference on Innovative Research and Development (ICIRD), Jakarta, Indonesia, 28–30 June 2019. [Google Scholar]
- Aljafari, B.; Vasantharaj, S.; Indragandhi, V.; Vaibhav, R. Optimization of DC, AC, and Hybrid AC/DC Microgrid-Based IoT Systems: A Review. Energies 2022, 15, 6813. [Google Scholar] [CrossRef]
- Abuzed, S.; Foster, M.; Tsang, C.-W.; Stone, D. Repurposing ATX Power Supply for Battery Charging Applications. In Proceedings of the 8th IET International Conference on Power Electronics, Machines and Drives (PEMD 2016), Glasgow, UK, 19–21 April 2016. [Google Scholar] [CrossRef]
- Sedaghati, N.; Martinez-Garcia, H.; Cosp-Vilella, J. On modeling of linear-assisted DC-DC voltage regulators. In Proceedings of the 2016 Conference on Design of Circuits and Integrated Systems (DCIS), Granada, Spain, 23–25 November 2016; pp. 1–4. [Google Scholar] [CrossRef]
- Carniti, P.; Cassina, L.; Gotti, C.; Maino, M.; Pessina, G. A low noise and high precision linear power supply with thermal foldback protection. Rev. Sci. Instrum. 2016, 87, 054706. [Google Scholar] [CrossRef]
- Arvindan, A.; Sharma, V. Hysteresis-Band Current Control of a Four Quadrant AC-DC Converter giving IEEE 519 compliant performance at any Power Factor. In Proceedings of the 2006 International Conference on Power Electronic, Drives and Energy Systems, New Delhi, India, 12–15 December 2006; pp. 1–6. [Google Scholar] [CrossRef]
- Zhao, B.; Song, Q.; Liu, W.; Xiao, Y. Next-Generation Multi-Functional Modular Intelligent UPS System for Smart Grid. IEEE Trans. Ind. Electron. 2013, 60, 3602–3618. [Google Scholar] [CrossRef]
- He, G.; Zheng, S.; Dong, Y.; Li, G.; Zhang, W. Model Predictive Voltage Control of Uninterruptible Power Supply Based on Extended-State Observer. Energies 2022, 15, 5489. [Google Scholar] [CrossRef]
- He, G.; Zhao, L.; Dong, Y.; Li, G.; Zhang, W. A Novel VSG Control Strategy for UPS Voltage Source Inverter with Impulsive Load. Energies 2022, 15, 4702. [Google Scholar] [CrossRef]
- Gunawardane, K.; Subasinghage, K.; Kularatna, N. Efficiency enhanced linear DC-DC converter topology with integrated DC-UPS capability. In Proceedings of the 2018 IEEE International Conference on Industrial Technology (ICIT), Lyon, France, 20–22 February 2018; pp. 712–717. [Google Scholar] [CrossRef]
- Kumar, P.A.; Devi, V.S.K.; Kakani, S.K. Reliability Improvement of Uninterrupted Power Supplies. In Proceedings of the 2018 4th International Conference for Convergence in Technology (I2CT), Mangalore, India, 27–28 October 2018; pp. 1–7. [Google Scholar] [CrossRef]
- Karpati, A.; Zsigmond, G.; Vörös, M.; Lendvay, M. Uninterruptible Power Supplies (UPS) for data center. In Proceedings of the 2012 IEEE 10th Jubilee International Symposium on Intelligent Systems and Informatics, Subotica, Serbia, 20–22 September 2012; pp. 351–355. [Google Scholar] [CrossRef]
- Schmidt, S.; Clausen, J.; van der Auwera, R.; Klapp, O.; Schmerler, R.; Löffler, D.; Werner, M.J.; Block, L. Novel Battery Module Design for Increased Resource Efficiency. World Electr. Veh. J. 2022, 13, 177. [Google Scholar] [CrossRef]
- Karve, S. Three of a kind. IEE Rev. 2000, 46, 27–31. [Google Scholar] [CrossRef]
- Zima, A.; Duprat, S.; Frangi, J.-P. Framework of a New Low-Cost Multipurpose Building Operation Datalogger Measurement Network. In Proceedings of the 2016 IEEE Intl Conference on Computational Science and Engineering (CSE) and IEEE Intl Conference on Embedded and Ubiquitous Computing (EUC) and 15th Intl Symposium on Distributed Computing and Applications for Business Engineering (DCABES), Paris, France, 24–26 August 2016; pp. 677–680. [Google Scholar] [CrossRef]
- Yadav, A.; Sakle, N. Development of low-cost data logger system for capturing transmission parameters of two-wheeler using Arduino. Mater. Today Proc. 2022. [Google Scholar] [CrossRef]
- Silva, H.E.; Coelho, G.; Henriques, F. Climate monitoring in World Heritage List buildings with low-cost data loggers: The case of the Jerónimos Monastery in Lisbon (Portugal). J. Build. Eng. 2020, 28, 101029. [Google Scholar] [CrossRef]
- Pasquali, V.; D’Alessandro, G.; Gualtieri, R.; Leccese, F. A new data logger based on Raspberry-Pi for Arctic Notostraca locomotion investigations. Measurement 2017, 110, 249–256. [Google Scholar] [CrossRef]
- Pillai, P.; Sundaresan, S.; Kumar, P.; Pattipati, K.R.; Balasingam, B. Open-Circuit Voltage Models for Battery Management Systems: A Review. Energies 2022, 15, 6803. [Google Scholar] [CrossRef]
- Zhang, R.; Xia, B.; Li, B.; Cao, L.; Lai, Y.; Zheng, W.; Wang, H.; Wang, W.; Wang, M. A Study on the Open Circuit Voltage and State of Charge Characterization of High Capacity Lithium-Ion Battery Under Different Temperature. Energies 2018, 11, 2408. [Google Scholar] [CrossRef]
- Fotopoulou, M.; Rakopoulos, D.; Trigkas, D.; Stergiopoulos, F.; Blanas, O.; Voutetakis, S. State of the Art of Low and Medium Voltage Direct Current (DC) Microgrids. Energies 2021, 14, 5595. [Google Scholar] [CrossRef]
- Zhou, X.; Wang, Y.; Wang, L.; Liu, Y.-F.; Sen, P.C. A Soft-Switching Transformerless DC−DC Converter With Single-Input Bipolar Symmetric Outputs. IEEE Trans. Power Electron. 2021, 36, 8640–8646. [Google Scholar] [CrossRef]
- Blessington, T.P.; Murthy, B.B.; Ganesh, G.V.; Prasad, T.S.R. Optimal implementation of UART-SPI Interface in SoC. In Proceedings of the 2012 International Conference on Devices, Circuits and Systems (ICDCS), Coimbatore, India, 15–16 March 2012; pp. 673–677. [Google Scholar] [CrossRef]
- Amazon. Amazon.com: Online Shopping for Electronics, Apparel, Computers, Books, DVDs & More. [online] Amazon.com. 2021. Available online: https://www.amazon.com (accessed on 3 July 2022).
- www.digikey.com. (n.d.). DigiKey Electronics—Electronic Components Distributor. [online]. Available online: https://www.digikey.com (accessed on 3 July 2022).
- www.mouser.com. (n.d.). Electronic Components Distributor—Mouser Electronics. [online]. Available online: https://www.mouser.com/ (accessed on 3 July 2022).
- AliExpress—Online Shopping for Popular Electronics, Fashion, Home & Garden, Toys & Sports, Automobiles and More. Available online: best.aliexpress.com (accessed on 3 July 2022).


| # | Item | Model | Characteristics | Costs |
|---|---|---|---|---|
| 1 | power cable | Type 8 | 1.8 m two poles | $5.88 |
| 2 | input connector | Type 8 | chassis mount | $0.85 |
| 3 | ON/OFF switch | KDC11 | 250 V 3 A ON/ON | $0.20 |
| 4 | 2 fuse holder | Generic | chassis mount | $1.16 |
| 5 | 2 glass fuses | 5 × 20 mm | 3 A | $0.20 |
| 6 | AC/DC converter | M5-60-24 | 24 V/3 A bivolt | $10.99 |
| 7 | 2 resistors | 50W6J | 6 Ω 50 W metal dissipation | $5.98 |
| 8 | 12 V battery | EP12-2.2 | 12 V 2.3 Ah lead-acid battery | $19.00 |
| 9 | glass fuse | 5 × 20 mm | 2 A | $0.10 |
| 10 | fuse holder | Generic | wire to wire | $0.69 |
| 11 | temperature sensor | TMP36 | −40 + 125 °C analog sensor | $1.75 |
| 12 | DC-DC buck-boost | TPS54360 | symmetric 3 A +12 V 3 A −12 V | $14.36 |
| 13 | 2 DC-DC buck | LM2596 | positive de 3 A 3.2 V at 40 V | $3.60 |
| 14 | OLED display | GM009605 | OLED 128 × 64 pixel I2C | $1.66 |
| 15 | BMS | DD30CRTA | 12 Vup to 45 A/h charger | $7.99 |
| 16 | load wires | Generic | AWG 10 | $6.00 |
| 17 | DC wires | Generic | AWG 13 | $5.00 |
| 18 | discrete wires | Generic | AWG 18 | $5.00 |
| Total: | $90.41 |
| Qty | Value | Device | Package | Parts | Price |
|---|---|---|---|---|---|
| 4 | 0.1 uf | CAPACITOR-KIT-1VISHAY | 402 | C3, C9, C35, C40 | $0.20 |
| 1 | 100 uf | CAPACITOR-KIT-11206 | 1206 | C4 | $0.30 |
| 1 | 10 M | RESISTORVISHAY | 402 | R14 | $0.05 |
| 6 | 10 k | RESISTORVISHAY | 402 | R2, R7, R11, R12, R13, R15 | $0.30 |
| 1 | 16 k | RESISTORVISHAY | 402 | R1 | $0.05 |
| 3 | 1 k | RESISTORVISHAY | 402 | R3, R4, R5 | $0.15 |
| 2 | 1n5408 | DIODE-FR | DIODE1.5A | D3, D5 | $2.50 |
| 3 | 20 k | RESISTORVISHAY | 402 | R6, R8, R10 | $0.15 |
| 2 | 20 pf | CAPACITOR-KIT-1VISHAY | 402 | C41, C42 | $0.12 |
| 1 | 47 uf | CAPACITOR-KIT-11206 | 1206 | C5 | $0.06 |
| 1 | 56 k | RESISTORVISHAY | 402 | R9 | $0.05 |
| 1 | ATMEGA328PB | ATMEGA328PB-MU | QFN50P500 | U2 | $1.76 |
| 5 | BAT46W-E3-08 | DIODE_1SOD-123 | SOD-123 | D1, D2, D4, D6, D8 | $2.00 |
| 1 | Buzzer | CYT1036 | CYT1036 | SG2 | $0.69 |
| 1 | Crystal | FA-238 16.0000MB-AG3 | 4-SMD@1 | CK1 | $0.86 |
| 2 | KF2EDGK | AK500/3-H | AK500/3-H | X1, X3 | $1.10 |
| 1 | Kf301 | M02F | Borne 2× | FUSE | $0.93 |
| 2 | Kf301 | M03 | Borne 3× | JP9, JP14 | $1.06 |
| 1 | LDL50 | REGULATOR_ 1117AMS117 | SOT223 | REG1 | $0.68 |
| 1 | M10 × 1 | CONN_10”; 1 × 10” | J2 | 0.1 inch spaced | $0.88 |
| 1 | M2 × 1 | M02PTH | 1X02 | JP1 | $0.12 |
| 1 | M3 × 1 | M03LOCK | 1X03_LOCK | 7805 | $0.15 |
| 3 | NPN-BC337 | TRANSISTOR-NPN-BC337 | BC337 | Q3, Q4, Q5 | $1.00 |
| 2 | JQF-3FF-S-Z | RELAY-PACKA | RELAY_ G5LE | K1, K2 | $1.16 |
| 1 | m10 × 2 | CONN_10X2 | 2X10 | J3 | $0.12 |
| 2 | mmbt2222a-7-f | TRANSISTOR_ NPNMPSA42 | SOT23-3 | Q1, Q2 | $0.28 |
| 1 | PCB | MCU PCB | 50 × 70 | PCB | $1.00 |
| Total: | $17.72 | ||||
| Part | Time | Material | Costs |
|---|---|---|---|
| Main (body) | 15:00 h | 200 g | $3.00 |
| Lid (main power supply lid) | 6:30 h | 80 g | $1.20 |
| Expand (area for external connection) | 2:00 h | 20 g | $0.30 |
| Expand holder (external connection area) | 0:30 h | 5 g | $0.08 |
| Front lid (frontal area with screen and button) | 0:35 h | 5 g | $0.08 |
| Bat holder (support to attach the battery) | 0:40 h | 10 g | $0.15 |
| Backside lid (hear part of the power supply) | 2:00 h | 15 g | $0.23 |
| Total: | 27:15 h | 325 g | $5.04 |
Disclaimer/Publisher’s Note: The statements, opinions and data contained in all publications are solely those of the individual author(s) and contributor(s) and not of MDPI and/or the editor(s). MDPI and/or the editor(s) disclaim responsibility for any injury to people or property resulting from any ideas, methods, instructions or products referred to in the content. |
© 2022 by the authors. Licensee MDPI, Basel, Switzerland. This article is an open access article distributed under the terms and conditions of the Creative Commons Attribution (CC BY) license (https://creativecommons.org/licenses/by/4.0/).
Share and Cite
Amorim, M.L.M.; Ginja, G.A.; Carmo, J.P.; Moreira, M.M.A.; Siqueira, A.A.G.; Afonso, J.A. Low-Cost/High-Precision Smart Power Supply for Data Loggers. Energies 2023, 16, 278. https://doi.org/10.3390/en16010278
Amorim MLM, Ginja GA, Carmo JP, Moreira MMA, Siqueira AAG, Afonso JA. Low-Cost/High-Precision Smart Power Supply for Data Loggers. Energies. 2023; 16(1):278. https://doi.org/10.3390/en16010278
Chicago/Turabian StyleAmorim, Marcio L. M., Gabriel Augusto Ginja, João Paulo Carmo, Melkzedekue Moraes Alcântara Moreira, Adriano Almeida Goncalves Siqueira, and Jose A. Afonso. 2023. "Low-Cost/High-Precision Smart Power Supply for Data Loggers" Energies 16, no. 1: 278. https://doi.org/10.3390/en16010278
APA StyleAmorim, M. L. M., Ginja, G. A., Carmo, J. P., Moreira, M. M. A., Siqueira, A. A. G., & Afonso, J. A. (2023). Low-Cost/High-Precision Smart Power Supply for Data Loggers. Energies, 16(1), 278. https://doi.org/10.3390/en16010278