Article

Analysis of the Influence of Structure–Soil–Structure Interaction on the Seismic Response for Nuclear Power Plant ASTS

1
Nuclear and Radiation Safety Center, Ministry of Ecology and Environment, Beijing 100082, China
2
Faculty of Architecture, Civil and Transportation Engineering, Beijing University of Technology, Beijing 100124, China
*
Author to whom correspondence should be addressed.
Energies 2023, 16(1), 194; https://doi.org/10.3390/en16010194
Submission received: 17 November 2022 / Revised: 20 December 2022 / Accepted: 21 December 2022 / Published: 24 December 2022
(This article belongs to the Section B4: Nuclear Energy)

Abstract

:
After the Fukushima nuclear accident in Japan, whether the structural safety of the nuclear power plant (NPP) can be guaranteed under an earthquake has been of wide concern. Automatic seismic trip systems (ASTS) have been deployed in NPPs. There are generally two units or more double units on the one NPP site, and the vibration energy of the structure can certainly affect its adjacent structures through the soil, and there is energy transfer and conversion between adjacent structures. At present, the distance between two reactors of NPPs of different reactor types is generally 100–200 m (this distance is referring to the distance between the centers of two reactors, which is slightly different for different reactor types). In the past, seismic instruments were used in the ASTS and the setting of shutdown threshold, so the impact of only one unit was considered in the structural analysis of NPPs, and the interaction of two reactors through site conditions was not considered. In addition, as the site conditions of NPPs become more and more complex, it is necessary to consider the impact of one reactor structure on another reactor structure through the soil on the same site under an earthquake. In order to analyze the influence of structure–soil–structure interaction (SSSI), a three-dimensional refined finite element model of NPPs is established in this paper. The soil–structure interaction (SSI) is considered by using viscoelastic boundary. The seismic responses of different positions of the raft foundation and NPP structure, under the conditions of considering SSI effect (one reactor) and SSSI effect (two reactors), are compared. The influence of SSSI effect on the seismic responses of the raft foundation and NPP structure is revealed. It is proposed that SSSI effect should be reasonably considered according to the site conditions for the structural analysis of NPPs for the NPP ASTS.

1. Introduction

The influence of soil–structure interaction (SSI) should be considered in the seismic response analysis of a nuclear power plant structure [1,2,3]. The effect on the overall structural response motions, in the case of two structures in close proximity, is also found to be secondary in studies reported in Lucoand Contesse, Wong and Luco, and Ostadan et al. [4,5,6,7]. Since NPPs usually include closely spaced structures with different sizes and depths, the seismic response of each structure may be affected by adjacent closely spaced structures. In order to explore the dynamic interaction principle of adjacent NPP structures under an earthquake, the Nuclear Power Engineering Corporation (NUPEC) conducted a series of field tests and numerical simulation studies on the dynamic performance of NPPs, and investigated the effects of different spacing of adjacent structures, whether they are exposed or buried foundations, and foundation burial depth. In the research project implemented by NUPEC, Kitada et al. [8] conducted a series of field full-scale tests and indoor model tests. It is found that the existence of adjacent structures will change the dynamic characteristics and dynamic response of the whole system, and the effect of this change will vary with the direction of external excitation and the spatial arrangement of two adjacent structures. Subsequently, Clouteau et al. [9] found that the existence of adjacent structures has little impact on the seismic response of the system when shallow foundations are used, but for embedded foundations, the existence of adjacent structures significantly affects the seismic response of the system, such as increasing the amplitude of the top of the structure. In view of the structural characteristics of NPPs, the structural dimensions and weights of different functions will vary greatly. In terms of research on interaction between adjacent structures with different weights and sizes, Naserkhaki et al. [10] and Anderson et al. [11] found that relatively light structures have very small interaction effects on heavier structures, but heavier structures have very significant effects on lighter structures. In addition, Roy et al. [12] studied the dynamic response of adjacent surface structures under different soil conditions, foundation burial depth and structure spacing, mainly considering the influence of structure weight on system response spectrum and peak acceleration. The results show that the response of the SSSI system decreases with the decrease in soil stiffness and the increase in structure spacing.
Automatic seismic trip systems (ASTS) have been widely deployed in NPPs. Previous studies did not consider the impact of SSSI on different locations of NPPs. However, this is important because the seismic response at different locations under SSSI conditions will directly determine the deployment position of seismic instruments used in the ASTS and the setting of shutdown threshold. In this paper, it is proposed to compare the seismic responses of different positions of raft foundation and NPP structure under the conditions of considering SSI effect (one reactor structure) and SSSI effect (two reactors structures) to discuss and analyze the influence of SSSI effect on the seismic response of raft foundation and NPP structure. The finite element analysis method has been considered as one of the most effective approaches for simulating seismic behaviors of civil infrastructures and nuclear structures [13].

2. Numerical Analysis Methods and Models

2.1. Finite Element Model

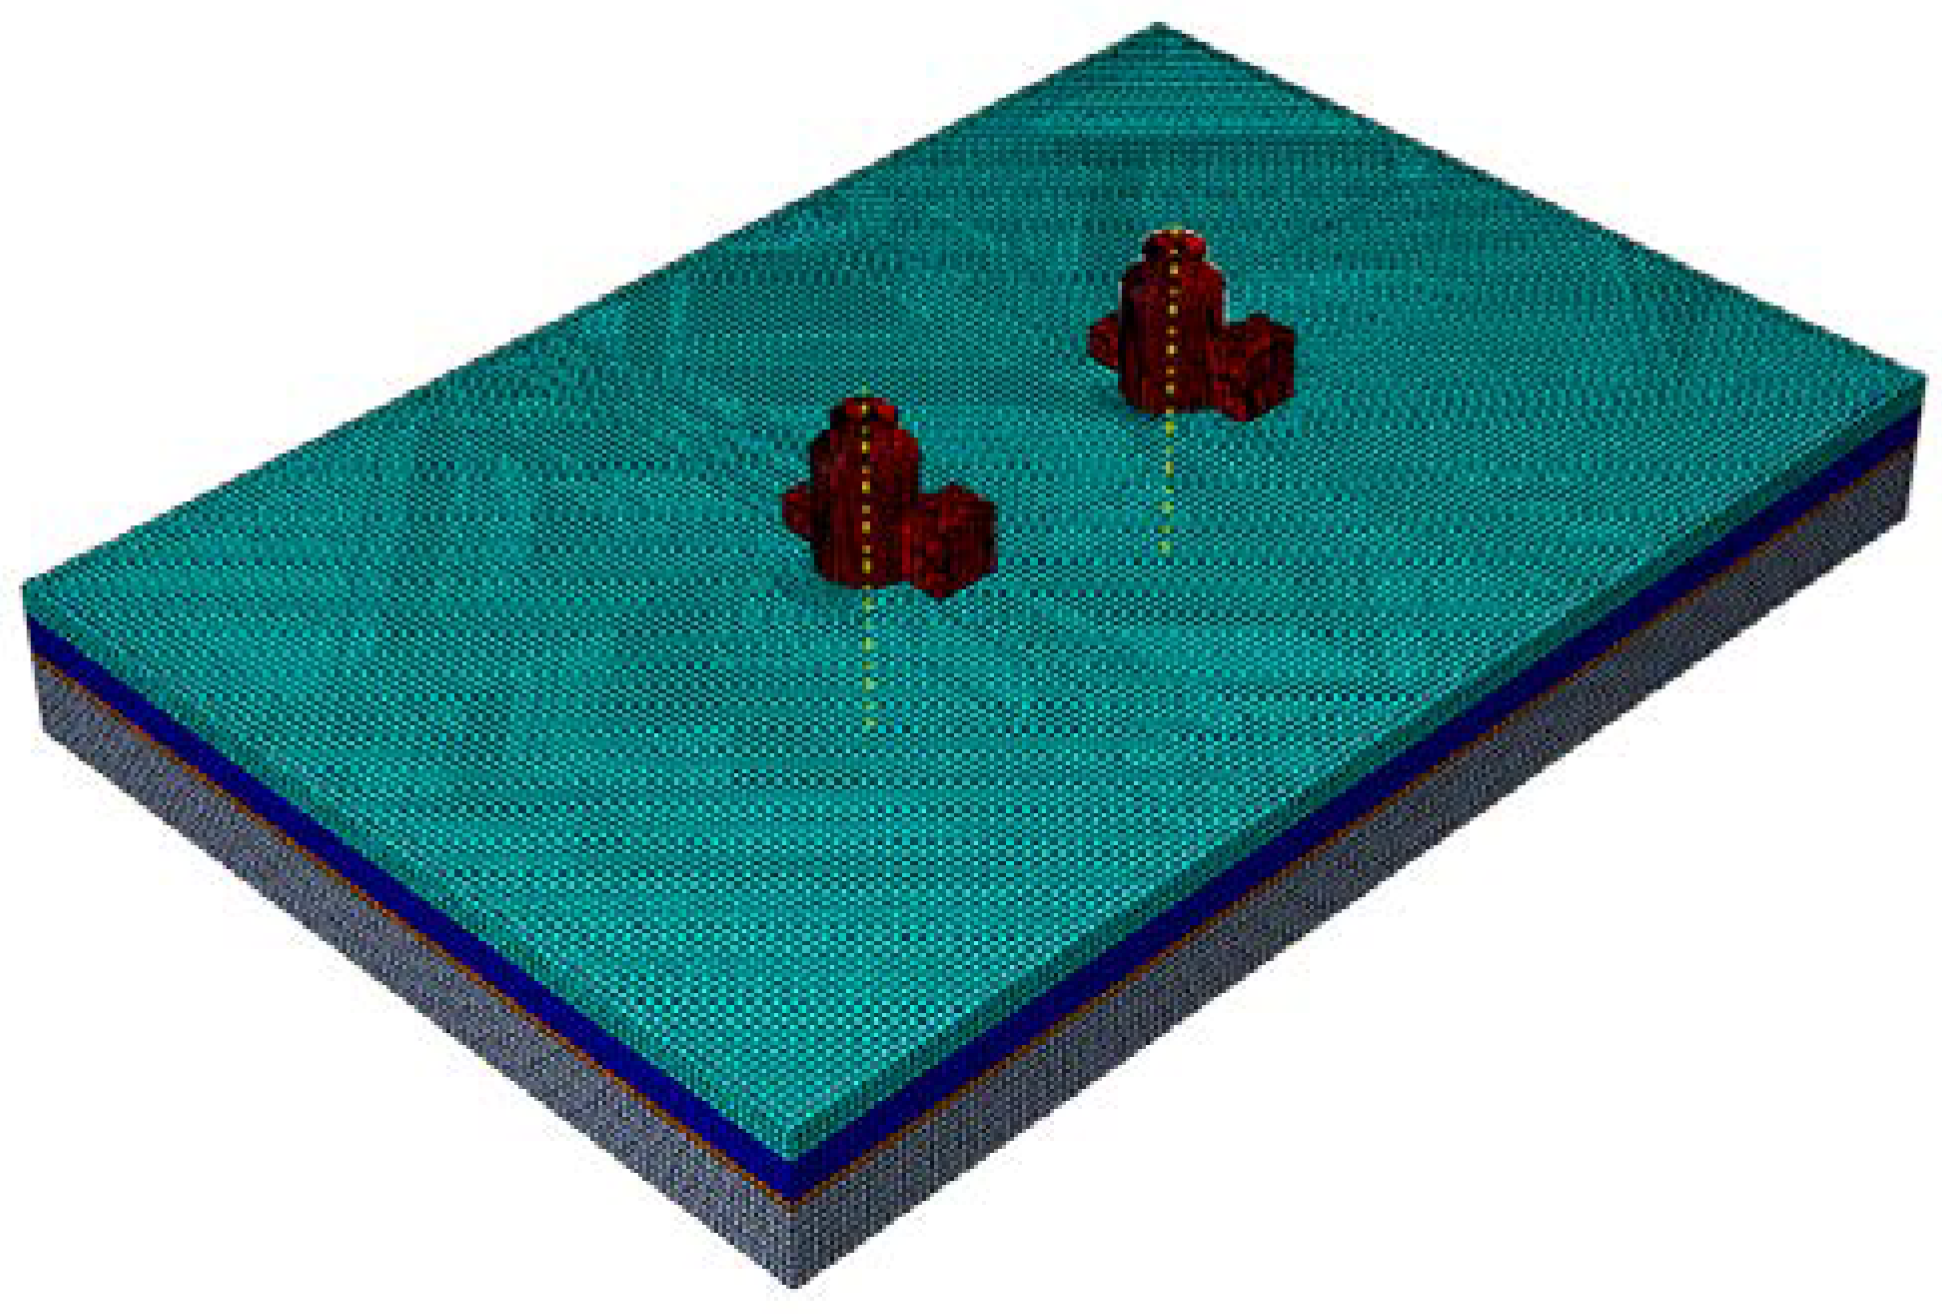
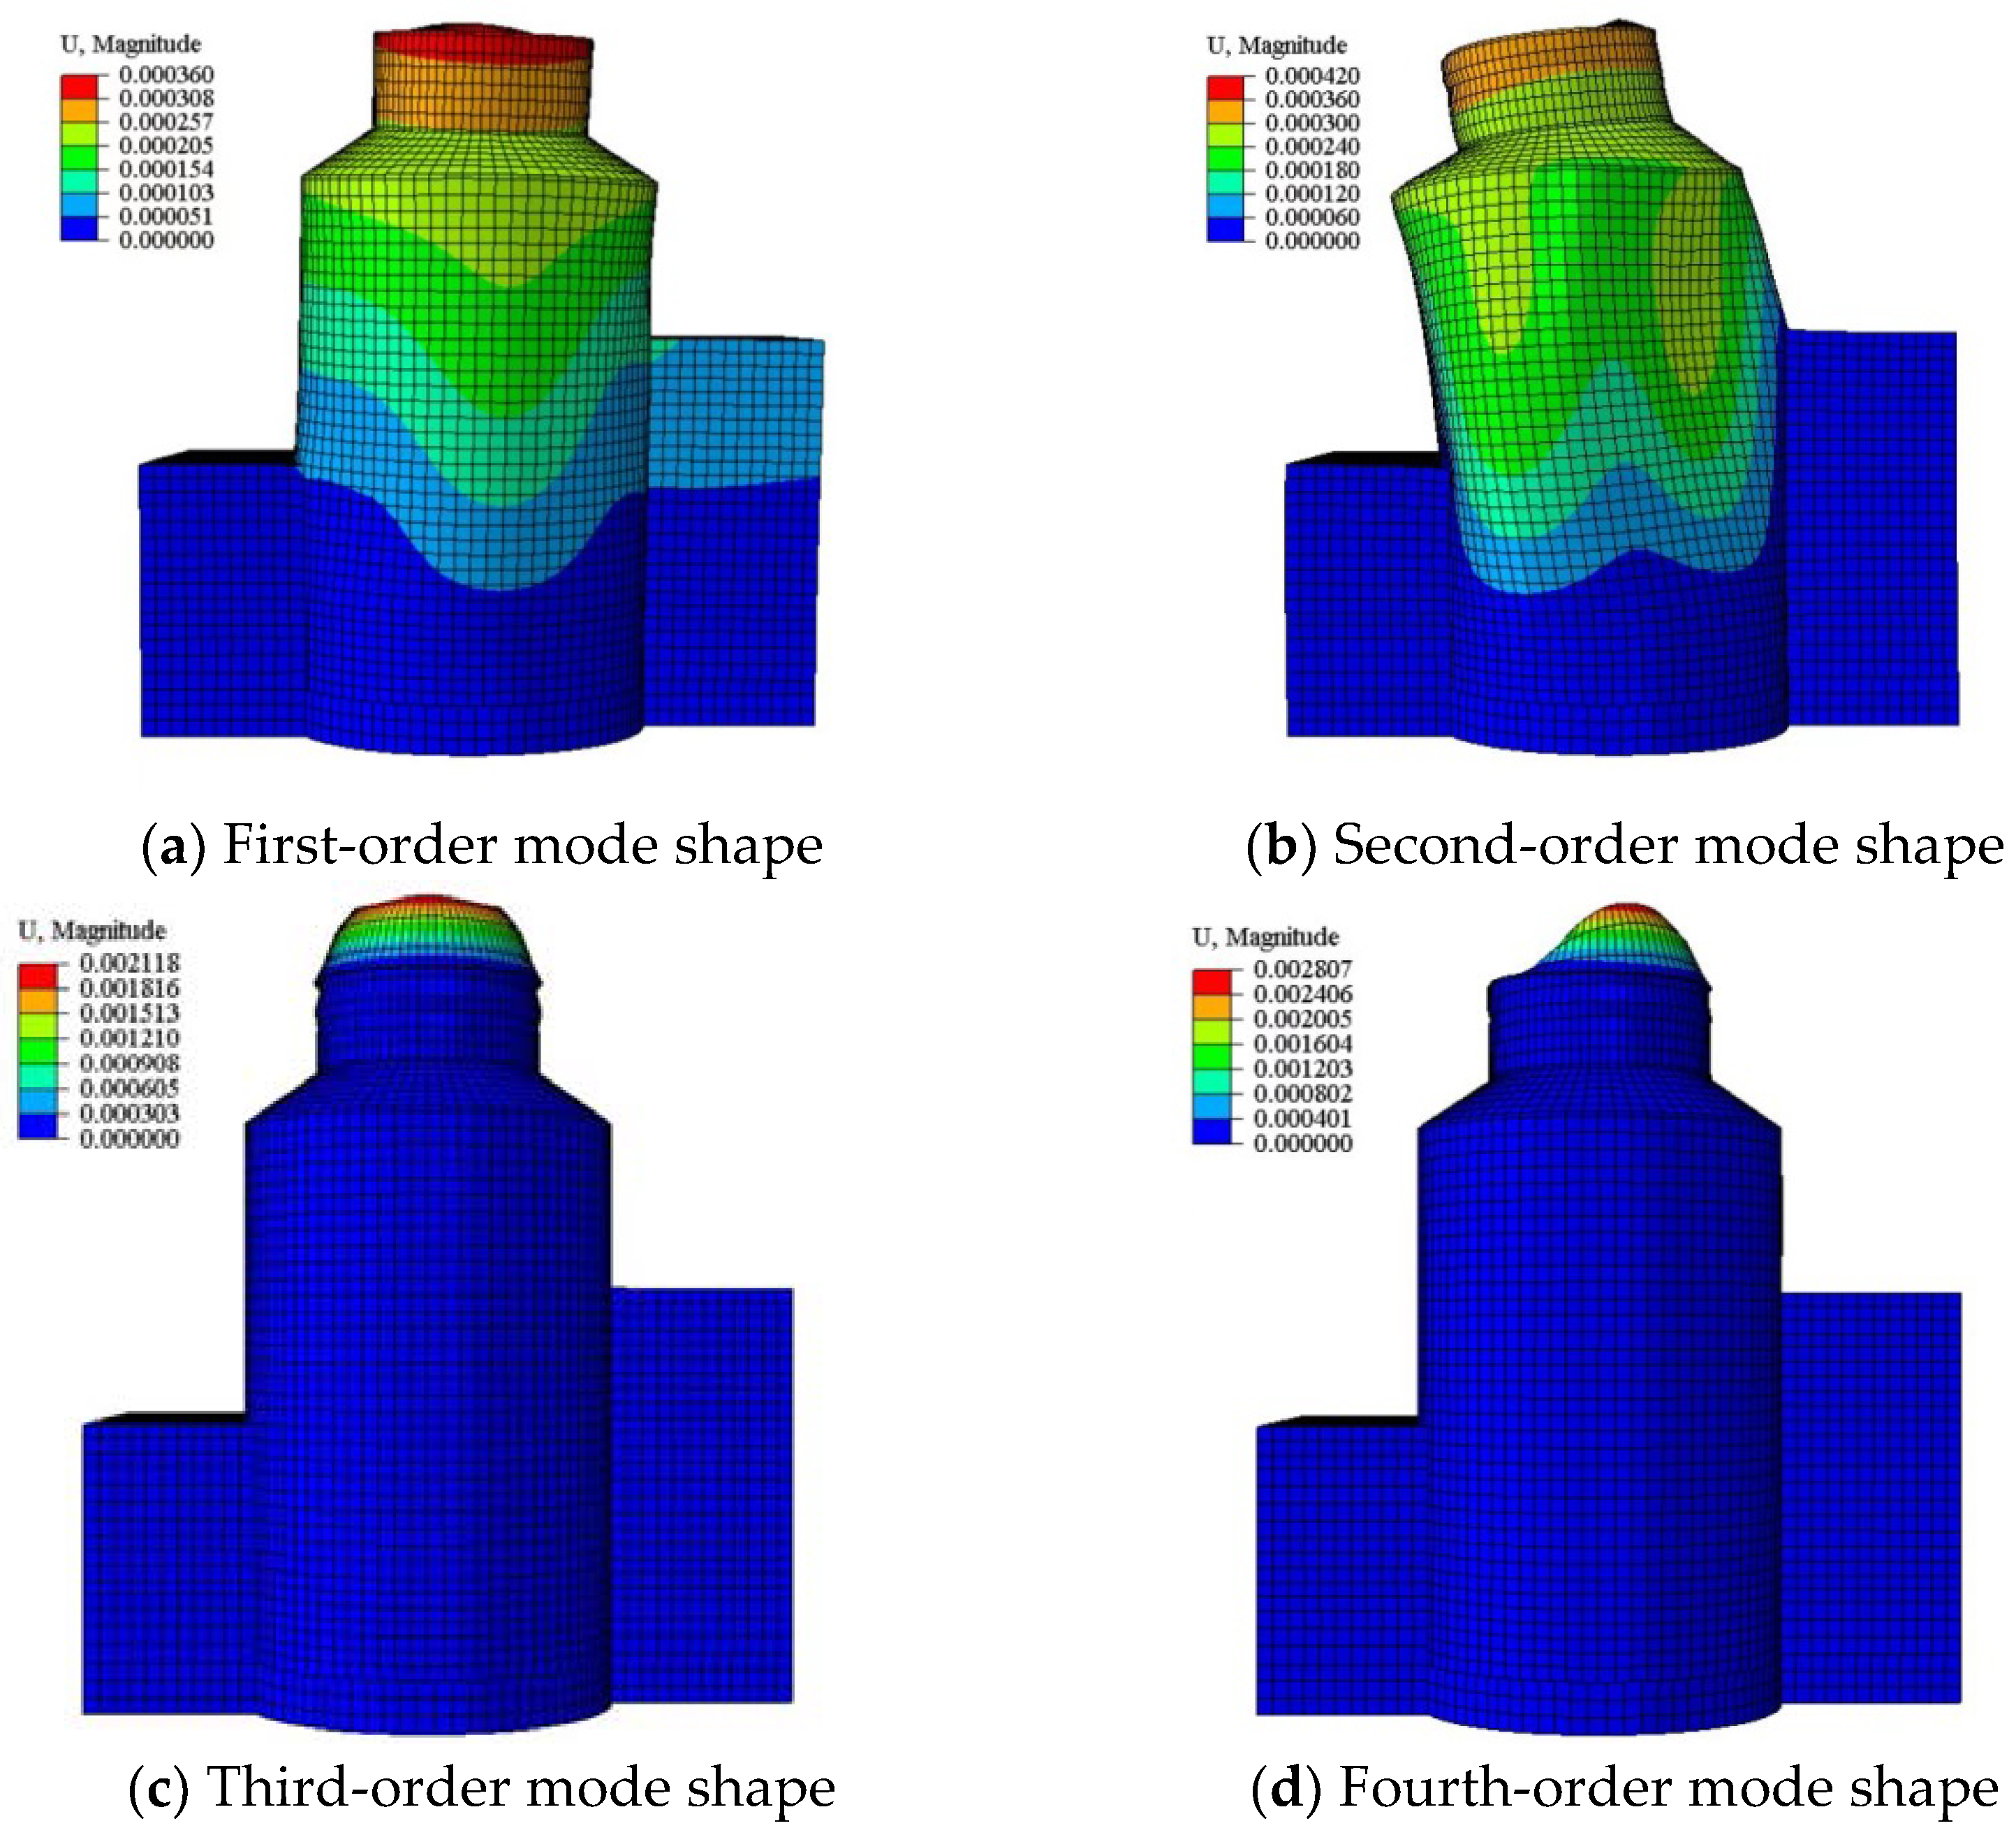
The finite element model of soil–structure interaction (SSI) was established according to the relevant drawings of the NPPs, using the software ABAQUS6.14. The concrete strength grade is C55. The mesh size used for solid and shell elements is 2 m. The soil–structure interaction system is shown in Figure 1, where there were 182,031 elements and 216,807 nodes. The length, width, and height of the foundation are 1000 m, 600 m, and 80 m. The structure–soil–structure interaction system, including two reactors structures, is shown in Figure 2. The length, width, and height of the foundation are 1200 m, 600 m, and 80 m. The layout of the two reactors structures is determined according to the actual situation, and the center points of the two reactors structures are 200 m. The first four modes calculated are shown in Figure 3. The first four modes are listed in Table 1.

2.2. Site Conditions

The mesh density setting is according to the Code for Seismic Design of Nuclear Power Plants (GB 50267-2019) [14],
h β · V s f max
where f max is the highest frequency of seismic vibration; V s is the shear wave velocity; and β is a coefficient between 1 5 1 12 .
As for site conditions, the actual layered site was selected, provided by the Site Safety Analysis Report (SSAR) of Guangdong NPP Phase I Project, as shown in Table 2 below.
Rayleigh damping was selected to simulate the energy dissipation [15,16], and the calculation formula was as follows:
C = α M + β K
where α is the mass coefficient, M is the mass matrix, β is the stiffness coefficient, and K is the stiffness matrix.
α = 2 ω i ω j ( ω j ξ i ω i ξ j ) ω j 2 ω i 2
β = 2 ( ω i ξ i ω j ξ j ) ω i 2 ω j 2
where ξ i and ξ j are the damping ratio for the i and j, and the same as ω i and ω j .

2.3. Ground Motion Input

By combining the site response with the viscoelastic boundary, the site seismic response can be converted into the equivalent load on the truncated boundary as the ground motion input [17,18].
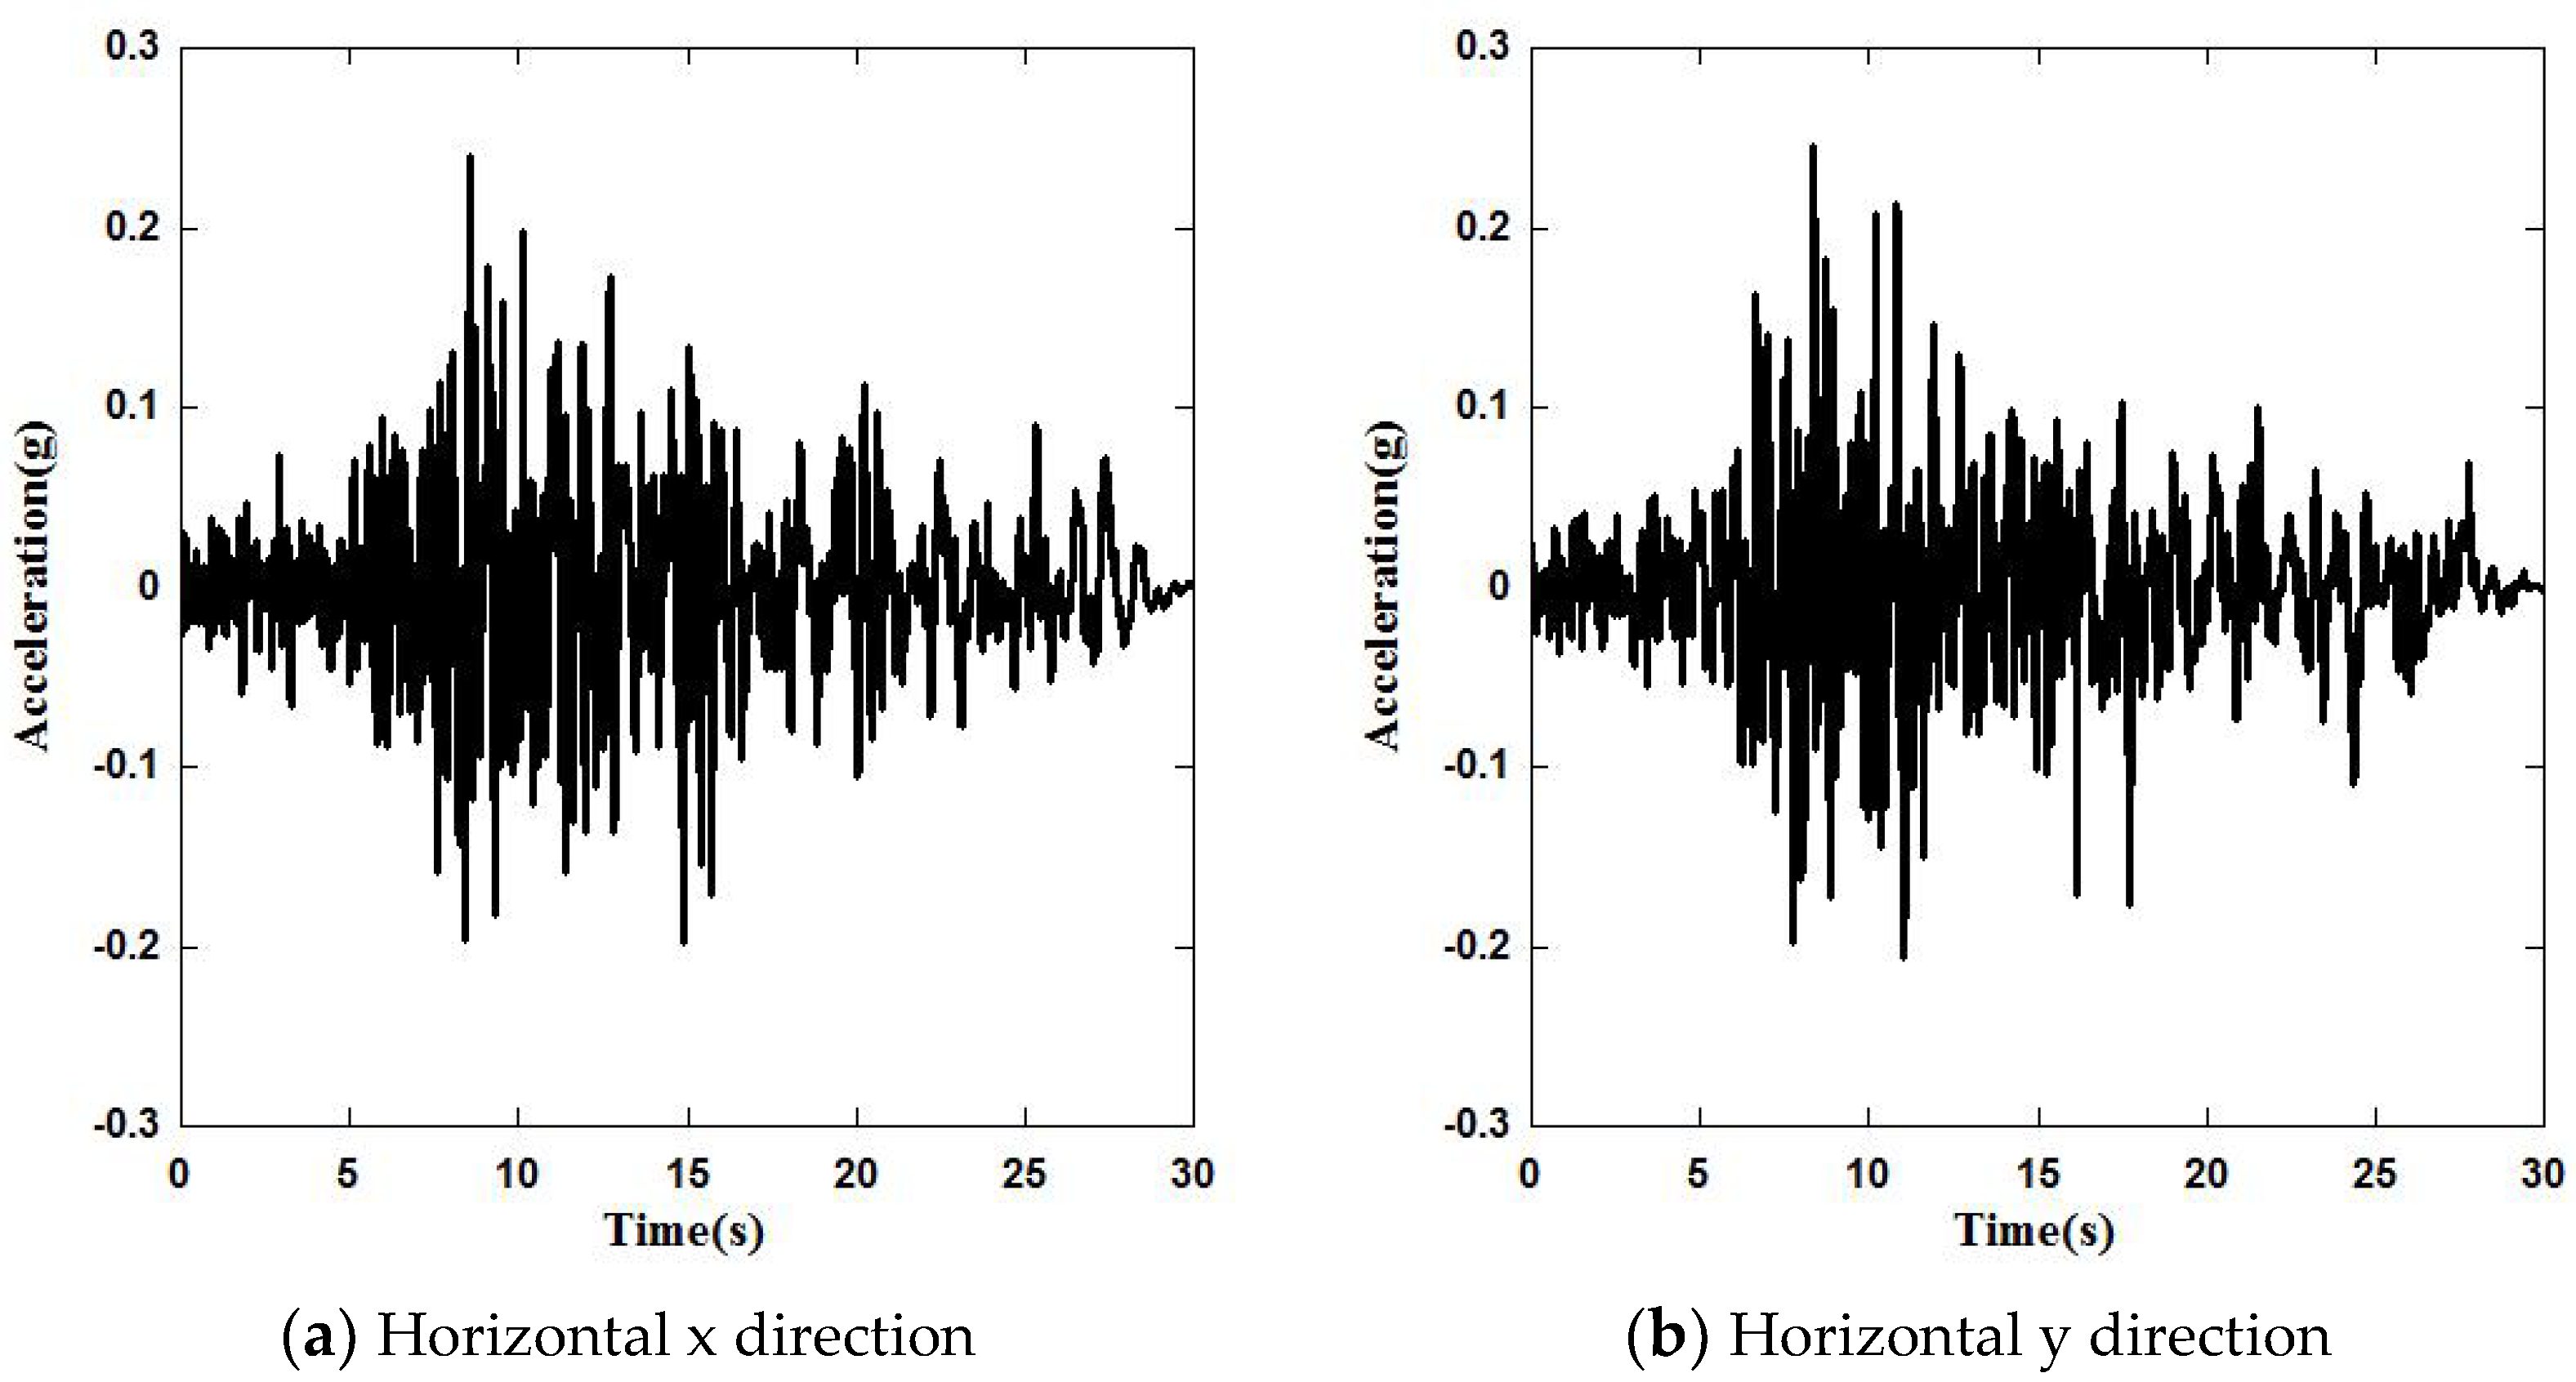
In this paper, the actual time history provided in the SSAR of Guangdong NPP Phase I Project was selected, with time histories shown in Figure 4.

3. Analysis of Seismic Parameters of Raft Foundation

3.1. Seismic Parameter Analysis of Raft Foundation of SSI System

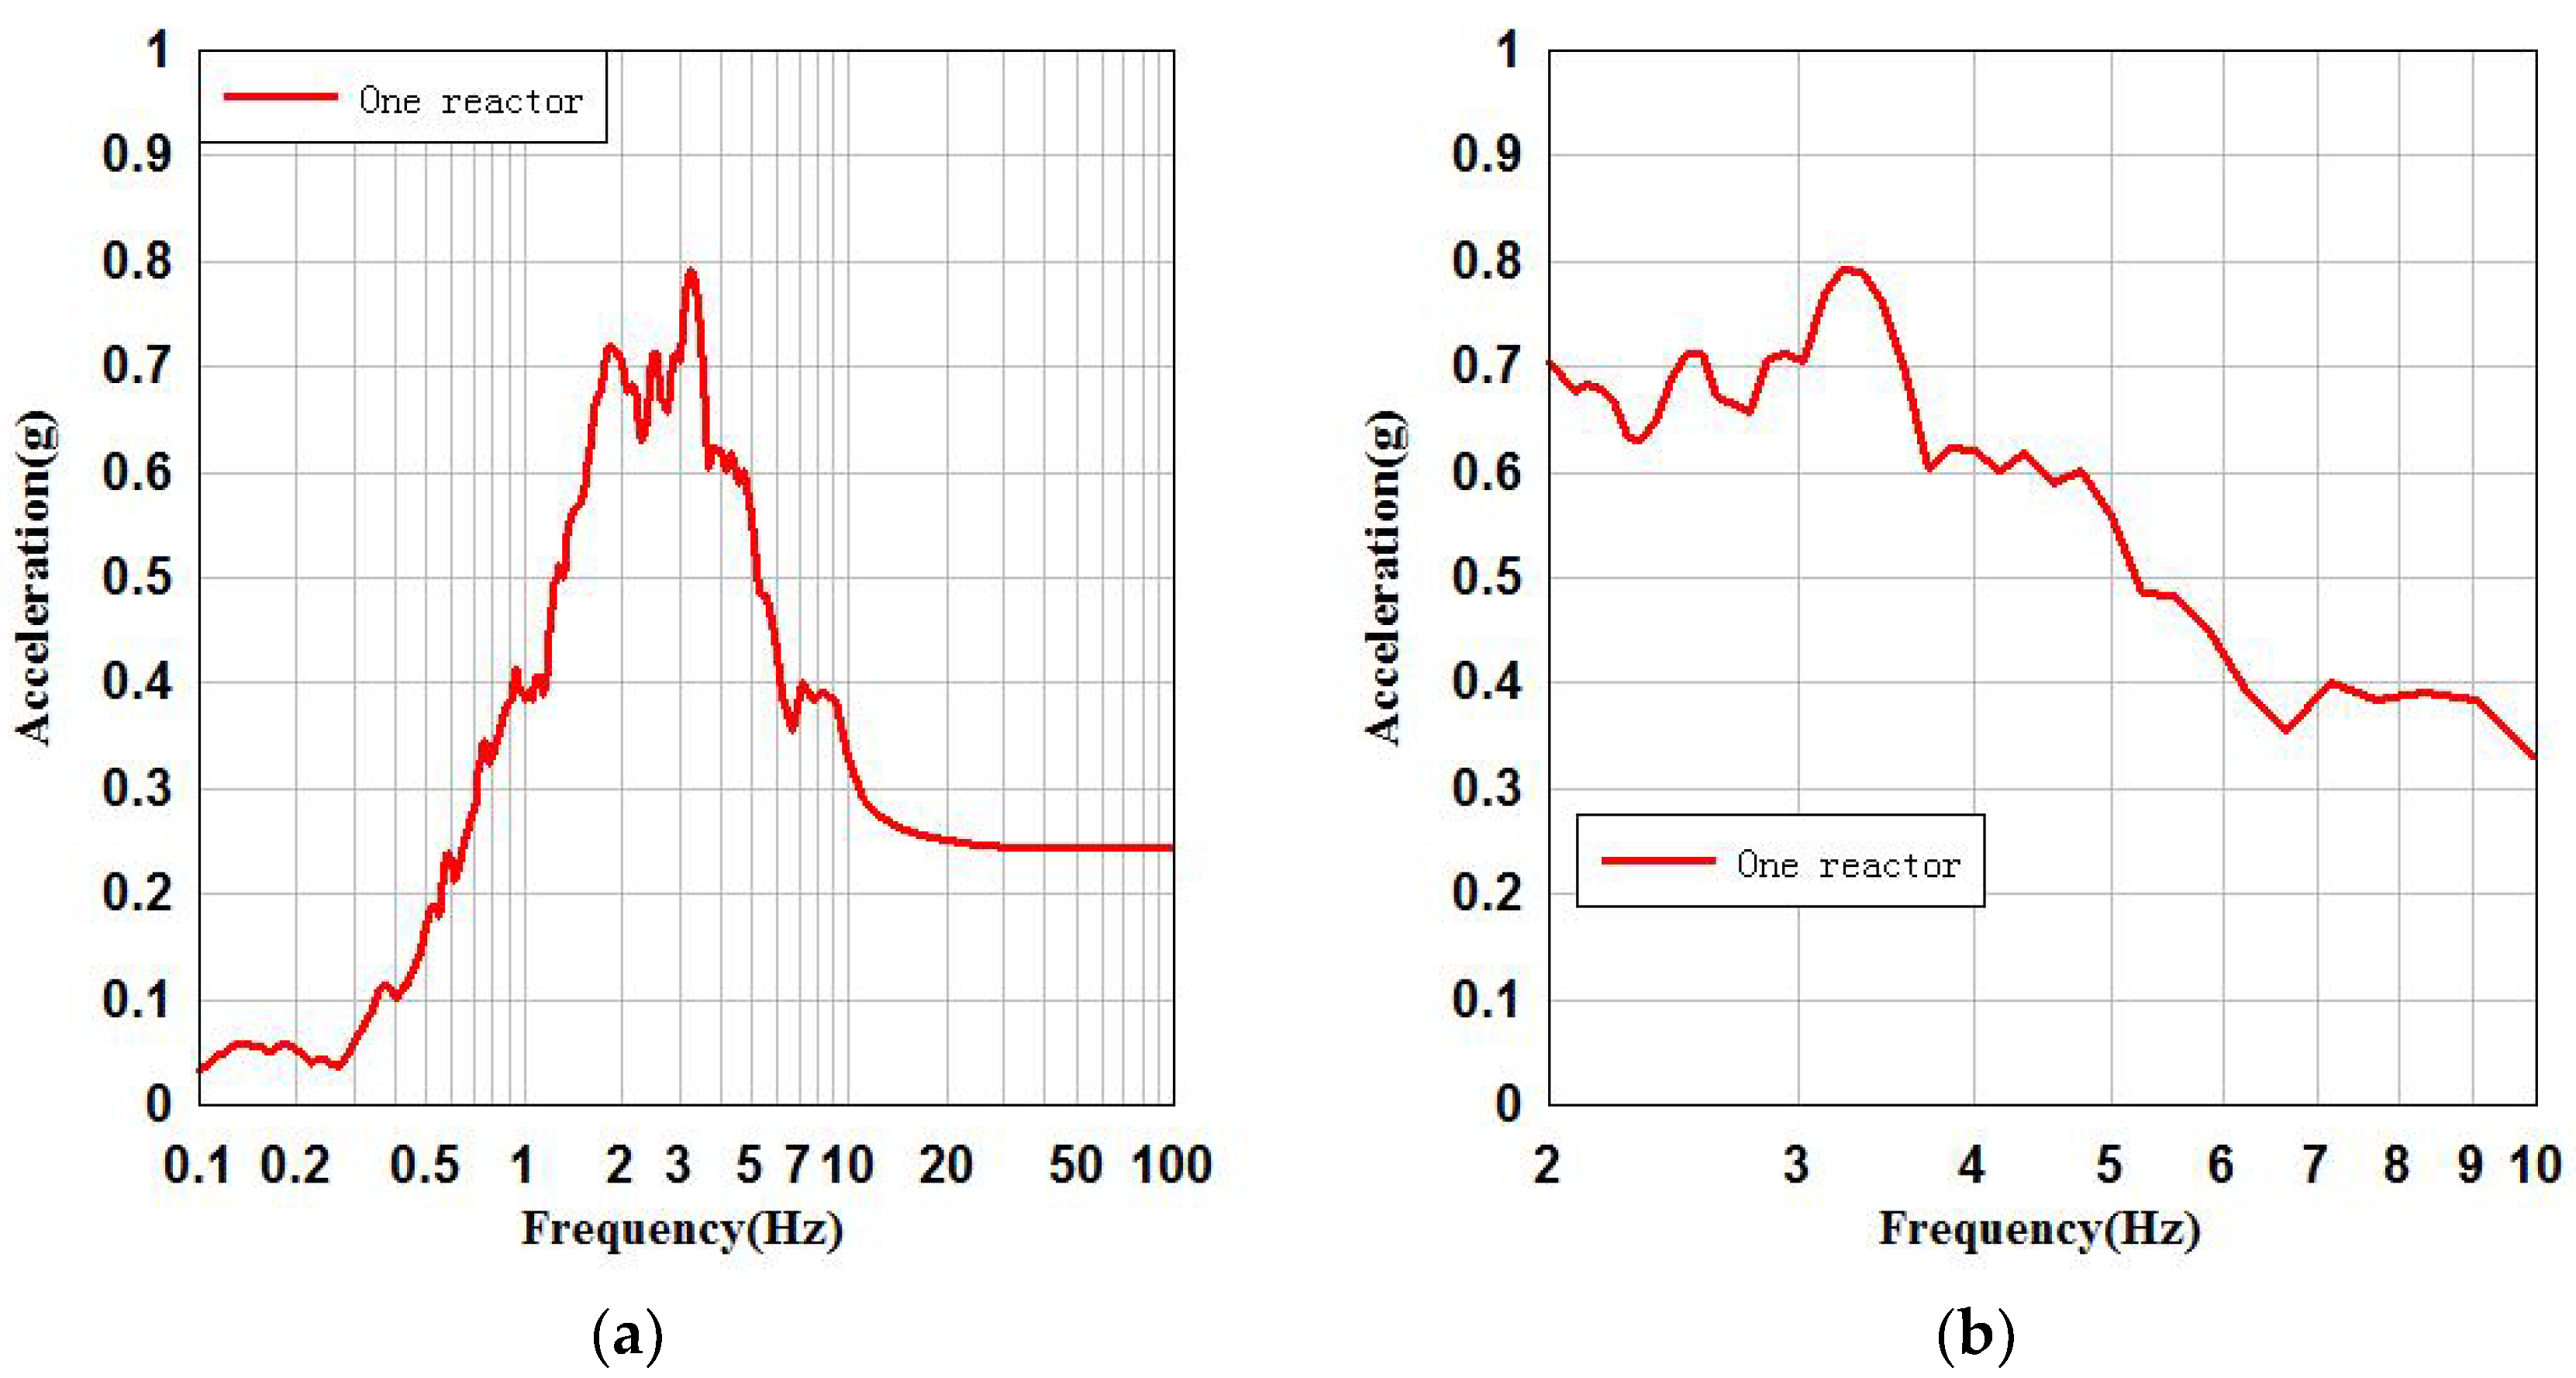
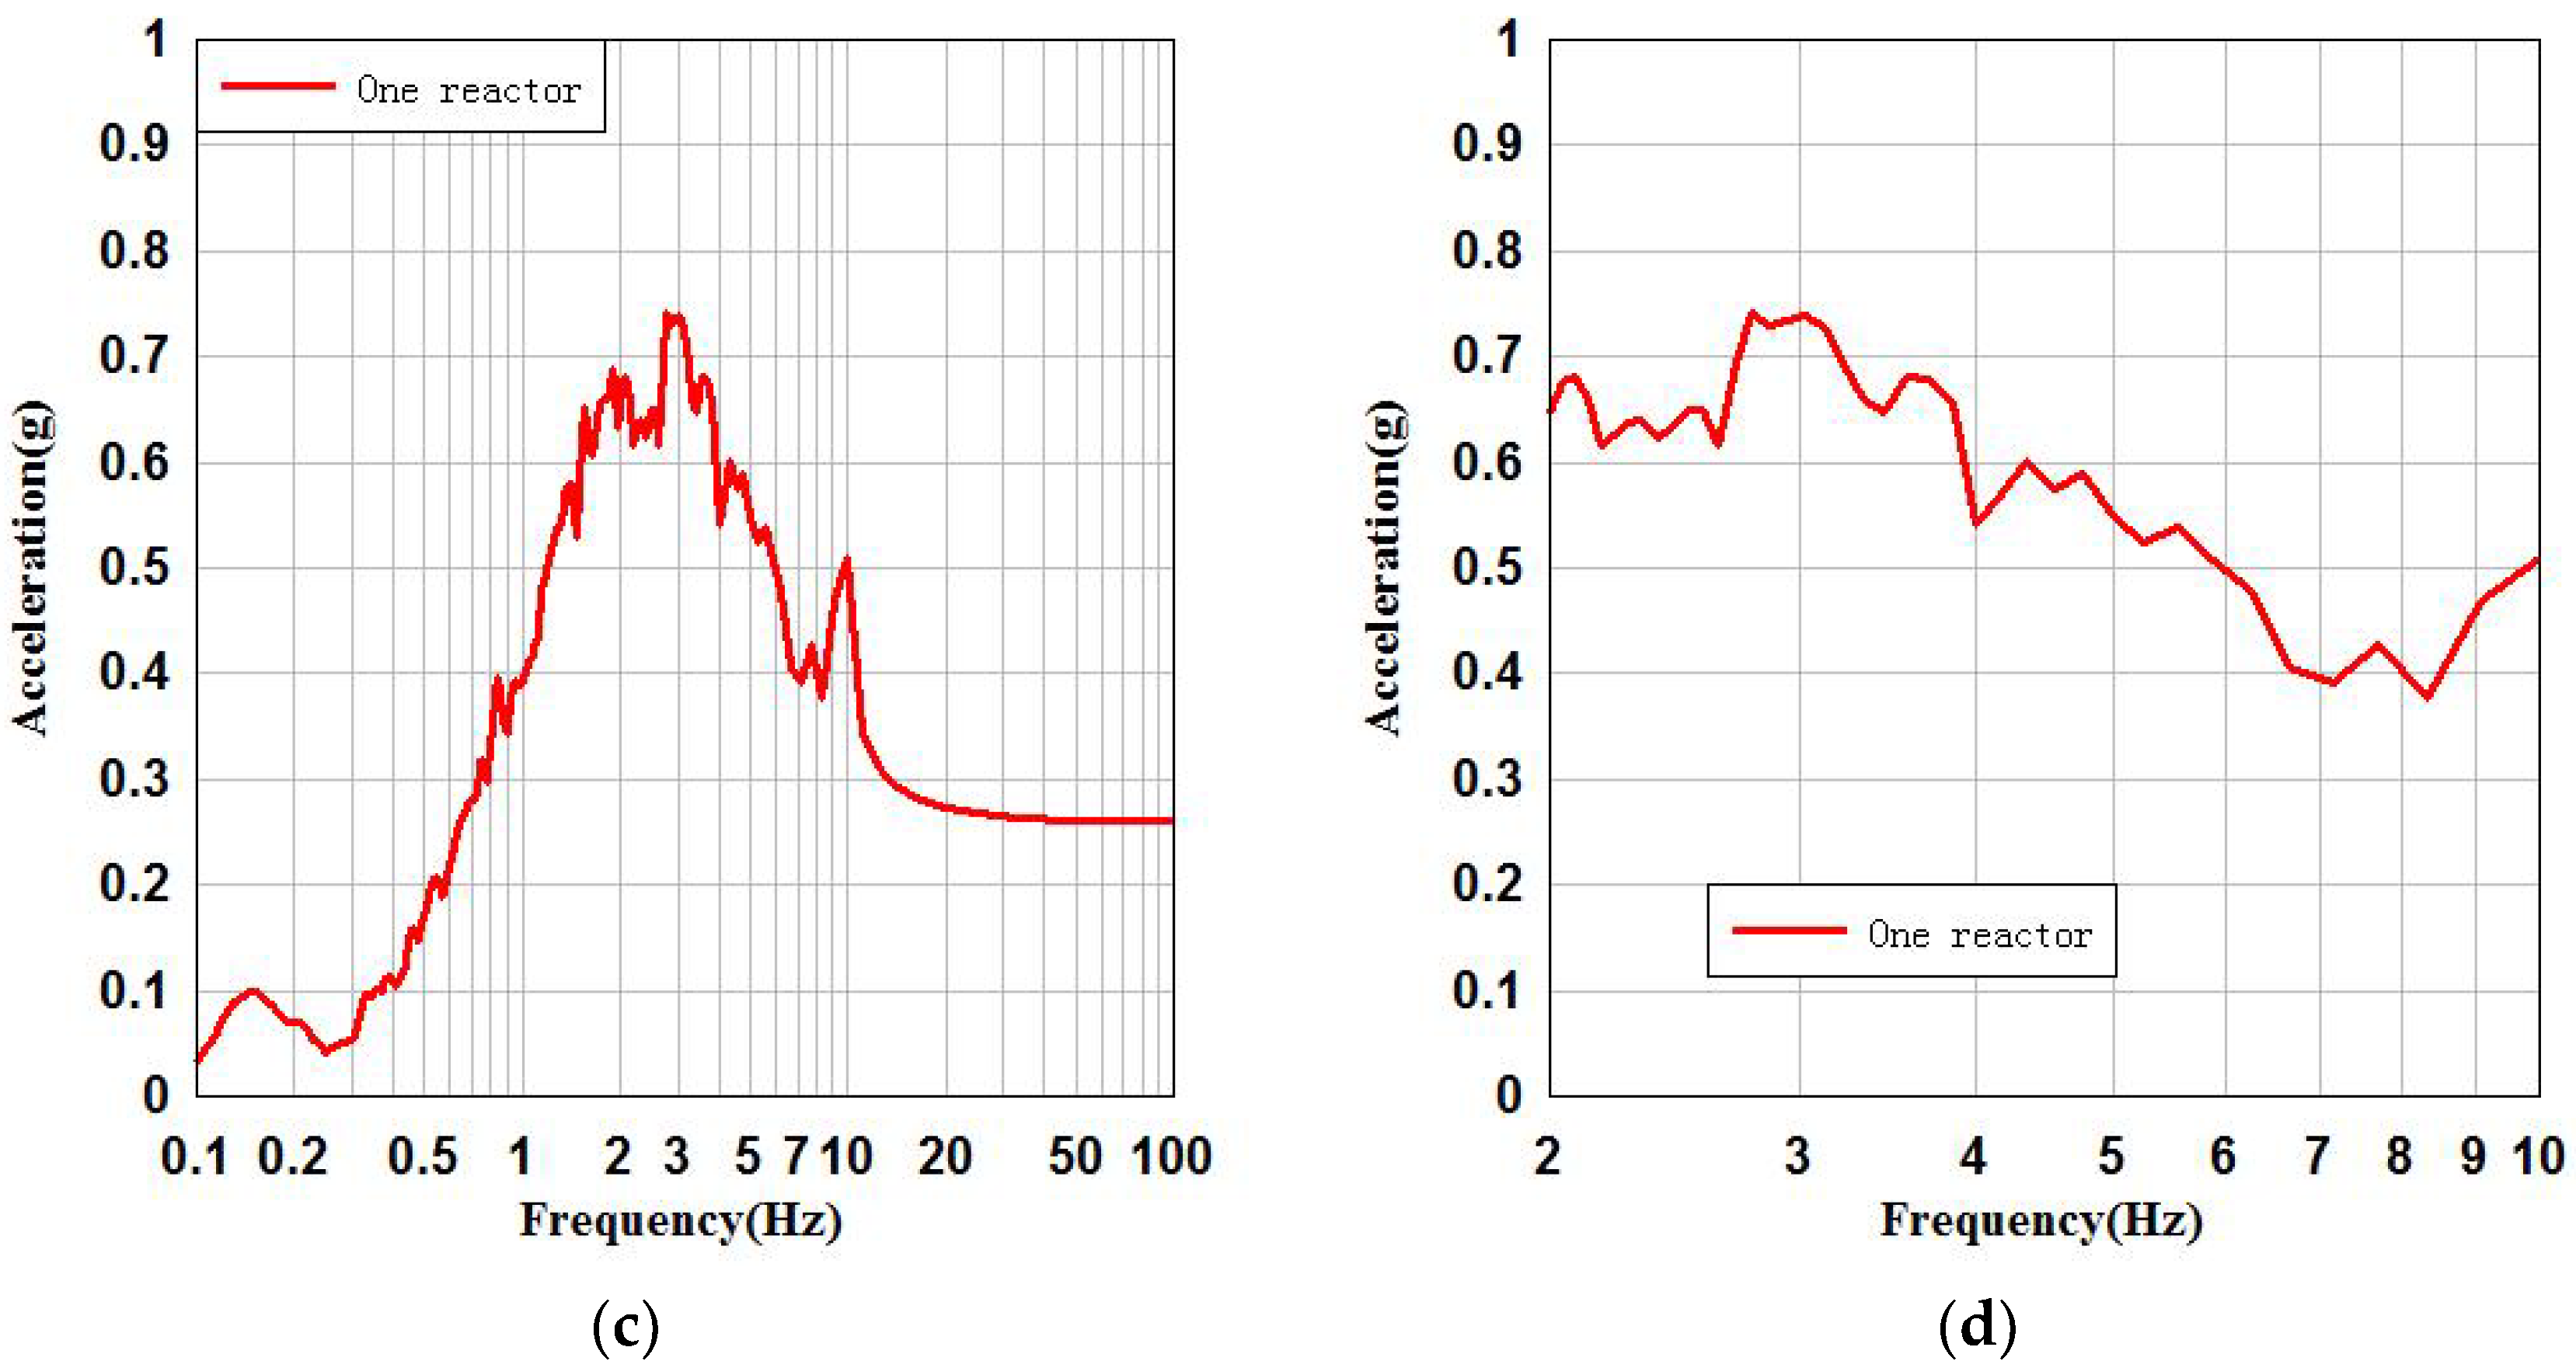
The reference point of the raft foundation is taken to calculate the acceleration response and floor response spectrum (FRS). At the same time, in order to make the analysis more targeted, the frequency bands (2–10 Hz) that have a great impact on the structural, system, and components (SSCs) of the NPPs [19] are extracted for comparative analysis. The seismic response of the raft foundation reference point shown in Figure 5a–d are, respectively, the FRS of raft foundation floors in x and y directions, and the FRS of the raft foundation (2–10 Hz).

3.2. Seismic Parameter Analysis of SSSI System Raft Foundation

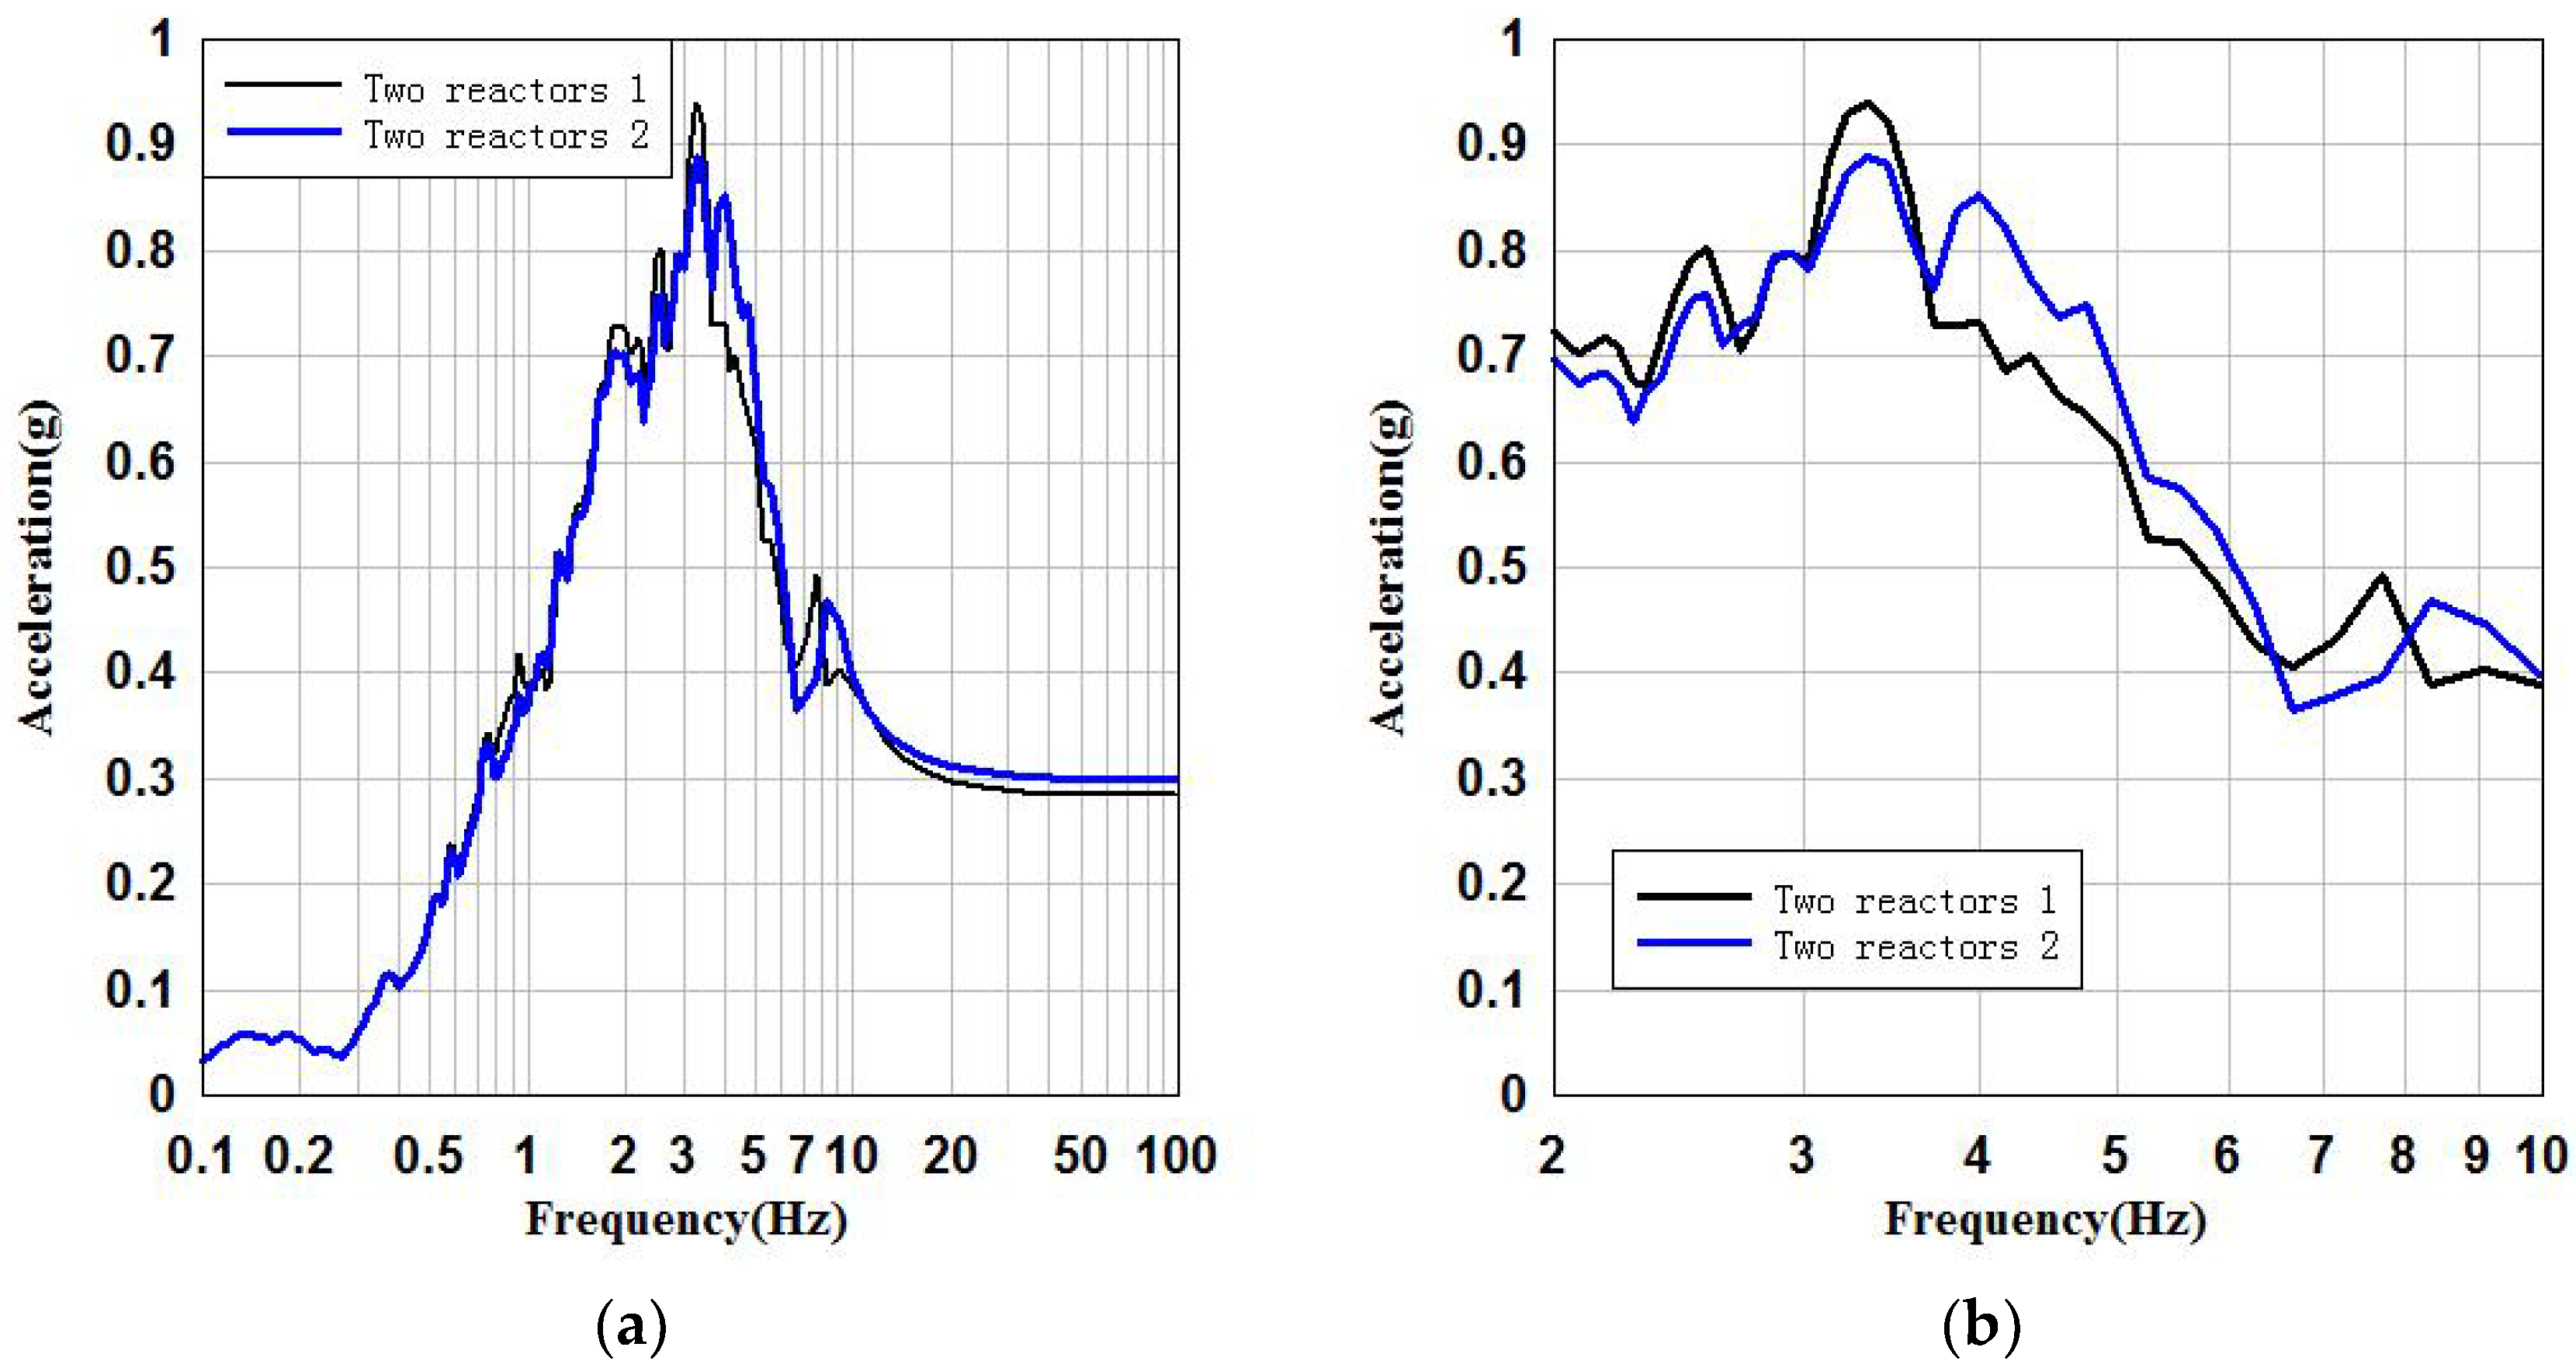
Calculate the acceleration response and floor response spectrum (FRS) at the same reference point of the raft foundation. The seismic response of the reference point of the raft foundation shown in Figure 6a–d are, respectively, the FRS of the raft foundation floors in x and y directions, and the FRS of the raft foundation (2–10 Hz).

3.3. Comparison and Analysis of Two Reactors at the Same Site

This section compares the peak acceleration and FRS of the reference point on the raft foundation of two reactors located at one site (i.e., as shown in Figure 2). It is found that the peak acceleration of two reactors in x and y directions differ by 0.02 g and 0.02 g, respectively; the peak acceleration ( A ), raft foundation position, and reduction rate of A δ are shown in Table 3. The peak accelerations of the FRS in x and y directions differ by 0.05 g and 0.06 g, respectively, and peak acceleration of the FRS ( S ), the raft foundation position, and reduction rate of S δ under two conditions are shown in Table 4 and Table 5. It can be said that under the same site conditions, the difference of the ground motion parameters of two reactors’ raft foundation is very small. The variables that are used in this paper are given in Table 6.
A δ = A max A min A min
S δ = S max S min S min

3.4. Comparison of Raft Foundation Ground Motion Parameters between SSI System and SSSI System

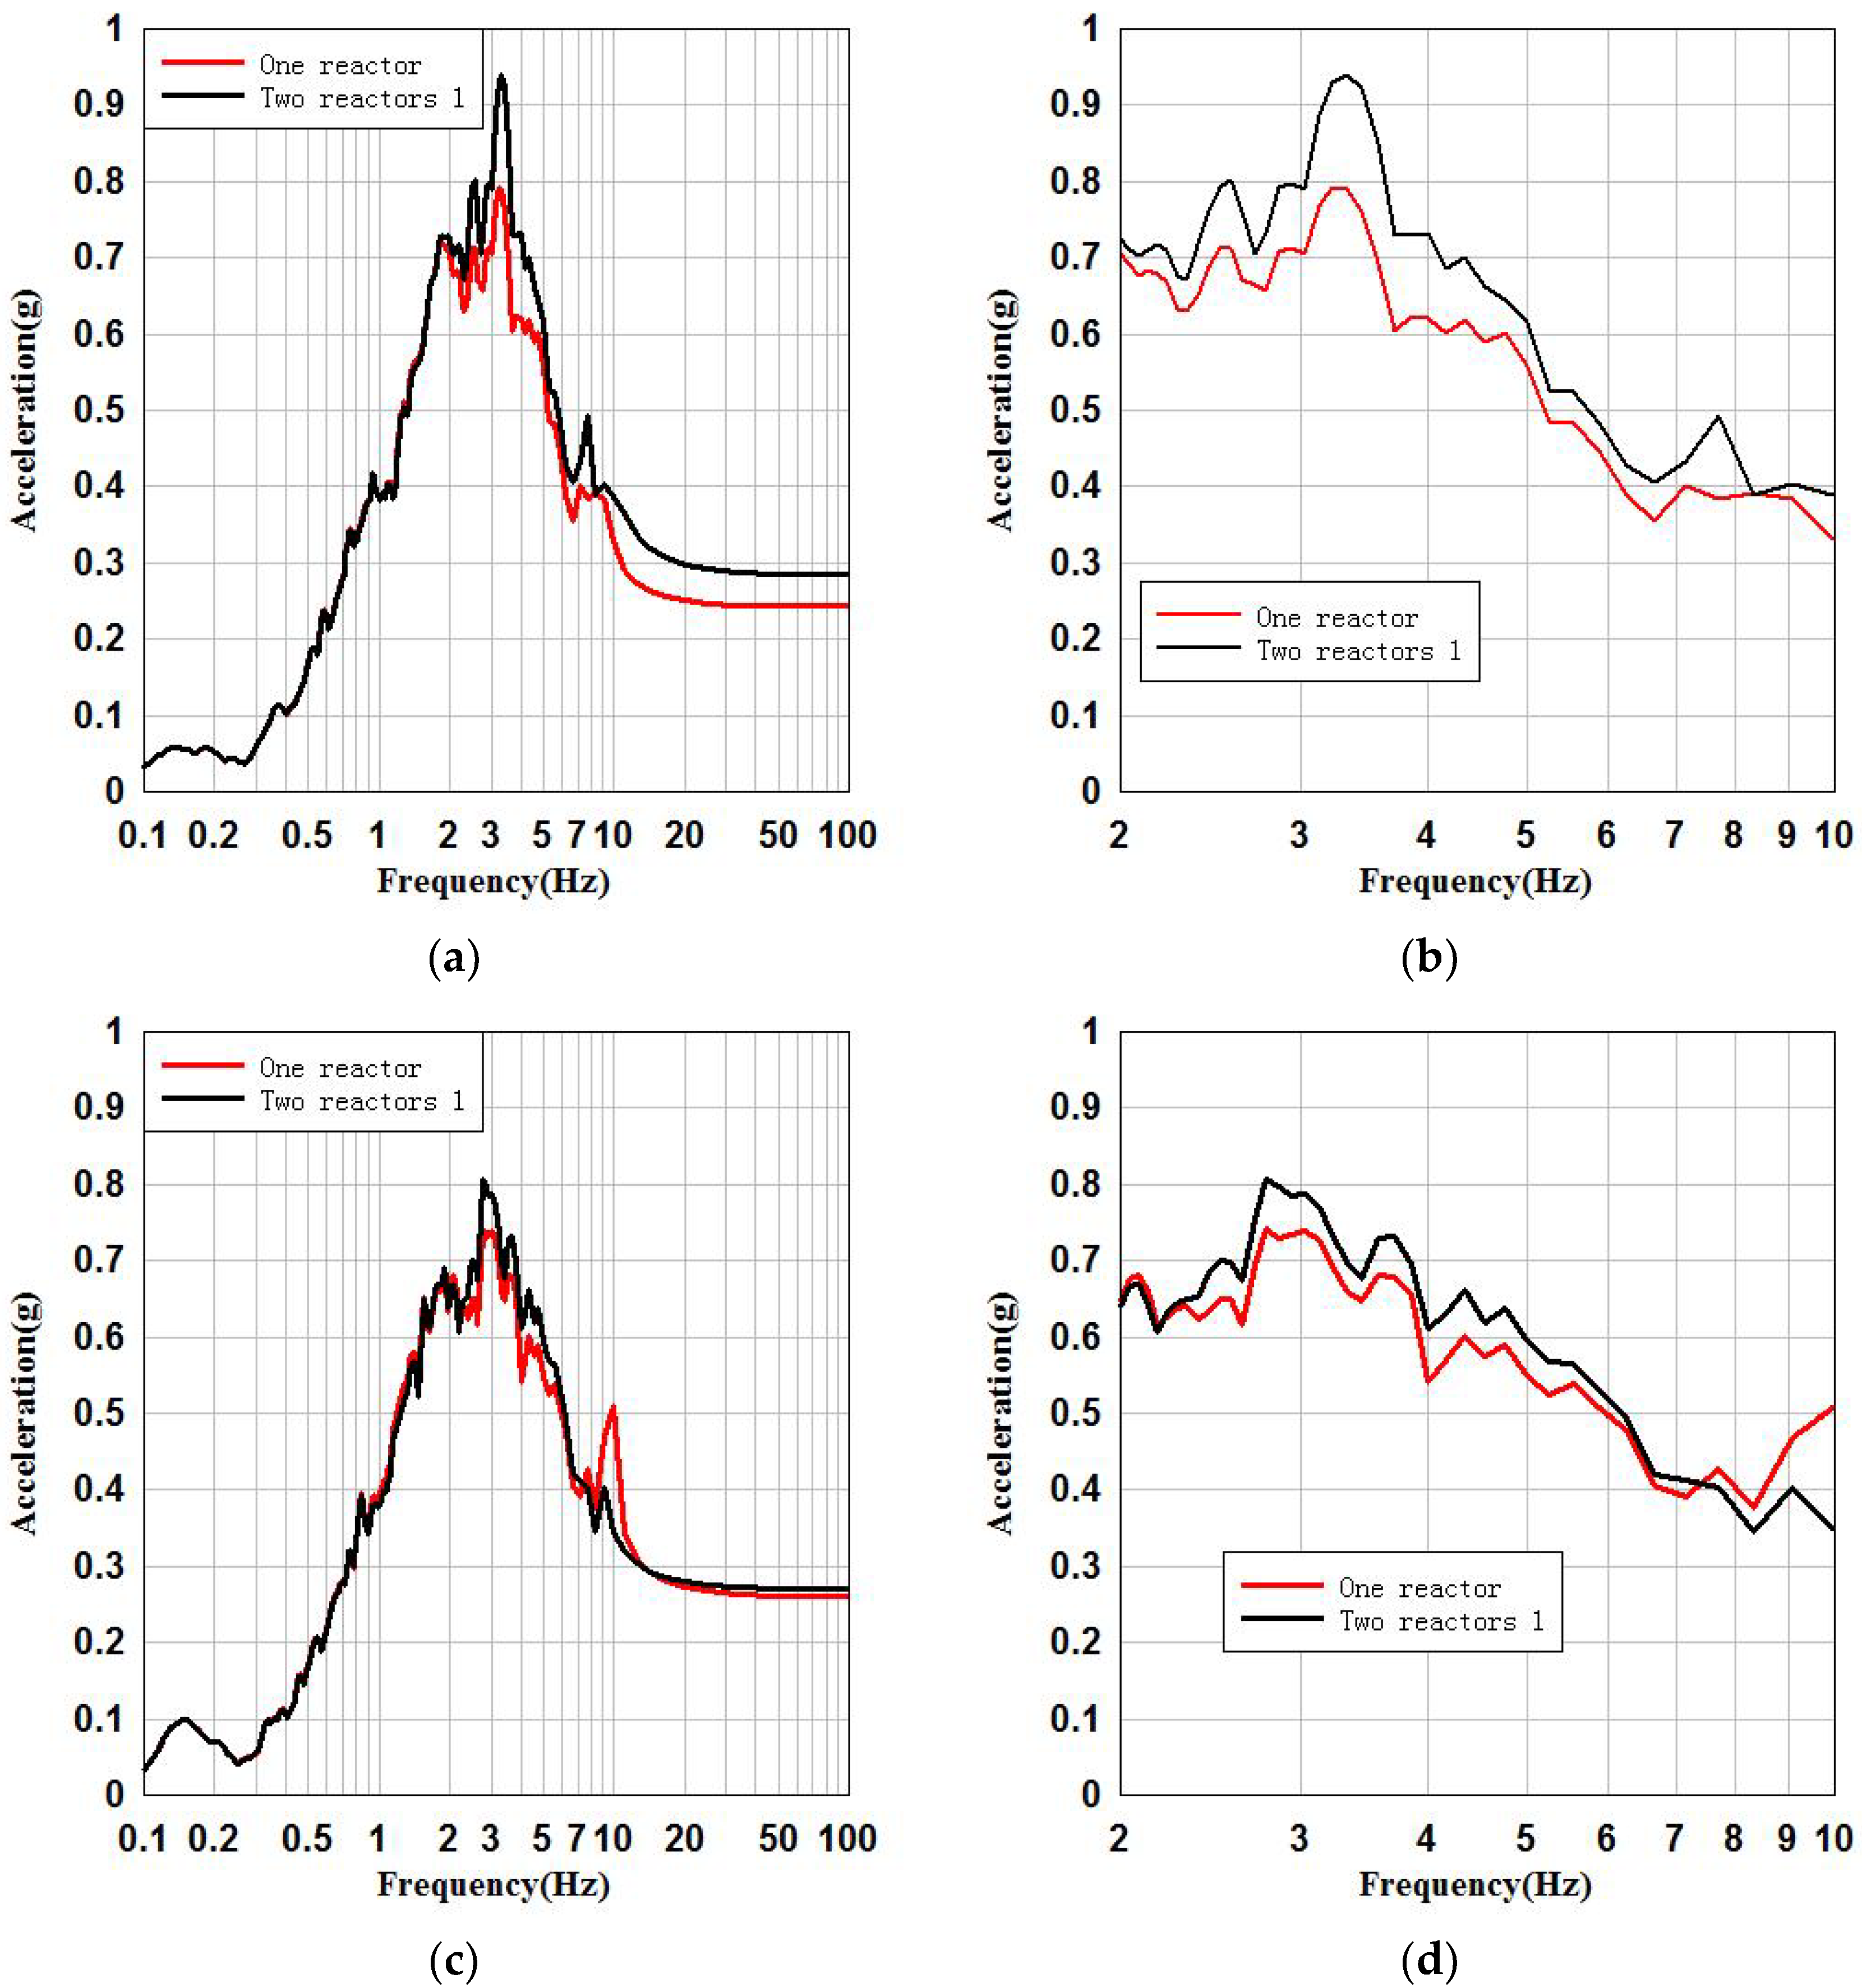
This section compares the ground motion parameters at the same reference point of raft foundation of SSI system and SSSI system (i.e., as shown in Figure 1 and Figure 2). The comparison of FRS at x and y directions of raft foundation reference points of SSI system and SSSI system is shown in Figure 7 below. By comparison, it is found that the peak accelerations of SSI system and SSSI system differ by 0.04 g and 0.01 g, respectively, in x and y directions, as shown in Table 7. The peak accelerations of the FRS in x and y directions differ by 19% and 18%, respectively, as shown in Table 8 and Table 9. It can be said that the FRS of the raft foundation reference points of the SSI system and SSSI system are different to some extent. It can also be found from Figure 6 that the FRS of the raft foundation of SSI system and SSSI system are basically consistent in the low frequency band (below 2 Hz), and have certain differences in the main frequency band (2–5 Hz).

4. Analysis of Seismic Parameters of the Key Floor

4.1. Seismic Parameter Analysis of the Key Floor of SSI System

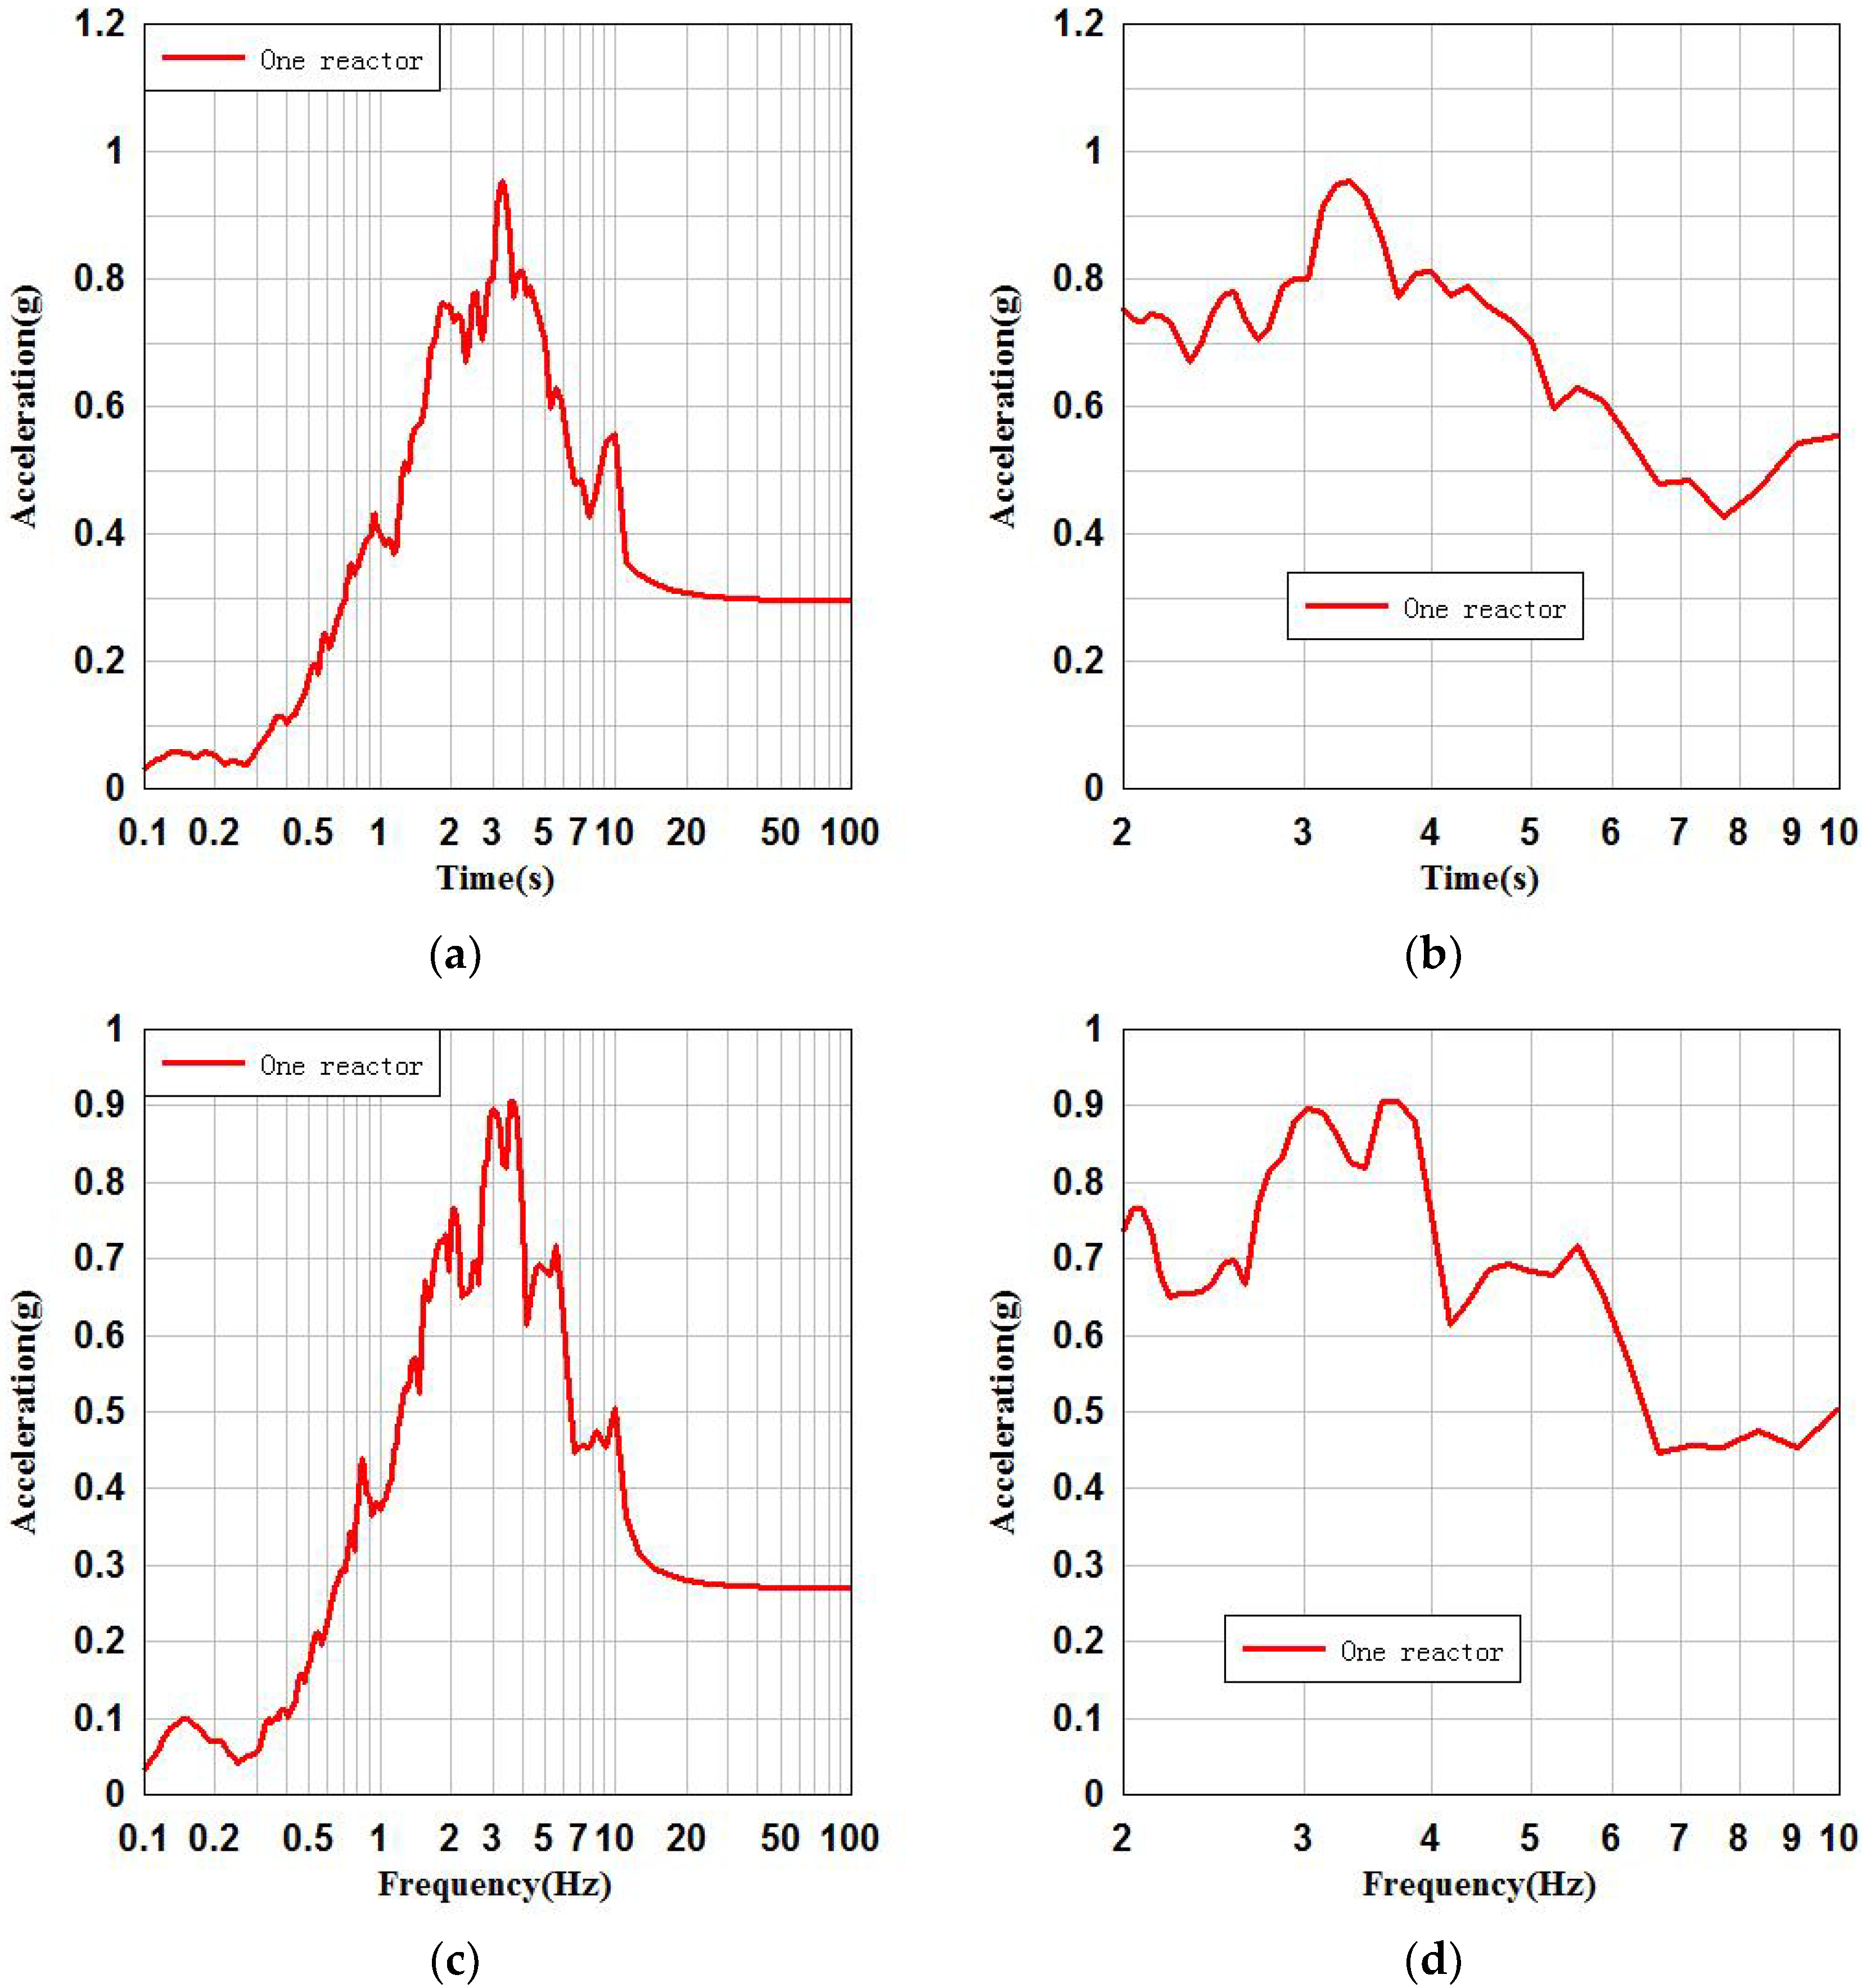
The FRS of the key floor reference point at 12.65 m of the NPP structure are calculated. The seismic response of the key floor reference point as shown in Figure 8a–d are, respectively, the FRS of the raft foundation in x and y directions, and the FRS of raft foundation (2–10 Hz).

4.2. Seismic Parameter Analysis of the Key Floor of SSI System

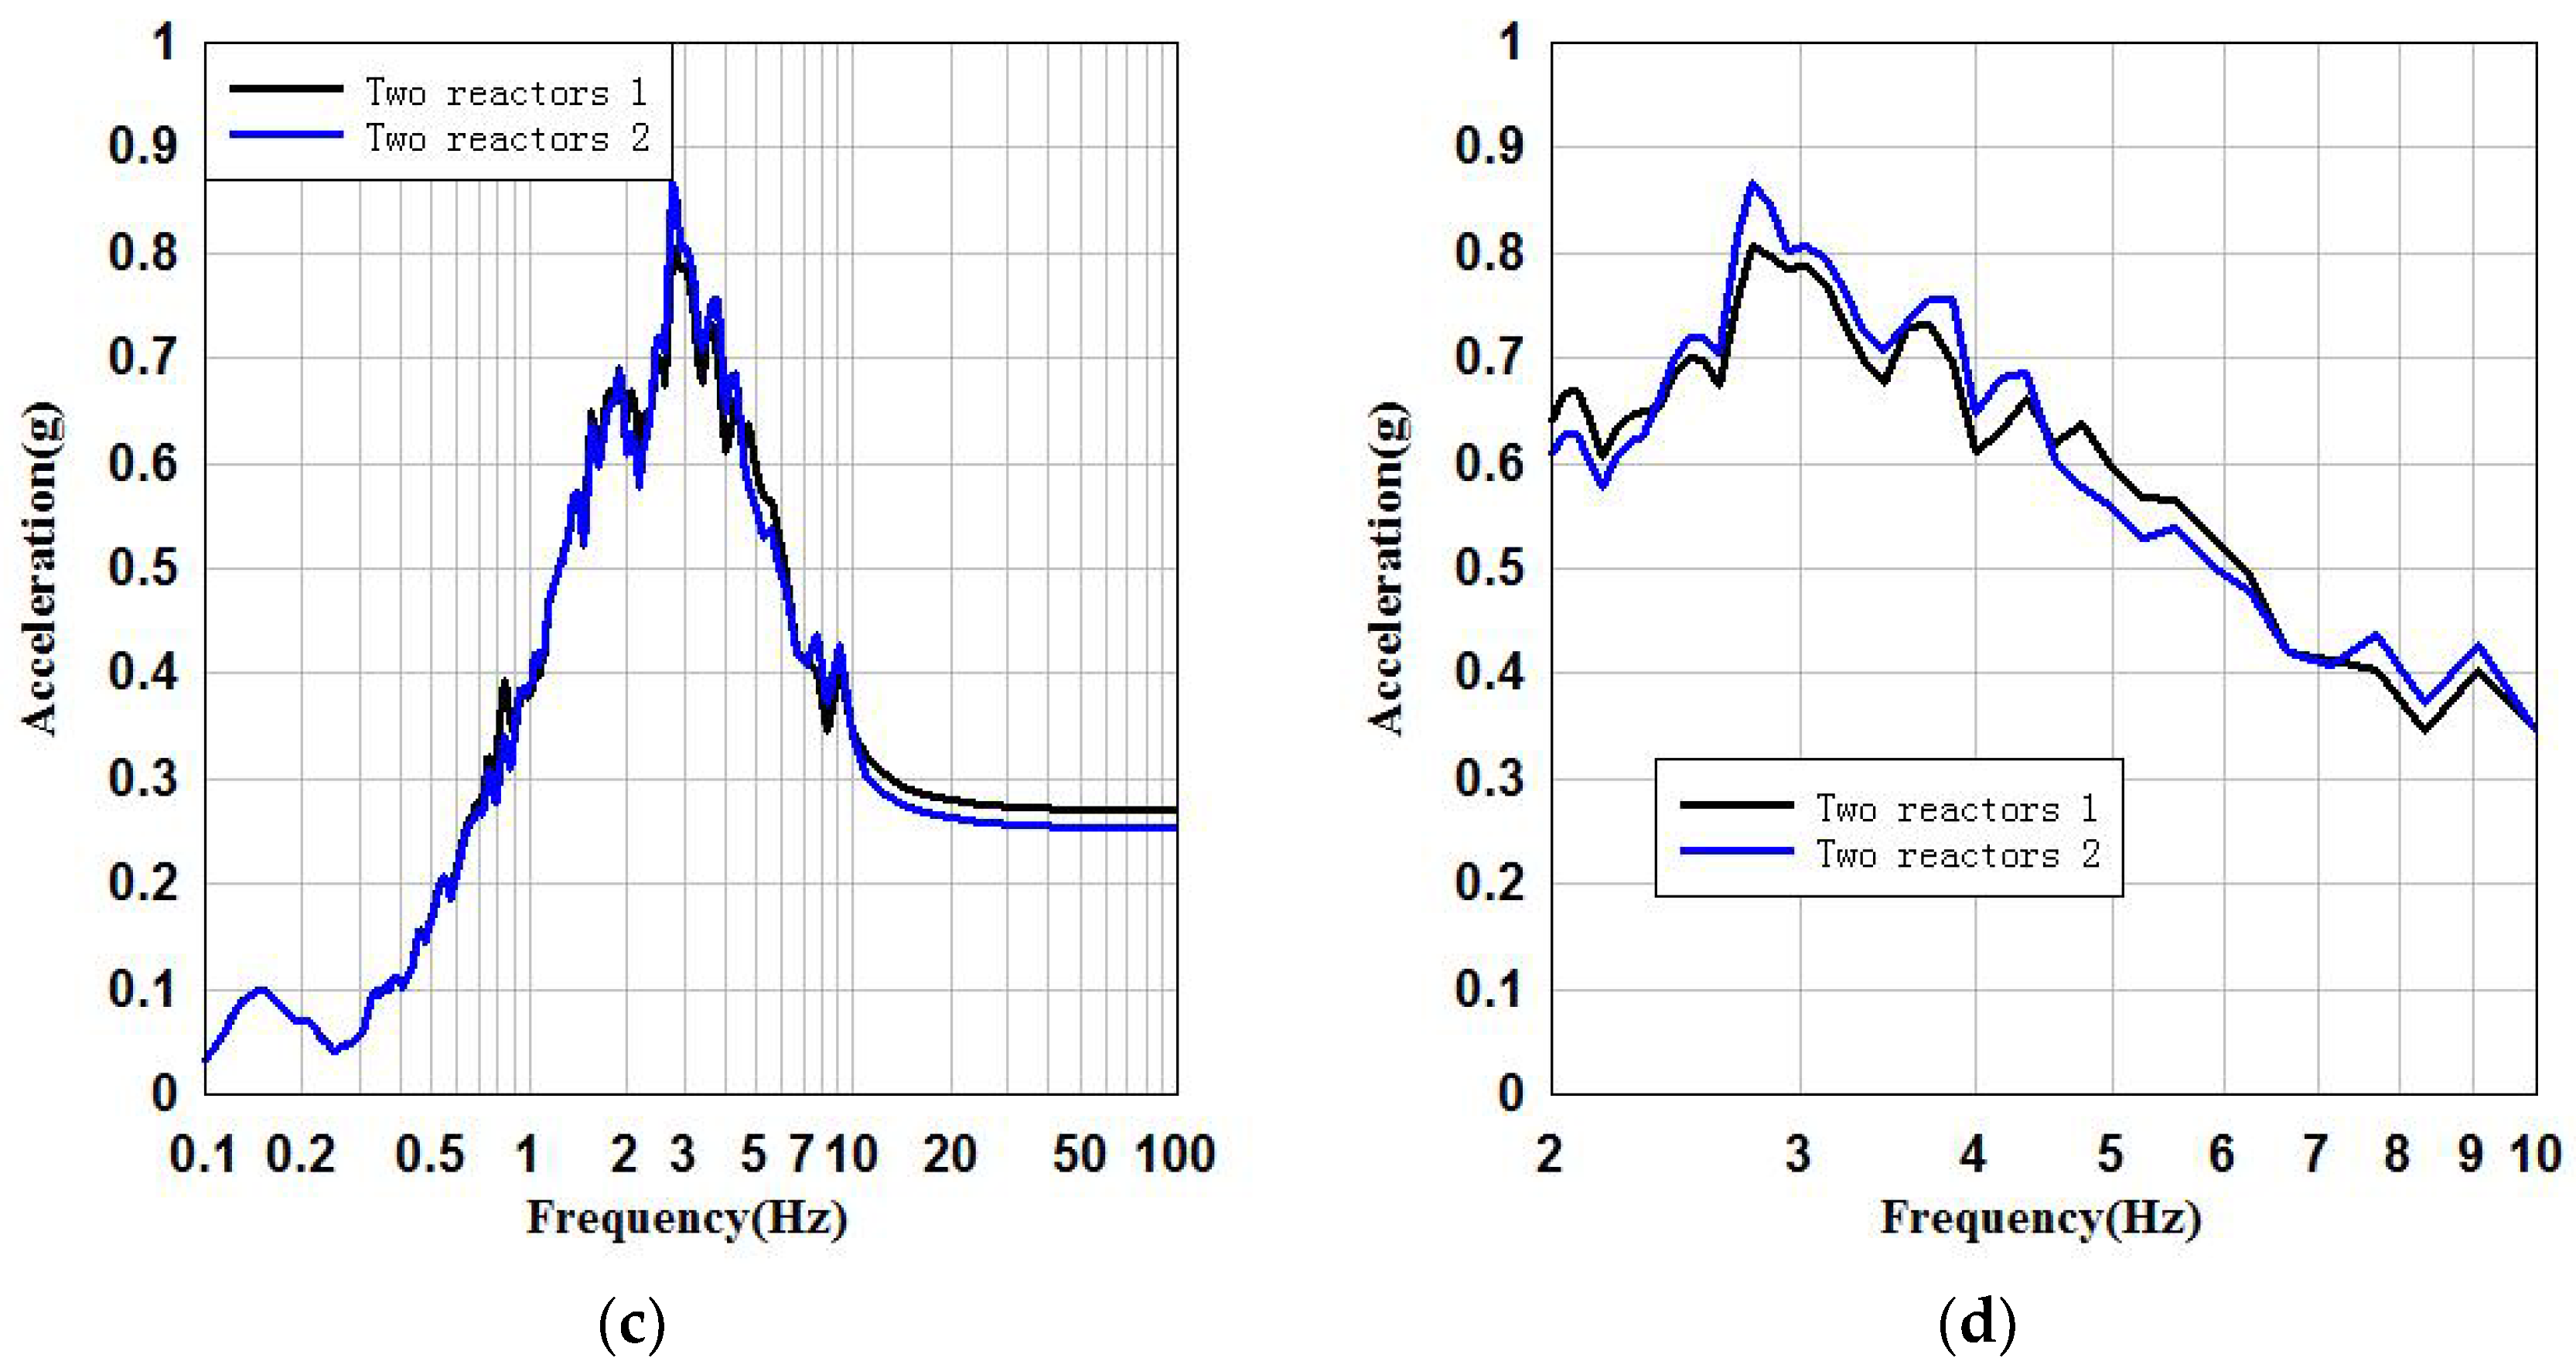
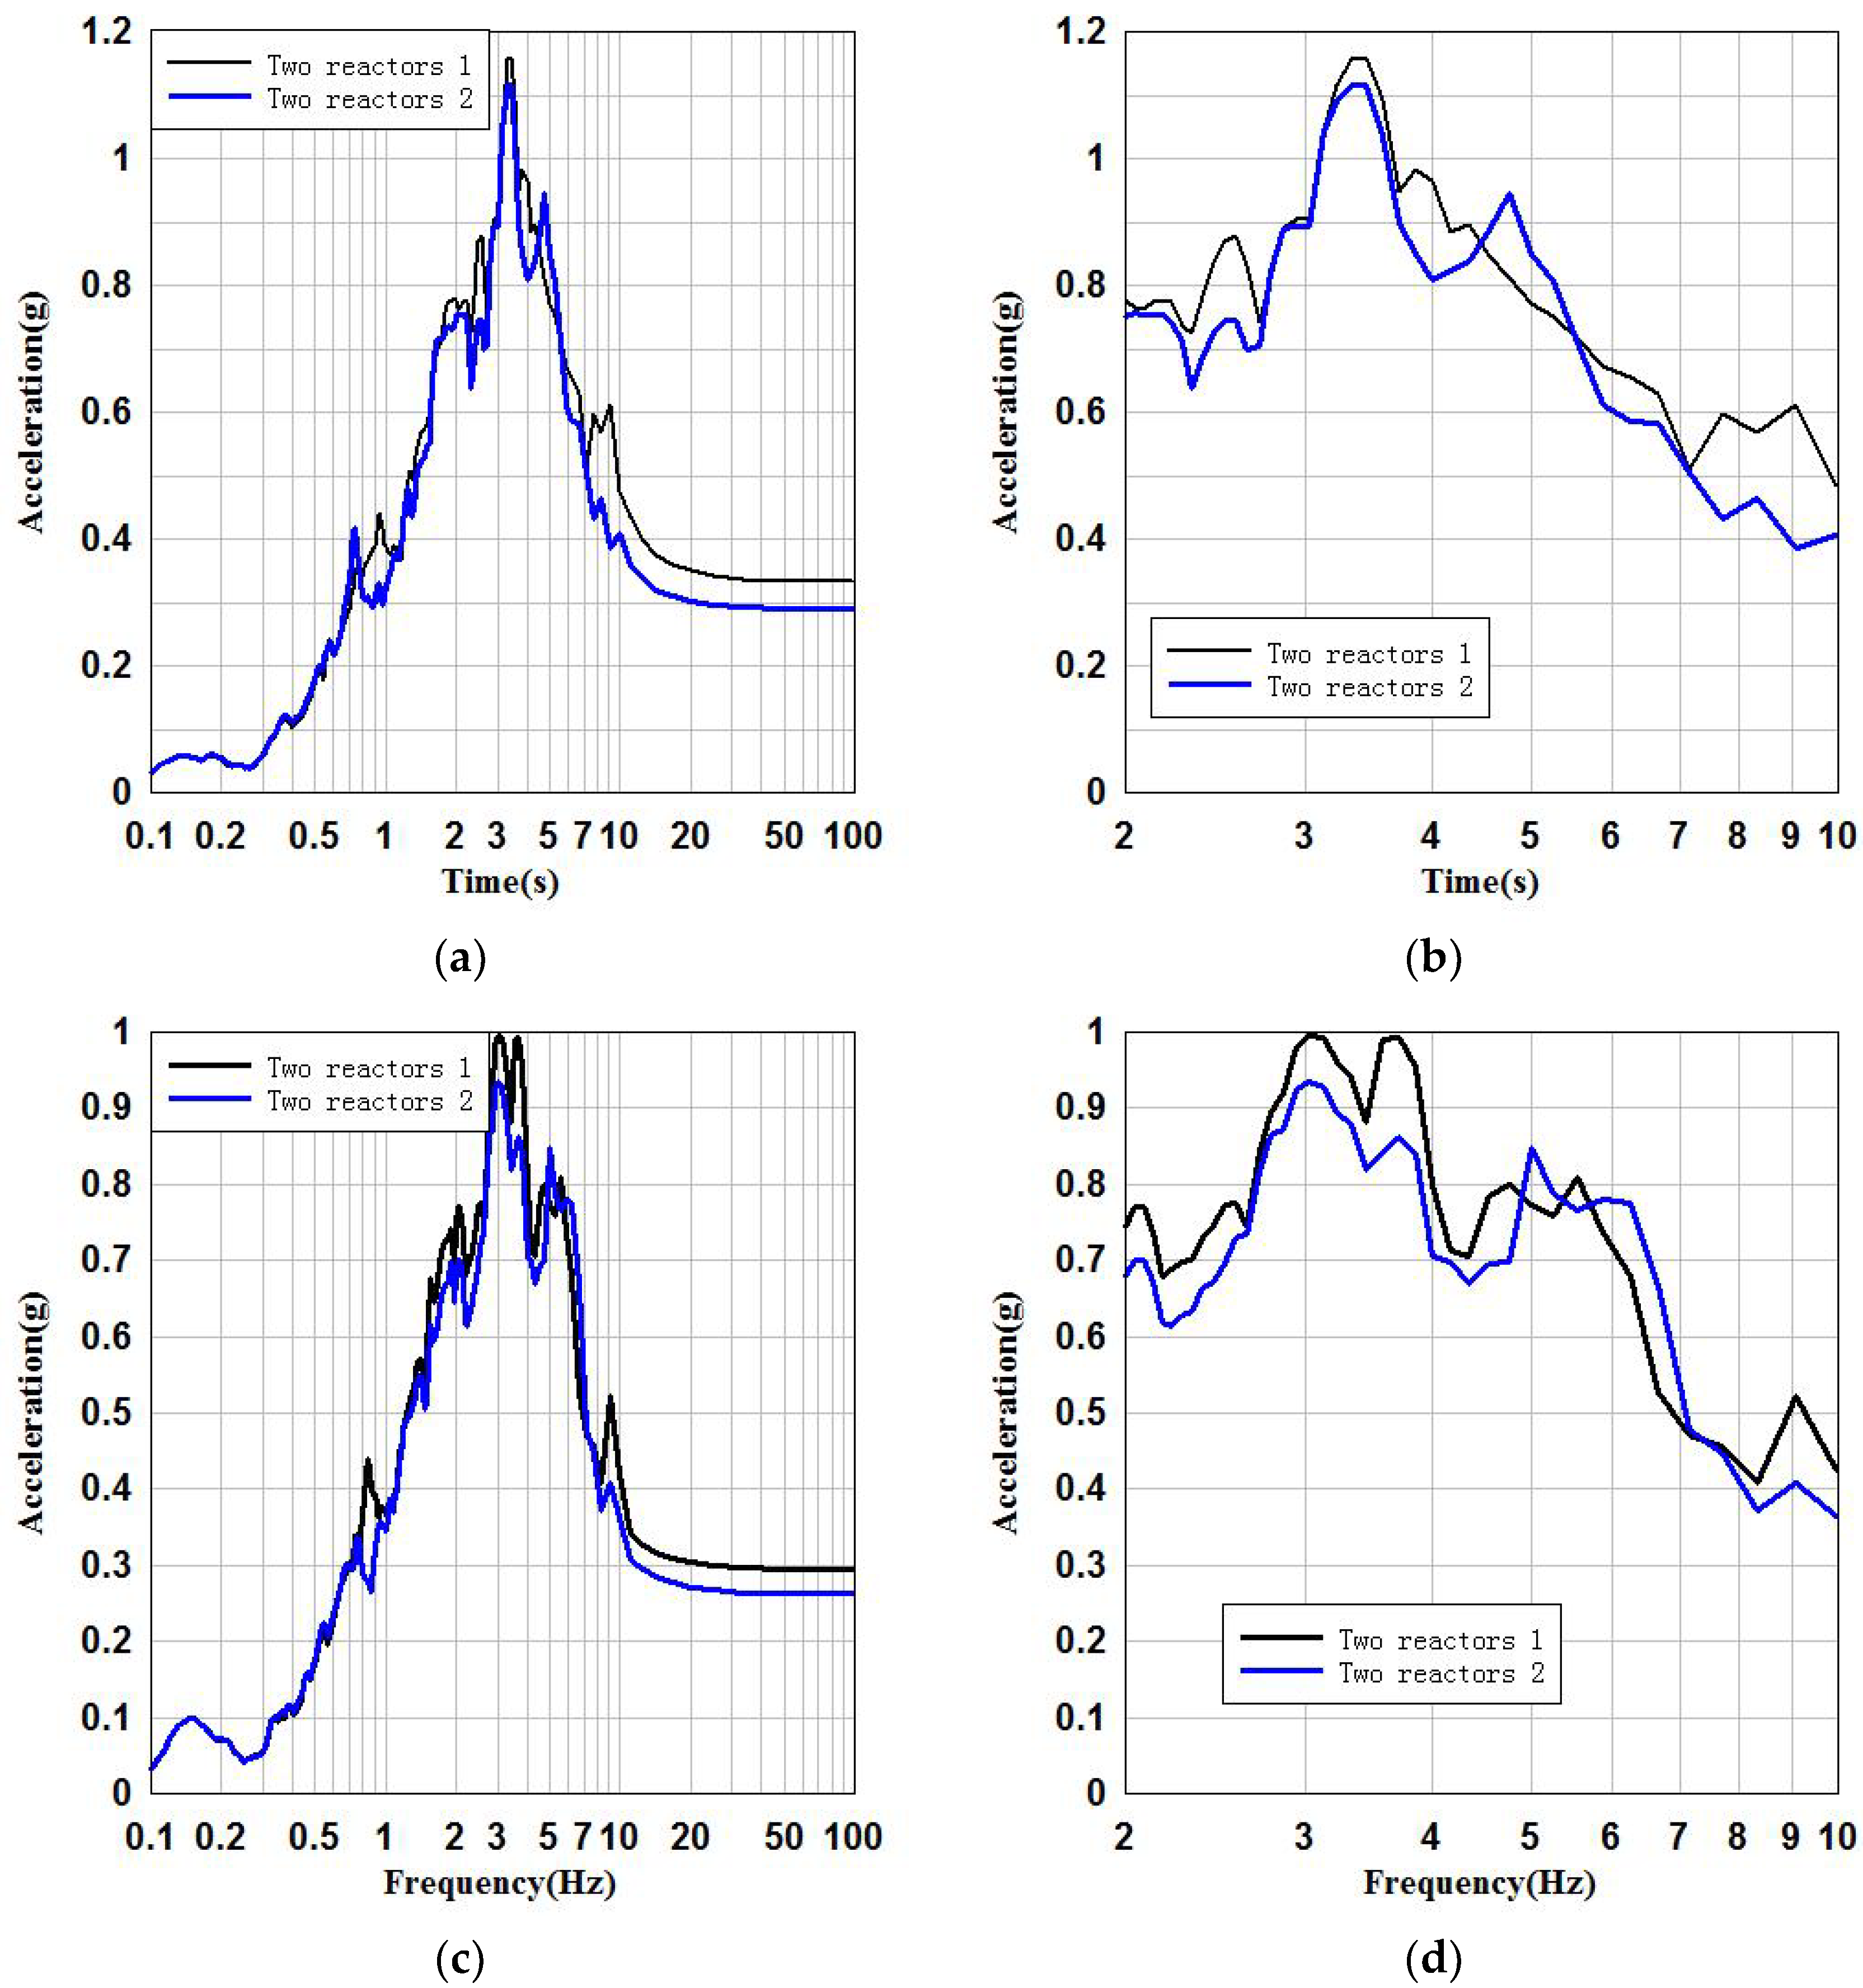
The FRS are calculated from the reference points at the same position on the key floors of the NPP structure. The seismic response of the reference points of the key floors shown in Figure 9a–d are the FRS of key floors in x and y directions, respectively, and the FRS of the key floors (2–10 Hz).

4.3. Seismic Parameter Analysis of the Key Floor of SSI System

This section compares the peak acceleration and FRS of the reference point on the key floor of two reactors located at one site (i.e., as shown in Figure 2). It is found that the difference between the peak acceleration of the two reactors in x and y directions is 0.04 g and 0.03 g, respectively, as shown in Table 10. The peak accelerations of the FRS in x and y directions differ by 0.04 g and 0.06 g, respectively, as shown in Table 11 and Table 12. It can be said that the ground motion parameters of the key floors of the SSSI system have little difference under the same site conditions. In addition, the FRS of the two floors are very similar.

4.4. Comparison of Ground Motion Parameters of Key Floors between SSI System and SSSI System

In this section, the comparison of ground motion parameters at the same reference point of the key floor of the NPP structure between the SSI system and the SSSI system (see Figure 1 and Figure 2) is conducted. The comparison of the FRS of the key floor reference points of the SSI system and the SSSI system in x and y directions is shown in Figure 9 below. At the same time, by comparison, it is found that the peak accelerations of SSI system and SSSI system differ by 0.04 g and 0.02 g, respectively, in x and y directions, as shown in Table 13. The peak accelerations of the FRS in x and y directions differ by 22% and 10%, respectively, as shown in Table 14. It can be said that there is a certain difference between the FRS of the key floor reference points of the SSI system and the SSSI system. It can also be found from Figure 10 that the FRS of the key floors of the SSI system and the SSSI system are basically consistent in the low frequency band (below 2 Hz), and have certain differences in the main frequency band (2–6 Hz).

5. Conclusions

In order to analyze the influence of SSSI effect on the structure of NPPs ASTS, this paper conducted a comparative analysis considering SSI and SSSI, which can be concluded as follows:
(1)
By comparing the SSI system with the SSSI system for the raft foundation, the peak accelerations of the SSI system and the SSSI system in x and y directions differ by 0.04 g and 0.01 g, respectively. The peak accelerations of the FRS in x and y directions differ by 19% and 18%, respectively. It can be said that the difference between the peak accelerations of the raft foundation reference point of the SSI system and the SSSI system is very small, but the peak values of the FRS are somewhat different. The FRS of raft foundation of SSI system and SSSI system are basically consistent in the low frequency band (below 2 Hz), and have certain differences in the main frequency band (2–10 Hz).
(2)
By comparing the SSI system with the SSSI system for the key floor of the NPP structure, the difference between the peak acceleration of the SSI system and the SSSI system in x and y directions is 0.04 g and 0.02 g, respectively. The peak accelerations of the FRS in x and y directions differ by 22% and 10%, respectively. It can be said that the FRS of the key floor reference points of the NPP structure of the SSI system and the SSSI system are different. The FRS of the key floors of the SSI system and SSSI system are basically consistent in the low frequency band (below 2 Hz), and have certain differences in the main frequency band (2–10 Hz).
(3)
Generally, SSSI effect can be ignored for bedrock sites, but for non-bedrock sites, especially those with soft soil site, the influence of SSSI effect shall be considered in the layout position of seismic instruments used for ASTS and the setting of shutdown threshold. SSSI effect shall be reasonably considered according to site conditions during structural analysis for the NPPs ASTS.

Author Contributions

Conceptualization, L.L.; data curation, Q.C.; supervision, R.P. All authors have read and agreed to the published version of the manuscript.

Funding

This research was funded by the National Key Research and Development Program of “Aging Degradation Behavior and Prediction Model of Important Structures and Equipment Materials of In-Service Nuclear Power Plants” (No. 2019YFB1900900). This financial support is gratefully acknowledged.

Data Availability Statement

Not applicable.

Acknowledgments

This paper was prepared to document work performed by the Nuclear and Radiation Safety Center, Ministry of Environmental Protection (NSC). This paper is an independent product and does not reflect the views or regulatory positions of the NSC.

Conflicts of Interest

The authors declare no conflict of interest.

References

  1. Elkhoraibi, T.; Hashemi, A.; Ostadan, F. Probabilistic and deterministic soil structure interaction analysis including ground motion incoherency effects. Nucl. Eng. Des. 2014, 269, 250–255. [Google Scholar] [CrossRef]
  2. Farahani, R.V.; Dessalegn, T.M.; Vaidya, N.R.; Bazan-Zurita, E. Seismic soil–structure interaction analysis of a nuclear power plant building founded on soil and in degraded concrete stiffness condition. Nucl. Eng. Des. 2016, 297, 320–326. [Google Scholar] [CrossRef]
  3. Politopoulos, I.; Sergis, I.; Wang, F. Floor response spectra of a partially embedded seismically isolated nuclear plant. Soil Dyn. Earthq. Eng. 2015, 78, 213–217. [Google Scholar] [CrossRef]
  4. Luco, J.E.; Contesse, L. Dynamic structure-soil-structure interaction. Bull. Seismol. Soc. Am. 1973, 63, 1289–1303. [Google Scholar] [CrossRef]
  5. Wong, H.L.; Luco, J.E. Dynamic interaction between rigid foundations in a layered half-space. Soil Dyn. Earthq. Eng. 1986, 5, 149–158. [Google Scholar] [CrossRef]
  6. Wong, H.L.; Luco, J.E. Dynamic structure-to-structure interaction for closely spaced buildings. In Proceedings of the 3rd US National Conference on Earthquake Engineering, Charleston, SC, USA, 24–28 August 1986. [Google Scholar]
  7. Ostadan, F.; Tseng, W.S.; Liu, A.S. Effect of site soil properties on seismic SSI response of embedded structures. In Proceedings of the ASCE Foundation Engineering Congress, Reston, VA, USA, June 1989. [Google Scholar]
  8. Kitada, Y.; Hirotani, T.; Iguchi, M. Model test on dynamic structure-structure interaction of nuclear power plant buildings. Nucl. Eng. Des. 1999, 192, 205–216. [Google Scholar] [CrossRef]
  9. Clouteau, D.; Broc, D.; Devésa, G.; Guyonvarh, V.; Massin, P. Calculation methods of structure-soil-structure interaction (3SI) for embedded buildings. application to NUPEC tests. Soil Dyn. Earthq. Eng. 2012, 32, 129–142. [Google Scholar] [CrossRef]
  10. Naserkhaki, S.; Pourmohammad, H. SSI and SSSI effects in seismic analysis of twin buildings:Discrete model concept. J. Civ. Eng. Manag. 2012, 18, 890–898. [Google Scholar] [CrossRef] [Green Version]
  11. Anderson, L.M.; Carey, S.; Amin, J. Effect of structure, soil, and ground motion parameters on structure-soil-structure interaction of large scale nuclear structures. In Structures Congress 2011; ASCE: Las Vegas, NV, USA, 2011; pp. 2862–2873. [Google Scholar]
  12. Roy, C.; Bolourchi, S.; Eggers, D. Significance of structure-soil-structure interaction for closely spaced structures. Nucl. Eng. Des. 2015, 295, 680–687. [Google Scholar] [CrossRef]
  13. Nguyen, D.D.; Thusa, B.; Park, H.; Azad, M.S.; Lee, T.H. Efficiency of various structural modeling schemes on evaluating seismic performance and fragility of APR1400 containment building. Nucl. Eng. Technol. 2021, 53, 2696–2707. [Google Scholar] [CrossRef]
  14. GB50267-2019; Code for Seismic Design of Nuclear Power Plants. China Architecture and Building: Beijing, China, 2019.
  15. Zhao, M.; Wang, X.; Zhong, Z. Study on seismic responses of nuclear island structure in non-bedrock site under obliquely incidence of p waves. Eng. Mech. 2020, 37, 43–51. [Google Scholar]
  16. Frano, R.L.; Forasassi, G. Isolation systems influence in the seismic loading propagation analysis applied to an innovative near term reactor. Nucl. Eng. Des. 2010, 240, 3539–3549. [Google Scholar] [CrossRef]
  17. Du, X.L.; Zhao, M. A local time-domain transmitting boundary for simulating cylindrical elastic wave propagation in infinite media. Soil Dyn. Earthq. Eng. 2010, 30, 937–946. [Google Scholar] [CrossRef]
  18. Zhao, M.; Gao, Z.D.; Wang, L.T.; Du, X. Obliquely incident earthquake input for soil-structure interaction in layered half space. Earthq. Struct. 2017, 13, 573–588. [Google Scholar]
  19. Seismic Instrumentation System and Its Use in Post-earthquake Decision Making at Nuclear Power Plants; IAEA TECDOC-1956; International Atomic Energy Agency: Viena, Austria, 2021.
Figure 1. Finite element of the soil–structure interaction.
Energies 16 00194 g001
Figure 2. Finite element of the structure–soil–structure interaction.
Energies 16 00194 g002
Figure 3. First four modes of the NPP.
Energies 16 00194 g003
Figure 4. Time history of Guangdong NPP site.
Energies 16 00194 g004
Figure 5. FRS of the raft foundation reference point in x and y directions. (a) FRS of the raft foundation in the x direction. (b) FRS of the raft foundation in the x direction (2–10 Hz). (c) FRS of the raft foundation in the y direction. (d) FRS of the raft foundation in the y direction (2–10 Hz).
Energies 16 00194 g005aEnergies 16 00194 g005b
Figure 6. FRS of the raft foundation reference point in x and y direction. (a) FRS of the raft foundation in the x direction. (b) Floor response spectrum of the raft foundation in the x direction (2–10 Hz). (c) FRS of the raft foundation in the y direction. (d) FRS of the raft foundation in the y direction (2–10 Hz).
Energies 16 00194 g006aEnergies 16 00194 g006b
Figure 7. Comparison of FRS of raft foundation reference points in x and y directions between SSI system and SSSI system. (a) FRS of the raft foundation in the x direction. (b) FRS of the raft foundation in the x direction (2–10 Hz). (c) FRS of the raft foundation in the y direction. (d) FRS of the raft foundation in the y direction (2–10 Hz).
Energies 16 00194 g007
Figure 8. FRS of the key floor reference point in x and y directions. (a) FRS of the key floor in the x direction. (b) FRS of the key floor in the x direction (2–10 Hz). (c) FRS of the key floor in the y direction. (d) FRS of the key floor in the y direction (2–10 Hz).
Energies 16 00194 g008
Figure 9. Comparison of FRS of key floor reference points in x and y directions. (a) FRS of the key floor in the x direction. (b) FRS of the key floor in the x direction (2–10 Hz). (c) FRS of the key floor in the y direction. (d) FRS of the key floor in the y direction (2–10 Hz).
Energies 16 00194 g009
Figure 10. FRS of key floor reference points of SSI system and SSSI system in x and y directions. (a) FRS of the key floor in the x direction. (b) Floor response spectrum of the key floor in the x direction (2–10 Hz). (c) FRS of the key floor in the y direction. (d) FRS of the key floor in the y direction (2–10 Hz).
Energies 16 00194 g010
Table 1. First 4 modes of the NPP.
Mode1234
Frequency (Hz)4.114.465.005.81
Table 2. Sites geotechnical parameters.
Depth
(m)
Shear Velocity
(m/s)
Density
(kg/m3)
Elastic Modulus
(MPa)
Poisson Ratio
5967.071596191049230.378
15458.45863202010920.286
201146.22413246085390.321
40756.684691247036120.277
Table 3. Comparison of peak acceleration of the two reactors at the same site.
DirectionConditionAmax (g) A δ / %
xTwo reactors10.280.02
Two reactors20.30
yTwo reactors10.270.02
Two reactors20.25
Table 4. Comparison of FRS at different locations of raft foundation.
DirectionConditionSmax (g)Frequency (Hz) S δ / %
xTwo reactors10.943.330.05
Two reactors20.893.33
yTwo reactors10.812.770.06
Two reactors20.872.77
Table 5. Comparison of FRS at different locations of raft foundation (2–10 Hz).
DirectionConditionSmax (g)Frequency (Hz) S δ / %
xTwo reactors10.943.330.05
Two reactors20.893.33
yTwo reactors10.812.770.06
Two reactors20.872.77
Table 6. The variables nomenclature table.
VariablesDefinitionVariablesDefinition
A the peak acceleration S peak acceleration of the floor response spectrum
A δ reduction rate of the peak acceleration S δ reduction rate of peak acceleration of the floor response spectrum
Amaxmaximum of the peak accelerationSmaxmaximum of peak acceleration of the floor response spectrum
Table 7. Peak acceleration of the raft foundation of SSI system and SSSI system.
DirectionConditionAmax (g) A δ / %
xSSSI0.280.04
SSI0.24
ySSSI0.270.01
SSI0.26
Table 8. Comparison of FRS at different locations of the raft foundation of SSI system and SSSI system.
DirectionConditionSmax (g)Frequency (Hz) S δ / %
xSSSI0.943.3319
SSI0.793.22
ySSSI0.872.7718
SSI0.742.77
Table 9. Comparison of FRS at different locations of raft foundation (2–10 Hz) of SSI system and SSSI system.
DirectionConditionSmax (g)Frequency (Hz) S δ / %
xSSSI0.943.3319
SSI0.793.22
ySSSI0.872.7718
SSI0.742.77
Table 10. Comparison of peak acceleration of the two reactors located at one site.
DirectionConditionAmax (g) A δ / %
xTwo reactors10.330.04
Two reactors20.29
yTwo reactors10.290.03
Two reactors20.26
Table 11. Comparison of FRS at different locations of the raft foundation.
DirectionConditionSmax (g)Frequency (Hz) S δ / %
xTwo reactors11.163.440.04
Two reactors21.123.33
yTwo reactors11.003.030.06
Two reactors20.943.03
Table 12. Comparison of FRS at different locations of the raft foundation (2–10 Hz).
DirectionConditionSmax (g)Frequency (Hz) S δ / %
xTwo reactors11.163.440.04
Two reactors21.123.33
yTwo reactors11.003.030.06
Two reactors20.943.03
Table 13. Relative changes of x and y peak accelerations of reference points on key floors of SSI system and SSSI system.
DirectionConditionAmax (g) A δ / %
xSSSI0.330.04
SSI0.29
ySSSI0.290.02
SSI0.27
Table 14. Comparison of FRS in X and Y directions of key floor reference points of SSI system and SSSI system.
DirectionConditionSmax (g)Frequency (Hz) S δ / %
xSSSI1.163.4422
SSI0.953.33
ySSSI1.003.0310
SSI0.913.57
Disclaimer/Publisher’s Note: The statements, opinions and data contained in all publications are solely those of the individual author(s) and contributor(s) and not of MDPI and/or the editor(s). MDPI and/or the editor(s) disclaim responsibility for any injury to people or property resulting from any ideas, methods, instructions or products referred to in the content.