Abstract
University campuses represent a heterogeneous ecosystem as to social, economic, energetic, and personal travel planning with a huge impact on hosting cities and territories. Sustainable policies are thus fundamental to reduce this impact and to adopt ecological behaviors. The measures for any University Sustainability Plan should be evaluated in terms of GHG emissions, as well as the overall impact of the university itself. Carbon footprint (CF) calculation is a relevant Decision Support tool that allows university organizations to measure and communicate the environmental effects of their activities. The aim of this paper is to present a carbon footprint methodology specifically designed to calculate the carbon footprint of large universities. The methodology was applied to calculate the CF of the University of Bologna by following international standards—i.e., the GHG protocol, the ISO 14064, and the ISO/TR 14069 guide—to understand the environmental impact caused by greenhouse gas emissions from direct and indirect university activities. The study was conducted upon the data available in 2020 and then was compared to the 2018 data, with the aim to recognize if the effect of the pandemic could have altered the results. In 2020, the University of Bologna emitted 16,467 tCO2e which became 15,753 tCO2e considering the offset and avoided emission provided by the internal production of energy from renewable sources. Comparison between 2020 and 2018 shows how, in 2018, most of the emissions came from transportation, representing 74% of the total emissions, while in 2020 almost 50% of total emissions derived by IT procurements. The case application demonstrates the way with which the methodology may be applied to assess environmental impact for complex university campuses.
1. Introduction
Climate change refers to long-term shifts in temperatures and weather patterns, as indicated by the United Nations; it has become a main global issue related to energy, economy, and environment. The Intergovernmental Panel on Climate Change [1] has stated that the average global land and ocean temperatures increased by 0.85 °C between 1880 and 2012 [1]. One of the most relevant factors able to drive climate change has been recognized in greenhouse emissions gases (GHG). According to the International Energy Agency (IEA), the top three producers of GHG emissions are public electricity and heating, manufacturing and construction [2], and transportation [3]. If no action is taken to reduce GHG emissions, the world will be 2 °C higher than it was before industrialization [4]. Urban areas represent the main context in which 80% of GHG emissions have been produced [5]. Within the urban context, a relevant impact in terms of GHG emissions released into the atmosphere has been associated with complex organizations, since they have a large energy consumption and generation of movements of people. Complex organizations aiming to achieve the climate neutral goal should first evaluate their environmental performance. The key factor is the carbon footprint, which indicates the amount of GHG emissions generated directly and indirectly by the activities carried out by organizations and is usually expressed by the carbon dioxide equivalent (tCO2e). UNI EN ISO 14064:2019 (part 1, 2, and 3) and the GHG Protocol are the two main protocols to be applied for the assessment of GHG emissions. The carbon footprint is a green measurement and is defined by the Carbon Trust [6] as the total GHG emissions caused directly or indirectly by an individual, organization, service, or product. In accordance with the Kyoto Protocol, the greenhouse gases to be included are carbon dioxide (CO2), methane (CH4), nitrous oxide (N2O), hydrofluorocarbons (HFs), sulfur hexafluoride (SF6), nitrogen trifluoride (NF3), and perfluorocarbons (PFCs). These are the most common gases released both from the use of fossil fuels in electricity, heat, and transport and by productivity processes. Water vapor and ozone are not considered because of their short persistence in the atmosphere. tCO2e is used to express the greenhouse effect produced by all climate gases, which is considered to be equal to 1 [7]. Each greenhouse gas is converted to tCO2e, using the appropriate global warming potential (GWP) index, introduced by the IPCC. The GWP index is a relative measure of how much heat a given mass of greenhouse gas releases into the atmosphere compared to the heat trapped by the same mass of CO2 (considered to be equal to zero). So, the higher the GWP value, the greater the impact of the CO2 over the same period is.
It is possible to calculate the carbon footprint both for a product or service and for an organization, but it is necessary to assess all the operations carried out, following the reference ISO standards that are different from one other. Quantifying the total GHG emissions of a product means analyzing the entire life cycle of the good, according to the approach of the Life Cycle Assessment (LCA) methodology and in compliance with the principles, requirements, and guidelines of the UNI EN ISO 140 67:2018 standard. Otherwise, in the case of organizations, the GHG emissions inventory is drawn up, considering energy direct and indirect emissions and other indirect emissions. The reference ISO standards in this case are UNI EN ISO 14064:2019—part 1, 2, and 3. The carbon footprint of an Organization (OCF), such as a company, a business, and also a university, can be calculated by creating an inventory of greenhouse gas emissions, with annual reference, to understand how much and where the carbon footprint is present, to calculate it, and consequently reduce or eliminate it. In this context, OCF can be used to involve the CEOs and mangers in environmental policies. The carbon footprint is thus an effective decision support system. When the total carbon footprint is calculated, it is possible to identify its different components. The results obtained lead to different action: intervention on production departments and facilities, through precise energy diagnoses and consequent improvement plans; analysis of direct and indirect energy consumption; auditing of design of products and packaging; analysis of LCA methodology; analysis of the supply chain and consequent modification of purchasing policies of raw materials and semi-finished products; verification of the effectiveness of logistics by analyzing the flow of outgoing materials (finished product, waste) in relation to the means of transport used [8]. Three scopes have been established according to the GHG Protocol [9] to completely evaluate the emission sources and risk/opportunities and to promote transparency. Scope 1 (direct GHG emissions) accounts for GHG emissions from sources owned or controlled by the organization, Scope 2 (electricity indirect GHG emissions) accounts for GHG emissions from the generation of purchased electricity consumed by the organization and Scope 3 (other indirect GHG emissions) is an optional reporting category that includes emissions released from sources not owned or controlled by the organization. Universities are the organizations that have the strongest impact on urban structures, socio-economic health, and policies. Firstly, universities enhance the creation of new economic patterns, with complex social relationships between “town” and “gown” in the hosting city [10]. There are several issues that orient the urban impact produced by the University presence on a given territory. The key concept, anyway, is rooted on the accessibility and the housing choice made by students and University staff [11]. Another relevant aspect is the impact commuting students and staff have on air quality. Transport generates a series of direct and indirect effects that should cover a central position in university policies. Together with environmental concerns, accessibility and equity are also essential requirements for sustainable universities and should work toward providing access and mobility without affecting campus health qualities [12]. Generally, in some cities, college campuses are very often among the area’s largest employers. They have their own energy plants and water treatment facilities, on the basis of specific territory needs. Besides energy, water, and waste, college campuses are also major traffic generators that require extensive parking areas and cycling infrastructures [13]. The assessment of universities’ environmental impact and of their carbon reduction level not only yields environmental benefits but also promotes financial savings and increases competition [14]. Sustainability reporting has been proven to help delivering these benefits as well as assisting university leaders in directing on-campus operations [15] and sustainability projects [16].
The evident interest of universities’ carbon footprint calculations has been also demonstrated by the subscription of 1400 universities worldwide to the declarations on Sustainability in Higher Education (SHE) [17]. Being an organization engaged in education, research, and community services, a university has an important role to let graduates maintain a sustainable development. Three important aspects of sustainable development have been identified: economic, social, and environmental pillars [18]. Thus, by applying carbon footprint calculation, a university can monitor and evaluate the activities with negative effects on climate change.
Given that students and staff are likely to be the most significant portion of a typical university’s carbon footprint, the use of appropriate assessment methodologies and key performance indicators to promote realistic target-setting is required at the sector-level to achieve the 2020 goal. [19]. It has been also evaluated that one of the main sources of emissions is the transportation of students and faculty staff to and from the campus [20].
A specific model has been used to calculate the carbon footprint (CF) of the Norwegian University of Technology and Science (NTNU). The results show that the carbon footprint of NTNU is very significant with an average contribution of 4.6 tons per student. In particular, the purchase of large amounts of equipment and consumables for scientific use is found to be an important contributor [21].
The mobility habits of students and related CO2 emission estimation has been conducted through a statistical analysis at the University of Palermo (Italy), identifying the annual distances traveled by commuters [22].
Differently, a CO2-assessment tool allows students to calculate and assess the carbon footprint of their school by themselves [23].
Since carbon footprint calculation acts as a baseline for evaluation and future mitigation efforts, several universities developed specific studies. A study at Clemson University quantified each greenhouse gas emission source and discussed the data assumptions and life cycle phases included to improve carbon footprint comparison with other higher education institutions. The results showed that Clemson University’s carbon footprint for 2014 was approximately 95,000 metric tons CO2e and 4.4 metric tons CO2e per student. The largest sources of greenhouse gas emissions were estimated in electricity generation (41%), automotive commuting (18%), and steam generation (16%). Electricity generation from coal was 29% of the electricity generation resource mix and accounted for three-quarters of Clemson University’s GHG emissions associated with electricity [24]. An interesting methodology to estimate an average student’s personal carbon footprint has been developed at a university in Shanghai, through an online survey aimed to capture students’ energy consumption patterns, behavioral tendencies, and willingness to engage in energy conservation. Survey responses, combined with utility data and emissions calculations, indicated that the average annual carbon footprint was a relatively modest 3.84 tons of CO2 equivalent per student, with 65% attributable to daily life, 20% to transportation, and 15% to academic activities such as studying. The top three individual uses were dining (34%), showering (18%), and dorm electricity loads (14%) [25].
Another example has been carried out by Universitas Pertamina located in Jakarta, which is an active part of an Intergovernmental Panel on Climate Change (IPCC) program that supported the reduction in carbon emissions. The analysis to calculate the amount of carbon emissions had been based upon direct sampling, questionnaire survey, and secondary data, particularly data of electricity usage. Total amount of CO2 emissions had been evaluated in 1,351.98 metric tons of carbon dioxide (MTCO2), which was equal to 0.52 MTCO2/person/year [26]. The data diverged from the amount calculated by Universitas Pertamina essentially for geographical reasons. Research conducted at Birla Institute of Technology and Science Pilani has evaluated the main outcomes of university activity, i.e., direct emissions of university-owned facilities, indirect energy emissions of purchased electricity, heat or steam, and other indirect emissions. It has been found that the contribution of indirect emissions is 99%. This study highlights the need of formulating policies to reduce such emissions [27]. A greenhouse gas (GHG) inventory has been assessed using the GHG protocol (GHGP in the public University at Mexico City, showing that, in 2016, the campus produced around 3000 tons of CO2 equivalent, with Scope 1, 2, and 3 accounting for 4%, 24%, and 72%, respectively. Emissions analysis using activity indicated 51% for commuting; 24% for electricity usage; 14% for academic travel; and 11% for other activities [28].
A spatial evaluation and visualization of the CO2 emissions of King Abdullah University of Science and Technology (KAUST), Saudi Arabia collected data from the overall coverage of the university campus buildings. The study showed that the overall estimate of the CO2 emissions for the university campus was 127.7-tons CO2 equivalent. The lowest emission was 0.02-tons CO2 equivalent, while the maximum value was 20.9-tons of CO2 equivalent [29].
A case study has been performed on UCLM, a regional multicampus institution that can be considered a medium-sized Spanish public university with over 30,000 registered students in 2012 and over 3000 workers including researchers, teachers, and administrative staff. The research indicated that the average employee is much more responsible for emissions through their private life than through their job at the university, which is congruent with the lower time spent at work but also with the non-carbon intensive characteristic of higher education. The carbon footprint measurement had its highest value for 2008, 36.4tCO2e kt, and its lowest value at the end of the period analyzed, 22.9 kt in 2012 [30].
An interesting application had been carried on the case of Universitat Jaume I, Spain, through a specific calculation tool based upon GHG Protocols. The tools. including the most significant emission sources of the universities, using Spanish emission factors, allowed users to introduce new emission sources, use their own emission factors, and calculate CO2 absorptions from their own offset projects [31]. In particular, the research demonstrated that in the literature there were no findings on calculation tools able to consider Scopes 1, 2, and 3 and, consequently, the tools defined had been able to calculate the CF of universities, including all the emission sources that are characteristically found in education centers. However, at the same time, the tool was designed to be flexible enough to be adaptable to other types of organizations since both the ES and the EF can be modified.
Furthermore, COVID-19 had a strong impact on the GHG emissions of universities. Although the overall carbon footprint generally decreased by almost 30% during the lockdown, the carbon intensity of online teaching and learning was found to be substantial and almost equal to that of staff and student commute in the pre-lockdown period [32]. This aspect needs a deepened evaluation that includes searching the details of the related emissions released by any sources.
Gaps and Novelty
The literature review offers a wide sample of different methodologies, variable from self-calculation tools to criteria aimed to define a specific emissions indicator, i.e., GHG emissions per person, or, alternatively, the allocation of emissions production on a spatial basis.
Consequently, the limits in the existing literature have been found on the absence of a calculation methodology specifically able to assess complex multicampus university structures. Indeed, the novelty of this paper is to present a methodology based on GHG Protocols [9] able to assess urban complexity and a wide range of populations. In these terms, the University of Bologna offers a more complex case study with its 80,000 students and 6000 workers in comparison to the other mentioned multicampus structure of UCLM (Spain), with 30,000 students and 3000 workers. Consequently, the enhanced scale offers an innovative overview on data collection, emissions sources analysis and impact of COVID-19 on GHG emissions.
The paper has been structured in the following sections:
2. Materials and Methods
This research presents a new carbon footprint calculation methodology in adherence to international standards able to assess environmental impacts produced by different university campuses, characterizing a complex organization.
The case study is based upon data collection from 2020, during the pandemic, and then in 2018 to test the validity of the calculation method. The following international references were followed for calculating the 2020 University of Bologna’s GHG emissions:
- GHG Protocol Corporate Accounting and Reporting Standards, for guiding principles and identification of system boundaries;
- ISO 14064:2019-1 for requirements, categories, and general guidelines for quantifying an organization’s climate footprint;
- ISO/TR 14069:2013 guideline for the application of the above standard.
The system was created based on the data and information generated by data provided by administrative offices, concerning University of Bologna activity, management, and operational processes.
2.1. The Case Study of the University of Bologna
The Alma Mater Studiorum—University of Bologna is an Italian public university that was formally established in 1088. The “Scuola of Bologna” arose spontaneously through the initiative of some students, gathered in primordial associative forms, who dictated the aims of teaching and controlled its correct implementation. In XI and XII centuries, it has been reported that magistri were paid directly by students, who often welcomed the latter into their homes, establishing almost family relationships with them. Around the innovative Schools of Law, students soon gathered in mutual assistance associations, which over time were structured according to their places of origin (Nationes) and finally aggregated into prestigious supra-regional corporations called universitates. Since then, lawyers and artists have enjoyed an unparalleled social and political reputation: indispensable to a Europe that was being born and that needed solid legal and cultural foundations.
This community-oriented approach remained alive through the centuries and currently University of Bologna is developed on several campuses located in Bologna, Cesena, Forlì, Ravenna, and Rimini. The university is organized into 5 schools, 32 departments (of which, however, only 17 are grouped into the 5 schools), and 232 study courses covering 16 subject areas. It includes centers and libraries and offers study facilities indicated in the Social Responsibility Report [33]. A general overview of University of Bologna has been reported in Figure 1.
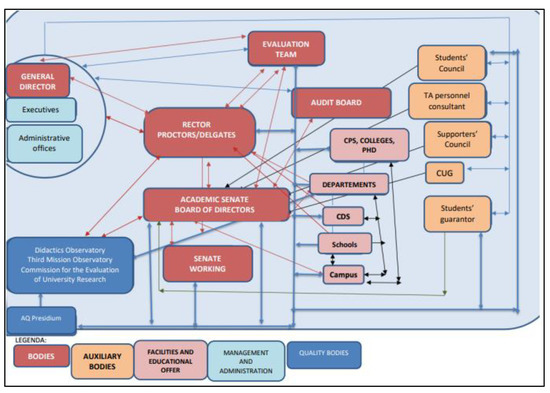
Figure 1.
University of Bologna overview.
With 85,000 enrolled students, 6000 employed as academic and administrative staff, 232 courses of study (a.y. 2020/2021), of which 93 are Bachelor’s degree and 125 Master’s degree courses, University of Bologna plays an important role due to its large size in terms of environmental urban impact.
University of Bologna has previously calculated the carbon footprint, using the methodology proposed by the Green Metric Ranking (GMR) that is based on two macro-areas: energy consumed and transport (divided by car, bus, and motorcycle) [34]. Standard emission factors are then considered for each item. It should be immediately evident that the calculation methodology proposed by GMR is simpler compared to that required by international standards such as the GHG Report and ISO 14064. Green Metric considers electricity and transport without distinguishing between different scopes. In particular, the items of Scope 1 are not considered, items of Scope 2 are limited to overall energy consumption, and the ones of Scope 3 are not distinguished between university-owned and non-owned vehicles. Through the previous GMR criteria, the University of Bologna had different results calculated during the past years, as shown in Table 1.

Table 1.
University of Bologna carbon footprint calculated using Green Metric Ranking.
Due to the high level of structural complexity and wide territorial distribution, it has been necessary to review the calculation methodology proposed by the Green Metric.
The aim of this paper is to illustrate a new carbon footprint calculation according to EN ISO 14064:2019 and GHG Protocol, to apply an overall assessment and to measure the environmental impact of policies and actions taken. The aim of this paper is to illustrate a quali-quantitative assessment methodology developed to measure the impact of University of Bologna in terms of GHG, considering specifically its complexity and dimension in territorial and community expanse. The calculation criteria have been also applied to analyze and measure in quantitative terms the environmental impacts generated by University of Bologna in the function of COVID-19-containment measures, such as lockdown and the reduction in in-person activities.
2.2. Organizational Boundaries and Operational Boundaries
Organizational boundaries have been identified by choosing the operational control approach (and not the financial operational approach), in which activities emissions are under the direct control of the University that has full authority to implement its policies. The emissions of all activities carried out within the university’s five main campuses (Bologna, Forlì, Cesena, Rimini, and Ravenna) and smaller sites, such as libraries, lectures, study rooms, etc. are calculated. Foreign sites (Campus in Buenos Aires, Brussels, New York, and Shanghai) have been not considered, nor sports buildings and university residences for students.
After having identified the organizational boundaries (Figure 2), the second phase has been to define operational boundaries: the choice and analysis of the GHG categories to be considered in the calculation of the three scopes. In Table 2, Scope 1, 2, and 3 emissions have been illustrated. All these categories have been selected, due to their quantitative consistency and are, therefore, significant for the final calculation. In addition, they are categories in which the university has a greater capacity of monitoring and reduction.
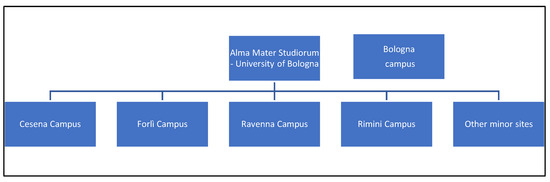
Figure 2.
Organizational boundaries.
Table 2.
Scope 1, 2, and 3 data collection and sources for 2020.
2.3. Calculation Criteria
The relative equivalent emissions of each category have been calculated using the following criteria, indicated by the GHG Protocol:
- Direct measurement:
GHG = Emission data × GWP100
- Calculation:
GHG emissions = activity data × emission factor kg CO2e
- The activity data are a quantitative measure of activity that results in a GHG emission or GHG removal;
- The emission factor is a coefficient relating GHG activity data with the GHG emission. The data have been extracted from national or international datasets.
Equation (1) provides a direct measurement using the Global Warming Potential data, used only in the calculation of emissions in the direct emissions category. On the other hand, Equation (2) is a more complex but common calculation. The activity data are structured as kilowatt—hours of energy consumed, or kilometers traveled, or cubic meter of natural gas consumed.
2.4. Data Collection
The collection of data for Scope 1 and 2 has been structured thanks to data availability within internal university sources, included in Social Responsibility Reports. On the other hand, Scope 3 was a different matter, as the process was clearly longer and less straightforward. The other indirect emissions macro category (Scope 3) is the only one to be not mandatory to analyze, according to international standards ISO 14064, even if recommended, due to the fact that a large part of the emissions comes from this scope. Specifically, in the case of the University of Bologna, emissions from transport were elaborated through data collected from a questionnaire; for waste, instead, it was not possible to calculate the emissions of all types of waste as the university has not yet prepared a strategy to measure the waste sorting.
Regarding the data collection of Scope 1, the first category examined has concerned direct emissions from the stationary combustion of fossil fuels for heating and other fuels used for on-site energy generation. Heating oil (diesel) and natural gas were examined with related data derived by power heating plants on the Bologna campus; it has been multiplied by “Gas oil, IPCC Europe” as a factor emission extracted from the National Inventory Report 2020. In contrast, natural gas is purchased from outside and burned in boilers within the university’s organizational boundaries to produce warm water. The “Natural gas, 2018” factor (ISPRA 2020) has been used to convert natural gas. The second category analyzed the results of the loss of refrigerants during the maintenance (refilling) phases and repairment activities of air conditioning systems. This type of datum was difficult to find and more difficult to process. The data have been collected by the university energy supply companies. The gases that caused significant emissions to the atmosphere during 2020 were R-410A, R-427A, R-407C, and R-422D and each one of these was multiplied by its relative Global Warming Potentials (GWPs).
The categories of Scope 2 include indirect emissions from the generation of purchased and consumed energy, such as electricity, heat, and steam. Electricity is purchased from the national grid, most of which is generated outside the university’s perimeter, and it has been entirely categorized as renewable energy. For this reason, the relative emissions have been counted as null. In addition, part of the electricity is produced directly by university through photovoltaic systems. Even thermal energy for heating and cooling is purchased only from outside. As with Scope 1, for Scope 2 annual energy consumption data have been provided by Energy Management office.
Finally, the categories of indirect emissions analyzed in Scope 3 were various: emissions from employees’ and students’ commuting; emissions from waste generated from organizational activities; emissions from purchased products; emissions from purchased services (such as water consumption).
To calculate indirect emissions from transportation, mainly focused on the emissions derived by employees’ and students’ commuting, two conditions have been settled: first, rented vehicles for institutional uses are included, second, only cars, buses, and trains have been taken in account.
Means such as motorcycles/scooters, taxis, car sharing, etc., are scarcely used, thus they were not significant for the purposes of this study. Initially, the results of the online survey developed by the University of Bologna for 2020 (“PASSACOLVERDE”) were analyzed and used to create the data set. To further enrich and integrate the data collection, a second online survey was created. This second survey was released through e-mail, messages, social media, etc. It received 1170 voluntary and anonymous responses, of which 929 responses were considered valid within the time frame set for the calculation. In particular, about 900 students responded, while another 270 responses came from the university staff (professors and administrative units).
A second category considered for Scope 3 has been that of hazardous and non-hazardous waste (excluding those similar to household waste, collected by the municipal service), generated mainly in the university’s various laboratory activities and in the medical, veterinary, and research sectors. The data and the relative emission factors were extracted from the company EcoEridiana, which manages the harvest and transports the waste generated by the University of Bologna.
For the category “Indirect emissions from purchased products”, two types of purchases were analyzed: paper and IT equipment. In both cases, data sets were provided by the university’s administrative offices, which also provided useful data for Scope 3, namely emissions from the use of consumed water.
2.5. Computation Procedure
According to Equations (1) and (2), the following criteria, for Scope 1, have been defined (Table 3):
GHG = quantity of fuel consumed × emission factor
GHG = amount of gas charged or lost × GWP100
Table 3.
Unibo refrigerant gas consumption in 2020.
The kilograms of gas were added up for each type of refrigerant gas, except for R-427A gas for which no GWP conversion factor was available and, consequently, it has not been considered. The overall results of emissions from the two GHG categories are reported in Table 4.
Table 4.
Emissions from GHG categories of Scope 1.
For Scope 2, the following criteria have been applied:
GHG = amount of energy consumed × emission factor
Since the University of Bologna is entirely supplied with energy generated from certified renewable sources, the emissions relating to the imported electricity consumed category have been calculated as zero GHG emission categories (Table 5).
Table 5.
Emissions from GHG categories of Scope 2.
For Scope 3, the final calculation criteria, for each GHG category, were as follows:
GHG = total km traveled in 2020 × emission factor
GHG = amount of waste disposed of (kg) × emission factor
GHG = quantity of paper procurement × emission factor
GHG = pieces of IT procurement × emission factor
GHG = quantity of water supplied or consumed × emission factor
The calculation has been carried out for the different three modes of transport considering polluting and relevant (car, bus, and train) (Table 6).
Table 6.
Emissions from GHG categories of Scope 3.
Regarding the sub-category “Transport of special/hazardous waste generated in operations”, an offsetting activity has been considered. In 2020, EcoEridiana offset the GHG emissions produced in the services provided at the University of Bologna by supporting the UNFCC IN_2936 project (generation of clean energy from hydroelectric sources). The offset amounted to 15,600 kg CO2e, which was subtracted from the total calculated emissions (57,758.06 kg CO2e). The calculation of emissions from paper purchases data has been related to overall paper purchase and then the amount has been divided between recycled and non-recycled paper. Moreover, it was assumed that all paper provision has been attributable to reams (a ream usually contains around 500 sheets) and it was estimated that 2% of the reams were in A3 format and 98% in A4 format. The unit costs of a ream of paper bought by the university were requested to the University Procurement office with the aim to calculate the specific weight of each ream. The data on the weight of each ream were also obtained: 2.49 kg for an A4 ream and 4.99 kg for an A3 ream. Once defined, the paper account and the stationery account for the total cost incurred by the university for paper procurement and, having known the unit costs and unit weight of a ream of paper, the following activity data have been obtained:
- 11.82 tons of recycled paper purchased by the University at the end of 2020 (of which 0.22 tons were in A3 format and 11.61 tons in A4 format);
- 37.34 tons of virgin paper purchased by the university at the end of 2020 (of which 0.70 tons were in A3 format and 36.64 tons in A4 format).
These activity data were then multiplied by the relevant emission factors extracted from DEFRA (DEFRA, 2020). In contrast, for the emissions from IT equipment procurement, no in-depth processing of the data received from the university’ offices were necessary.
2.6. Focus: Transport Survey
A new online survey was developed to better investigate how often students and teaching and administrative staff (employees) traveled to the university in 2020, by different means of transportation and the journey average distance. The questions of the survey aimed to investigate: the professional role; the place of study/work (answers structured in multiple choice format, offering wide options on all cities with campuses); how many times on a weekly and monthly basis in-person activities in the university were organized, considering all activities (work, internship, attending lectures, sitting exams, studying in the library, tutoring, etc.); which transport mean has been used for the home—university commuting journey (on multiple choice); km of the commuting journey; and, in spite of the COVID-19 pandemic, if any activity was conducted in person in 2020.
A statistical analysis of the answers was carried out for all the questions asked in the survey to understand the accuracy of the data and how well they represented reality.
The survey results have been useful to calculate the activity data for the transport sector for each mode of transport, which are the following:
where:
Total annual trip traveled = total km traveled per day × frequency × round trip
Total annual trip traveled = average km traveled per day × average daily frequency × 4 weeks × average
monthly frequency × 2
monthly frequency × 2
- “frequency” represents how many times on average a person came to the university physically during the year of reference and it is calculated as the result of daily frequency, weekly frequency, and monthly frequency;
- “round trip” indicated with 2 since the questionnaire explicitly asks whether the return used the same means or not;
- “total annual km traveled” by students commuting and teaching and administrative staff (employees’ commuting): the calculation was carried out for the different three modes of transport considering polluting and relevant (car, bus, and train).
Then, Equations (11) and (12) were applied and the calculation was carried out for each mode of transport (Table 7 and Table 8).
Table 7.
Total km for teaching and administrative staff by mode of transport in 2020.
Table 8.
Total km for student by mode of transport in 2020.
Further analysis has been defined to estimate total kilometers traveled by the university community, including those who did not participate in the survey, based upon different assumptions: for each category of respondents to the questionnaire, the percentage frequency of the provided response in the choice of the means of transport have been taken into consideration, as illustrated in Table 9; the percentages of the previous point were then applied to the consistency on to the overall amount of people belonging to the teaching and administrative staff and students of 2020 (Table 10 and Table 11).
Table 9.
Main means of transport used on the way home to university in 2020.
Table 10.
Estimates of teaching and administrative staff using the different types of transport in 2020.
Table 11.
Estimates of students using the different types of transport in 2020.
The item “Car as a passenger” has not been considered for the final calculation of CO2 emissions because it is not relevant, representing only 2% of the Unibo staff and 1% of the student population who validly answered the survey. The proportion performed is:
where:
Total respondents by type of vehicle/total km of all respondents by type of vehicle = People calculated as
a % of estimated attendances by type of vehicle/x
a % of estimated attendances by type of vehicle/x
- x is the total km traveled for all the estimated population by type of vehicle.
Applying Equation (13), the following results have been obtained, as well as the activity data needed to calculate emissions:
- 1,959,953 km by teaching and administrative staff during 2020 traveled by car;
- 33,599 km by teaching and administrative staff during 2020 traveled by bus;
- 2,123,282 km by teaching and administrative staff during 2020 traveled by train;
- 4,962,292 km by students for the whole year 2020 traveled by car;
- 2,422,994 km by students for the whole year 2020 traveled by bus;
- 13,291,853 km by students for the whole year 2020 traveled by train.
Subsequently, all these activity data were multiplied by the relevant emission factor, which we found to depend on the type of polluting medium used, by applying the formula (13) reported above.
3. Results
The final calculation of total emissions from the Unibo in 2020, as a sum of the emissions that occurred in the three Scopes, has been reported in Table 12.
Table 12.
Unibo carbon footprint related to 2020.
Table 12 shows that in 2020, the University of Bologna emitted 16,467 tons of CO2e, which become 15,753 tCO2e considering the offset and avoided emission caused by the internal production of energy from renewable sources fed into the national grid. Most of the emissions come from Scope 1, representing 43% of the total emissions; however, if we compare the data with the Scope 2 emissions (representing 36% of the total), the difference is not so high, while it is much larger if compared to the Scope 3, which represents only 21% of the total (Figure 3). Some related considerations are as follows:
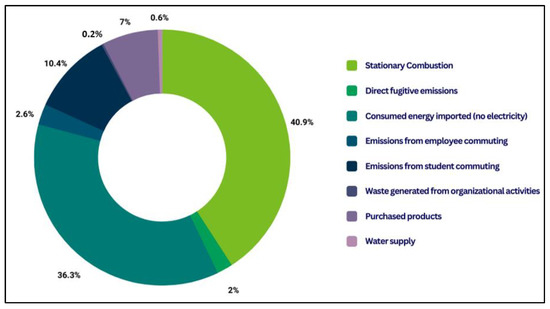
Figure 3.
Tons of CO2e by emission categories.
- Emissions in the employees’ and students’ commuting categories may have been smaller in 2020 than in a non-pandemic year;
- All the emissions related to the generation of municipal waste within university classrooms are missing;
- Additional types of emissions that were not possible to account for in this study could be calculated: employees’ business travels; students’ academic travels; transport of waste generated in operations; and water waste treatment.
Scope 1 emissions are mainly caused by the category “direct emissions from stationary combustion”, which is, in addition, the most polluting category (Figure 4), accounting for 41% of the total GHG emissions. This category is followed by “Consumed energy im-ported through a physical network excluding electricity” from Scope 2, which accounts for 36% of total emissions. The two categories of Scope 3 follow, namely “emissions from students’ commuting” (10%) and “purchased products” (7%).
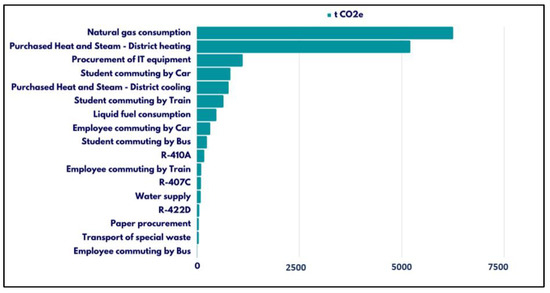
Figure 4.
Tons of CO2e by activity subset.
Apart from the emissions from natural gas and district heating, all the other activity subsets produce much smaller emissions than the first two. The third most polluting item is “Procurement of IT equipment” with 1116.78 tCO2e emitted, followed by “Students Commuting by car” with 817.29 tCO2e produced by students who use cars as their main means of transport on their way to university.
From this analysis, it is clear that the University of Bologna should improve its energy efficiency, try to reduce its natural gas consumption, and better manage its IT equipment purchases.
By producing new energy with photovoltaic panels, covering a surface area of 8443 m2, the University of Bologna can reduce the amount of CO2 released into the environment if compared to the same amount of energy produced by the national energy mix. This activity, therefore, results in a reduction of approximately 714 tCO2e of total emissions, calculated as follows:
where:
Avoided offset emissions = energy produced by PV × C footprint national E mix
- 1,347,266 kWh is the energy produced by photovoltaic systems in 2020, which has been multiplied by 0.53 kg CO2/kWh because it is the “electricity mix emission factor” (ISPRA, 2020) and represents the average value of CO2 emissions due to the production of electricity used in Italy.
Similarly, because of the Renewable Energy Certificate System purchased by the University of Bologna, the avoided emissions were not subtracted from the total in this case to avoid double counting. Therefore, it is simply said that this activity avoided 19,237 t CO2e because:
where:
Avoided emissions = energy purchased from green sources × C footprint national
energy E mix
energy E mix
- 36,296,017 kWh correspond to the energy purchased from green sources in 2020, which has been multiplied by 0.53 kg CO2/kWh.
Overall, the University of Bologna avoided 19,951 tCO2e, as illustrated in Figure 5.
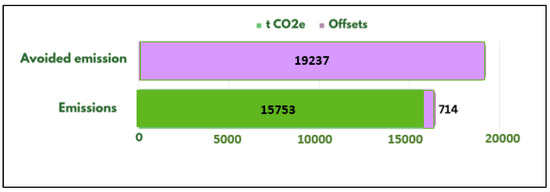
Figure 5.
Comparison between avoided and emitted emissions with offsets at the University of Bologna in 2020.
Due to the exceptional nature of the pandemic year, 2020, the new calculation methodology has been applied also to the University of Bologna’s carbon footprint in 2018 in order to make a comparison with the 2020 results and to further understand and test the reliability of the new methodology.
The year 2018 was chosen as the year of comparison because it is close to 2020 from a temporal point of view and, above all, because many data were already available. Furthermore, it represents an ordinary year, before the spread of the COVID-19 pandemic and related containment measures. Indeed, in 2018, a survey (GOTOUNIBO, published in 2019) was carried out to investigate the transport modes of the Unibo community on the home—university journey, with the response of over 10,000 people. The data collection and processing for the calculation of the carbon footprint in 2018 was carried out almost in the same way for 2020. It should be noted that Direct Emissions have not been calculated for 2018 due to a lack of primary data. However, all the other categories have been examined in the final emissions calculation. Table 13 shows the components of the university community for 2018.
Table 13.
Employees and students enrolled at the University of Bologna in 2018.
Applying the methodology even for 2018, the results of the tCO2e emissions produced in each macro-category considered have been calculated as reported in Table 14. The main difference is the calculation of emissions from employees’ and students’ commuting for which data from the GOTOUNIBO survey were processed and analyzed without performing a new survey (Table 14).
Table 14.
Unibo carbon footprint for 2018.
In 2018, the University of Bologna also produced energy from photovoltaic panels: 1,294,573 kWh of renewable energy was released into the national energy grid. In 2020, the avoided emissions had reduced the total emissions calculated.
Unlike in 2020, most of the emissions were derived from Scope 3, representing 74% of the total emissions, followed by Scope 1 with 15% and Scope 2 with 11%. The comparison between the 2020 and 2018 emissions is illustrated in Figure 6.
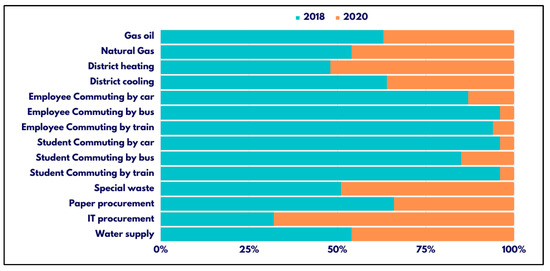
Figure 6.
Comparison of 2018 and 2020 emissions by sub activity.
Some final considerations can be highlighted: the quantities of emissions from the water supply, special waste management, district heating, and natural gas are almost similar in the two years; emissions from paper purchasing, gas oil, and district cooling are higher in 2018 than in 2020, while emissions from all the student and employee commuting activities are clearly higher. In particular, it should be justified by the fact that the university remained closed or partially closed for many months in 2020, conducting almost entirely remote activities.
4. Discussion
The carbon footprint calculation presented in this paper introduces different scientific innovative contributions.
First, the methodology, based on accurate data collections and analysis, allowed for the assessment of GHG emissions produced by a large university, with complex organization and territorial shattered distribution, without a previous case study in the literature, exploiting also an innovative level of direct and indirect data details. The estimation of GHG emissions derived by campus activities responds to a need increasingly felt by traditional European campuses, whose urban structures differ significantly from other countries. This urgent need is due to the difficulties and limitations present in simpler methodologies, conceived for other universities in the world. The methodology explained in this paper is suitable for huge European Universities with multicampus structures.
Furthermore, this approach showed the relevance of an integrated data harvesting approach, in which direct data collection has been supported by survey and indirect assessment of emissions sources.
The results confirmed the opportunity of international standards application (GHG Protocols, ISO 14064, and the ISO/TR 14069) as key factors for GHG emissions estimation in the case of large universities.
Another significant and novel issue is related to the application of the methodology to the data concerning two very different years (2018 and 2020). Indeed, during the year of the COVID-19 outbreak, there was no longer the possibility to travel freely to the university as well as to be together daily in the same locations. This resulted, for instance, in a strong decrease in paper purchases because most activities were moved online, in a lower consumption of gas oil because the need to heat the classrooms had decreased, and in a reduction in impacts from home—university traveling by the university community related to the remote connection. Without considering direct emissions, which were calculated only for 2020, the only sub activity that significantly caused higher emissions in 2020 than in 2018 concerned the purchase of IT equipment, which increased due to smart working. It can therefore be concluded that district heating activities and the use of natural gas show little difference when an anomalous year, characterized by the pandemic, is compared to an ordinary year. This means that they are certainly activities in which the university can directly act to make improvements and decrease its consumption and emissions.
The analysis conducted demonstrated also that even in the case of huge and shattered multicampus organization, with a wide population and territorial complexity, in an ordinary year, Scope 3 represents the more relevant impacting emissions source. It also offered a decision support system able to evaluate the environmental impacts generated by university policies concerning distance learning and smart working.
Furthermore, the methodology proposed in this paper has the advantages of being easy to implement by an organization and not requiring specific skills or complex calculation or financial backing.
Some disadvantages are related to the phases of harvesting and elaborating complex data. This means that a simplistic tool or calculation app is difficult to implement due to the complex organization of the multicampus structure.
The results are sensitive to external conditions, as the COVID-19 impact has demonstrated. In particular, it is easy to find a direct correlation with significant political events. A major national or international crisis may have a relevant indirect impact on GHG emissions, i.e., the war in Ukraine. In particular, during autumn 2022, energy costs have suffered a high increase and consequently have induced an effect on energy financial budgeting. University governance has partially renewed smart working solutions and remote activities with the aim to reduce energy consumption. This policy will have easily an indirect effect on GHG emissions, partially reducing the transportation emissions impact generated by home—work commuters.
5. Conclusions
The novelty of the research is to present a methodology for calculating the carbon footprint suitable for a large university, with a high grade of organizational complexity and a multicampus structure. It offers an objective, analytical, and easy-to-apply approach, suited to representing the role and overall impact of large universities in different urban areas. The study indicates the level of accuracy of data collections needed in GHG emissions assessment and the more relevant sources of emissions. The methodology has been applied by the University of Bologna for GHH institutional calculation, forming the basis to further develop emissions reduction policies.
Some interesting evaluations emerged in this paper, concerning environmental impacts produced by lockdown measures related to the COVID-19 pandemic The analysis demonstrates how the emissions should register the relevant change in the function of remote activities, ICT improvements, and the overall reduction in transportation emissions and offer also an undirect assessment of changing the type of emission sources during the experience of remote working.
The next steps of the research should be oriented to investigate the correlation between university financial issues and carbon footprint quantitative evaluation on the basis of university policies and activities.
Author Contributions
R.B. and F.P.: conceptualization; F.P., R.M., and R.B.: methodology, writing—original draft; F.P.: formal analysis, data curation; R.M. and C.L.: writing—review and editing; V.V. and C.L., visualization: A.S. and V.V.: investigation, supervision. All authors have read and agreed to the published version of the manuscript.
Funding
This research received no external funding.
Data Availability Statement
Data supporting reported results can be found at the University of Bologna Research Repository at DICAM and Department of Industrial Chemistry “Toso Montanari”.
Acknowledgments
The authors want to thank the Sustainability Administrative Office at University of Bologna, respectively: Fabiana Fini and Natalia Sacchetti for administrative support.
Conflicts of Interest
The authors declare no conflict of interest.
References
- Tang, K.H.D. Climate change in Malaysia: Trends, contributors, impacts, mitigation and adaptations. Sci. Total Environ. 2019, 650, 1858–1871. [Google Scholar] [CrossRef] [PubMed]
- Pazzini, M.; Lantieri, C.; Vignali, V.; Simone, A.; Dondi, G.; Luppino, G.; Grasso, D. Case studies in the Emilia Romagna Region in support of intermodality and accessibility of public transport. Adv. Intell. Syst. Comput. 2021, 1278, 65–74. [Google Scholar]
- Censorii, F.; Cotignoli, L.; Vignali, V.; Bartoli, A. Sustainable and resistant road infrastructures: The role of the envision framework as a guide to a new design approach. Coatings 2022, 12, 236–248. [Google Scholar] [CrossRef]
- Zhao, S.; Song, Q.; Huabo Duan, H.; Wen, Z.; Wang, C. Uncovering the lifecycle GHG emissions and its reduction opportunities from the urban buildings: A case study of Macau. Resour. Conserv. Recycl. 2019, 147, 214–226. [Google Scholar] [CrossRef]
- Davoudi, S.; Sturzaker, J. Urban form, policy packaging and sustainable urban metabolism. Resour. Conserv. Recycl. 2017, 120, 55–64. [Google Scholar] [CrossRef]
- Carbon Trust. A Guide: Carbon Footprinting for Businesses. 2020. Available online: https://www.carbontrust.com/our-work-and-impact/guides-reports-and-tools/a-guide-carbon-footprinting-for-businesses (accessed on 15 October 2022).
- IPCC. Climate Change 2022: Impacts, Adaptation and Vulnerability. 2022. Available online: https://www.ipcc.ch (accessed on 10 October 2022).
- ENEA—Italian National Agency for New Technologies, Energy and Sustainable Economic Development. ClimFoot Project—Climate Governance: Implementing Public Policies to Calculate and Reduce Organizations’ Carbon Footprint. 2022. Available online: https://sostenibilita.enea.it/en/ (accessed on 20 October 2022).
- GHG Protocol. The Greenhouse Gas Protocol: A Corporate Accounting and Reporting Standard. World Resources Institute/World Business Council Sustainable Development. 2004. Available online: https://ghgprotocol.org/ (accessed on 2 November 2022).
- Pazzini, M.; Lantieri, C.; Vignali, V.; Simone, A.; Dondi, G.; Luppino, G.; Grasso, D. Comparison between different territorial policies to support intermodality of public transport. Transp. Res. Procedia 2022, 60, 68–75. [Google Scholar] [CrossRef]
- Addie, J.D.; Keil, R.; Olds, K. Beyond town and gown: Universities, territoriality and the mobilization of new urban structures in Canada. Territ. Politics Gov. 2015, 3, 27–50. [Google Scholar] [CrossRef]
- Miralles-Guasch, C.; Domene, E. Sustainable transport challenges in a suburban university: The case of the Autonomous University of Barcelona. Transp. Policy 2010, 17, 454–463. [Google Scholar] [CrossRef]
- Balsas, C.J.L. Sustainable transportation planning on college campuses. Transp. Policy 2003, 10, 35–49. [Google Scholar] [CrossRef]
- Dangelico, R.M.; Pujari, D. Mainstreaming green product innovation: Why and how companies integrate environmental sustainability. J. Bus. Ethics 2010, 95, 471–486. [Google Scholar] [CrossRef]
- Lozano, R.; Huisingh, D. Inter-Linking issues and dimensions in sustainability reporting. J. Clean. Prod. 2011, 19, 99–107. [Google Scholar] [CrossRef]
- Townsend, J.; Barrett, J. Exploring the applications of carbon foot printing towards sustainability at a UK university: Reporting and decision making. J. Clean. Prod. 2015, 107, 164–176. [Google Scholar] [CrossRef]
- Grindsted, T.S. Sustainable universities-from declarations on sustainability in higher education to national law. J. Environ. Econ. 2011, 2, 29–36. [Google Scholar] [CrossRef]
- UNEP—United Nations Environment Programme. Annual Report. 2015. Available online: https://www.unep.org/ (accessed on 20 October 2022).
- Robinson, O.; Kemp, S.; Williams, I. Carbon management at universities: A reality check. J. Clean. Prod. 2015, 106, 109–118. [Google Scholar] [CrossRef]
- Yanez, P.; Sinha, A.; Vasquez, M. Carbon footprint estimation in a university campus: Evaluation and insights. Sustainability 2020, 12, 181–196. [Google Scholar] [CrossRef]
- Larsen, H.N.; Pettersen, J.; Solli, C.; Hertwich, E.G. Investigating the carbon footprint of a university-the case of NTNU. J. Clean. Prod. 2013, 48, 39–47. [Google Scholar] [CrossRef]
- Cirrincione, L.; Di Dio, S.; Peri, G.; Scaccianoce, G.; Schillaci, D.; Rizzo, G. A Win-Win Scheme for Improving the Environmental Sustainability of University Commuters’ Mobility and Getting Environmental Credits. Energies 2022, 15, 396–416. [Google Scholar] [CrossRef]
- Wagner, O.; Tholen, L.; Nawothnig, L.; Albert-Seifried, S. Making School-Based GHG-Emissions Tangible by Student-Led Carbon Footprint Assessment Program. Energies 2021, 14, 8558. [Google Scholar] [CrossRef]
- Clabeaux, R.; Carbajales-Dale, M.; Ladner, D.; Walker, T. Assessing the carbon footprint of a university campus using a life cycle assessment approach. J. Clean. Prod. 2020, 273, 122600–122611. [Google Scholar] [CrossRef]
- Li, X.; Tan, H.; Rackes, A. Carbon footprint analysis of student behavior for a sustainable university campus in China. J. Clean. Prod. 2015, 106, 97–108. [Google Scholar] [CrossRef]
- Ridhosari, B.; Ari Rahman, A. Carbon footprint assessment at Universitas Pertamina from the scope of electricity, transportation, and waste generation: Toward a green campus and promotion of environmental sustainability. J. Clean. Prod. 2020, 246, 119172–119183. [Google Scholar] [CrossRef]
- Sangwan, K.S.; Bhakar, V.; Arora, V.; Solanki, P. Measuring carbon footprint of an Indian university using life cycle assessment. Procedia CIRP 2018, 69, 475–480. [Google Scholar] [CrossRef]
- Mendoza-Flores, R.; Quintero-Ramírez, R.; Ortiz, I. The carbon footprint of a public university campus in Mexico City. Carbon Manag. 2019, 10, 501–511. [Google Scholar] [CrossRef]
- Adenle, Y.; Alshuwaikhat, H. Spatial estimation and visualization of CO2 emissions for campus sustainability: The case of King Abdullah University of Science and Technology (KAUST), Saudi Arabi. Sustainability 2017, 9, 2124–2139. [Google Scholar] [CrossRef]
- Gomez, N.; Cadarso, M.A.; Monsalve, F. Carbon footprint of a university in a multiregional model: The case of the University of Castilla-La Mancha. J. Clean. Prod. 2016, 138, 119–130. [Google Scholar] [CrossRef]
- Valls-Val, K.; Bovea, M.D. Carbon footprint assessment tool for universities: CO2UNV. Sustain. Prod. Consum. 2022, 29, 791–804. [Google Scholar] [CrossRef]
- Filimonau, V.; Archer, D.; Bellamy, L.; Wintrip, S.N. The carbon footprint of a UK University during the COVID-19 lockdown. Sci. Total Environ. 2021, 756, 143964–143976. [Google Scholar] [CrossRef]
- University of Bologna. Social Responsibility Report. 2020. Available online: https://www.unibo.it/en/ (accessed on 12 August 2022).
- UI Green Metric. UI GreenMetric Guidelines 2020. 2020. Available online: https://greenmetric.ui.ac.id/ (accessed on 18 July 2022).
- ISPRA. Emission Factors for the Production and Consumption of Electricity in Italy. 2020. Available online: http://www.sinanet.isprambiente.it (accessed on 15 September 2022).
- DEFRA—Department for Business, Enerfy & Industrial Strategy. Government Greenhouse Gas Conversion Factors for Company Reporting—Methodology Paper for Conversion Factors. Final Report. 2020. Available online: https://assets.publishing.service.gov.uk/government/uploads/system/uploads/attachment_data/file/901692/conversion-factors-2020-methodology.pdf (accessed on 15 October 2022).
Disclaimer/Publisher’s Note: The statements, opinions and data contained in all publications are solely those of the individual author(s) and contributor(s) and not of MDPI and/or the editor(s). MDPI and/or the editor(s) disclaim responsibility for any injury to people or property resulting from any ideas, methods, instructions or products referred to in the content. |
© 2022 by the authors. Licensee MDPI, Basel, Switzerland. This article is an open access article distributed under the terms and conditions of the Creative Commons Attribution (CC BY) license (https://creativecommons.org/licenses/by/4.0/).