
Effect of Coolant Temperature on Performance and Emissions of a Compression Ignition Engine Running on Conventional Diesel and Hydrotreated Vegetable Oil (HVO)


Abstract
1. Introduction
2. Materials and Methods
2.1. Engine and Experimental Setup
2.2. Tested Fuels
2.3. Exerimental Test Procedure
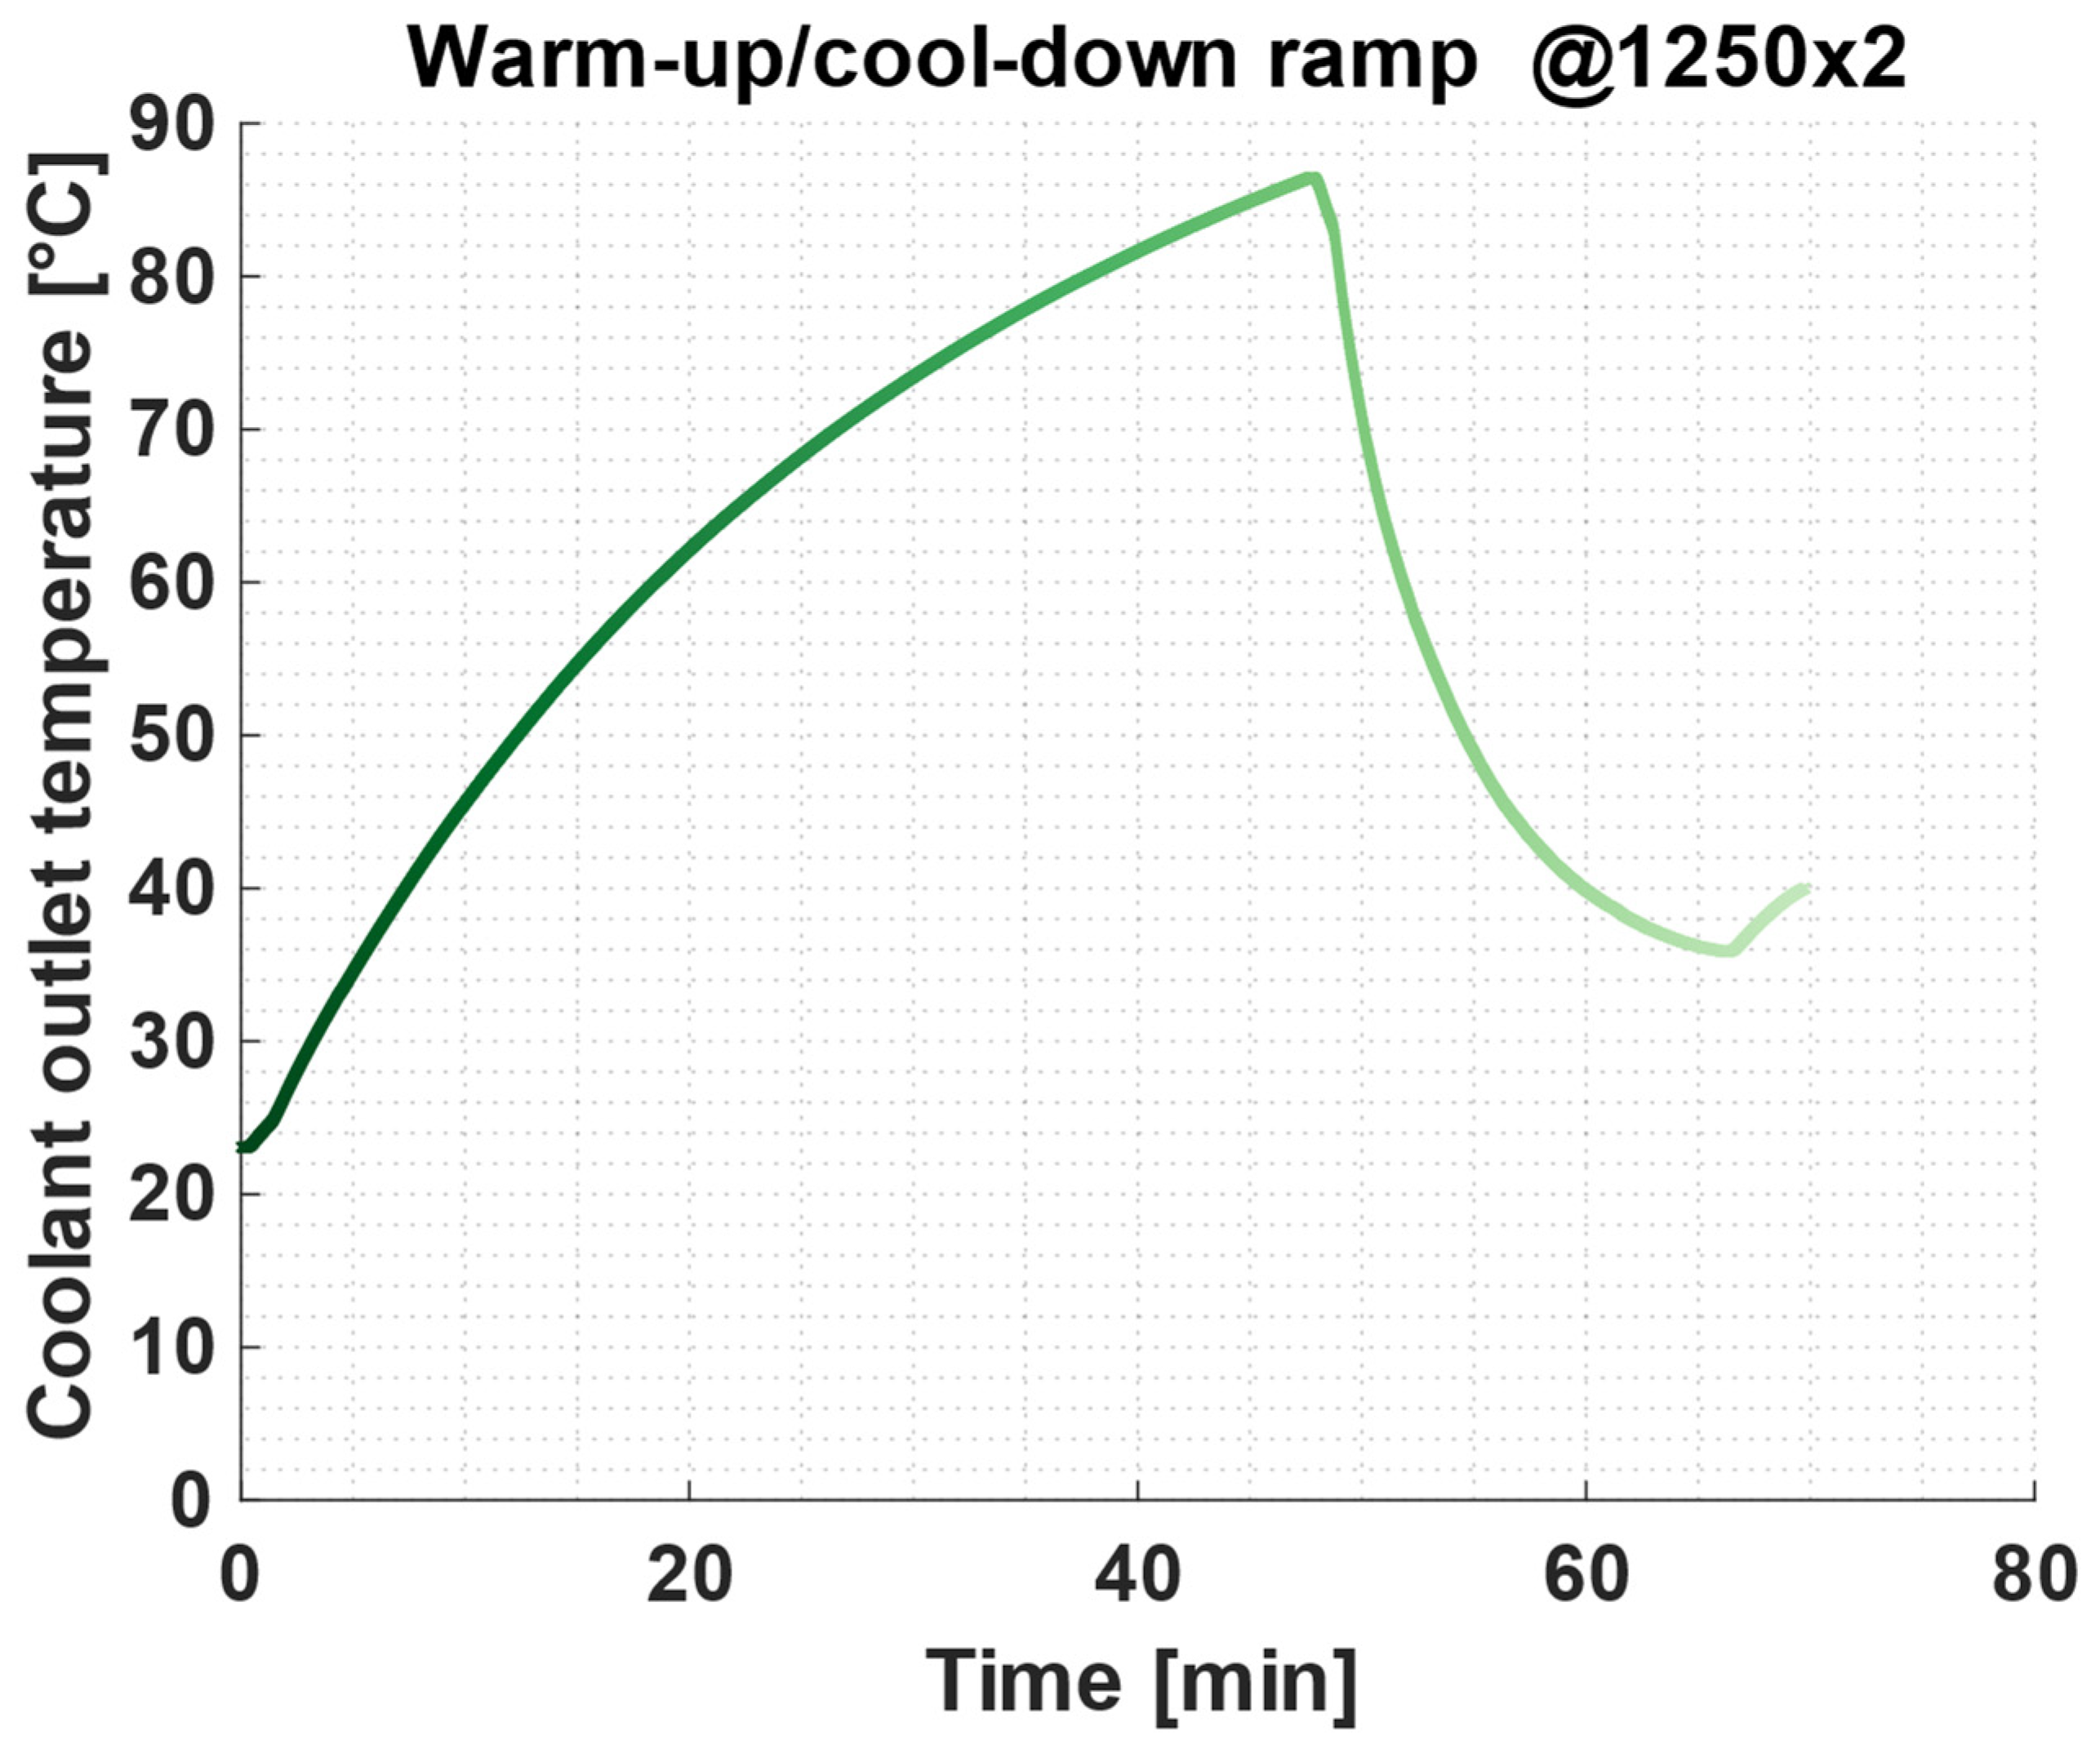
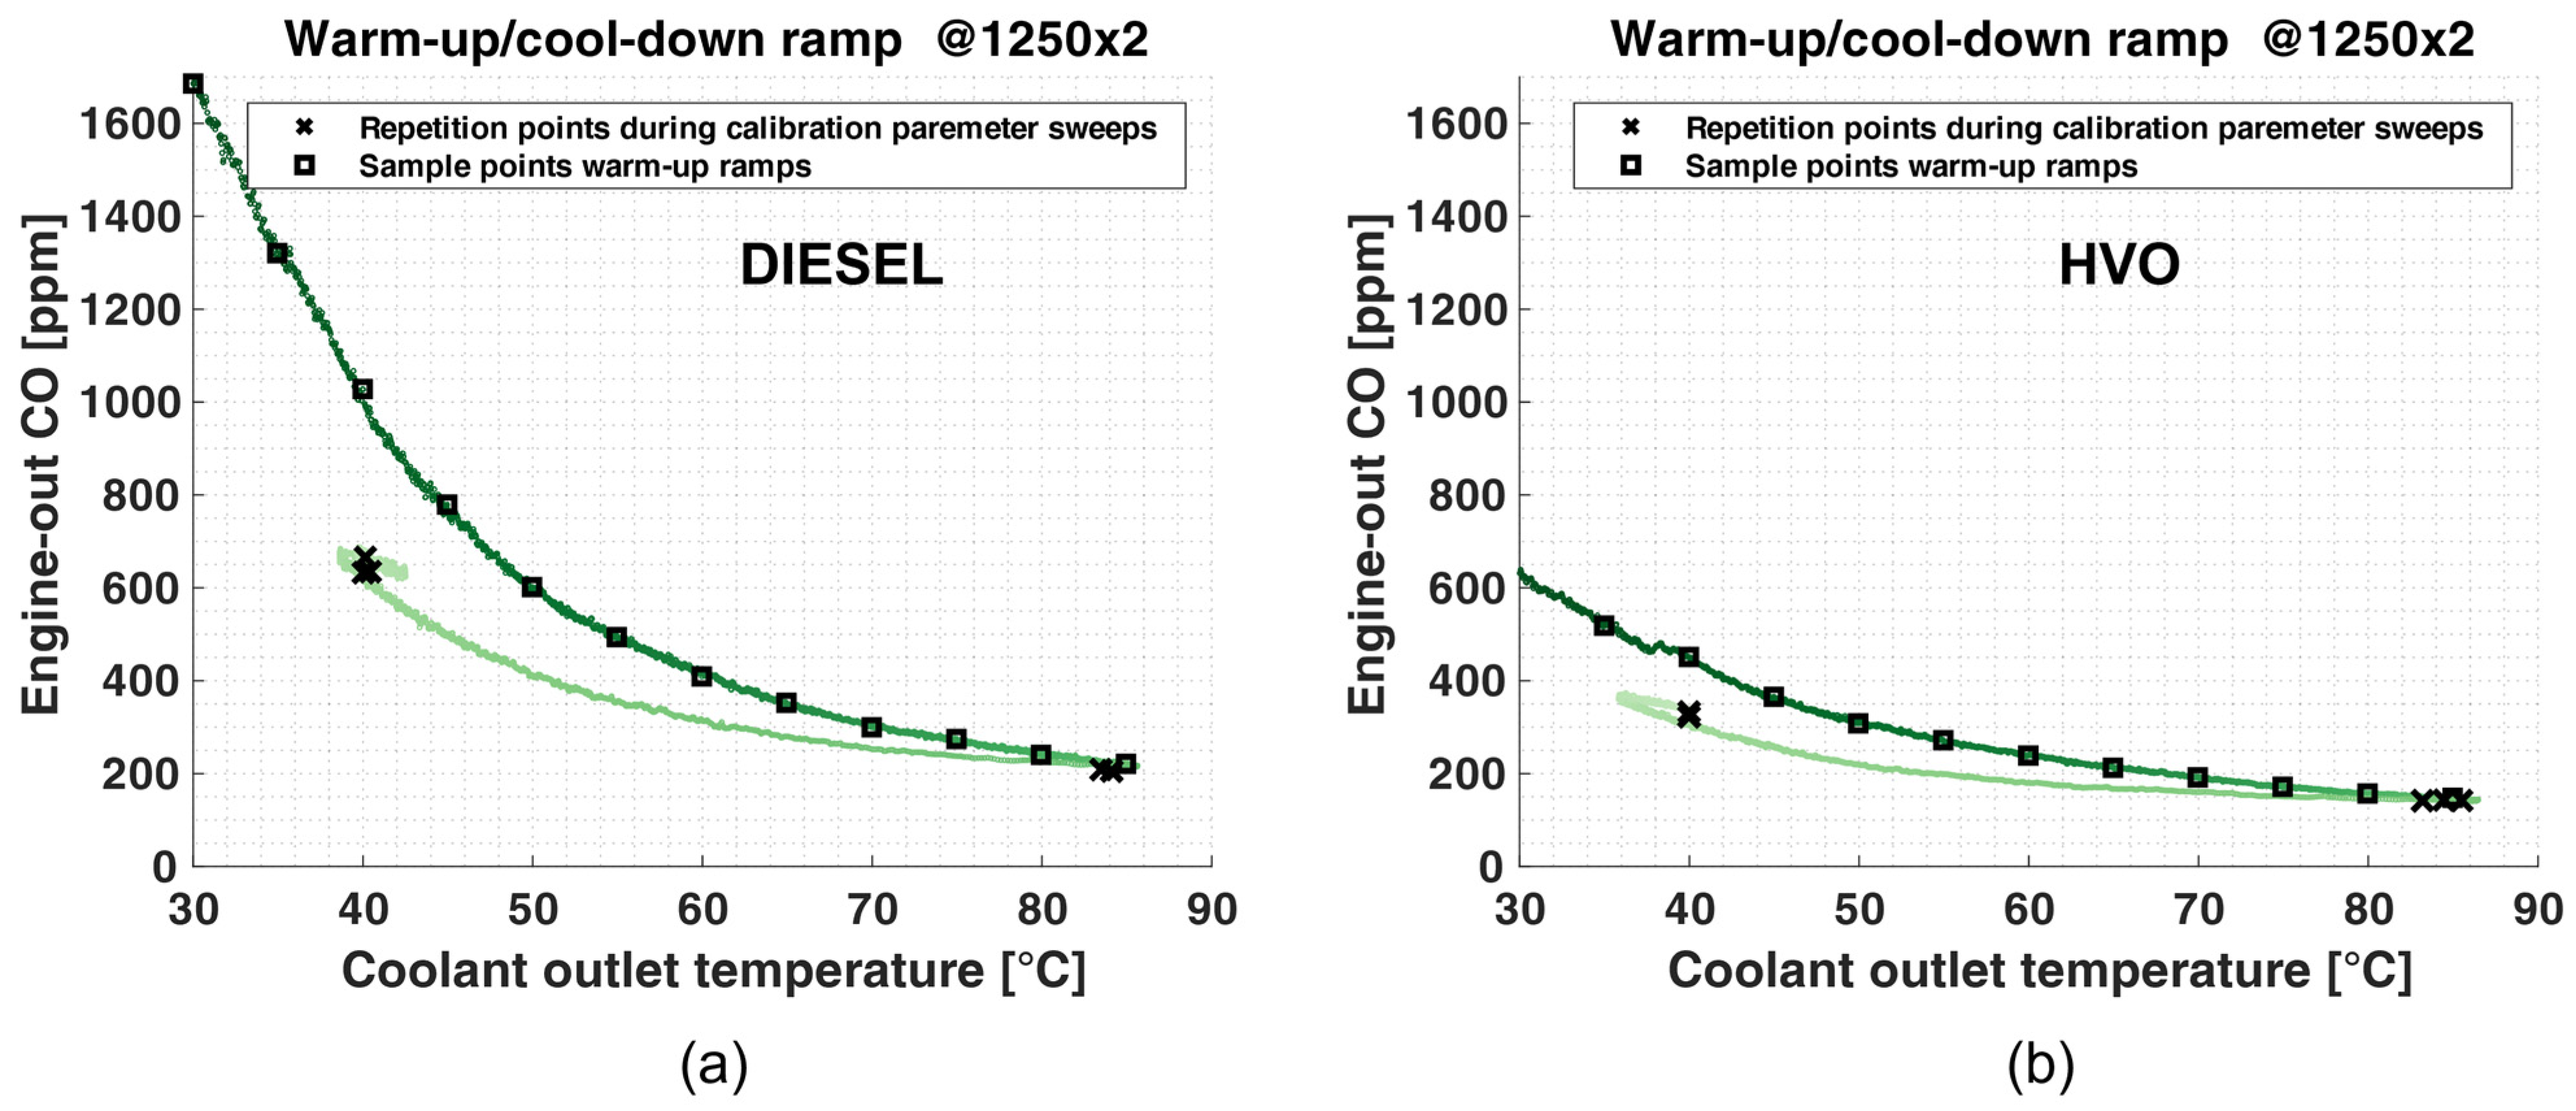
2.3.1. Test Type #1: Warm-Up/Cool-Down Ramps
2.3.2. Test Type #2: Calibration Parameter Sweeps
2.3.3. Additional Observations on Experimental Test Procedures
3. Experimental Test Analysis
3.1. HVO vs. Conventional Diesel Oil: “Natural” Warm-Up Operation (Test Type #1)
3.1.1. Effects on Engine Combustion
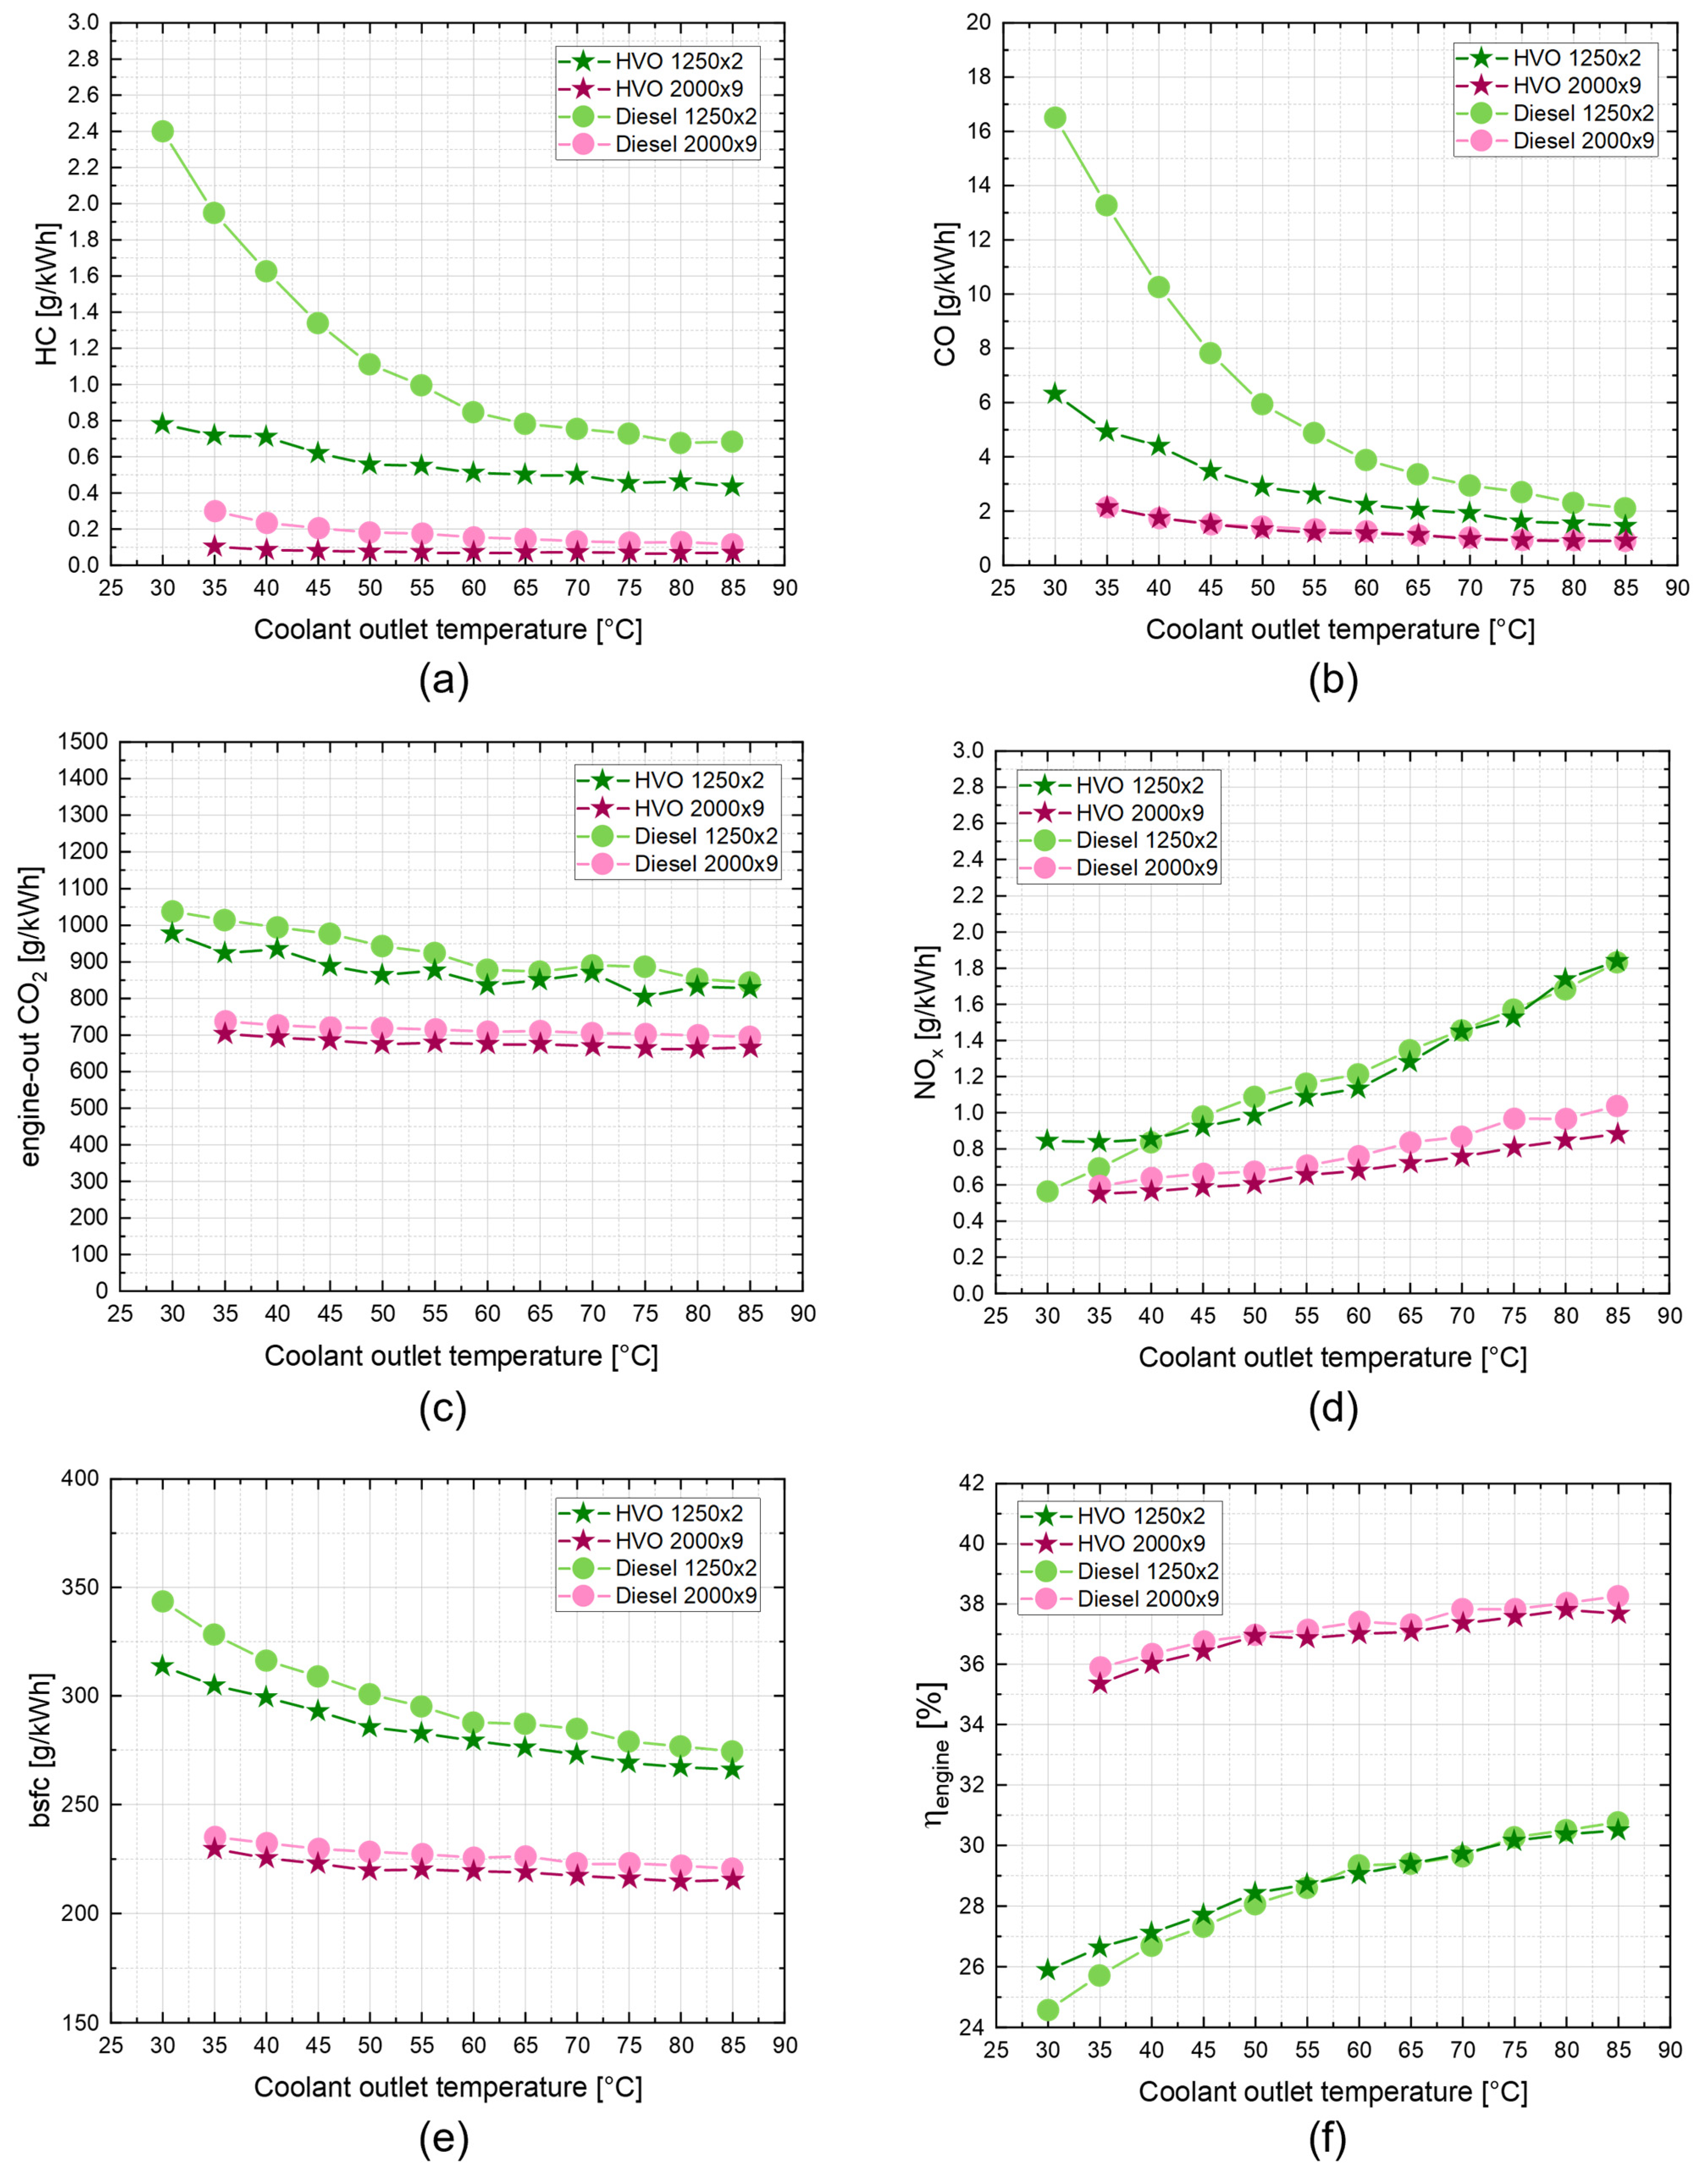
3.1.2. Effects on Exhaust Pollutant Emissions and Engine Performance
HC and CO Emissions
NOx Emissions
Fuel Consumption and Engine Thermal Efficiency
3.2. HVO vs. Conventional Diesel Oil: Calibration Parameter Sweep Tests (Test Type #2)
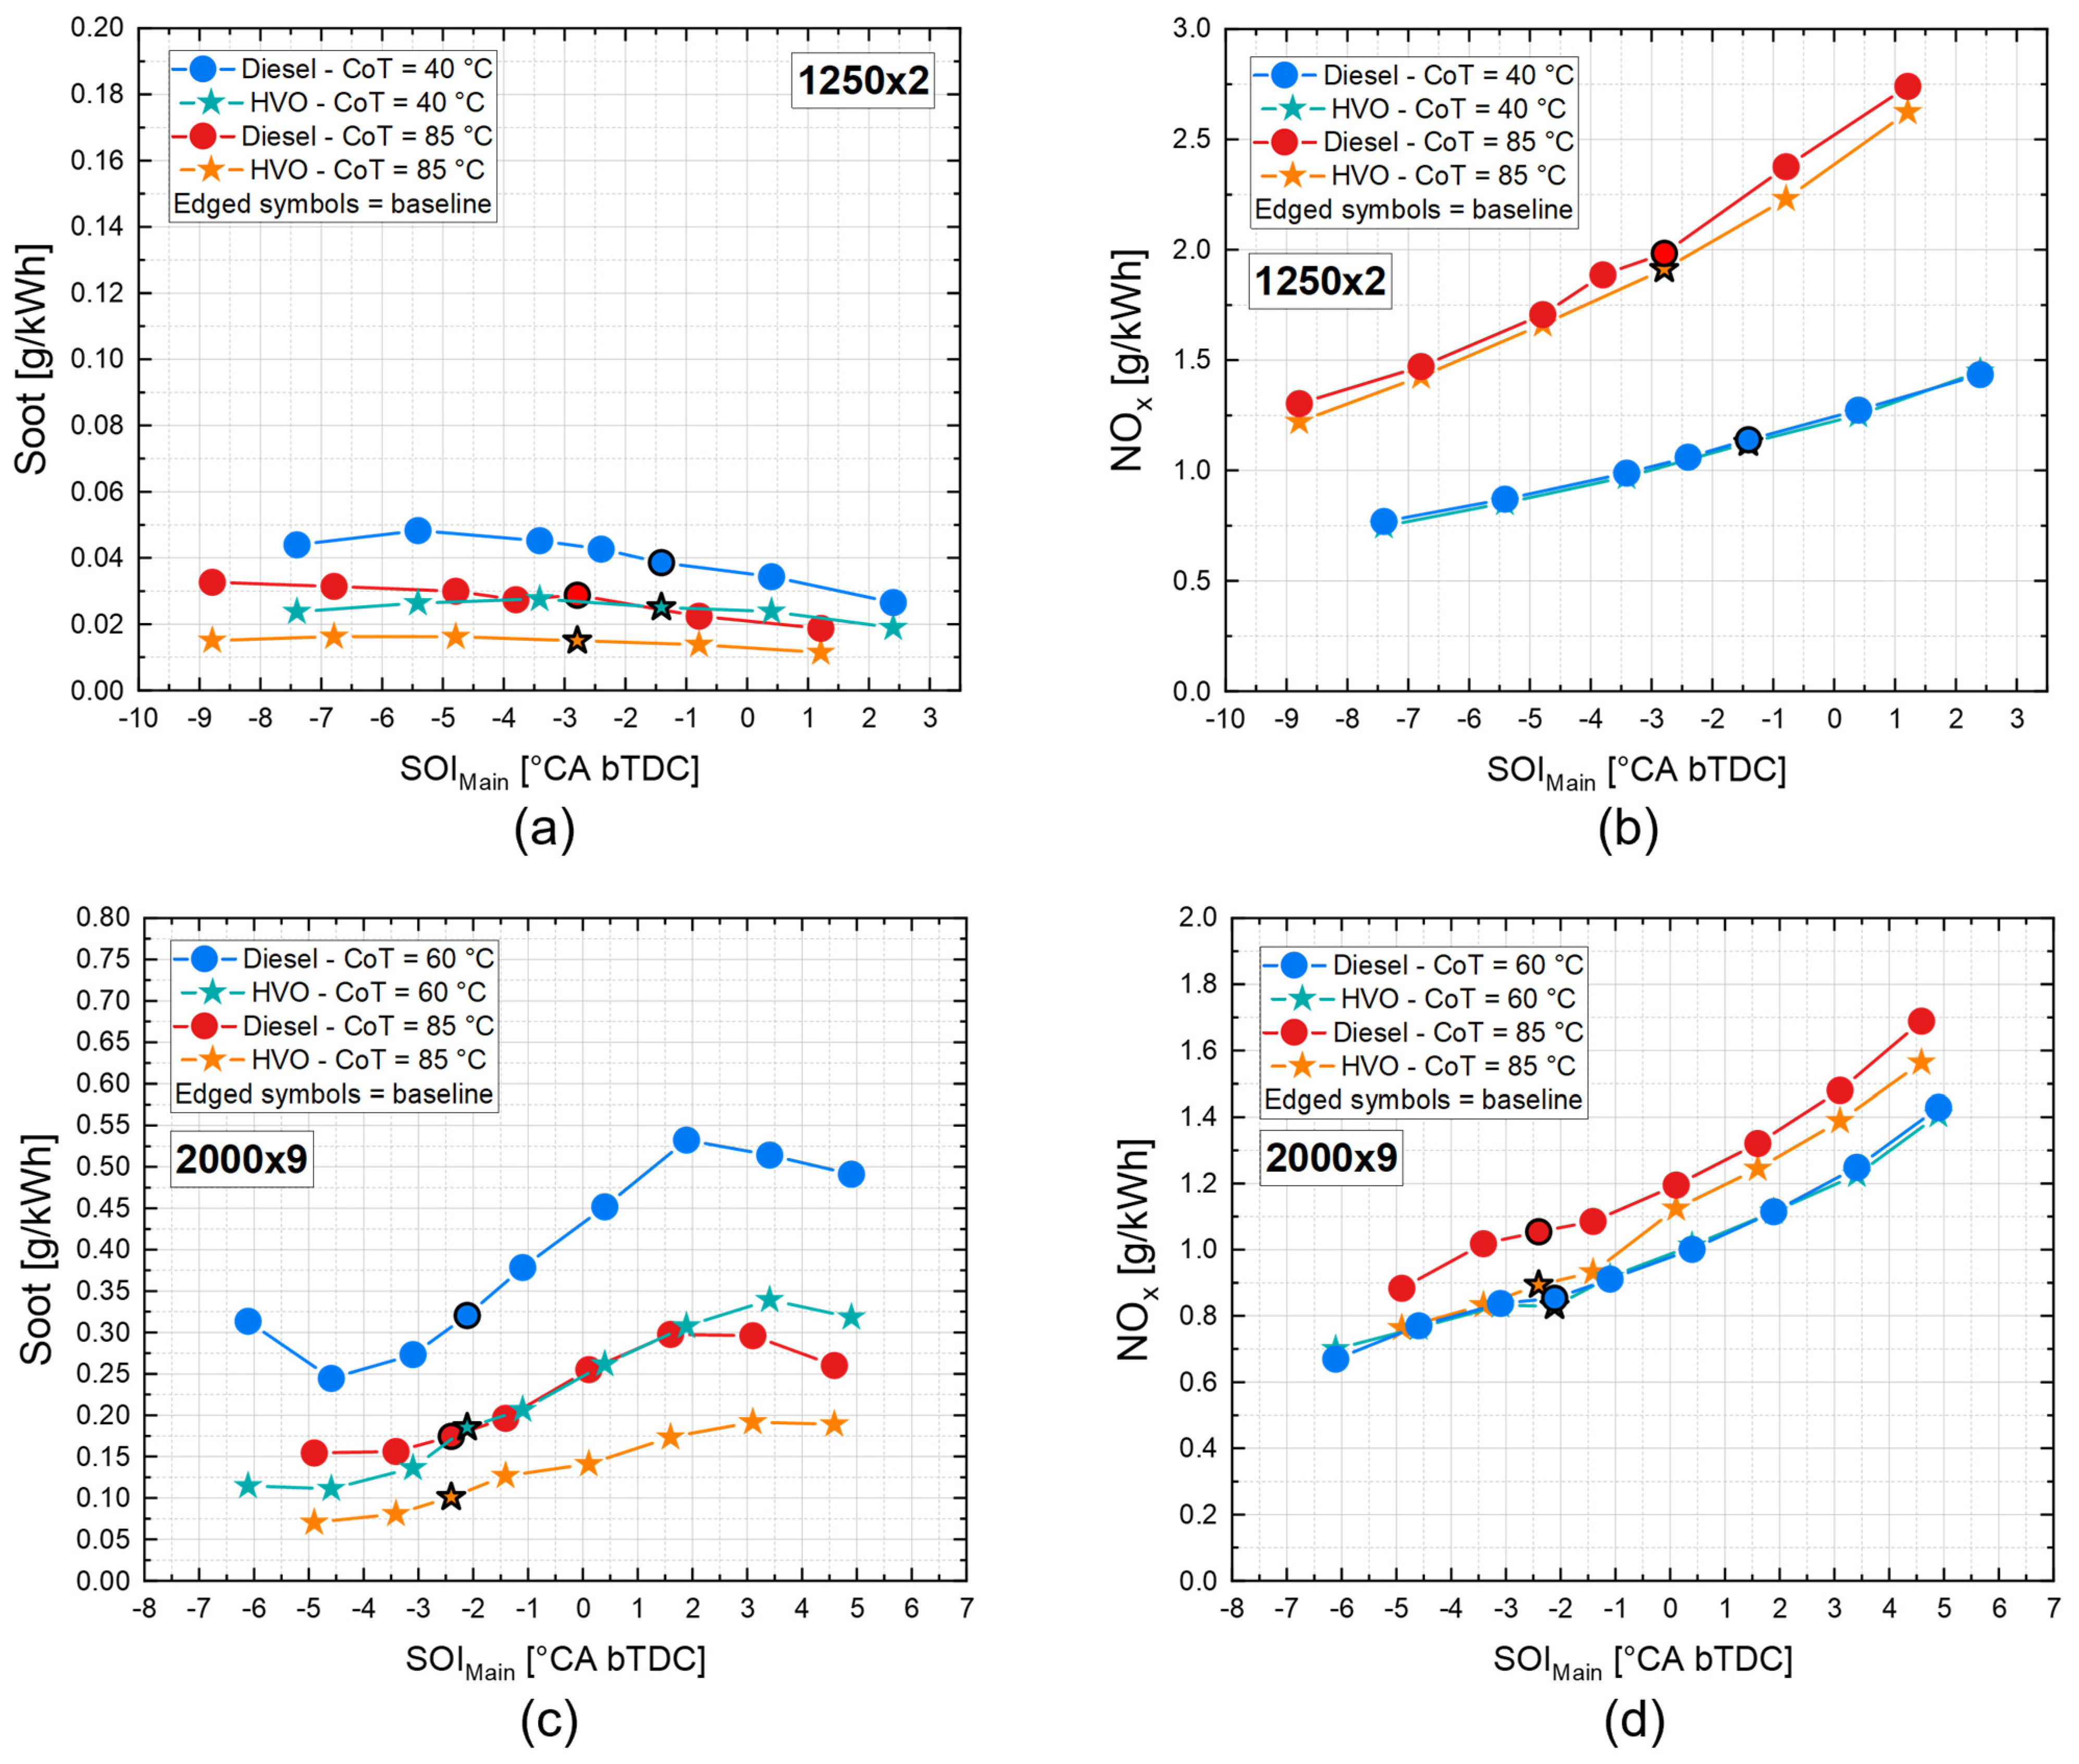
3.2.1. SOIMain Sweep
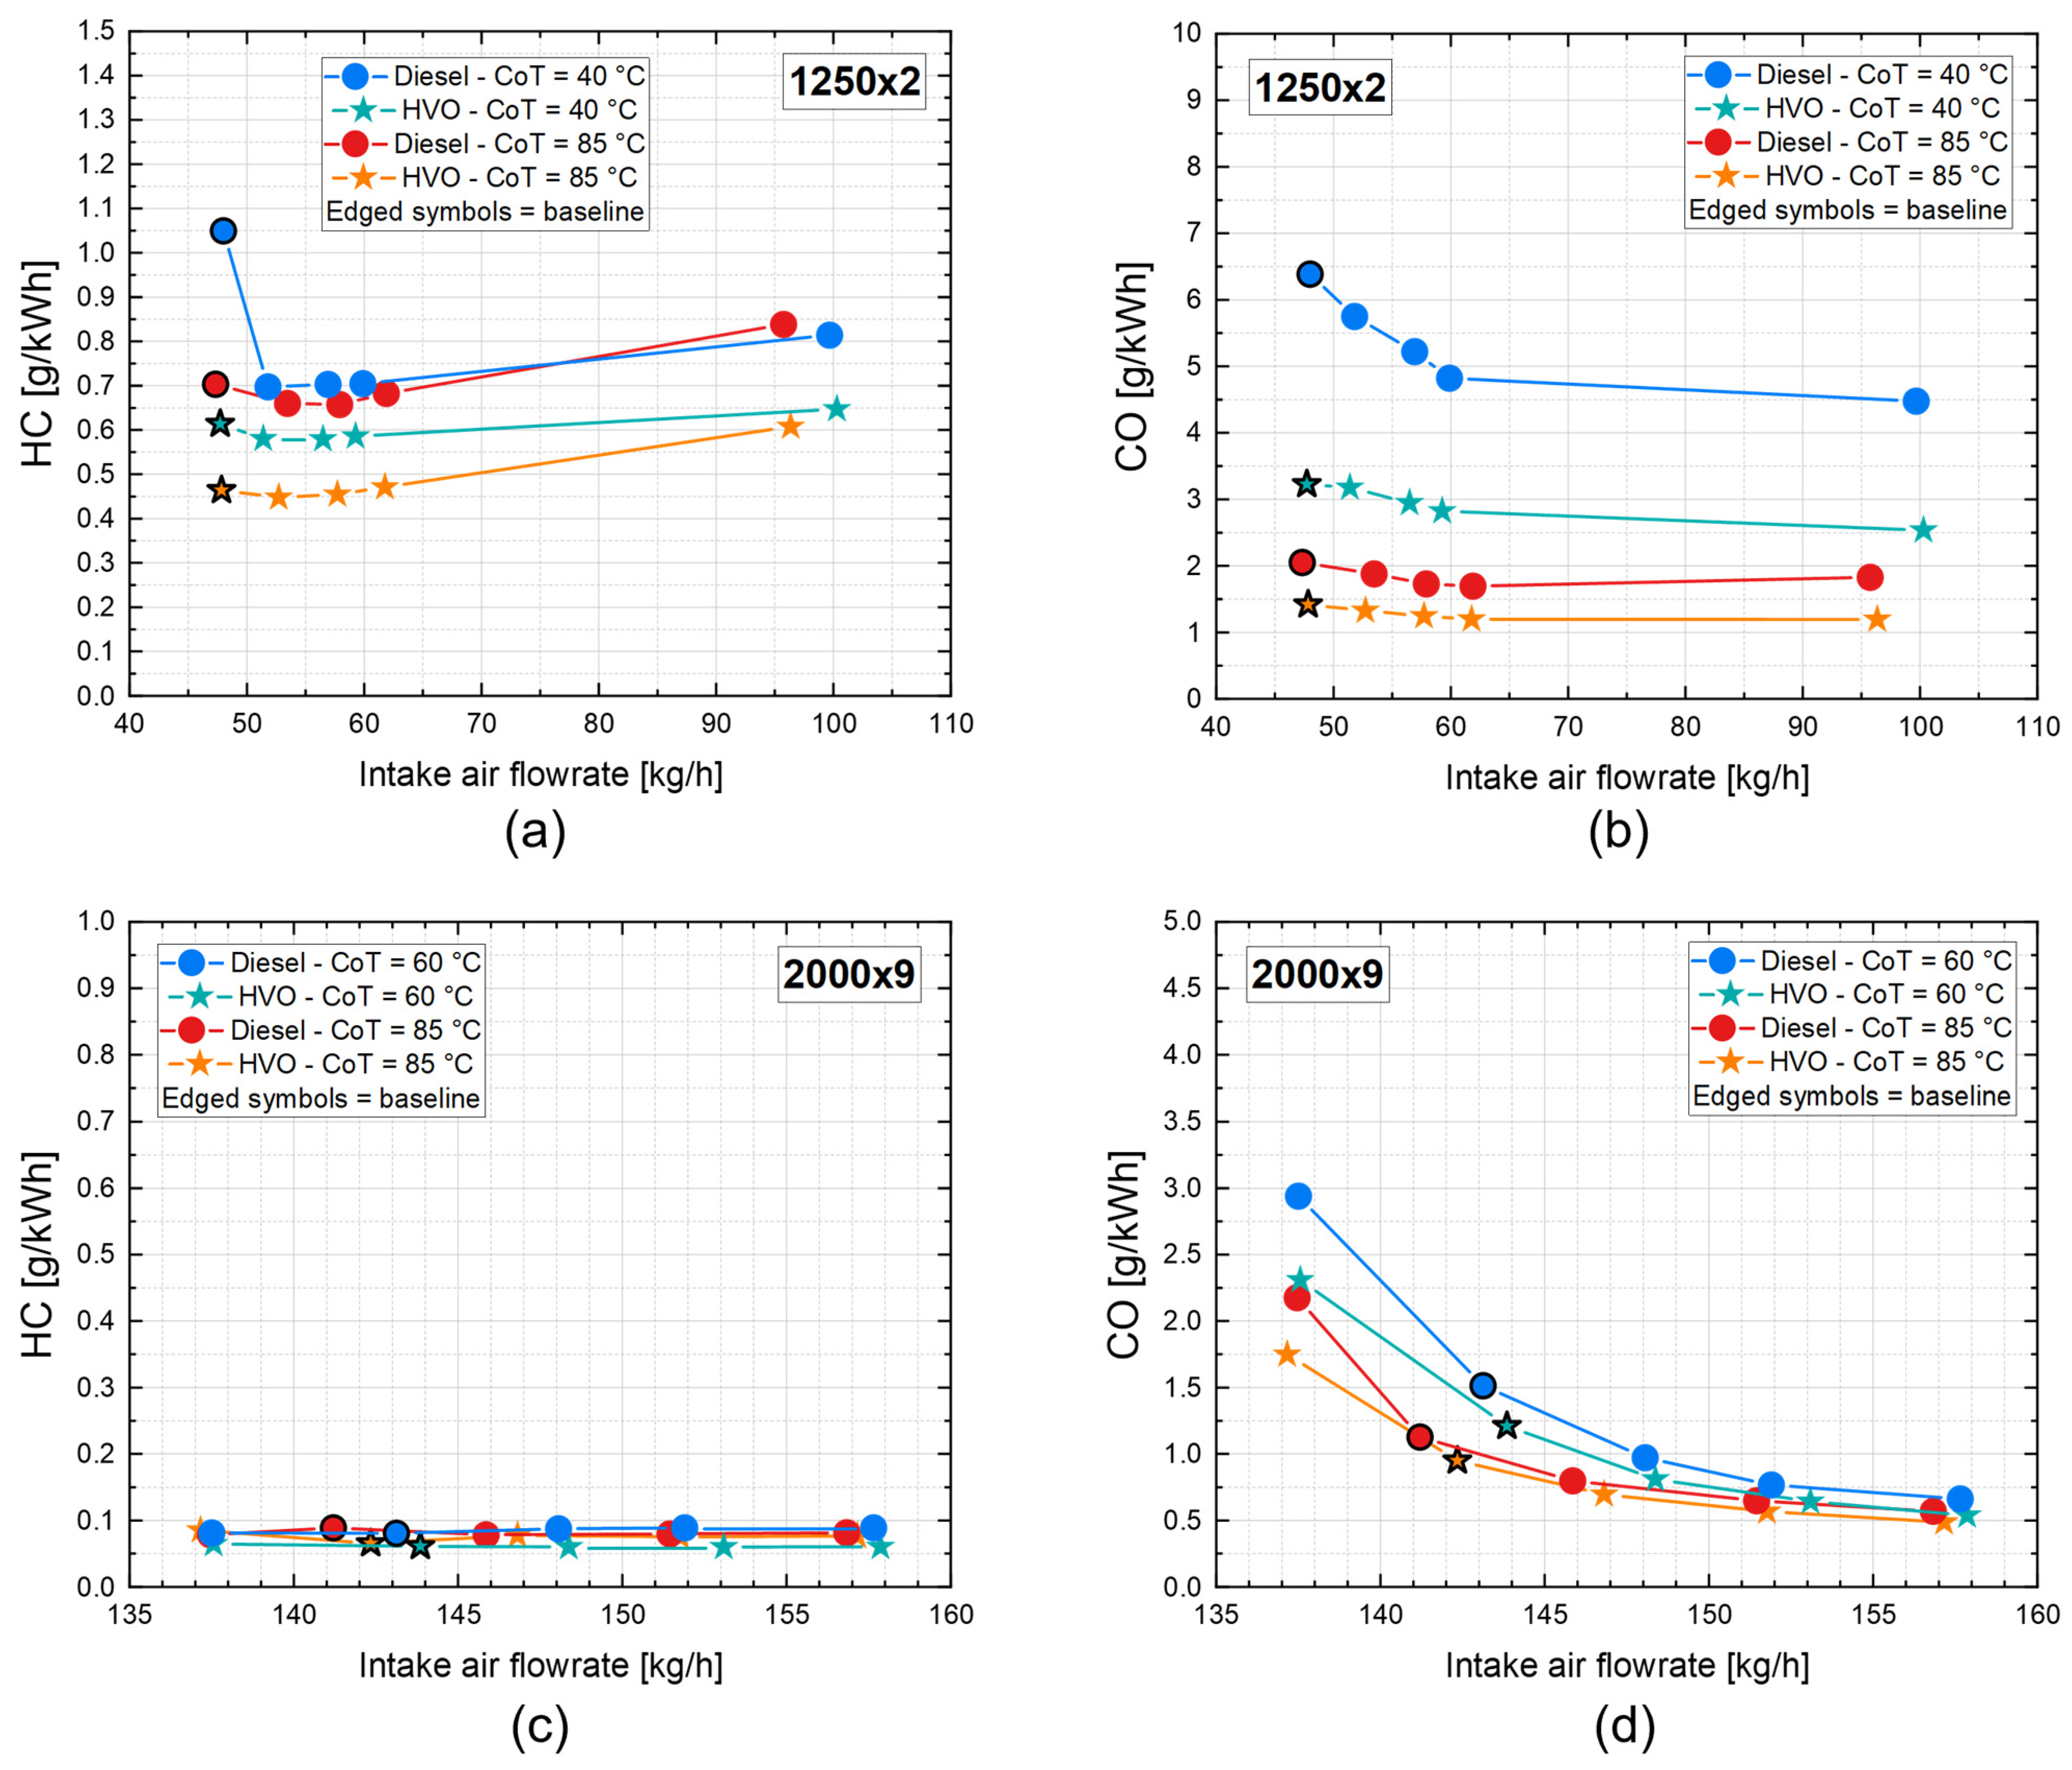
Engine-Out HC and CO Emissions
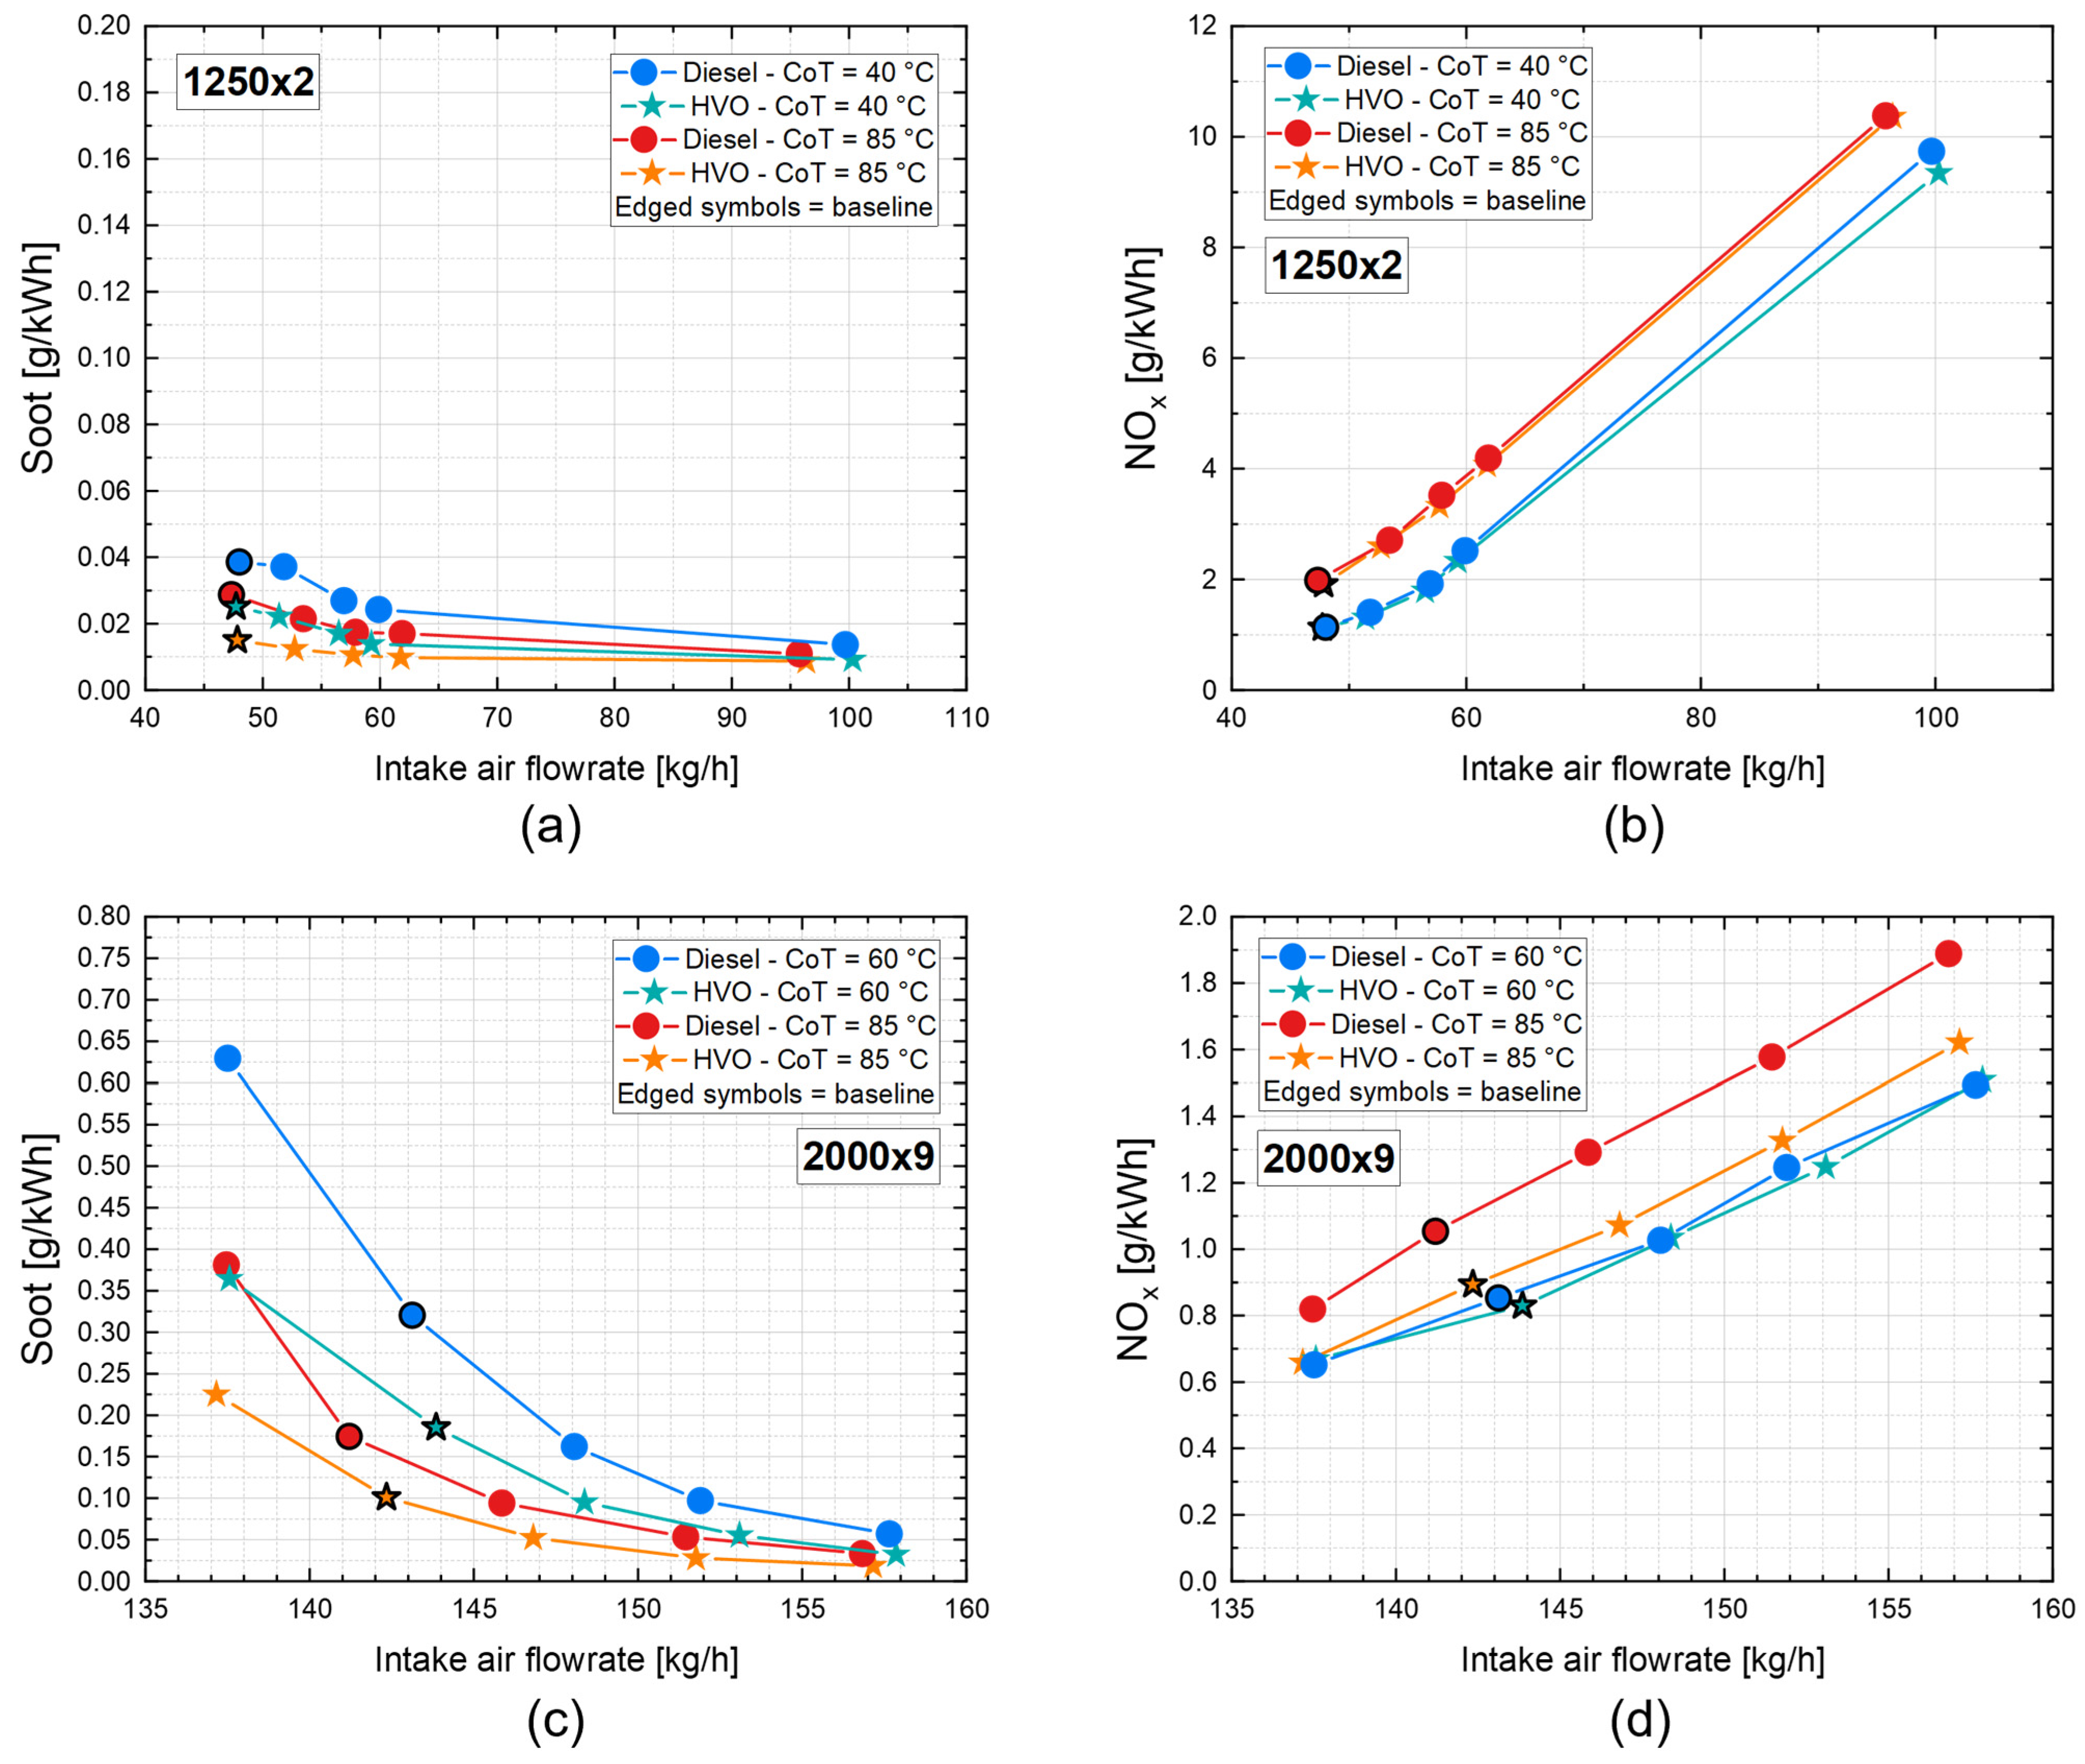
Engine-Out NOx and Soot Emissions
Engine Thermal Efficiency and Fuel Consumption
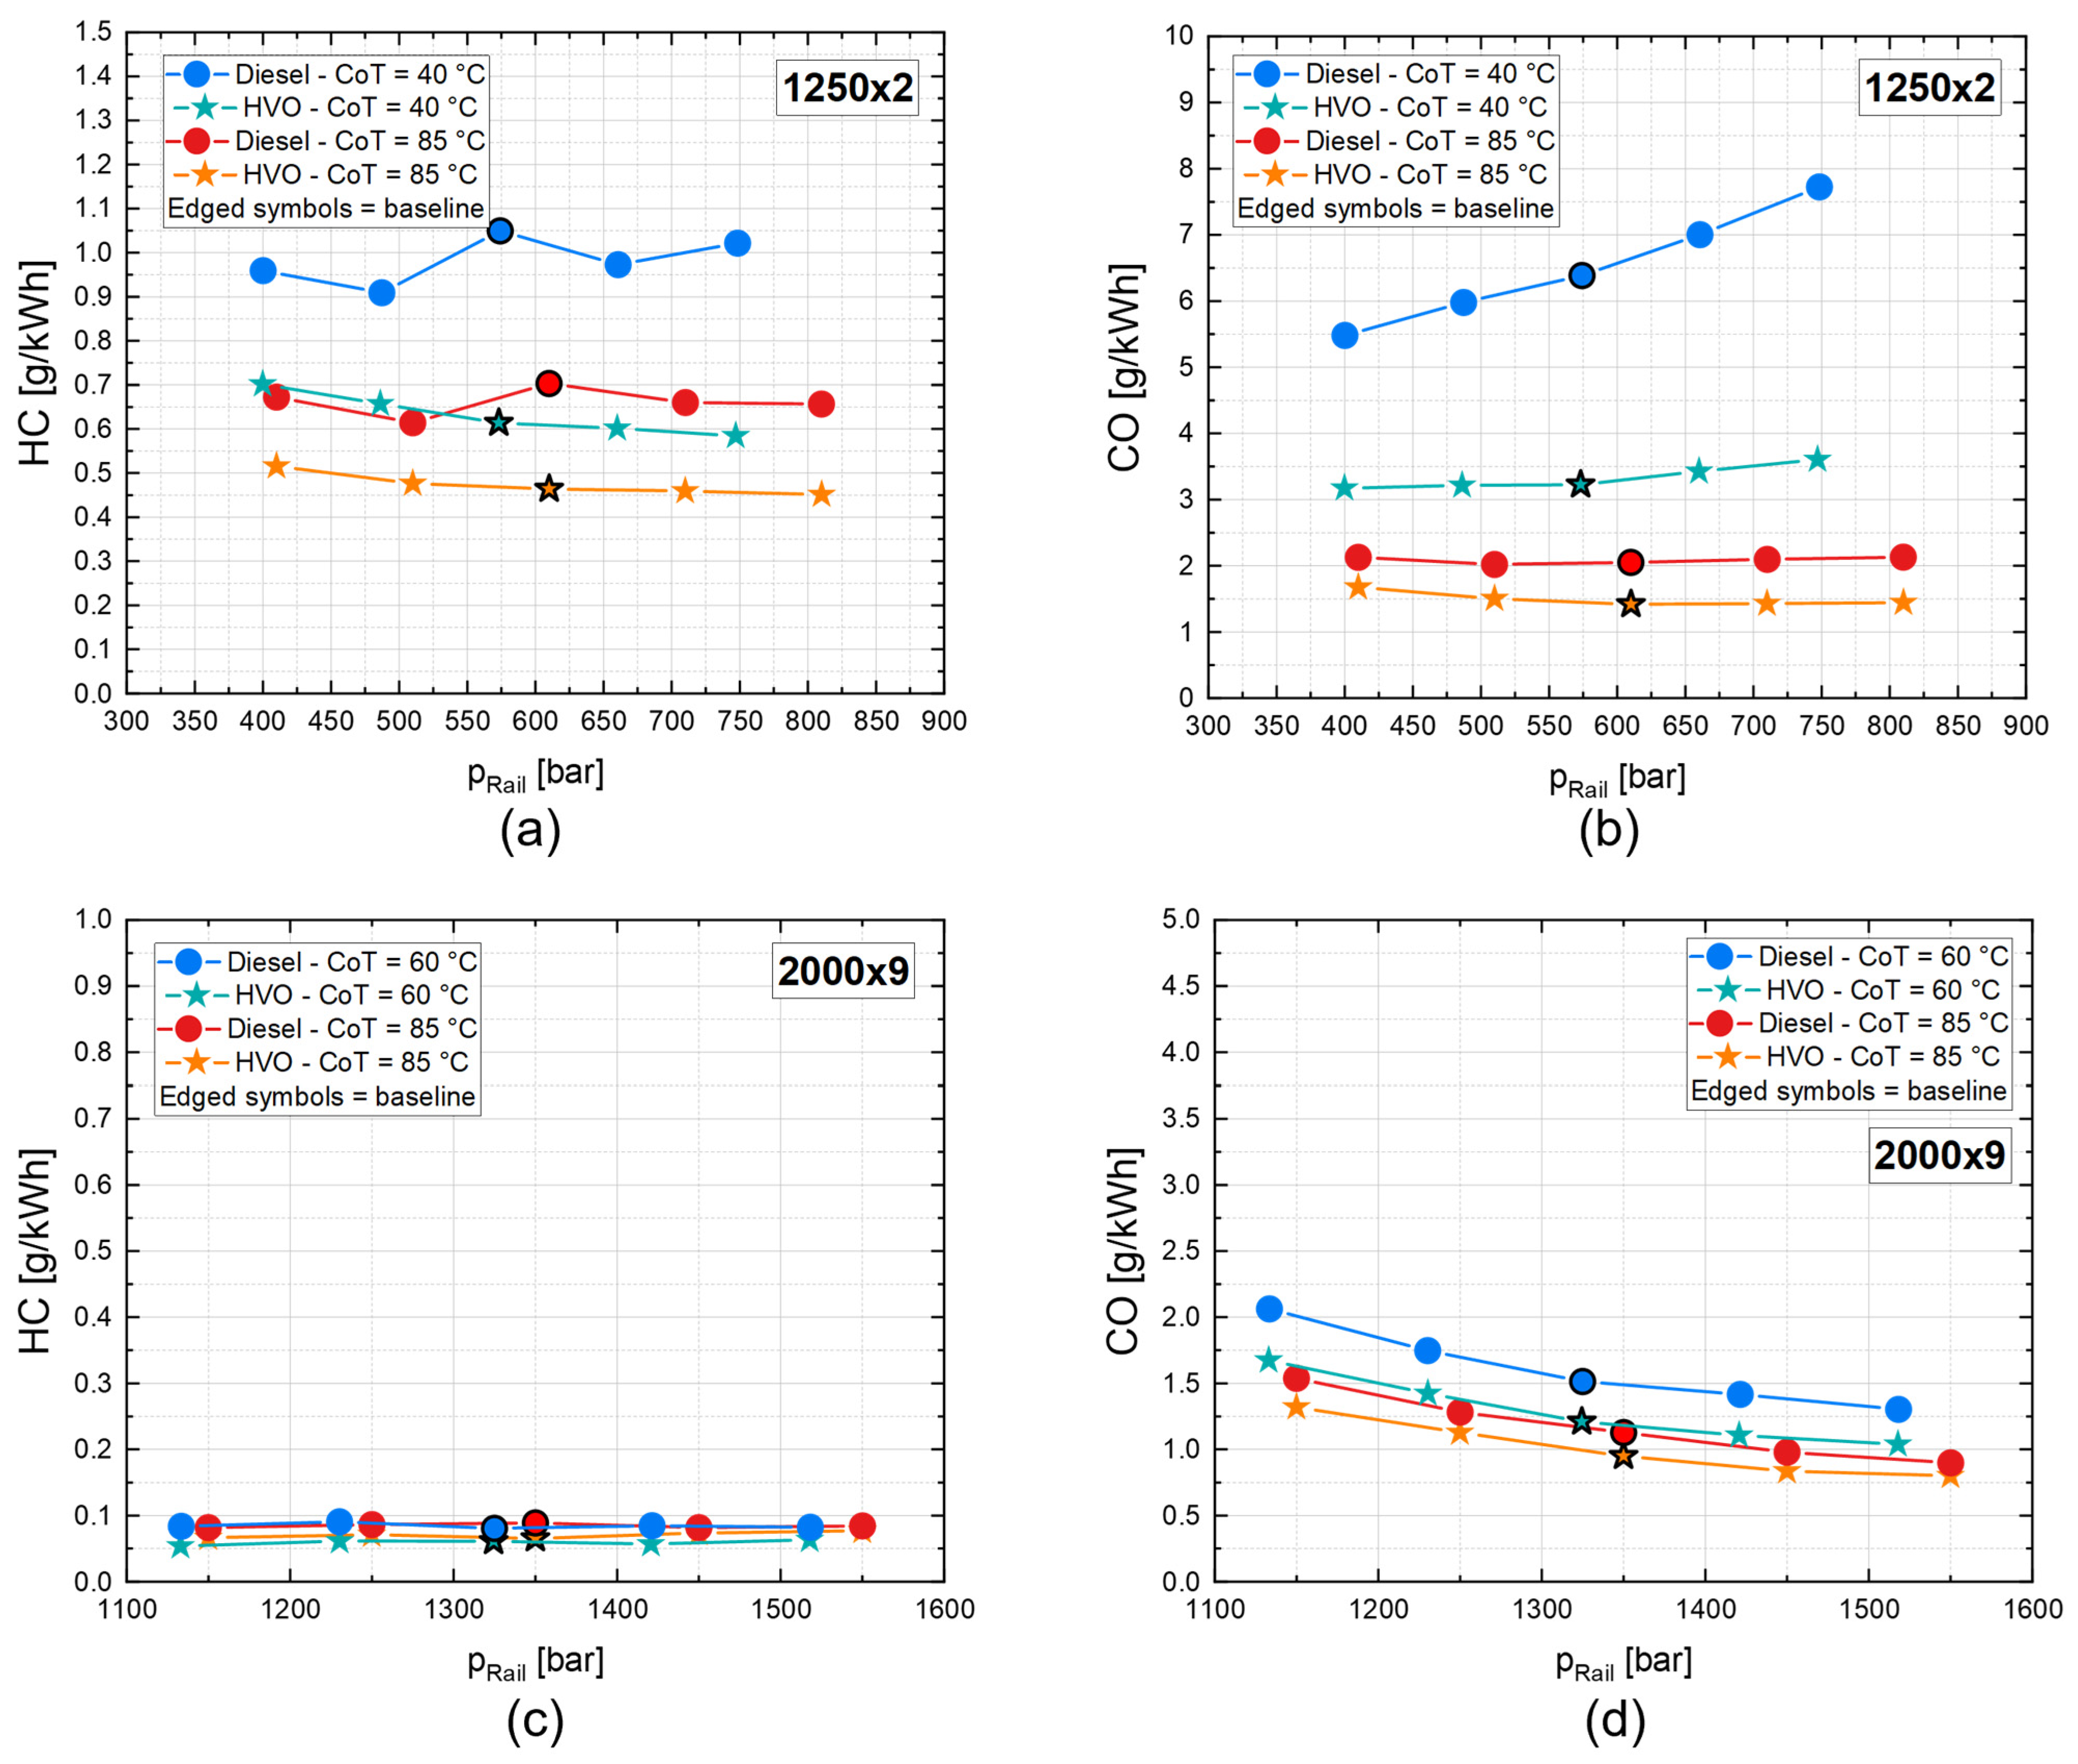
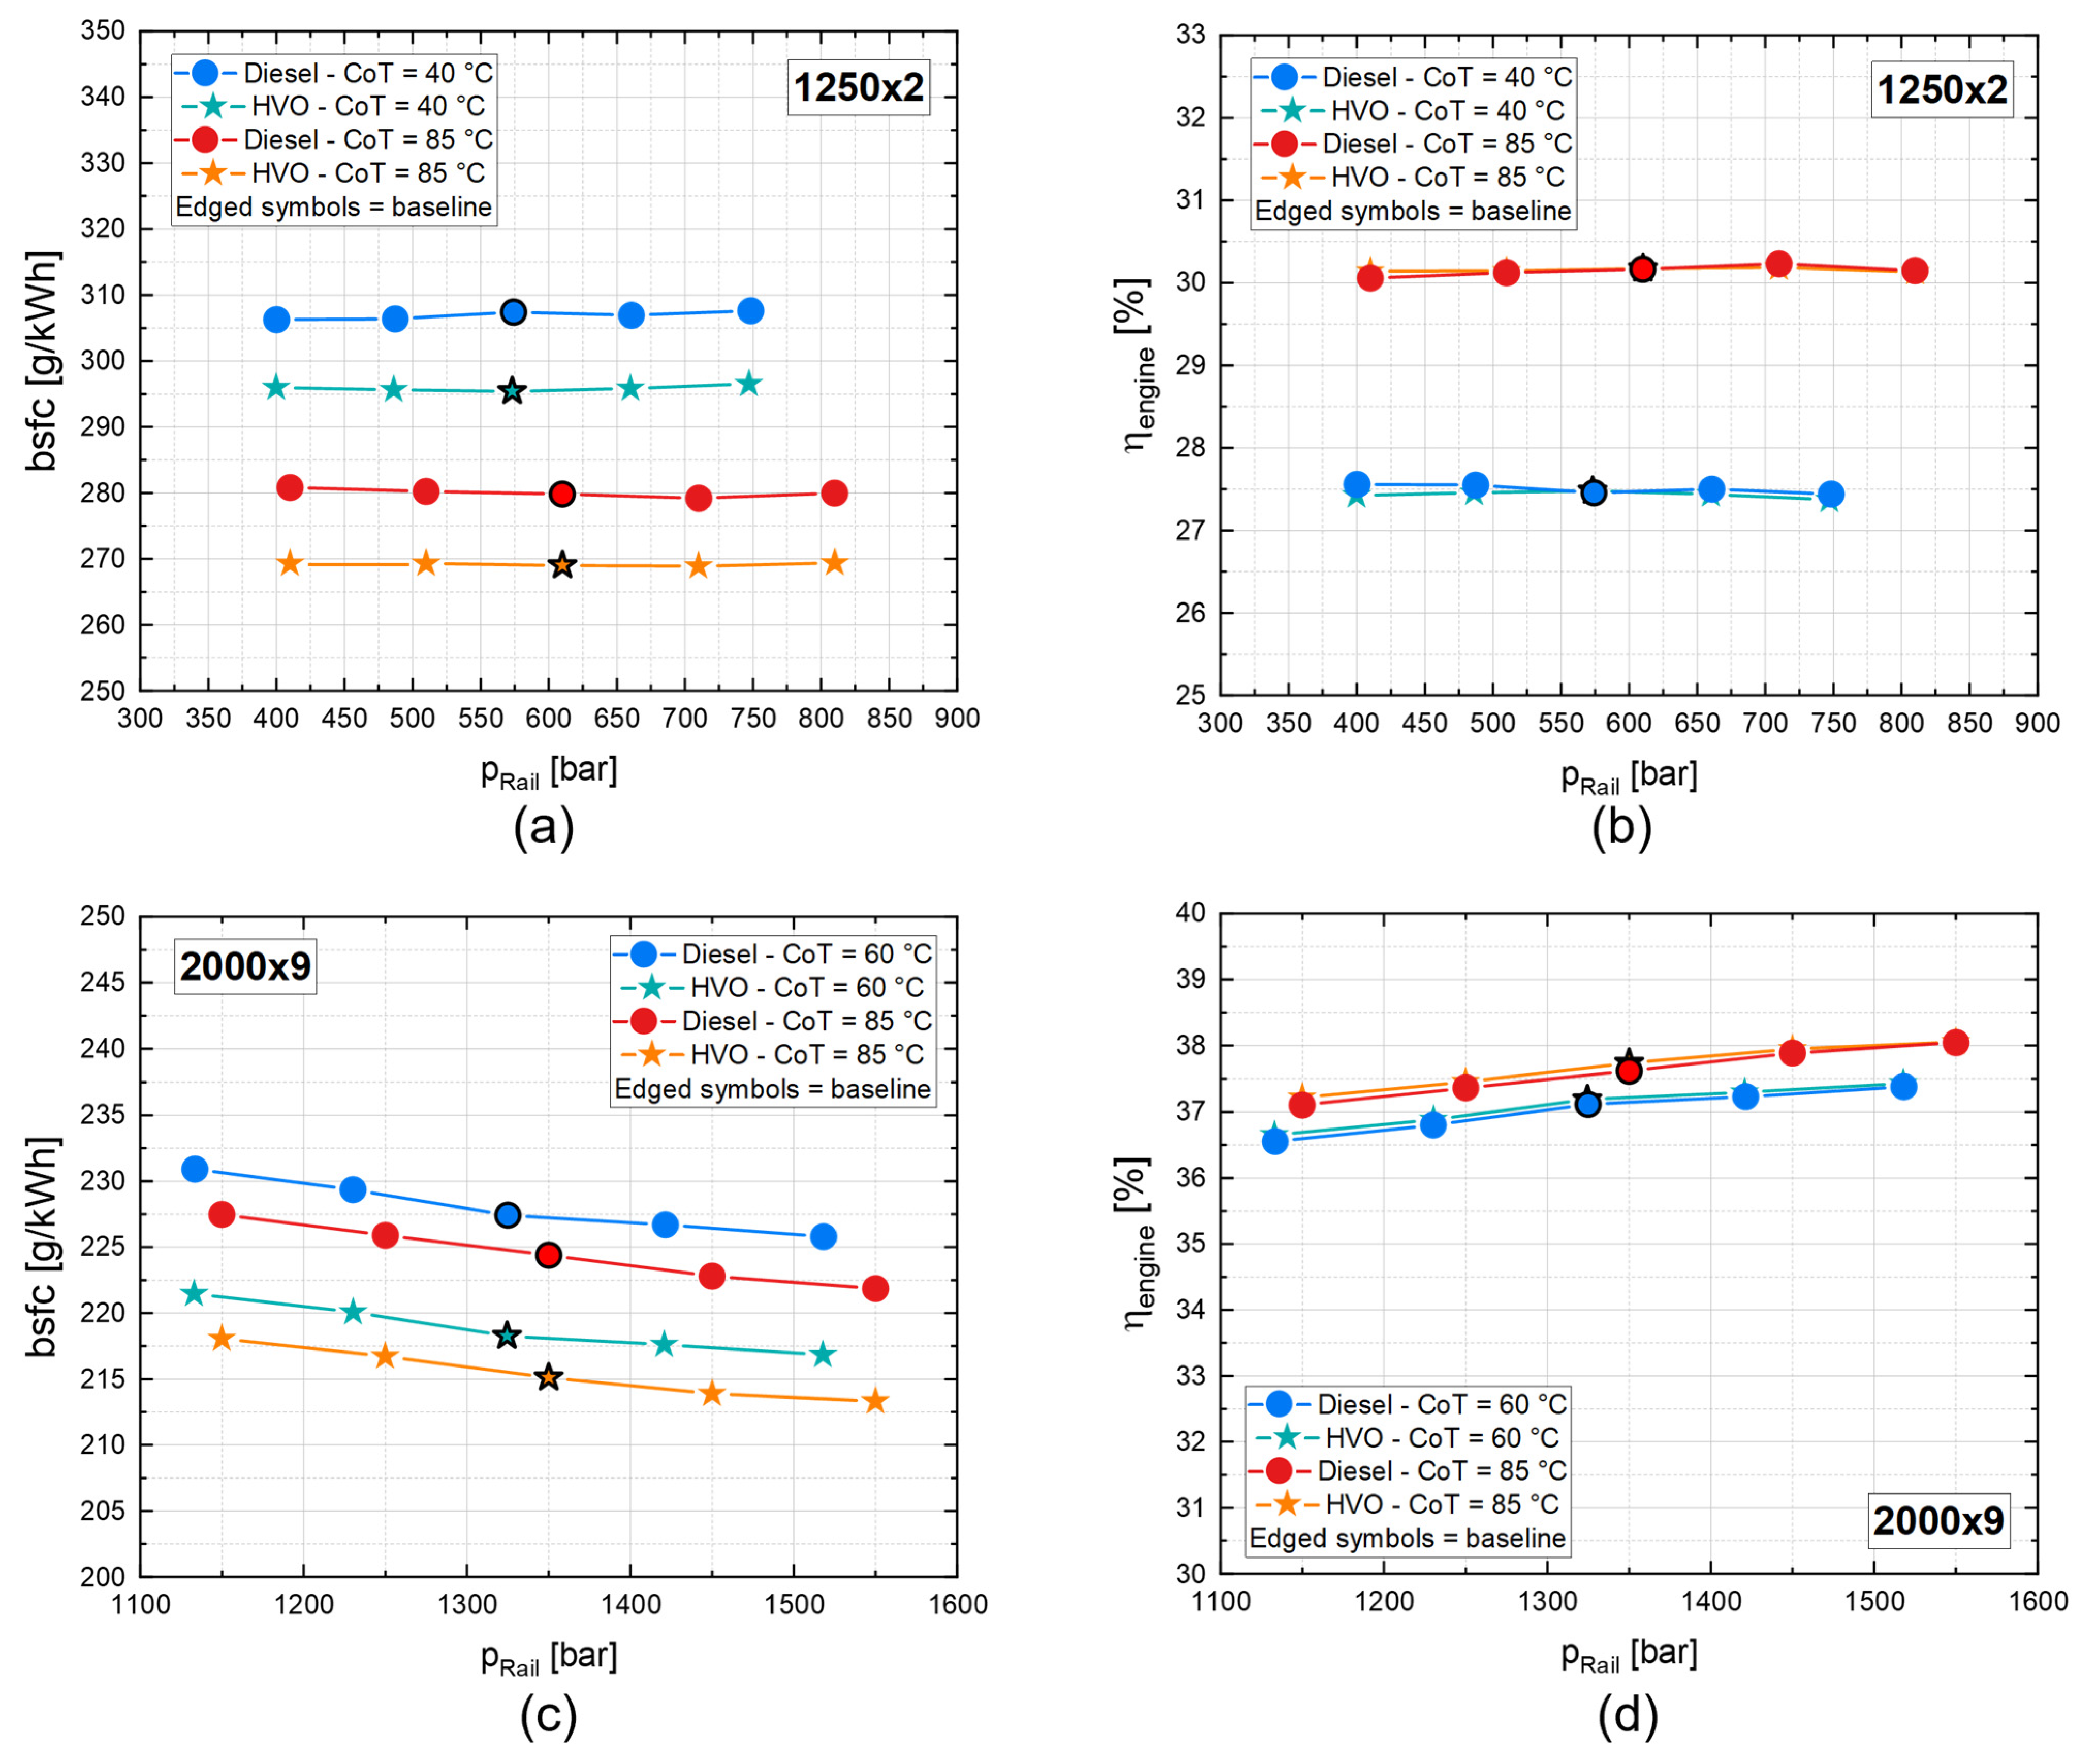
3.2.2. pRail Sweep
Engine-Out HC and CO Emissions
Engine-Out NOx and Soot Emissions
Engine Thermal Efficiency and Fuel Consumption
3.2.3. qair Sweep
Engine-Out HC and CO Emissions
Engine-Out NOx and Soot Emissions
Engine Thermal Efficiency and Fuel Consumption
4. Conclusions
Author Contributions
Funding
Data Availability Statement
Acknowledgments
Conflicts of Interest
Abbreviations
| ATS | After treatment system |
| bmeps | Brake mean effective pressure |
| bsfc | Brake specific fuel consumption |
| °CA | Crank angle degree |
| °CA aTDC | Crank angle degree after top dead center |
| °CA bTDC | Crank angle degree before top dead center |
| CI | Compression ignition |
| CoT | Coolant outlet temperature |
| DOC | Diesel oxidation catalyst |
| DPF | Diesel particulate filter |
| ECU | Electronic control unit |
| EGR | Exhaust gas recirculation |
| FAME | Fatty acid methyl esters |
| GHG | Greenhouse gas |
| HC | Unburned hydrocarbon |
| HP EGR | High pressure EGR |
| HVO | Hydrotreated Vegetable Oil |
| ID | Ignition delay |
| LP EGR | Low pressure EGR |
| Air mass flow rate | |
| MFB50 | Crank angle at 50% Mass Fraction Burned |
| mg/str | milligram per stroke |
| NOx | Nitrogen oxides |
| PID | Proportional, Integrative, Derivative |
| PM | Particulate matter |
| pRail | Rail fuel pressure |
| qair | Intake air quantity |
| SCR | Selective reduction catalyst |
| SOC | Start of combustion |
| SOIMain | Crank angle at which main injection star |
| VGT | Variable geometry turbine |
| ηengine | Engine thermal efficiency |
References
- Guo, Y.; Kelly, J.A.; Clinch, J.P. Road Transport Electrification—Is Timing Everything? Implications of Emissions Analysis’ Outcomes for Climate and Air Policy. Transp. Res. Interdiscip. Perspect. 2021, 12, 100478. [Google Scholar] [CrossRef]
- Kalghatgi, G. Is It Really the End of Internal Combustion Engines and Petroleum in Transport? Appl. Energy 2018, 225, 965–974. [Google Scholar] [CrossRef]
- Savickas, D.; Steponavičius, D.; Špokas, L.; Saldukaitė, L.; Semenišin, M. Impact of Combine Harvester Technological Operations on Global Warming Potential. Appl. Sci. 2021, 11, 8662. [Google Scholar] [CrossRef]
- Rimkus, A.; Žaglinskis, J.; Stravinskas, S.; Rapalis, P.; Matijošius, J.; Bereczky, Á. Research on the Combustion, Energy and Emission Parameters of Various Concentration Blends of Hydrotreated Vegetable Oil Biofuel and Diesel Fuel in a Compression-Ignition Engine. Energies 2019, 12, 2978. [Google Scholar] [CrossRef]
- Puricelli, S.; Cardellini, G.; Casadei, S.; Faedo, D.; van den Oever, A.E.M.; Grosso, M. A Review on Biofuels for Light-Duty Vehicles in Europe. Renew. Sustain. Energy Rev. 2021, 137, 110398. [Google Scholar] [CrossRef]
- Haines, A.; McMichael, A.J.; Smith, K.R.; Roberts, I.; Woodcock, J.; Markandya, A.; Armstrong, B.G.; Campbell-Lendrum, D.; Dangour, A.D.; Davies, M.; et al. Public Health Benefits of Strategies to Reduce Greenhouse-Gas Emissions: Overview and Implications for Policy Makers. Lancet 2009, 374, 2104–2114. [Google Scholar] [CrossRef]
- European Commission. Transport Emissions, Climate Action. Available online: https://ec.europa.eu/clima/policies/transport_en (accessed on 30 November 2022).
- Heywood, J.B. Internal Combustion Engine Fundamentals; McGraw-Hill Education: New York, NY, USA, 2018. [Google Scholar]
- Zeldovich, Y.B. 26. Oxidation of Nitrogen in Combustion and Explosions. In Selected Works of Yakov Borisovich Zeldovich; Princeton University Press: Princeton, NJ, USA, 2015; Volume I. [Google Scholar]
- Hiroyasu, H.; Arai, M.; Nakanishi, K. Soot Formation and Oxidation in Diesel Engines. In Proceedings of the 1980 Automotive Engineering Congress and Exposition, Detroit, MI, USA, 25 February 1980; SAE International: Warrendale, PA, USA, 1980. [Google Scholar]
- Malmborg, V.B.; Eriksson, A.C.; Shen, M.; Nilsson, P.; Gallo, Y.; Waldheim, B.; Martinsson, J.; Andersson, Ö.; Pagels, J. Evolution of In-Cylinder Diesel Engine Soot and Emission Characteristics Investigated with Online Aerosol Mass Spectrometry. Environ. Sci. Technol. 2017, 51, 1876–1885. [Google Scholar] [CrossRef]
- d’Ambrosio, S.; Mancarella, A.; Manelli, A.; Mittica, A.; Hardy, G. Experimental Analysis on the Effects of Multiple Injection Strategies on Pollutant Emissions, Combustion Noise, and Fuel Consumption in a Premixed Charge Compression Ignition Engine. SAE Int. J. Engines 2021, 14, 611. [Google Scholar] [CrossRef]
- D’Ambrosio, S.; Ferrari, A.; Mancarella, A.; Mancò, S.; Mittica, A. Comparison of the Emissions, Noise, and Fuel Consumption Comparison of Direct and Indirect Piezoelectric and Solenoid Injectors in a Low-Compression-Ratio Diesel Engine. Energies 2019, 12, 4023. [Google Scholar] [CrossRef]
- Reşitoğlu, I.A.; Altinişik, K.; Keskin, A. The Pollutant Emissions from Diesel-Engine Vehicles and Exhaust Aftertreatment Systems. Clean Technol. Environ. Policy 2015, 17, 15–27. [Google Scholar] [CrossRef]
- Cococcetta, F.; Finesso, R.; Hardy, G.; Marello, O.; Spessa, E. Implementation and Assessment of a Model-Based Controller of Torque and Nitrogen Oxide Emissions in an 11 L Heavy-Duty Diesel Engine. Energies 2019, 12, 4704. [Google Scholar] [CrossRef]
- d’Ambrosio, S.; Finesso, R.; Hardy, G.; Manelli, A.; Mancarella, A.; Marello, O.; Mittica, A. Model-Based Control of Torque and Nitrogen Oxide Emissions in a Euro VI 3.0 L Diesel Engine through Rapid Prototyping. Energies 2021, 14, 1107. [Google Scholar] [CrossRef]
- Malan, S.A.; Ventura, L.; Manelli, A. Cycle to Cycle Closed-Loop Combustion Control through Virtual Sensor in a Diesel Engine. In Proceedings of the 2021 29th Mediterranean Conference on Control and Automation (MED 2021), Puglia, Italy, 22–25 June 2021. [Google Scholar]
- Luo, X.; Wang, S.; de Jager, B.; Willems, P. Cylinder Pressure-Based Combustion Control with Multi-Pulse Fuel Injection. IFAC-PappersOnLine 2015, 28, 181–186. [Google Scholar] [CrossRef]
- Yin, L.; Turesson, G.; Tunestal, P.; Johansson, R. Model Predictive Control of an Advanced Multiple Cylinder Engine with Partially Premixed Combustion Concept. IEEE/ASME Trans. Mechatron. 2020, 25, 804–814. [Google Scholar] [CrossRef]
- Parravicini, M.; Barro, C.; Boulouchos, K. Experimental Characterization of GTL, HVO, and OME Based Alternative Fuels for Diesel Engines. Fuel 2021, 292, 120177. [Google Scholar] [CrossRef]
- Knothe, G. Biodiesel and Renewable Diesel: A Comparison. Prog. Energy Combust. Sci. 2010, 36, 364–373. [Google Scholar] [CrossRef]
- Bortel, I.; Vávra, J.; Takáts, M. Effect of HVO Fuel Mixtures on Emissions and Performance of a Passenger Car Size Diesel Engine. Renew. Energy 2019, 140, 680–691. [Google Scholar] [CrossRef]
- Krivopolianskii, V.; Bjørgen, K.O.P.; Emberson, D.; Ushakov, S.; Æsøy, V.; Løvås, T. Experimental Study of Ignition Delay, Combustion, and NO Emission Characteristics of Hydrogenated Vegetable Oil. SAE Int. J. Fuels Lubr. 2019, 12, 29–42. [Google Scholar] [CrossRef]
- Ohshio, N.; Saito, K.; Kobayashi, S.; Tanaka, S. Storage Stability of FAME Blended Diesel Fuels. In Proceedings of the Powertrains, Fuels and Lubricants Meeting, Chicago, IL, USA, 6–9 October 2008. SAE Technical Papers. [Google Scholar]
- Wei, X.F.; Meng, Q.; Kallio, K.J.; Olsson, R.T.; Hedenqvist, M.S. Ageing Properties of a Polyoxymethylene Copolymer Exposed to (Bio) Diesel and Hydrogenated Vegetable Oil (HVO) in Demanding High Temperature Conditions. Polym. Degrad. Stab. 2021, 185, 109491. [Google Scholar] [CrossRef]
- Athanasios, D.; Athanasios, D.; Stylianos, D.; Stella, B.; Samaras, Z. Emissions Optimization Potential of a Diesel Engine Running on HVO: A Combined Experimental and Simulation Investigation. In Proceedings of the 14th International Conference on Engines & Vehicles, Capri, Italy, 10–19 September 2019. SAE Technical Papers. [Google Scholar]
- Hartikka, T.; Kuronen, M.; Kiiski, U. Technical Performance of HVO (Hydrotreated Vegetable Oil) in Diesel Engines. In Proceedings of the SAE 2012 International Powertrains, Fuels & Lubricants Meeting, Heidelberg, Germany, 17–19 September 2012; SAE Technical Papers. Volume 9. [Google Scholar]
- Mittelbach, M. Fuels from Oils and Fats: Recent Developments and Perspectives. Eur. J. Lipid Sci. Technol. 2015, 117, 1832–1846. [Google Scholar] [CrossRef]
- Suarez-Bertoa, R.; Kousoulidou, M.; Clairotte, M.; Giechaskiel, B.; Nuottimäki, J.; Sarjovaara, T.; Lonza, L. Impact of HVO Blends on Modern Diesel Passenger Cars Emissions during Real World Operation. Fuel 2019, 235, 1427–1435. [Google Scholar] [CrossRef]
- Dimitriadis, A.; Natsios, I.; Dimaratos, A.; Katsaounis, D.; Samaras, Z.; Bezergianni, S.; Lehto, K. Evaluation of a Hydrotreated Vegetable Oil (HVO) and Effects on Emissions of a Passenger Car Diesel Engine. Front. Mech. Eng. 2018, 4, 7. [Google Scholar] [CrossRef]
- Stumborg, M.; Wong, A.; Hogan, E. Hydroprocessed Vegetable Oils for Diesel Fuel Improvement. Bioresour. Technol. 1996, 56, 13–18. [Google Scholar] [CrossRef]
- Zeman, P.; Hönig, V.; Kotek, M.; Táborský, J.; Obergruber, M.; Mařík, J.; Hartová, V.; Pechout, M. Hydrotreated Vegetable Oil as a Fuel from Waste Materials. Catalysts 2019, 9, 337. [Google Scholar] [CrossRef]
- No, S.Y. Application of Hydrotreated Vegetable Oil from Triglyceride Based Biomass to CI Engines—A Review. Fuel 2014, 115, 88–96. [Google Scholar] [CrossRef]
- Bohl, T.; Smallbone, A.; Tian, G.; Roskilly, A.P. Particulate Number and NOx Trade-off Comparisons between HVO and Mineral Diesel in HD Applications. Fuel 2018, 215, 90–101. [Google Scholar] [CrossRef]
- Dobrzyńska, E.; Szewczyńska, M.; Pośniak, M.; Szczotka, A.; Puchałka, B.; Woodburn, J. Exhaust Emissions from Diesel Engines Fueled by Different Blends with the Addition of Nanomodifiers and Hydrotreated Vegetable Oil HVO. Environ. Pollut. 2020, 259, 113772. [Google Scholar] [CrossRef]
- Pflaum, H.; Hofmann, P.; Geringer, B.; Weissel, W. Potential of Hydrogenated Vegetable Oil (HVO) in a Modern Diesel Engine. In Proceedings of the Small Engine Technology Conference & Exposition, Niigata, Japan, 30 October 2010. SAE Technical Papers. [Google Scholar]
- d’Ambrosio, S.; Ferrari, A.; Mancarella, A.; Mittica, A. Effects of Rate-Shaped and Multiple Injection Strategies on Pollutant Emissions, Combustion Noise and Fuel Consumption in a Low Compression Ratio Diesel Engine. Int. J. Automot. Technol. 2020, 21, 197–214. [Google Scholar] [CrossRef]
- Botero, M.L.; Mosbach, S.; Kraft, M. Sooting Tendency of Paraffin Components of Diesel and Gasoline in Diffusion Flames. Fuel 2014, 126, 8–15. [Google Scholar] [CrossRef]
- Sugiyama, K.; Goto, I.; Kitano, K.; Mogi, K.; Honkanen, M. Effects of Hydrotreated Vegetable Oil (HVO) as Renewable Diesel Fuel on Combustion and Exhaust Emissions in Diesel Engine. SAE Int. J. Fuels Lubr. 2012, 5, 205–217. [Google Scholar] [CrossRef]
- d’Ambrosio, S.; Mancarella, A.; Manelli, A. Utilization of Hydrotreated Vegetable Oil (HVO) in a Euro 6 Dual-Loop EGR Diesel Engine: Behavior as a Drop-In Fuel and Potentialities along Calibration Parameter Sweeps. Energies 2022, 15, 7202. [Google Scholar] [CrossRef]
- Lodi, F.; Zare, A.; Arora, P.; Stevanovic, S.; Jafari, M.; Ristovski, Z.; Brown, R.J.; Bodisco, T. Combustion Analysis of a Diesel Engine during Warm up at Different Coolant and Lubricating Oil Temperatures. Energies 2020, 13, 3931. [Google Scholar] [CrossRef]
- Weiss, M.; Paffumi, E.; Clairotte, M.; Drossinos, Y.; Vlachos, T. Including Cold-Start Emissions in the Real-Driving Emissions (RDE) Test Procedure Effects; Joint Research Centre (JRC): Ispra, Italy, 2017. [Google Scholar]
- D’Ambrosio, S.; Finesso, R.; Spessa, E. Calculation of Mass Emissions, Oxygen Mass Fraction and Thermal Capacity of the Inducted Charge in SI and Diesel Engines from Exhaust and Intake Gas Analysis. Fuel 2011, 90, 152–166. [Google Scholar] [CrossRef]
- Jaroonjitsathian, S.; Saisirirat, P.; Sivara, K.; Tongroon, M.; Chollacoop, N. Effects of GTL and HVO Blended Fuels on Combustion and Exhaust Emissions of a Common-Rail Di Diesel Technology. In Proceedings of the SAE 2014 International Powertrain, Fuels & Lubricants Meeting, Birmingham, UK, 20–22 October 2014. SAE Technical Papers. [Google Scholar]
- Ventura, L.; Finesso, R.; Malan, S.A.; D’Ambrosio, S.; Manelli, A. Model-Based Design of Closed Loop Controllers of the Air-Path in a Heavy Duty Diesel Engine. In AIP Conference Proceedings; AIP Publishing LLC: Melville, NY, USA, 2019; Volume 2191, p. 020152. [Google Scholar]
- Finesso, R.; Hardy, G.; Maino, C.; Marello, O.; Spessa, E. A New Control-Oriented Semi-Empirical Approach to Predict Engine-out NOx Emissions in a Euro VI 3.0 L Diesel Engine. Energies 2017, 10, 1978. [Google Scholar] [CrossRef]
- Singh, D.; Subramanian, K.A.; Garg, M.O. Comprehensive Review of Combustion, Performance and Emissions Characteristics of a Compression Ignition Engine Fueled with Hydroprocessed Renewable Diesel. Renew. Sustain. Energy Rev. 2018, 81, 2947–2954. [Google Scholar] [CrossRef]
- Tauzia, X.; Maiboom, A.; Karaky, H.; Chesse, P. Experimental Analysis of the Influence of Coolant and Oil Temperature on Combustion and Emissions in an Automotive Diesel Engine. Int. J. Engine Res. 2019, 20, 247–260. [Google Scholar] [CrossRef]
- Opat, R.; Ra, Y.; Gonzalez D, M.A.; Krieger, R.; Reitz, R.D.; Foster, D.E.; Durrett, R.P.; Siewert, R.M. Investigation of Mixing and Temperature Effects on HC/CO Emissions for Highly Dilute Low Temperature Combustion in a Light Duty Diesel Engine. In Proceedings of the SAE World Congress & Exhibition, Detroit, MI, USA, 16–19 April 2007. SAE Technical Papers. [Google Scholar]


| Number of cylinders | 4 |
| Displacement | 2.3 L |
| Compression ratio | ~16:1 |
| Valves per cylinder | 4 |
| Turbocharger | Single-stage VGT |
| Fuel injection system | Common-rail injection system |
| EGR circuit type | Dual-loop, water-cooled |
| Composition of the Gas Calibration Cylinder and Extended Uncertainty | |
|---|---|
| NO (lower range) [ppm] | 89.7 ± 1.7 |
| NO (higher range) [ppm] | 919 ± 18 |
| CO (lower range) [ppm] | 4030 ± 79 |
| CO (higher range) [%] | 8.370 ± 0.097 |
| CO2 (lower range) [ppm] | 4.980 ± 0.067 |
| CO2 (higher range) [%] | 16.78 ± 0.15 |
| C3H8 (lower range) [ppm] | 88.8 ± 1.8 |
| C3H8 (higher range) [ppm] | 1820 ± 36 |
| Measurement Errors of Emission Analyzers | |
|---|---|
| Linearity | ≤1% of full-scale range ≤2% of measured value whichever is smaller |
| Drift 24 h | ≤1% of full-scale range |
| Reproducibility | ≤0.5% of full-scale range |
| Parameter | Unit | EN590 Diesel | HVO |
|---|---|---|---|
| Density at 15 °C | kg/m3 | 830.6 | 777.8 |
| Kinematic viscosity | mm2/s | 2.969 | 2.646 |
| Dynamic viscosity | Pa·s | 2.47 × 10⁻³ | 2.06 × 10⁻³ |
| Cetane number | - | 54.6 | 79.6 |
| Monoaromatic | %v/v | 20.1 | 0.50 |
| Polyaromatic | %v/v | 3.00 | 0 |
| Total aromatic | %v/v | 23.1 | 0 |
| Flammability | °C | 74.0 | 60.5 |
| Lower heating value | MJ/kg | 42.65 | 44.35 |
| Hydrogen | %m/m | 13.72 | 15.00 |
| Carbon | %m/m | 85.67 | 85.00 |
| Oxygen | %m/m | 0.61 | 0 |
| Sulphur | mg/kg | 6.50 | 0.53 |
| FAME | %v/v | 5.00 | 0.05 |
| Approx. formula | - | C13H24O0.06 | C13H28 |
| SOIMain | pRail | qair | |
|---|---|---|---|
| [°CA bTDC] | [mbar] | [mg/str] | |
| 1250 × 2 HOT | −2.8 | 610 | 316 |
| 1250 × 2 COLD | −1.4 | 570 | 316 |
| 2000 × 9 HOT | −2.4 | 1350 | 590 |
| 2000 × 9 COLD | −2.1 | 1320 | 595 |
Disclaimer/Publisher’s Note: The statements, opinions and data contained in all publications are solely those of the individual author(s) and contributor(s) and not of MDPI and/or the editor(s). MDPI and/or the editor(s) disclaim responsibility for any injury to people or property resulting from any ideas, methods, instructions or products referred to in the content. |
© 2022 by the authors. Licensee MDPI, Basel, Switzerland. This article is an open access article distributed under the terms and conditions of the Creative Commons Attribution (CC BY) license (https://creativecommons.org/licenses/by/4.0/).
Share and Cite
Mancarella, A.; Marello, O. Effect of Coolant Temperature on Performance and Emissions of a Compression Ignition Engine Running on Conventional Diesel and Hydrotreated Vegetable Oil (HVO). Energies 2023, 16, 144. https://doi.org/10.3390/en16010144
Mancarella A, Marello O. Effect of Coolant Temperature on Performance and Emissions of a Compression Ignition Engine Running on Conventional Diesel and Hydrotreated Vegetable Oil (HVO). Energies. 2023; 16(1):144. https://doi.org/10.3390/en16010144
Chicago/Turabian StyleMancarella, Alessandro, and Omar Marello. 2023. "Effect of Coolant Temperature on Performance and Emissions of a Compression Ignition Engine Running on Conventional Diesel and Hydrotreated Vegetable Oil (HVO)" Energies 16, no. 1: 144. https://doi.org/10.3390/en16010144
APA StyleMancarella, A., & Marello, O. (2023). Effect of Coolant Temperature on Performance and Emissions of a Compression Ignition Engine Running on Conventional Diesel and Hydrotreated Vegetable Oil (HVO). Energies, 16(1), 144. https://doi.org/10.3390/en16010144