Article

Effect of Nonlinear Spring Characteristics on the Efficiency of Free-Piston Engine Generator

1
Faculty of Engineering, Shinshu University, Nagano 380-8553, Japan
2
Department of Mechanical Engineering, College of Engineering, Kanazawa Institute of Technology, Nonoichi 921-8501, Japan
*
Authors to whom correspondence should be addressed.
Energies 2022, 15(20), 7579; https://doi.org/10.3390/en15207579
Submission received: 15 August 2022 / Revised: 30 September 2022 / Accepted: 11 October 2022 / Published: 14 October 2022
(This article belongs to the Special Issue Trends and Prospects in a New Generation of Engines and Powertrains)

Abstract

:
Piston motion is an important factor in improving the energy conversion efficiency of free-piston engine generators (FPEGs), and an air cylinder is an important component affecting piston motion. In this study, the effect of the air cylinder specifications on the piston drive frequency and energy conversion efficiency is clarified. By considering that the repulsion force of an air cylinder is nonlinear, the main factors that change the piston drive frequency were investigated by simulation. In addition, a piston drive frequency diagram was drawn based on the top surface area of the air cylinder and the compression ratio to discuss the effect of the air cylinder specifications on the piston drive frequency. The results indicate that the air cylinder specifications affect the piston drive frequency and generation force of a linear machine. Moreover, the structure of the air cylinder and the constraints on the maximum generation force of the linear machine narrow the possible operating range in the piston drive frequency. The air cylinder specifications based on the piston drive frequency diagram improved the FPEG energy conversion efficiency by 0.5%.

1. Introduction

Low-carbon policies are being supported worldwide to minimize greenhouse gas emissions, particularly CO2 [1,2]. A rotary generator powered by a traditional crankshaft engine is a conventional engine generator [3,4]. However, the high cost of fuel, which is a result of fossil fuel depletion and increased CO2 emissions, has prompted the development of more efficient energy conversion devices. Researchers have designed free-piston engine generators (FPEGs) as a highly efficient energy conversion technology [5,6].
The reciprocating motion of the piston, driven by the power of the internal combustion engine, creates electricity for FPEGs [7]. In FPEGs without a crank mechanism, the piston motion can be changed. As a result, the compression ratio (CR) can be changed to accommodate a variety of fuels, including hydrogen, which is a zero-carbon alternative fuel [8,9,10]. In addition, FPEGs have advantages such as reduced frictional loss because they have no crank mechanism [11,12] and improved thermal efficiency by varying the piston motion [13,14,15]. However, controlling the piston motion between the top dead center (TDC) and the bottom dead center (BDC) is difficult because FPEGs have no mechanical limits.
The TDC is an important parameter of FPEGs because the variation in TDC produces uncertainty in a stable operation [16,17]. A magnetoelectric load control technique was proposed by Yang et al. [16], which used the difference between the real-time CR and the predefined CR as the error signal. The simulation results state that the magnetoelectric load control technique allowed the FPEG to stabilize by adjusting the magnetoelectric force according to the received error signal. In addition, switching control strategies between motoring and power generation modes have been studied. A gradual switching strategy was proposed by Guo et al. [18], which could help achieve a gradual change in the piston parameters (piston TDC, peak piston velocity, and in-cylinder peak gas pressure) between the motoring and power generation modes.
The engine efficiency and electrical efficiencies are about 40% and 90%, respectively. Therefore, the improvement of the energy conversion efficiency by improving the engine efficiency is remarkable [19]. To improve engine efficiency, the piston drive frequency must be set appropriately [13,19]. Piston motion, including piston drive frequency, is affected by piston mass, spring stiffness, and engine combustion force [20,21]. Yuan et al. [20] reported that for the same injection position in a single-cylinder FPEG with a mechanical spring, increasing the stiffness of the spring increases the piston drive frequency, which is beneficial for increasing the thermal efficiency of the engine. However, too high spring stiffness resulting in higher NO and soot emissions has been confirmed. Xu et al. [21] determined the effects of piston mass, air cylinder pressure, and intake position on the piston drive frequency and electrical efficiency in a compressed air-driven FPEG. Kosaka et al. [22] showed that it is necessary to select appropriate operating conditions for the fuel ignition position, fuel injection amount, and generation force coefficient to enable stable continuous operation in a single-cylinder FPEG using an air cylinder. However, the effect of the air cylinder specifications on the piston drive frequency is not clear.
This study clarifies the effect of changing the air cylinder specifications on the piston drive frequency. In addition, the effect of the air cylinder specifications on the engine efficiency and electrical efficiency is described. Section 2 reports on the effect of changing the air cylinder specifications on the repulsion force characteristics. In addition, the relationship between the air cylinder specifications and efficiency is described. In Section 3, the effect of the air cylinder specifications on the piston drive frequency is examined. First, the effect of the air cylinder specifications on the repulsion force characteristics is clarified. Then, the effect of the change in the repulsion force characteristics on the piston drive frequency is reported. Finally, a piston drive frequency diagram based on the top surface area of the air cylinder and the compression ratio is presented. Section 4 reports on the efficiency improvement by setting the air cylinder specifications based on the piston drive frequency diagram.

2. Principle of FPEG

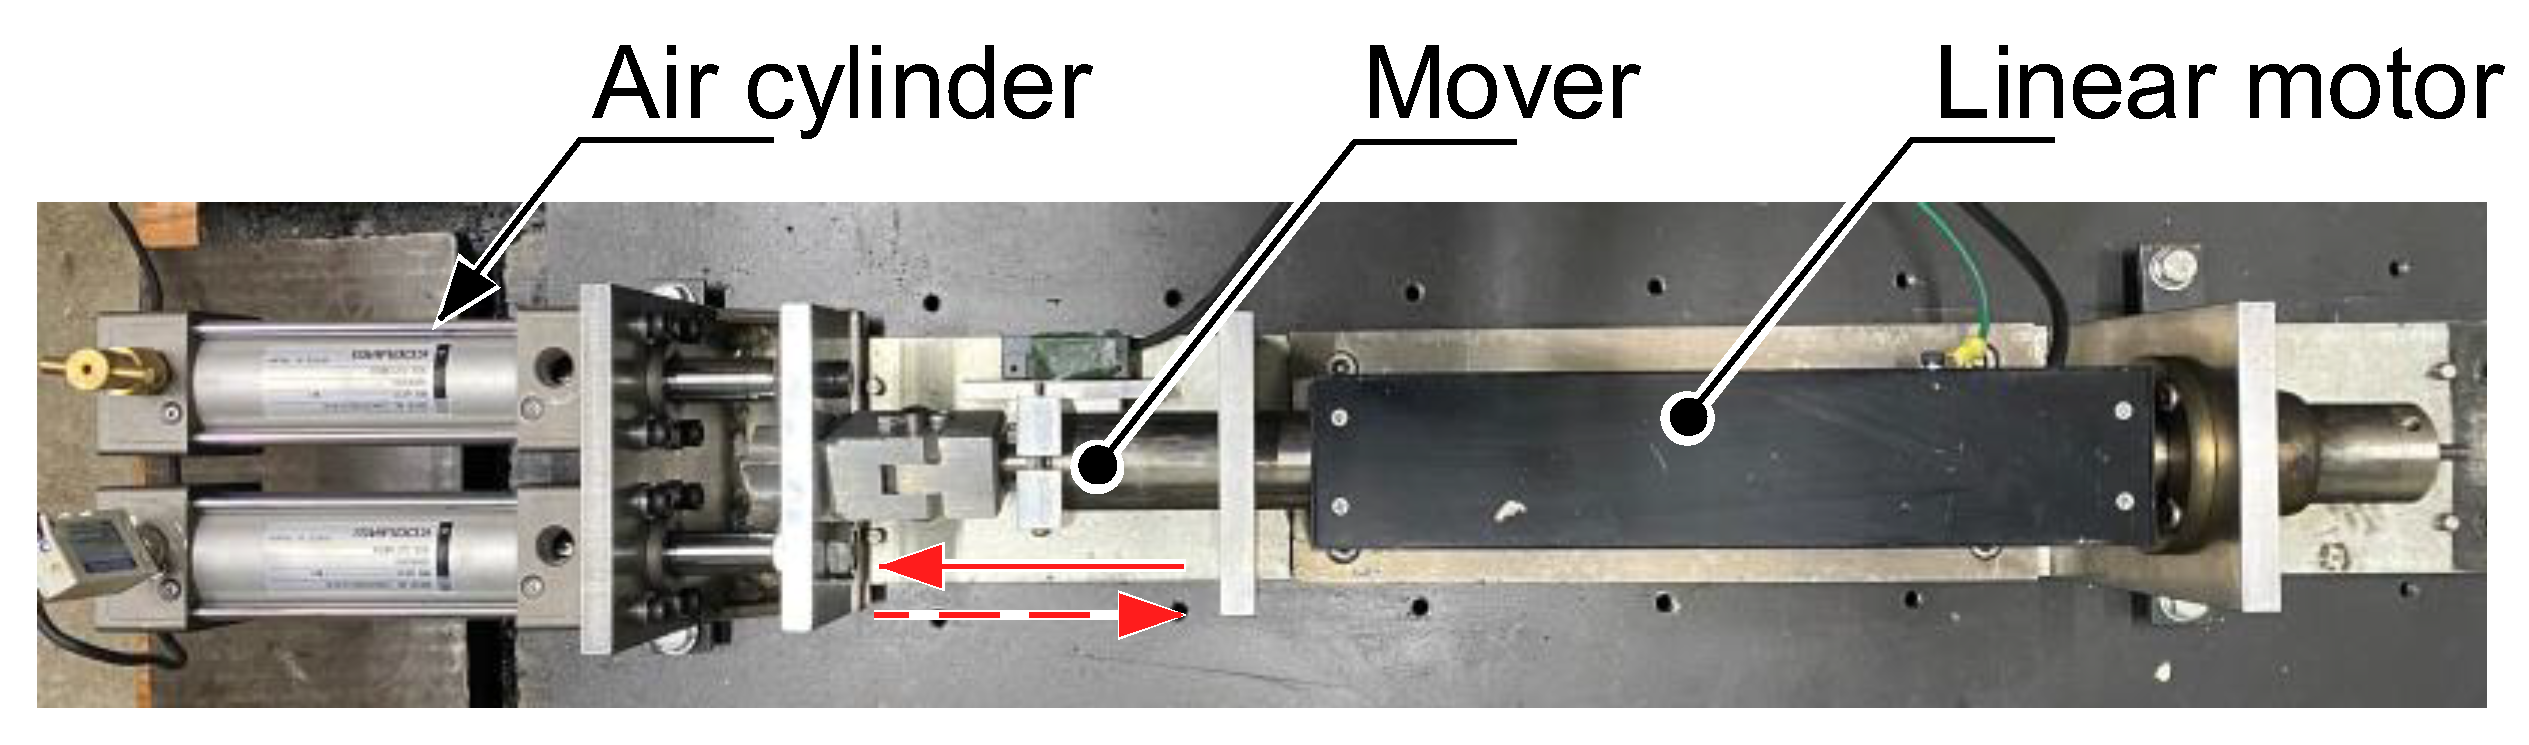
2.1. Basic Structure and Energy Flow of the FPEG

Figure 1a shows the basic structure of the FPEG, which consists of a free-piston engine, a linear machine, and an air cylinder. The engine exerts a combustion force Fc which moves the piston toward the air cylinder. In the air cylinder, a repulsion force Fga acts in the opposite direction, pushing the piston back. This alternating action of the combustion and repulsion forces causes the piston to reciprocate. A permanent magnet is attached to the piston and a coil is placed around it to create a movable-magnet linear machine. An inverter charges the battery with the electric power generated by the piston’s reciprocating action. The piston motion can be varied by changing the generation force Fl controlled by the PWM inverter [23].
Here, the speed and the generation force are positive when the piston moves toward the positive and negative directions of the x-axis. The piston position x is set to zero at the TDC, and xb is the point at which the piston reaches the BDC. Herein, piston motion is expressed as
m d 2 x d t 2 = F c F l F ga F r   ( N )
where m is the mass of the piston (kg), x denotes the piston position (m), Fc indicates the combustion force (N), Fl is the generation force (N), Fga denotes the repulsion force of the air cylinder (N), and Fr is the friction force acting on the piston (N).
FPEGs do not use a bearing due to their relatively simple structure [11]. Therefore, the friction force Fr is calculated as
F r = F r _ en + F r _ lin   ( N )
where Fr_en is the friction force on the engine (N) and Fr_lin denotes the friction force on the linear machine (N).
The friction force on the engine Fr_en generated by the piston rings was calculated as the product of the friction coefficient of the piston rings and the vertical drag force [11,24]. The friction force on the linear machine Fr_lin was assumed to be 15 N [11].
The energy flow of the FPEG is depicted in Figure 1b. The combusted fuel’s energy is the engine input Pin. The output is the electric power Pout stored in the battery after subtracting the indicated thermal loss Pt, friction loss Pr, and generation loss Pe from the engine input Pin. The energy conversion efficiency ηo is expressed as
η o = η en 100 × η e 100 × 100 = η t 100 × η m 100 × η e 100 × 100 ( % )
where ηt is the indicated thermal efficiency (%) and ηm is the mechanical efficiency (%). The engine efficiency ηen is expressed as the ratio of the engine input Pin to the engine output Pen, which considers the indicated thermal loss Pe and the friction loss Pr. The electrical efficiency ηe is the ratio of the engine output Pen to the output power Po to the battery, which considers the electrical loss (iron loss and copper loss).
Attempts to forcibly change the piston motion will result in motoring which allows the linear machine to operate as a linear motor. However, motoring consumes battery power, which significantly reduces the electrical efficiency ηe [25]. Therefore, linear machines should operate only on power generation.

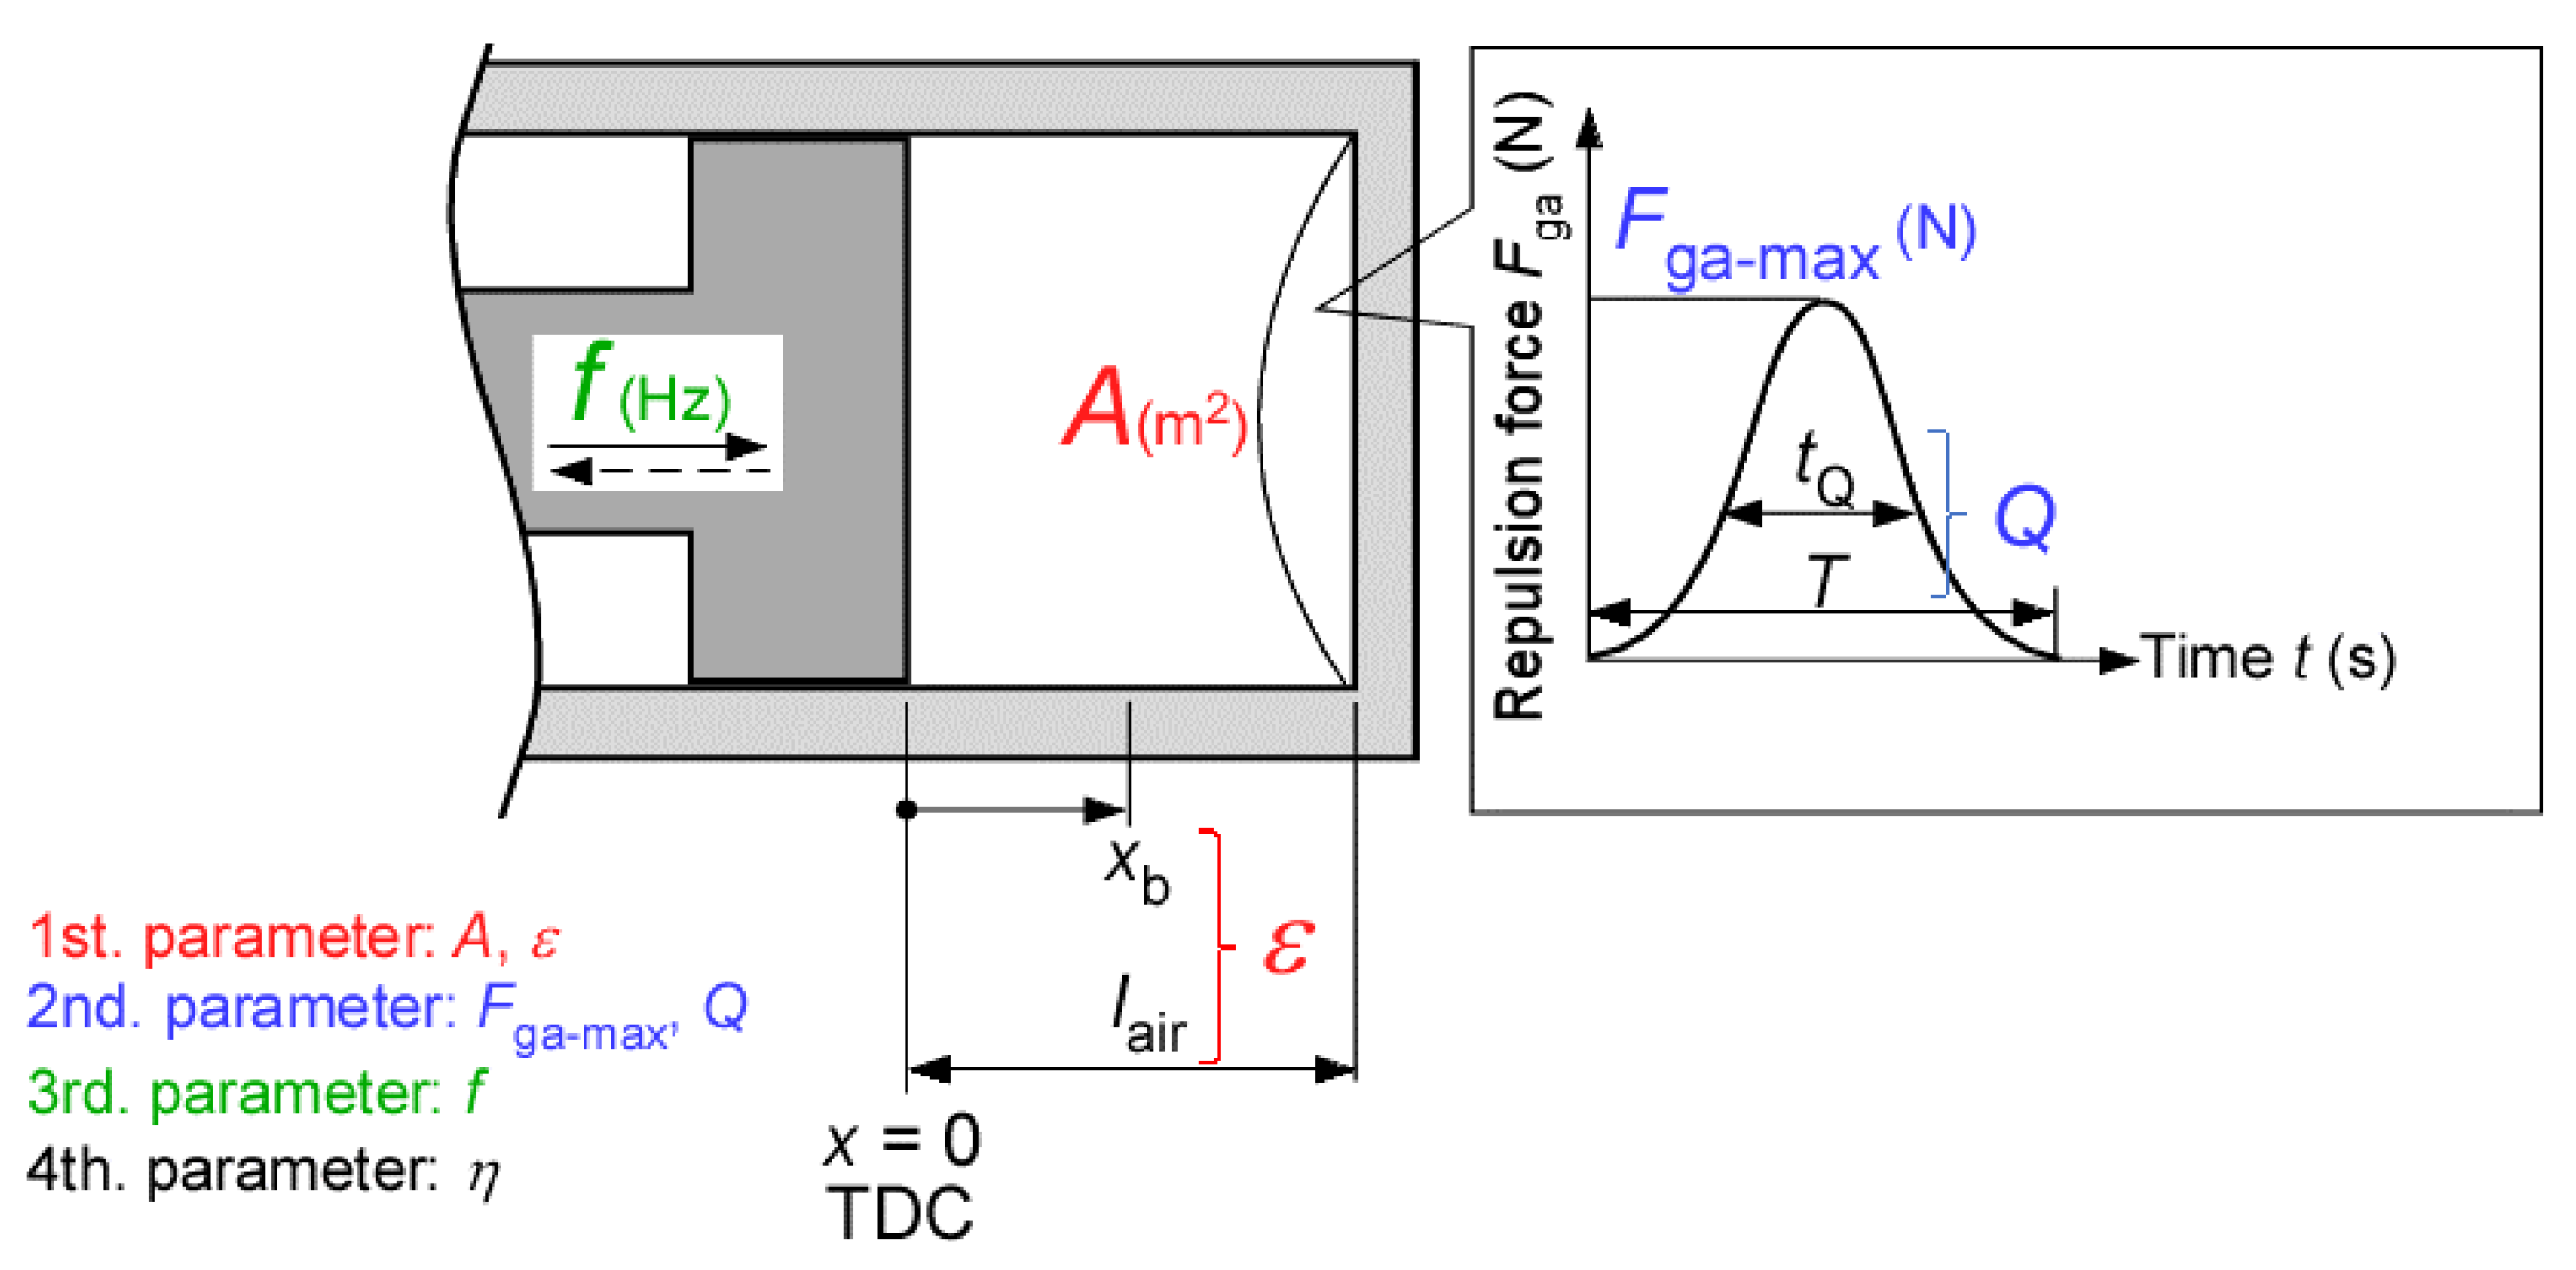
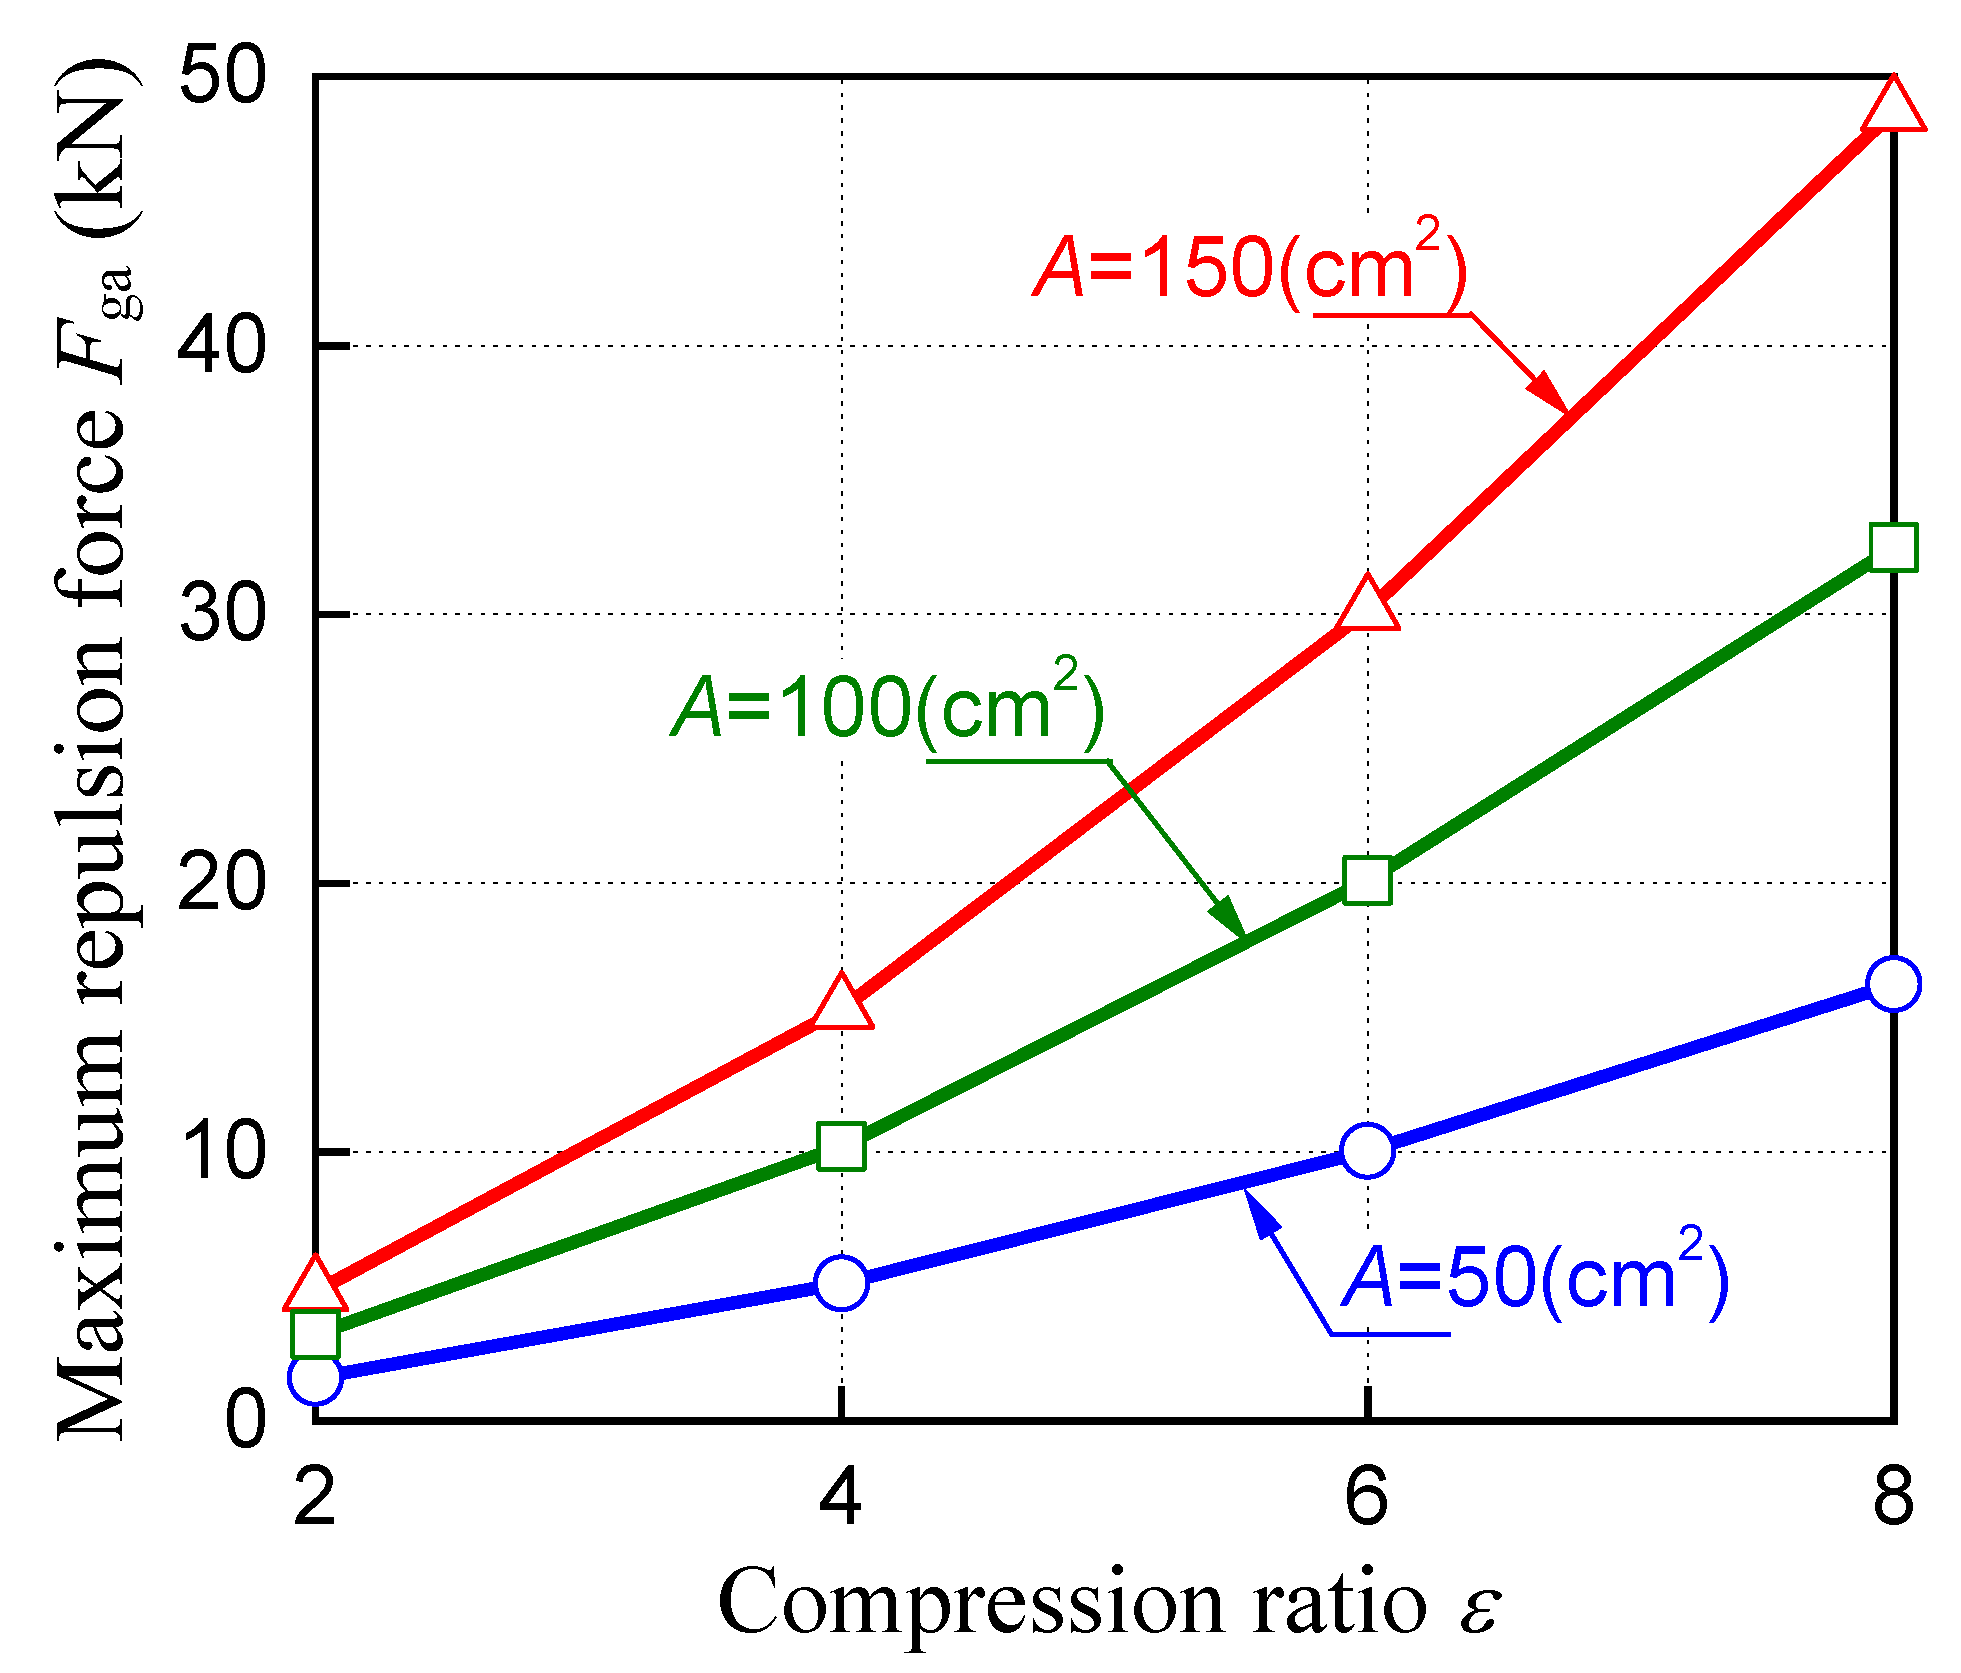
2.2. Specifications and Repulsion Force Characteristics of the Air Cylinder

Figure 2 shows the air cylinder specifications and parameters, which are the pressure of the air cylinder at TDC p0, the compression ratio ε, and the top surface area of air cylinder A. The pressure of the air cylinder at TDC p0 indicates the pressure inside the air cylinder when the piston is at the TDC, which is set to be atmospheric pressure in this study. The compression ratio ε is calculated as
ε = l air l air x b
where lair is the length of the air cylinder (m) and xb is the piston position at the BDC (m).
The repulsion force Fga generated by the air cylinder is expressed as
F ga = A · p air   ( N )
where A is the top surface area of the air cylinder (m2) and pair is the pressure in the air cylinder (Pa).
The pressure of the air cylinder pair is assumed to be an adiabatic change and is given by
p air = p 0 · ( V 0 V air ) κ   ( Pa )
where Vair is the volume of the air cylinder (m3), V0 is the volume of the air cylinder at TDC (m3), and κ is the specific heat ratio.
The volume of the air cylinder Vair is given by
V air = A · ( l a i r x )   ( Pa )
The pressure in the cylinder is at maximum when the piston is at the BDC and is given by
p air _ max = ε κ p 0
The ratio of the half-width tQ to the period of the pressure in the air cylinder T is defined as the quality factor Q, which is calculated as
Q = t Q T
In this study, the specification of the air cylinder is used as the first parameter and the maximum repulsion force Fga and quality factor Q, which indicate the repulsion force characteristics of the air cylinder, are used as the second parameter. Herein, the second parameter is determined by the top surface area of the air cylinder A and the compression ratio ε (first parameter). The piston drive frequency, which is the third parameter, varies under the influence of the second parameter. The piston drive frequency is an important factor affecting the efficiency of the FPEG, which is the fourth parameter.
When a mechanical spring is used, the repulsion force acting on the piston is linear with respect to the piston position x; therefore, the piston drive frequency can be easily set. In contrast, when an air cylinder is used, the repulsion force acting on the piston is nonlinear with respect to the piston position x. Accordingly, setting the piston drive frequency is complicated.

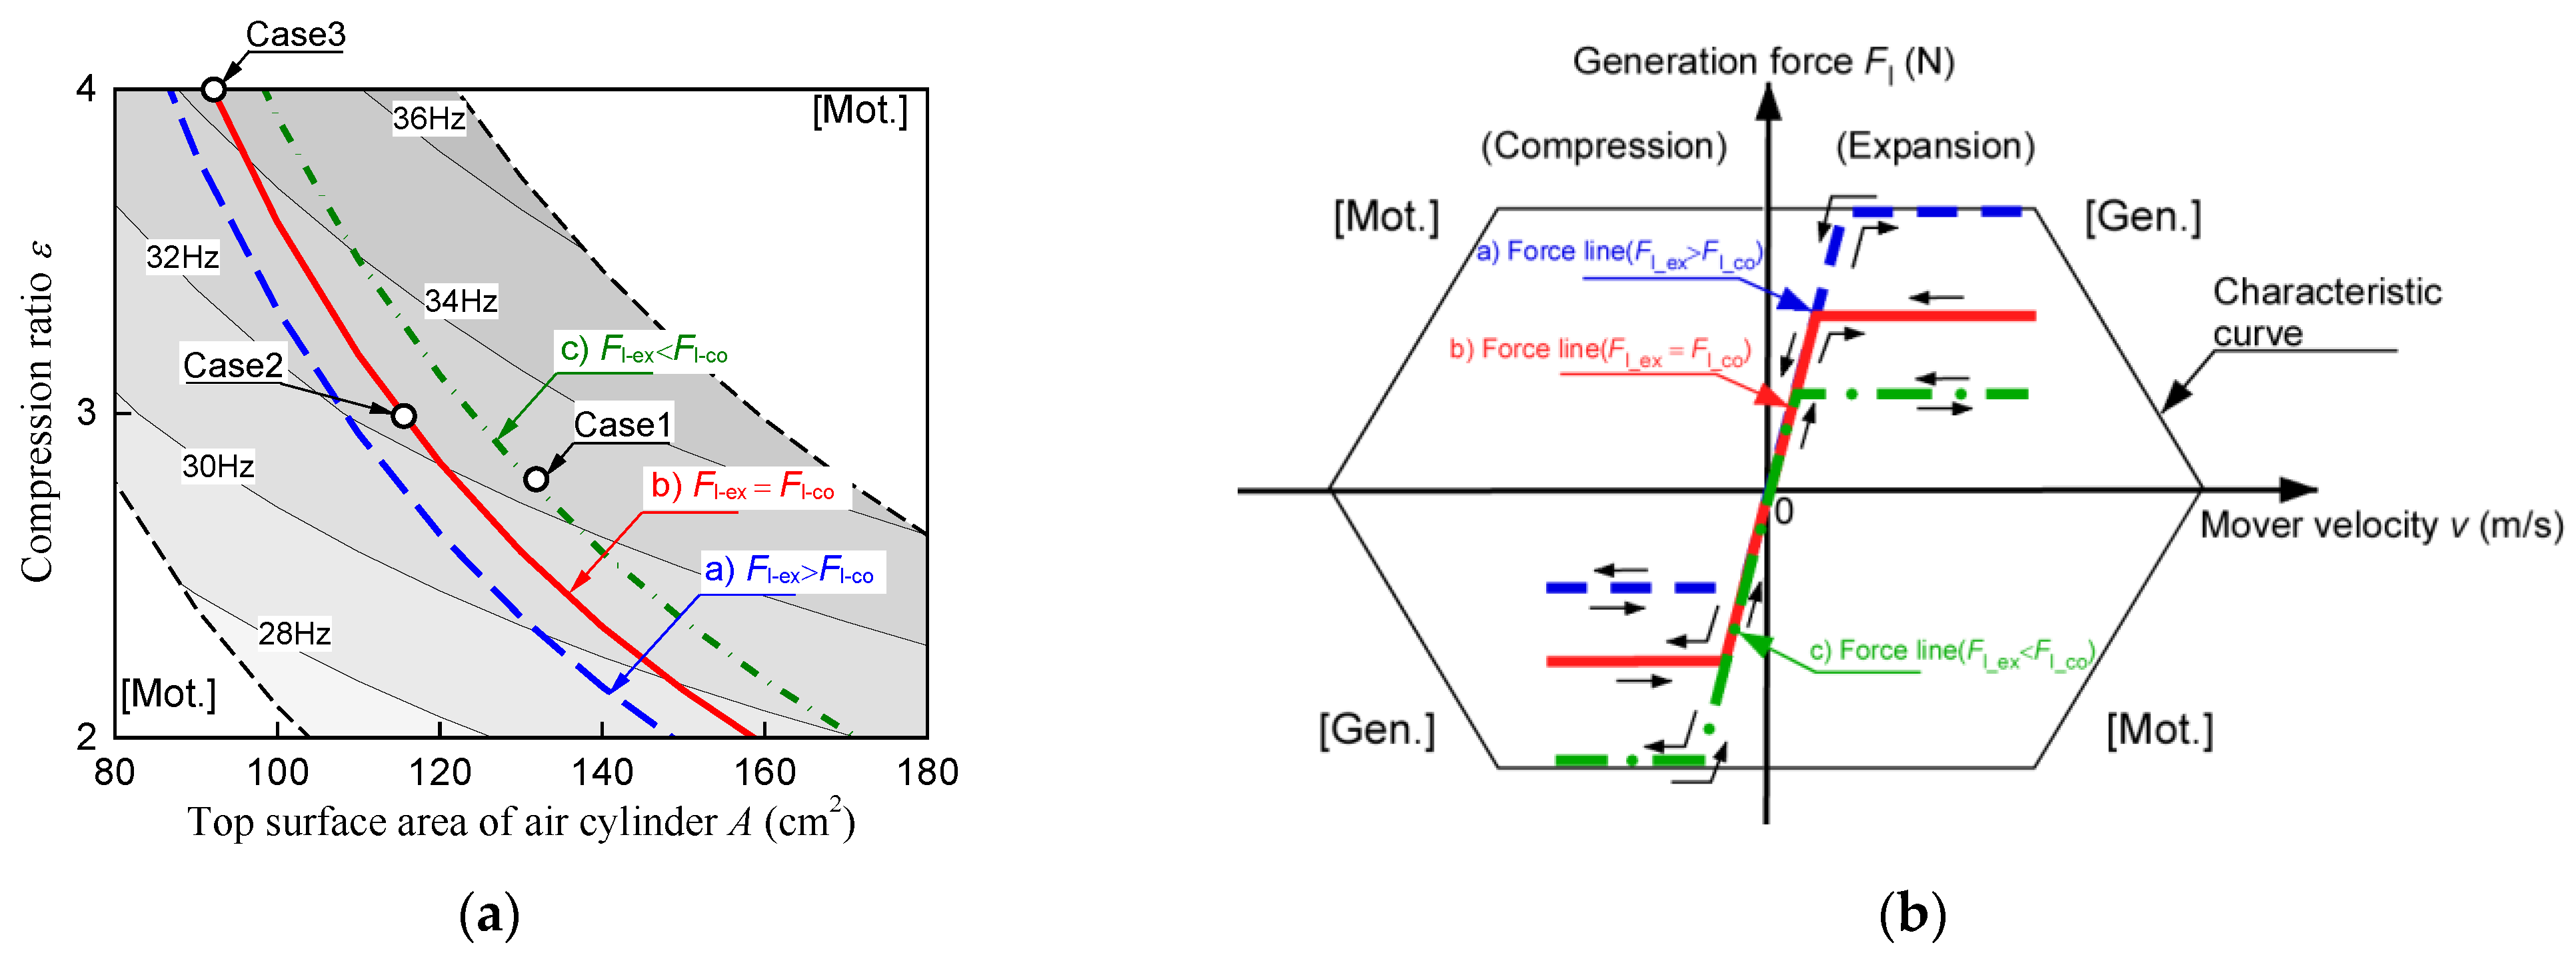
2.3. Relationship between Drive Frequency and Efficiency

Figure 3 shows the abstract relationship between the air cylinder specifications and efficiency. The black solid and blue dashed lines represent air cylinders A and B, respectively. Air cylinder B was assumed to have a larger top surface area A and a higher CR ε than air cylinder A. First, when the specification of the air cylinder is changed, the repulsion force Fga of the air cylinder with respect to the piston position x changes, as shown in Figure 3c. The reason why the repulsive force of air cylinder B is greater than that of air cylinder A at the initial conditions is that the top surface area A is larger. Second, the repulsion force characteristics of the air cylinder can be changed by varying the repulsion force Fga, as shown in Figure 3e. Third, the change in the repulsion force characteristics affects the piston drive frequency, as represented in Figure 3d. Finally, the shaded area shown in Figure 3a increases or decreases as the piston drive frequency is changed. As the shaded area expands, the indicated power increases, thereby improving the indicated thermal efficiency. Figure 3b shows the generation force Fl of the linear machine. When the air cylinder specifications are set focusing only on the engine efficiency, motoring will occur in linear machines, as indicated by the blue dashed line in Figure 3b. Since motoring reduces the electrical efficiency, the air cylinder specifications must be set considering the generation force of the linear machine.
Resonant output dispersion (ROD) control was adopted, which is based on applying a generation force proportional to the piston velocity v, as in a damped vibration system [26]. As a feature of ROD control, the linear machine can be operated continuously without motoring, as shown by the black solid line in Figure 3(b). Herein, the generation force Fl is given by
F l = { F l _ ex   ( K l v > F l _ ex   ) K l v F l _ co   ( K l v > F l _ co   )   ( N )  
where Kl is the generation force coefficient [N/(m/s)], v is the piston velocity (m/s), Fl_ex is the maximum generation force during the expansion stroke (N), and Fl_co is the maximum generation force during the compression stroke (N).
To improve the energy conversion efficiency ηo, the engine efficiency ηen and electrical efficiency ηe must be improved. Improvement of the engine efficiency ηen has a large impact on the energy conversion efficiency ηo. Moving the piston at the appropriate piston drive frequency is important to improve the engine efficiency ηen [19]. In addition, to improve the electrical efficiency ηe, the linear machine should be operated only by power generation. Therefore, the energy conversion efficiency ηo can be improved by changing the air cylinder specifications to move the piston at an appropriate piston drive frequency to improve the engine efficiency ηen without motoring.

3. Effect of the Air Cylinder Parameters on the Piston Drive Frequency

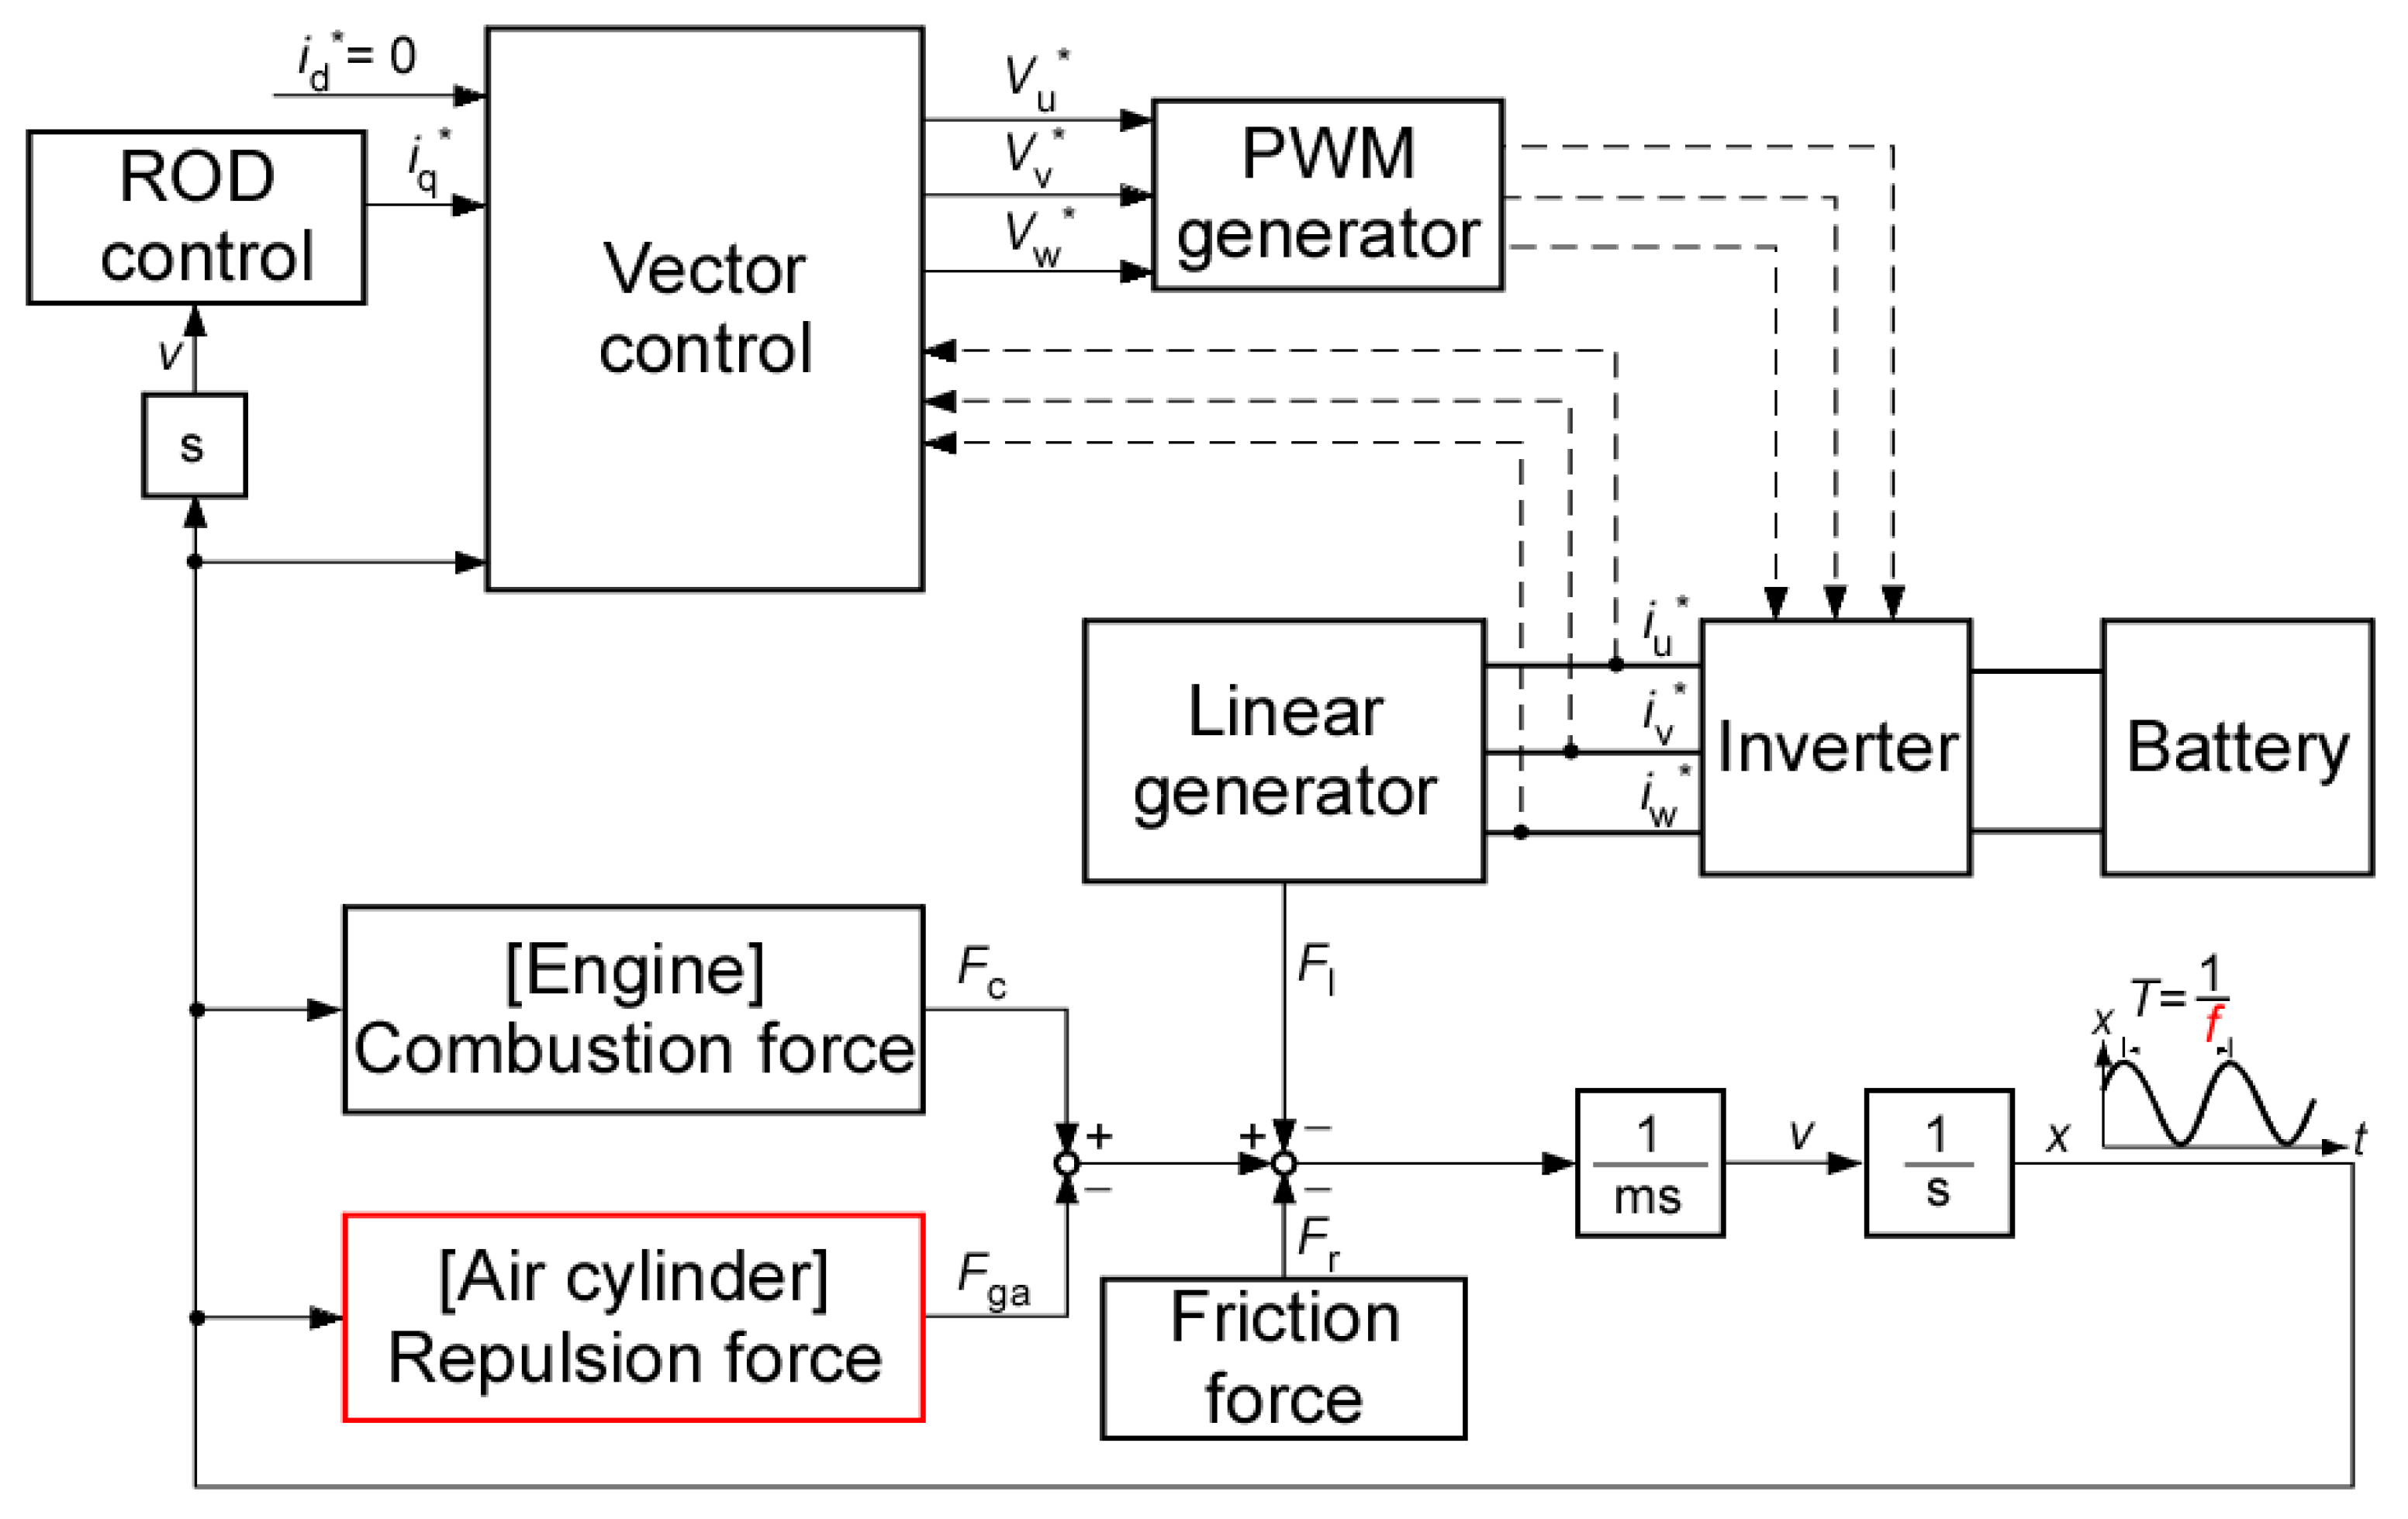
3.1. Simulation Method

In this section, the effect of the air cylinder specifications on the piston drive frequency by simulation software is demonstrated. Figure 4 shows the simulation procedure. In step 1, the engine and linear machine specifications were defined based on the predetermined FPEG dimensions. Finite-element analysis using JMAG-Designer was used to calculate the parameters of the linear machine, such as the generation force constant. In step 2, a piston dynamic model was designed in MATLAB/Simulink according to Newton’s second law. The combustion force, due to the engine, was calculated using the Wiebe function model to obtain the piston motion x1 [27]. In step 3, the combustion force and indicated thermal efficiency were estimated in GT-SUITE based on the obtained piston motion x1. In step 4, the combustion force calculated using the Wiebe function model was replaced by the simulation results of GT-SUITE to obtain the piston motion x2. Finally, the piston motions x1 and x2 obtained in steps 2 and 4, respectively, were compared to confirm that the piston drive frequencies matched. These steps were taken to eliminate the influence of the model differences on the results.
Figure 5 shows an overview of the simulation blocks used to calculate the piston motion, electrical efficiency, and mechanical efficiency. Details of the engine, linear machine, and air cylinder sections, which are the main parts of this simulation, are described in the following.

3.1.1. Linear Machine Part
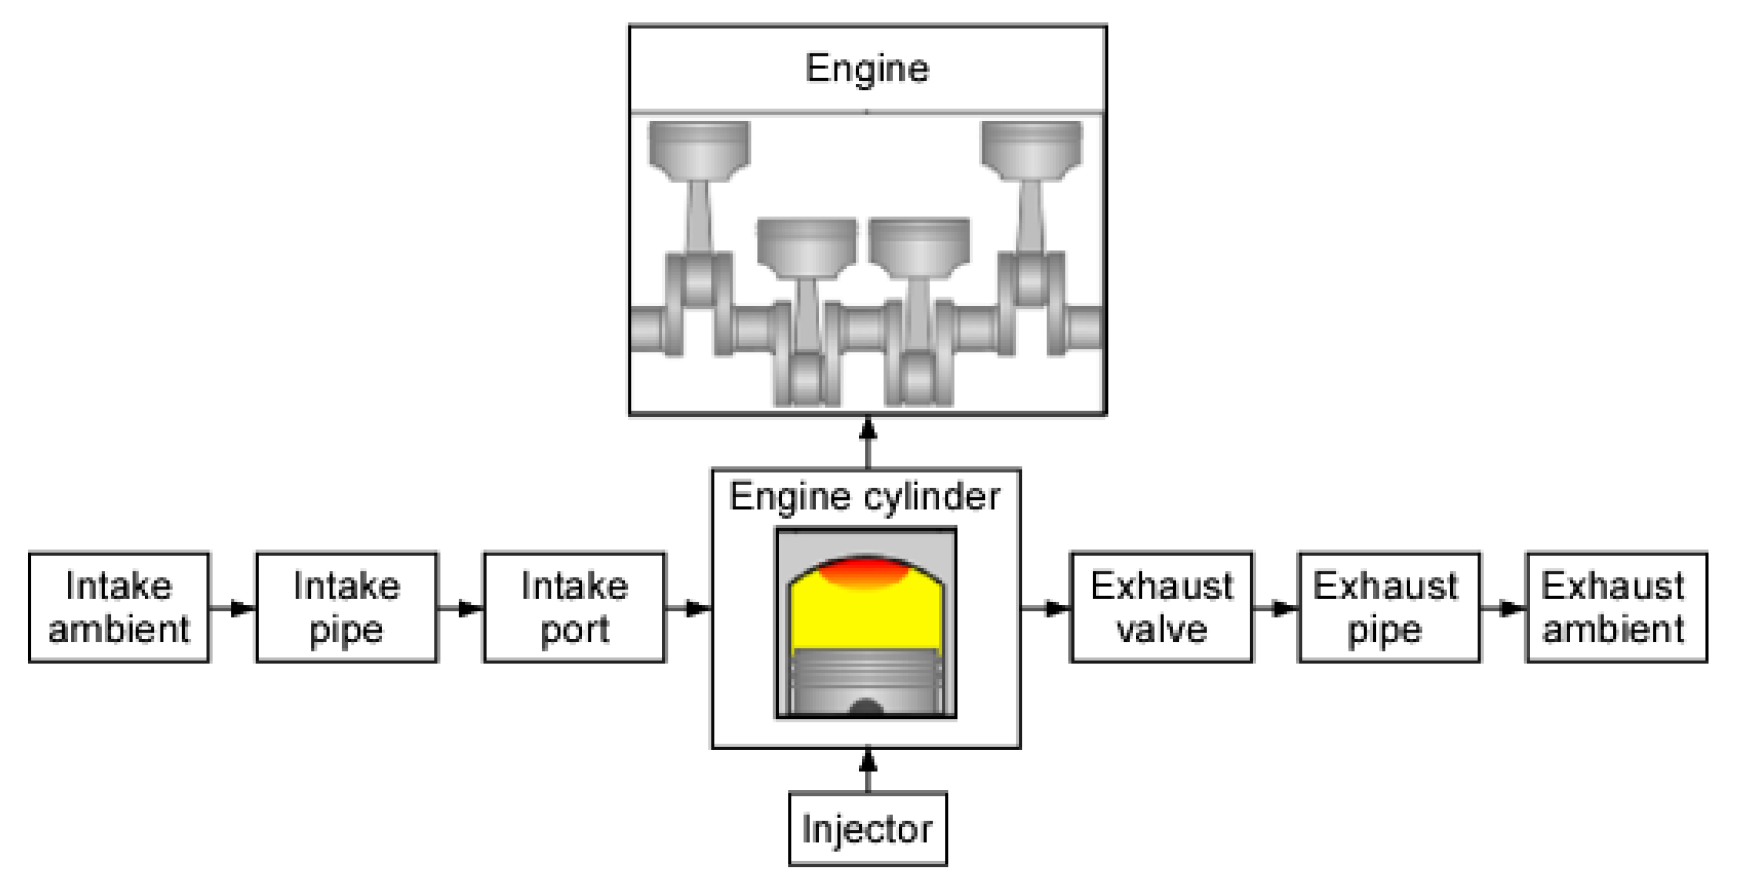
Figure 6 shows an overview of the FPEG and an enlarged view of the linear machine. The linear machine was analyzed using the finite-element method with JMAG-Designer to set the parameter values. A tumbler-type linear motor, which is more reliable than the flat type, was used for the linear motor [28]. A Halbach arrangement was used for the permanent magnets in the mover to improve the output density. The armature coil wound on the stator was made of a flat square wire and wound in a concentrated manner. The gap between the stator and permanent magnets was set to 1 mm to increase the permeance coefficient.
Table 1 shows the analysis conditions. The software used was JMAG-Designer (JSOL Corporation, Tokyo, Japan), and the analysis was a two-dimensional axis-oriented transient response analysis. Table 2 shows the specifications of the linear machine that was analyzed and set up. By considering the current density of the coils, the limit generation force of the linear machine was set to 1420 N. The linearity of the generation force with respect to the current was maintained until the limit generation force was reached, at which time the generation force constant was 18.5 (N/A). The generation force coefficient Kl in Equation (10) is 250 N/(m/s) considering that the electrical efficiency of linear machines is lower at low piston velocity.

3.1.2. Engine Part

The engine simulator GT-SUITE (Gamma Technologies, LLC, Westmont, IL, USA) was used to estimate the combustion power and indicated the thermal efficiency of the engine. In GT-SUITE, the combustion rate and heat generation rate are derived based on the combustion model shown in Figure 7. Subsequently, the cooling and exhaust losses calculated by the in-cylinder heat transfer model and the indicated thermal efficiency were solved. Table 3 shows the specifications of the direct-injection gasoline engine simulated in this study. The amount of fuel injected per cycle was 13.2 mg and was constant independent of the piston drive frequency. The stroke was set to 136 mm considering the moving area of the linear machine. The air-fuel ratio was set at 14.7, which is the ideal ratio for gasoline [29]. The CR was 15. No engine CR variation was assumed in this study. In addition, the excess air ratio was set to 2 (lean burn) to improve the indicated thermal efficiency. The ignition timing was set to minimum advance for the best torque (MBT) that maximizes the combustion power.

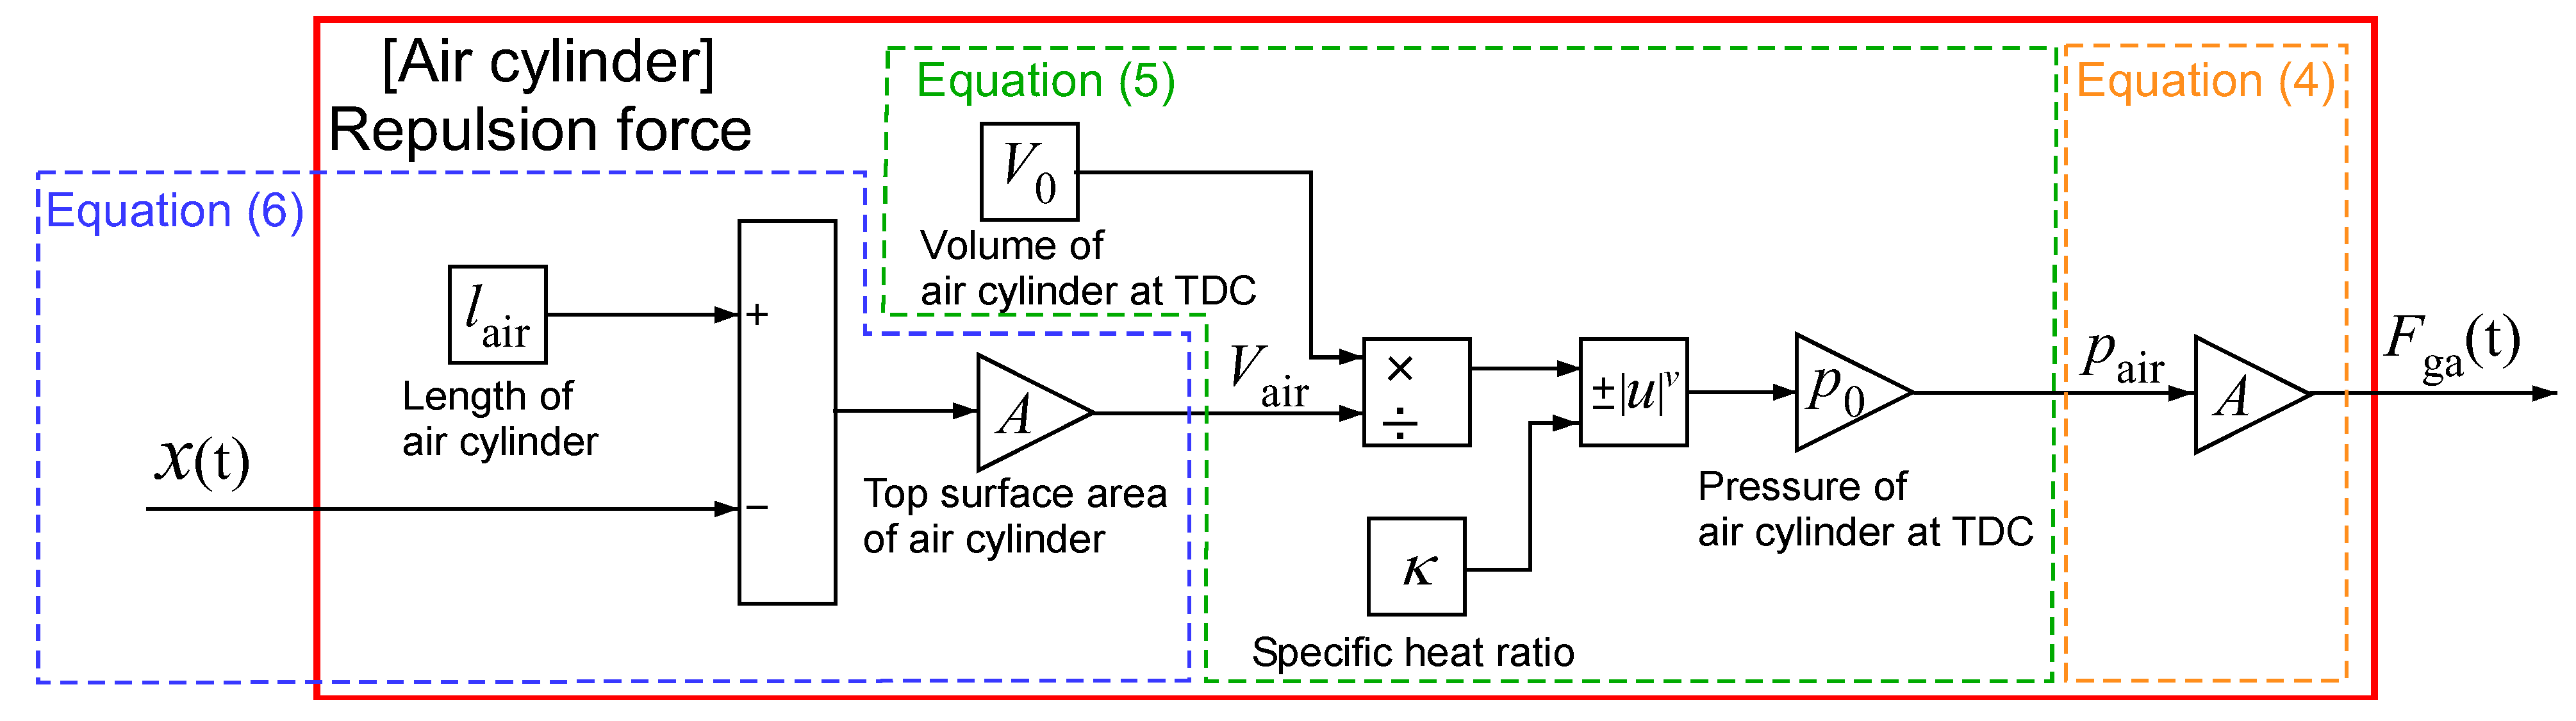
3.1.3. Air Cylinder Part

The pressure and repulsion force of the air cylinder in the simulation were estimated in MATLAB/Simulink based on Equations (5)–(7) using the block diagram shown in Figure 8. The compression ratio ε was set by changing the length of the air cylinder lair and stroke xb. As shown in Section 2, the thrust characteristics of the air cylinder are very important to investigate the effect of the air cylinder specifications on the piston drive frequency. Therefore, we compared the results of the thrust waveform of the air cylinder obtained by the experimental apparatus shown in Figure 9 with the results obtained by the simulation block shown in Figure 8 and confirmed the validity of the simulation block.
A pressure sensor (CAD-15K, Koganei Corporation, Tokyo, Japan) was attached to an air cylinder (DAA 40 × 80, Koganei Corporation, Tokyo, Japan) to measure the pressure inside the air cylinder. A linear motor (S350-1S-100st-L480, GMC Hillstone Co., Yamagata, Japan) was used to simulate the piston motion. A servo amplifier controls the current flowing to the linear motor based on the force command created by the FPGA. The piston motion in the actual measurement was controlled using position control. The piston position command x* used for position control in the measurement and the piston position x in the simulation were both given sinusoidal signals. The piston drive frequency was set below 5 Hz considering the range of stable operation of the linear motor. In this study, the pressure in the air cylinder was calculated assuming adiabatic change. In the experiment, due to the air cylinder specifications and the low piston drive frequency, the pressure in the air cylinder was considered to be an isothermal change based on Boyle’s law and the specific heat ratio in Equation (6) was set to 1. The top surface area of air cylinder A was set to 12.6 cm2 in both the simulation and measurement. The compression ratios inside the air cylinder were set to 1.76 and 2.34 considering the maximum force of the linear motor.
A comparison of the measured and simulated pressures in the air cylinder at a piston drive frequency of 5 Hz is shown in Figure 10. The maximum differences between the measured and simulated pressures were 2.1% and 1.3% for the compression ratios of 1.76 and 2.34, respectively, which are sufficiently small. Even when operated at other piston drive frequencies below 5 Hz, the difference between the simulation and actual measurement was about 2% under all conditions, which is not a significant change. In addition, the pressure in the air cylinder was measured when the experimental device was operated continuously for a long time. As a result, there was no difference in the piston motion between immediately after the start of operation and 20 min after the start of the operation. In contrast, the maximum and minimum pressures in the air cylinder 20 min after the start of operation were higher than those immediately after the start of operation, with a maximum difference of 3.3%. The effect of the pressure change in the air cylinder on the piston motion is discussed in [30], which demonstrated that the pressure in the air cylinder can be changed even during operation. Therefore, it is believed that the simulation model can reproduce the repulsion force characteristics of an air cylinder because there is almost no discrepancy between the measured and simulated results.

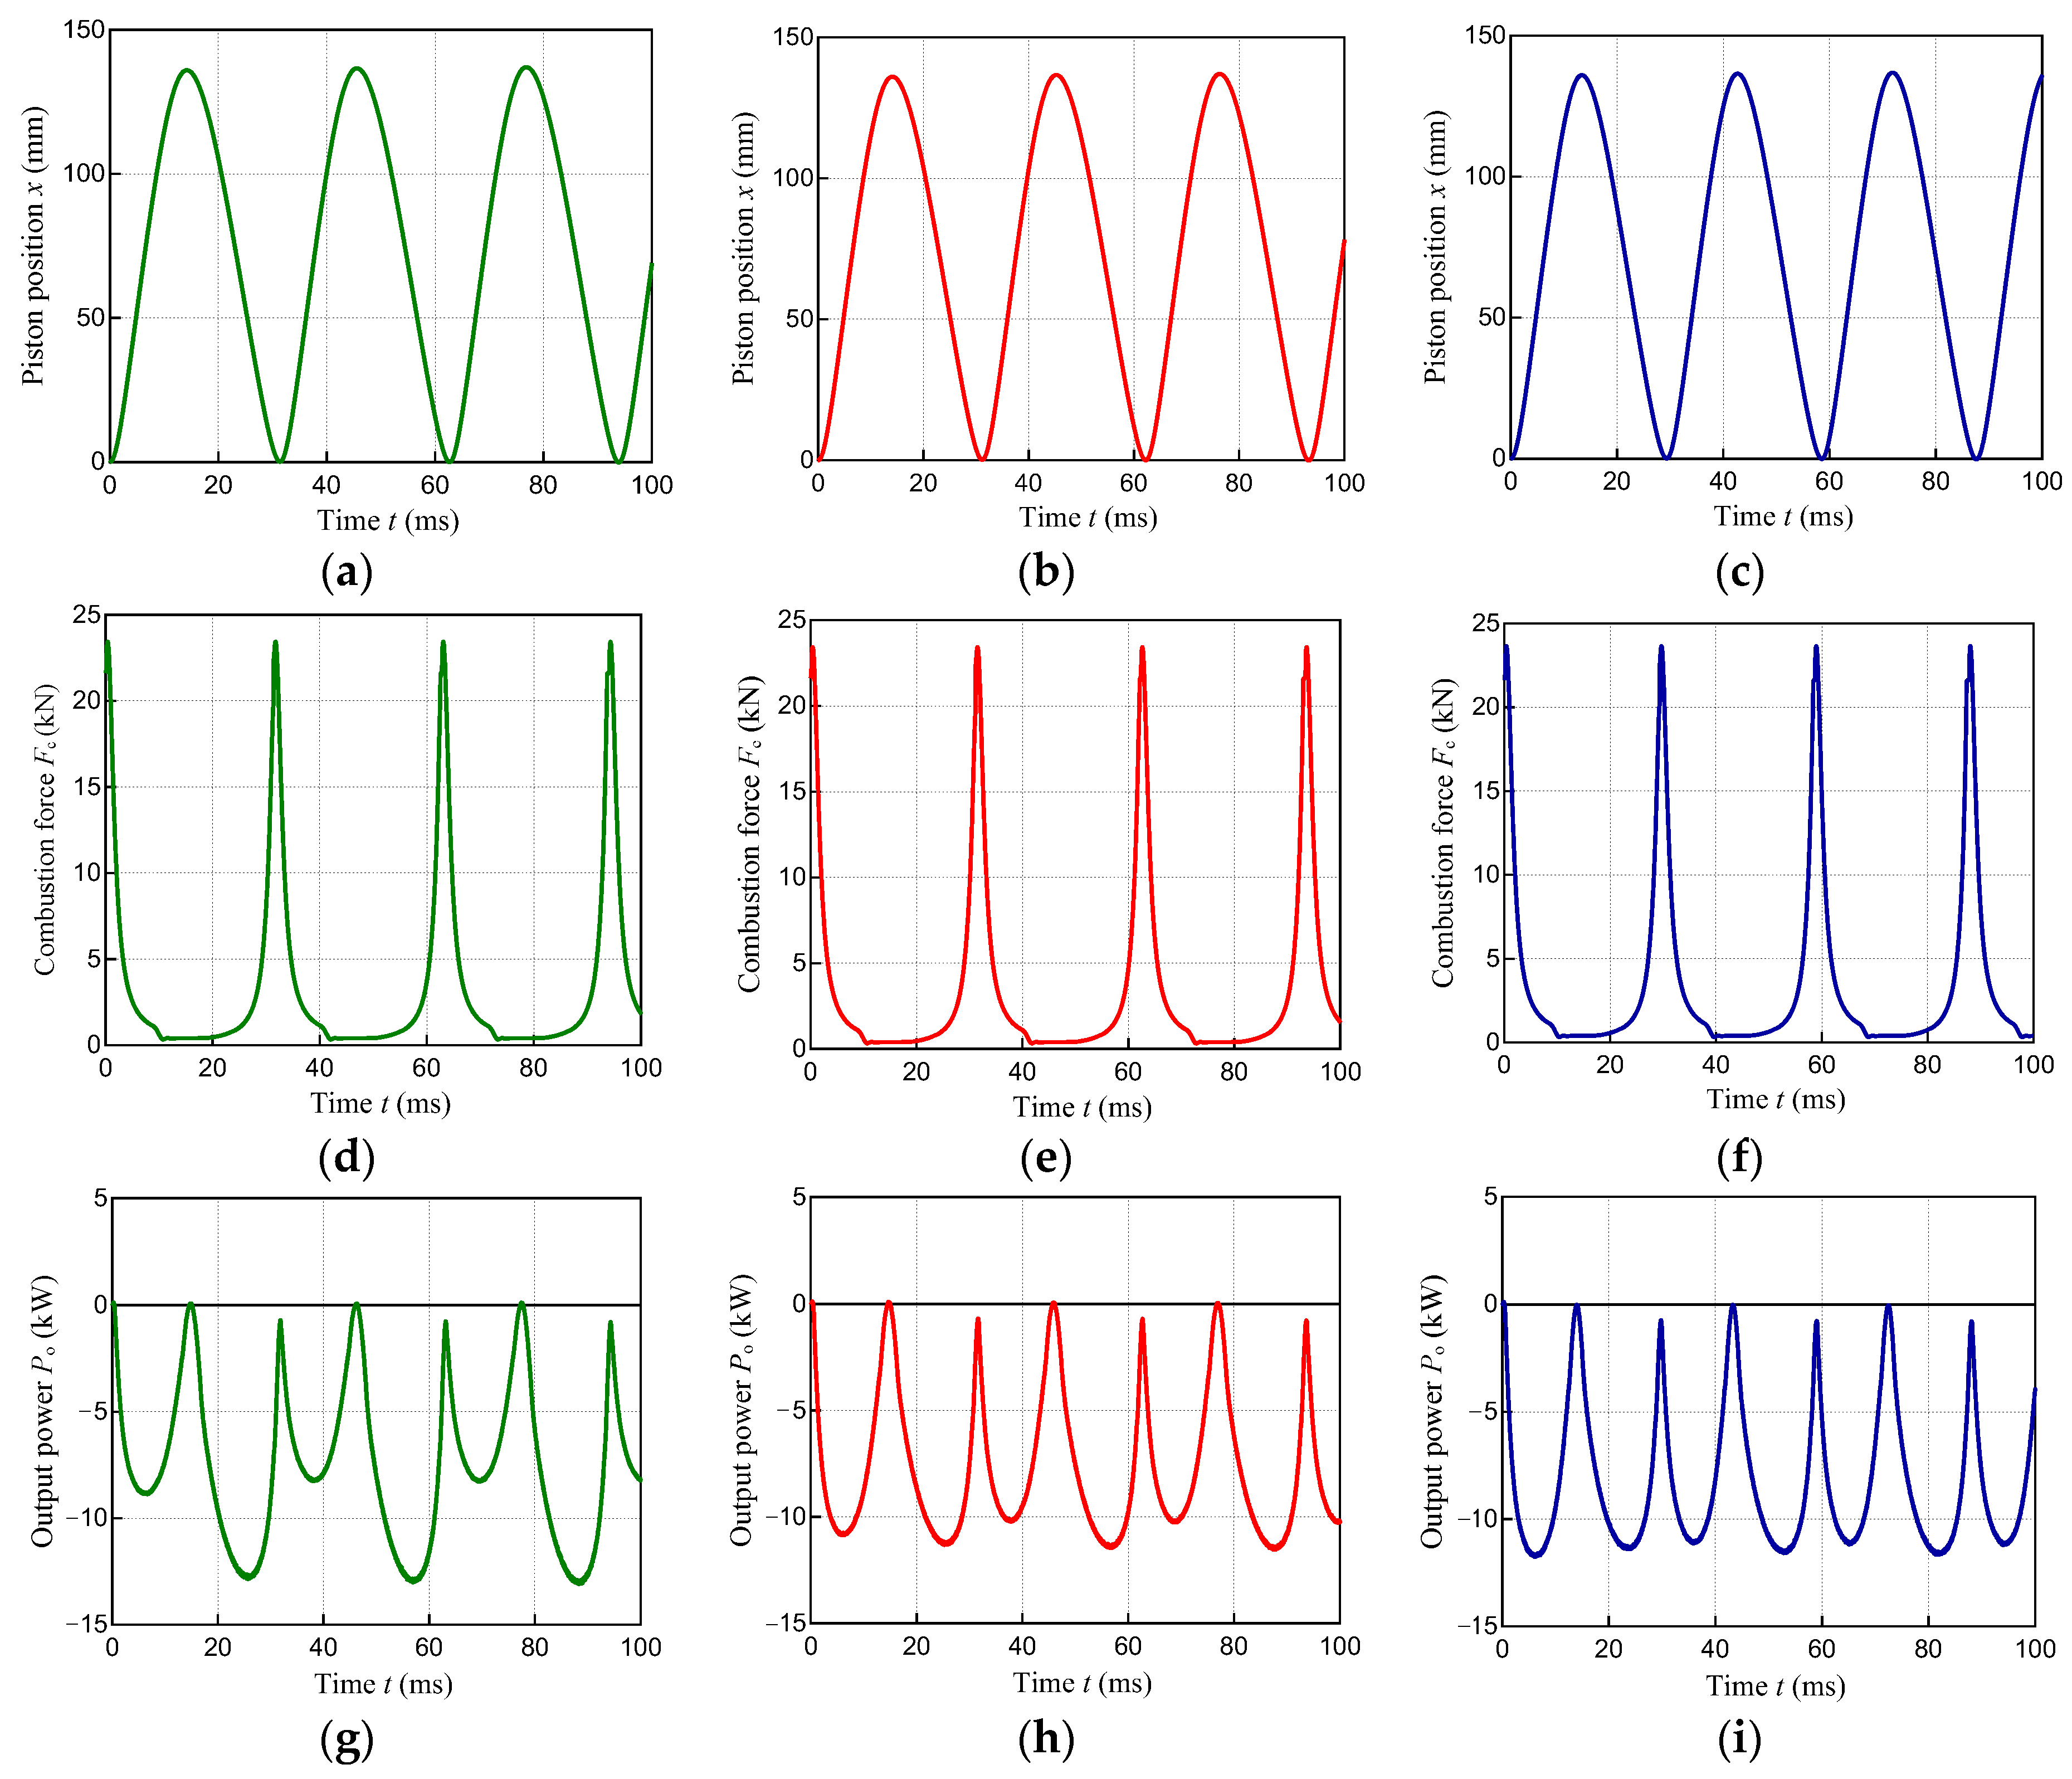
3.2. Simulation Results

Figure 11 shows the simulation results of the maximum repulsion force against the first parameter. The maximum repulsion force varies due to the changes in the compression ratio ε and the top surface area of the air cylinder A. From Equation (5), the repulsion force Fga is proportional to the top surface area of air cylinder A. From Equation (8), a change in the compression ratio ε affects the pressure in air cylinder pair. Therefore, the repulsion force Fga is stronger with increasing pressure in air cylinder pair.
Figure 12 shows the simulation results of the quality factor Q against the first parameter. The quality factor Q does not change when the compression ratio ε has the same value even if the top surface area of air cylinder A changes. On the contrary, the quality factor Q is confirmed to decrease with an increased compression ratio ε.
Figure 13 shows the relationship between the piston drive frequency and the air cylinder characteristics for a constant stroke xb. The air cylinder specifications used to draw Figure 13 are shown in Table 4. Figure 13a shows the piston drive frequency when only the maximum repulsion force is varied with a constant quality factor Q of 0.248. Figure 13a indicates that the piston drive frequency increases with an increase in the maximum repulsion force. Figure 13b shows the piston drive frequency when the maximum repulsion force is kept constant at 14 kN and only the quality factor Q is changed. Figure 13b also shows that the piston drive frequency increases as the quality factor Q increases. Therefore, to increase the piston drive frequency, the quality factor Q or the maximum repulsion force must be increased.
Figure 14 shows the piston drive frequency diagram, where the vertical and horizontal axes are the compression ratio ε and the top surface area of the air cylinder A, respectively. The piston drive frequency is indicated in the figure. This diagram is the result of changing the air cylinder specifications (first parameter) under the constant conditions of the engine and generator specifications, the piston stroke, and the amount of injected fuel per cycle. The piston drive frequency diagram was created through the following procedure: (1) The top surface area of the air cylinder A and the CR ε were determined. (2) The maximum generation force during the expansion stroke was set and determined by searching for a value in the range above zero at which the piston velocity is zero at the BDC. (3) The maximum generation force during the compression stroke was set and determined by searching for a value below zero at which the piston velocity is zero at the TDC. (4) When the maximum generation force during the expansion and compression stroke was appropriately determined, a stable piston motion was obtained. The piston drive frequency was calculated from the piston motion. The black thick line was derived through the following procedure: (1) The maximum generation force during the expansion stroke was set to zero, and various values of the CR ε and the top surface area of the air cylinder A at which the piston velocity is zero at the BDC were obtained. The curve was derived from the obtained data using the least squares method. (2) The maximum generation force during the compression stroke was set to zero, and various values of the CR ε and the top surface area of the air cylinder A at which the piston velocity is zero at the TDC were obtained. The curve was derived from the obtained data using the least squares method.
Figure 14 was plotted by discretely determining the piston drive frequency for the top surface area of the air cylinder A in 20mm increments from 40 to 180 mm2 and for the compression ratio ε in 1 increment from 2 to 5. The upper limit of the compression ratio ε was set to 4 [31] to suppress the temperature rise inside the air cylinder. The specific heat ratio κ inside the air cylinder was estimated to be 1.67 (helium). The top surface area of air cylinder A was set to be less than the outside diameter of the linear machine. The stroke was set to 136 mm considering the moving range of the linear machine [14].
The blank area in Figure 14 is the range where the linear machine cannot operate only by power generation under the set conditions. The blank area in the upper right corner of Figure 14 is a region where the repulsion force Fga is large due to the large top surface area of air cylinder A and the compression ratio ε. Therefore, the combustion force Fc obtained with the amount of injected fuel set in this study cannot sufficiently compress the gas in the air cylinder. The blank area in the lower left of Figure 14 is a region where the energy stored in the air cylinder is too low because the top surface area of air cylinder A and the compression ratio are small. As a result, the air cylinder must be operated as a linear motor to reach the TDC because the energy stored in the air cylinder is less than the energy to compress the combustion chamber. When the linear machine is operated as a linear motor, the electric efficiency is decreased. Therefore, the specifications of air cylinders that can be set are limited when the electrical efficiency is considered. As a result, the configurable piston drive frequency is limited.

4. Effect of the Air Cylinder Parameters on the Efficiency

In this section, the engine and generator specifications are fixed and only the air cylinder specifications are changed to study the energy conversion efficiency improvement of the FPEG.
Figure 15 shows the piston drive frequency diagram and the operating range of the linear machine. Figure 15a shows the piston drive frequency diagram considering the operating range of the linear machine, while Figure 15b shows the operating range of the linear machine shown in Table 2. The blue dashed, red solid, and green single-dotted lines in Figure 15 are the generation force lines for the different settings of the maximum generation force during the compression and expansion stroke. The blue dashed line shows the air cylinder specifications where the generation force during the compression stroke Fl_co reaches the limit generation force of the linear machine. In contrast, the green single-dotted line shows the air cylinder specifications where the generation force during the expansion stroke Fl_ex reaches the limit generation force of the linear machine. Here the red solid line indicates that there is no bias in the generation force Fl exerted in the expansion and compression stroke. For the red solid line, the output power Pout is equalized between the expansion and compression stroke, which improves the electrical efficiency ηe.
Figure 16 shows the engine efficiency against the piston drive frequencies of the engine listed in Table 3. The engine efficiency increased with increasing piston drive frequency in the range shown in Figure 16. In this range, the absolute amounts of friction loss, cooling loss, and exhaust loss increased with increasing piston drive frequency. However, the engine efficiency increased due to the large decrease in the cooling loss ratio relative to the heat supplied. The reduction in the cooling loss ratio may be attributed to the shorter expansion time per cycle due to the increase in piston velocity. Similar results have been reported for a traditional crankshaft engine, where the cooling loss ratio decreased with increasing rotational speed [32]. Figure 15 shows that there is a limit to the improvement of the piston drive frequency considering the operating range of the linear machine and the maximum compression ratio of the air cylinder. Therefore, the engine and linear machine specifications used in this study can only operate in the operating range (shaded area) shown in Figure 16.
This study compares the efficiencies of the FPEG operation with the air cylinder specifications in Case 1, Case 2, and Case 3 in Figure 15a. Case 1 and Case 2 are designed to operate on the red solid and green single-dotted lines in Figure 15a, respectively, and at the same piston drive frequency. Case 2 and Case 3 are on the red solid line in Figure 15a and operate at different piston drive frequencies. Since Figure 16 shows that the engine efficiency is improved in the operating range, Case 3 is designed to have the highest piston drive frequency on the red solid line. Here, by comparing the efficiencies between the specifications of the air cylinder on the blue dashed line and the air cylinder on the green single-dotted line at the same piston drive frequency, no difference in efficiency is observed. Therefore, in this study, the efficiencies are compared at three points from Case 1 to Case 3.
The piston position x, combustion force Fc, and output power Pout for Case 1, Case 2, and Case 3 are shown in Figure 17. Case 1 and Case 2 have the same piston drive frequency and stroke, so there is no difference in the piston displacement. Figure 17 shows that Case 3 has a higher piston drive frequency than Case 2. The piston positions of Case 1 and Case 2 are the same because Case 1 and Case 2 have the same piston drive frequency and stroke. Figure 17 indicates that Case 3 has a higher piston drive frequency than Case 2. In addition, there is no significant difference in the maximum value of the combustion force among Case 1, Case 2, and Case 3. Figure 17 also shows that Case 1 has a bias in the output power Pout between the expansion and compression cycles compared to Case 2 and Case 3.
Table 5 shows the specifications and respective efficiencies of each air cylinder for Case 1, Case 2, and Case 3. Table 5 also shows that the electrical efficiency ηe is the lowest in Case 1 where the output power Pout is biased. By comparing Case 1 and Case 2, the power electrical efficiency ηe increased from 94.1% to 94.3% due to the leveling of the output power Pout. The engine efficiencies ηen of Case 2 and Case 3 were 44.7% and 44.9%, respectively. The electrical efficiency ηe of Case 3 was higher than that of Case 2. This is because the linear machine shown in Table 2 is designed to have a higher efficiency at a piston drive frequency of 40 Hz. Consequently, the energy conversion efficiencies ηo of Case 2 and Case 3 were 42.1% and 42.5%, respectively.
The above results show that the electrical efficiency ηe and engine efficiency ηen can be improved by setting the air cylinder specifications considering the generation force of the linear machine and the piston drive frequency.

5. Conclusions

This study examined the effect of air cylinder specifications on energy conversion efficiency in FPEG. The maximum generation force during the compression and expansion stroke and the piston drive frequency varied with the top surface area of the air cylinder and the CR when the engine and linear machine specifications are not changed. By considering the limit generation force of the linear machine and the upper CR of the air cylinder, a piston drive frequency diagram was developed from the top surface area of the air cylinder and the CR. The limit of the piston drive frequency is clarified by drawing the piston drive frequency diagram. The energy conversion efficiency of the FPEG was improved by 0.5% by using the air cylinder specifications based on the piston drive frequency diagram. Therefore, it can be confirmed that the improvement in energy conversion efficiency can be realized by setting the air cylinder specifications based on the piston drive frequency diagram.

Author Contributions

Conceptualization and Methodology, S.I., M.S. and K.N.; Software, S.I. and F.N.; Funding Acquisition, M.S. and T.M. All authors have read and agreed to the published version of the manuscript.

Funding

This work was supported by JSPS KAKENHI Grant Number 20K14714 and Nagamori Foundation Research Grant 2020.

Data Availability Statement

The data presented in this study are available on request from the corresponding author. The data are not publicly available due to the large amount of data.

Conflicts of Interest

The authors declare no conflict of interest.

References

  1. Bulkeley, H.; Broto, C.V.; Edwards, G. Bringing climate change to the city: Towards low carbon urbanism? Local Environ. 2012, 17, 545–551. [Google Scholar] [CrossRef] [Green Version]
  2. Peyerl, D.; Barbosa, M.O.; Ciotta, M.; Pelissari, M.R.; Moretto, E.M. Linkages between the Promotion of Renewable Energy Policies and Low-Carbon Transition Trends in South America’s Electricity Sector. Energies 2022, 15, 4293. [Google Scholar] [CrossRef]
  3. Ehsani, M.; Gao, Y.; Miller, M.J. Hybrid Electric Vehicles: Architecture and Motor Drives. Proc. IEEE 2007, 95, 719–728. [Google Scholar] [CrossRef]
  4. Feng, H.; Guo, C.; Jia, B.; Zuo, Z.; Guo, Y.; Roskilly, T. Research on the intermediate process of a free-piston linear generator from cold start-up to stable operation: Numerical model and experimental results. Energy Convers. Manag. 2016, 122, 153–164. [Google Scholar] [CrossRef]
  5. Yan, H.; Xu, Z.; Lu, J.; Liu, D.; Jiang, X. A Reciprocating Motion Control Strategy of Single-Cylinder Free-Piston Engine Generator. Electronics 2020, 9, 245. [Google Scholar] [CrossRef] [Green Version]
  6. Smallbone, A.; Hanipah, R.M.; Jia, B.; Scott, T.; Heslop, J.; Towell, B.; Lawrence, C.; Roy, S.; Shivaprasad, K.V.; Roskilly, P.A. Realization of a Novel Free-Piston Engine Generator for Hybrid-Electric Vehicle Applications. Energy Fuels 2020, 34, 12926–12939. [Google Scholar] [CrossRef] [PubMed]
  7. Sato, M.; Goto, T.; Zheng, J.; Irie, S. Resonant Combustion Start Considering Potential Energy of Free-Piston Engine Generator. Energies 2020, 13, 5754. [Google Scholar] [CrossRef]
  8. Chiong, M.; Chong, T.C.; Ng, J.-H.; Mashruk, S.; Chong, F.W.W.; Samiran, A.N.; Mong, R.G.; Valera-Medina, A. Advancements of combustion technologies in the ammonia-fuelled engines. Energy Convers. Manag. 2021, 244, 114460. [Google Scholar] [CrossRef]
  9. Thawko, A.; Eyal, A.; Tartakovsky, L. Experimental comparison of performance and emissions of a direct-injection engine fed with alternative gaseous fuels. Energy Convers. Manag. 2022, 251, 114988. [Google Scholar] [CrossRef]
  10. Zhang, Z.; Feng, H.; Zuo, Z. Numerical Investigation of a Free-Piston Hydrogen-Gasoline Engine Linear Generator. Energies 2020, 13, 4685. [Google Scholar] [CrossRef]
  11. Li, J.; Zuo, Z.; Jia, B.; Feng, H.; Wei, Y.; Zhang, Z.; Smallbone, A.; Roskilly, P.A. Comparative analysis on friction characteristics between free-piston engine generator and traditional crankshaft engine. Energy Convers. Manag. 2021, 245, 114630. [Google Scholar] [CrossRef]
  12. Yuan, C.; Xu, J.; Feng, H.; He, Y. Friction characteristics of piston rings in a free-piston engine generator. Int. J. Engine Res. 2017, 18, 871–885. [Google Scholar] [CrossRef]
  13. Irie, S.; Zheng, J.; Sato, M.; Mizuno, T.; Nishimura, F.; Naganuma, K. Loss-Reduction Effect of Varying the Mover Motion in a Dual-Sided Free-Piston Engine Generator System. In Proceedings of the 13th International Symposium on Linear Drives for Industry Applications (LDIA), Wuhan, China, 1–3 July 2021. [Google Scholar]
  14. Zheng, J.; Naganuma, K.; Nirei, M.; Irie, S.; Sato, M.; Mizuno, T.M. Improvement of thermal efficiency via high-frequency driving of mover in free-piston engine linear generator. In Proceedings of the 23rd International Conference on Electrical Machines and Systems (ICEMS), Hamamatsu, Japan, 24–27 November 2020. [Google Scholar]
  15. Zhang, C.; Sun, Z. Using variable piston trajectory to reduce engine-out emissions. Appl. Energy 2016, 170, 403–414. [Google Scholar] [CrossRef] [Green Version]
  16. Yang, B.; Yuan, C.; Li, J. Control of Magnetoelectric Load to Maintain Stable Compression Ratio for Free Piston Linear Engine Systems. Int. J. Struct. Stab. Dyn. 2021, 21, 2150017. [Google Scholar] [CrossRef]
  17. Zhang, C.; Chen, F.; Li, L.; Xu, Z.; Liu, L.; Yang, G.; Lian, H.; Tian, Y. A Free-Piston Linear Generator Control Strategy for Improving Output Power. Energies 2018, 11, 135. [Google Scholar] [CrossRef] [Green Version]
  18. Guo, G.; Feng, H.; Jia, B.; Zuo, Z.; Guo, Y.; Roskilly, T. Research on the operation characteristics of a free-piston linear generator: Numerical model and experimental results. Energy Convers. Manag. 2017, 131, 32–43. [Google Scholar] [CrossRef] [Green Version]
  19. Sato, M.; Irie, S.; Zheng, J.; Mizuno, T.; Nishimura, F.; Naganuma, K. Generator Design Considering Mover Action to Improve Energy Conversion Efficiency in a Free-Piston Engine Generator. Electronics 2021, 10, 2142. [Google Scholar] [CrossRef]
  20. Yuan, C.; He, L.; Zhou, L. Numerical simulation of the effect of spring dynamics on the combustion of free piston linear engine. Energy 2022, 254, 124241. [Google Scholar] [CrossRef]
  21. Xu, Y.; Xue, X.; Wang, Y.; Ai, M. Performance characteristics of compressed air-driven free-piston linear generator (FPLG) system—A simulation study. Appl. Therm. Eng. 2019, 160, 114013. [Google Scholar] [CrossRef]
  22. Kosaka, H.; Akita, T.; Moriya, K.; Goto, S.; Hotta, Y.; Umeno, T.; Nakakita, K. Development of Free Piston Engine Linear Generator System Part 1—Investigation of Fundamental Characteristics; SAE Technical Papers 2014-01-1203; SAE International: Warrendale, PA, USA, 2014. [Google Scholar]
  23. Sato, M.; Nirei, M.; Yamanaka, Y.; Suzuki, T.; Goto, T.; Bu, Y.; Mizuno, T. Effect of Copper Loss Reduction with Output Dispersion in a Free-Piston Engine Linear Generator System. IEEJ T. Ind. Appl. 2019, 14, 1703–1710. [Google Scholar] [CrossRef]
  24. Nakanishi, K.; Okada, Y.; Sera, K.; Minami, K.; Kadota, I. New Approach for Piston Assembly Friction Analysis Based on Empirical Data. Trans. Soc. Automot. Eng. Jpn. 2010, 41, 301–305. [Google Scholar]
  25. Jia, B.; Smallbone, A.; Zuo, Z.; Feng, H.; Roskilly, P.A. Design and simulation of a two- or four-stroke free-piston engine generator for range extender applications. Energy Convers. Manag. 2016, 111, 289–298. [Google Scholar] [CrossRef]
  26. Sato, M.; Nirei, M.; Yamanaka, Y.; Murata, H.; Bu, Y.; Mizuno, T. Operation Range of Generation Braking Force to Achieve High Efficiency Considering Combustion in a Free-Piston Engine Linear Generator System. IEEJ J. Ind. Appl. 2018, 7, 343–350. [Google Scholar] [CrossRef] [Green Version]
  27. Sato, M.; Nirei, M.; Yamanaka, Y.; Bu, Y.; Mizuno, T. High Power Density by Combining of a Double Stator and an Opposite-magnets Linear Generator in a Dual-type Free-piston Engine Generator. Int. J. Appl. Electromagn. Mech. 2021, 65, 355–370. [Google Scholar] [CrossRef]
  28. Cheng, C.-H.; Dhanasekaran, S. Design of a Slot-Spaced Permanent Magnet Linear Alternator Based on Numerical Analysis. Energies 2022, 15, 4523. [Google Scholar] [CrossRef]
  29. Odunlami, O.A.; Oderinde, O.K.; Akeredolu, F.A.; Sonibare, J.A.; Obanla, O.R.; Ojewumi, M.E. The effect of air-fuel ratio on tailpipe exhaust emission of motorcycles. Fuel Commun. 2022, 11, 100040. [Google Scholar] [CrossRef]
  30. Moriya, K.; Goto, S.; Akita, T.; Kosaka, H.; Hotta, Y.; Nakakita, K. Development of Free Piston Engine Linear Generator System Part 3—Novel Control Method of Linear Generator for to Improve Efficiency and Stability; SAE Technical Papers 2016-01-0685; SAE International: Warrendale, PA, USA, 2016. [Google Scholar]
  31. Kosaka, H.; Akita, T.; Goto, S.; Hotta, Y. Development of free piston engine linear generator system and a resonant pendulum type control method. Int. J. Engine Res. 2021, 22, 2254–2266. [Google Scholar] [CrossRef]
  32. Mitianiec, W. Assessment of total efficiency in adiabatic engines. Scientific Conference on Automotive Vehicles and Combustion Engines. IOP Conf. Ser. Mater. Sci. Eng. 2016, 148, 012080. [Google Scholar] [CrossRef]
Figure 1. Basic structure and energy flow of FPEG: (a) basic structure; (b) energy flow.
Energies 15 07579 g001
Figure 2. Air cylinder’s specification and parameters.
Energies 15 07579 g002
Figure 3. Relationship between the air cylinder specifications and efficiency: (a) combustion force; (b) generation force; (c) repulsion force; (d) piston position; (e) repulsion force characteristics.
Energies 15 07579 g003
Figure 4. Simulation procedure.
Energies 15 07579 g004
Figure 5. Simulation block.
Energies 15 07579 g005
Figure 6. Structure of the FPEG (unit: mm): (a) cross-section of the FPEG; (b) enlarged view of the linear machine.
Energies 15 07579 g006
Figure 7. Engine model.
Energies 15 07579 g007
Figure 8. Simulation block of air cylinder.
Energies 15 07579 g008
Figure 9. Overview of experimental equipment.
Energies 15 07579 g009
Figure 10. Pressure in the air cylinder (A = 12.6 cm2, f = 5 Hz, κ = 1.0).
Energies 15 07579 g010
Figure 11. Results of maximum repulsion force against compression ratio.
Energies 15 07579 g011
Figure 12. Results of quality factor against compression ratio.
Energies 15 07579 g012
Figure 13. Relationship between the second parameter of the air cylinder and the piston drive frequency: (a) maximum repulsion force against piston drive frequency; (b) quality factor against piston drive frequency.
Energies 15 07579 g013
Figure 14. Piston drive frequency diagram.
Energies 15 07579 g014
Figure 15. Piston drive frequency diagram and characteristic curve of the linear machine: (a) piston drive frequency diagram considering the operating range of the linear machine; (b) operating range of the linear machine.
Energies 15 07579 g015
Figure 16. Engine efficiency against piston drive frequency.
Energies 15 07579 g016
Figure 17. Simulation results: piston positions of (a) Case 1, (b) Case 2, and (c) Case 3; combustion forces of (d) Case 1, (e) Case 2, and (f) Case 3; output power of (g) Case 1, (h) Case 2, and (i) Case 3.
Energies 15 07579 g017
Table 1. Analysis conditions.
ItemNote
SoftwareJMAG-Designer (×64) Ver. 19.1
Analysis conditionsTwo-dimensional axisymmetric transient response magnetic field analysis, Iron loss analysis
SolutionFEM
Mesh size(1) Stator: 0.2 mm
(2) Piston: 0.2 mm
(3) Air: Auto
Materials(1) Core: 20HX1200(Nippon steel and sumitomo metal corp.)
(2) Permanent magnet: NEOMAX-42BH(Hitachi metal, Ltd.)
(3) Air: (ρ = ∞ Ωm, μ’ = 1, μ’’ = 0)
Table 2. Linear machine specifications.
Item (Unit)Value
Dimensions of stator (mm)158 × 263.4
Dimensions of mover (mm)118 × 111.6
Piston mass (kg)2.94
Width of teeth (mm)3.0
Number of poles12
Thickness of the magnet (mm)4.65
Width of the magnet (mm)4.65
Thickness of back yoke (mm)3.5
Generation force constant (N/A)18.5
Resistance of armature coils (mΩ/Phase)69.8
Inductance of armature coils (mH/Phase)0.362
Table 3. Engine specifications.
Item (Unit)Value
Amount of injected fuel (mg/cycle)13.2
Bore (mm)68.0
Stroke (mm)136
Displacement (cm3)494
Volume of the combustion chamber (cm3)28.2
Length of the intake port (mm)108.8
Excess air ratio2.0
Compression ratio15
Combustion efficiency1.0
Ignition timingMBT
Table 4. Air cylinder specifications: (a) constant quality factor; (b) constant maximum repulsion force.
Item (Unit)Symbol(a)(b)
Value
Value
Maximum repulsion force (kN)Fga_max6.28.210.212.37.0
Quality factorQ0.2480.2320.2480.2670.290.319
Compression ratioε44.543.532.5
Top surface area of air cylinder (cm2)A6080100120566885110150
Table 5. FPEG efficiencies of the different air specifications.
Item (Unit)SymbolCase 1Case 2Case 3
Air cylinderPressure in air cylinder at TDC (Pa)po101,300
Top surface area of air cylinder (cm2)A130115.290.8
Compression ratioε2.7534
Piston motionPiston drive frequency (Hz)f32.232.234.1
Stroke (mm)xb136
EfficiencyEnergy conversion efficiency (%)ηo42.042.142.5
Engine efficiency (%)ηen44.744.744.9
Thermal efficiency (%)ηt47.347.347.5
Mechanical efficiency (%)ηm94.394.394.5
Electrical efficiency (%)ηe94.194.394.6
Publisher’s Note: MDPI stays neutral with regard to jurisdictional claims in published maps and institutional affiliations.

