Article

Ionic Gelatin-Based Flexible Thermoelectric Generator with Scalability for Human Body Heat Harvesting

1
Tsinghua Shenzhen International Graduate School, Tsinghua University, Shenzhen 518055, China
2
Tsinghua-Berkeley Shenzhen Institute, Tsinghua University, Shenzhen 518055, China
*
Authors to whom correspondence should be addressed.
Energies 2022, 15(9), 3441; https://doi.org/10.3390/en15093441
Submission received: 2 April 2022 / Revised: 5 May 2022 / Accepted: 5 May 2022 / Published: 8 May 2022
(This article belongs to the Topic Thermoelectric Energy Harvesting)

Abstract

:
The prosperity of intelligent wearables brings an increasingly critical problem of power supply. Regular rechargeable lithium or disposable button batteries have some problems, such as limited capacity, frequent replacement, environmental pollution, etc. Wearable energy harvester (WEH) can fundamentally solve these problems. Among WEHs, thermoelectric generator (TEG) is a promising option due to its independence of light condition or the motion of the wearer, and thermoelectric conversion (TEC) has the characteristics of quietness and continuity. Therefore, TEG has become a suitable choice for harvesting low-grade heat energy such as human body heat. Ionic thermoelectric gel (iTEG) has the advantages of a large Seebeck coefficient, freely defined shape and size, low processing cost, wide material sources, easy encapsulation, etc. In this paper, the gelatin-based iTEG is regulated and optimized by silica nanoparticles (SiO2 NPs). The optimal compound quantity of SiO2 NPs is determined, and the optimization mechanism is discussed through a series of characterization tests. Based on the iTEG, a kind of scalable flexible TEGs is proposed, and its preparation method is described in detail. A small wristband TEG (STEG) was made, and its Seebeck coefficient is 74.5 mV/K. Its bendability and stretchability were verified, and the impedance matching experiment was carried out. By charging a capacitor, the STEG successfully lights up an LED at a temperature difference (ΔT) of ~15.5 K. Subsequently, a large extended oversleeve TEG (LTEG) was prepared, and a set of heat sinks was added at the cooling end of the LTEG. Being worn on a volunteer’s forearm, the LTEG output a voltage of more than 3 V at ~20 °C. Through storing the converted energy in a capacitor, the LTEG directly drove a calculator without a DC–DC booster. The proposed iTEG and TEGs in this paper have the prospect of mass production, extending to people’s clothes, harvesting human body heat and directly powering wearable electronics.

1. Introduction

As more intelligent wearables appear in people’s lives and researchers’ labs [1,2], powering these electronics has become critical. The regular power supply is a rechargeable lithium or even a disposable button battery. However, there are many problems with these power supplies. Firstly, intelligent wearables are becoming versatile and powerful, and require a large battery capacity, but this contradicts the miniaturization of the power supply of wearable electronics. Secondly, such power sources need to be recharged or replaced frequently, raising the maintenance cost and worsening the user experience. In addition, such batteries will pollute environment after being discarded [3]. For these reasons, people begin to develop innovative green power supplies [4].
A natural idea is to create a wearable energy harvester (WEH) to obtain energy from the human body or the environment. This method of energy acquisition is mobile and sustainable [4]. WEH is a research hotspot at present, with technologies such as solar cells [5,6], electromagnetic energy harvesters [7,8,9], piezoelectric energy harvesters [10,11,12], triboelectric nanogenerators [13,14], radio frequency (RF) energy harvesters [15,16], etc. Nevertheless, when it is cloudy, rainy, dark or indoors, solar cells will stop harvesting energy. When the human body stops moving, such as in a sleep or in a serious meeting, mechanical energy harvesters will stop working. RF energy harvesters limit the range of human activity. On the other hand, heat is a common energy source, and heat recovery devices play an essential role in the industry [17]. It is worth noting that the human body is also a permanent heat source, but compared with the waste heat recovered in industry, the heat emitted by human body is low-grade heat [18]. The temperatures of different body parts are dissimilar in cold or warm environments, and taking an arm as an example, its surface temperature is about 32~36 °C [19]. When atmospheric temperature (AT) is defined as 20 °C, the temperature difference (ΔT) between skin and air is 12 K~16 K. The devices using ΔT for thermoelectric conversion (TEC) have no moving parts, no noise, no requirements for illumination and do not require constant limb movement, so they are suitable as WEHs to power wearable electronics.
Harvesting and utilizing low-grade heat requires the high efficiency of a TEC device. WEH for body heat recovery also needs to be flexible and biocompatible. The traditional wearable thermoelectric generator (TEG) uses the Seebeck effect of semiconductors or conductive polymers to realize TEC [20]. For example, the Seebeck coefficient of bismuth telluride-based semiconductor thermoelectric material (TEM) is about 100 μV/K ~ 200 μV/K, and it is fixed on a rigid ceramic substrate or flexible substrate to make a wearable TEG [21,22,23]. The traditional TEG is generally prepared from hundreds or even thousands of TEM legs in series and connected with a boost circuit to raise the output voltage to a level sufficient to drive sensors [21,23,24,25]. However, it is evident that the Seebeck coefficient of TEM based on semiconductors or conductive polymers is minimal, and semiconductor TEM is rigid, brittle, expensive and biologically harmful [17,26]. Furthermore, its integrating process is complex, and processing equipment is costly [25]. At the same time, ionic TEM has attracted more and more attention because of its giant Seebeck coefficient.
Ionic TEM can generally be classified into liquid state and quasi-solid state (gel). Liquid ionic TEM can be divided into TEM formed by ionic liquids and TEM created by aqueous electrolytes. Gel-based ionic TEM usually uses material such as gelatin [27,28,29], cellulose [30], or Poly(vinyl alcohol) (PVA) [29,31] to develop a cross-linked network to fabricate the matrix and then constructs microchannels to migrate aqueous electrolyte or ionic liquid. The Seebeck coefficient of ionic TEM (in a broad sense, it can be expressed as Si = VOC/ΔT, where Si is the ionic Seebeck coefficient, VOC is the open-circuit voltage) can reach the order of several millivolts [28,31,32,33]. There are generally two kinds of ionic TEC principles: the thermogalvanic effect and Soret effect [28,34], which stem from temperature-dependent entropy change during electron transfer between redox couple and electrodes and selective diffusion of ions under a thermal gradient, respectively. Another advantage of ionic TEM is that its thermal conductivity is usually low, which is conducive to maintaining a more considerable ΔT across the device [28,35]. The disadvantage of ionic TEM is that its electrical conductivity is generally low, making its output current small [28,31,35]. At present, the power consumption of sensors is usually low (of the order of μW), and they can often be set to operate intermittently. Still, the driving voltage they need is typically high (2 V~3 V), so the sufficient voltage is more critical than a large current [34]. The reported studies focus on improving the Seebeck coefficient, electrical conductivity and thermal resistance of ionic TEM and optimizing the electrodes [30,35,36,37,38]. These optimization routes are similar to those of electronic TEM.
In this paper, gelatin is used to build a cross-linking network, and in the aqueous electrolyte, [Fe(CN)6]3− and [Fe(CN)6]4− are used as redox couple for thermogalvanic effect, Cl and K+ are used as migrating ions for Soret effect, and silica nanoparticles (SiO2 NPs) are used to regulate the behavior of ions in the electrolyte. The synergistic effect of the thermogalvanic effect and the Soret effect produces a giant Seebeck coefficient [28]. At the same time, the ionic thermoelectric gel (iTEG) prepared herein has relatively high electrical conductivity, relatively low thermal conductivity and excellent mechanical properties. Subsequently, the developed iTEG blocks are used as the functional units, the biocompatible elastomer Ecoflex (a kind of elastic rubber product from Smooth-On Inc., Macungie, PA, USA) [39] as the flexible frame, and the ultra-thin copper foils as the flexible electrodes to create a small wristband TEG (STEG) that can deliver an impressive Seebeck coefficient (74.5 mV/K). Finally, copper foam is used as the heat sink of wearable TEG to optimize the thermal resistance of its cooling end, and the STEG is extended to an oversleeve size. After placing the large extended oversleeve TEG (LTEG) on a volunteer’s forearm, a voltage of more than 3 V was output in a room of ~20 °C. By charging a 220 μF capacitor, the LTEG directly powers a calculator, enabling it to display clearly and calculate accurately, with an endurance of about 2 min.

2. Materials and Methods

To test the Seebeck coefficient and output power of the iTEG and the TEGs, a self-made TEG-testing platform was built, and its schematic diagram is shown in Figure 1a. It comprises a vertical translation mechanism, a temperature controlling module, a temperature measurement module, a voltage measurement module, a water-cooling cycle module, an output curve scanning module, the user interface, the data reading and writing program, etc. An aluminum alloy heat exchanger is pasted on the back of the Peltier chip. The aluminum alloy heat exchanger is connected with a two-stage circulating water cooling system (Figure 1b), which can ensure the efficient heat exchange of the two Peltier chips during the system’s operation to realize rapid, accurate and stable temperature control. The controlling software and user interface were compiled with LabVIEW (National Instruments Corporation, Austin, TX, USA), and the functions of automatic data recording, instruments communication and PID were implemented. A source measure unit (SMU, Keithley 2450, Solon, OH, USA) was used as a sink to scan the output voltage and current of the TEG tested. K type thermocouples and Dupont wires were connected with a data acquisition unit (DAU, Keysight 34970A, Santa Rosa, CA, USA) to test the temperature and output voltage, respectively. A programmable power supply (RIGOL DP832, Suzhou, China) was used to control Peltier chips’ voltage and current input to realize temperature-controlling automation.
The preparation process of the iTEG can be described as follows: firstly, add a certain amount of deionized water (18.2 MΩ·cm @ 25 °C; Synergy® Water Purification System; Merck Millipore Corporation, Burlington, MA, USA), gelatin (photographic grade, B type, ~250 g Bloom, Aladdin Industrial Corporation, Shanghai, China), K3Fe(CN)6 (AR, 99.5%, Aladdin Industrial Corporation), K4Fe(CN)6·3H2O (AR, 99.0%, Aladdin Industrial Corporation; the hydrated water was neglected when making the solutions) and KCl (AR, 99.5%, Aladdin Industrial Corporation) into the beaker. The mass ratio of gelatin to deionized water is 1:3 [28]. The molar concentration of KCl was 0.8 mol/L, K4Fe(CN)6 was 0.42 mol/L and K3Fe(CN)6 was 0.25 mol/L [28]. Then, a certain weight of SiO2 NPs (99.5% metals basis, particle size 15 nm, the mass ratio of SiO2 NPs to deionized water is 0, 0.0033, 0.01, 0.025, 0.05, respectively) was added to the same beaker and it was sealed with polyethylene film. Then, the beaker was put into a water bath magnetic stirrer (DU-3GW, Yiheng Scientific Instrument Co., Ltd., Shanghai, China) for mechanical blending. The temperature of water bath was set to 60 °C, the magnetic stirring speed of the first stage (10 min) was set to 0, the rate of the second stage (30 min) was set to 500 r/min, the speed of the third stage (90 min) was set to 900 r/min, and the rate of the fourth stage (30 min) was set to 500 r/min. The mucilaginous precursor was poured into the pre-milled Teflon mold to define the shape and size of the iTEG blocks. It was then aged in a horizontal sealed box for ~8 h. The physical cross-linking of gelatin gave the iTEG unit a jelly-like appearance, as shown in Figure 1c. Herein, the size of the iTEG block was 15 × 15 × 2 mm3 (for the iTEG improvement experiments) or 10 × 10 × 2.5 mm3 (for the preparation of wearable TEGs).
To evaluate the performance of the prepared iTEG, 15 × 15 × 0.01 mm3 copper foils were pasted on the upper and lower sides of the iTEG block as electrodes, and hydrophobic gel was used to seal the periphery of the iTEG block. After that, two silver-plated wires were pasted on the electrodes with ultra-thin copper tapes as the lead-out wires. The section diagram of the assembled TEG unit is shown in Figure 1d. This kind of unit was tested to evaluate the property of the iTEG block contained in it.
Ecoflex (Smooth-On Inc., Macungie, PA, USA) is used to encapsulate the flexible wearable TEG, and copper foils are used as electrical connections. Ecoflex is a commercial elastic silicone rubber with non-irritating safety certification issued by a third party [39]. It is very suitable for making wearable devices that directly contact human skin. Silicone Thinner is a diluent produced by Smooth-On company, which can enhance the fluidity of a Ecoflex precursor and prolong the setting time [39]. The preparation process of the flexible frame of the wearable STEG is shown in Figure 2a, and its photo is shown in Figure 2b. The mass ratio is m (Part A):m (Part B):m (Silicone Thinner) = 5:5:1. A Teflon mold was used to define the dimensions of the flexible frame and its internal holes. The manufacturing process of the Ecoflex flexible films is shown in Figure 2c. The mass ratio is m (Part A):m (Part B):m (Silicone Thinner) = 5:5:1. The Teflon roller and Teflon plate jointly define the size of the Ecoflex thin films. In this paper, the mass of the roller is ~200 g and the thickness of the film is ~25 μm, as shown in the inset of Figure 2d. Herein, the flexible frame and films are prepared by mixing Ecoflex (00-20 Fast) and Silicon Thinner. Compared with pure Ecoflex, the mixed fluid has smaller viscosity and better fluidity, so it can fully fill the mold and be fully cast on the flat plate, making the surface of the frame and films fine with fewer bubbles.
Usually, the design scheme of a wearable TEG is to connect TEG units in series electrically and in parallel thermally so that a higher voltage can be generated even from a small ΔT. Generally, there are two connection modes between TEG units: “Z” and “π” shape [18,31,40]. In this paper, the Z-shaped connection is adopted to utilize consistent high-performance units to achieve a high power output. A paper cutter was used to cut copper foils into 10 × 28 mm2 pieces, and then a set of 3D-printed die was used to stamp the copper pieces into the shape of “Z”, which was then used as flexible electrodes and conductive connections. The assembly relationship of the flexible frame, films, electrodes and iTEG units in the TEG is shown in Figure 3a.
The fabrication process of the flexible wearable TEG is described as follows: firstly, the iTEG units and copper electrodes are embedded into the flexible frame, and then two Ecoflex films are bonded at both ends of the TEG to complete packaging. The specific bonding operation is to use a Teflon roller to coat a thin layer of Ecoflex precursor (the mass ratio is m (00-35 Fast Part A):m (00-35 Fast Part B) = 1:1) on the flexible film and then ~60 N weight is used to squeeze the flexible frame and film to complete bonding. The 3D exploded diagram of the flexible wearable STEG is shown in Figure 3b, and its photo is shown in the inset.
The flexible wearable TEG proposed in this paper is scalable. It can be mass-produced by milling Teflon molds of different sizes. As shown in Figure 3b, it is a small wristband TEG (STEG, including 3 rows and 8 columns of iTEG units). Another large extended flexible oversleeve TEG (LTEG, including 9 rows and 12 columns of iTEG units) was prepared to obtain output voltage sufficient to power a wider range of devices at AT. The 5 mm thick porous copper foam was used as the heat sink of the TEG to increase the heat transfer efficiency and reduce the convection heat resistance of the cooling end, and thus to increase the ΔT across the LTEG [41]. The microscopic picture of the copper foam is shown in Figure 3c. The photo of the LTEG is shown in Figure 3d, indicating excellent flexibility.

3. Results and Discussion

3.1. Improvement of iTEG

As mentioned above, five groups of iTEG were prepared, among which the only difference is the quantity of dispersed SiO2 NPs. The optimal dosage of compositing SiO2 NPs in iTEG was determined. Subsequently, a series of characterization tests were carried out for the iTEG with or without SiO2 NPs to help discuss and explain the optimization mechanism.

3.1.1. Determination of SiO2 NPs Dispersion Quantity

Generally, the Seebeck coefficient indicates the ability of TEG to output voltage under a certain ΔT, but powering electronics requires not only voltage but also a certain current, that is, TEG needs to output a sufficient power. On the other hand, the output power of TEG is related to the electrode’s effective area and the ΔT. Therefore, to adequately reflect the comprehensive performance of TEG, it is necessary to model the temperature-insensitive maximum power density (TIMPD) as:
TIMPD = P max A · ( Δ T ) 2
where Pmax is the maximum output power of TEG during discharge, and A is the effective area of electrode [36,38,42]. The TIMPD of the TEG units with a different amount of SiO2 NPs is tested, as shown in Figure 4a, which is drawn by the self-made testing platform. This test explores five mass ratios of SiO2 NPs to deionized water, which are 0:100, 0.33:100, 1:100, 2.5:100 and 5:100, respectively. In the experiment, each mass ratio represents a group of samples, so there are five groups of samples. Three measurements were conducted at each ratio to extract the mean and standard deviation. The temperature difference across the TEG unit was maintained at 10 K during the test. It can be seen that the maximum TIMPD among the five mass ratios is as the mass ratio of SiO2 NPs to deionized water is 1:100 (unless otherwise denoted, the mass ratio is 1:100 in the following text).

3.1.2. Microstructure of iTEG

As shown in Figure 4b,c, the iTEG with or without SiO2 NPs was observed with a scanning electron microscope (SEM). The results reveal that there are many micropores and microchannels in the iTEG, and their diameter sizes are about 100 μm. This shows that the designed gelatin cross-linking network is successfully formed. In the iTEG with SiO2 NPs dispersed, a large number of granular substances can be observed, which presumably are the SiO2 NPs and their agglomerates. The particle size of the used SiO2 NPs is similar to that observed in the SEM images. There are many amino and carboxyl groups on the molecular chains of gelatin, and the surface of the SiO2 NPs contains hydroxyl groups, and there will be hydrogen bond interaction [28,35,43]. Therefore, SiO2 NPs will randomly attach to the gelatin matrix and form a rough cross-linking network with a higher specific surface area.

3.1.3. Ionic Conductivity and Thermal Conductivity of iTEG

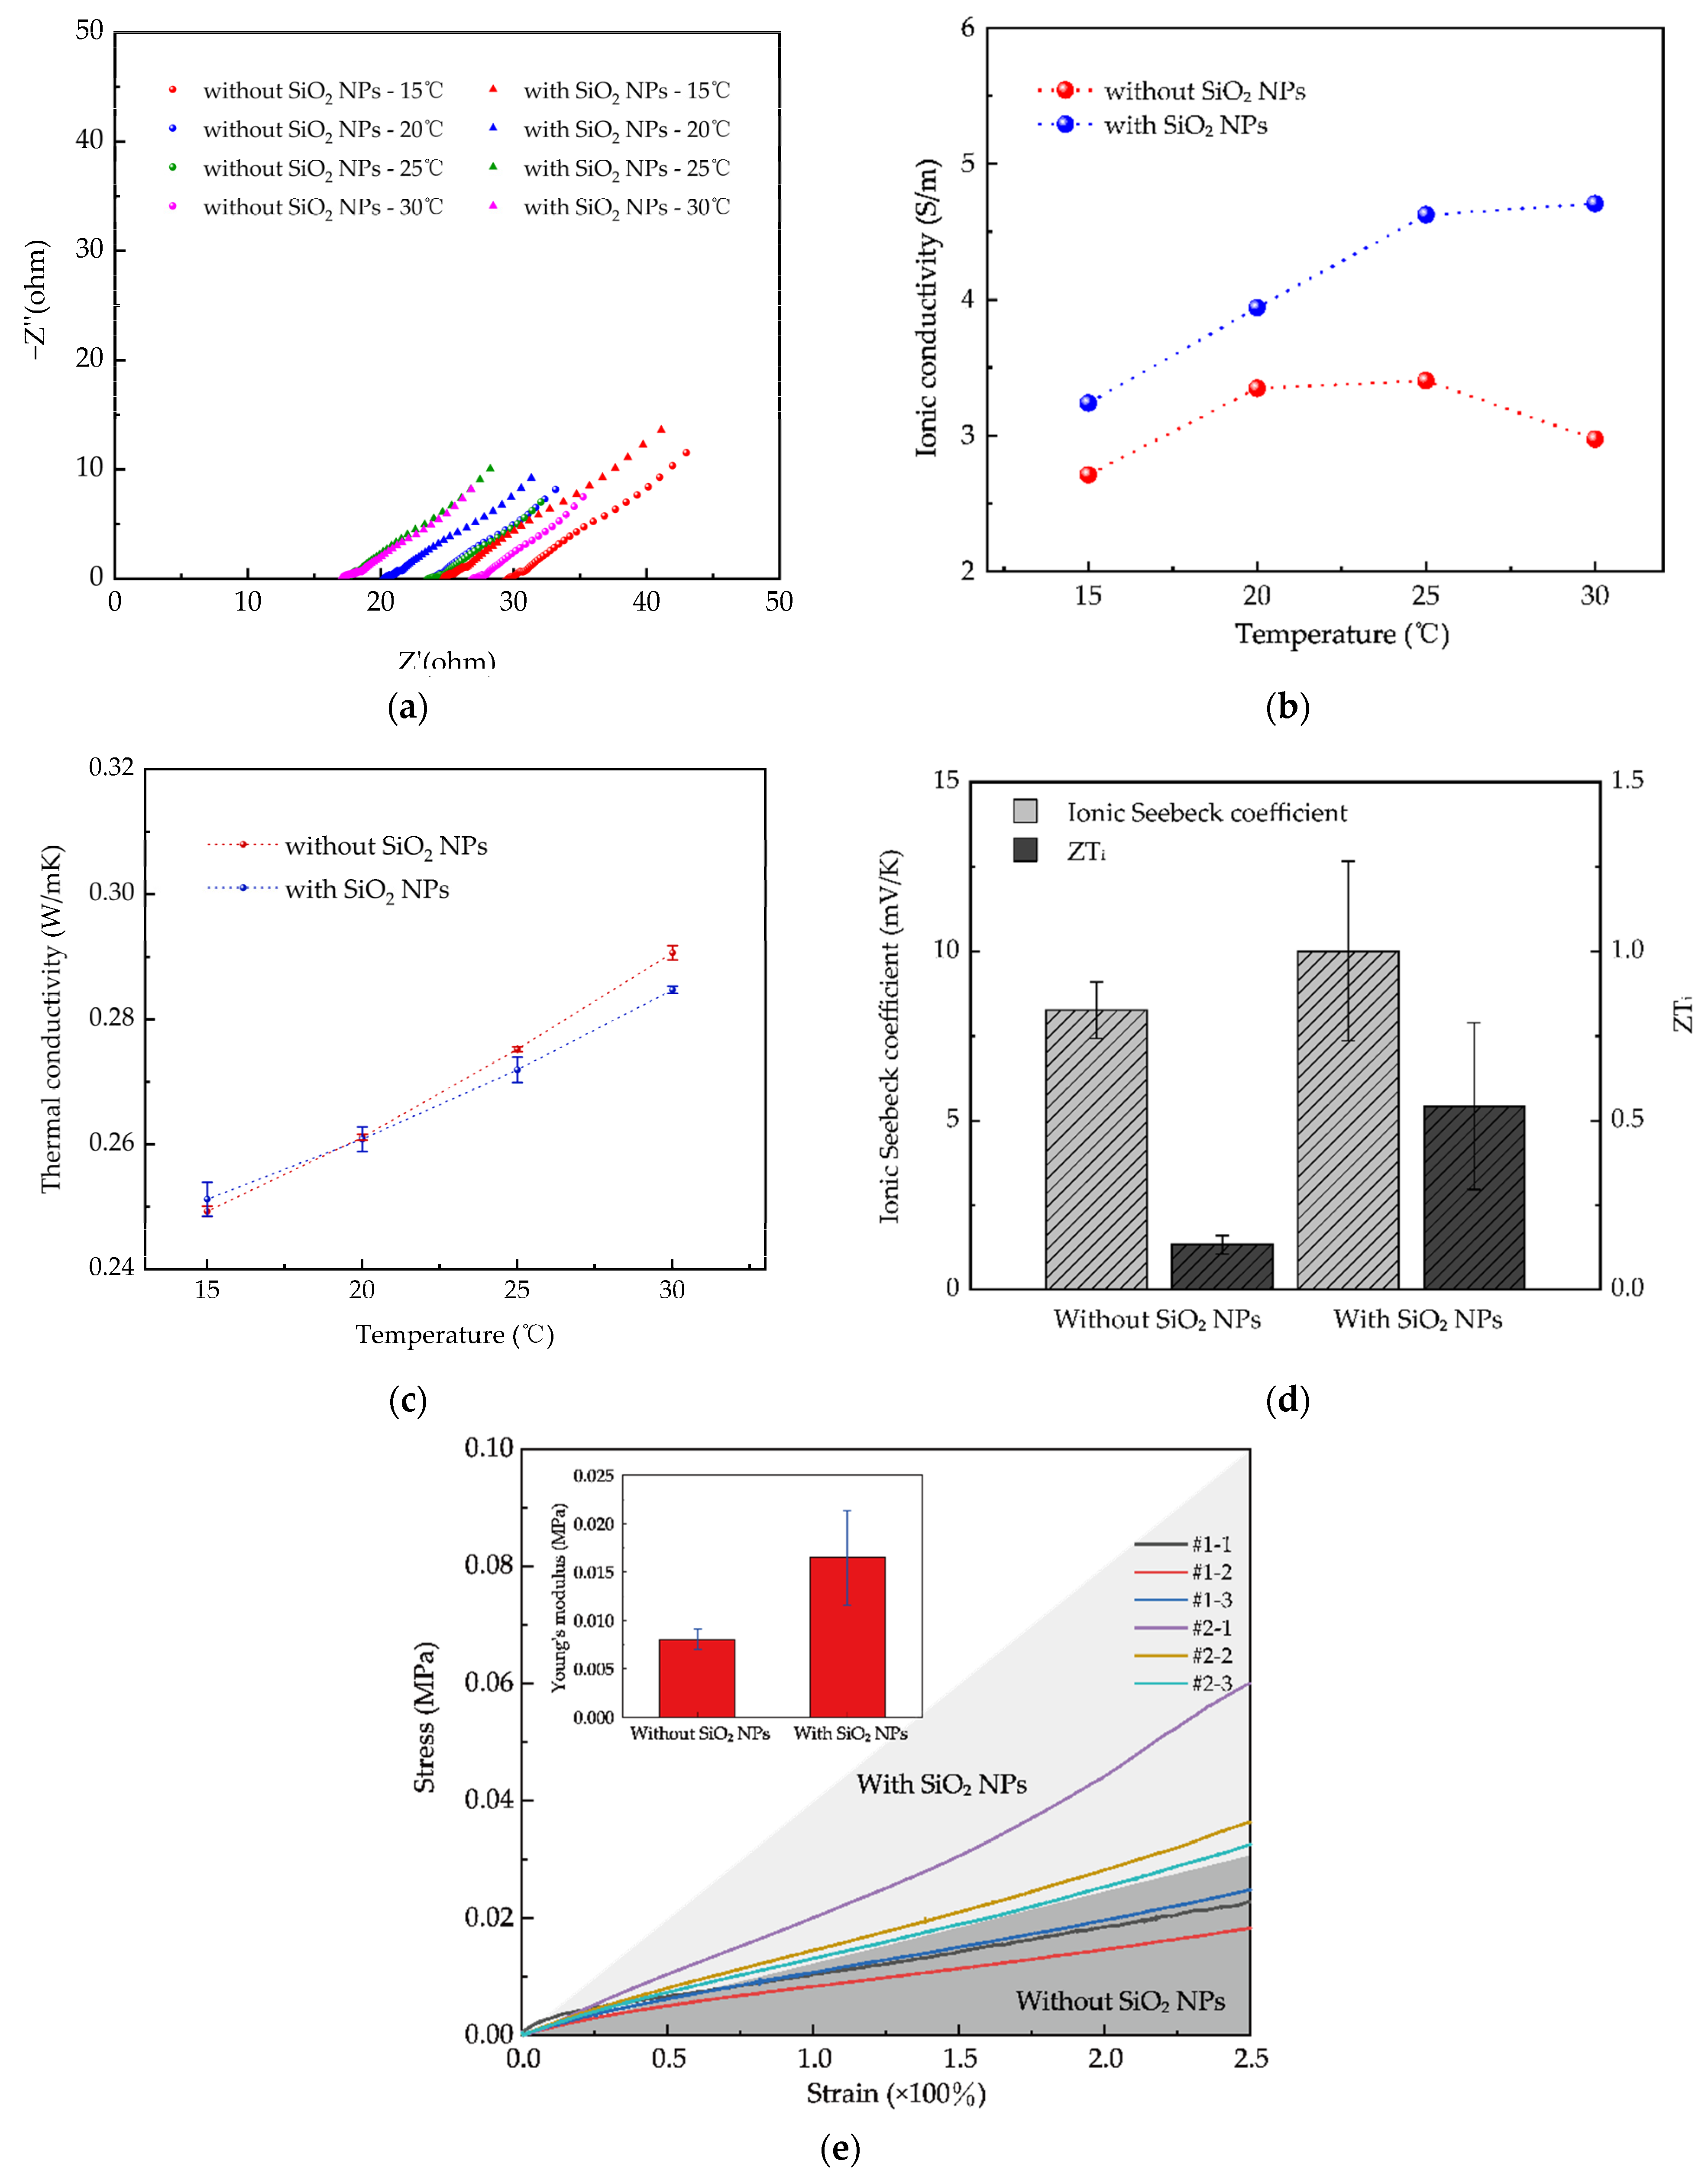
An electrochemical workstation (CHI760E, Chenhua Instrument Co., Ltd., Shanghai, China) was used to test the AC impedance spectrum of the iTEG. Two platinum electrodes (99.99%, 5 × 5 × 0.1 mm3) are used to clamp the iTEG blocks. The sample size was 5 × 5 × 2 mm3, and the high frequency was set to be 1 × 10⁶ Hz, low frequency to be 0.5 Hz, amplitude to be 0.01 V and static time to be 2 s. Figure 5a shows the Nyquist diagram of the iTEG at various temperatures. There are similar Nyquist diagrams in other literature on the conductivity of ionic gel electrolyte [29,35]. The conductivity of ionic gel (σi) can be calculated by the intercept of the X-axis at high frequency (the intrinsic resistance R) in the Nyquist plot and the sample size [29,35]. The formula is:
σ i = d R A
where d is the sample thickness and A is the effective electrode area [29,35]. According to this formula, the ionic conductivity curves of the iTEG containing SiO2 NPs and the blank control group were drawn, as shown in Figure 5b. The results prove that the iTEG with SiO2 NPs dispersed has higher ionic conductivity at various temperatures, and the conductivity of the composite increases with temperature. In addition, the ionic conductivity at 30 °C is smaller than that at 25 °C in the blank control group. When the temperature is relatively high, the migration rate of the ions in the gelatin network will be greater, so the conductivity increases with temperature. When the temperature is higher, the reason why conductivity increases slowly may be that the evaporation of the water in iTEG accelerates, thereby more water is lost in the test process, which reduces the conductivity. Ionic conductivity generally increases with the increase in temperature, and this temperature dependence can be explained by Vogel–Tammann–Fulcher (VTF) equation [44]. The growth of the iTEG conductivity is related to the interaction between SiO2 NPs and migrating ions, and its mechanism is similar to the effect of ceramic nanoparticles on the ionic conductivity of polymer electrolyte [35,45,46]. Lewis acid groups also exist on the surface of SiO2 NPs [35]. Similar to the carboxyl groups on gelatin molecular chains attracting anions, the hydroxyl groups on the surface of SiO2 NPs also tend to attract anions, which makes the molecular chains of the gelatin cross-linking network and the surface of SiO2 NPs tend to be negatively charged [28,35]. This interaction can disrupt the short-range ordered structure of ionic electrolyte, thus creating the free volume for the ion migration to improve the ions’ migration rate [35]. On the other hand, it has been pointed out that the interaction between SiO2 NPs surface and ionic electrolyte can reduce the activation energy of ionic gels; that is, the promotion of SiO2 NPs to ion transport leads to a decrease in activation energy [46,47,48].
The thermal conductivity of the iTEG with or without SiO2 NPs at various temperatures was measured by a thermal conductivity meter (Hot Disk TPS3500, Swedish Hot Disk Company, Gothenburg, Sweden), as shown in Figure 5c. It can be seen from the figure that the iTEG with SiO2 NPs has lower thermal conductivity at AT and above, but the decrease is not significant. In addition, the thermal conductivity of the iTEG increases with the rise in temperature. This may be because, when the temperature is higher, thermal motion of the matter in iTEG is more intense, which is conducive to heat transfer. The quantity of introduced SiO2 NPs is small, the size of SiO2 NPs is tiny, and the specific surface area of SiO2 NPs is massive. Therefore, the intrinsic thermal conductivity of silica (~1.4 W/(m·K) [49]) no longer plays a major role. In this case, the influence of nanoparticles on the thermal conductivity needs to be reconsidered. There is a large number of interfaces between nano-sized SiO2 NPs. The interface effect will inhibit the phonon transport across the SiO2 NPs in the iTEG, which reduces the thermal conductivity [35]. Here, the thermal conductivity of the pure SiO2 NPs is also tested by the Hot Disk thermal conductivity meter, and it is only ~0.0362 W/(m·K) (@ 25 °C), which supports the interpretation. The particle size of the pure SiO2 NPs used in the whole experiment is 15 nm.

3.1.4. Ionic Seebeck Coefficient and Thermoelectric Figure of Merit (ZTi) of iTEG

The ionic Seebeck coefficient is measured (by measuring three samples in each group, calculating the corresponding mean and standard deviation, and drawing the error bars) and the ZTi of iTEG with/without SiO2 NPs is calculated at room temperature according to the Formula (3), as shown in Figure 5d.
ZT i = S i 2 · σ i λ · T
where λ is the thermal conductivity and T is the absolute temperature in Kelvin (K). It can be seen from Figure 5d that although the Si of iTEG is increased by about 1/4, its error bar is longer, which means that after the SiO2 NPs are dispersed in the iTEG, the properties of the same batch of composites are not homogeneous, probably due to the partial agglomeration or uneven dispersion of SiO2 NPs in the iTEG precursor. The Si of iTEG reaches 10 mV/K. The increase in Si can be explained by the interaction between migrating ions and the SiO2 NPs. The surface of SiO2 NPs contains a large number of hydroxyl groups, which preferentially attract anions with large polarity [35]. Therefore, the mobility of Cl, [Fe(CN)6]3− and [Fe(CN)6]4− will decrease, which increases the difference of thermal diffusion rate between K+ and polar anions, thus increasing the Soret voltage [28,30,35]. This is similar to the interaction between the carboxyl groups on gelatin molecular chains and the anions [28].

3.1.5. Mechanical Properties of iTEG

Herein, a universal testing machine (CMT6104, Hengyu Instrument Co., Ltd., Shanghai, China) was applied to conduct the tensile tests on the iTEG to obtain its Young’s modulus and tensile properties. As Figure 5e shows, in addition to thermoelectric performance, the mechanical performance of the iTEG has also been improved. The iTEG mixed with SiO2 NPs can still be stretched to 3.5 times its original length without fracture, and its Young’s modulus is roughly doubled. The iTEG used as the blank control is soft and easily damaged with low mechanical strength, and it cannot match Ecoflex and human skin in modulus [50,51]. Therefore, increasing the Young’s modulus of the iTEG can promote its damage resistance for practical use. Compounding with inorganic nanoparticles is a common method to improve the mechanical properties of gelatin-based hydrogel [52]. There are two main reasons for the increase in the modulus of iTEG: one is that the modulus of silica is about 70 GPa [49], which is much larger than that of the iTEG, so the introduction of SiO2 NPs will increase the total modulus of the compound; secondly, there will be hydrogen bond interaction between the SiO2 NPs and the gelatin molecular chains, which may limit the deformation of the cross-linked network matrix under mechanical stress [43,52].

3.1.6. FTIR and Raman Spectra of iTEG

Figure 6a shows the Fourier transform infrared (FTIR) spectrum of the iTEG with/without SiO2 NPs, and Figure 6b offers the Raman spectrum. The FTIR spectra of the iTEG containing SiO2 NPs shows peaks of the Si–O bond and Si–O–Si bond, and the spectral peak of C≡N shifts blue slightly (from 2038.05 cm−1 to 2042.18 cm−1). All these show that SiO2 NPs are successfully compounded in the iTEG, the hydroxyl groups on the surface of SiO2 NPs are introduced, and they have interacted with [Fe(CN)6]3− and [Fe(CN)6]4−. The Raman spectrum shown in Figure 6b can also support this interpretation. The double peaks representing the characteristic of [Fe(CN)6]3− and [Fe(CN)6]4− increase the Raman shift after compounding SiO2 NPs.

3.2. Performance of Flexible Wearable TEG

3.2.1. Seebeck Coefficient and V-I-P Curves Tests

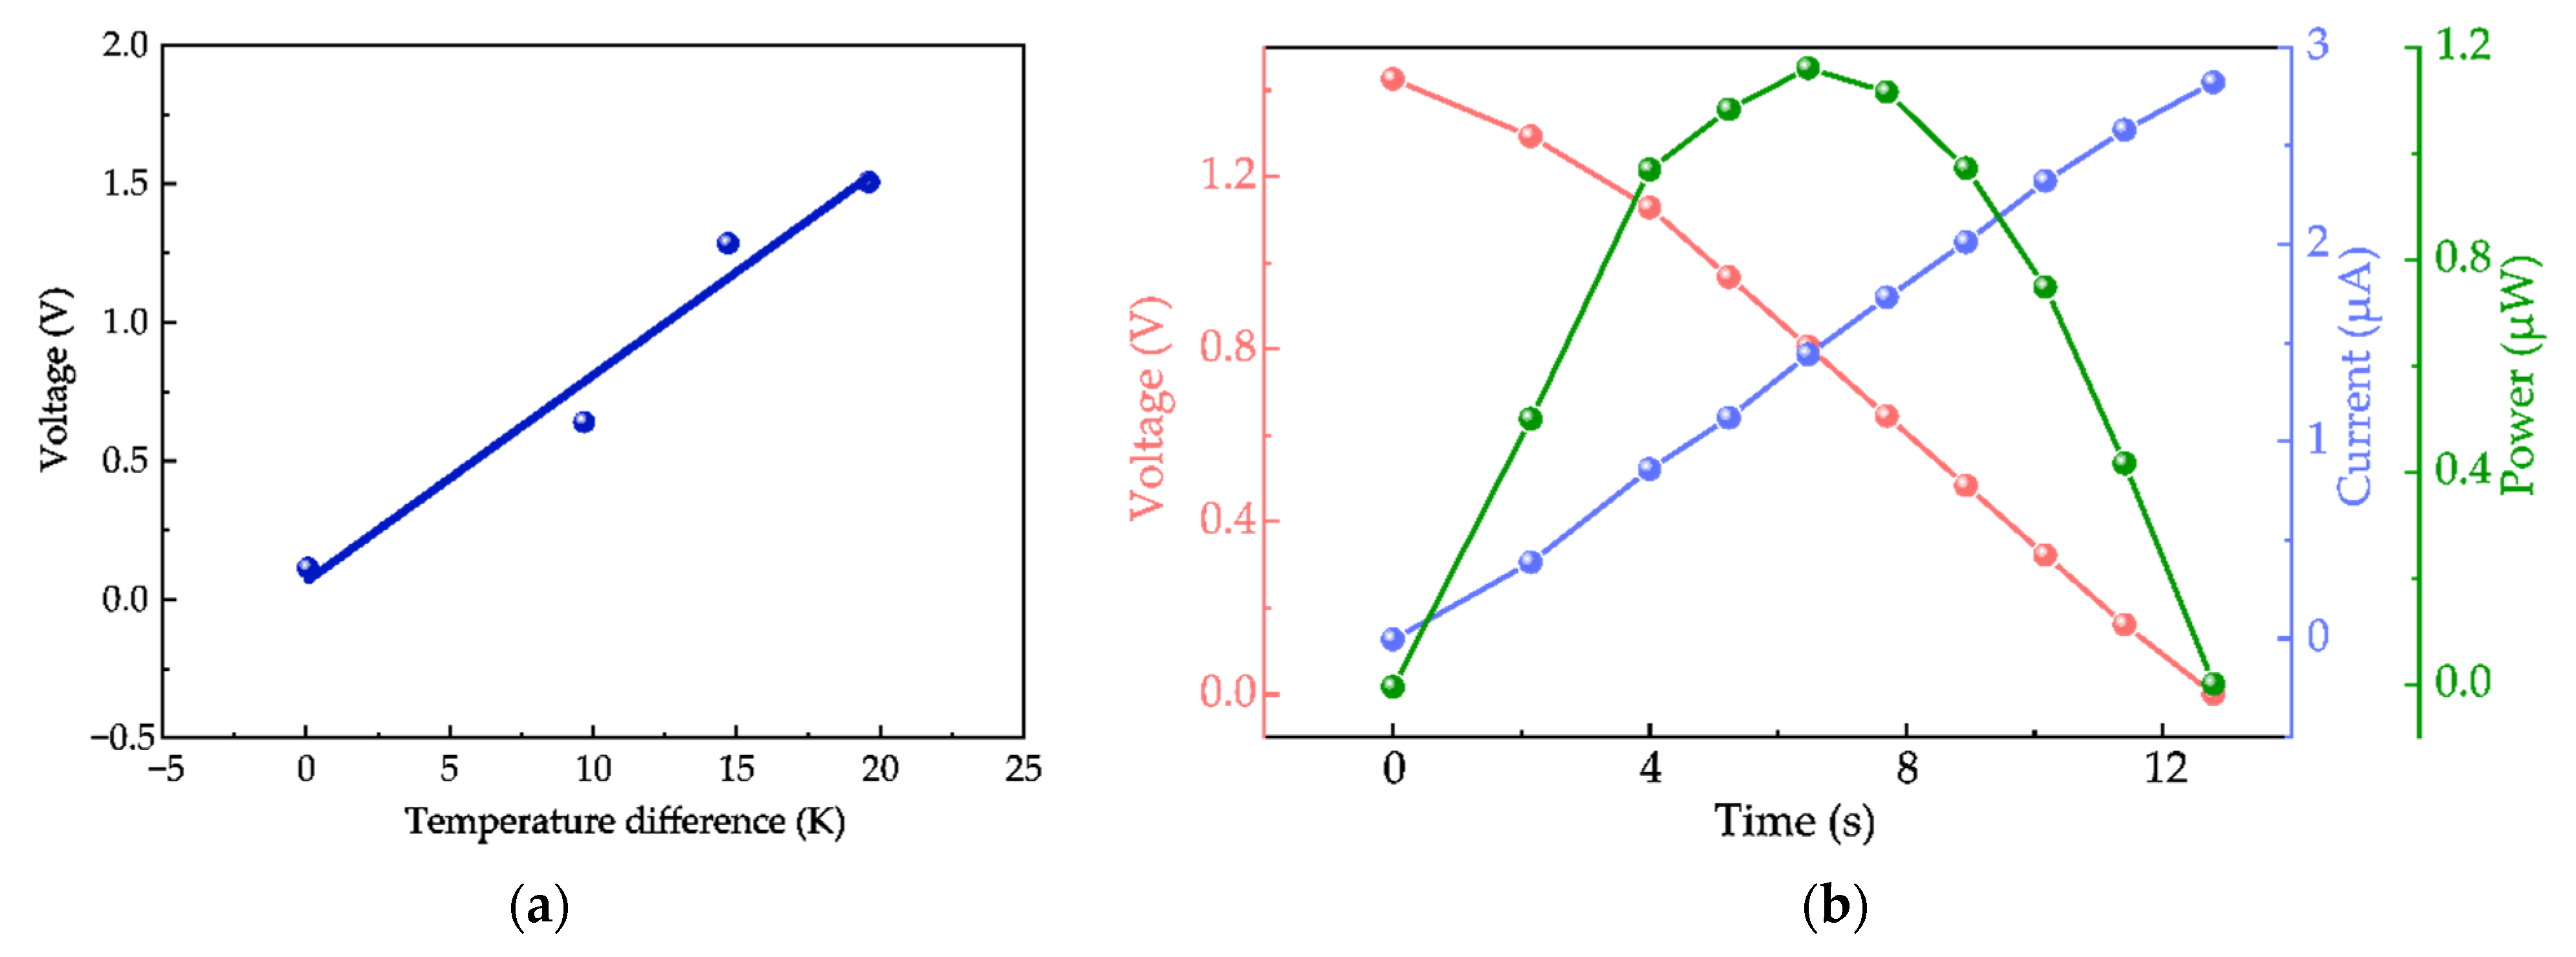
Firstly, the Seebeck coefficients of the STEG are characterized by the self-made testing platform. Figure 7a shows the curve of VOC–ΔT. It can be seen that the linear relationship between the VOC and ΔT across the STEG is apparent. After linear fitting, the Seebeck coefficient can be calculated as 74.5 mV/K. The Seebeck coefficient of the STEG is significantly less than the sum of Seebeck coefficient of all the iTEG units contained therein. If the Seebeck coefficients of all the 24 iTEG units are simply added together, the total Seebeck coefficient of ~240 mV/K can be obtained. This is because, in the encapsulated STEG, there are Ecoflex films on both sides of the iTEG unit in addition to copper foils. Although the Ecoflex film is significantly thin (~25 μm), the thermal conductivity of Ecoflex is low (0.2 W/(m·K) [53]), so the ΔT measured across the STEG will be much larger than the actual ΔT across its internal iTEG units. Figure 7b shows the output voltage–current–power (V-I-P) curves of the STEG scanned by the SMU. It can be seen from Figure 7b that the maximum power output of the STEG is 1.16 μW when the ΔT is 19.6 K. According to the size of the STEG (155 × 46 mm2), its TIMPD can be calculated as 0.424 μW/(m2·K2). When the load voltage decreases, the current in the circuit increases, and the curve of output power is parabolic.

3.2.2. Bending and Stretching Tests

TEG’s flexibility could be broken up into two parts: bendability and stretchability. The human forearm can be approximated as a cylinder with diameter of 80 mm and length of 200 mm. Herein an acrylic cylinder with a diameter of 80 mm is used to simulate the human forearm, and a rubber heating plate is attached to the sidewall of the acrylic cylinder to mimic the texture and temperature of human skin, and then they are put into a self-made temperature-controlled refrigeration box. The Seebeck coefficient and maximum output power of the STEG in two cases were tested, respectively, as shown in Figure 8a. The results reveal that cooling the cold end of the STEG by convective heat transfer rather than directly attaching it to a temperature-controlled plate will reduce the output voltage of the STEG, which is due to the existence of convective thermal resistance. To ensure a more accurate evaluation, a layer of 0.01 mm copper foil was laid on the cooling end of the STEG to help dissipate heat (only in this subsubsection). Compared with the unbent state, the Seebeck coefficient of the bent STEG is reduced by about 24.4%. However, the maximum output power in bending state is similar to that in the unbending condition, and the maximum output power in the bending state reaches 2.67 μW (the ΔT between the heating plate and the air is ~26 K), being reduced by only 3.3%. In conclusion, the bendability of the STEG is verified.
In addition to being soft and flexible, human skin can also be stretched slightly. Similar to the verification test of bendability, the rubber heating film tiled on an acrylic plate is still used to simulate human skin. When it is not stretched, the overall length of the STEG is 155 mm. The length after stretching is 186 mm, and the elongation is 20%, which is close to the elongation at break of human skin [54]. The Seebeck coefficient and maximum output power of the STEG in these two cases are also tested, respectively. The results are shown in Figure 8b. Compared with the non-stretched state, the Seebeck coefficient of the STEG after stretching is reduced by about 36.4%. It can be seen that the tensile deformation has a relatively significant impact on the STEG, which reduces the output voltage under a certain ΔT. The maximum output power of the STEG under stretching and non-stretching states is 1.65 μW and 2.41 μW, respectively. That is, when the STEG is stretched to 120%, the maximum output power of the STEG is reduced by about 31.5%. The reason why tensile deformation has a relatively significant impact may be that the stretching will make the iTEG units thinner, so as to reduce the ΔT, or because the stretching makes the cross-linked gelatin network matrix undergo great deformation, which affects the migration of ions in the matrix.

3.2.3. Impedance Matching Test

According to Ohm’s law, the power output reaches the maximum when the load resistance is equal to the internal resistance of the power supply. Therefore, matching the internal impedance of the flexible wearable TEG is of great significance for efficient utilization. Herein an electrometer (Keithley 6514, Keithley Instruments, Solon, OH, USA) was used to log the voltage on the load and then calculate the power and energy output from the STEG. Taking the energy consumed on the load resistance in a certain period as the evaluation index, the impedance matching experiment of the STEG was carried out. A total of five kinds of load resistance were tested. During the test, the ΔT across the STEG was kept at ~17 K. The voltage across the load during 1 h was acquired, and the current was calculated according to Ohm’s law, and then the power curve was obtained (Figure 9a). Next, the power is integrated with time to obtain the output energy, and the energy density curve was drawn, as shown in Figure 9a. It can be seen that after the load resistance is connected, the terminal voltage and output power drop rapidly. Then, the output power curves gradually flatten out, and the thermogalvanic effect plays a major role in this process [28]. The energy density curve presents the form of a parabola with the opening downward. Similar curves are reported on other TEG in the literature [28]. When the load is 2 MΩ, the STEG outputs the maximum energy density, which indicates that when the STEG is used as a power supply; its internal impedance is about 2 MΩ.

3.2.4. Capacitor Charging Test

As mentioned in the literature [28], the output voltage and current of the flexible wearable TEG are capacitive to a large extent, which leads to the fact that the output power is not constant. Therefore, it is necessary to utilize the energy output by TEG in a particular way. Herein, the prepared STEG is used as the power supply to charge capacitors of various capacities, so as to store the converted energy effectively. Eventually, sufficient energy is obtained to directly drive electronics without a DC–DC booster. Six capacitors with different capacities (1 μF/10 μF/22 μF/47 μF/100 μF/220 μF) are used as energy storage devices in the experiment. During the test, the ΔT across the STEG is kept at ~15.5 K, and an electrometer (Keithley 6514, USA) is used to record the voltage of the capacitors. As shown in Figure 9b, after the VOC of the STEG reaches saturation, the capacitor is connected into the circuit, and the STEG begins to charge the capacitor. After the capacitor of 220 μF is fully charged, a red LED is linked to the capacitor and is successfully driven.

3.2.5. Scalability of TEG and Optimization of Heat Dissipation Structure

In this subsection, the scalability of the flexible wearable TEG is studied, and an oversleeve LTEG is prepared through the same process as that of the STEG. To strive for greater ΔT across the TEG in application, further optimization is conducted by adding a heat dissipation structure on the cooling end of TEG. In order to test the thermoelectric performance of the LTEG, it was placed in a constant temperature biochemical incubator (SPX-50B, HongNuo Instrument Co., Ltd., Tianjin, China), which was used to simulate the environment at various temperatures. The rubber heating plate was still used to simulate human skin, which was placed under the LTEG, and the temperature of the rubber heating plate is set by a digital temperature controller (Yudian Automation Technology Co., Ltd., Xiamen, China). Two K-type thermocouples were used to obtain the temperature of the hot end of LTEG and the air in the incubator, respectively, and an electrometer was used to log the output voltage of the LTEG. The measured VOC–ΔT curve of the LTEG is shown in Figure 9c, and the Seebeck coefficient can be calculated as 191.7 mV/K.

3.3. Wearing Test

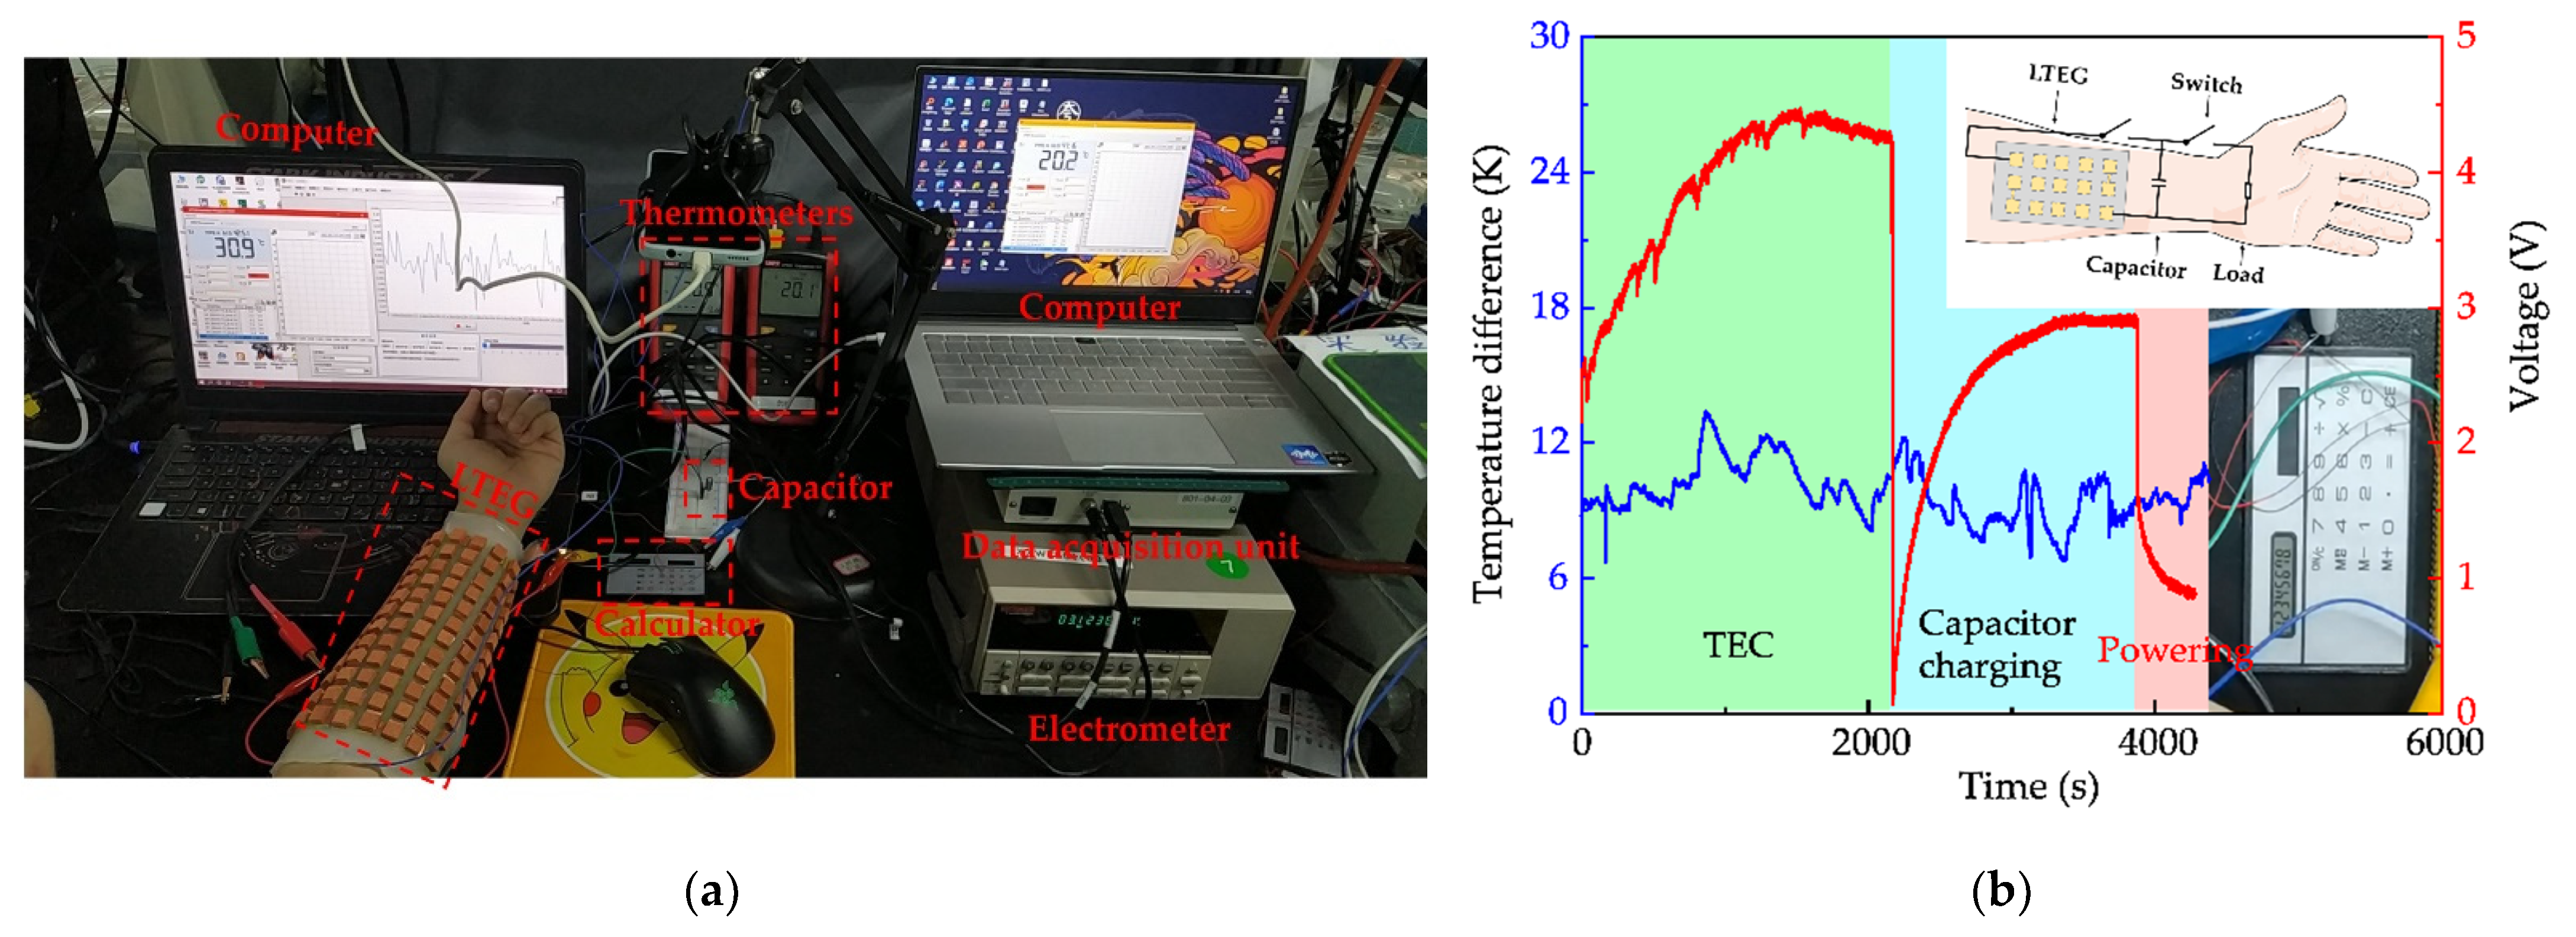
Herein, the prepared LTEG was worn on the forearm of a volunteer to conduct TEC test in a practical environment. The experimental scene is shown in Figure 10a. Two thermometers (UT320 series, UNI-T Technology Co., Ltd., Dongguan, China) were connected with K-type thermocouples to acquire the temperature of the forearm skin and the air. The electrometer was used with a data acquisition unit (USB-6255, National Instruments Corporation, Austin, TX, USA) to log the output voltage of the LTEG and the capacitor voltage. It can be seen that the temperature of the ambient air is about 20 °C, the temperature of the forearm skin is about 31 °C, and the ΔT is about 11 K. Figure 10b shows the VOC curve of the LTEG and the terminal voltage curve when charging a 220 μF capacitor. Power was supplied to an electronic calculator immediately after the capacitor was fully charged. From a ΔT of about 11 K, the LTEG outputs a VOC up to ~4 V, but when it charges the capacitor, it only lifts the capacitor voltage to nearly 3 V. This may be because the electrodes of the LTEG are polarized, the temperature of the forearm skin is decreasing, the load impedance decreases after connecting the capacitor, or voltage drops in the internal resistance of the LTEG when the circuit is closed and current flows. Then, the LTEG and capacitor together power and drive a calculator successfully, making it operate smoothly and display clearly, and the endurance time is nearly 2 min (Video S1 in the Supplementary Materials).

4. Conclusions

In summary, a series of studies on the ionic gelatin-based flexible wearable TEG with scalability for human body heat harvesting were carried out in this paper. An iTEG system with excellent thermoelectric and mechanical properties is described, which is composed of [Fe(CN)6]3−/[Fe(CN)6]4−/Cl/K+/SiO2 NPs/gelatin/deionized water. The ionic Seebeck coefficient of the iTEG can reach 10 mV/K. The optimal SiO2 NPs compound quantity is determined by the control variable method, and a series of characterization tests were carried out to help interpret and discuss the optimization mechanism. A set of manufacturing processes from the iTEG to TEG unit and then to scalable wearable TEG is proposed, and the material selection and preparation processes are described in detail. This manufacturing process does not require complicated and expensive processing equipment, lengthy processes, or use of fragile, toxic, rigid raw materials. In short, it is a relatively simple, low-cost and scalable fabrication process. In order to test the performance of the prepared TEG, a customized testing platform is built. Then, a kind of flexible wearable TEG with scalability based on the new iTEG was designed. Herein, two TEGs were prepared to intuitively convey the idea. Firstly, the STEG was fabricated, its Si is 74.5 mV/K, its Pmax is 1.16 μW, and its TIMPD is 0.424 μW/(m2·K2). Then, its bendability and stretchability were verified, and the impedance matching test was carried out. By storing the converted energy in a capacitor, the STEG directly lights up an LED without a DC–DC booster, which proves the availability of the STEG, whereas there will be convective thermal resistance between the TEG and air in the practical scene. Given that, the STEG was extended to the LTEG in order to demonstrate the scalability of the designed flexible wearable TEG, and a set of heat sinks was added on the LTEG. Finally, the wearability experiment of the LTEG was carried out. The LTEG successfully drives a calculator without a DC–DC booster by harvesting human body heat in a normal environment (~20 °C), which not only shows the practicability of the LTEG, but also proves the excellent scalability. The results and discussion in this work may offer a new train of thought for the topics of self-powered devices, human body heat harvesting, WEH, TEG and their applications.

Supplementary Materials

The following supporting information can be downloaded at: https://www.mdpi.com/article/10.3390/en15093441/s1, Video S1: The LTEG and capacitor together power a calculator directly, making it operate smoothly and display clearly, and the endurance time is nearly 2 min.

Author Contributions

Conceptualization, S.W.; methodology, S.W. and Y.D.; software, S.W. and L.H.; validation, S.W., L.H. and H.L.; investigation, S.W. and H.L.; data curation, S.W.; writing—original draft preparation, S.W.; writing—review and editing, Y.D.; supervision, Y.D.; project administration, Y.D.; funding acquisition, Y.D. and X.W. All authors have read and agreed to the published version of the manuscript.

Funding

This research was funded by Shenzhen Science and Technology Innovation Committee (WDZC20200819143234001), National Natural Science Foundation of China (61971262) and Natural Science Foundation of Guangdong Province (2020A1515010618).

Institutional Review Board Statement

The study was conducted according to the guidelines of the Declaration of Helsinki and approved by the Institutional Ethics Committee of Tsinghua Shenzhen International Graduate School, Tsinghua University.

Informed Consent Statement

Informed consent was obtained from all subjects involved in the study.

Data Availability Statement

The data presented in this study are available on request from the corresponding author.

Acknowledgments

The authors would like to acknowledge the support from the volunteer.

Conflicts of Interest

The authors declare no conflict of interest.

Abbreviations

WEHWearable energy harvester
ATAtmospheric temperature
RFRadio Frequency
△TTemperature difference
TECThermoelectric conversion
TEGThermoelectric generator
TEMThermoelectric material
PVAPoly(vinyl alcohol)
SiO2 NPsSilica nanoparticles
iTEGIonic thermoelectric gel
SMUSource measure unit
DAUData acquisition unit
STEGSmall wristband TEG (3 rows × 8 columns iTEG units)
LTEGLarge extended oversleeve TEG (9 rows × 12 columns iTEG units)
TIMPDTemperature-insensitive maximum power density
SEMScanning electron microscope
V-I-PVoltage–current–power
SiIonic Seebeck coefficient
VOCOpen-circuit voltage
PmaxThe maximum output power
AEffective electrode area
σiIonic conductivity
RIntrinsic resistance
dSample thickness
ZTiThermoelectric figure of merit of iTEG
λThermal conductivity
TTemperature

References

  1. Huawei Consumer Business Official Website. Available online: https://consumer.huawei.com/cn/ (accessed on 24 March 2022).
  2. Trung, T.Q.; Lee, N.-E. Flexible and stretchable physical sensor integrated platforms for wearable human-activity monitoringand personal healthcare. Adv. Mater. 2016, 28, 4338–4372. [Google Scholar] [CrossRef]
  3. Kim, W.-G.; Kim, D.-W.; Tcho, I.-W.; Kim, J.-K.; Kim, M.-S.; Choi, Y.-K. Triboelectric nanogenerator: Structure, mechanism, and applications. ACS Nano 2021, 15, 258–287. [Google Scholar] [CrossRef] [PubMed]
  4. Wu, H.; Huang, Y.; Xu, F.; Duan, Y.; Yin, Z. Energy harvesters for wearable and stretchable electronics: From flexibility to stretchability. Adv. Mater. 2016, 28, 9881–9919. [Google Scholar] [CrossRef] [PubMed]
  5. Tran, T.V.; Chung, W.-Y. High-efficient energy harvester with flexible solar panel for a wearable sensor device. IEEE Sens. J. 2016, 16, 9021–9028. [Google Scholar] [CrossRef]
  6. Kartsch, V.; Benatti, S.; Mancini, M.; Magno, M.; Benini, L. Smart wearable wristband for EMG based gesture recognition powered by solar energy harvester. In Proceedings of the 2018 IEEE International Symposium on Circuits and Systems (ISCAS), Florence, Italy, 27–30 May 2018; pp. 1–5. [Google Scholar]
  7. Delnavaz, A.; Voix, J. Electromagnetic micro-power generator for energy harvesting from breathing. In Proceedings of the IECON 2012-38th Annual Conference on IEEE Industrial Electronics Society, Montreal, QC, Canada, 25–28 October 2012; pp. 984–988. [Google Scholar]
  8. Padasdao, B.; Boric-Lubecke, O. Respiratory rate detection using a wearable electromagnetic generator. In Proceedings of the 2011 Annual International Conference of the IEEE Engineering in Medicine and Biology Society, Boston, MA, USA, 30 August–3 September 2011; pp. 3217–3220. [Google Scholar]
  9. Hamid, R.; Yuce, M.R. A wearable energy harvester unit using piezoelectric–electromagnetic hybrid technique. Sens. Actuators A Phys. 2017, 257, 198–207. [Google Scholar] [CrossRef]
  10. Zhao, J.; You, Z. A shoe-embedded piezoelectric energy harvester for wearable sensors. Sensors 2014, 14, 12497–12510. [Google Scholar] [CrossRef]
  11. Jung, W.-S.; Lee, M.-J.; Kang, M.-G.; Moon, H.G.; Yoon, S.-J.; Baek, S.-H.; Kang, C.-Y. Powerful curved piezoelectric generator for wearable applications. Nano Energy 2015, 13, 174–181. [Google Scholar] [CrossRef]
  12. Qian, F.; Xu, T.-B.; Zuo, L. Design, optimization, modeling and testing of a piezoelectric footwear energy harvester. Energy Convers. Manag. 2018, 171, 1352–1364. [Google Scholar] [CrossRef]
  13. Lee, S.; Ko, W.; Oh, Y.; Lee, J.; Baek, G.; Lee, Y.; Sohn, J.; Cha, S.; Kim, J.; Park, J.; et al. Triboelectric energy harvester based on wearable textile platforms employing various surface morphologies. Nano Energy 2015, 12, 410–418. [Google Scholar] [CrossRef]
  14. Wen, Z.; Yang, Y.; Sun, N.; Li, G.; Liu, Y.; Chen, C.; Shi, J.; Xie, L.; Jiang, H.; Bao, D.; et al. A wrinkled PEDOT: PSS film based stretchable and transparent triboelectric nanogenerator for wearable energy harvesters and active motion sensors. Adv. Funct. Mater. 2018, 28, 1803684. [Google Scholar] [CrossRef]
  15. Masotti, D.; Costanzo, A.; Adami, S. Design and realization of a wearable multi-frequency RF energy harvesting system. In Proceedings of the 5th European Conference on Antennas and Propagation (EUCAP), Rome, Italy, 11–15 April 2011; pp. 517–520. [Google Scholar]
  16. Nguyen, S.; Amirtharajah, R. A hybrid RF and vibration energy harvester for wearable devices. In Proceedings of the 2018 IEEE Applied Power Electronics Conference and Exposition (APEC), San Antonio, TX, USA, 4–8 March 2018; pp. 1060–1064. [Google Scholar]
  17. Wu, X.; Gao, N.; Jia, H.; Wang, Y. Thermoelectric converters based on ionic conductors. Chem. Asian J. 2021, 16, 129–141. [Google Scholar] [CrossRef] [PubMed]
  18. Duan, J.; Yu, B.; Huang, L.; Hu, B.; Xu, M.; Feng, G.; Zhou, J. Liquid-state thermocells: Opportunities and challenges for low-grade heat harvesting. Joule 2021, 5, 768–779. [Google Scholar] [CrossRef]
  19. Tamura, T.; Huang, M.; Togawa, T. Body temperature, heat flow, and evaporation. In Seamless Healthcare Monitoring: Advancements in Wearable, Attachable, and Invisible Devices; Tamura, T., Chen, W., Eds.; Springer International Publishing: Cham, Switzerland, 2018; pp. 281–307. [Google Scholar]
  20. Park, T.; Lim, H.; Hwang, J.U.; Na, J.; Lee, H.; Kim, E. Roll type conducting polymer legs for rigid-flexible thermoelectric generator. APL Mater. 2017, 5, 074106. [Google Scholar] [CrossRef] [Green Version]
  21. Feng, R.; Tang, F.; Zhang, N.; Wang, X. Flexible, high-power density, wearable thermoelectric nanogenerator and self-powered temperature sensor. ACS Appl. Mater. Interfaces 2019, 11, 38616–38624. [Google Scholar] [CrossRef] [PubMed]
  22. Goncalves, L.; Alpuim, P.; Correia, J. Fabrication of thermoelectric devices by applying microsystems technology. J. Electron. Mater. 2010, 39, 1516–1521. [Google Scholar] [CrossRef]
  23. Xia, C.; Zhang, D.; Pedrycz, W.; Fan, K.; Guo, Y. Human body heat based thermoelectric harvester with ultra-low input power management system for wireless sensors powering. Energies 2019, 12, 3942. [Google Scholar] [CrossRef] [Green Version]
  24. Thielen, M.; Sigrist, L.; Magno, M.; Hierold, C.; Benini, L. Human body heat for powering wearable devices: From thermal energy to application. Energy Convers. Manag. 2017, 131, 44–54. [Google Scholar] [CrossRef] [Green Version]
  25. Wang, Z.; Leonov, V.; Fiorini, P.; Van Hoof, C. Realization of a wearable miniaturized thermoelectric generator for human body applications. Sens. Actuators A Phys. 2009, 156, 95–102. [Google Scholar] [CrossRef]
  26. Wang, Y.; Yang, L.; Shi, X.-L.; Shi, X.; Chen, L.; Dargusch, M.S.; Zou, J.; Chen, Z.-G. Flexible thermoelectric materials and generators: Challenges and innovations. Adv. Mater. 2019, 31, 1807916. [Google Scholar] [CrossRef]
  27. Wu, J.; Black, J.J.; Aldous, L. Thermoelectrochemistry using conventional and novel gelled electrolytes in heat-to-current thermocells. Electrochim. Acta 2017, 225, 482–492. [Google Scholar] [CrossRef] [Green Version]
  28. Han, C.-G.; Qian, X.; Li, Q.; Deng, B.; Zhu, Y.; Han, Z.; Zhang, W.; Wang, W.; Feng, S.-P.; Chen, G. Giant thermopower of ionic gelatin near room temperature. Science 2020, 368, 1091–1098. [Google Scholar] [CrossRef] [PubMed]
  29. Cheng, H.; He, X.; Fan, Z.; Ouyang, J. Flexible quasi-solid state ionogels with remarkable seebeck coefficient and high thermoelectric properties. Adv. Energy Mater. 2019, 9, 1901085. [Google Scholar] [CrossRef]
  30. Li, T.; Zhang, X.; Lacey, S.D.; Mi, R.; Zhao, X.; Jiang, F.; Song, J.; Liu, Z.; Chen, G.; Dai, J. Cellulose ionic conductors with high differential thermal voltage for low-grade heat harvesting. Nat. Mater. 2019, 18, 608–613. [Google Scholar] [CrossRef] [PubMed]
  31. Yang, P.; Liu, K.; Chen, Q.; Mo, X.; Zhou, Y.; Li, S.; Feng, G.; Zhou, J. Wearable thermocells based on gel electrolytes for the utilization of body heat. Angew. Chem. 2016, 128, 12229–12232. [Google Scholar] [CrossRef]
  32. Duan, J.; Yu, B.; Liu, K.; Li, J.; Yang, P.; Xie, W.; Xue, G.; Liu, R.; Wang, H.; Zhou, J. PN conversion in thermogalvanic cells induced by thermo-sensitive nanogels for body heat harvesting. Nano Energy 2019, 57, 473–479. [Google Scholar] [CrossRef]
  33. Yu, B.; Duan, J.; Cong, H.; Xie, W.; Liu, R.; Zhuang, X.; Wang, H.; Qi, B.; Xu, M.; Wang, Z.L. Thermosensitive crystallization–boosted liquid thermocells for low-grade heat harvesting. Science 2020, 370, 342–346. [Google Scholar] [CrossRef] [PubMed]
  34. Liu, W.; Qian, X.; Han, C.-G.; Li, Q.; Chen, G. Ionic thermoelectric materials for near ambient temperature energy harvesting. Appl. Phys. Lett. 2021, 118, 020501. [Google Scholar] [CrossRef]
  35. He, X.; Cheng, H.; Yue, S.; Ouyang, J. Quasi-solid state nanoparticle/(ionic liquid) gels with significantly high ionic thermoelectric properties. J. Mater. Chem. A 2020, 8, 10813–10821. [Google Scholar] [CrossRef]
  36. Zhang, L.; Kim, T.; Li, N.; Kang, T.J.; Chen, J.; Pringle, J.M.; Zhang, M.; Kazim, A.H.; Fang, S.; Haines, C. High power density electrochemical thermocells for inexpensively harvesting low-grade thermal energy. Adv. Mater. 2017, 29, 1605652. [Google Scholar] [CrossRef]
  37. Romano, M.S.; Li, N.; Antiohos, D.; Razal, J.M.; Nattestad, A.; Beirne, S.; Fang, S.; Chen, Y.; Jalili, R.; Wallace, G.G.; et al. Carbon nanotube-reduced graphene oxide composites for thermal energy harvesting applications. Adv. Mater. 2013, 25, 6602–6606. [Google Scholar] [CrossRef] [Green Version]
  38. Hu, R.; Cola, B.A.; Haram, N.; Barisci, J.N.; Lee, S.; Stoughton, S.; Wallace, G.; Too, C.; Thomas, M.; Gestos, A. Harvesting waste thermal energy using a carbon-nanotube-based thermo-electrochemical cell. Nano Lett. 2010, 10, 838–846. [Google Scholar] [CrossRef] [PubMed]
  39. Smooth-On, Inc. Official Website. Available online: https://www.smooth-on.com/ (accessed on 24 March 2022).
  40. Duan, J.; Feng, G.; Yu, B.; Li, J.; Chen, M.; Yang, P.; Feng, J.; Liu, K.; Zhou, J. Aqueous thermogalvanic cells with a high Seebeck coefficient for low-grade heat harvest. Nat. Commun. 2018, 9, 1–8. [Google Scholar] [CrossRef] [PubMed] [Green Version]
  41. Shi, Y.; Wang, Y.; Mei, D.; Chen, Z. Wearable thermoelectric generator with copper foam as the heat sink for body heat harvesting. IEEE Access 2018, 6, 43602–43611. [Google Scholar] [CrossRef]
  42. Im, H.; Kim, T.; Song, H.; Choi, J.; Park, J.S.; Ovalle-Robles, R.; Yang, H.D.; Kihm, K.D.; Baughman, R.H.; Lee, H.H.; et al. High-efficiency electrochemical thermal energy harvester using carbon nanotube aerogel sheet electrodes. Nat. Commun. 2016, 7, 10600. [Google Scholar] [CrossRef] [PubMed] [Green Version]
  43. Smitha, S.; Mukundan, P.; Krishna Pillai, P.; Warrier, K.G.K. Silica–gelatin bio-hybrid and transparent nano-coatings through sol–gel technique. Mater. Chem. Phys. 2007, 103, 318–322. [Google Scholar] [CrossRef]
  44. Vila, J.; Ginés, P.; Pico, J.; Franjo, C.; Jiménez, E.; Varela, L.; Cabeza, O. Temperature dependence of the electrical conductivity in EMIM-based ionic liquids: Evidence of Vogel–Tamman–Fulcher behavior. Fluid Phase Equilibria 2006, 242, 141–146. [Google Scholar] [CrossRef]
  45. Wieczorek, W.; Such, K.; Wyciślik, H.; Płocharski, J. Modifications of crystalline structure of PEO polymer electrolytes with ceramic additives. Solid State Ion. 1989, 36, 255–257. [Google Scholar] [CrossRef]
  46. Liu, W.; Liu, N.; Sun, J.; Hsu, P.-C.; Li, Y.; Lee, H.-W.; Cui, Y. Ionic conductivity enhancement of polymer electrolytes with ceramic nanowire fillers. Nano Lett. 2015, 15, 2740–2745. [Google Scholar] [CrossRef]
  47. Liu, W.; Lee, S.W.; Lin, D.; Shi, F.; Wang, S.; Sendek, A.D.; Cui, Y. Enhancing ionic conductivity in composite polymer electrolytes with well-aligned ceramic nanowires. Nat. Energy 2017, 2, 17035. [Google Scholar] [CrossRef]
  48. Wang, S.; Shi, Q.X.; Ye, Y.S.; Xue, Y.; Wang, Y.; Peng, H.Y.; Xie, X.L.; Mai, Y.W. Constructing desirable ion-conducting channels within ionic liquid-based composite polymer electrolytes by using polymeric ionic liquid-functionalized 2D mesoporous silica nanoplates. Nano Energy 2017, 33, 110–123. [Google Scholar] [CrossRef]
  49. Properties: Silica-Silicon Dioxide (SiO2). Available online: https://www.azom.com/properties.aspx?ArticleID=1114 (accessed on 24 March 2022).
  50. Yoon, J.; Lee, J.; Hur, J. Stretchable supercapacitors based on carbon nanotubes-deposited rubber polymer nanofibers electrodes with high tolerance against strain. Nanomaterials 2018, 8, 541. [Google Scholar] [CrossRef] [PubMed] [Green Version]
  51. Pailler-Mattei, C.; Bec, S.; Zahouani, H. In vivo measurements of the elastic mechanical properties of human skin by indentation tests. Med Eng. Phys. 2008, 30, 599–606. [Google Scholar] [CrossRef] [PubMed]
  52. Kariminejad, M.; Sadeghi, E.; Rouhi, M.; Mohammadi, R.; Askari, F.; Taghizadeh, M.; Moradi, S. The effect of nano-SiO2 on the physicochemical and structural properties of gelatin-polyvinyl alcohol composite films. J. Food Process Eng. 2018, 41, e12817. [Google Scholar] [CrossRef]
  53. Bartlett, M.D.; Kazem, N.; Powell-Palm, M.J.; Huang, X.; Sun, W.; Malen, J.A.; Majidi, C. High thermal conductivity in soft elastomers with elongated liquid metal inclusions. Proc. Natl. Acad. Sci. USA 2017, 114, 2143–2148. [Google Scholar] [CrossRef] [Green Version]
  54. Jacquemoud, C.; Bruyere-Garnier, K.; Coret, M. Methodology to determine failure characteristics of planar soft tissues using a dynamic tensile test. J. Biomech. 2007, 40, 468–475. [Google Scholar] [CrossRef] [Green Version]
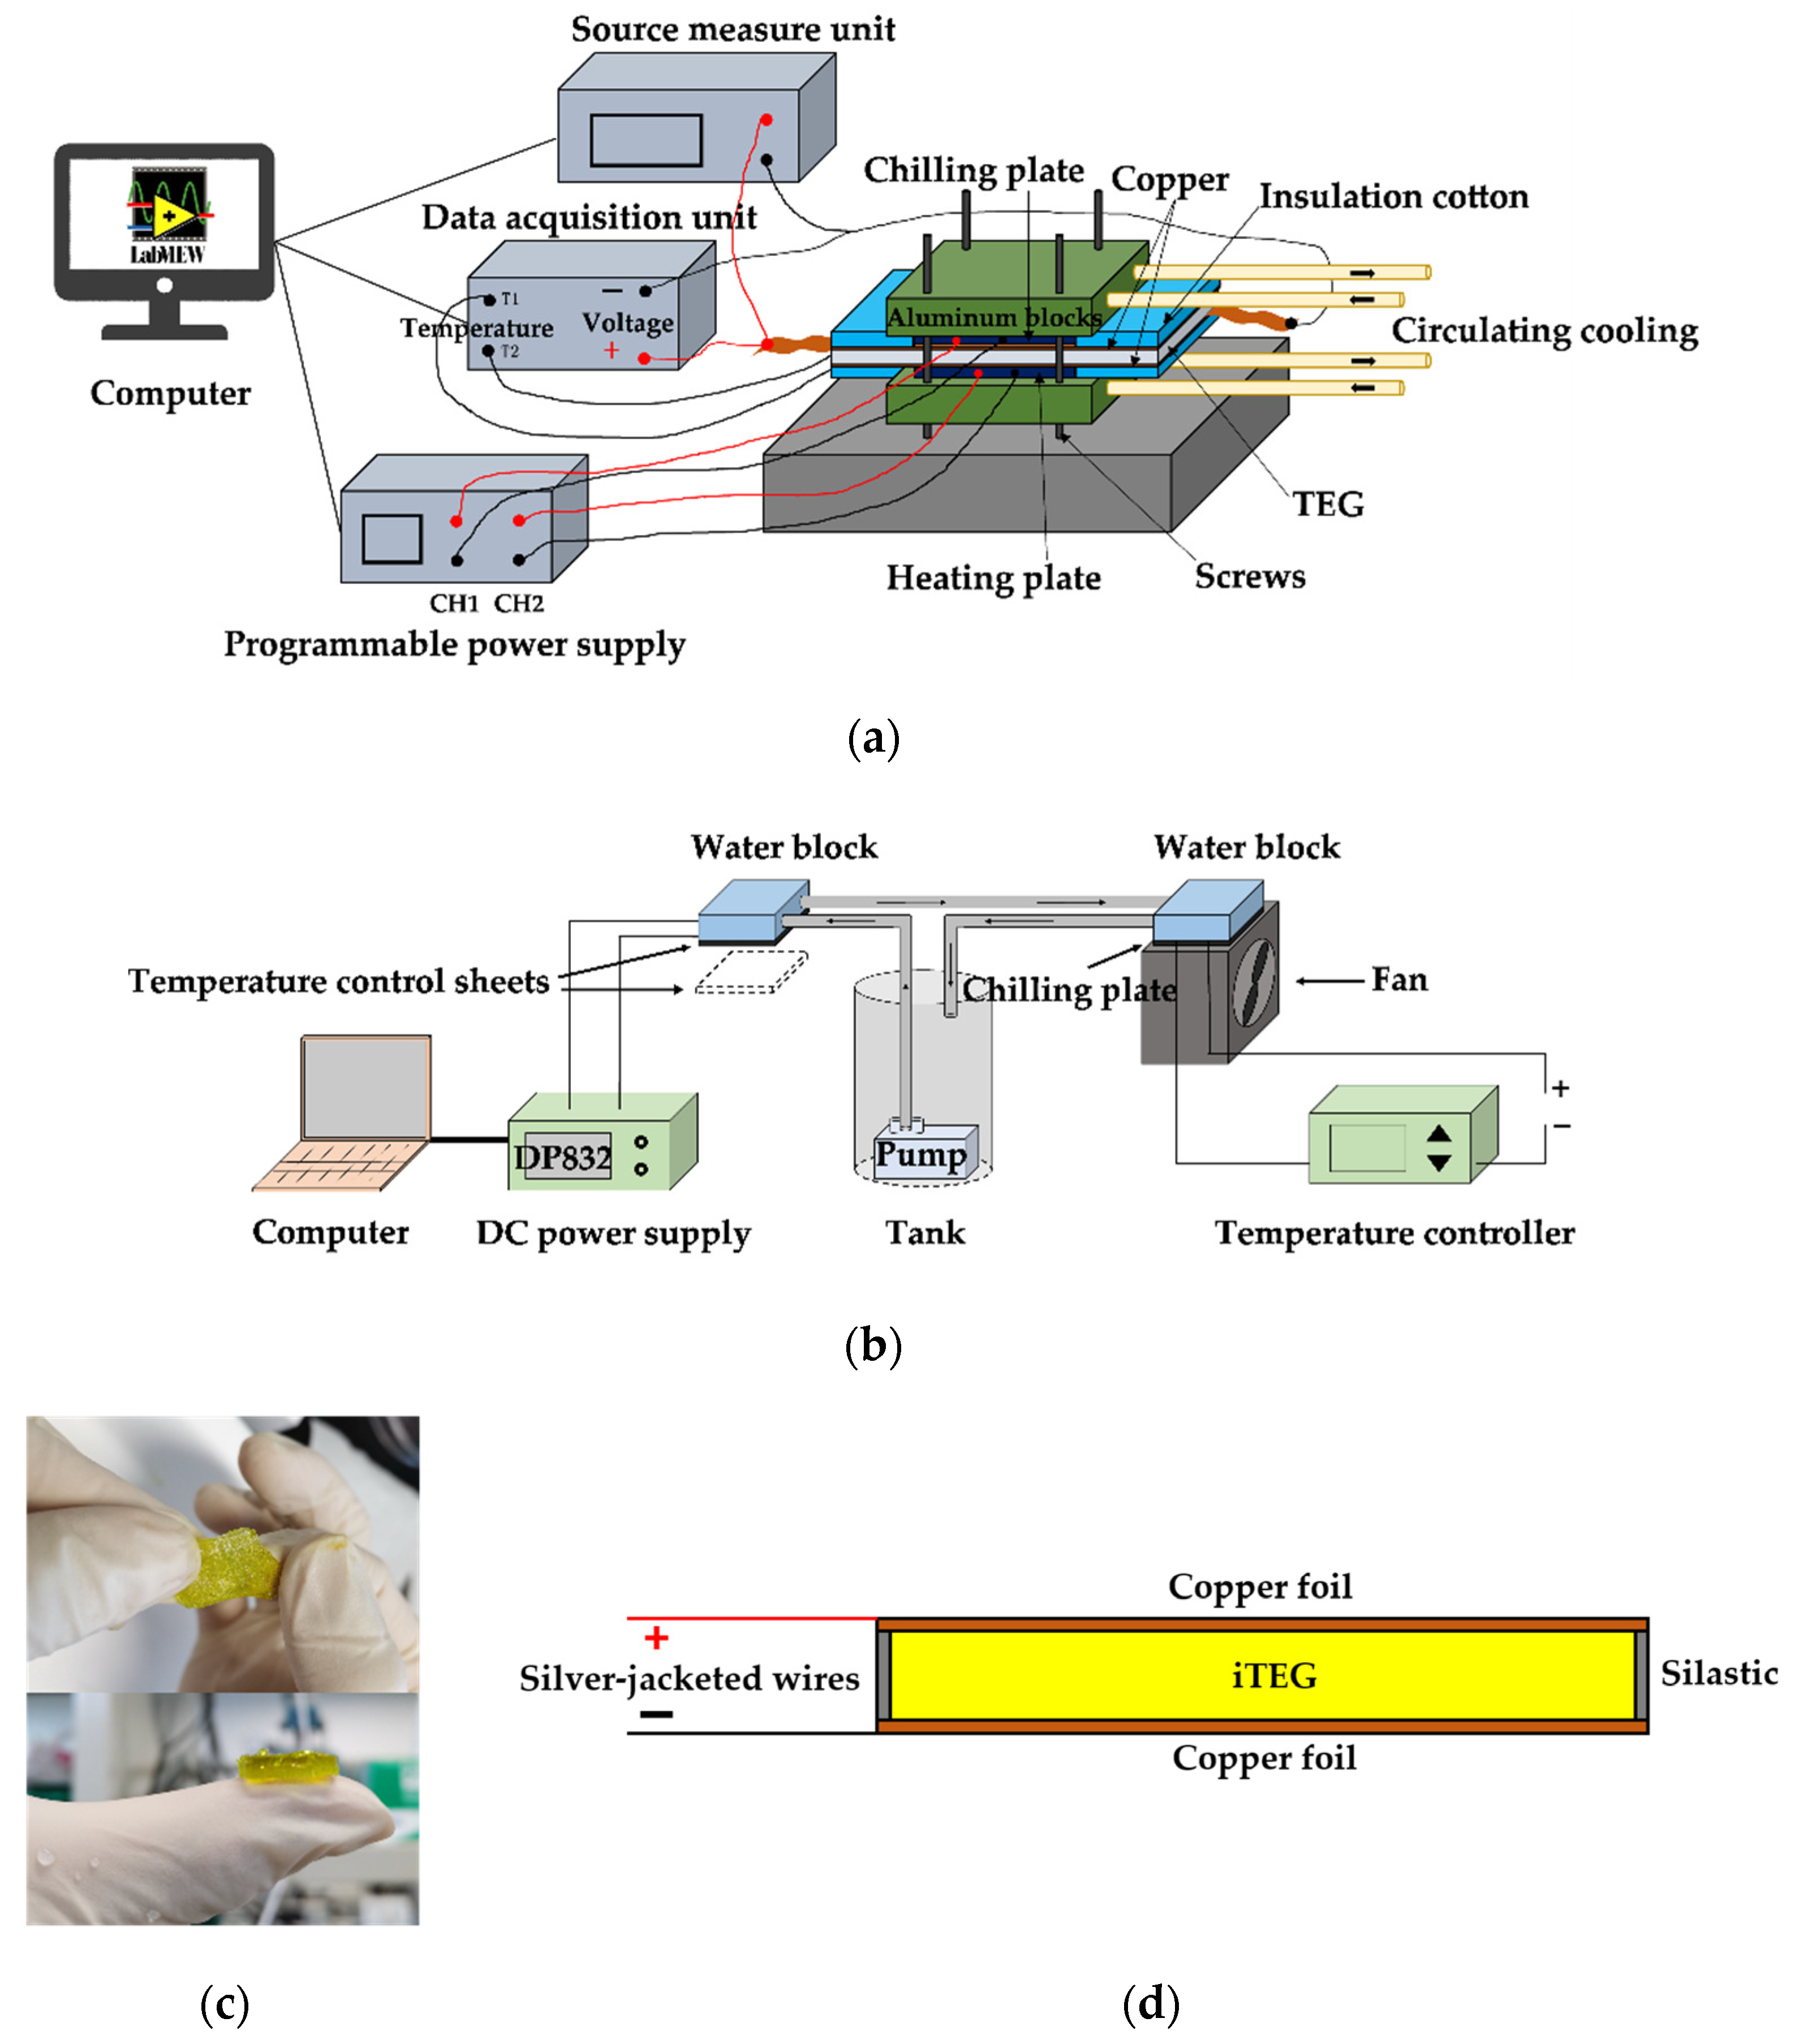
Figure 1. (a) Schematic diagram of the self-made TEG-testing platform; (b) schematic diagram of the two-stage circulating water-cooling system; (c) the jelly-like appearance of the iTEG block; (d) section diagram of the assembled TEG unit.
Energies 15 03441 g001
Figure 2. (a) Preparation process of the flexible Ecoflex frame; (b) the photo of a finished flexible frame; (c) manufacturing process of the flexible Ecoflex film; (d) the photo of a finished flexible film with thickness of ~25 μm.
Energies 15 03441 g002
Figure 3. (a) The assembly relationship of the flexible frame, films, electrodes and iTEG units in the TEG (inset is the photo of the 3D-printed die); (b) 3D exploded diagram of the flexible wearable STEG (inset is the photo of a finished flexible STEG); (c) microscopic picture of the copper foam; (d) photos of the LTEG.
Energies 15 03441 g003
Figure 4. (a) The temperature-insensitive maximum power density (TIMPD) of the prepared TEG units with different quantity of SiO2 NPs; (b) SEM images of the iTEG with SiO2 NPs; (c) SEM images of the iTEG without SiO2 NPs.
Energies 15 03441 g004
Figure 5. (a) Nyquist diagrams of the iTEG at various temperatures; (b) the ionic conductivity curves of the iTEG containing SiO2 NPs and the blank control group; (c) the thermal conductivity of the iTEG with or without SiO2 NPs at various temperatures; (d) the Si and ZTi of the iTEG with/without SiO2 NPs; (e) stress–strain curves and Young’s modulus for the iTEG with or without SiO2 NPs (the experiments are repeated three times in each case).
Energies 15 03441 g005
Figure 6. (a) Fourier transform infrared (FTIR) spectrum of the iTEG with/without SiO2 NPs; (b) Raman spectrum of the iTEG with/without SiO2 NPs.
Energies 15 03441 g006
Figure 7. (a) The VOC–ΔT curve of the STEG; (b) the output voltage–current–power (V-I-P) curves of the STEG scanned by the SMU.
Energies 15 03441 g007
Figure 8. (a) The Seebeck coefficient and maximum output power of the STEG in bending/non-bending state; (b) the Seebeck coefficient and maximum output power of the STEG in stretching/non-stretching state.
Energies 15 03441 g008
Figure 9. (a) The power curves of the STEG (insets are the output energy density curve of the STEG and the schematic diagram of the experimental circuit); (b) capacitor charging curves and the LED driving test; (c) the measured VOC–ΔT curve of the LTEG.
Energies 15 03441 g009
Figure 10. (a) The experimental scene of the LTEG wearing test; (b) the VOC curve of the LTEG and the terminal voltage curve when charging a 220 μF capacitor (insets are the photo of the driven electronic calculator and the schematic diagram of the experimental circuit).
Energies 15 03441 g010
Publisher’s Note: MDPI stays neutral with regard to jurisdictional claims in published maps and institutional affiliations.