Article

Murree Clay Problems and Water-Based Drilling Mud Optimization: A Case Study from the Kohat Basin in Northwestern Pakistan

by
S. M. Talha Qadri
1,*,
Waqas Ahmed
2,
A. K. M. Eahsanul Haque
3,
Ahmed E. Radwan
4,
Mohammad Hail Hakimi
5 and
Ahmed K. Abdel Aal
6
1
School of Land Use and Environmental Change, University of the Fraser Valley, Abbotsford, BC V2S 7M7, Canada
2
OGDCL Institute of Science and Technology, Islamabad 44000, Pakistan
3
The Geosciences and Petroleum Engineering Department, University Teknologi Petronas, Seri Iskandar 32610, Malaysia
4
Institute of Geological Sciences, Jagiellonian University in Krakow, 31-007 Krakow, Poland
5
Geology Department, Faculty of Applied Science, Taiz University, Taiz 6803, Yemen
6
Civil Engineering Department, Faculty of Engineering, Najran University, Najran P.O. Box 1988, Saudi Arabia
*
Author to whom correspondence should be addressed.
Energies 2022, 15(9), 3424; https://doi.org/10.3390/en15093424
Submission received: 28 March 2022 / Revised: 25 April 2022 / Accepted: 25 April 2022 / Published: 7 May 2022
(This article belongs to the Special Issue New Insights into Reservoir 3D Modeling and Simulation)

Abstract

:
Drilling fluids with subtle filtration and rheological characteristics are essential to optimize the functioning of oil and gas well drills. The Early Miocene Murree Formation in the Kohat Basin of Pakistan is generally referred to as the Murree Clays. When mixed with water-base drilling mud, ultra-fine particles of the Murree Formation tend to eradicate default fluid rheological properties and result in wellbore instabilities during drilling in that area. To obtain the optimized mud to deliver the drilling operation efficiently, we aimed to mitigate the impact of Murree clay on the drilling mud. We analyzed the drilling mud to observe the effects of the mud additive on clays on the basis of the samples from the Murree Clays. On the basis of the experimental tests, we observed that the rheological properties of mud significantly improved in the presence of KCl. KCl prevented the smectite group swelling inclinations and reduced rheological values to 25%, 33.3%, 48.6%, and 65.2%. The plastic viscosity increased as the concentration of clays increased; however, there was a noticeable reduction in the yield point values with the introduction of KCl. The laboratory results showed that Mud + 4% Clay + 1% KCl proved to be the best mitigation while preserving the rheological and performance characteristics of the mud. Tests enabled the scope to increase the inhibition efficiency and optimize customization. Depending on the clay present in the Murree formation, drilling fluid optimization is proposed to reduce mud-related drilling problems in this area.

1. Introduction

Non-renewable sources, such as methane gas, oil, and coal, are significant energy sources for the survival of society. In 2004 and 2012, the global demand for hydrocarbon-based energy increased by close to 10% [1]. Scientists have claimed that the energy requirement will continue to show an increasing trend, 75% of which fossil fuels will ultimately fulfill until 2040 [2]. The energy contribution from non-renewable sources, such as oil (31%), methane gas (21%), coal 29%, and nuclear energy (4.8%), is more than 86%. By contrast, the energy from renewable sources makes up almost 11% of the primary energy supply [3]. The best possible way to overcome the shortage in the supply and demand of fossil fuel energy is to improve the techniques in exploration processes and enhance the drilling of oil and gas wells in the present decade [4,5,6,7,8]. Drilling muds play a vital role during the drilling process [9]. The primary function of the drilling mud is to clean the wellbore, transport drill cuttings and lubricant to the drill bit, and minimize its consumption [1,10,11]. Complex drilling fluids make up almost 20% of the expenses spent on oil and gas well drills [12]. Various schemes have been implemented to understand the characteristics and formulation of the drilling fluids [1,9,10]. Spud muds are considered a classic example of water-based mud, comprising water and clay. Still, the results are generally poor regarding their functioning evaluation, established by the link between system stability, filtration, and rheological properties. At present, the focus has shifted to either enhancing the performance of water-based mud or switching to the addition of biodegradable material in oil-based muds [12].
Wellbore problems derived from clay instabilities create significant issues for the exploration industry, such as a pipe stuck because of collapse and caving or low annular velocities in over-gauged holes because of solids loading. This non-productive time (NPT) costs millions per annum for the oil and gas industry. One of the primary reasons for the high cost, time-wasting, and trouble faced during the drilling process is wellbore instability. Wellbore instability issues occur mainly in the fine-grained sediments of clay and its lithified lithology (shale), which represent 75% of the drilled formations in exploratory wells [12]. The interaction between the drilling mud and clays or shales can affect the drilling fluid characteristics, resulting in the clay’s dispersion into ultra-fine colloidal particles [13]. Water adsorption, osmotic swelling, and cation exchange are the primary origins of shale–fluid interactions [14]. The clay’s concentration and type within the shale are important physical features to be understood before using the shale in the drilling fluid. Despite the excellent wellbore stability, good lubricity, and temperature stability the oil-based mud provides, its frequent usage is restricted because of environmental regulations. These ecological constraints on oil-based muds trigger the need for environmentally friendly water-based mud to present the same acceptable conditions as oil-based mud [12]. Several studies have focused on substituting oil-based mud with water-based mud [14,15].
Similarly, numerous scientists have focused on multiple dimensions to enhance drilling mud’s functioning and restrict the wellbore instability [1,4,12]. These studies showed a way to conduct a case study and investigate the wellbore-based problems caused by Murree clay within the Kohat Basin of Pakistan. The main idea behind the study was to focus on water-based drilling mud and secondary clays. Clay’s interactions with water-based fluids depend firstly on transport processes in shales, secondly on physio-chemical changes caused by this transport, and thirdly on the implications of these changes for mechanical and chemical clay stability. Therefore, the primary purpose of this research was to appraise, through an experiment, the concentration of Murree clay minerals in water-based mud and its role as an additive in contaminated water-based mud. Furthermore, the study also determined the effects on the rheology of water-based mud due to the increase in different concentrations of Murree clays. Rheological properties were examined, and the final solution for correctives is concluded.

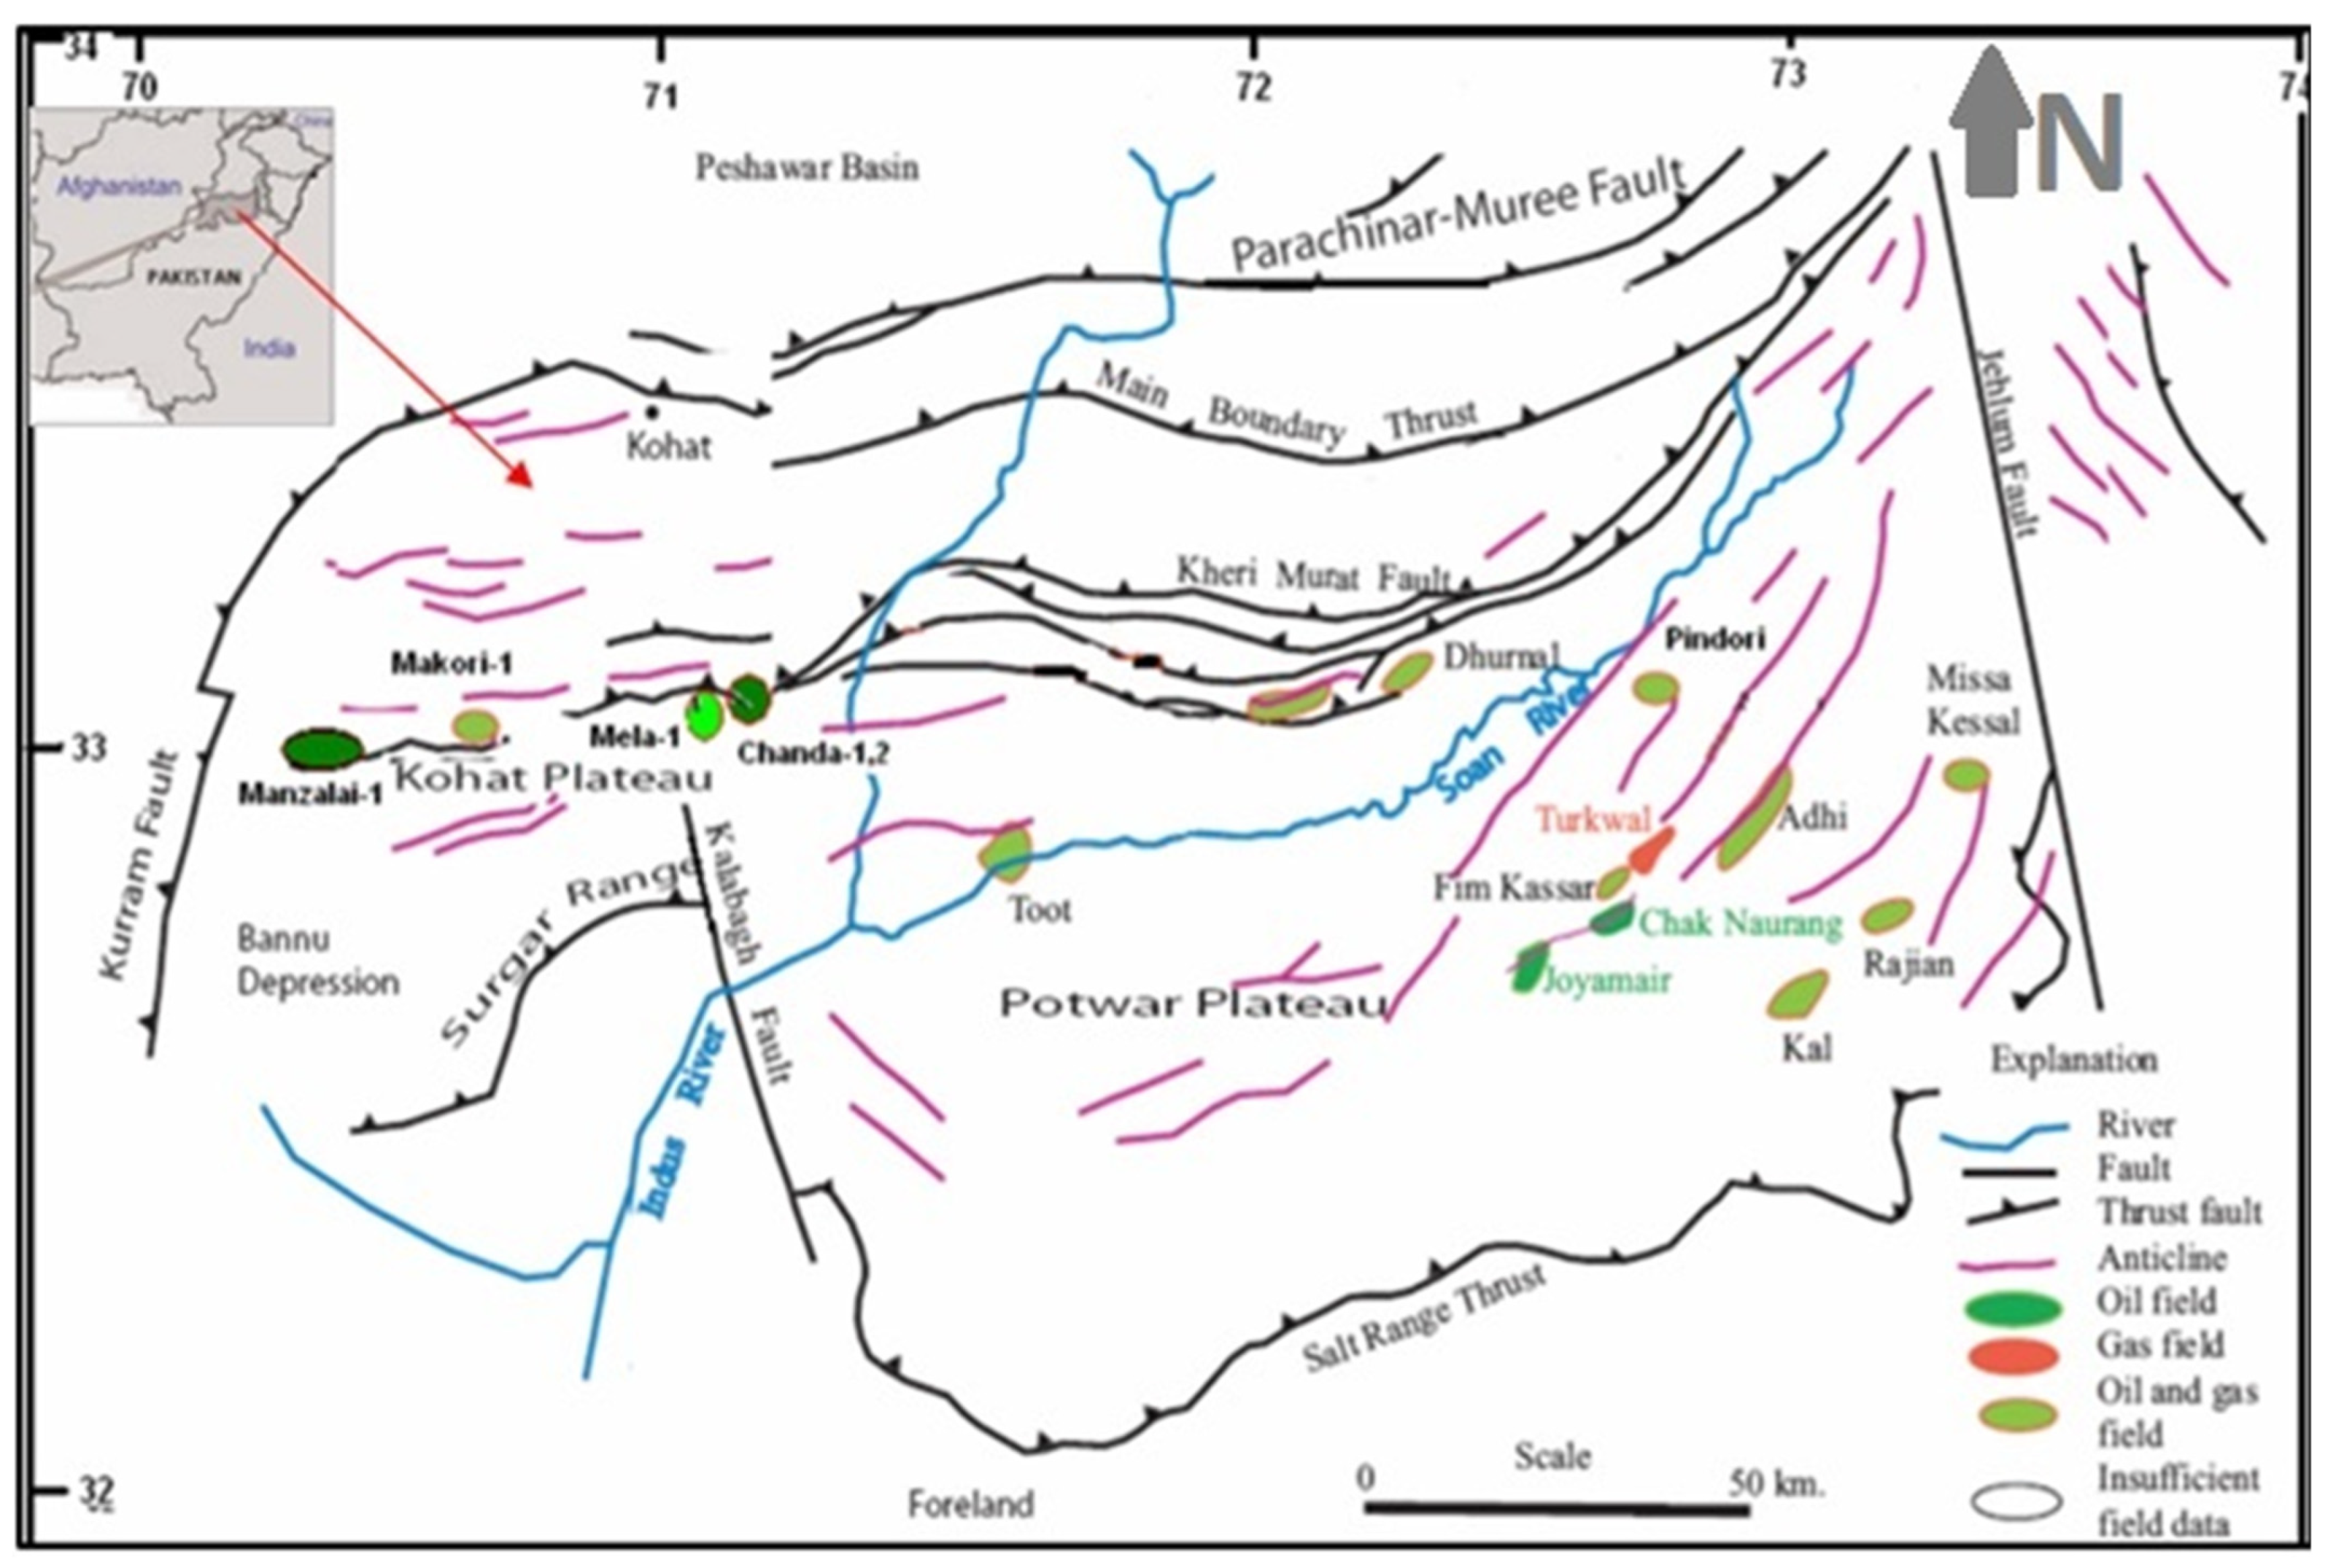
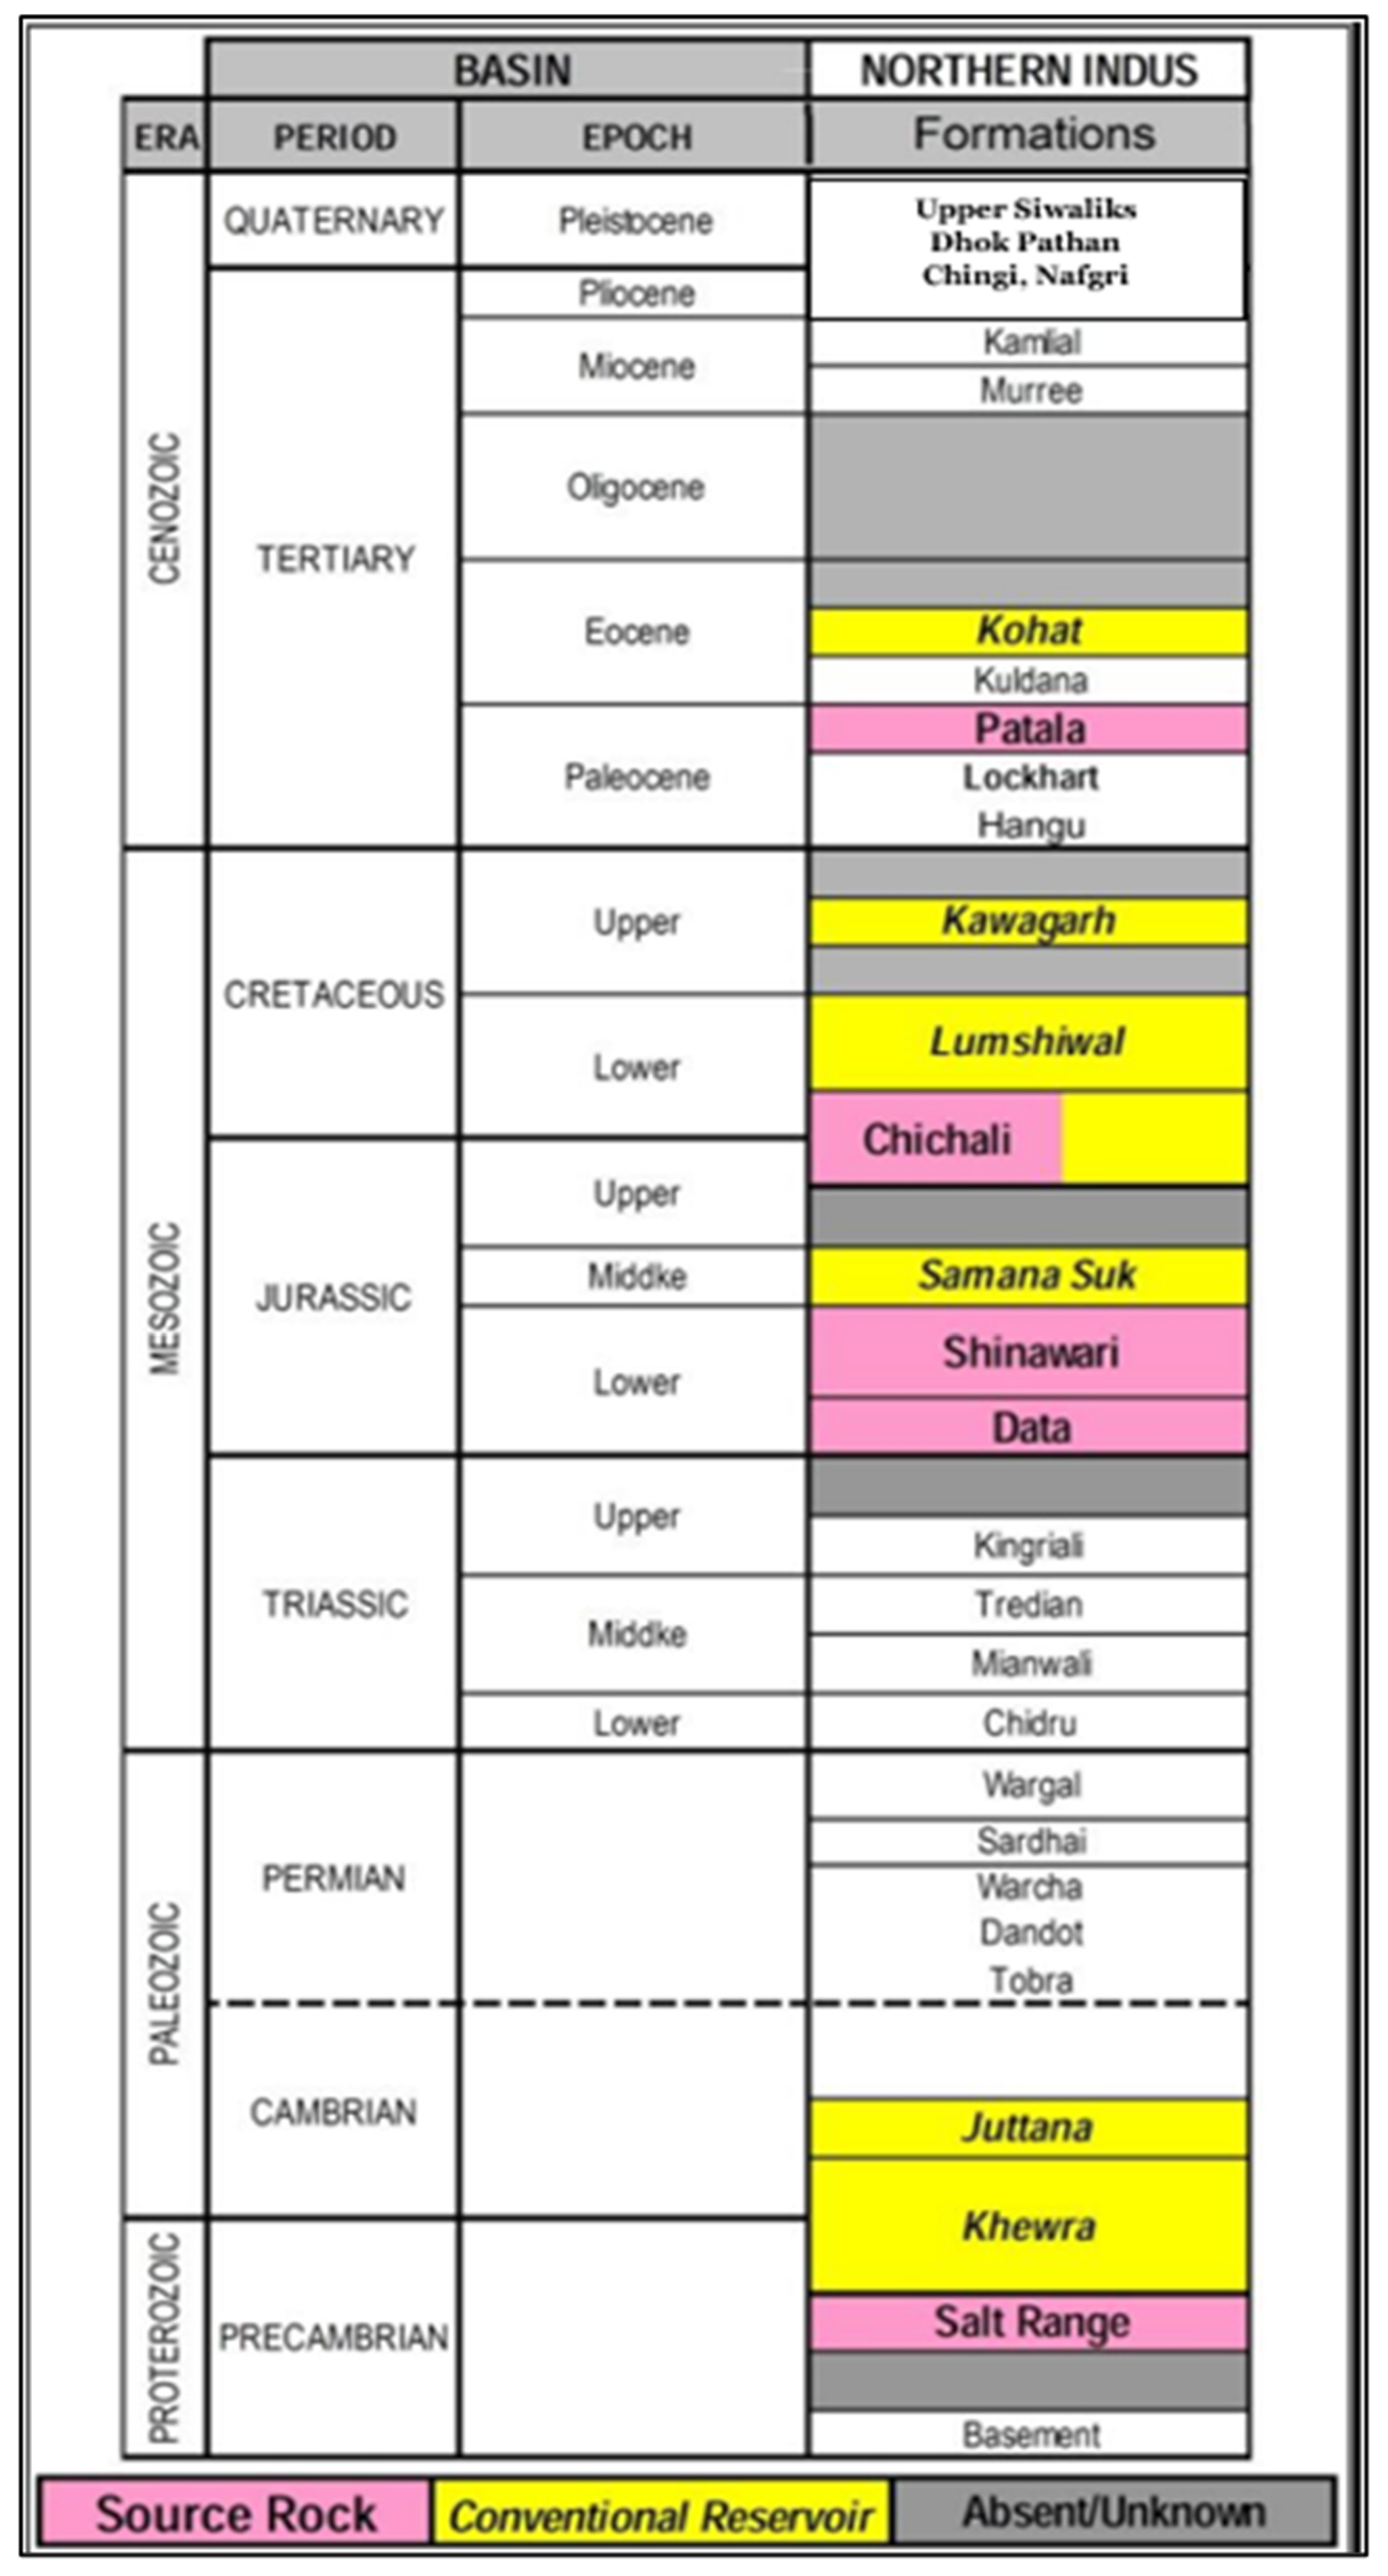
2. Geological Settings

The Kohat Basin is a part of the Upper Indus Basin, situated in the northwest of Pakistan between the latitudes 32° and 34° N and the longitudes 70° and 74° E (shown in Figure 1). The second segment of the Indus Basin is the Potwar Basin, separated naturally from the Kohat Basin by the Indus River. Geologists also consider the Kohat and Potwar sub-basins [16]. The Kohat Basin is situated in the Himalayan Foothills and carries historical evidence of the closure of the Tethys Sea and the Himalayan collision between India, Asia, and several microplates [17]. The study area indicates complex tectonics, appears as a tilted plateau, accommodates steep dips, represents the imbricated thrusts, and reveals asymmetric structures due to numerous thrusting and normal faulting [18,19]. Sedimentation within the Kohat Basin was initiated during the Precambrian and lasted until the Pleistocene. The oldest exposed rock in the Kohat Basin belongs to the Zaluch group of the Permian age, whereas the Dhok Pathan Formation is considered the youngest rock within the study area [1,16]. Three major unconformities are also present within the study area: Ordovician to Carboniferous, Mesozoic to late Permian, and Eocene to Oligocene. The Kohat Basin showed the absence of or very thin deposition during the Cretaceous era, primarily because of dominant erosional episodes and the emergence of the study area from the sea [19]. During the Eocene–Pliocene epoch, the Kohat Basin underwent complex folding and thrusting; thrusting explains the presence of salt in the anticlinal structure [16]. The stratigraphic successions highlighting the deposition of various formations within the study area are shown in Figure 2.
The Murree Formation consists of a monotonous sequence of dark red and purple clay and purple-grey to greenish-grey sandstone of fluvial origin. Its age seems to be Miocene [19]. It is correlated with the Vihowa group of the Sulaiman Basin. The Kamlial beds are distinguished from the underlying Murree Formation their its rich mineral content, in which tourmaline dominates over epidote [22]. The Murree Formation is a member of the Rawalpindi Group and belongs to the Miocene epoch. The Murree Formation is comprised mainly of sandstone, clay, and shale. In the Kohat area, the formation has a higher percentage of brown sandstone, greenish-grey and purple in places, and is medium- to coarse-grained. Interbeds of hard siltstone, conglomerate lenses, and purple to reddish-brown shale are frequent. The average thickness of the Murree Formation within the Kohat Basin is 335 m [23]. The distinguishing features of the Murree Formation include its clay concentration, lower permeability due to the lack of pore connections, tiny pore throats, and a substantial disparity in the coefficient of thermal expansion. Before analyzing the fluctuations caused by the interaction between drilling mud and the Murree Formation, containing clays of the high tectonic regime, it is essential to understand the basic characteristics of the in situ shales, such as the pre-existing water and mineral content and porosity.

3. Materials and Methods

3.1. Materials

Mud of desired properties was prepared according to the materials and methodology; however, the methodology of correction was used for undesired properties of the mud. Various tests and experiments were used for different results and mud treatments. Mud was prepared using API equipment and standards [24]. Bentonite was used in water-based mud formulation. The other additives were:
I.
Water, which was used as the base fluid.
II.
Barite, which was used to increase the mud density.
III.
Soda ash, which acted as a hardness control agent.
IV.
Caustic soda, which was used to optimize the pH in the range of 9 to 10.
V.
Polyanionic cellulose (PAC-LV), which provided additional filtration control.
VI.
Xanthum gum, which is the only polymer that provides thixotropy, i.e., the formation of the gel structure.
VII.
Potassium chloride (KCl); mud with potassium ions (K+) is very inhibitive to hydratable clays [14].

3.2. Methods

The experimental methods section of this research is segmented into two sections. The first one highlights the characterization of clay samples in terms of their mineralogical content. The second part emphasizes mud formulation and analyzes the sensitivity of Murree clays to water-based mud by testing, analyzing, and discussing the rheological properties of the clay–fluid interaction.

3.2.1. Clay

A Murree clay cutting from the Kohat Basin was air-dried at room temperature and prepared to be finely powdered in a porcelain mortar [25] with a weight according to API standards. Then, the clays entered the oven and were heated to a temperature of 120 °C. After heating, the ground sample was again accounted for by weight to find the value of Native Moisture Content. The X-ray diffraction (XRD) scheme was applied to quantitatively analyze the clay, non-clay, and expandable clay content [26] by comparing the resulting diffraction pattern to determine which minerals were present in the clay sample.

3.2.2. Preparation of Mud

First, 353 cm3 of water was measured and poured into a Hamilton mixing cup, then 24.9 g of bentonite was added. The above suspension was mixed in the Hamilton cup container with a beach mixer with a sine wave single-impeller spindle. The container was removed after stirring for 5 min, and a spatula was used to clear the walls of the container. After this process, this suspension was prehydrated for 30 min under the condition of stirring. Again, we removed the container and added 3 g of barite, 0.5 g of soda ash, 0.5 g of caustic soda, 6 g of PAC-LV, and 3 g of xanthan gum, sequentially. The bentonite suspension was aged for up to 16 h in a covered container at room temperature. After aging, the container was shaken, and the contents were poured into a mixing cup and stirred with a Hamilton Beach mixer for 5 min.
The rheological properties of the prepared mud were recorded, and this mud was considered the default mud. The default mud was contaminated by introducing Murree clays with 2%, 4%, 7%, and 10% concentrations by weight of the default mud. The rheological readings of the contaminated mud were recorded again. In the next phase, the potassium chloride (KCl) additive with 0.4%, 1%, 2%, and 4% by weight of the contaminated mud was added, respectively. Rheological measurements were conducted again at a variable speed using a Fann 35A viscometer. The standard [24] formulation obtained plastic viscosity and yield points.

4. Results and Discussion

This section explains the findings from our methodology, which also supports the discussion of previous and recent results regarding the clay–mud interaction.

4.1. Native Moisture Content and CEC
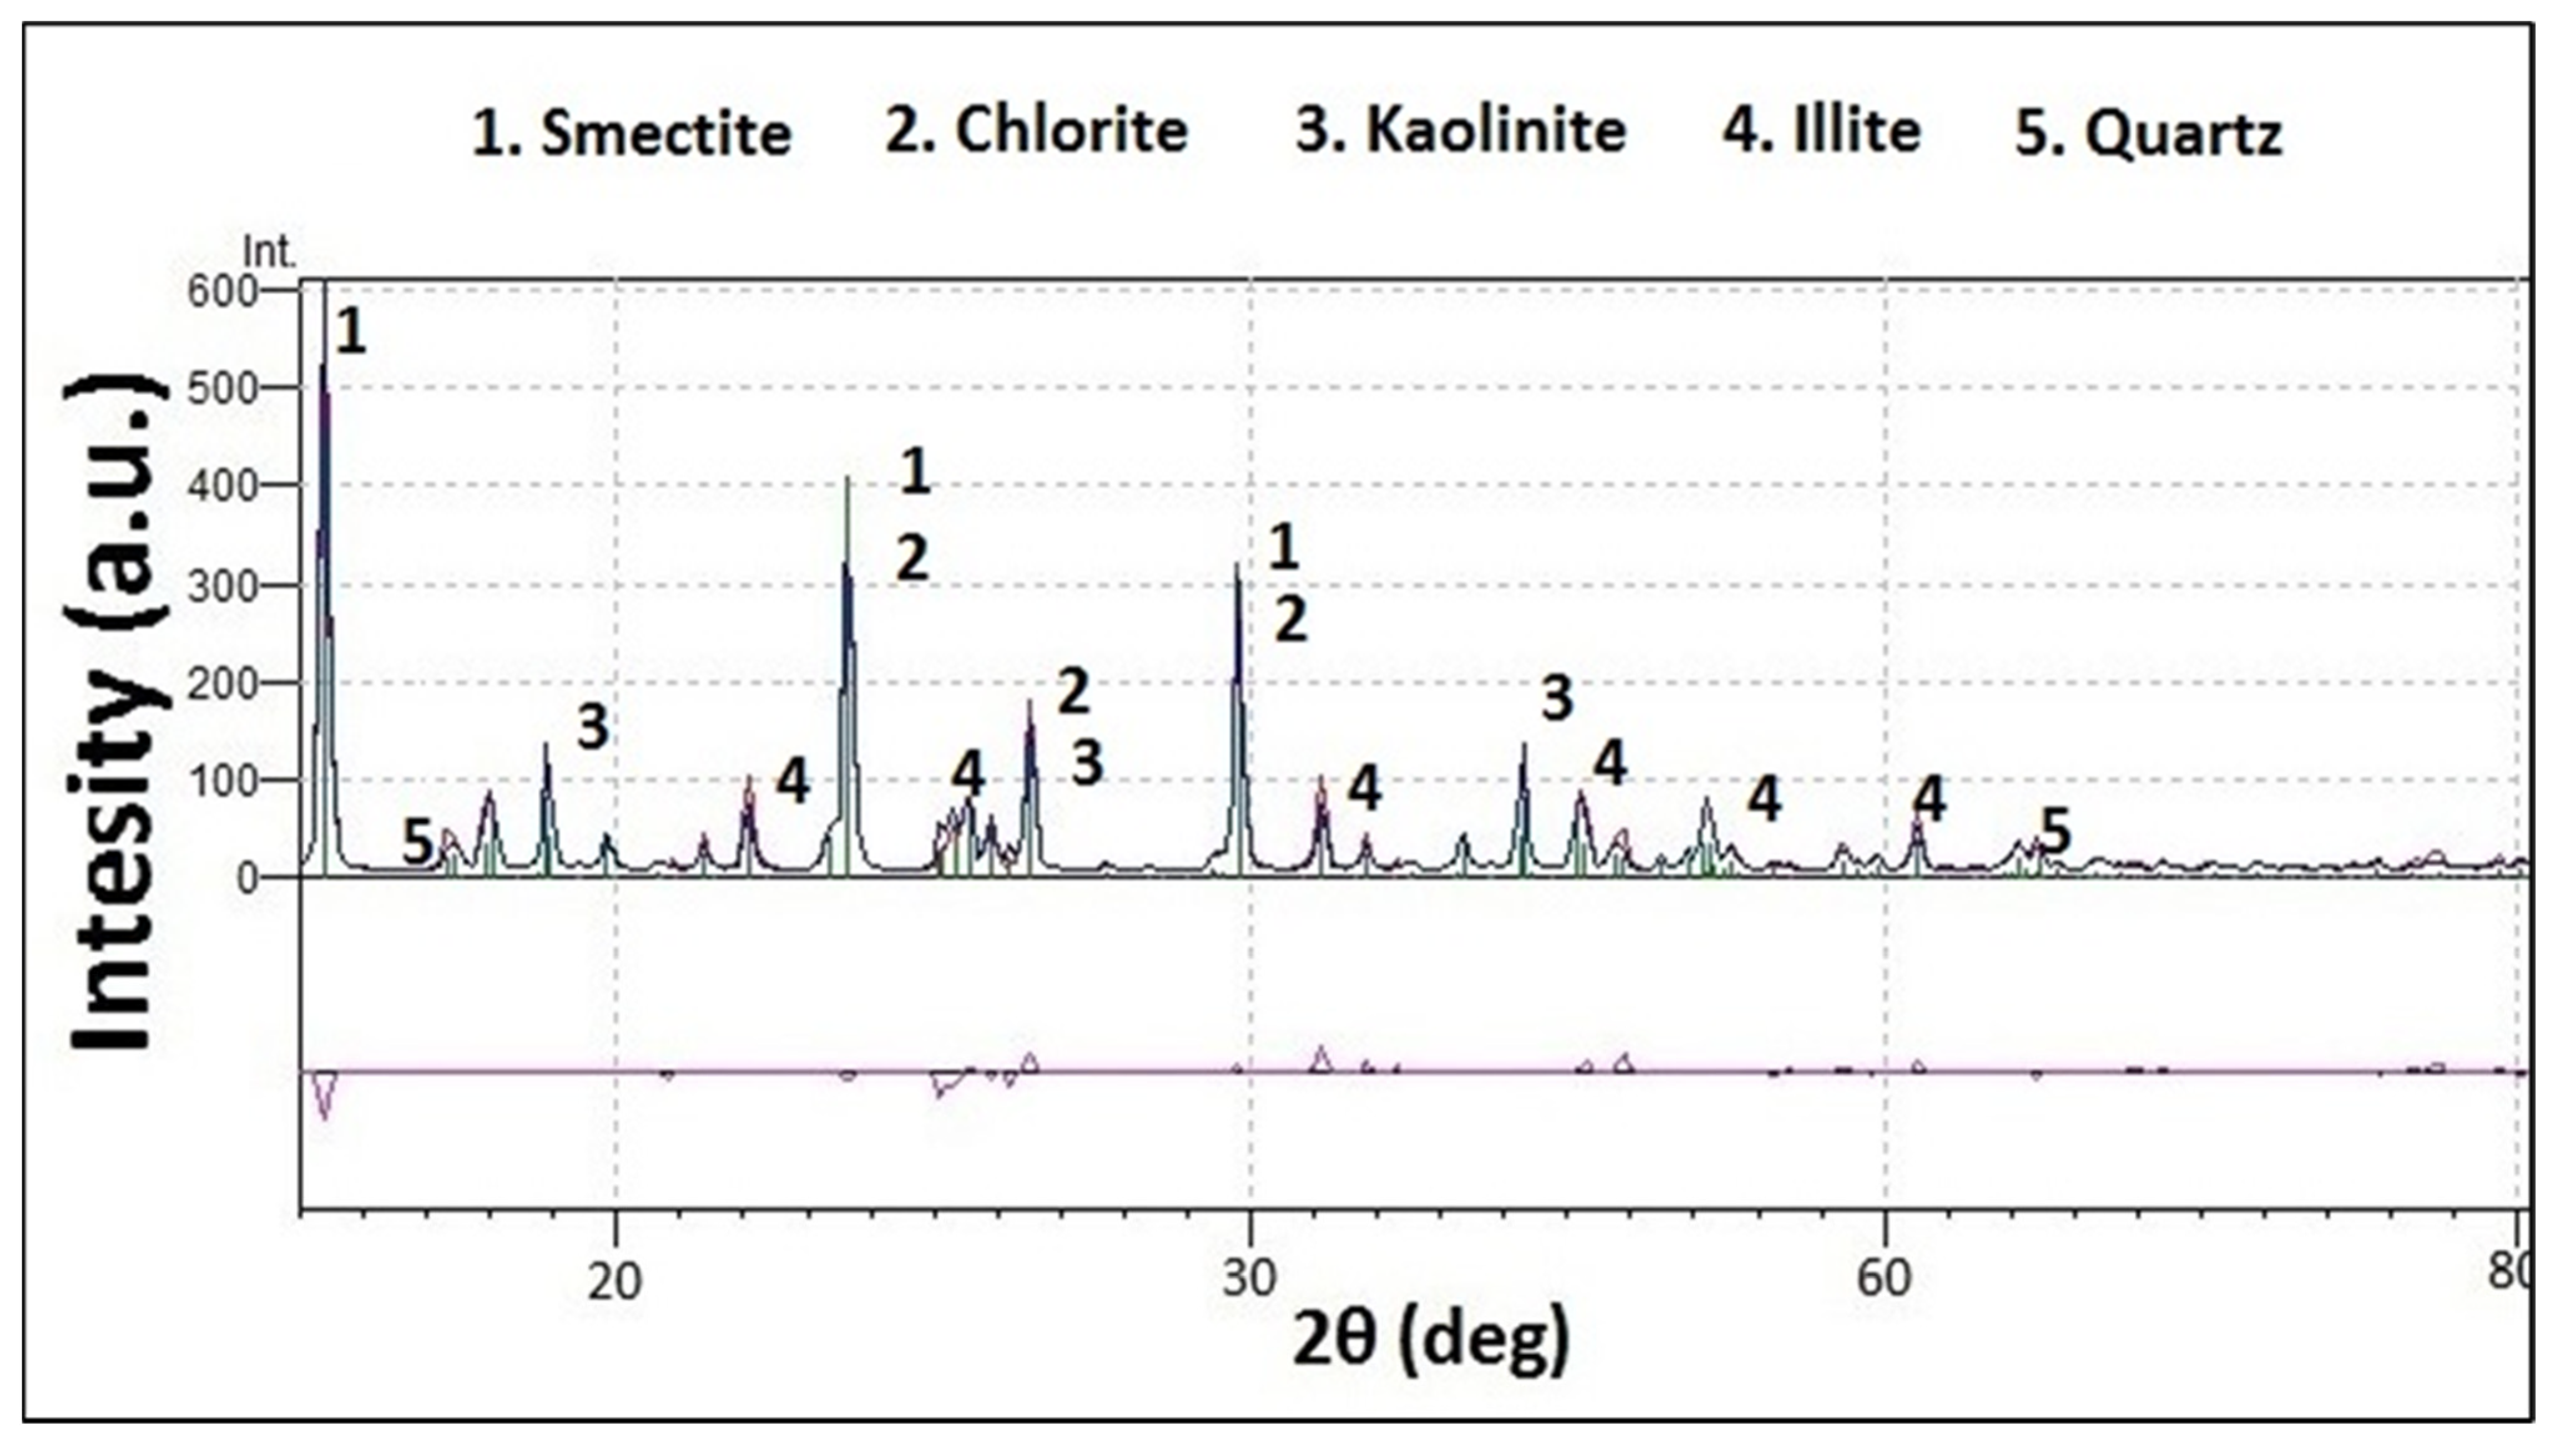
The results indicated the Native Moisture Content of the clay was 14.21%, and Cation Exchange Capacity (CEC) was 118 Meq/100 g (as shown in Table 1). The 14.21% moisture content of the clay indicates a high presence of expandable clays with the ability to store moisture easily, while the characteristic property of clay minerals was mainly of the smectite group (70 to 130 Meq/100 g), which has an affinity of water adsorption in the clay–fluid interaction phenomenon.

4.2. XRD Analysis

The XRD technique was applied to conduct a qualitative mineral analysis. XRD is a non-destructive test method used to analyze the crystalline material structure present in the sample. By way of the study of the crystal structure, XRD analysis was used to identify the crystalline phases present in the sample and thereby reveal the chemical composition information. The results obtained from the XRD data (shown in Figure 3) indicate that the mineral assemblage within the clay sample of the Murree Formation was dominated by Smectite, and the chlorite, kaolinite, and illite groups were non-dominant. Smectite yields X-ray diffraction patterns characterized by basal reflections that vary with humidity, exposure to specific organic molecules, heat treatment, and exchangeable cations [27]. The physical characteristics of the clays subjected to the drilling fluids depend on the category and content of the clay within the investigated sample. The results revealed the presence of an expandable layer within the sample, thus indicating the smectite domination, which results in expansion after interacting with water contents.

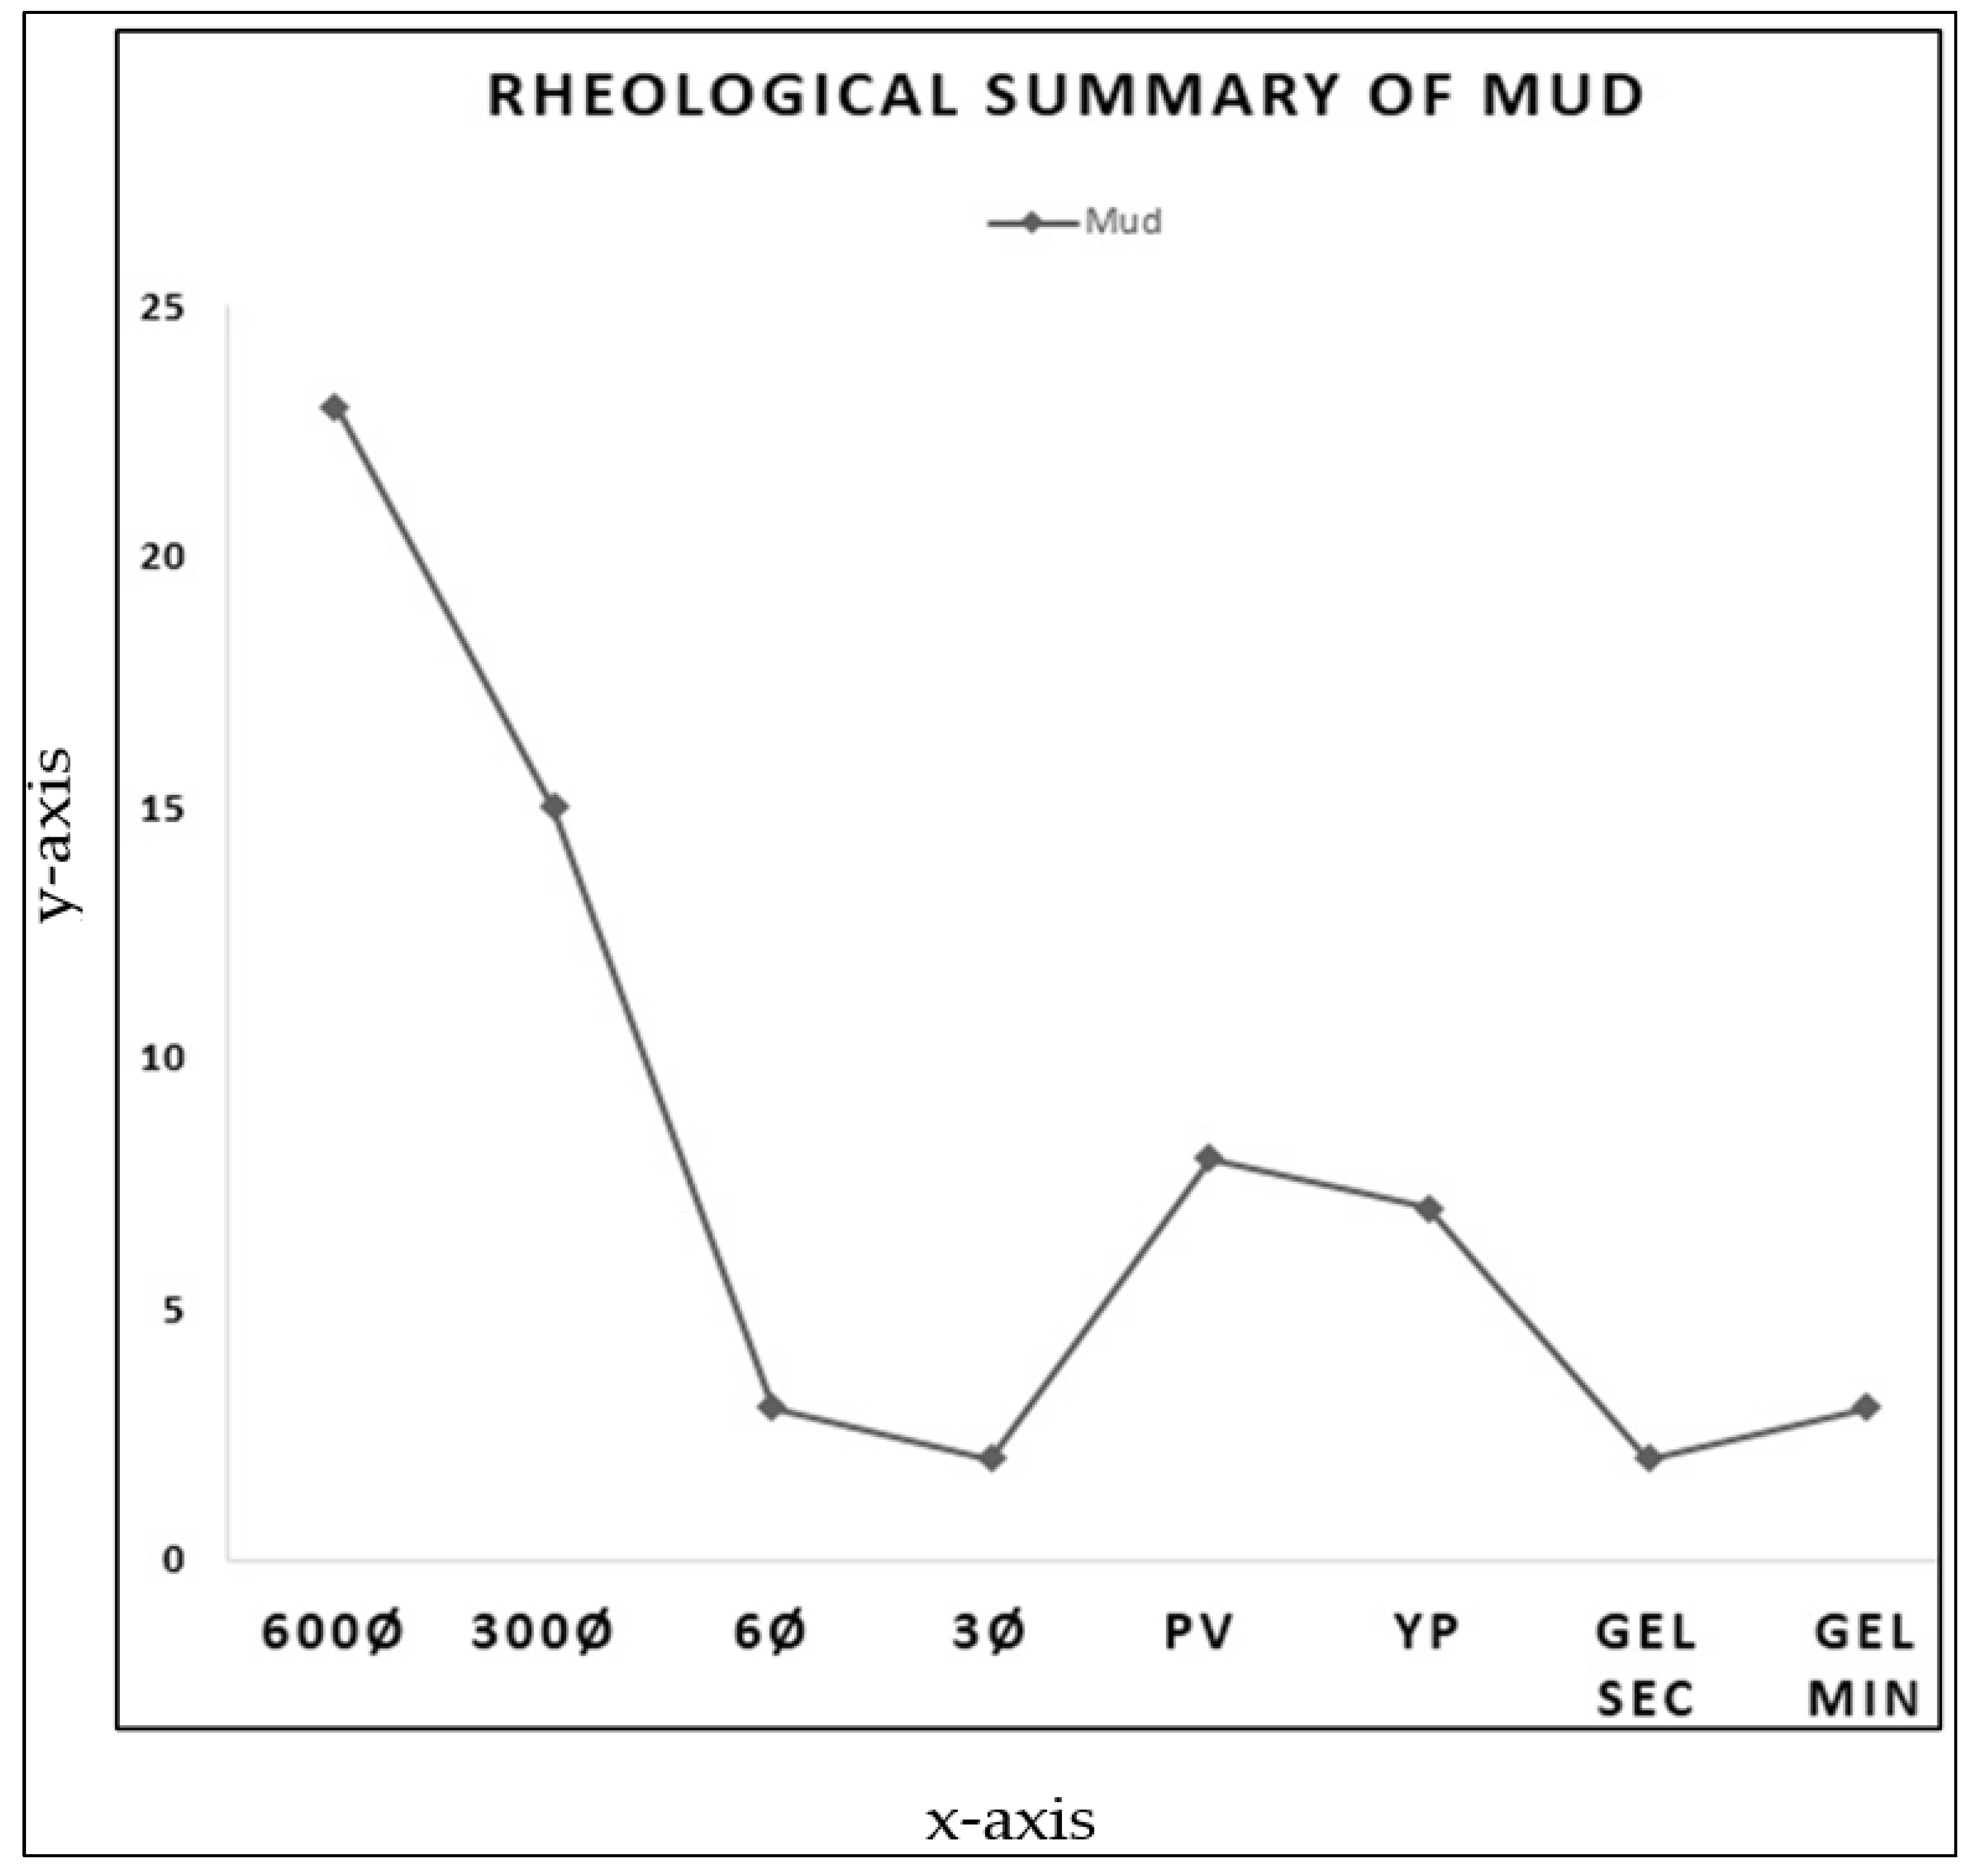
4.3. Water-Based Mud

After making the water-based drilling mud, we obtained the rheological values of the prepared mud (as shown in Table 2). These rheological values were considered the default properties of the drilling mud before interaction with the clays. It is essential to mention that the dial readings are included along with the rheological properties of the drilling mud for the detailed analysis of clay–fluid interactions. Formulated mud properties can easily be manipulated in graphical form, so we can quickly analyze the difference between the properties after interaction and how these properties are mitigated after treatment. Figure 4 illustrates the trend of default rheological properties of mud. This trend line acts as a baseline with a default pattern. If we obtain different results different from the trend, then mitigation should be proposed according to the situation, thus leading to a pattern close to the default trend.

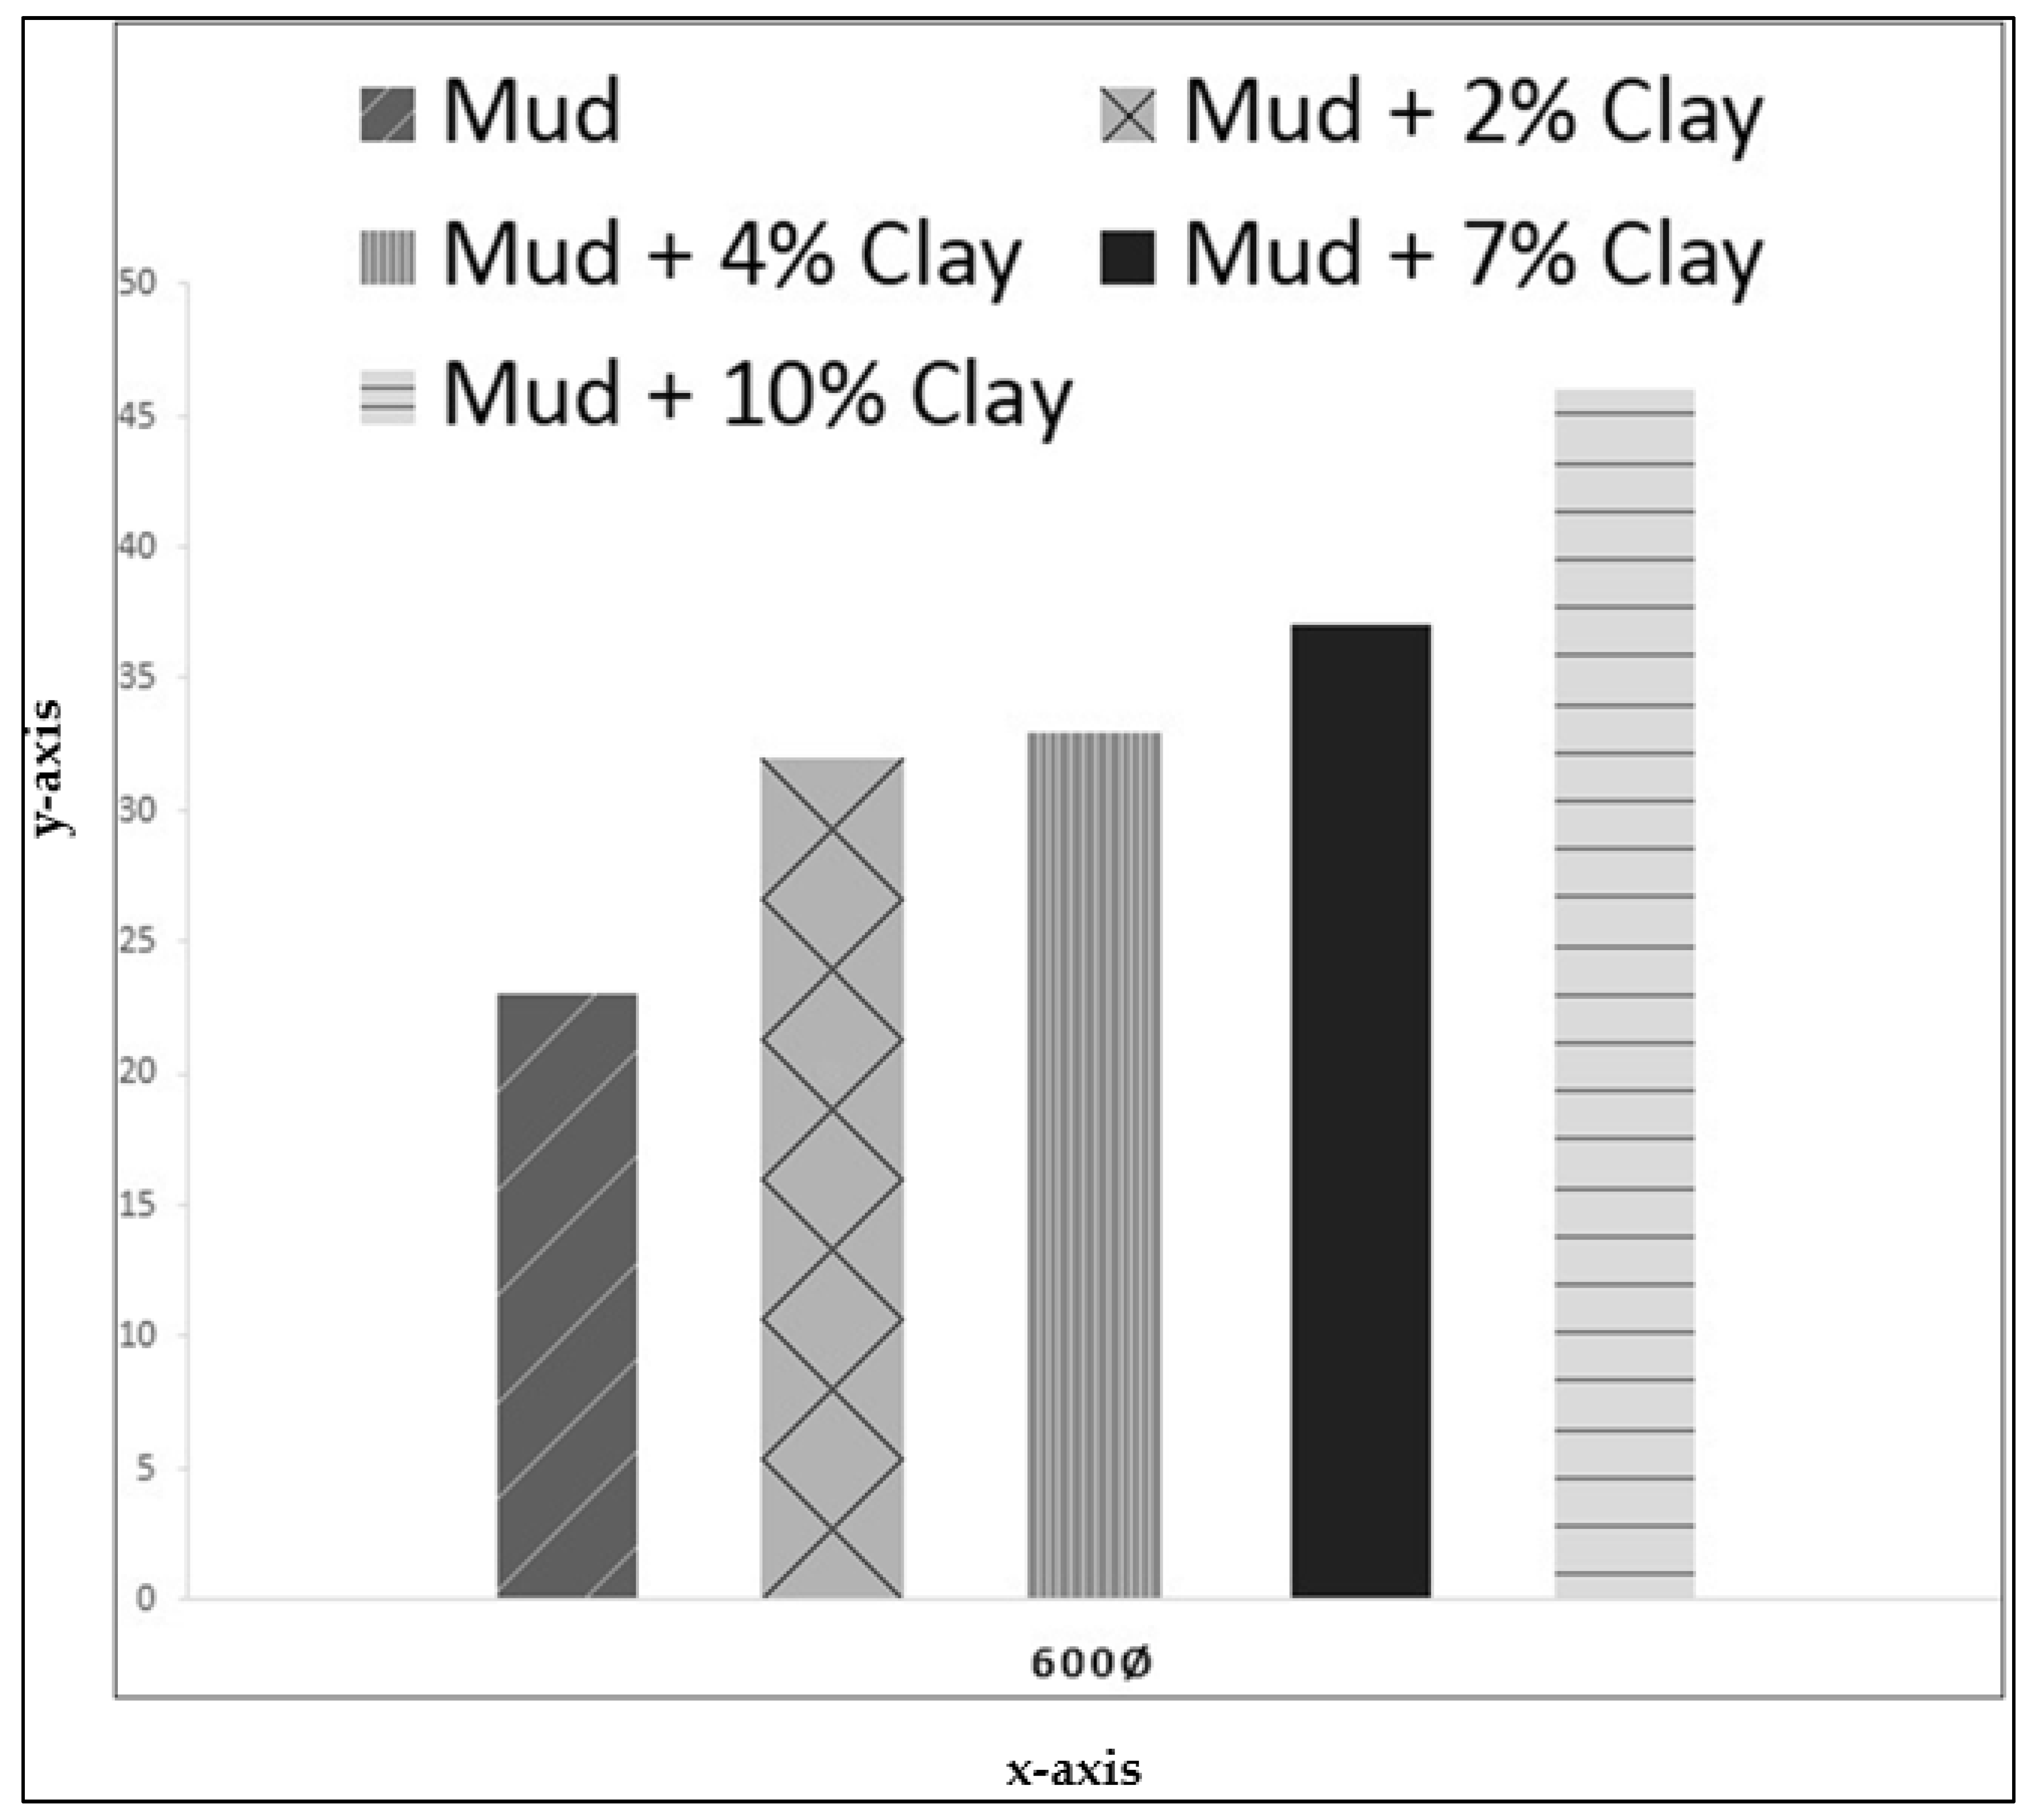
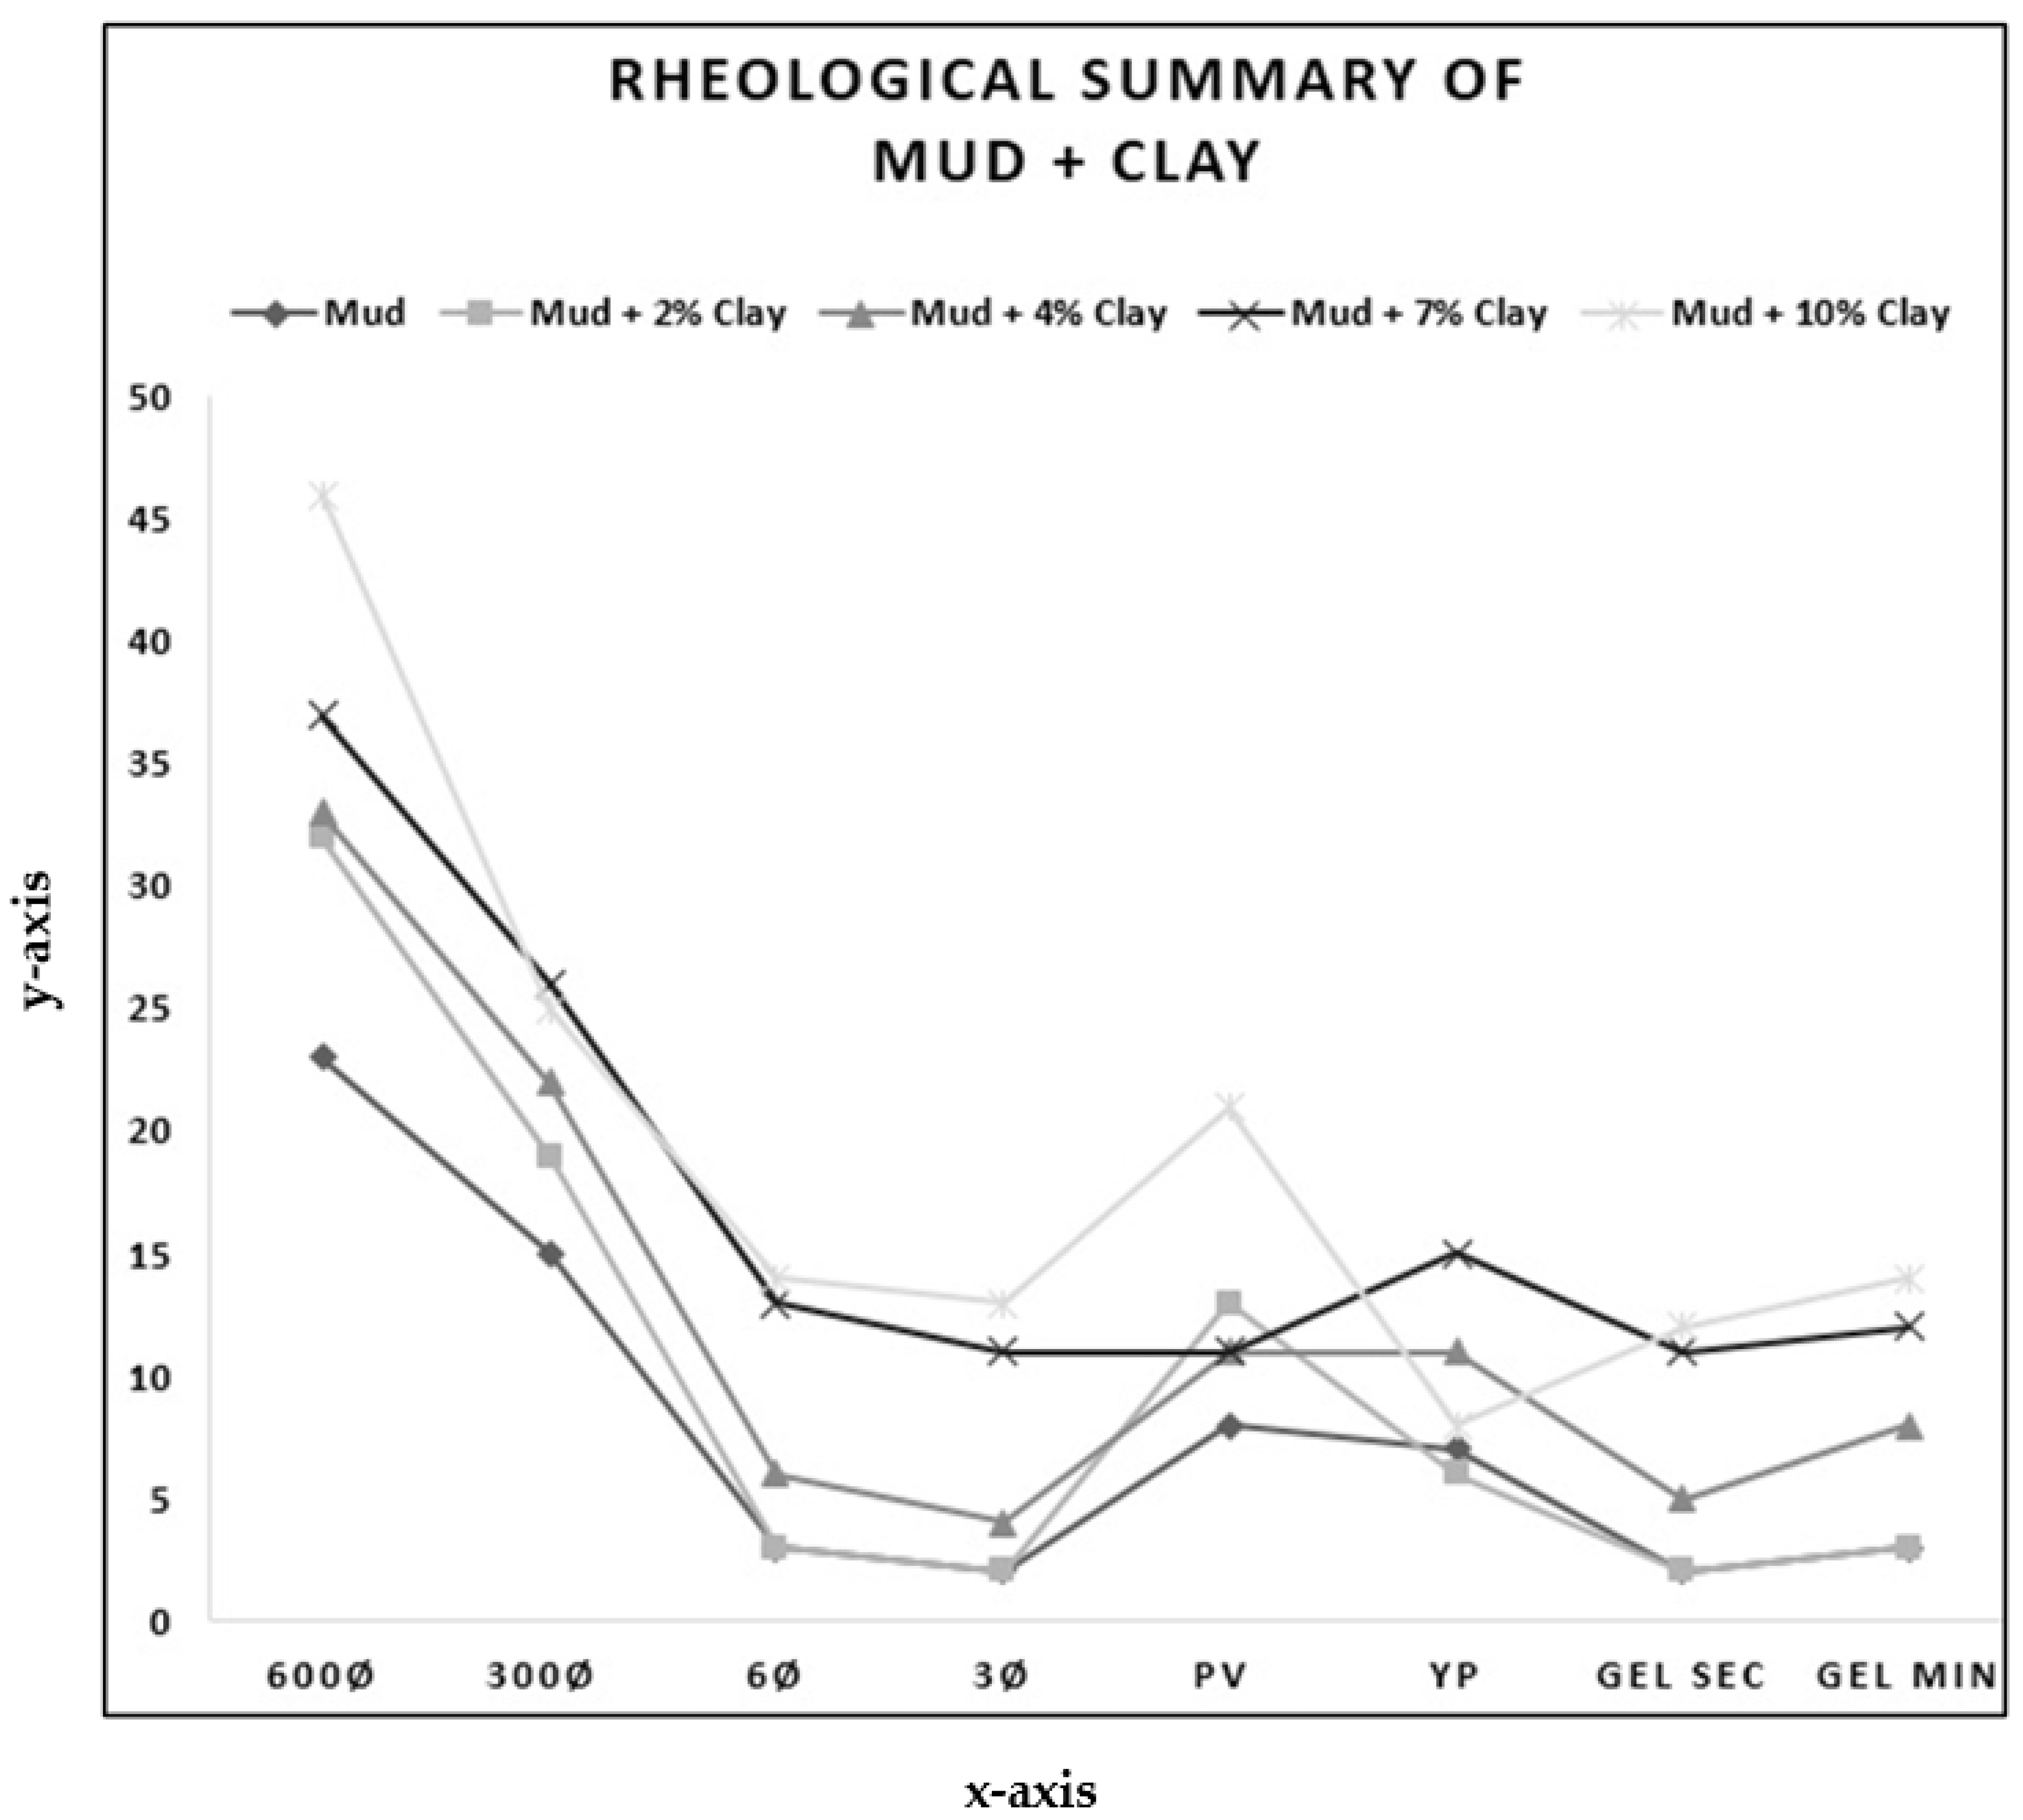
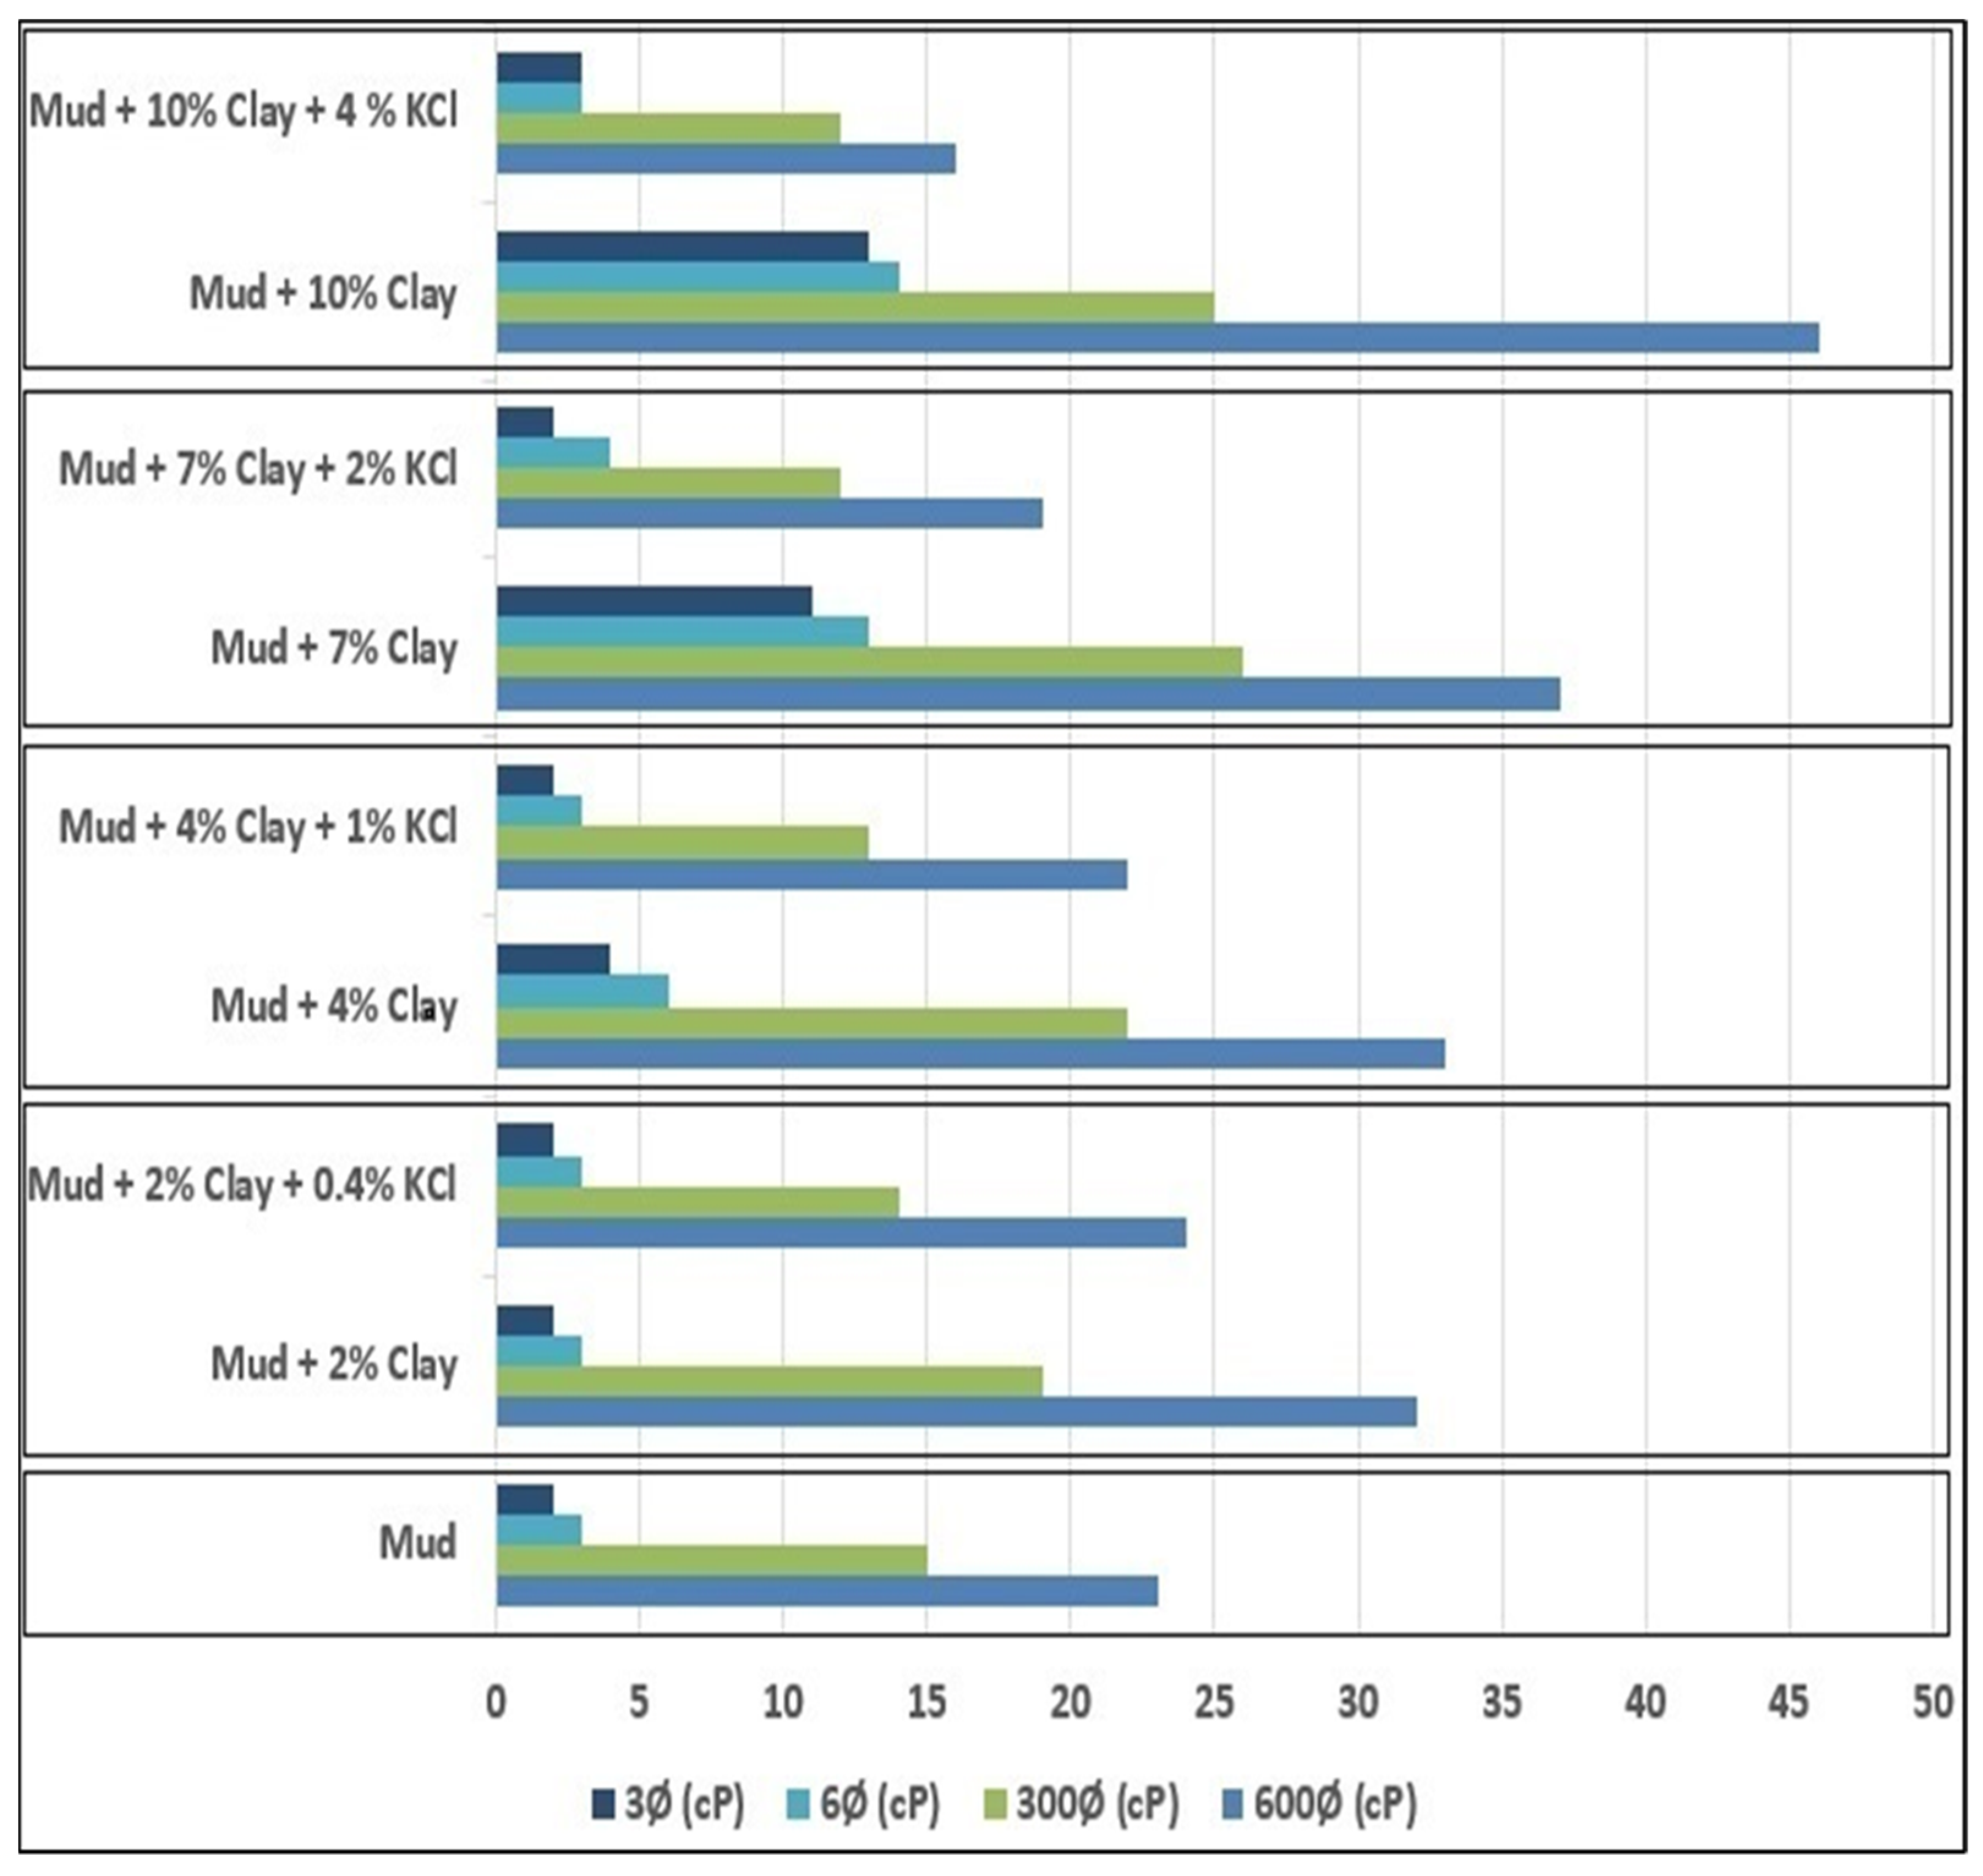
4.4. Clay-Concentrated Mud

In the next phase, the introduction of different concentrations of clays by mud weight percentage in the mud caused changes in the rheological properties of the mud because of the mineralogical composition of the clays of the Murree formation. The results are displayed in Table 3, obtained by introducing different clay concentrations by the weight of the mud. After obtaining the results of the default formulated mud prepared in the lab, we obtained the trend that could be considered the model trend for the default properties of the drilling mud. We could correlate the properties of different concentrated clay curves with the trend/base curve of the default mud. Therefore, we could easily interpret the analysis in the form of a graph, shown in Figure 5.
When wellbore walls become unstable, the knockout of cuttings causes devastating changes in the rheological characteristics of the mud. The behavior of the rheological characteristics of clay-concentrated mud diverts from API standards used in drilling industries to meet the desired results for better wellbore conditions. These properties of mud cause change the essential functions necessary during a drilling operation. Different calculations can be extracted from the above experimentation method to mitigate the abnormal activity for mud optimization.
As shown in Table 3, the rheological values increased and are illustrated in Figure 5. We can interpret that the values of 600 Φ dial readings increased by 39.2% (from 23 to 32 cP) for 2% clay, 43.5% (from 23 to 33 cP) for 4% clay, 60.9% (from 23 to 37 cP) for 7% clay, and 100% (from 23 to 46 cP) for 10% clay. Other rheological properties, such as gel strength, yield point, and plastic viscosity were also affected by adding clays with different concentrations in the mud. Readings along with gel strength and the evaluated values of plastic viscosity and yield point are analyzed in Figure 6. Trend correlation helps us understand the behavior of rheological properties. Notably, the value increased as the percentage of clays increased. Still, with mud + 10% clays, the value of the yield point declined to 8 (lb/100 ft2) because large concentrations yield results from the breakdown of indirect (lubricated) contacts between particles [28].

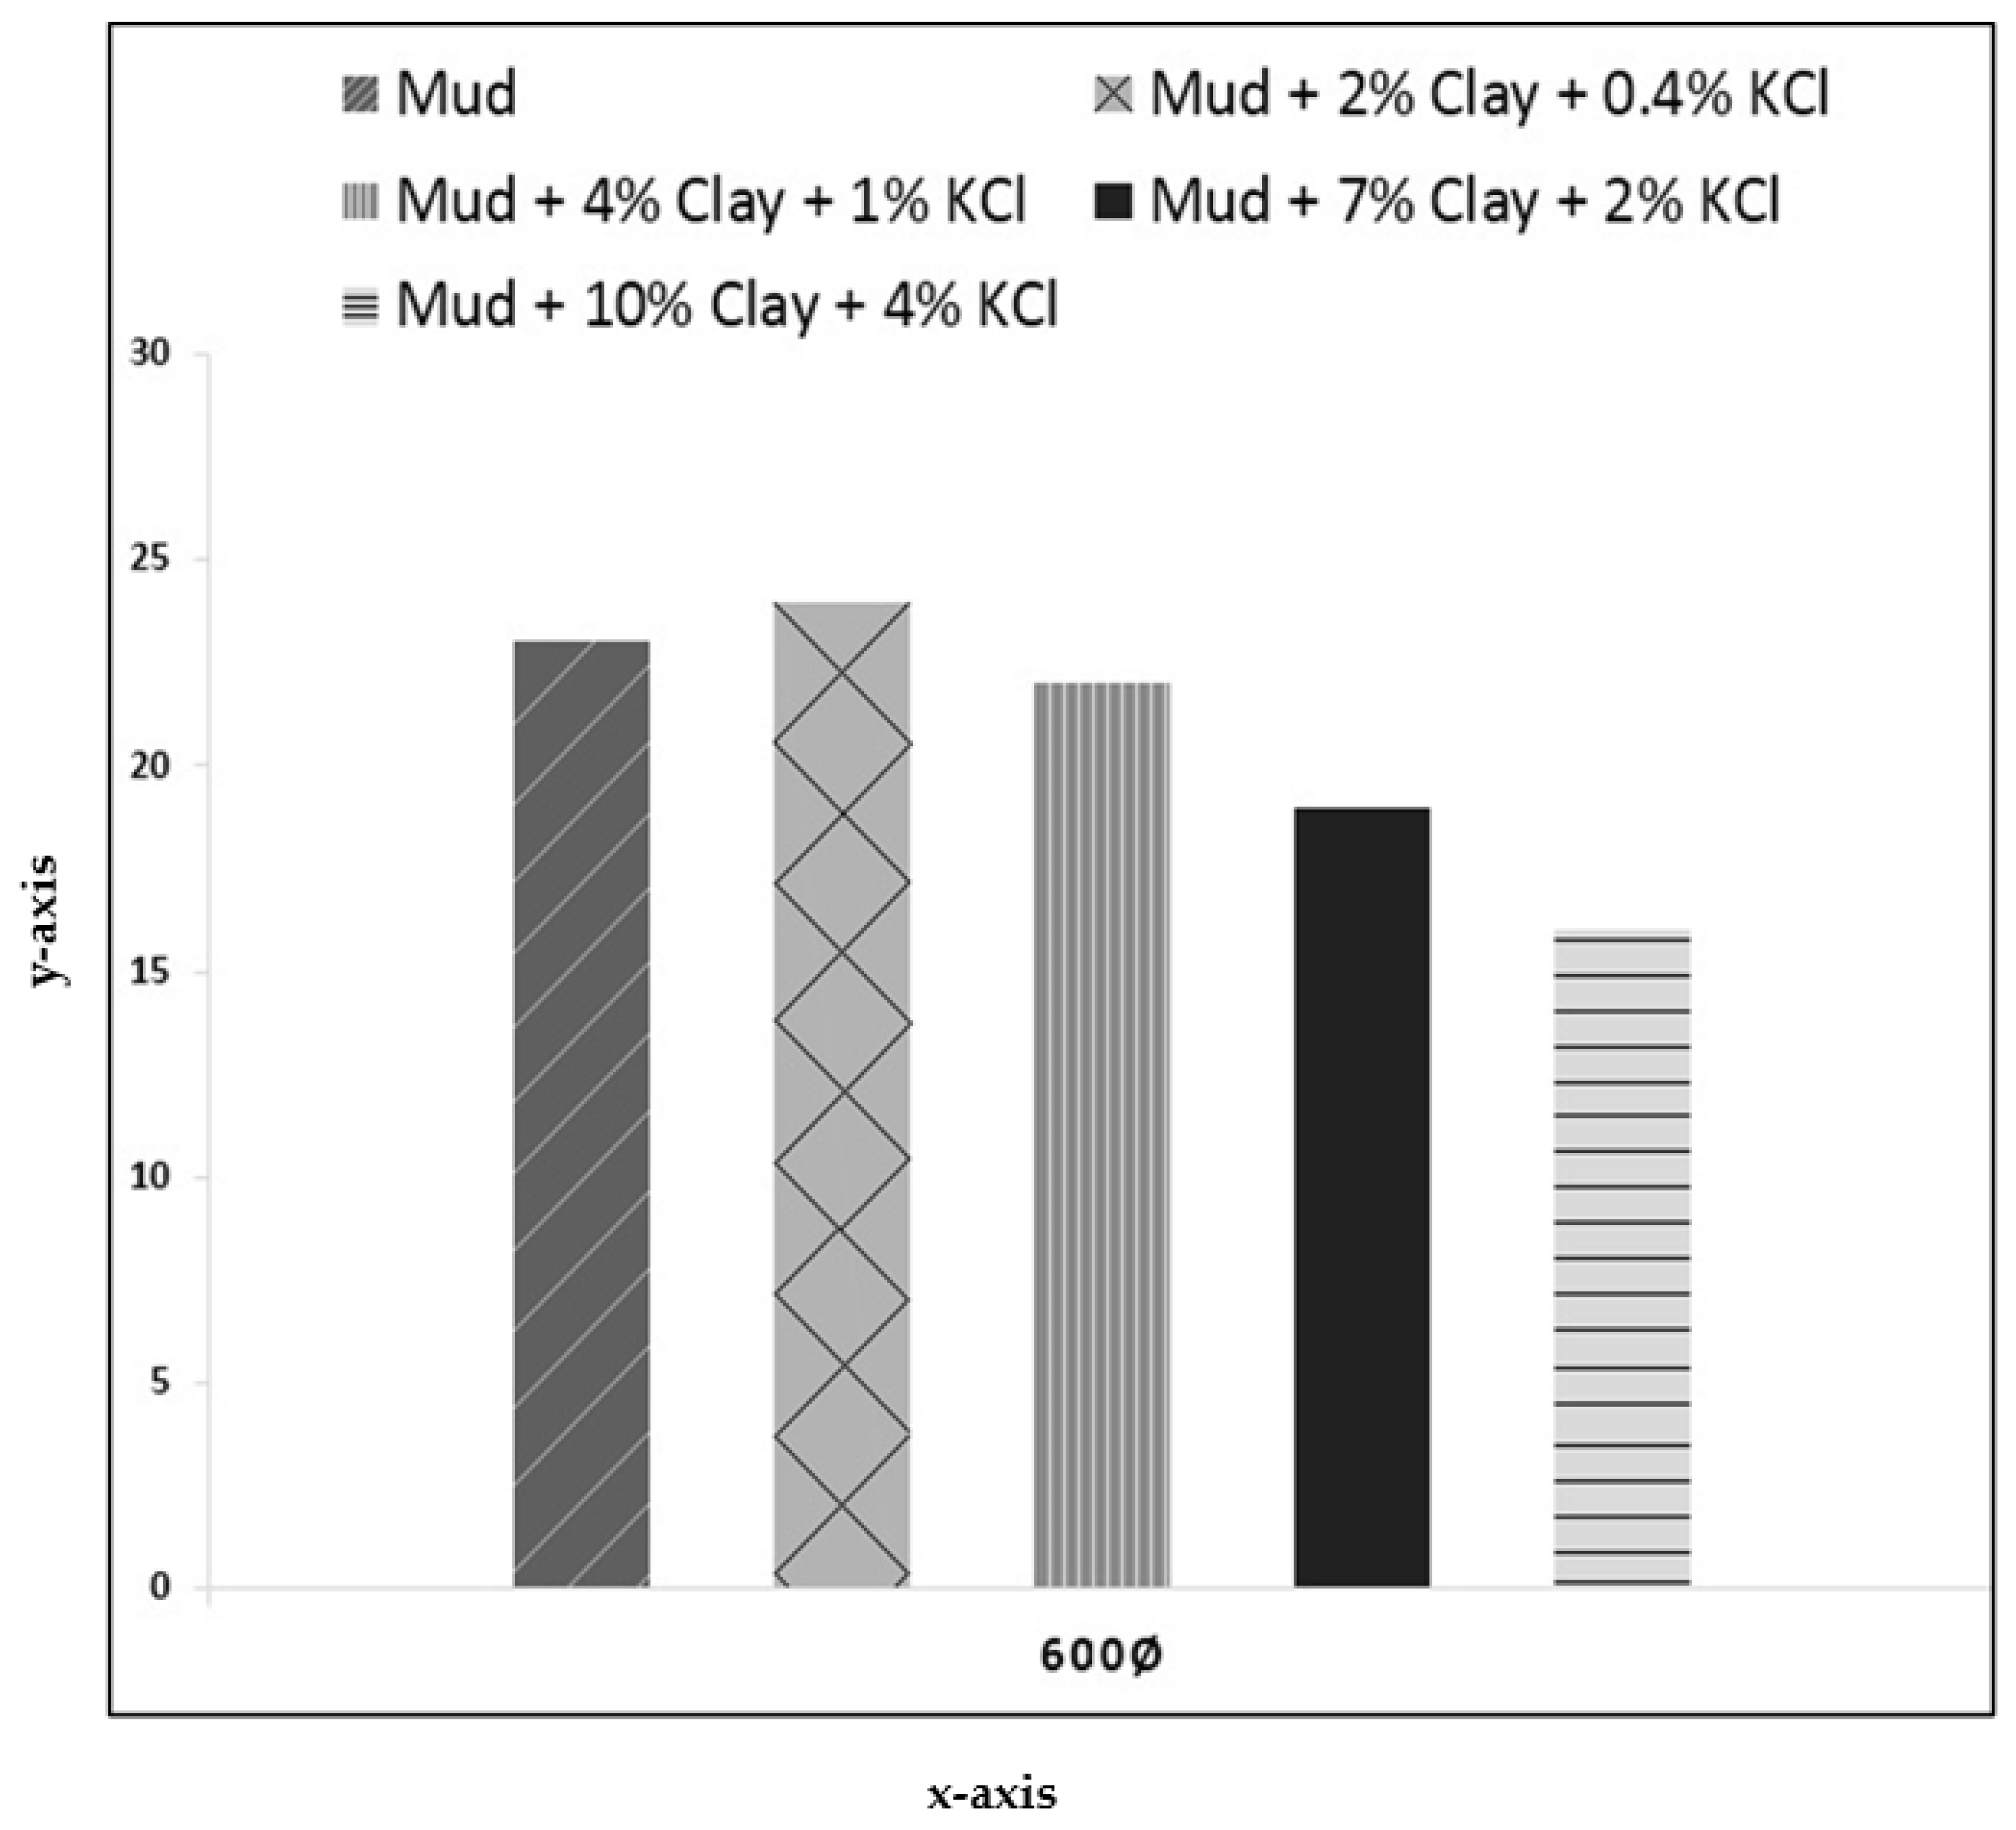
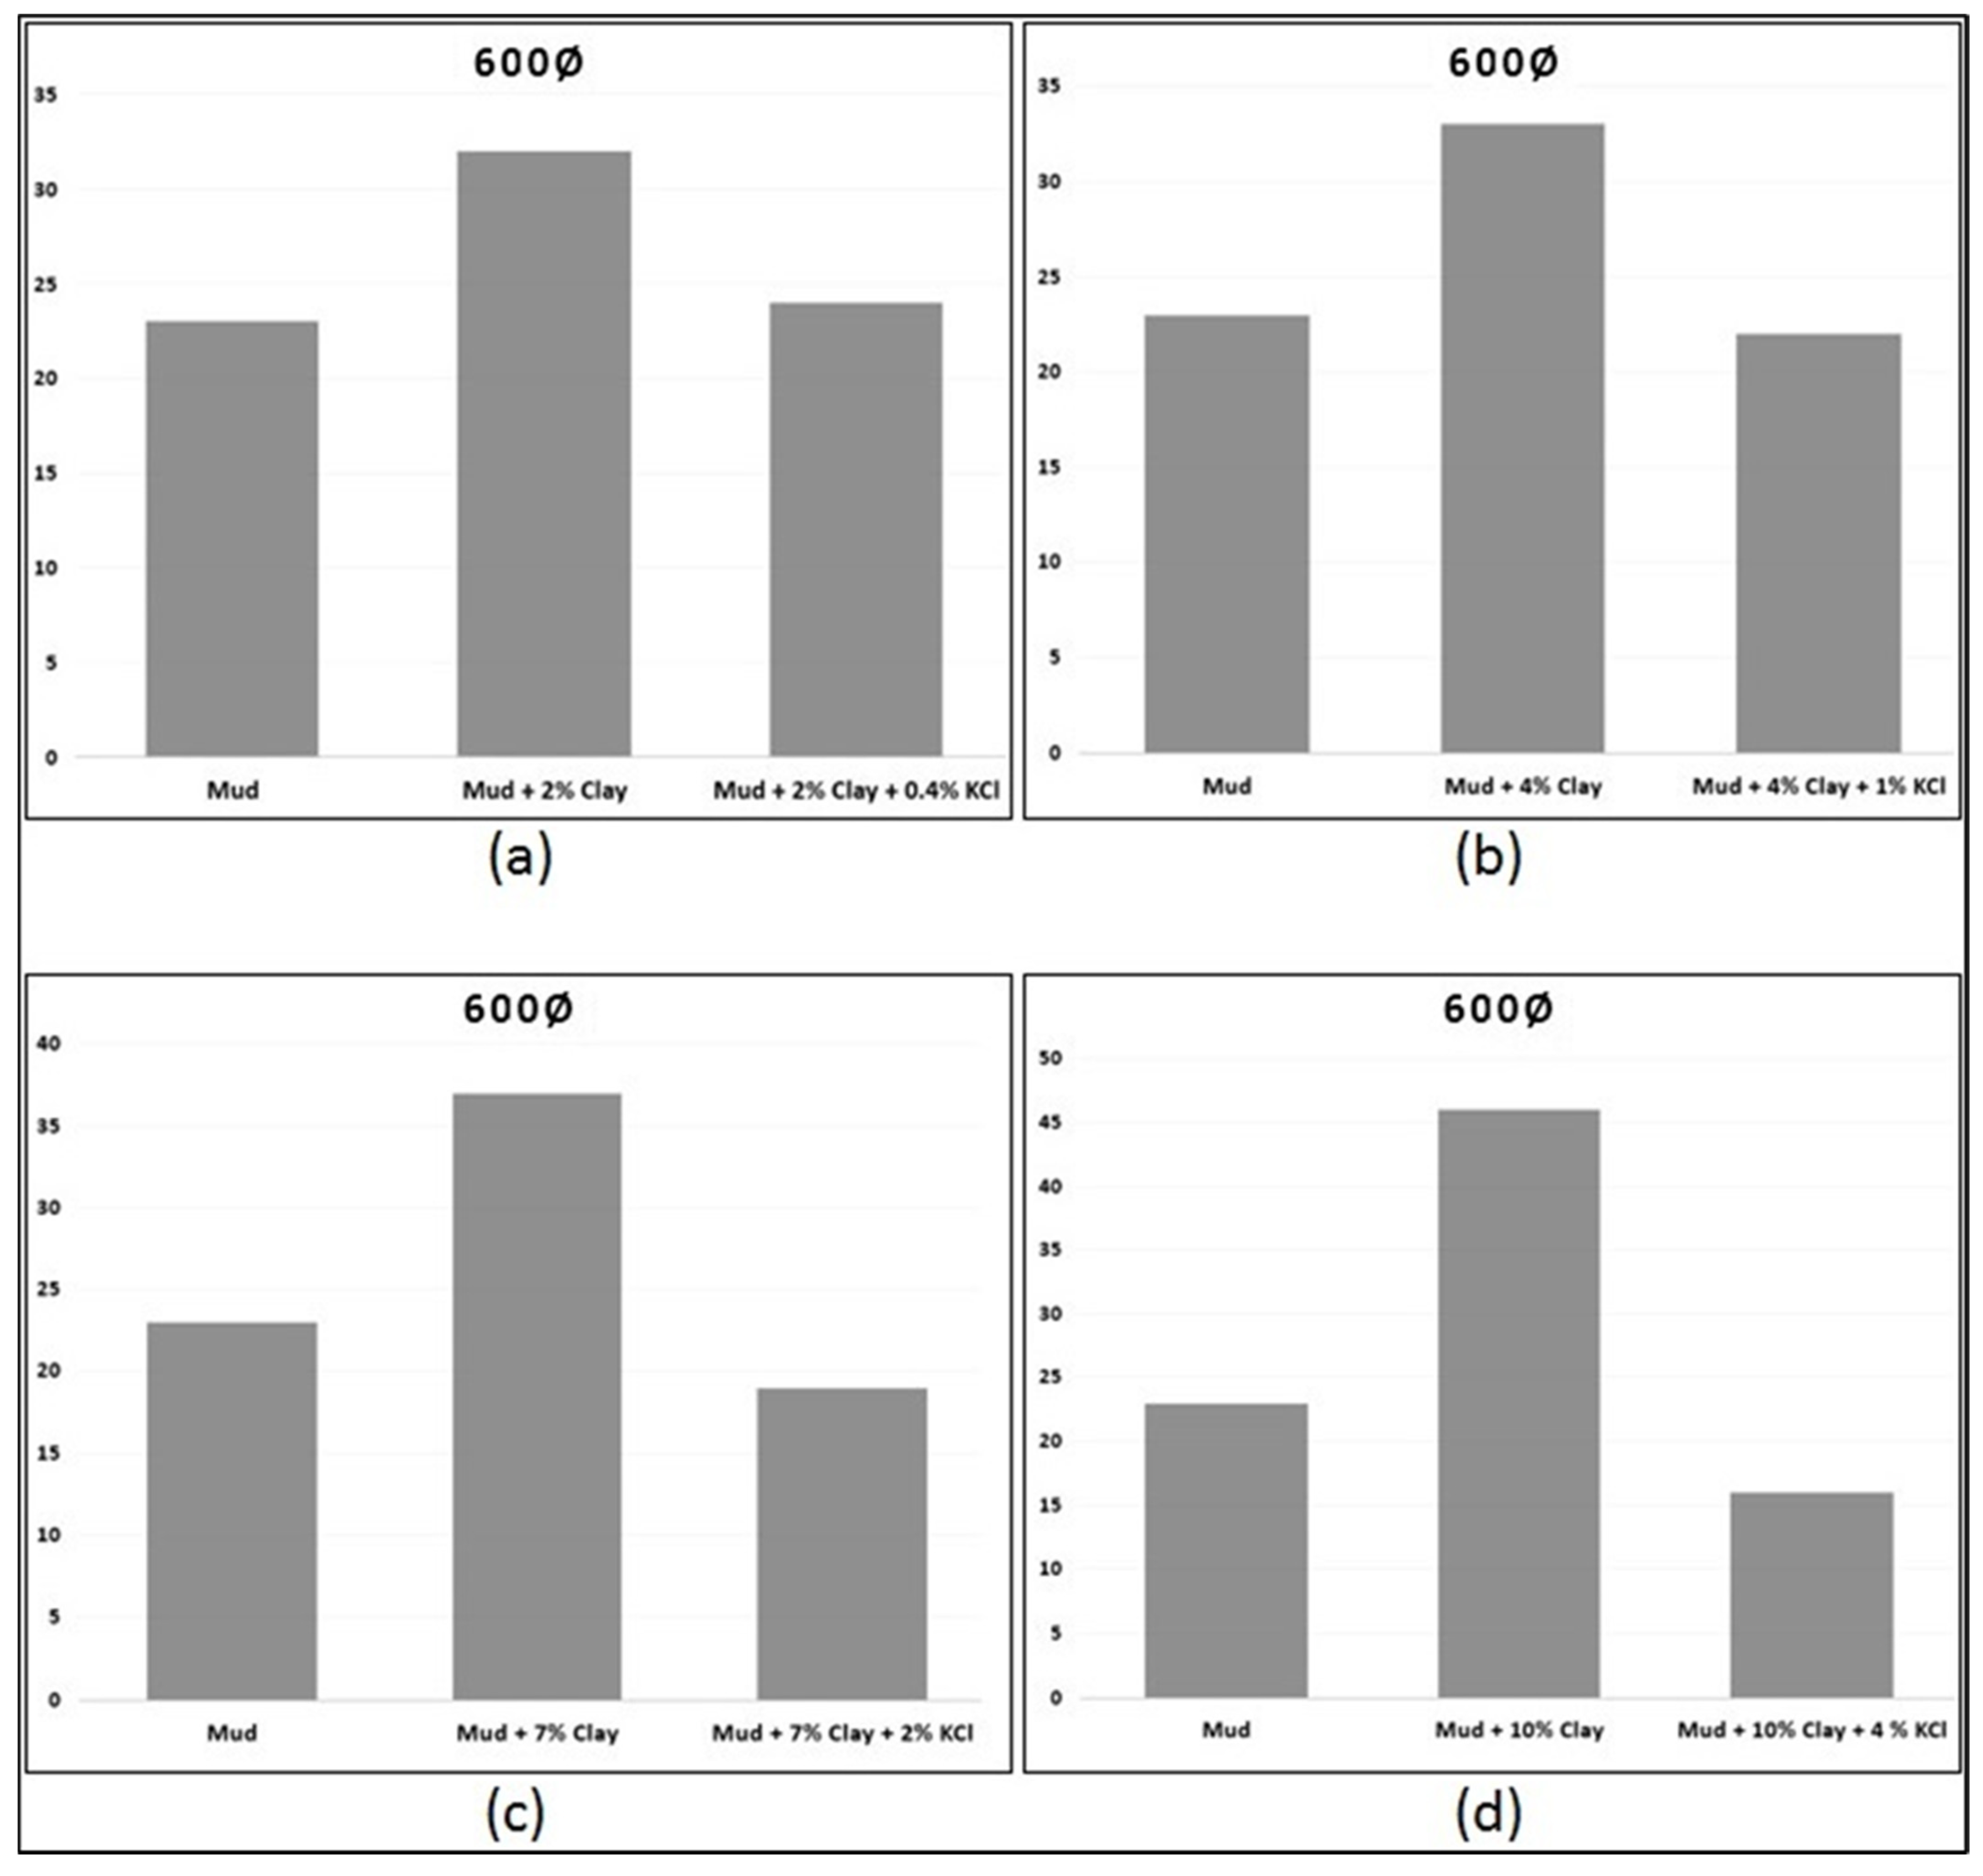
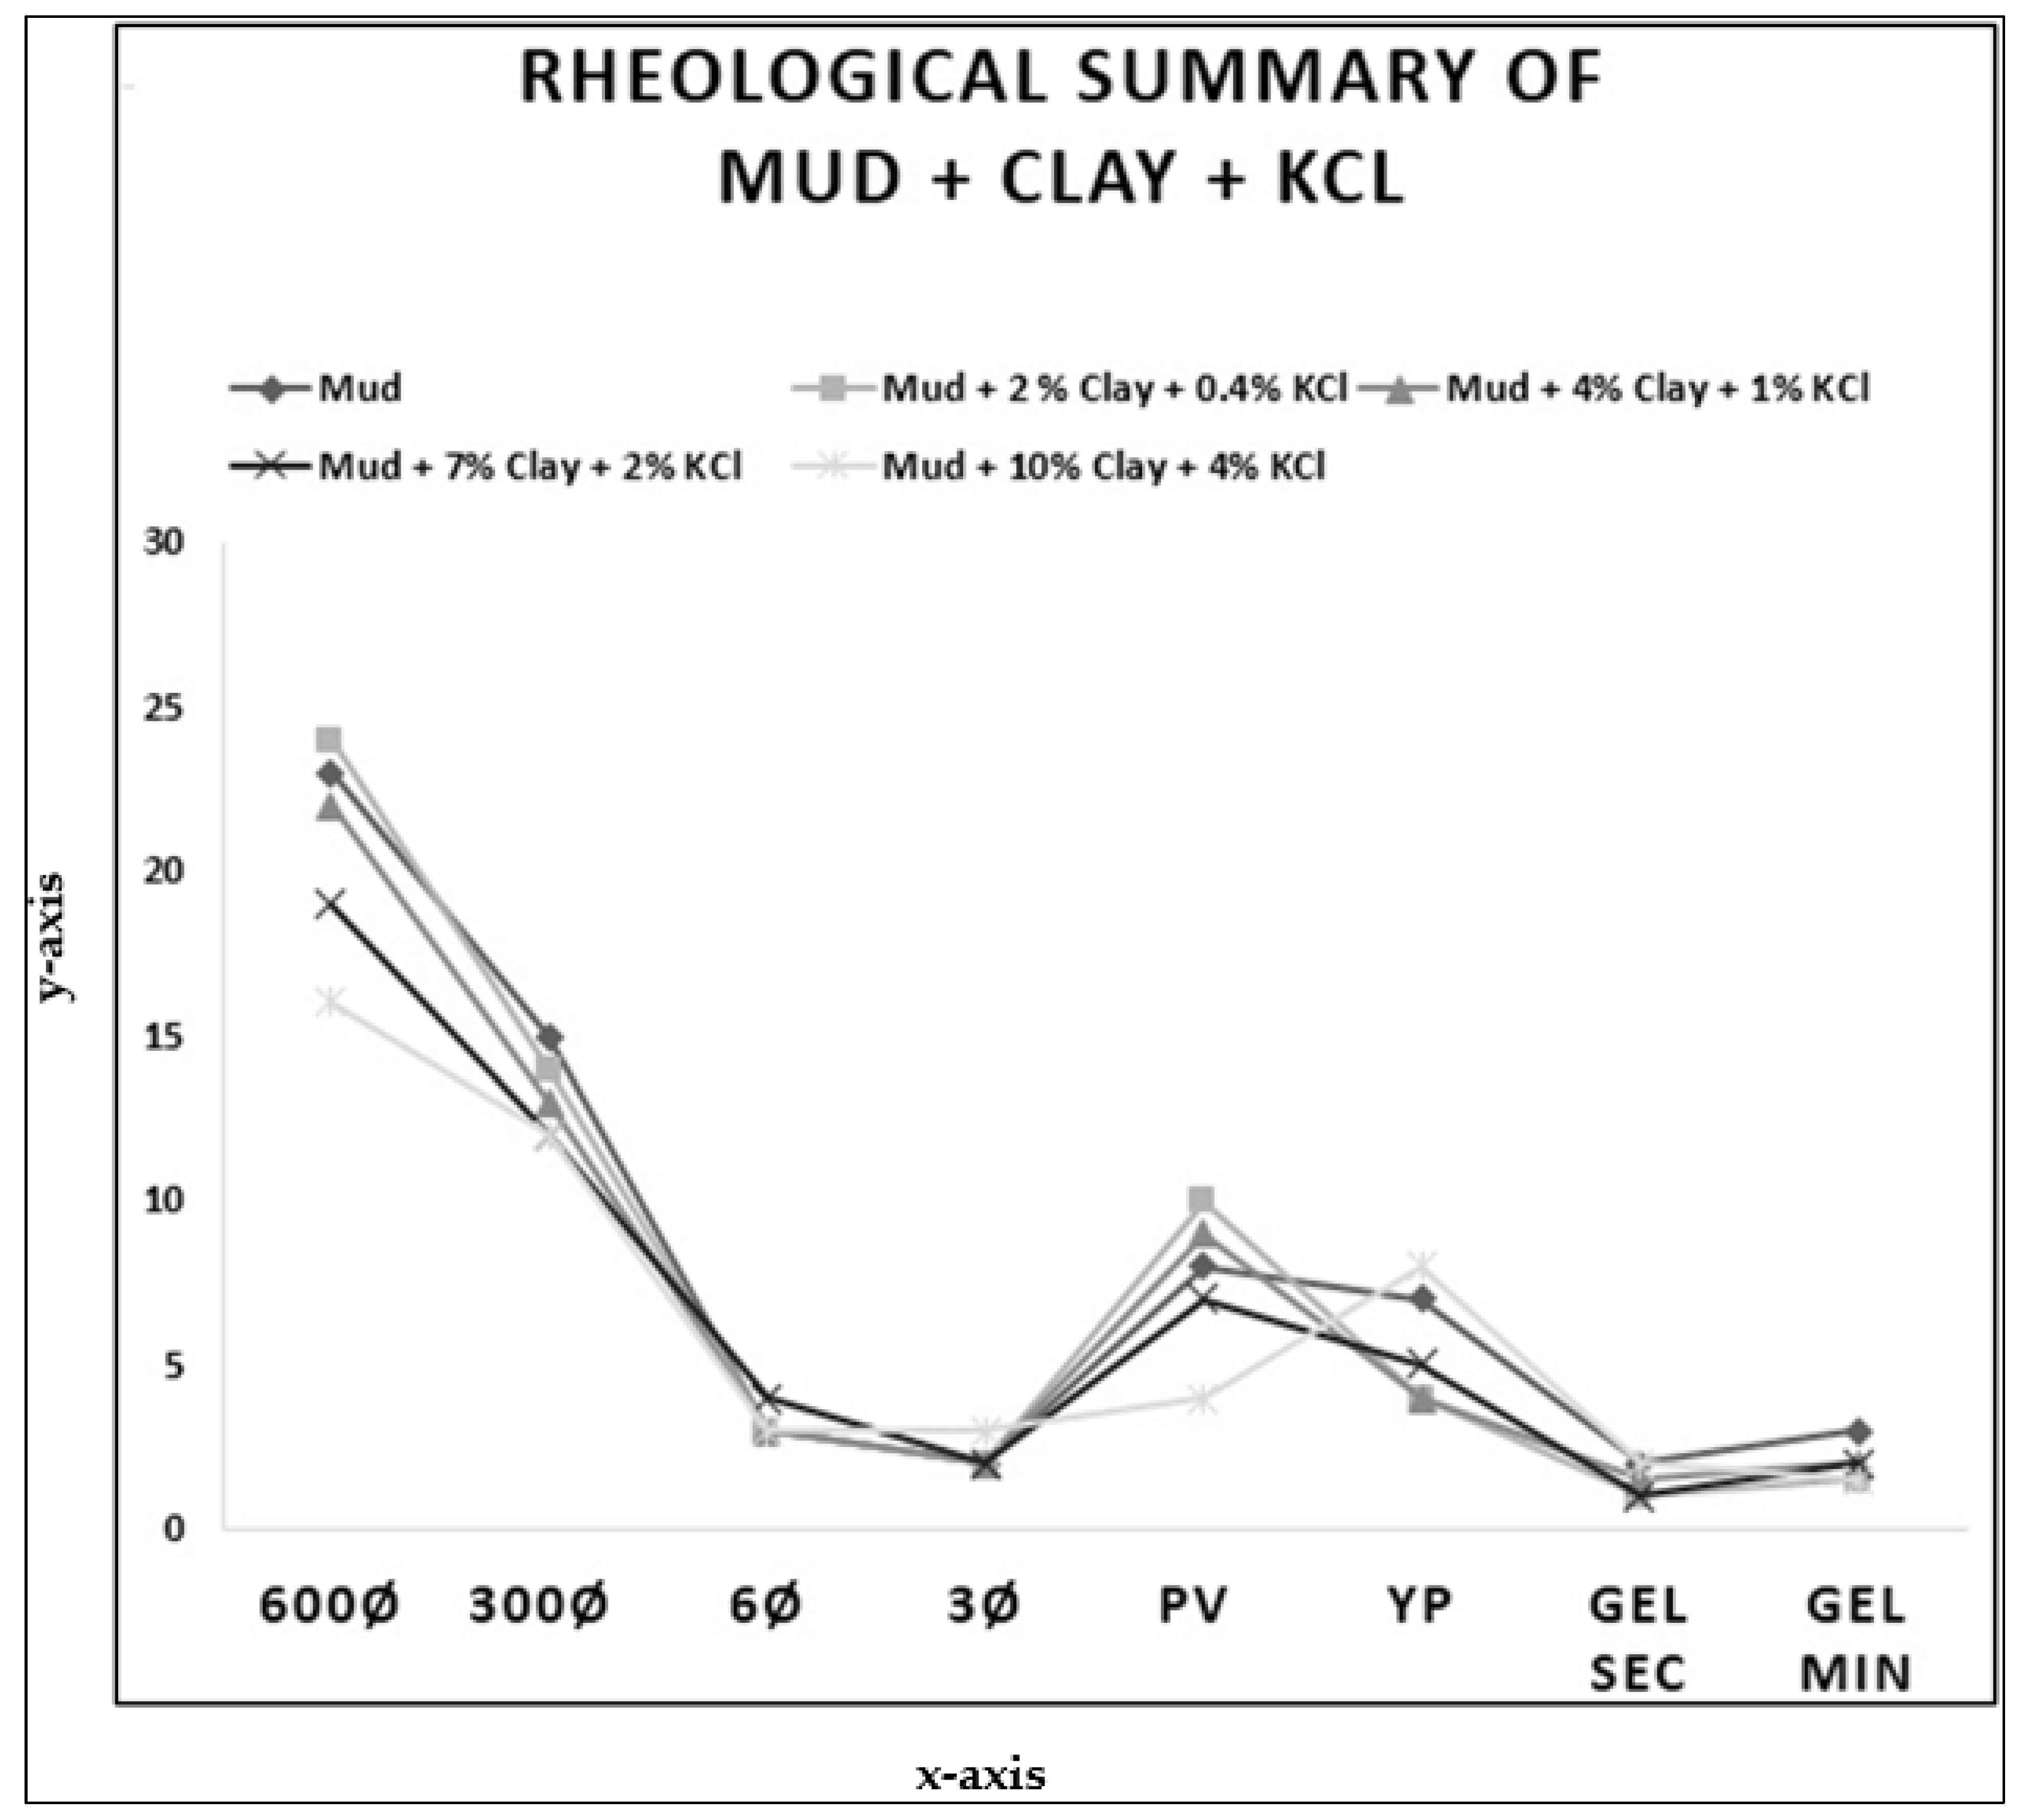
4.5. KCl-Concentrated Mud

The introduction of clays into the mud caused variations in the rheological features of the mud because of the mineralogical composition of the clays of the Murree Formation. An experimental study showed that the rheological values of concentrated clay mud also changed, as in the previous experimental section, in which mud was introduced with different concentrations of Murree clays. Now, with the addition of potassium chloride, the rheology reverted almost in line with the default values for prepared mud. The results in Table 4 were obtained by introducing different KCl concentrations.
During the first phase, rheological properties reverted to the API standards used in drilling industries to meet the desired results for better wellbore conditions. In the second phase, a gradual decrease in the rheological values occurred with the increase in KCl concentration. The new data revealed that the result was close to the default mud rheological properties. The 600 Φ dial readings are shown in the graph in Figure 7. The graph shows that the mud properties obtained are quite suitable, within the range of the mud properties that were declared for the reference default mud for our findings.
The decrease in the rheological values from the clay-concentrated mud to the KCl-concentrated clay + mud are illustrated in Figure 7; the values were 25% (from 32 to 24 cP) for 0.4% KCl, 33.3% (from 33 to 22 cP) for 1% KCl, 48.6% (from 37 to 19 cP) for 2% KCl, and 65.2% (from 46 to 16 cP) for 4% KCl. We can also interpret the findings from the dial readings of the experimental tasks. The results can be interpreted in the following way: how categorically the dial recordings mitigated toward the normal after introducing an additive. As shown in Figure 8a, the rheological behavior of mud + 2% clay was brought back nearly to that of the default mud after 0.4% KCl introduction by weight to the clay-concentrated mud. We can observe the same trend in Figure 8b for 1% KCl introduction by weight to the 4% clay-concentrated mud, in Figure 8c for 2% KCl introduction by weight to the 7% clay-concentrated mud, and in Figure 8d after 4% KCl introduction by weight to the 10% clay-concentrated mud. In a broader view, all rheological properties can be analyzed for further investigation output, as shown in Figure 9. The bar trends of different clay-concentrated muds are shown in Figure 9, indicating a diversion toward the undesired results that are not required for the wellbore conditioning during the drilling process.
Meanwhile, other rheological properties can also be studied for the continuation of our findings for the optimization of water-based drilling mud. Rheological results are illustrated in Figure 10; the values tended to remain at default when the reading caused by the clay particles experienced stress, at which point they began to deform plastically [29]. However, the trend of plastic viscosity helps elucidate the behavior of rheological properties. This study indicated that PV increased as the concentration of clay increased. However, there was a noticeable increase in YP values until 7% KCl, decreasing with a 10% KCl concentration. This indicates the dispersion and settling tendency of the solid particles in the mixture. Most wells use sodium chloride (NaCl) as an additive. Still, the hydrated radius of a potassium ion is smaller than that of a sodium ion. A more significant amount of water will not be exposed to the clay–fluid interaction [30]. This could be sorted out for better results when different concentrations of KCl become part of the system and overcome this undesired change caused by the clay–fluid interaction in the Kohat Basin of Pakistan. The implication of this study on the drilling activities in this basin can be utilized according to the geological drilling plan of the development or appraisal well. We can estimate the percentage of clays in the Murree section with the help of geophysical surveys of formation thickness. After that, we can mitigate the problems before they are prone to happen with the required concentrations of additives. The result of this study can be used for a logical approach to statistics that leads to risk-free drilling in this region.

5. Conclusions

The study’s main objective was to mitigate the impact of Murree clay on the drilling mud to obtain optimized mud to deliver the drilling operation properly. The rheological properties of the mud significantly improved in the presence of KCl according to the results obtained. The colloidal chemistry of smectite-dominated clays has a substantial impact on the performance of water-based mud. Within the fluids carrying clay-based viscous material, the flocculation is influenced by the presence of solid contents. Considering the 600 RPM readings, the percentage increase in the clay-contaminated mud are 39.2%, 43.5%, 60.9%, and 100%, respectively. Cyclic testing of the drilling fluids is indicative of the progressive deprivation of the properties of drilling fluids with time. The conclusions drawn from the tests reveal that KCl prevented the smectite group swelling inclinations and led to reductions in rheological values of 25%, 33.3%, 48.6%, and 65.2% compared with the results without KCl in the mud. The laboratory results showed that mud + 4% clay + 1% KCl proved to be the best for mitigation purposes, as the rheological reading values were similar to those of the mud used for better performance. The property of plastic viscosity resulted in diverting in the mud with different concentrations of the clay. The test results indicated that the plastic viscosity increased as the concentration of clays increased. However, there was a noticeable reduction in the yield point values with the introduction of KCl. This indicates the dispersion and settling tendency of the solid particles in the mixture. Tests enabled the scope to increase the inhibition efficiency and optimize customization. This inhibition factor considers several methods, such as the clay samples, and simulates the interactions in drilling operations on a small scale to make changes on a large scale. In that sense, the non-productive time could be reduced in this region, where problematic Murree clays are encountered most often inside the drilling wells.

Author Contributions

Conceptualization, S.M.T.Q. and W.A.; methodology, S.M.T.Q., W.A., A.K.M.E.H. and A.E.R.; software, W.A. and A.K.M.E.H.; formal analysis and investigation, S.M.T.Q., W.A., A.K.M.E.H., A.E.R., M.H.H. and A.K.A.A.; data curation, S.M.T.Q. and W.A.; writing—original draft preparation, S.M.T.Q., W.A., A.K.M.E.H., A.E.R., M.H.H. and A.K.A.A. All authors have read and agreed to the published version of the manuscript.

Funding

This research received no external funding.

Acknowledgments

The authors would like to thank the Oil and Gas Training Institute (OGTI) Laboratory and the Oil and Gas Development Company Limited (OGDCL) for their technical support in their laboratory at the OGTI base camp and at the drilling well site of Mela Oil Field (OGDCL) in the KPK province of Pakistan.

Conflicts of Interest

The authors declare no conflict of interest.

Abbreviations

APIAmerican Petroleum Institute
cPCentipoise
G10s/10mGel after 10 s and 10 min (lb/100 ft2)
KClPotassium Chloride
NPTNon Productive Time
PAC-LVPolyanionic Cellulose—Low Viscosity
PVPlastic Viscosity
WBMWater-Based Mud
OBMOil-Based Mud
XRDX-ray Diffraction
YPYield Point

References

  1. Aftab, A.; Ismail, A.R.; Ibupoto, Z.H.; Akeiber, H.; Malghani, M.G.K. Nanoparticles based drilling muds a solution to drill elevated temperature wells: A review. Renew. Sustain. Energy Rev. 2017, 76, 1301–1313. [Google Scholar] [CrossRef]
  2. EIA. Projects 48% Increase in World Energy Consumption by 2040. 2016. Available online: www.eia.gov/todayinenergy (accessed on 28 March 2022).
  3. IEA. Key World Energy Statistics; International Energy Agency: Paris, France, 2014. [Google Scholar]
  4. Qadri, S.M.T.; Islam, A.; Shalaby, M.R.; Ali, S.H. Integration of 1D and 3D modeling schemes to establish the Farewell Formation as a self-sourced reservoir in Kupe Field, Taranaki Basin, New Zealand. Front. Earth Sci. 2020, 15, 631–648. [Google Scholar] [CrossRef]
  5. Islam, M.A.; Yunsi, M.; Qadri, S.M.T.; Shalaby, M.R.; Haque, A.K.M.E. Three-dimensional structural and petrophysical modeling for reservoir characterization of the Mangahewa Formation, Pohokura Gas-Condensate Field, Taranaki Basin, New Zealand. Nat. Resour. Res. 2021, 30, 371–394. [Google Scholar] [CrossRef]
  6. Qadri, S.M.T.; Islam, M.A.; Shalaby, M.R.; Abd El-Aal, A.K. Reservoir quality evaluation of the Farewell sandstone by integrating sedimentological and well log analysis in the Kupe South Field, Taranaki Basin-New Zealand. J. Pet. Explor. Prod Technol. 2021, 11, 11–31. [Google Scholar] [CrossRef]
  7. Radwan, A.E. Chapter Two—Three-dimensional gas property geological modeling and simulation. In Sustainable Geoscience for Natural Gas Sub-Surface Systems; Wood, D.A., Cai, J., Eds.; Elsevier: Amsterdam, The Netherlands, 2022; pp. 29–45. [Google Scholar] [CrossRef]
  8. Haque, A.E.; Qadri, S.T.; Bhuiyan, A.H.; Navid, M.; Nabawy, B.S.; Hakimi, M.H.; Abd-El-Aal, A.K. Integrated wireline log and seismic attribute analysis for the reservoir evaluation: A case study of the Mount Messenger Formation in Kaimiro Field, Taranaki Basin, New Zealand. J. Nat. Gas Sci. Eng. 2022, 99, 104452. [Google Scholar] [CrossRef]
  9. Hossain, M.E.; Al-Majed, A.A. Fundamentals of Sustainable Drilling Engineering, 1st ed.; Wiley-Scrivener: Austin, TX, USA, 2015; ISBN 100470878177. [Google Scholar] [CrossRef]
  10. Sehly, K.; Chiew, H.-L.; Li, H.; Song, A.; Leong, Y.-K.; Huang, W. Stability and ageing behaviour and the formulation of potassium-based drilling muds. Appl. Clay Sci. 2015, 104, 309–317. [Google Scholar] [CrossRef] [Green Version]
  11. Radwan, A.; Abudeif, A.; Attia, M.; Mohammed, M. Pore and fracture pressure modeling using direct and indirect methods in Badri Field, Gulf of Suez, Egypt. J. Afr. Earth Sci. 2019, 156, 133–143. [Google Scholar] [CrossRef]
  12. Khodja, M.; Canselier, J.P.; Bergaya, F.; Fourar, K.; Khodja, M.; Cohaut, N.; Benmounah, A. Shale problems and water-based drilling fluid optimization in the Hassi Messaoud Algerian oil field. Applied Clay Sci. 2010, 49, 383–393. [Google Scholar] [CrossRef] [Green Version]
  13. Charlez, P.A.; Heugas, O. Evaluation of Optimal Mud Weight in Soft Shale Levels. In Proceedings of the 32nd US Symposium Rock Mechanics as a Multidisciplinary Science, Norman, France, 10–12 July 1991. [Google Scholar]
  14. van Oort, E. On the physical and chemical stability of shales. J. Pet. Sci. Eng. 2003, 38, 213–235. [Google Scholar] [CrossRef]
  15. Simpson, J.P.; Walker, T.O.; Jiang, G.Z. Environmentally Acceptable Water-Based Mud Can Prevent Shale Hydration and Maintain Borehole Stability. SPE Drill. Complet. 1995, 10, 242–249. [Google Scholar] [CrossRef]
  16. Kazmi, H.A.; Abbasi, I.A. Stratigraphy and Historical Geology of Pakistan: National Centre of Excellence in Geology; University of Peshawar: Peshawar, Pakistan, 2008; p. 210. [Google Scholar]
  17. Hussain, S.A.; Han, F.Q.; Ma, Z.; Hussain, A.; Mughal, M.S.; Han, J.; Alhassan, A.; Widory, D. Origin and Evolution of Eocene Rock Salts in Pakistan and Implications for Paleoclimate Studies: Insights from Chemistry and Cl Stable Isotopes. Front. Earth Sci. 2021, 9, 644485. [Google Scholar] [CrossRef]
  18. Pivnik, D.A.; Sercombe, W.J. Compression- and transpression-related deformation in the Kohat Plateau, NW Pakistan. Geol. Soc. Lond. Spéc. Publ. 1993, 74, 559–580. [Google Scholar] [CrossRef]
  19. Paracha, W. Kohat Plateau with Reference to Himalayan Tectonic General Study. CSEG Rec. 2004, 29, 46–52. [Google Scholar]
  20. Kadri, I.B. Petroleum Geology of Pakistan; Ferozsons (Pvt.) Ltd.: Lahore, Pakistan, 1995; p. 275. [Google Scholar]
  21. Amjad, M.R.; Hameed, M.S.; Mujtaba, M.; Munir, M. NPetrophysical and Geochemical Analysis of Chichali Formation for the Source Rock Evaluation: A Case Study of Chanda-01 Well, Upper Indus Basin, Pakistan. Int. J. Econ. Environ. Geol. 2017, 8, 32–39. [Google Scholar]
  22. Shah, S.M.I. Stratigraphy of Pakistan; The Geological Survey of Pakistan: Islamabad, Pakistan, 2009; Volume 22, 381p.
  23. Meissner, C.R., Jr.; Master, J.M.; Rashid, M.A.; Hussain, M. Stratigraphy of Kohat Quardangle, Pakistan; Paper 716-D; USGS: Reston, VA, USA, 1974; pp. 1–30.
  24. API RP 13B-1. Recommended Practice Stand. Proced. For Field Testing Water Based Drilling Fluids. 2003. Available online: http://www.chinajorson.cn/indexfile/upload_c28ad669455b32706a19472d60cafa5a.pdf (accessed on 28 March 2022).
  25. Benayada, B.; Habchi, K.N.; Khodja, M. Stabilization of clay walls during drilling in Southern Algeria. Appl. Energy 2003, 75, 51–60. [Google Scholar] [CrossRef]
  26. Andrei, A. Bunaciu, Elena gabriela Udriştioiu & Hassan Y. Aboul-Enein. X-Ray Diffraction: Instrumentation and Applications. Crit. Rev. Anal. Chem. 2015, 45, 289–299. [Google Scholar]
  27. Wilson, W.J. The Truly Disadvantaged; University of Chicago Press: Chicago, IL, USA, 1987; p. 254. [Google Scholar]
  28. Jogun, S.M.; Zukoski, C.F. Rheology of Dense Suspensions of Plate like Particles. J. Rheol. 1996, 40, 1211–1232. [Google Scholar] [CrossRef]
  29. Chaffey, C.E. Mechanisms and equations for shear thinning and thickening in dispersions. Colloid Polym. Sci. 1977, 255, 691–698. [Google Scholar] [CrossRef]
  30. Zhou, J.; Jung, C.M.; Pedlow, J.W.; Chenevert, M.E.; Sharma, M.M. A new standardized laboratory protocol to study the interaction of organic-rich shales with drilling and fracturing fluids. In Proceedings of the SPE Annual Technical Conference and Exhibition, New Orleans, LA, USA, 30 September–2 October 2013. [Google Scholar]
Figure 1. Location and geographical map of the Kohat Basin indicating different features, such as a river, faults, oil and gas fields, etc. (modified from [20]).
Energies 15 03424 g001
Figure 2. Stratigraphic succession of Kohat Basin indicates the source and reservoir formations, modified from [21].
Energies 15 03424 g002
Figure 3. X-ray diffraction of Murree clay.
Energies 15 03424 g003
Figure 4. Trend of default rheological properties of mud. The x-axis indicates rheological properties, whereas the values on the y-axis are indicative of rheological values of the mud.
Energies 15 03424 g004
Figure 5. The image shows the rheological values (y-axis) compared with the rheological properties (x-axis).
Energies 15 03424 g005
Figure 6. Trend correlation between default mud and clay-concentrated mud.
Energies 15 03424 g006
Figure 7. Trend correlation between default mud and KCL-concentrated mud + clay.
Energies 15 03424 g007
Figure 8. Bar correlation between (a) default mud, 2% clay-concentrated mud, and 0.4% KCL-concentrated mud + 2% clay; (b) default mud, 4% clay-concentrated mud, and 1% KCL-concentrated mud + 4% clay; (c) default mud, 7% clay-concentrated mud, and 2% KCL-concentrated mud + 7% clay; (d) default mud, 10% clay-concentrated mud, and 4% KCL-concentrated mud + 10% clay.
Energies 15 03424 g008
Figure 9. Correlation between all rheological dial readings (x-axis) compared with formulated mud (y-axis).
Energies 15 03424 g009
Figure 10. Trend correlation between default mud and mud + clay + KCL formulated mud. The rheological values are plotted along the y-axis and the rheological properties are mentioned along x-axis.
Energies 15 03424 g010
Table 1. Results of parameters for clay components.
Sr. #ParameterResult
1Native Moisture Content (%)14.21
2Cation Exchange Capacity (Meq/100 g)118
Table 2. Rheological properties of formulated mud.
MIXTURE600Ø (cP)300Ø (cP)6Ø (cP)3Ø (cP)PV (cP)YP (lb/100 ft2)Gel
10 s
Gel
10 min
Mud2315328723
Table 3. Rheological properties for muds with different concentrations of clay.
MIXTURE600Ø (cP)300Ø (cP)6Ø (cP)3Ø (cP)PV (cP)YP (lb/100ft2)Gel
10 s
Gel
10 min
Mud + 2% Clay32193213623
Mud + 4% Clay332264111158
Mud + 7% Clay3726131111151112
Mud + 10% Clay462514132181214
Table 4. Rheological properties for the mud at different concentrations of KCl.
MIXTURE600Ø (cP)300Ø (cP)6Ø (cP)3Ø (cP)PV (cP)YP (lb/100 ft2)Gel
10 s
Gel
10 min
Mud + 2% Clay + 0.4% KCl24143210411.5
Mud + 4% Clay + 1% KCl221332941.52
Mud + 7% Clay + 2% KCl1912427512
Mud + 10% Clay + 4% KCl1612334821.5
Publisher’s Note: MDPI stays neutral with regard to jurisdictional claims in published maps and institutional affiliations.

