3.1. Coupled Coordination Model
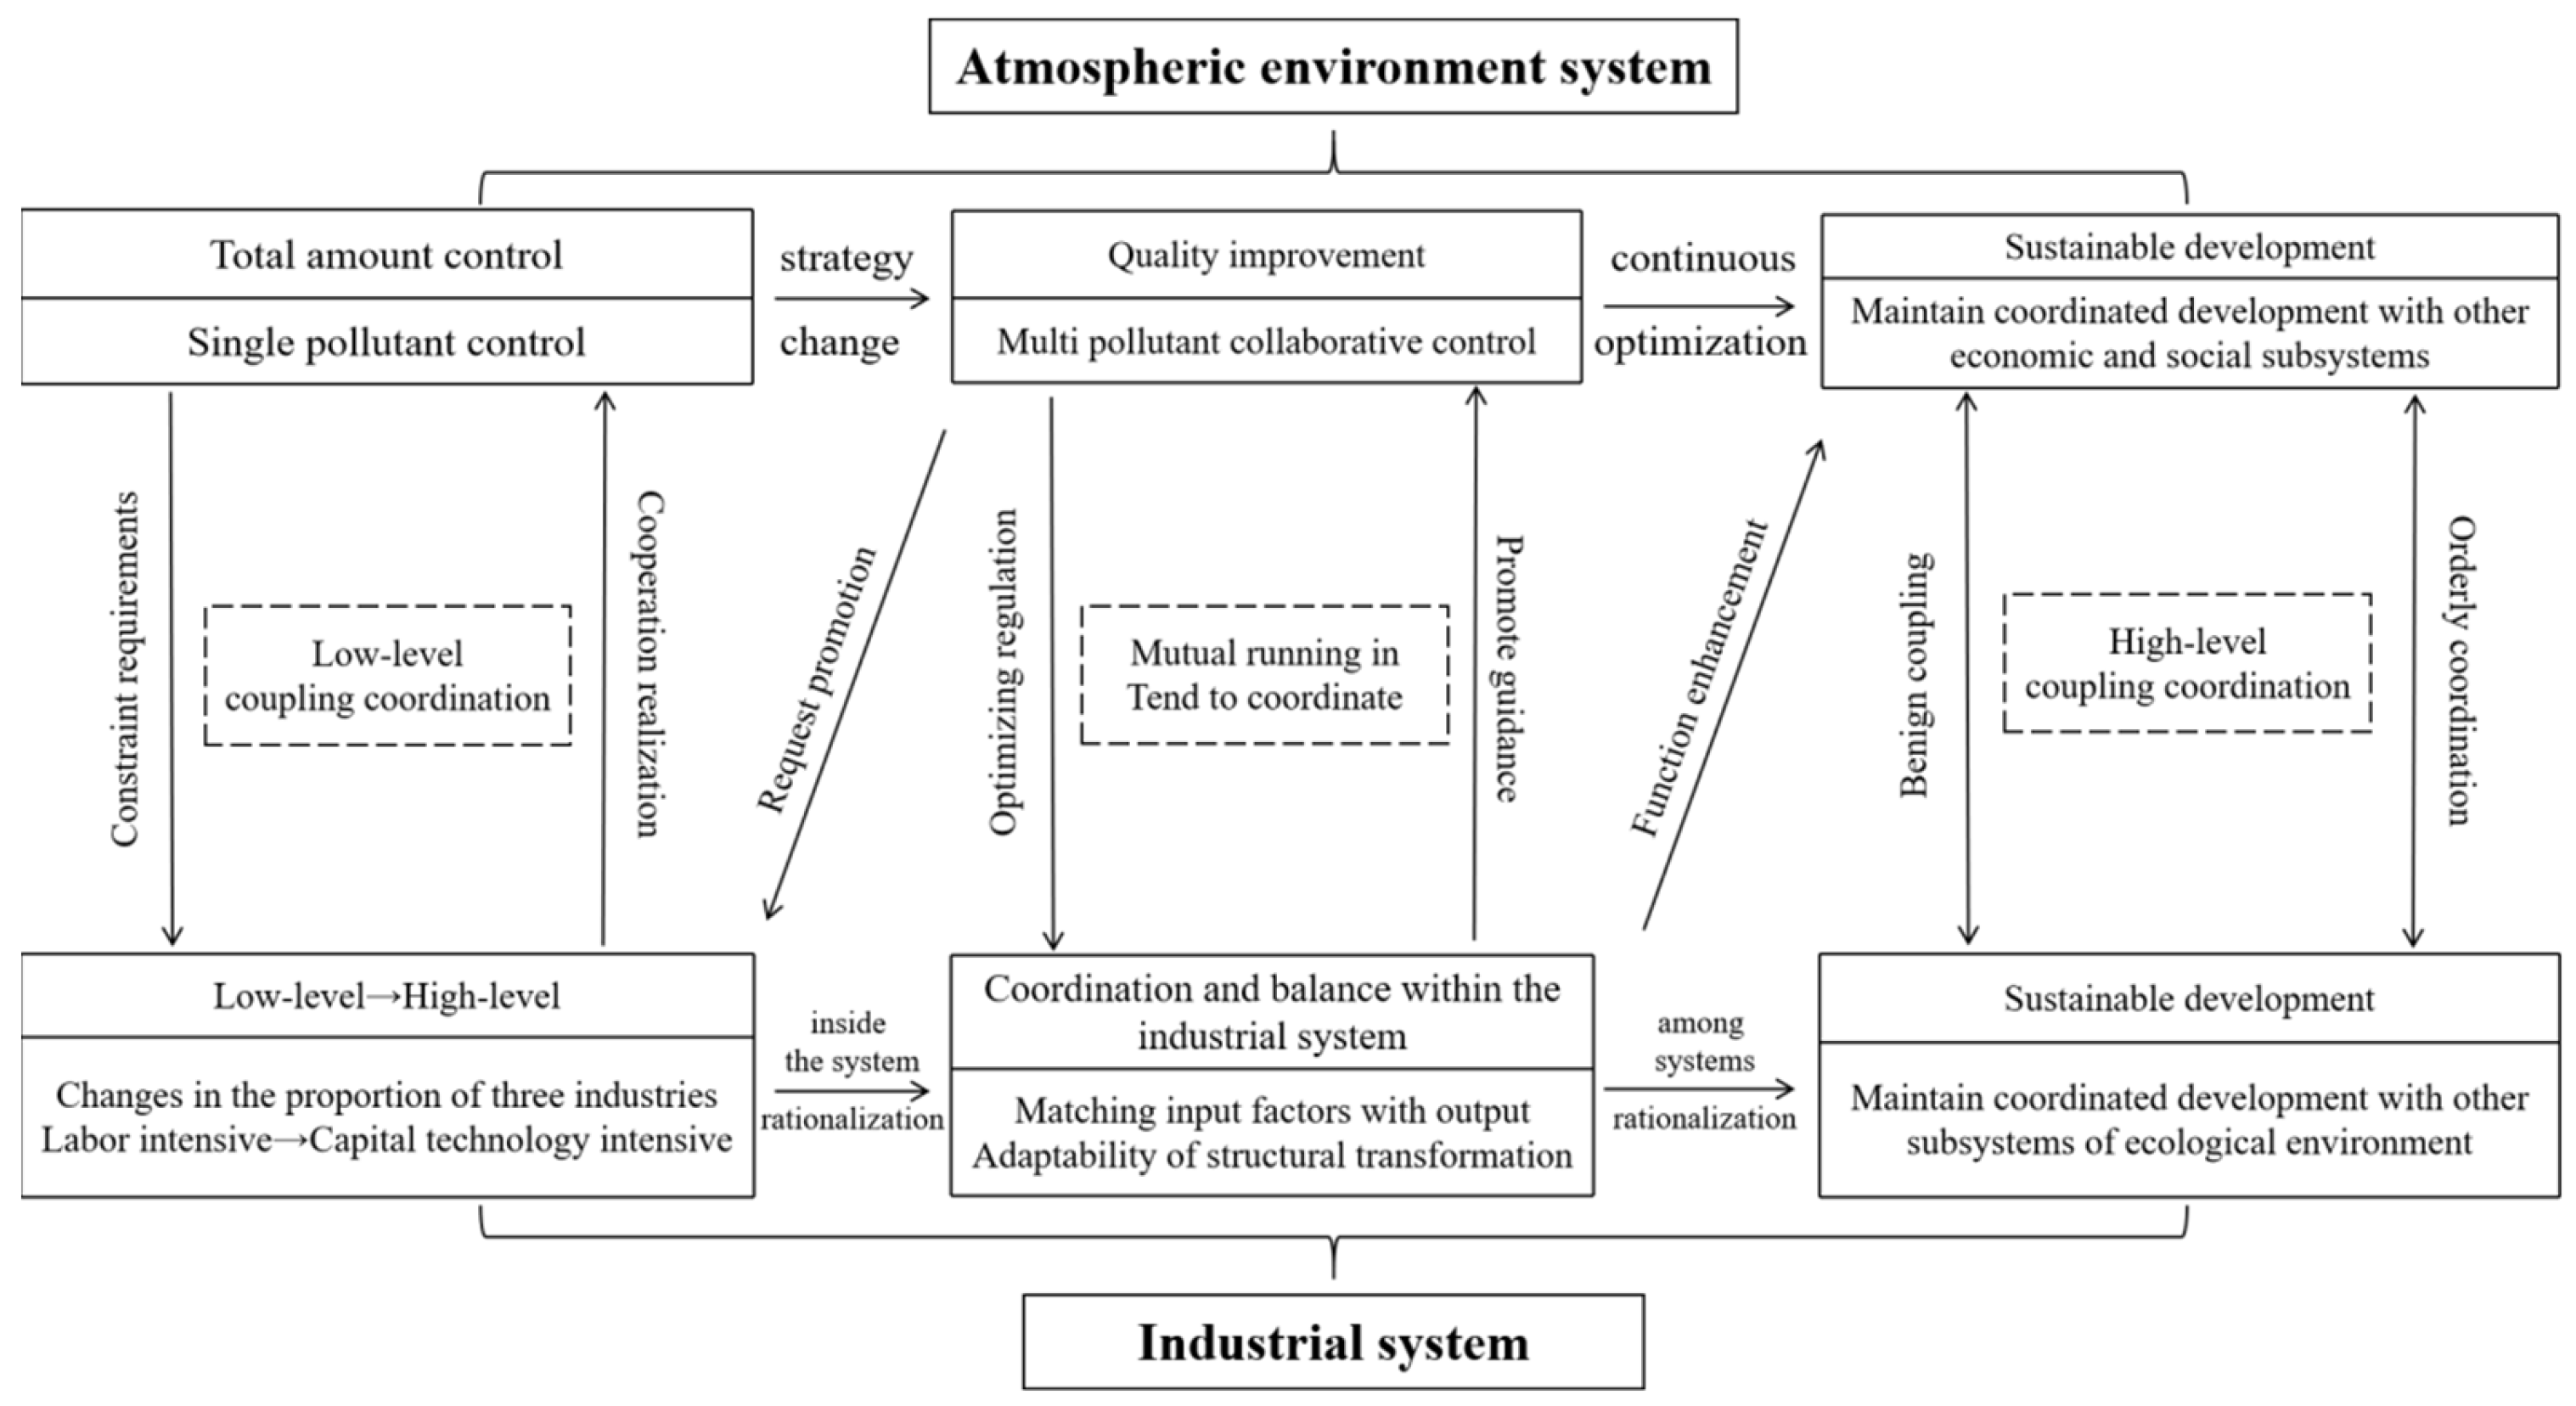
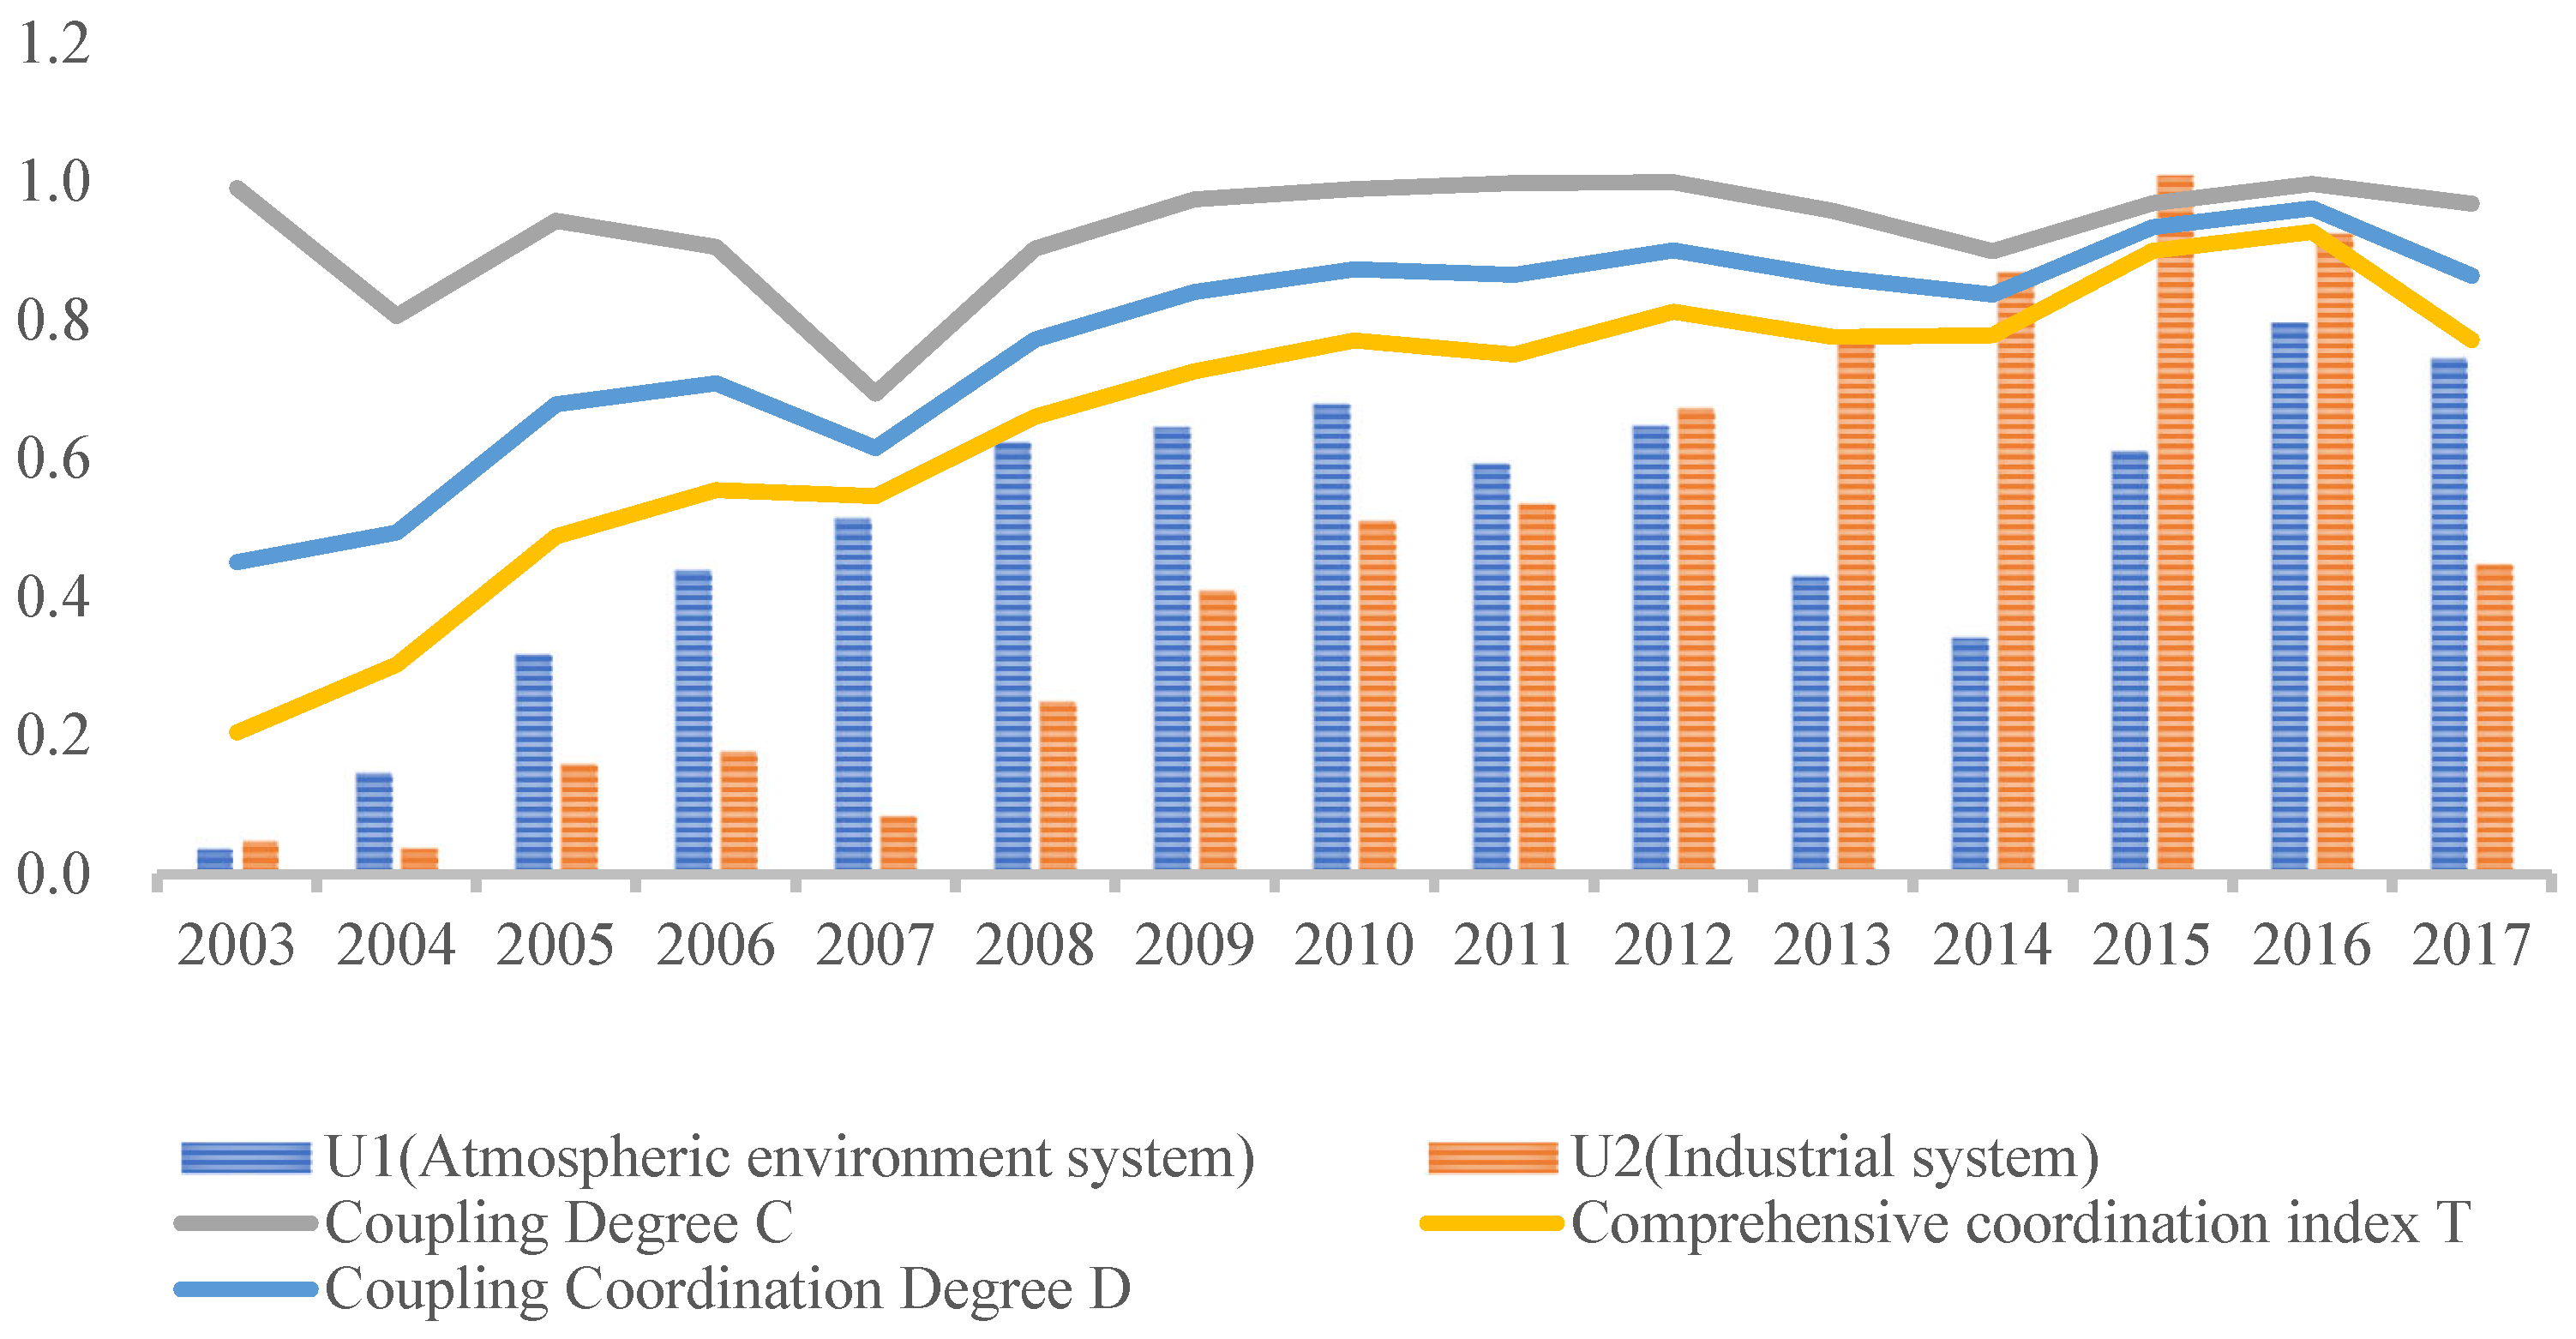
Coupling originates from the physical concept, which refers to the phenomenon that two or more systems and their elements affect each other and finally achieve synergy through interaction. The coupling degree in the model reflects the degree of mutual dependence and restriction between systems. The coupling coordination degree reflects the degree of benign coupling between systems in their interaction. The more obvious the trend of orderly development between systems, the greater the index.
For the comprehensive system composed of the atmospheric environment subsystem and the urban industry subsystem, subsystem
has
indicators, which are
,
,
,
. In order to eliminate the influence of dimensionality, the indicators need to be standardised before using these indicators to construct the comprehensive index of subsystem
. Referring to the existing research methods, this paper used the range method to process the data. When using this method, it needs to distinguish and process according to the positive and negative contributions of the index to the system. The greater the
value, the better the system function. It is called the positive index, and Formula (1) is used for standardisation. The smaller
value indicates the better system function, which is called the negative index, and Formula (2) is used for standardisation. The specific formulae are as follows:
where
is the standardised value of system
index
, 0 ≤
≤ 1.
is the maximum value of system
index
,
is the minimum value of system
index
, and
is the value of system
index
.
The comprehensive index of the atmospheric environment subsystem and the industrial subsystem is based on the weighted synthesis of the contribution of all indicators in each system to the subsystem, and its calculation formula is:
where
is the weight of index
of system
, where
and
. The weight corresponding to each index reflects the ability of the index to provide comprehensive information about the subsystem, so it needs to be determined according to the amount of information contained in the index. The principal component analysis method can effectively deal with the influence of information repetition and interaction between different indicators. Therefore, this method is also used in this paper. Through principal component analysis, the corresponding variance value of each index is obtained as the weight of the corresponding value index, and then the comprehensive index of each system and the coupling degree,
, between systems are calculated.
The calculation formula of coupling degree is as follows:
where
is the number of subsystems. Since the number of subsystems of the atmospheric environment and the urban industrial structure integrated system constructed in this paper is 2,
. Therefore, the above coupling calculation formula is simplified as follows:
where
and
are the comprehensive indexes of the atmospheric environment and the industrial subsystem, respectively. The value of
is between 0 and 1. The greater the value of
, the closer the relationship between systems. Referring to the median segmentation method adopted by most studies, it can be divided into the following four stages, listed in
Table 1.
However, the coupling index only reflects the function degree of the two systems. In order to account for the respective development of the two systems, it is necessary to further study whether the two systems are coordinated. Coordination is used to measure the degree of harmony of each subsystem. There is a close relationship between the industrial and the atmospheric environment subsystems. On the one hand, the atmospheric environmental carrying capacity requires the optimisation and upgrading of the industrial structure, and the atmospheric environmental quality will react to the process of industrial structure adjustment. On the other hand, the adjustment of the industrial structure not only needs to realise the healthy and sustainable development of the industrial system, but also needs to match with the carrying capacity of the atmospheric environment. The coupling coordination degree can better evaluate the coordination degree of the interaction coupling between industrial structure adjustment and atmospheric environmental quality improvement. The calculation formula is:
where
is the coupling coordination degree,
is the coupling degree, and
is the comprehensive coordination index of the industry and the atmospheric environment, reflecting the overall synergistic effect or contribution of industrial structure adjustment and atmospheric environment quality improvement.
and
are the weights of the two systems. This paper believes that the improvement of the atmospheric environment is as important as the optimisation and upgrading of the industrial structure, so
.
When the
D value is larger, it shows that the coordinated development of the two systems is better. According to the judgment method of existing research [
28], the coordination can be divided into ten stages according to the coupling coordination degree,
D, as shown in
Table 2.
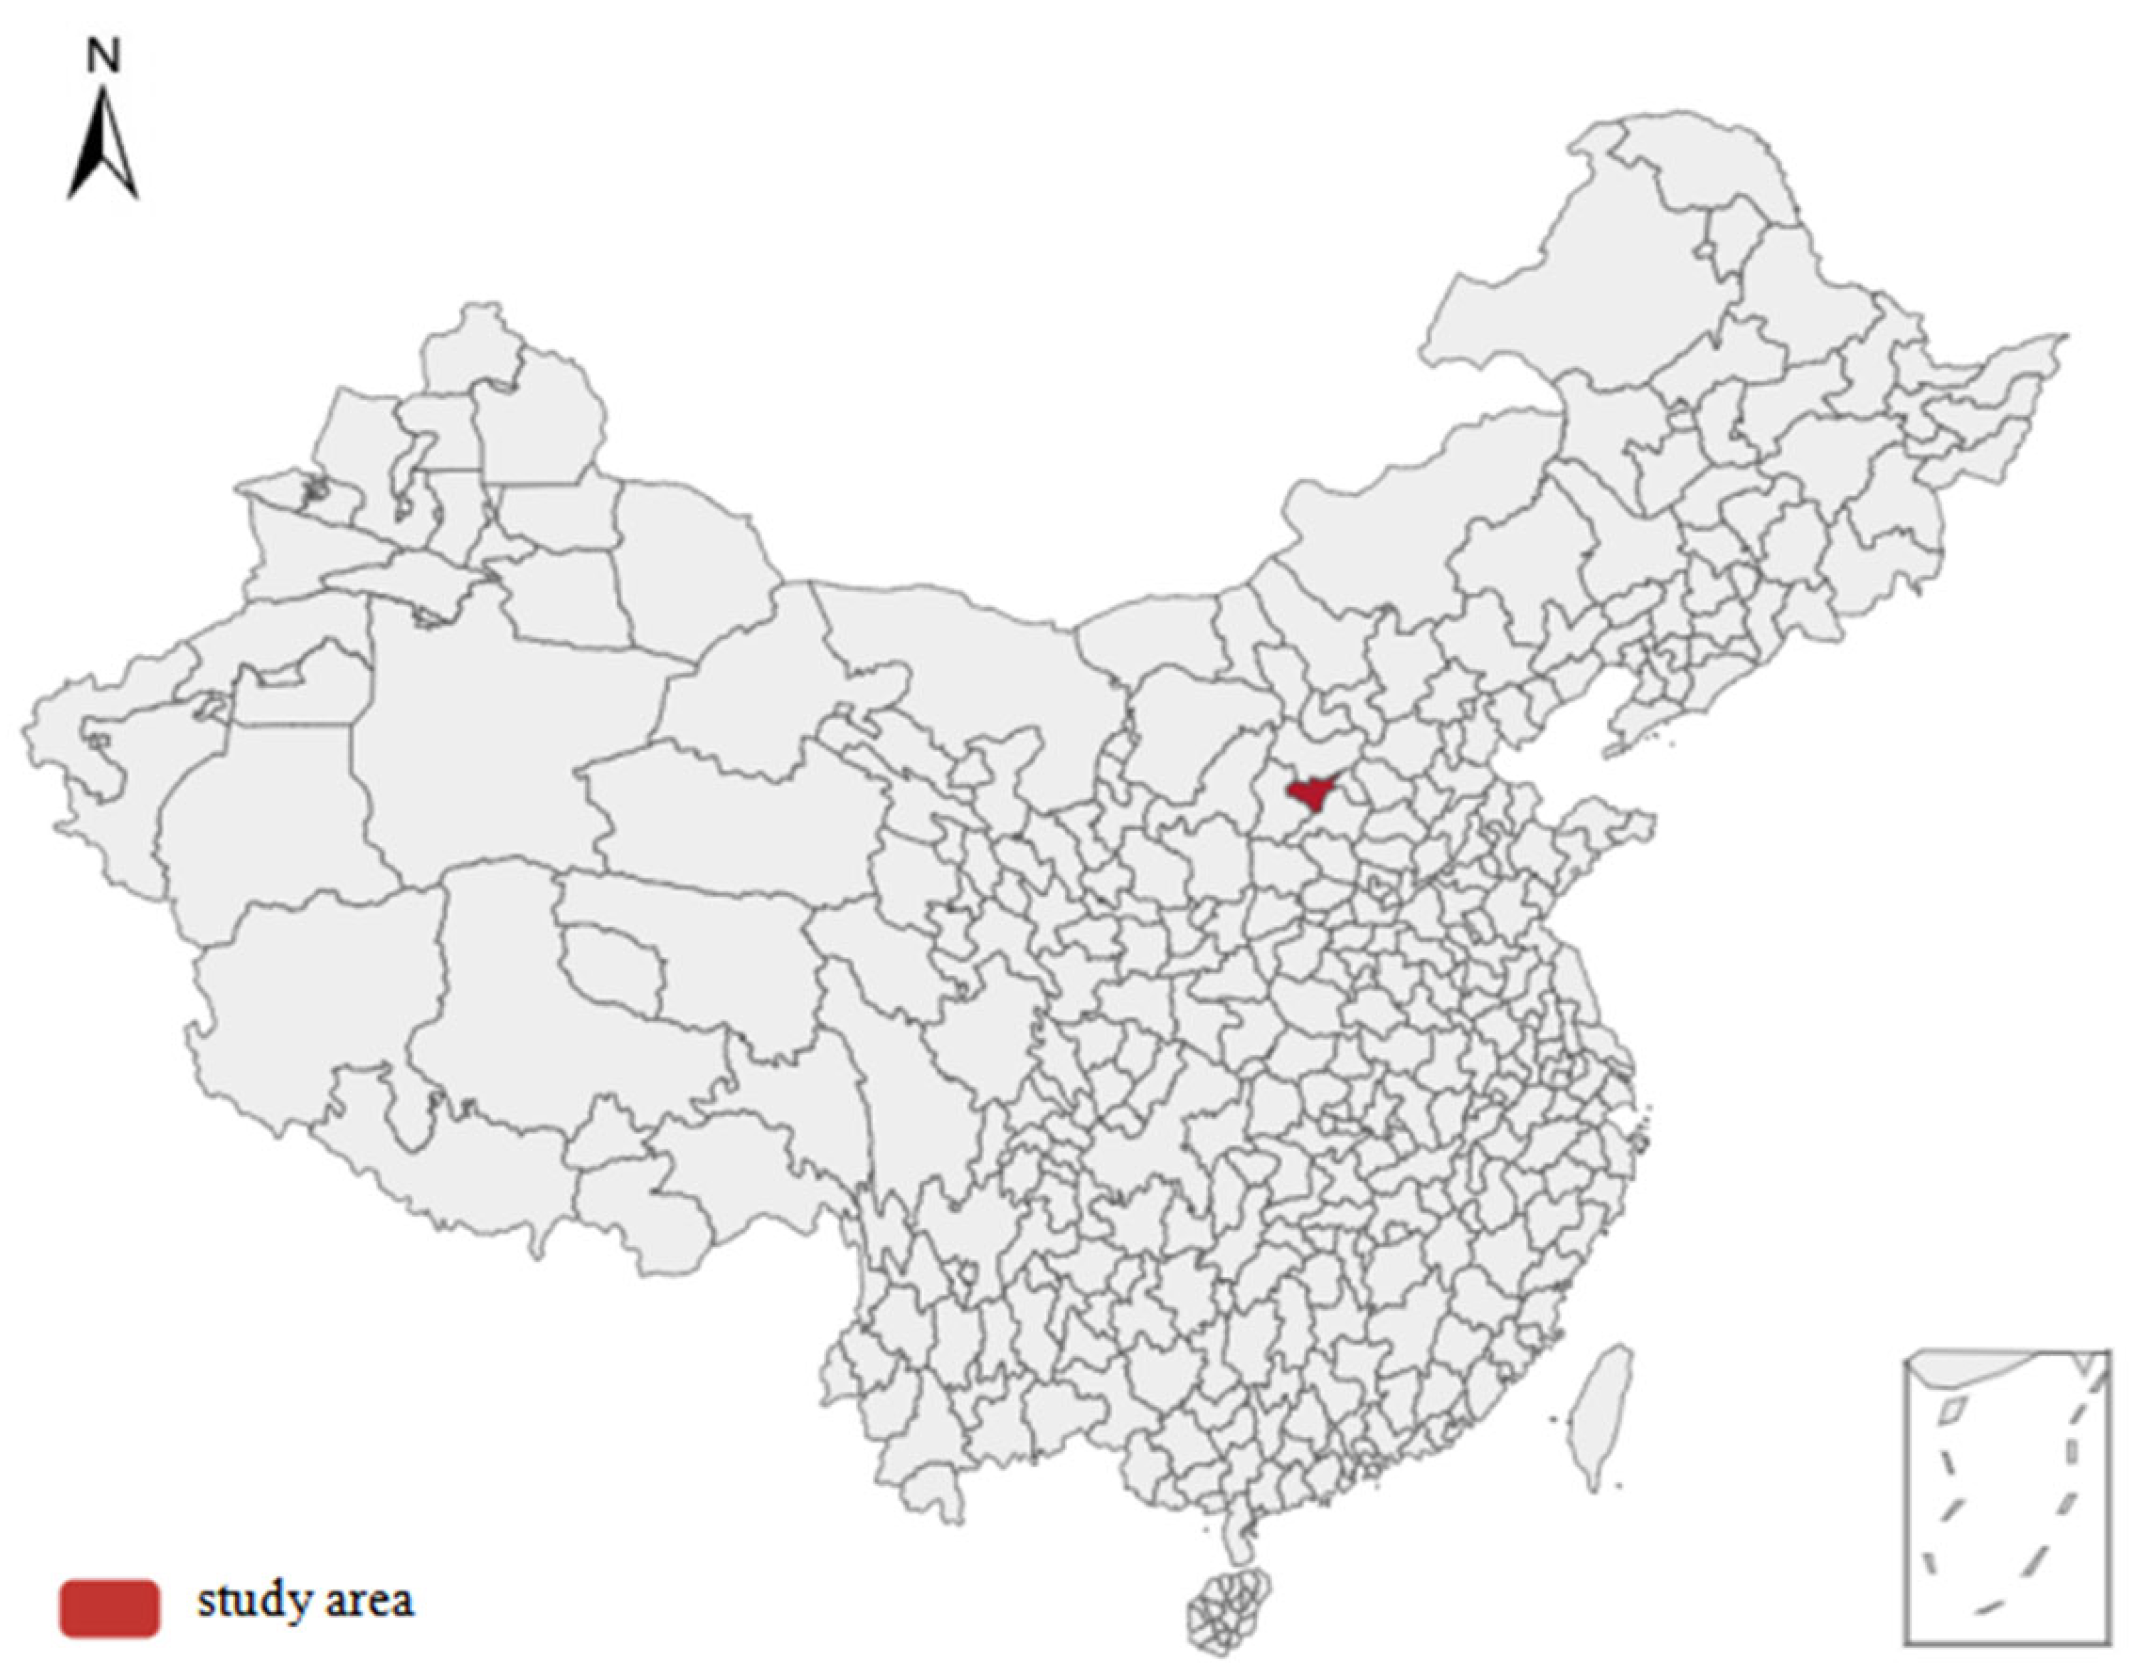
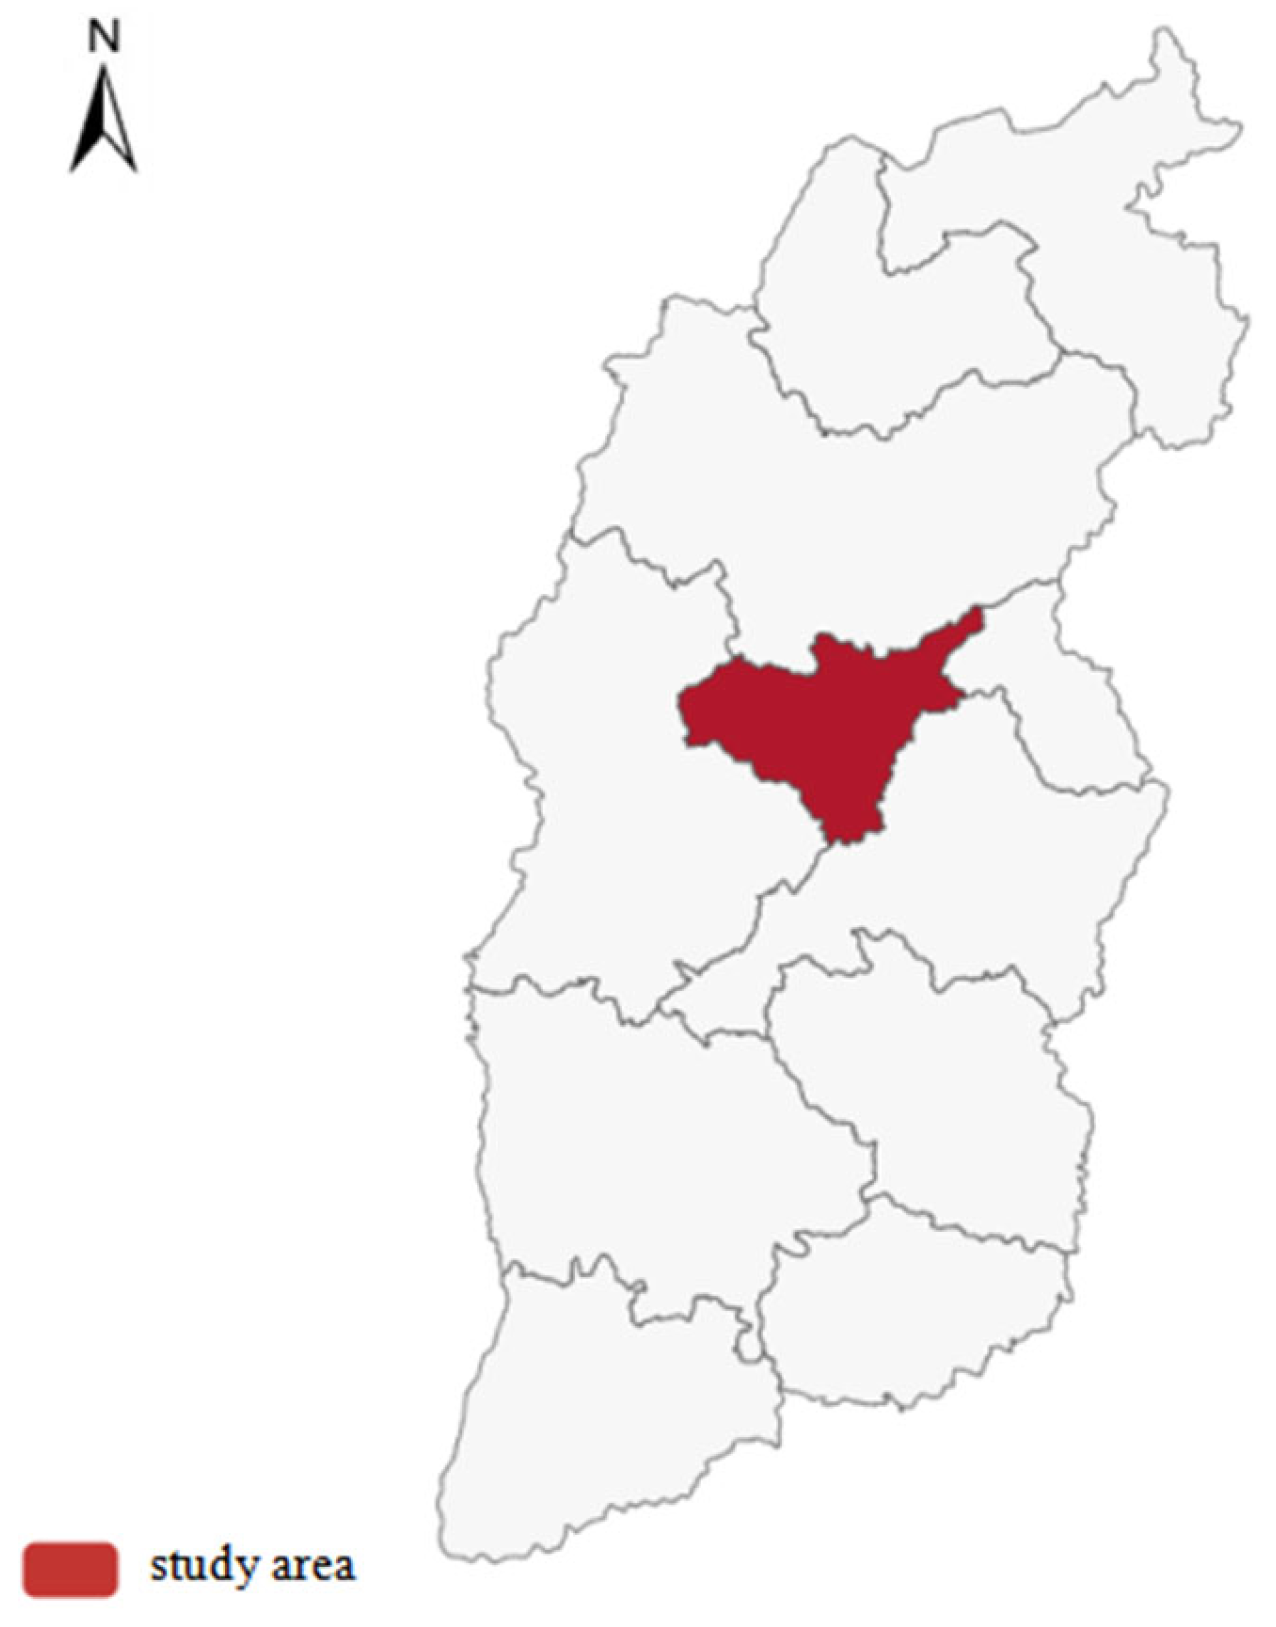
Considering the availability of data and indicators’ comprehensive information-carrying capacity, this paper constructs a comprehensive evaluation index system, as shown in
Table 3. Relevant data can be obtained from the official website of the Taiyuan Bureau of Statistics (
http://stats.taiyuan.gov.cn, accessed on 5 March 2022).
For the evaluation indicators of the atmospheric environment system, China mainly evaluates the atmospheric environment by monitoring the concentration of six types of pollutants (including PM10, PM2.5, O3, NO2, SO2, and CO) and the air quality index (AQI) in practice. However, because some data are difficult to obtain, this paper selects three indicators: industrial sulphur dioxide emission, industrial smoke (powder) dust emission, and days with air quality above grade II.
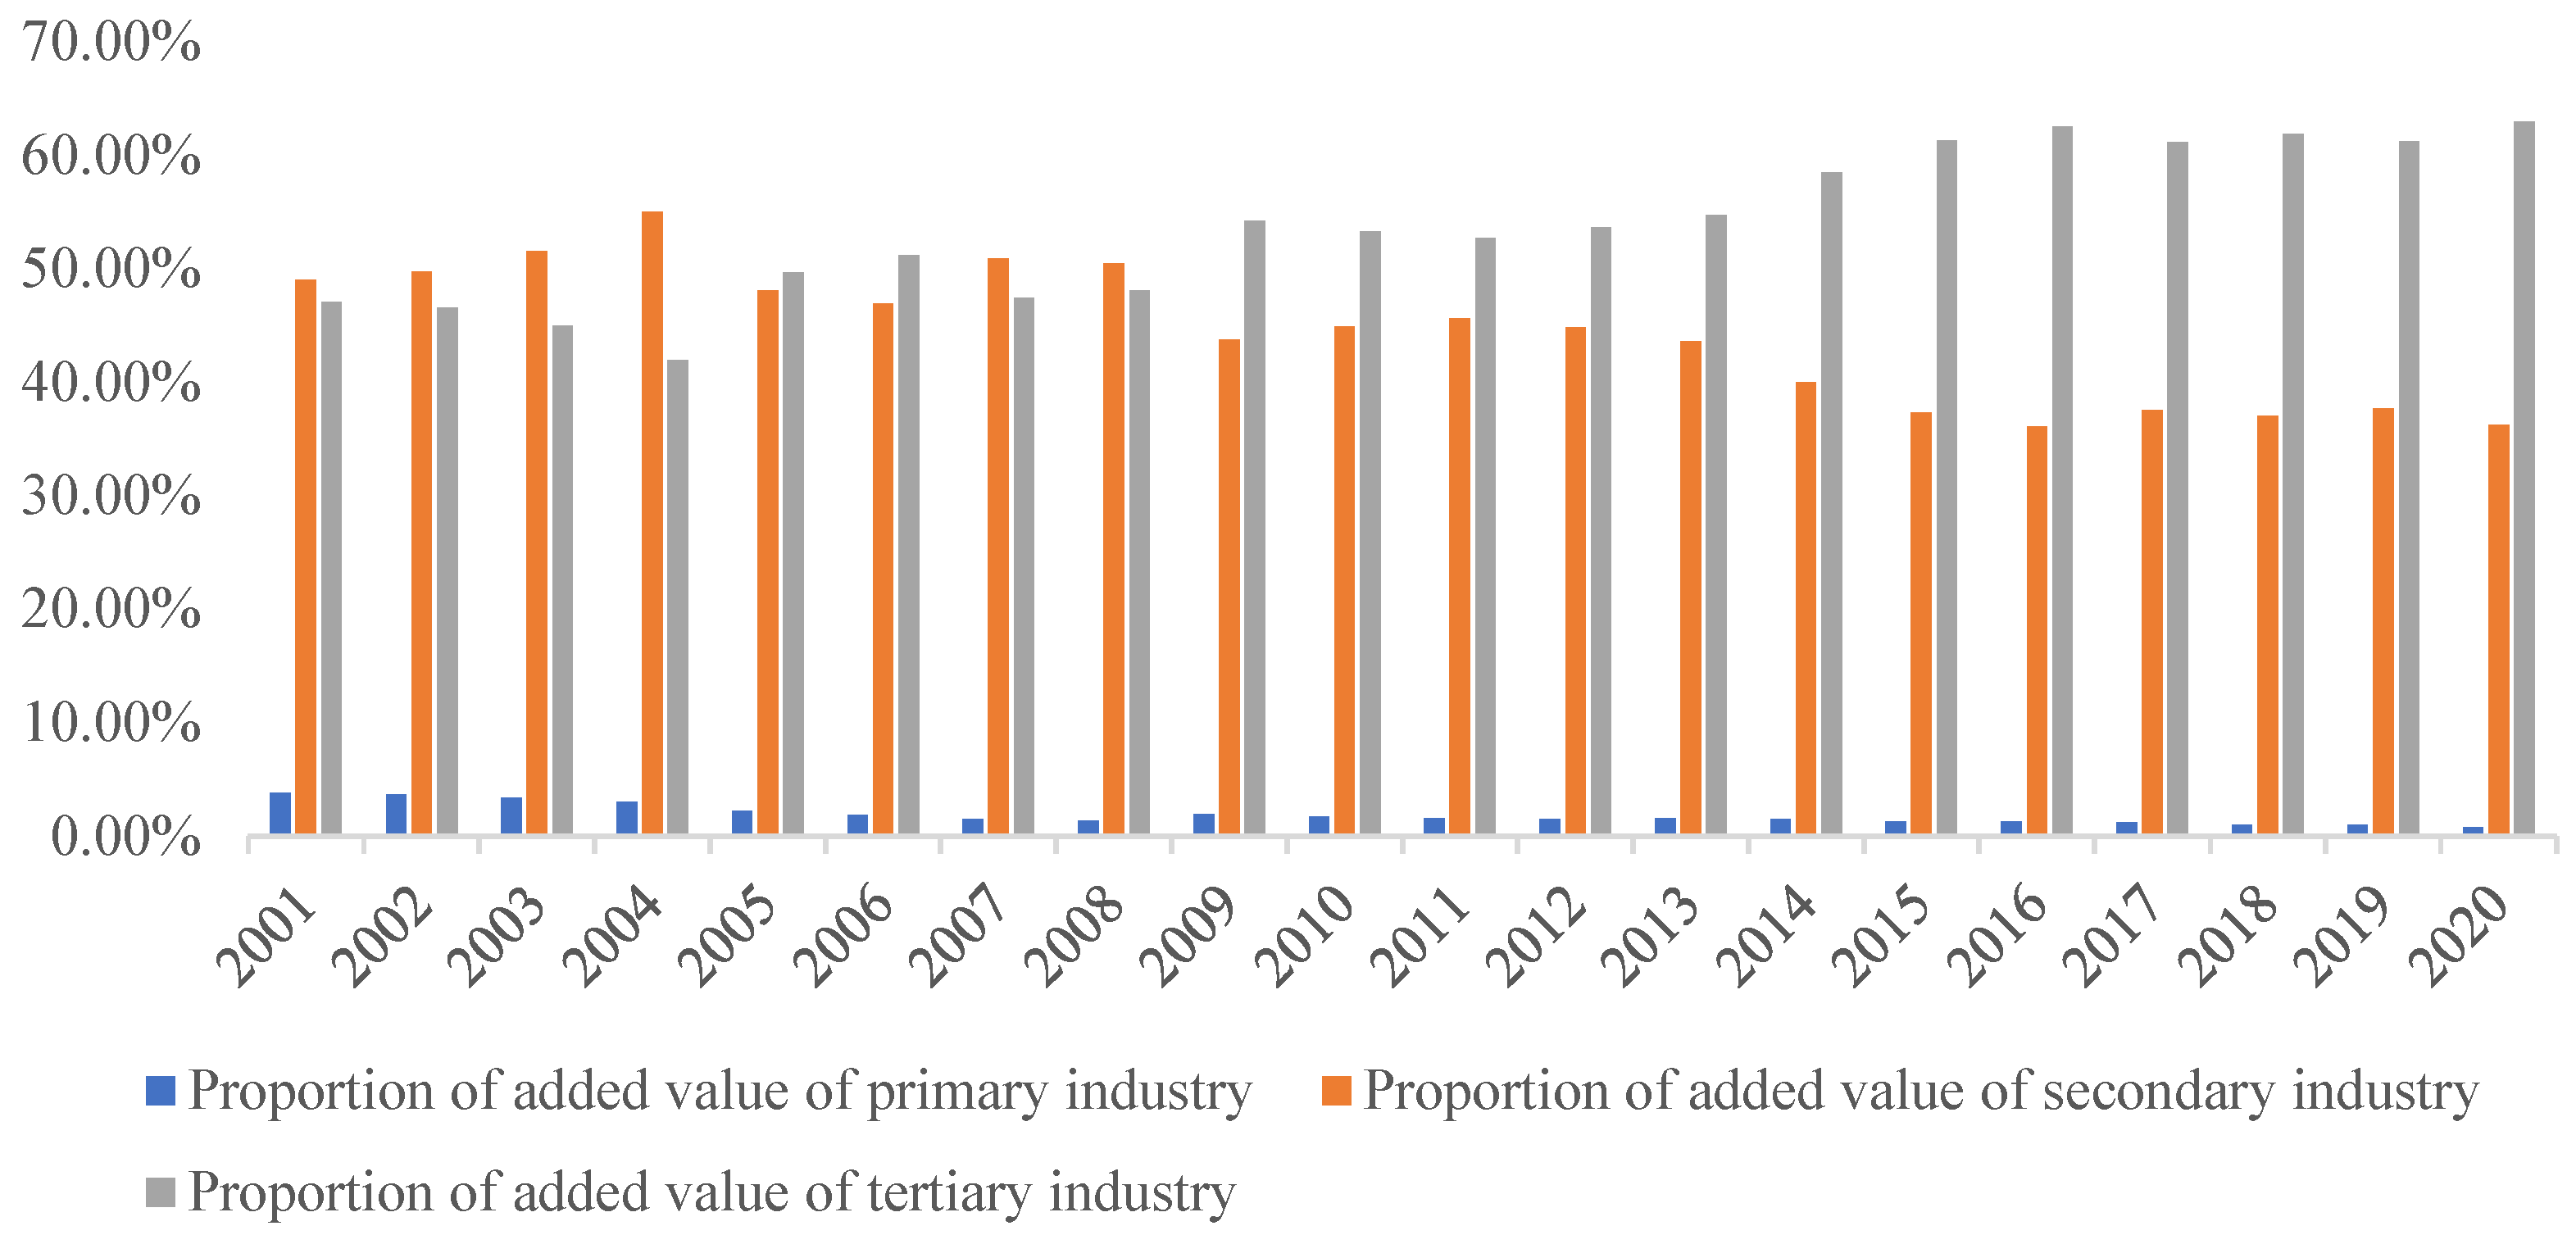
As for the evaluation indicators of the industrial structure system, the upgrading of the industrial structure aims to measure the degree of the evolution of the industrial structure from low-level to high-level. This paper constructs the following indicators based on the idea of Fu [
13]:
where
and
, respectively, represent the proportion of the secondary and tertiary industries in Taiyuan’s GDP in the
period.
The rationalisation of the industrial structure is to consider the coordination between different industries, the adaptability between input factors and output, and the adaptability of structural transformation ability. The existing studies mostly use the structural deviation degree improved by Gan et al. [
14] based on the Theil index. This method was also used in this paper. The specific calculation formula is:
where
indicates the proportion of the
industry in the region’s GDP during the
period,
refers to the gross domestic product of the
industry in Taiyuan during the
period, and
refers to the number of employees in the
industry in Taiyuan during the
period.
and
, respectively, represent the regional GDP (Gross domestic product) and total employment of Taiyuan in the
period. The closer
is to 0, indicating the closer the industrial structure is to the equilibrium state, the more reasonable the industrial structure is.
Referring to the index construction of the industrial rationalisation system by Liu [
15], the comprehensive utilisation rate of general industrial solid waste reflects the improvement of factor utilisation within the industry. The total investment in fixed assets is a strategic plan reflecting the industry’s long-term development. Therefore, this paper selected the above four indicators as the evaluation indicators of the industrial system.


