Article

Renewable Electricity Generation in Small Island Developing States: The Effect of Importing Ammonia

by
Victor N. Sagel
1,*,
Kevin H. R. Rouwenhorst
1,2,3,* and
Jimmy A. Faria
1,*
1
Catalytic Processes & Materials, MESA+ Institute for Nanotechnology, University of Twente, P.O. Box 217, 7500 AE Enschede, The Netherlands
2
Ammonia Energy Association, 77 Sands Street, 6th Floor, Brooklyn, NY 11201, USA
3
Proton Ventures, Karel Doormanweg 5, 3115 JD Schiedam, The Netherlands
*
Authors to whom correspondence should be addressed.
Energies 2022, 15(9), 3374; https://doi.org/10.3390/en15093374
Submission received: 30 March 2022 / Revised: 18 April 2022 / Accepted: 25 April 2022 / Published: 5 May 2022
(This article belongs to the Special Issue Ammonia as an Energy Carrier)

Abstract

:
Recently, we demonstrated for Curaçao that renewable electricity generation from wind combined with energy storage in the form of ammonia is competitive with imported fossil fuels, such as LNG, oil, and coal. In the current work, we have expanded the model by considering imported green ammonia as an alternative to local electricity generation and storage. Local production of ammonia as an energy storage medium was compared with imported ammonia to make up the electricity produced from onshore wind, for Curaçao and Fiji’s largest island Viti Levu. Curaçao and Viti Levu have been selected as two interesting extremes with favorable and non-favorable wind conditions, respectively. Assuming a market price of 500 USD/t NH3, it is found that importing ammonia is the most feasible solution for both islands, with a levelized cost of electricity (LCOE) of 0.11 USD/kWh for Curaçao and 0.37 USD/kWh for Viti Levu. This compares to 0.12 USD/kWh for Curaçao; however, for Viti Levu, this value increases to 1.10 USD/kWh for a completely islanded system based on onshore wind and imported ammonia. These islands represent two extreme cases in terms of wind load factor and load consistency, as Curaçao has a high and consistent wind load factor when compared to Viti Levu. Thus, the conclusions obtained for these locations are expected to be applicable for other small island developing states.

1. Introduction

Resilient energy resources and infrastructures are key for small islands developing states (SIDS) as climate change effects (e.g., tropical storms, hurricanes, sea-level rise) are bleaker and more frequent in these regions [1,2,3,4]. These intrinsic vulnerabilities of SIDS have become even more evident with the on-set of the COVID-19 pandemic that has led to severe economic contraction in these islands [5]. In this context, deployment of renewables can improve energy security in the long term. The fluctuating nature of renewables, however, complicates facile integration in the electricity grid for on-demand electricity generation, which negatively impacts the resilience of the energy sector [1,6]. To unlock the true potential of renewables, it is relevant to develop cost-effective energy storage systems that can act as buffers for the short- and long-term fluctuations in electricity generation. Essentially, to tackle this, sufficient energy storage is required for both hourly and seasonal fluctuations. For short-term small-scale storage, the use of conventional batteries is a suitable option. However, for long-term large-scale storage, batteries fall out of favor, and hydrogen carriers become the better option, as illustrated in Figure 1.
Ammonia is considered as an option for seasonal energy storage in islanded renewable energy systems [9,10,11,12,13], due to its economical and proven track record for safe storage and transportation. Furthermore, ammonia can be synthesized from abundant nitrogen in air and hydrogen generated via water electrolysis using renewables. Ammonia is easier to store as compared to hydrogen. Furthermore, ammonia does not require a circular CO2 source.
Other options instead of ammonia are methanol and methane. Both options are interesting and could be competitive in terms of storage conditions [14]. However, both options depend on a circular CO2 source. Direct air capture (DAC) is an experimental technology that is not cost-competitive with nitrogen purification from air, making energy storage in the form of green methane or methanol substantially more expensive than in the form of green ammonia. It should be noted, however, that handling of ammonia has safety risks. Fortunately, ammonia-related accidents are scarce when handled by trained personnel. Furthermore, storage, usage, and transportation of ammonia on an industrial scale is currently possible on a large scale as this chemical is essential in the production of synthetic fertilizers [14].
Recently, we demonstrated for the island of Curaçao that renewable electricity generation from wind combined with energy storage in the form of ammonia and batteries is competitive with imported fossil fuels, such as LNG, oil, and coal [7]. In this island, the months with the highest demand of electricity (holiday season) coincided with the months with the lowest wind electricity generation. By deploying the so-called power-to-ammonia-to-power or P2A2P process, the ammonia generated in the months with the strongest winds was employed to satisfy the demand in the consumption peak of the year, reducing the levelized cost of electricity (LCOE). One can imagine that an optimum in costs can be achieved in cases where green ammonia can be imported at competitive prices. In this scenario, low ammonia import costs can potentially outweigh the benefits of local production as the capital costs of the P2A2P can be reduced. In this line, the present contribution aims at assessing the impact of imported ammonia in the LCOE from renewables in SIDS. Three cases are explored in this study, including (1) full ammonia synthesis on-site, (2) full green ammonia import, and (3) a balance between the two options. Such an optimization between locally produced and imported renewable energy vectors has not been published before for SIDS.
Two islands with similar energy demands were considered hereafter, namely Viti Levu in Fiji (Pacific region), and Curaçao (Caribbean region). Viti Levu has a low load factor for onshore wind with high fluctuations, while Curaçao has consistent wind with a high net capacity factor [15]. These two islands serve as extreme cases to assess the impact of green ammonia price imports. The island of Trinidad & Tobago and Brazil were chosen as the primary suppliers of green ammonia for the island of Curaçao thanks to their proximity, potentially reducing transportation costs of ammonia, and the existing infrastructure for large-scale production and storage of ammonia in these countries [16,17]. Following the same rationale, Australia and Chile were selected as the green ammonia suppliers for the island of Viti Levu in Fiji [18,19]. An additional reason why importing ammonia could be interesting for Curaçao and Viti Levu, is the fact that both islands already have ports in place [20,21]. As a result, only ammonia storage terminals are required. A market price of 500 USD/t NH3 is assumed for green ammonia (see Supplementary Materials).
Fiji has a total electricity generation capacity of 362 MW as of 2020, of which 59% is renewable, including 38% hydropower, 15% bioenergy, 3% wind, and 3% solar [22,23]. Fiji has set a target for 100% renewable electricity generation by 2030 [24]. Viti Levu, the largest islands of Fiji, represents about 90% of the total electricity generation capacity of Fiji [25]. Currently, the import of fossil fuels represents 25–35% of total merchandise imports [25], which has led to electricity tariffs of 0.16–0.19 USD/kWh from 2010 until 2019 [24,26].
Curaçao has a total electricity generation capacity of 207 MW as of 2020, of which 47 MW is generated by wind and 18 MW from solar PV [27]. About 25% of the electricity was produced with renewables in 2020 [27]. Curaçao has set a target for 50% renewable electricity generation by 2035 [27]. Currently, the majority of electricity is generated using imported petroleum [27]. Surprisingly, in this location, the electricity tariffs were 0.23–0.36 USD/kWh from 2015 until 2020 [27,28]. In this case-study, the costs of energy generation using local wind energy resources are benchmarked with the costs of ammonia import for both islands. While it is true that the costs of onshore wind electricity for Fiji are expected to be higher than those for Curaçao, due to the differences in consistency and capacity factors, the purpose of the present study is to illustrate how inexpensive green ammonia can be leveraged to facilitate the energy transition in locations where the lack of renewable energy resources hinders decarbonization. Here, one can anticipate that a trade-off between ammonia imports and local production will be necessary for locations with neighboring countries with excess capacity for green ammonia generation. Furthermore, it is assumed that renewable electricity is exclusively produced from onshore wind. This is not entirely realistic, as for example, Fiji already has substantial hydropower and biomass capacity [29].
The manuscript has been subdivided in several sections. Section 2 describes the methodology, including the modelling approach and the arguments for process selections. Section 3 describes the results. The results show technical results into energy patterns, dimensions, and flowrates, as well as levelized costs of electricity. These costs are subsequently compared to energy generation alternatives. Then, a sensitivity analysis is implemented. Section 4 discusses the results, and the key factors influencing the final results. Section 5 describes the conclusions following from this manuscript, as well as recommendations for further research.

2. Methodology

The levelized cost of electricity (LCOE) from local wind energy has been estimated using an iterative algorithm previously reported by our group [7]. First, an order of magnitude calculation was performed to estimate a realistic range of equipment sizes to support a full power-to-ammonia-to-power (P2A2P) grid, with the goal of finding relevant boundary conditions for equipment size using equipment property correlation methods. Then, a P2A2P process was modelled to find the roundtrip efficiency (RTE). Subsequently, the annual and daily energy demand patterns were calculated, as well as annual and daily net capacity factor patterns for wind turbines.
In this study, wind turbines have been selected as the benchmark technology as the renewable energy generation source. Curaçao has one of the strongest and most consistent wind patterns in the world [30]. Furthermore, an analysis for the close SIDS island Barbados suggests that wind energy is deemed to be the cheapest option for renewable energy [31]. Wind energy is therefore selected as the benchmark technology for energy generation in this model. Wind energy is utilized for Viti Levu as well for a consistent comparison. For the net capacity patterns, the Vestas V82 1.65 MW wind turbine [32] was found to be suitable and its wind speed versus energy output patterns were utilized. The respective wind turbine was selected for several reasons including (1) a low cut-in wind speed required to start energy generation, (2) a relatively favorable wind-energy curve with high average capacities, mainly benefiting the Viti Levu case, as Viti Levu was found to have low wind speeds, and (3) these wind turbines are relatively short compared to modern wind turbines, which is important as large wind turbines can result in significant and critical transport problems on SIDS [31]. The net capacity patterns for the respective wind turbine were modeled using hourly and monthly wind data, from the ERA5 satellite database over the years 2007–2020 [15]. With the use of the calculated energy efficiencies, demand patterns, and net capacity factors, an iterative process was utilized to determine the size of the wind farm and the P2A2P system, with respect to RTE, safety factors, and fraction of ammonia from imports and on-site production.
In the model, wind turbines were used to directly power the electricity grid. To stabilize the energy output in the short term, battery storage was employed using battolysers. These units are designed to stabilize the energy output of renewables. This was performed by initially storing excess energy in Ni-Fe batteries, and subsequently performing electrolysis when the batteries were fully charged [33]. For seasonal fluctuations, energy from ammonia was used. Ammonia was synthesized using absorption-enhanced Haber–Bosch (AE-HB), which allows flexible ammonia production following renewable electricity patterns [7].
The flowsheet behind the first step in the modelling strategy is shown in Figure 2. Here, pure water was required for the electrolysis step. For this reason, seawater desalination was performed to obtain pure water in SIDS. To prevent the negative impact of brine disposal on marine life, Zero Liquid Discharge (ZLD) was performed using High Rejection Reverse Osmosis (HRRO) and Low Rejection Reverse Osmosis (LRRO), as described in [34] in combination with mechanical vapor compression (MVC). MVC was used due to its high energy efficiency compared to alternatives evaluated in reference [35]. Subsequently, battolysers were used to either store, for the short term, electricity, or split water into hydrogen and oxygen. The hydrogen generated in the previous step was reacted with nitrogen to produce ammonia thermo-catalytically. This reaction was conducted using absorption-enhanced Haber–Bosch, which in contrast to conventional high-pressure Haber–Bosch process, is highly resilient towards dynamic fluctuations in operational load [7,9,36]. Ammonia was afterwards stored in large-scale storage tanks at −33 °C and 1.1–1.2 bar as this is the most common and cost-effective storage method for large-scale ammonia storage [37]. The alternatives to storage tanks are high-pressure atmospheric temperature liquid ammonia storage, which is recommended for smaller-scale storage. Storage of ammonia in salts is recommended when increased safety is prioritized [7,9,38].
During seasonal energy shortages, the stored ammonia can be used to produce electricity. Patel and Farooque [39] have previously illustrated this concept at the same order of magnitude as the one herein used. The conversion of ammonia back to electricity can be performed using either direct fuel cells or fuel cells with thermal energy recovery. From these options, the preferred alternative is direct ammonia fuel cell using Solid Oxide Fuel Cells (SOFC) [40] without thermal energy recovery, as the relatively poor electrical efficiency gain of 2% using a recovery system does not justify the CapEx increase when using a thermal energy recovery system [41]. Furthermore, the thermal energy recovery system would substantially reduce the flexibility of the SOFCS. An efficiency of 55%LHV is assumed in this manuscript [9]. The SOFC-Hs are direct-use; this means that ammonia will be fed directly to the fuel cells. The electrocatalyst in the SOFC is Ni-based, which is able to dissociate NH3 at the elevated temperatures inside the SOFC [42]. This means that no pre-dissociation is required. This is an attractive proposition as external ammonia cracking requires additional energy input that can result in heat losses [9], which can be significant at relatively small-scale processes.
The round-trip efficiency (RTE) of P2A2P was calculated to be 24%LHV, and leads to a significant wind turbine overcapacity, which clearly increases the CapEx and thus the final levelized cost of electricity. Here, it becomes clear that using imported ammonia from a low-carbon ammonia plant is an attractive proposition, particularly when there is insufficient renewable electricity. The scale of the Haber–Bosch can be decreased or even completely removed from the planning depending on the expected ammonia costs and, finally, the smaller battery storage capacity will lead to less severe fluctuations during the daily operation. In this approach, the battolysers can be replaced by conventional Ni-Fe batteries, as electrolysis is not required. Here, however, the carbon-neutrality of the ammonia must be ensured. Thus, so-called green ammonia (i.e., ammonia generated from renewables) must be readily available in the region. Furthermore, since the wind farm will be smaller in this case, the ammonia-fueled SOFC-H will have to operate more frequently to prevent energy shortages, which could affect the stability of the stacks. In this sense, between the two extreme cases, it is possible to find an optimum between import and production on-site. The calculation methods that are utilized in this work are summarized in Table 1.
The specific energy consumption (SEC) of the ammonia synthesis loop based on AE-HB was 12.0 kWh/kg NH3 (see Table 2). For comparison, modern natural gas- and coal-based ammonia plants have an energy consumption of 7.8 and 10.6 kWh/kg NH3, respectively [43,44,45]. As mentioned before, when this process was combined with SOFC-H with an electrical efficiency of 55%LVH (LHV of 5.17 kWh/kg of NH3), the round-trip efficiency (RTE) of P2A2P was 24%. This value is comparable to the well-to-power (W2W) efficiency of fossil-based technologies of c.a. 16–20% [46].

3. Results

Hereafter, the analysis of the resulting electricity prices is presented for each location. The results show that for Viti Levu, importing ammonia is significantly cheaper compared to ammonia production on-site. For Curaçao, import is cheaper compared to on-site production in the main assumed scenario. The sensitivity analysis, however, shows that on-site production could be more cost-efficient for Curaçao in scenarios where the costs of imported ammonia are higher than those projected in the state-of-art.

3.1. Curaçao

First, the case of Curaçao was assessed to determine the wind farm size. From the data presented in [15], the hourly average wind speed and monthly average wind speed were calculated (see Figure 3a,b). The wind distribution, together with the wind speed versus capacity factor curve, is shown in Figure 3c.
Figure 3a illustrates that at night, wind speeds are higher than during the day. Furthermore, a drop in wind speed is illustrated at 9 a.m. [15]. The results of Figure 3b,c are in close agreement with empiric data from wind turbines on Curaçao, as illustrated in reference [30]. A net capacity factor of 0.67 is found, which is very high compared to wind turbines in different locations, including SIDS [30]. A net capacity factor of 0.67 is found, which is very high compared to wind turbines in different locations, including SIDS [30].
To estimate how much energy could be used for the grid and the seasonal storage, a calculation over the energy demand was performed (Figure 4a). This approximates the amount of energy lost in the battolysers in a day using the average hourly wind pattern, average demand pattern, and an 85% RTE [33], as a percentage of total generation. From this, the amount of energy that is not available for ammonia production or direct use was calculated. Figure 4b shows the effective net capacity factor that was corrected for battolyser RTE losses. Figure 4a illustrates that at night, more energy is generated than consumed, whereas during the day, the opposite holds true. This is because energy generation and demand are anticyclic. Figure 4b illustrates the net capacity factor of wind turbines on Curaçao, corrected for short-term storage losses.
From this data, it was possible to calculate annual generation and demand curves (Figure 5a). The distribution of energy flows going towards direct use, short-term storage, and seasonal storage, is illustrated in Figure 5b. Here, one can note that from August to November, the long-term storage is negligible. This is due to the large electricity demand and insufficient power generation in this section of the year.
For Curaçao, a wind farm size of 209 MW was calculated when making all ammonia on-site; this is comparable to the 207 MW of generation capacity in place as of 2020 [27]. The curves of average and maximum Haber–Bosch capacity versus import percentage of ammonia are shown in Figure 6. The maximum Haber–Bosch capacity was taken as the capacity required in the month with the largest energy excess, at wind speeds 25% higher than average for the given month, as a safety factor.
When full import is in place, the power-to-ammonia plant will not be in place anymore. Therefore, the battolysers can be switched with regular short-term storage batteries. Future projected costs of battolysers are 425 USD/kW [8,9,51]. The capacity of battolysers is designed to store 4 h of energy maximum charging capacity [52]. At a Lang factor of 4.06 [7], total installed costs per kWh are 430 USD/kWh. Based upon real projects, a near-term projection for installed costs for batteries is 340 ± 60 USD/kWh in the UK [53]. Long-term projections for installed costs are estimated to be 175 ± 25 USD/kWh in 2027–2040 [53]. Based on near- and long- term projections, and the location, installed costs of 250 USD/kWh were used in this model as a price estimation for conventional energy storage using batteries. Figure 7 illustrates the LCOE in USD/kWh assuming imported green ammonia costs at 500 USD/ton. Here, one can immediately recognize that increasing the ammonia imports from 0–100% can lead to a reduction of 18% of the LCOE to 0.110 USD/kWh. This result is rather surprising considering that the utilization factors for the wind farm in Curaçao is among the largest in the world [54]. These results indicate that even in locations with very favorable weather conditions, importing ammonia can still decrease the levelized costs of electricity. This result could thus be used to hint to other locations about the most cost-efficient configuration of an ammonia-based energy storage system.
The P2A2P system was compared with fossil fuels as illustrated in Figure 8. Figure 8 shows that P2A2P is competitive with fossil fuels at a levelized cost of 0.11 USD/kWh, when green ammonia is fully imported. When no ammonia is imported, levelized costs of 0.12 USD/kWh were found. Therefore, a P2A2P system in which ammonia will be imported rather than produced on-site can lead to competitive costs and renewable energy.

3.2. Fiji-Viti Levu

For Fiji, the same steps have been taken. Here, Figure 9a shows the hourly and monthly wind curves, whereas Figure 9b presents the wind distribution and the wind turbine wind versus capacity factor curve. From these figures, it becomes clear that the wind speed and net capacity factor of Viti Levu is significantly lower than that of Curaçao. This is in line with the resulting wind speed distribution (Figure 9c) in which the relative occurrence of winds with high speeds (e.g., +10 m/s) is essentially zero. Figure 9a illustrates that wind speeds are higher during the day than at night, which is beneficial as energy consumption during the day is higher than at night. Figure 9b,c, however, show that there is a relatively inconsistent and low wind speed throughout the year, leading to a low net capacity factor, and high required energy storage.
To obtain an effective net capacity factor, the short-term battery RTE losses were calculated as illustrated in Figure 10a. From this, the corrected net capacity factor per month is given in Figure 10b. Figure 10a illustrates a surplus of energy during the day. Energy generation at night and during the winter months is very low, as the cut-in wind speed of approximately 4 m/s as illustrated in Figure 9c, hinders energy generation at low wind speeds.
The low-capacity factor for wind on Viti Levu results in a relatively large storage requirement, and therefore a significantly oversized wind farm. This means that P2A2P without any import is likely not economically justified. Therefore, it is expected that Viti Levu could significantly reduce its costs by importing ammonia. Figure 11 shows how the on-site ammonia production capacity can be reduced by importing green ammonia.
Figure 12 illustrates the LCOE in USD/kWh assuming green ammonia total costs of 500 USD/ton. It becomes clear that importing ammonia is significantly cheaper than producing ammonia on-site. At 500 USD/ton, an LCOE of 0.37 USD/kWh was found when fully importing ammonia. Note that the cost reduction upon importing ammonia is more significant for Viti Levu than for Curaçao, which can be understood from the low wind capacity factor for Viti Levu.
Figure 13 shows the comparison between P2A2P and the most relevant alternatives for importing energy, namely LPG and diesel. It shows that for Viti Levu, ammonia is more expensive than the other alternatives. When utilizing green ammonia imports, LCOE of 0.37 USD/kWh are found which is higher than at the alternatives; it is therefore not expected that P2A2P will be implemented in the future in this location. Without import, the levelized costs rise to 1.10 USD/kWh. Wind energy combined with imported ammonia is only competitive at extremely high fossil fuel prices. It is expected that other options, such as biofuels or hydropower or solar are more relevant in a decarbonized energy system for Viti Levu [29].

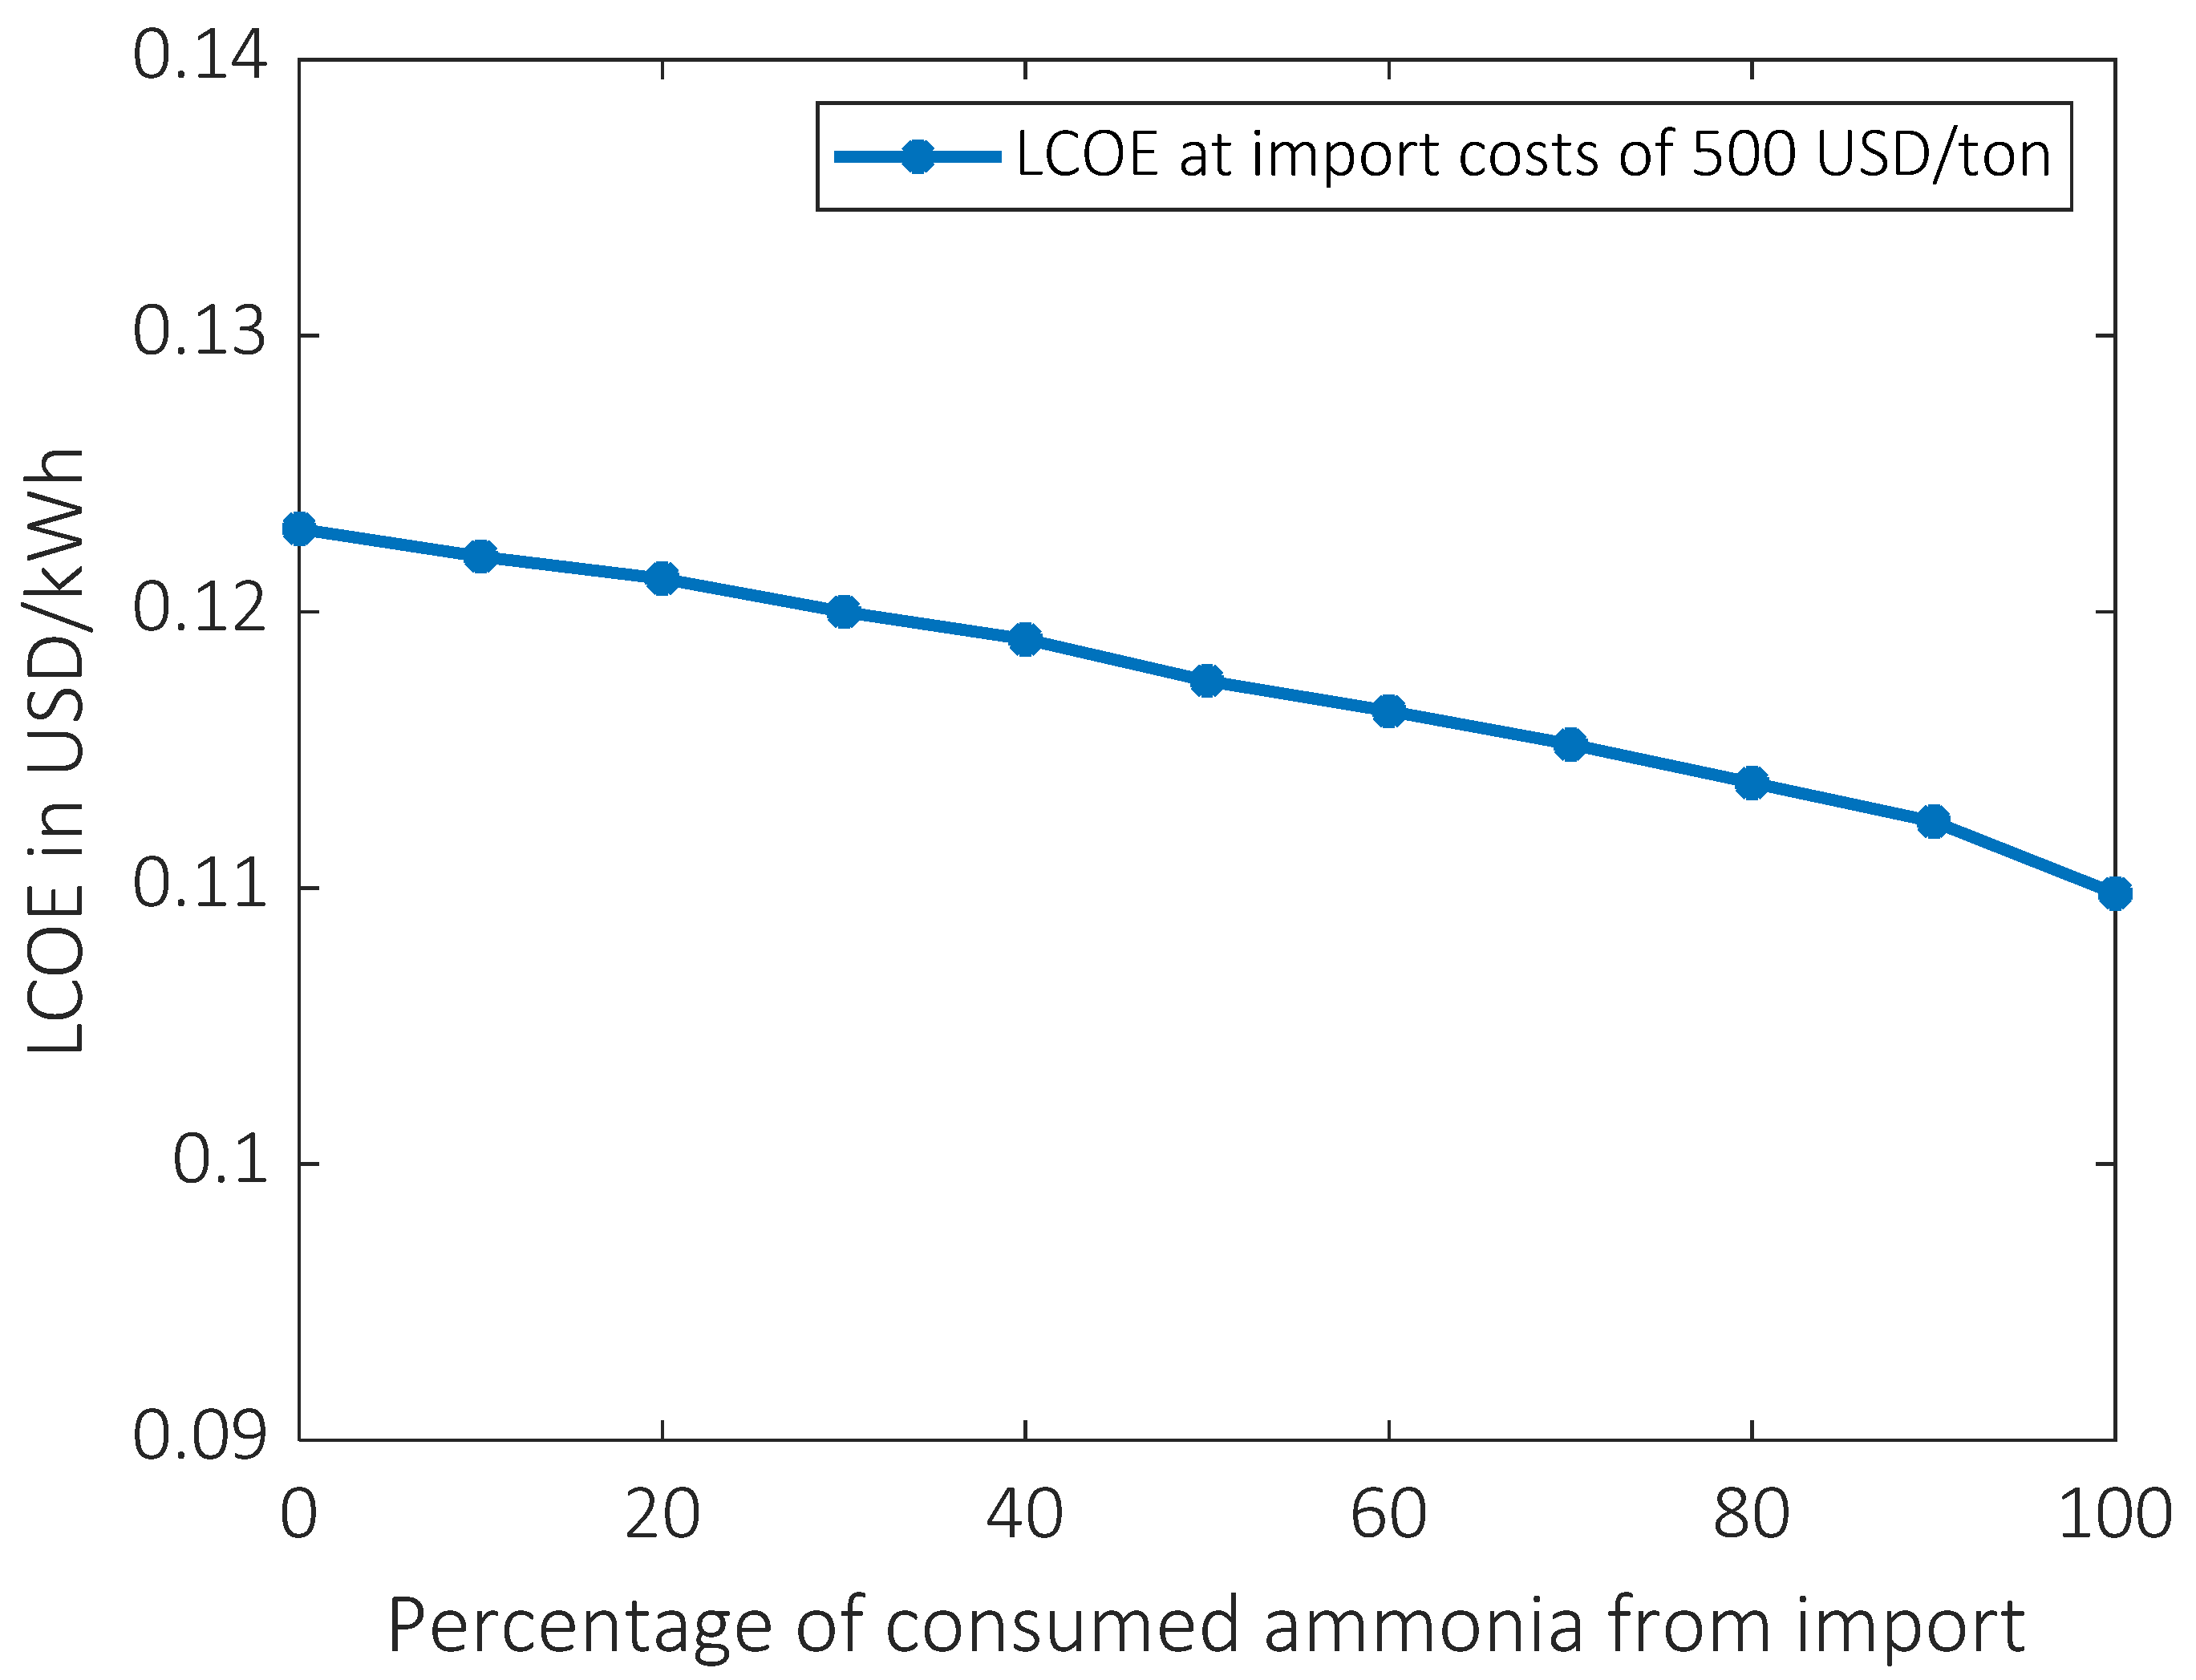
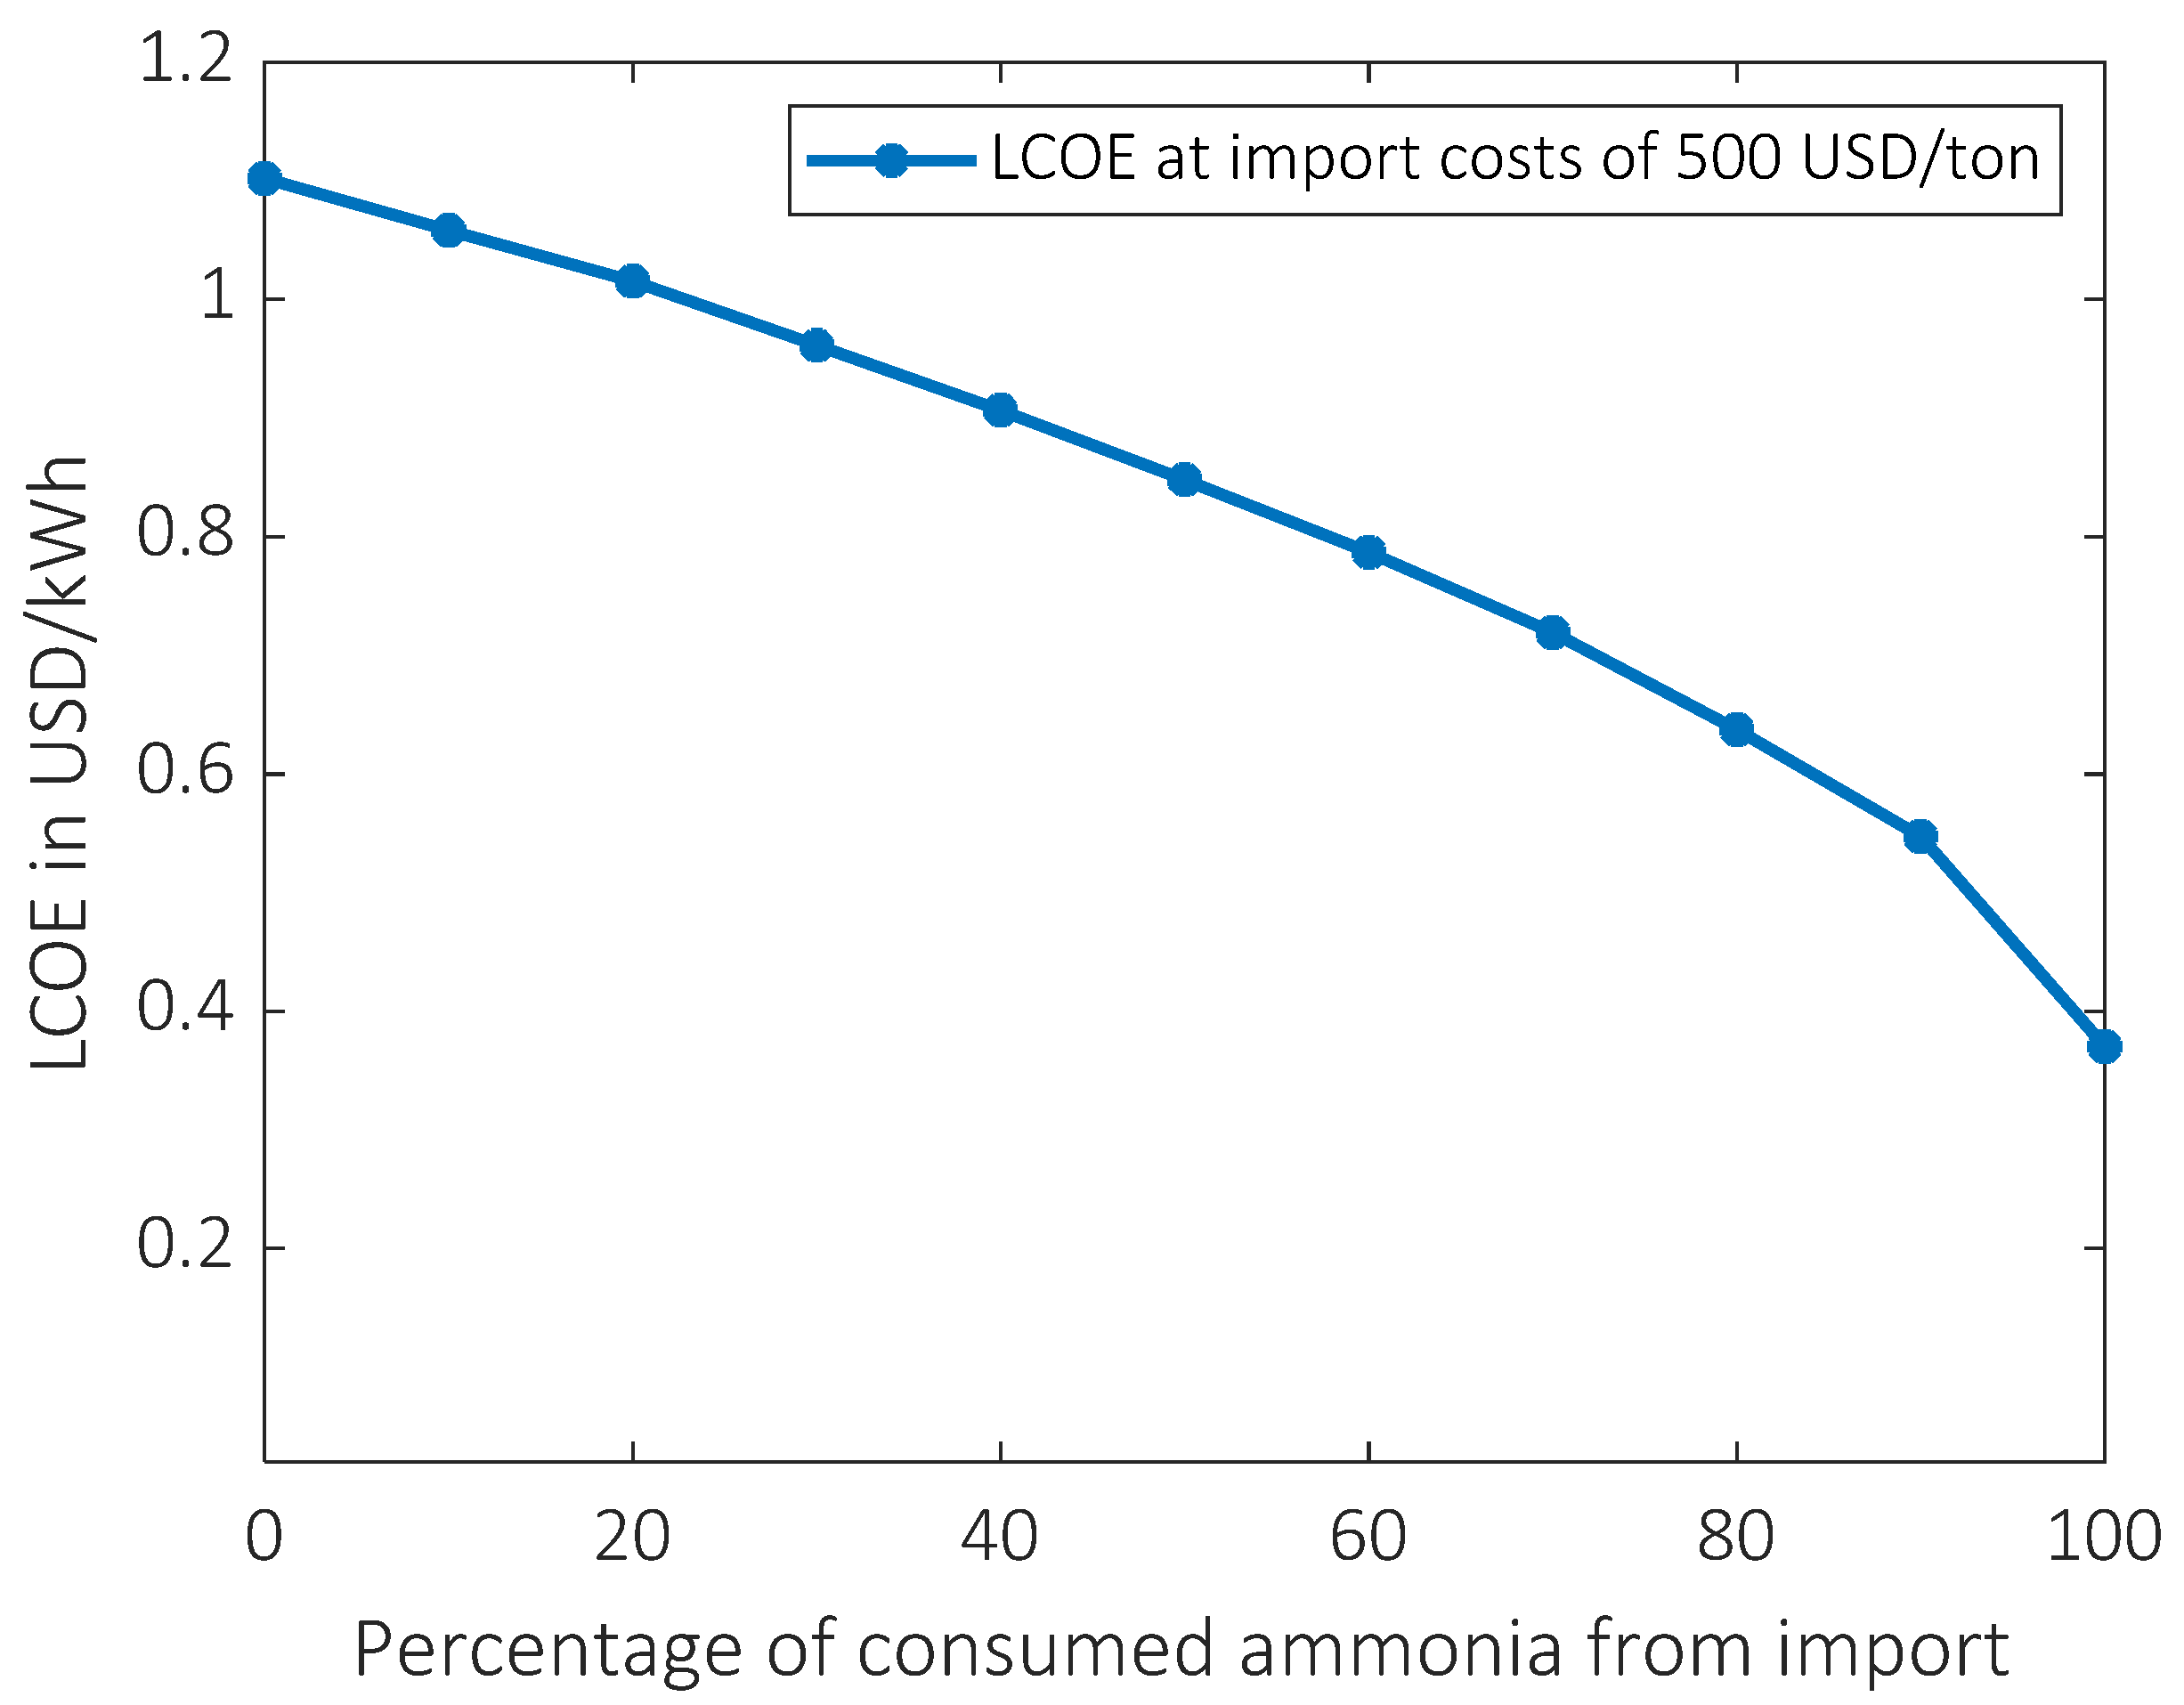
3.3. Sensitivity Analysis

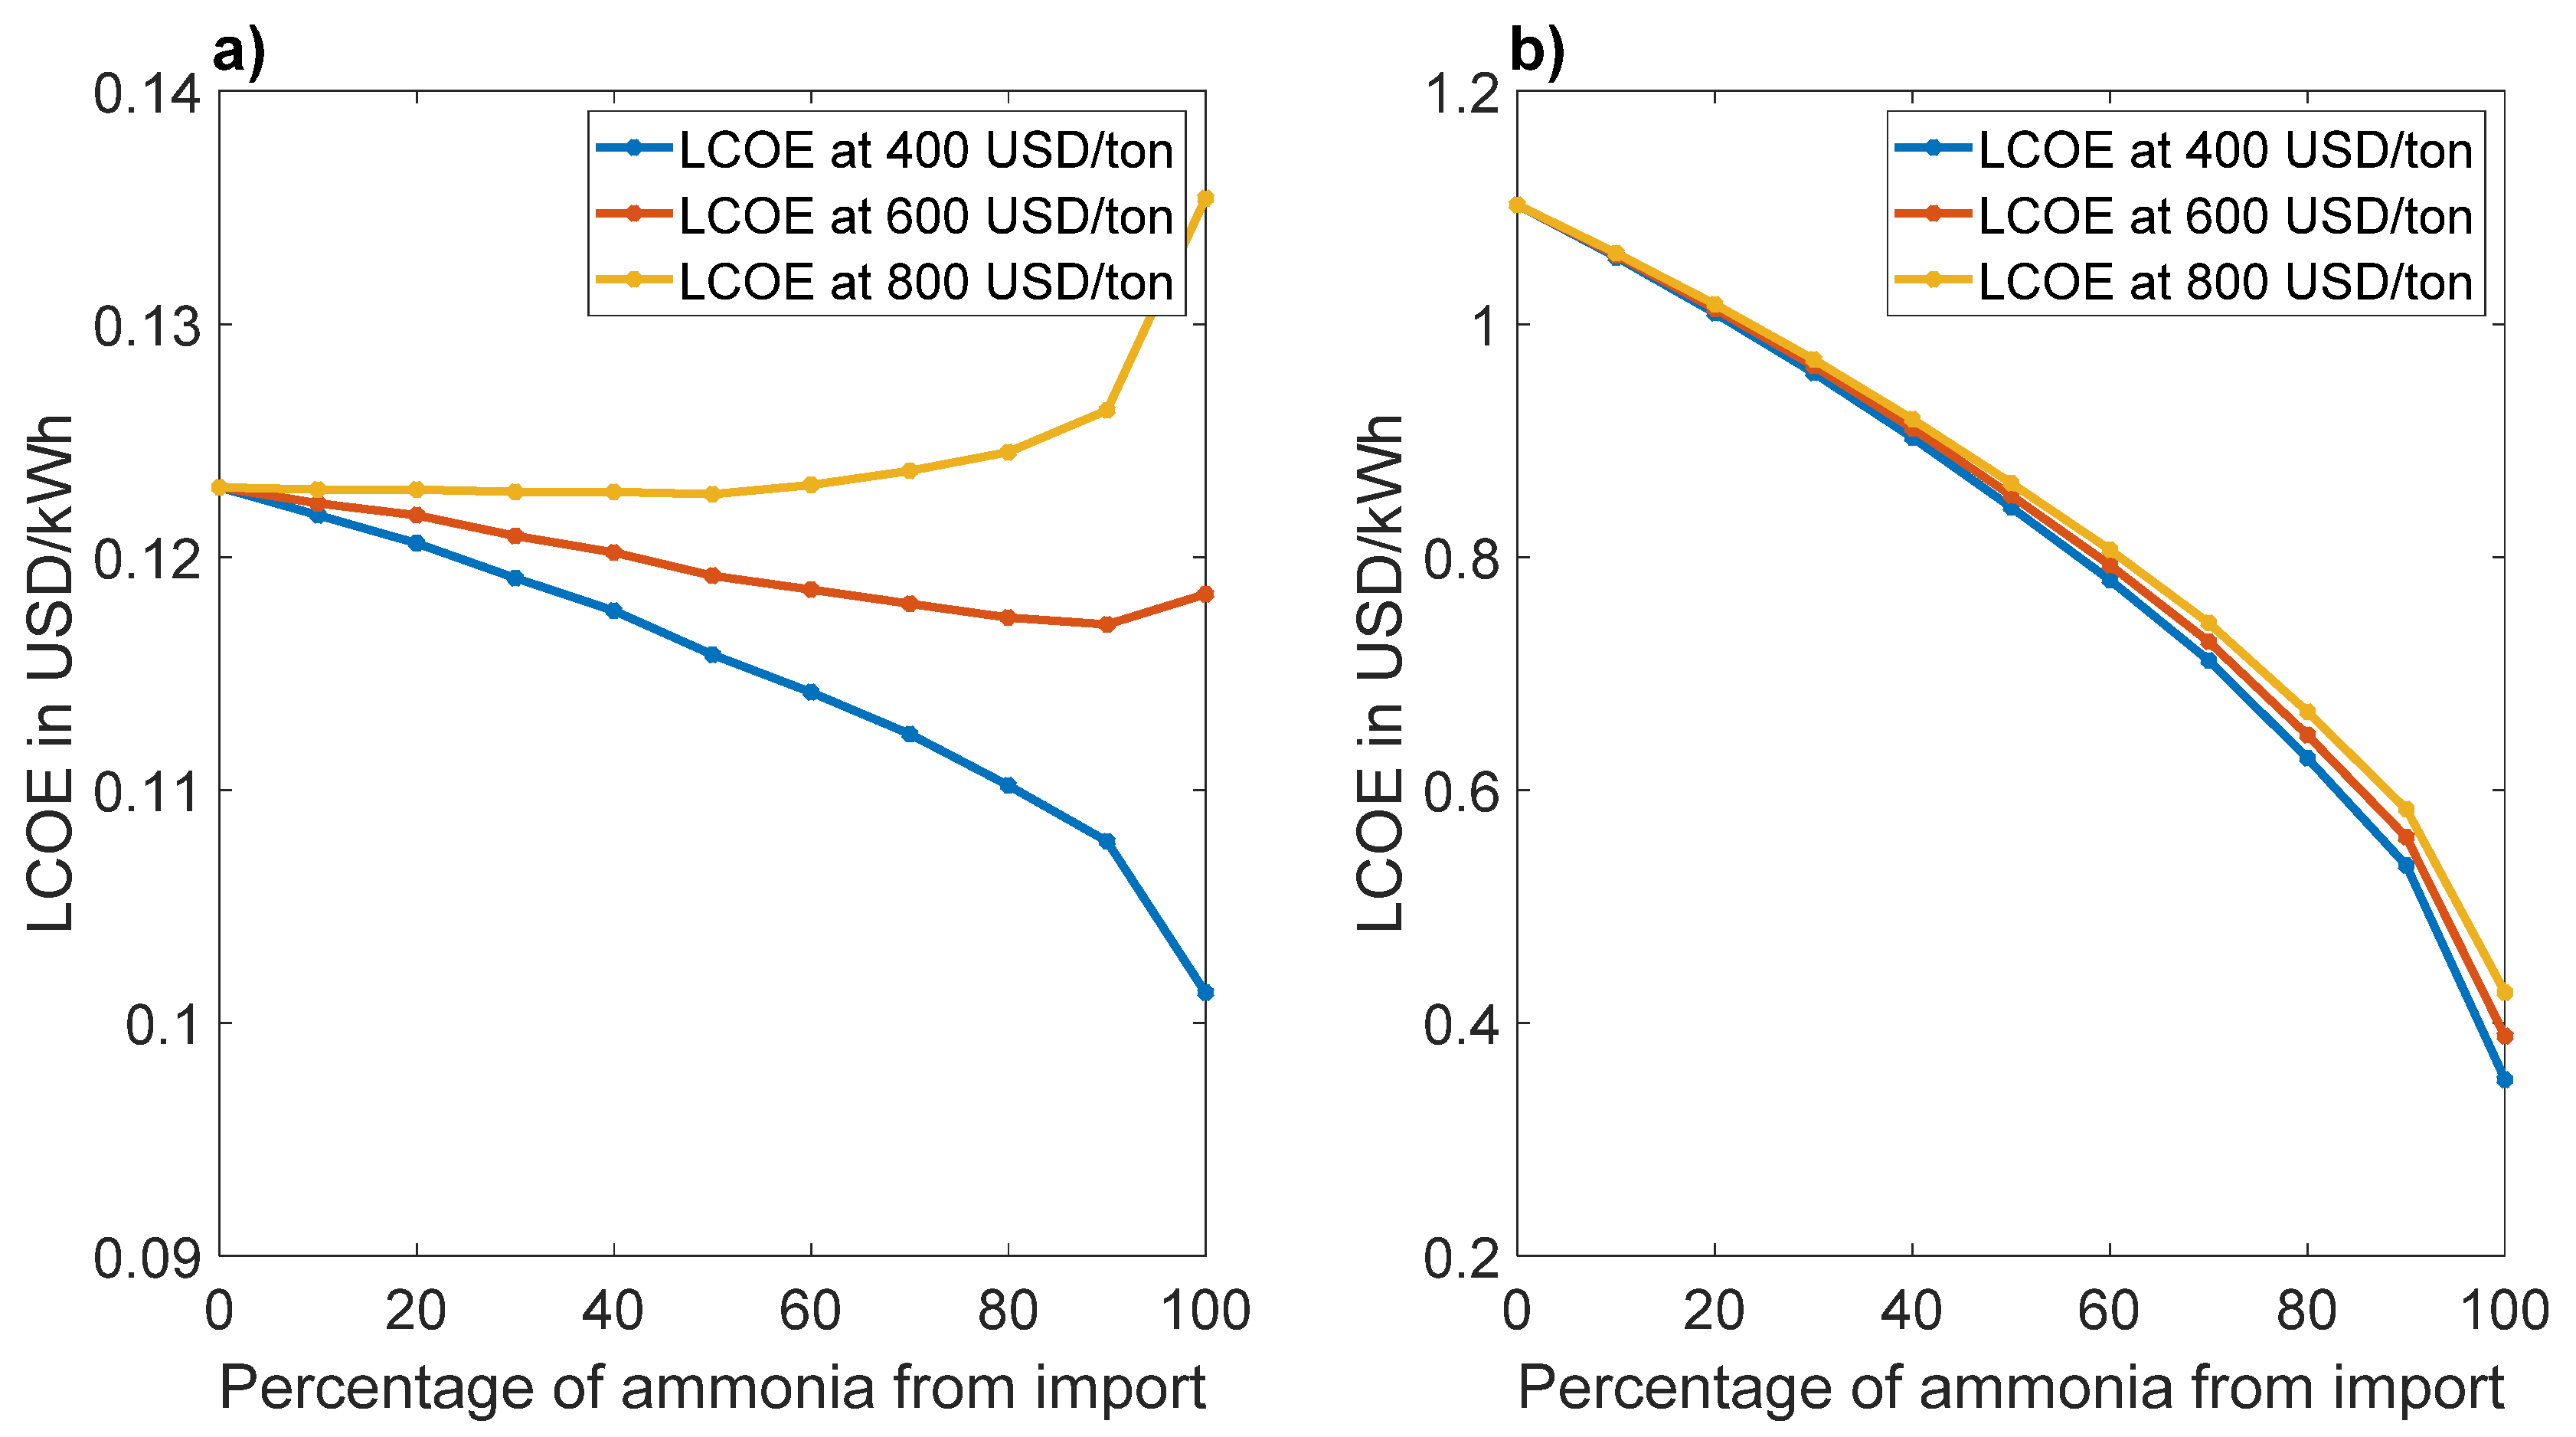
Effect of Ammonia Price

The prices of green ammonia have been estimated based on the costs related to purchasing, transporting, and storing. However, the future market price of green ammonia remains uncertain with a considerably large costs range projection [55]. Therefore, several scenarios were calculated, with ammonia import costs of 400–800 USD/ton; the results are shown in Figure 14 for Curaçao and Viti Levu, respectively. For Curaçao, it is shown that at ammonia import costs of 400 USD/ton, it is preferred to import all ammonia. This means that the grid will consist of wind turbines, a short-term storage Ni-Fe battery, SOFC-Hs, and imported green ammonia including storage. For green ammonia costs of >800 USD/ton, it is preferred to produce all ammonia on-site, whereas at prices of 600 USD/ton, a balance between imported ammonia and produced ammonia could be made. Notably, at 600 USD/ton, it could be possible that the slight increase in LCOE to use 100% import is justified by the implementation of a simpler system. However, this consideration is out of the scope of the presented model. For Viti Levu, it shows that regardless of the ammonia import price within the realistic range, importing ammonia is significantly cheaper than producing ammonia on-site. When ammonia import costs of 400 USD/ton are achieved, the LCOE can decrease to 0.35 USD/kWh. At 600 USD/ton and 800 USD/ton, the LCOE is calculated to be 0.39 and 0.42 USD/kWh, respectively. Sensitivity analyses of the wind turbine cost and lifetime of the SOFC can be found in the Supplementary Materials.
Sensitivity analyses on the wind turbine cost and the lifetime of the SOFC can be found in the supporting information.

4. Discussion

Importing ammonia has a lower cost than operating in an islanded system. The main reason for this is that the imported ammonia is produced at a lower cost than the locally produced ammonia on the islands. There are several key factors that could reduce green ammonia costs to further support the economic feasibility of ammonia as an energy vector in the aforementioned set-up utilizing imported green ammonia. Some of these key factors that affect this are listed below:
  • Plant size. GW-scale green ammonia plants have been announced [56]. Furthermore, partial decarbonization of existing renewable ammonia plants decrease the cost of renewable ammonia.
  • Lower cost of electricity generation. The electricity cost of complementary offshore wind and solar PV is below 0.02 USD/kWh in some locations [57]. Levelized cost of onshore wind 0.05 USD/kWh on Curaçao and 0.46 USD/kWh on Viti Levu were found in this work.
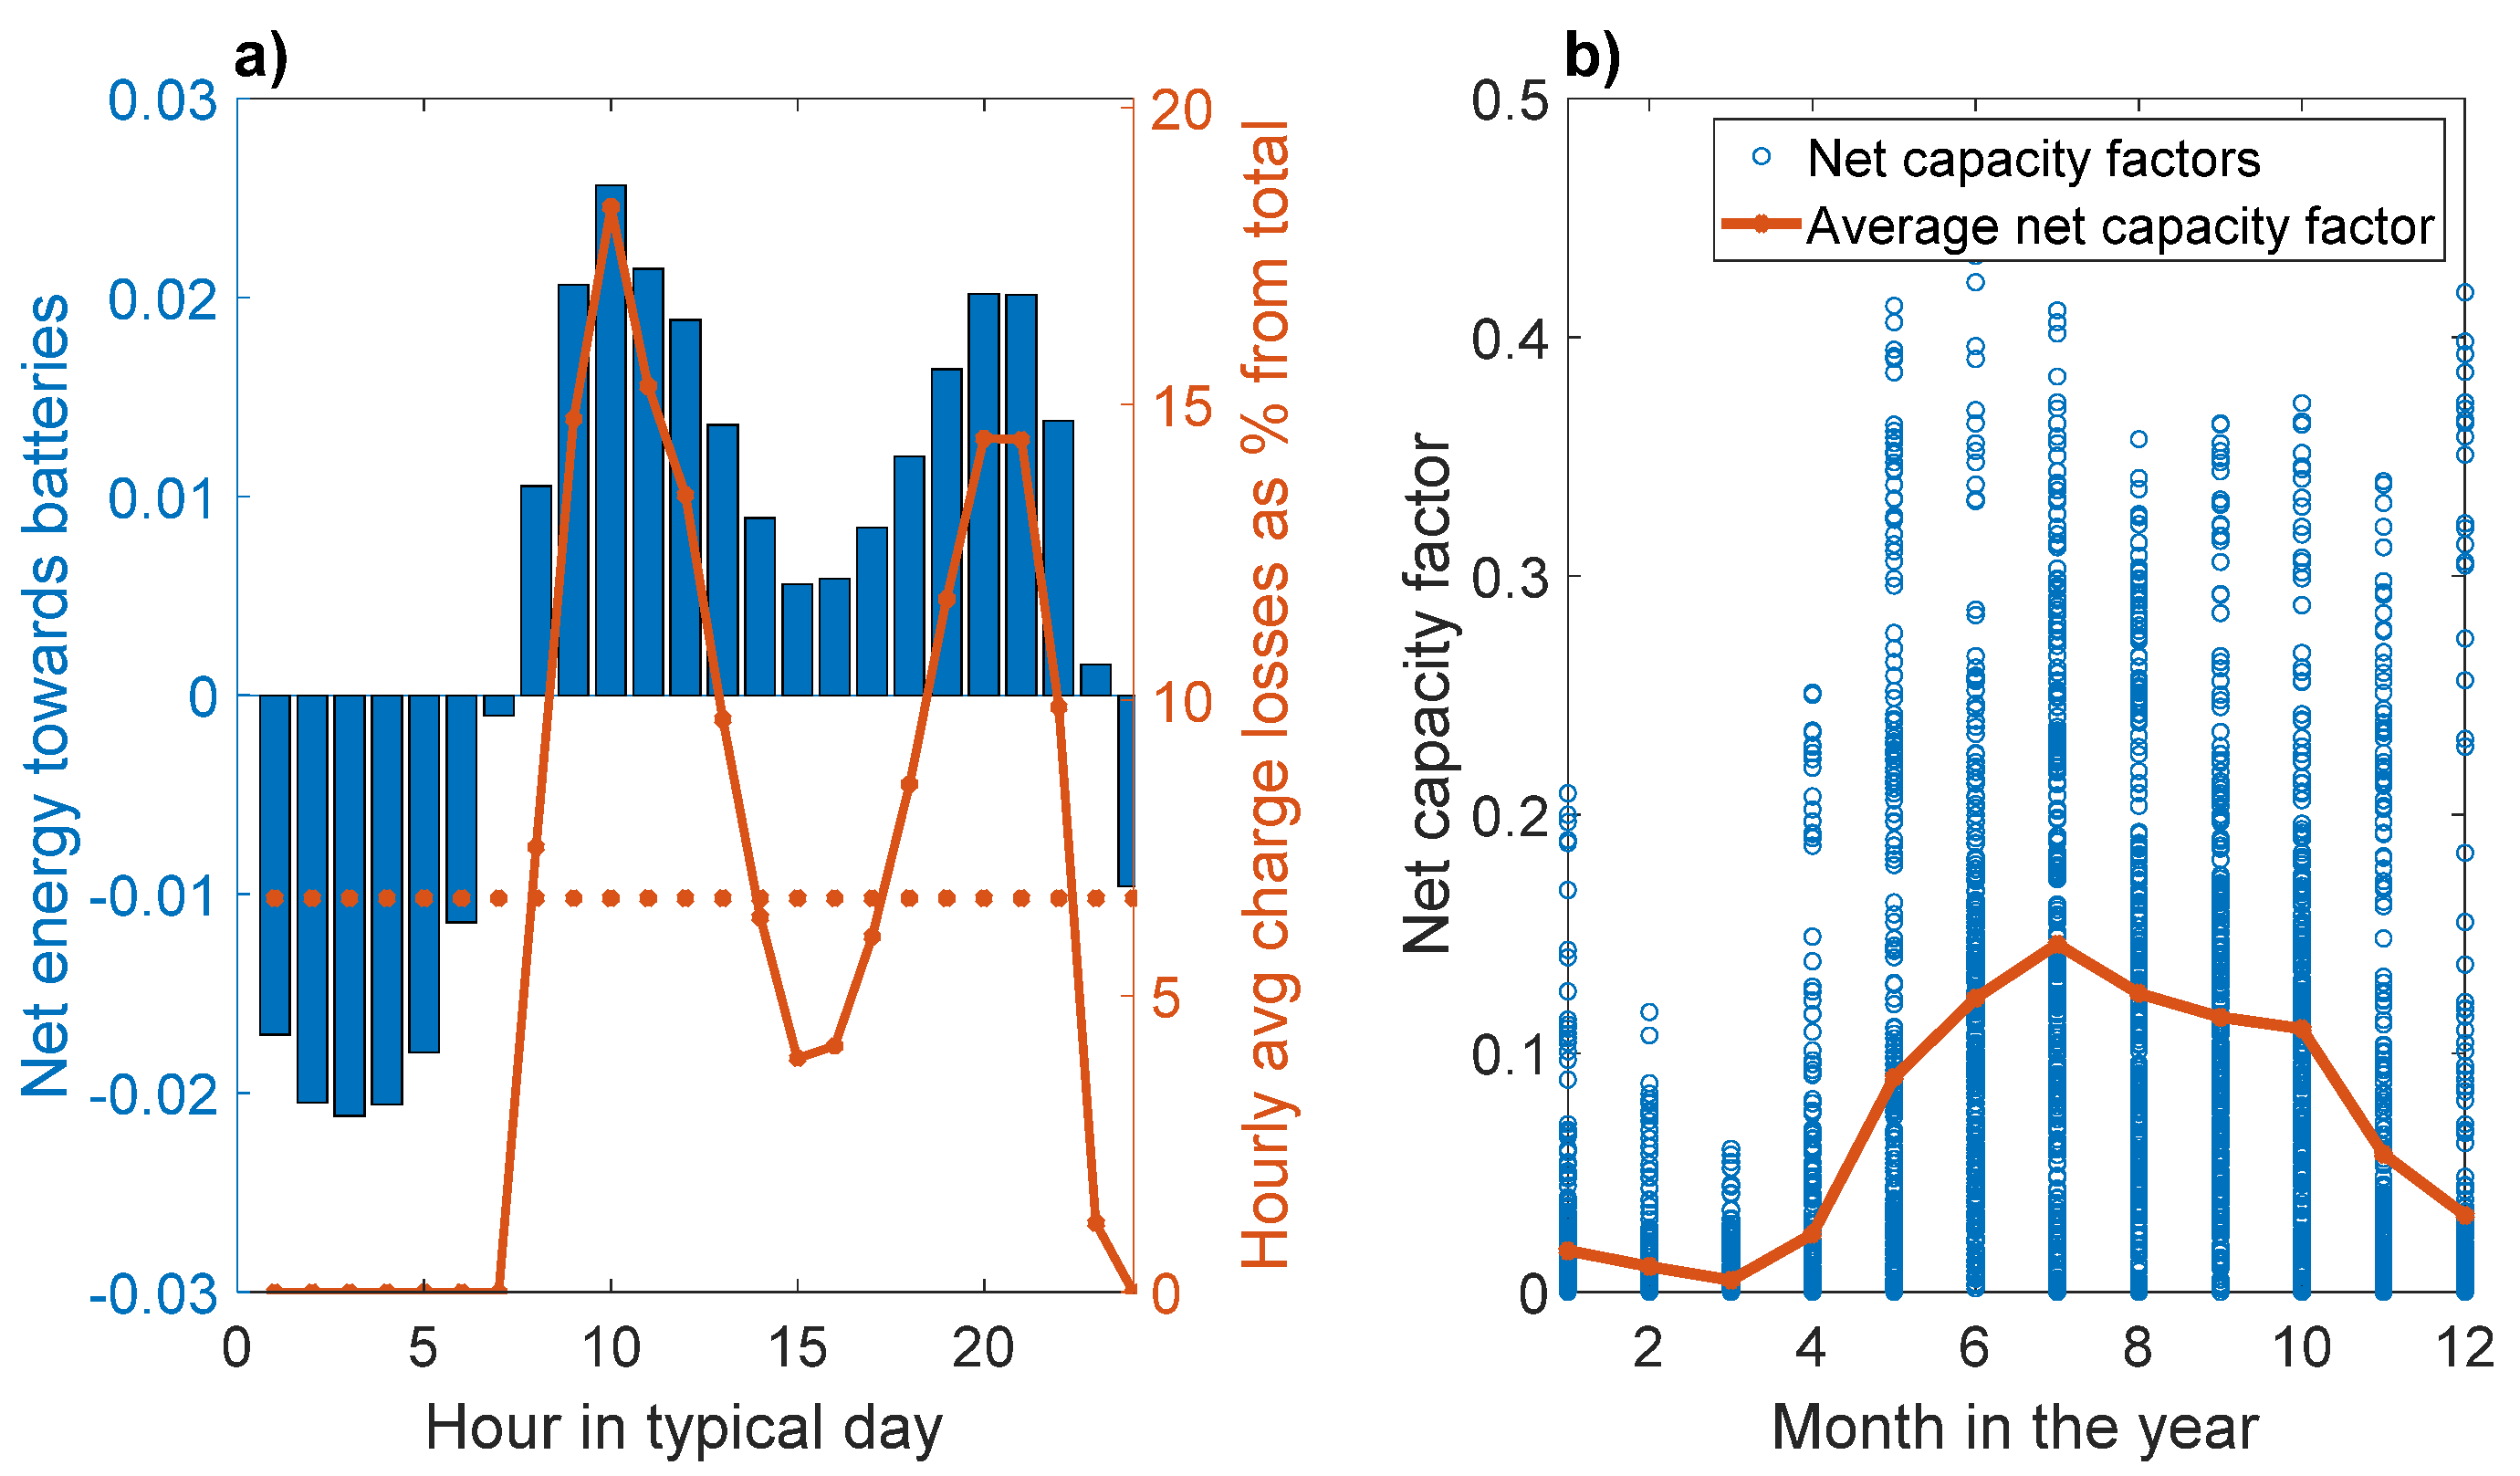
  • Higher load factor. Upon combining wind and solar PV, ammonia production with electrolyzer load factors up to 60–70% may be achieved [58,59]; decreasing the cost of the ammonia production plant. For reference, the onshore wind-based ammonia plant only operates at a load factor of 41% for Curaçao and 20% for Viti Levu. Thus, local production could become more attractive by increasing the utilization factor of the AEHB system.
Local ammonia production as energy storage medium on the islands provides resilience, as this means supply is not affected by geopolitics. However, geographic effects are also important to consider in this respect, as cyclones and hurricanes occur frequently in the Caribbean and Pacific areas. Furthermore, these are expected to increase in frequency and magnitude, due to climate change. Thus, the effective investment into the ammonia energy storage system can be substantially higher than calculated in this work. Additionally, it should furthermore be noted that building an islanded system requires a high capital investment, as both the onshore wind capacity and the ammonia energy storage system must be built. This high capital investment hinders the implementation rate of renewable technologies in SIDS [4,60,61,62]. If ammonia is imported as an energy commodity, then it is possible to reduce the risks associated with the capital investment. It should be noted that Viti Levu also has good local bagasse (0.08–0.13 USD/kWh), biomass (0.11 USD/kWh), and hydropower (0.09–0.15 USD/kWh) resources [22], implying less ammonia import is required. However, a benefit of ammonia is its availability throughout the year as a commodity, improving resilience and reducing further the reliance on fossil fuels.
Therefore, resilience on small island states is probably best achieved through corporation with an ammonia supplier abroad. For the case of completely importing ammonia, Curaçao requires about 83 kt ammonia imported annually, while Viti Levu requires about 164 kt ammonia imported annually. For reference, the announced renewable ammonia plants account for over 30 Mt ammonia by 2030 [56]. Thus, supply of renewable ammonia is not expected to be an issue. Based on the aforementioned information, the statements as shown in Table 3 hold true.

5. Conclusions

Local production of ammonia as an energy storage medium was compared with imported ammonia to make up for the deficits in the electricity produced from onshore wind, for Curaçao and Viti Levu in Fiji. It was found that importing ammonia is the most feasible solution for both islands, with a levelized cost of electricity (LCOE) of 0.11 USD/kWh for Curaçao and 0.37 USD/kWh for Viti Levu. This compares to 0.12 USD/kWh for Curaçao and 1.10 USD/kWh for Viti Levu for a completely islanded system based on onshore wind and local ammonia production. These islands represent two extremes in terms of wind load factor and load consistency with a high, consistent wind load factor for Curaçao and a low, inconsistent wind load factor for Viti Levu. Thus, the results herein reported are expected to be applicable for other SIDS. Additional arguments for importing ammonia are a lower capital investment and the geographic risks due to cyclones and hurricanes in the Caribbean and Pacific areas. In summary, SIDS can produce electricity from local onshore wind and imported ammonia in a cost-effective manner at a cost similar to imported fossil commodities with near-zero emissions.
Future research should be directed to several parts of the project, including (1) the costs of wind turbines have a significant influence on the final LCOE, thus case-specific projections are required for more accurate results on the respective SIDS; (2) more accurate projections on ammonia shipping rates, harbor terminals, storage, and transport infrastructure on a case-specific basis; and (3) a pilot set-up of the integrated system in a realistic environment should verify modeling results.

Supplementary Materials

The following supporting information can be downloaded at: https://www.mdpi.com/article/10.3390/en15093374/s1, Supplementary Materials S1–S9. References [7,11,13,30,31,32,55,56,59,63,64,65,66,67,68,69,70,71,72,73,74,75,76,77] are cited in the supplementary materials.

Author Contributions

V.N.S.: development of the modelling methodology, validation, investigation, data processing, and writing of the original draft. K.H.R.R.: formal analysis, writing review and editing, and visualization. J.A.F.: conceptualization of the project, visualization, supervision, project administration, formal analysis, editing and review of the manuscript, and funding acquisition. All authors have read and agreed to the published version of the manuscript.

Funding

The research project and APC was funded by the Nederlandse Organisatie voor Wetenschappelijk Onderzoek (NWO) Project Number NWOCA.2019.027 called RESILIENT-ISLAND.

Institutional Review Board Statement

Not applicable.

Informed Consent Statement

Not applicable.

Data Availability Statement

The wind data presented in this study is ERA5 reanalysis data and is available in the database of Climate Data Store (CDS). Detailed data searching input given in Supplementary Information.

Conflicts of Interest

The authors declare no conflict of interest.

References

  1. Ornes, S. How does climate change influence extreme weather? Impact attribution research seeks answers. Proc. Natl. Acad. Sci. USA 2018, 115, 8232–8235. [Google Scholar] [CrossRef] [PubMed] [Green Version]
  2. United Nations. 2014 Samoa Pathway: UN Resolution SAMOA Pathway. Population English Edition. Available online: https://sustainabledevelopment.un.org/samoapathway.html (accessed on 28 March 2022).
  3. Biggs, E.M.; Bruce, E.; Boruff, B.; Duncan, J.M.; Horsley, J.; Pauli, N.; McNeill, K.; Neef, A.; Van Ogtrop, F.; Curnow, J.; et al. Sustainable development and the water–energy–food nexus: A perspective on livelihoods. Environ. Sci. Policy 2015, 54, 389–397. [Google Scholar] [CrossRef] [Green Version]
  4. van der Velde, M.; Green, S.; Vanclooster, M.; Clothier, B. Sustainable development in small island developing states: Agricultural intensification, economic development, and freshwater resources management on the coral atoll of Tongatapu. Ecol. Econ. 2007, 61, 456–468. [Google Scholar] [CrossRef]
  5. Connell, J. COVID-19 and tourism in Pacific SIDS: Lessons from Fiji, Vanuatu and Samoa? Round Table 2021, 110, 149–158. [Google Scholar] [CrossRef]
  6. To, L.S.; Bruce, A.; Munro, P.; Santagata, E.; MacGill, I.; Rawali, M.; Raturi, A. A research and innovation agenda for energy resilience in Pacific Island Countries and Territories. Nat. Energy 2021, 6, 1098–1103. [Google Scholar] [CrossRef]
  7. Sagel, V.N.; Rouwenhorst, K.H.; Faria, J.A. Green ammonia enables sustainable energy production in small island developing states: A case study on the island of Curaçao. Renew. Sustain. Energy Rev. 2022, 161, 112381. [Google Scholar] [CrossRef]
  8. ISPT. Power to Ammonia. Report, 51. Available online: https://www.topsectorenergie.nl/sites/default/files/uploads/Energie en Industrie/Power to Ammonia 2017.pdf (accessed on 22 April 2022).
  9. Rouwenhorst, K.H.; Van der Ham, A.G.; Mul, G.; Kersten, S.R. Islanded ammonia power systems: Technology review & conceptual process design. Renew. Sustain. Energy Rev. 2019, 114, 109339. [Google Scholar] [CrossRef]
  10. Bañares-Alcántara, R.; Dericks, I.I.I.; Fiaschetti, M.; Grünewald, P.; Lopez, J.M.; Tsang, E.; Yang, A.; Ye, L.; Zhao, S. Analysis of Islanded Ammonia-based Energy Storage Systems, (October), 1–150. 2015. Available online: https://dokumen.tips/download/link/analysis-of-islanded-ammonia-based-energy-storage-of-islanded-ammonia-based (accessed on 22 April 2022).
  11. Nayak-Luke, R.M.; Bañares-Alcántara, R. Techno-economic viability of islanded green ammonia as a carbon-free energy vector and as a substitute for conventional production. Energy Environ. Sci. 2020, 13, 2957–2966. [Google Scholar] [CrossRef]
  12. Salmon, N.; Bañares-Alcántara, R.; Nayak-Luke, R. Optimization of green ammonia distribution systems for intercontinental energy transport. iScience 2021, 24, 102903. [Google Scholar] [CrossRef]
  13. Salmon, N.; Bañares-Alcántara, R. Green ammonia as a spatial energy vector: A review. Sustain. Energy Fuels 2021, 5, 2814–2839. [Google Scholar] [CrossRef]
  14. Dias, V.; Pochet, M.; Contino, F.; Jeanmart, H. Energy and Economic Costs of Chemical Storage. Front. Mech. Eng. 2020, 6, 1–17. [Google Scholar] [CrossRef]
  15. Muñoz Sabater, J. ERA5-Land hourly data from 1950 to 1980. Copernicus Climate Change Service (C3S) (2017): ERA5: Fifth Generation of ECMWF Atmospheric Reanalyses of the Global Climate. Copernicus Climate Change Service Climate Data Store (CDS). 2021. Available online: https://cds.climate.copernicus.eu/cdsapp#!/datashomet/reanalysis-era5-land?tab=overview (accessed on 21 December 2021).
  16. Ministry of Energy and Energy Industries|Ammonia. Available online: https://www.energy.gov.tt/our-business/lng-petrochemicals/petrochemicals/ammonia/ (accessed on 12 April 2022).
  17. Brazil Ammonia Production by Year (Thousand Metric Tons of Contained Nitrogen). Available online: https://www.indexmundi.com/minerals/?country=br&product=ammonia&graph=production (accessed on 12 April 2022).
  18. Australia—Ammonia Energy Association. Available online: https://www.ammoniaenergy.org/regions/australia/ (accessed on 12 April 2022).
  19. Million Tonnes Per Year Renewable Ammonia in Chile—Ammonia Energy Association. Available online: https://www.ammoniaenergy.org/articles/4-4-million-tonnes-per-year-renewable-ammonia-in-chile/ (accessed on 12 April 2022).
  20. Curaçao Ports Authority Curaçao Ports Authority. 2022. Available online: http://curports.com/ (accessed on 6 February 2022).
  21. Sea Ports of Fiji FJ. 2022. Available online: https://www.searates.com/maritime/fiji (accessed on 6 February 2022).
  22. IRENA. Energy Profile Fiji. 2021. Available online: https://www.irena.org/IRENADocuments/Statistical_Profiles/Oceania/Fiji_Oceania_RE_SP.pdf (accessed on 22 April 2022).
  23. Renewable Energy Statistics. 2021. Available online: https://irena.org/publications/2021/Aug/Renewable-energy-statistics-2021 (accessed on 27 March 2022).
  24. IRENA. Fiji Renewables Readiness Assessment. 2015. Available online: https://www.irena.org/-/media/Files/IRENA/Agency/Publication/2015/IRENA_RRA_Fiji_2015.pdf (accessed on 22 April 2022).
  25. Renewables Readiness Assessment: Fiji. 2015. Available online: https://www.irena.org/publications/2015/Jul/Renewables-Readiness-Assessment-Fiji (accessed on 27 March 2022).
  26. EFL. Electricity Tariffs and Rates. 2022. Available online: https://www.energytexas.com/docs/efls/output/20220309_F_ONC_36IF.pdf (accessed on 28 January 2022).
  27. ETI. Curacao Energy Snapshot. 2021. Available online: https://www.energy.gov/sites/default/files/2020/09/f79/ETI-Energy-Snapshot-Curacao_FY20.pdf (accessed on 22 April 2022).
  28. Office of Energy Efficiency and Renewable Energy. Energy Snapshot Curacao. NREL. Colorado. Available online: https://www.nrel.gov/docs/fy15osti/64120.pdf (accessed on 22 April 2022).
  29. Dornan, M.; Jotzo, F. Electricity Generation in Fiji: Assessing the Impact of Renewable Technologies on Costs and Financial Risk. In Proceedings of the 55th Australian Agricultural and Resource Economics Society 2011 Conference, Melbourne, Australia, 8–11 February 2011; pp. 1–29. [Google Scholar] [CrossRef]
  30. Yash, A. 100% Renewable Energy Transition In Small Island Developing States (SIDS). 2017. Available online: http://resolver.tudelft.nl/uuid:a0bc6111-618f-490f-94aa-87f9508a8bd6 (accessed on 22 April 2022).
  31. Rogers, T.; Ashtine, M.; Koon, R.K.; Atherley-Ikechi, M. Onshore wind energy potential for Small Island Developing States: Findings and recommendations from Barbados. Energy Sustain. Dev. 2019, 52, 116–127. [Google Scholar] [CrossRef]
  32. Vestas V82-1.65—1.65 MW—Wind Turbine. 2011. Available online: https://en.wind-turbine-models.com/turbines/81-vestas-v82-1.65 (accessed on 30 January 2022).
  33. Mulder, F.M.; Weninger, B.M.H.; Middelkoop, J.; Ooms, F.G.B.; Schreuders, H. Efficient electricity storage with a battolyser, an integrated Ni–Fe battery and electrolyser. Energy Environ. Sci. 2016, 10, 756–764. [Google Scholar] [CrossRef] [Green Version]
  34. Wang, Z.; Deshmukh, A.; Du, Y.; Elimelech, M. Minimal and zero liquid discharge with reverse osmosis using low-salt-rejection membranes. Water Res. 2019, 170, s115317. [Google Scholar] [CrossRef]
  35. Charisiadis, C. Brine Zero Liquid Discharge (ZLD) Fundamentals and Design; A Guide to the Basic Conceptualization of the ZLD/MLD Process Design and the Relative Technologies Involved. 2018. Available online: https://www.researchgate.net/publication/327976930_Brine_Zero_Liquid_Discharge_ZLD_Fundamentals_and_Design_A_guide_to_the_basic_conceptualization_of_the_ZLDMLD_process_design_and_the_relative_technologies_involved (accessed on 28 March 2022).
  36. Rouwenhorst, K.H.R.; Van der Ham, A.G.J.; Lefferts, L. Beyond Haber-Bosch: The renaissance of the Claude process. Int. J. Hydrog. Energy 2021, 46, 21566–21579. [Google Scholar] [CrossRef]
  37. Appl, M. Ammonia 1. Introduction. Ullmann’s Encycl. Ind. Chem. 2012, 3, 1–58. [Google Scholar] [CrossRef]
  38. Rouwenhorst, K.H.R.; Van der Ham, A.G.J.; Mul, G.; Kersten, S.R.A. Power-to-Ammonia-to-Power (P2A2P) for Local Electricity Storage in 2025. Current Developments, Process Proposal & Future Research Required. University of Twente. 2018. Available online: https://www.researchgate.net/publication/341286330_Power-to-ammonia-to-power_P2A2P_for_local_electricity_storage_in_2025_Current_developments_process_proposal_future_research_required?channel=doi&linkId=5eb90ead4585152169c587ef&showFulltext=true (accessed on 22 April 2022).
  39. Patel, P.; Farooque, M. DFC Technology Status. 2009. Available online: https://www.energy.gov/sites/prod/files/2014/03/f12/mcfc_pafc_workshop_patel.pdf (accessed on 15 May 2021).
  40. Aziz, M.; Wijayanta, A.T.; Nandiyanto, A.B.D. Ammonia as Effective Hydrogen Storage: A Review on Production, Storage and Utilization. Energies 2020, 13, 3062. [Google Scholar] [CrossRef]
  41. Faleh, S.; Khir, T.; Ben Brahim, A. Energetic Performance Optimization of a SOFC–GT Hybrid Power Plant. Arab. J. Sci. Eng. 2016, 42, 1505–1515. [Google Scholar] [CrossRef]
  42. Ganley, J.C.; Thomas, F.S.; Seebauer, E.G.; Masel, R.I. A Priori Catalytic Activity Correlations: The Difficult Case of Hydrogen Production from Ammonia. Catal. Lett. 2004, 96, 117–122. [Google Scholar] [CrossRef]
  43. Rouwenhorst, K.H.R.; Krzywda, P.M.; Benes, N.E.; Mul, G.; Lefferts, L. Ammonia, 4. Green Ammonia Production. 2020, pp. 1–20. Available online: https://onlinelibrary.wiley.com/doi/full/10.1002/14356007.w02_w02 (accessed on 22 April 2022).
  44. Rouwenhorst, K.; Krzywda, P.; Benes, N.; Mul, G.; Lefferts, L. Chapter 4: Ammonia Production Technologies. In Techno-Economic Challenges of Green Ammonia as an Energy Vector; Academic Press: Cambridge, MA, USA, 2020; pp. 41–83. [Google Scholar] [CrossRef]
  45. Brightling, J. Ammonia and the Fertiliser Industry: The Development of Ammonia at Billingham. Johns. Matthey Technol. Rev. 2018, 62, 32–47. [Google Scholar] [CrossRef]
  46. Zuccari, F.; Orecchini, F.; Santiangeli, A.; Suppa, T.; Ortenzi, F.; Genovese, A.; Pede, G. Well to wheel analysis and comparison between conventional, hybrid and electric powertrain in real conditions of use. AIP Conf. Proc. 2019, 2191, 020158. [Google Scholar] [CrossRef]
  47. Study on Development of Water Electrolysis in the EU Final Report E4tech Sàrl with Element Energy Ltd for the Fuel Cells and Hydrogen Joint Undertaking. 2014. Available online: www.e4tech.com (accessed on 22 April 2022).
  48. Schulte-Schulze-Berndt, A.; Krabiell, K. Nitrogen generation by pressure swing adsorption based on carbon molecular sieves. Gas Sep. Purif. 1993, 7, 253–257. [Google Scholar] [CrossRef]
  49. Malmali, M.; Le, G.; Hendrickson, J.; Prince, J.; McCormick, A.V.; Cussler, E.L. Better Absorbents for Ammonia Separation. ACS Sustain. Chem. Eng. 2018, 6, 6536–6546. [Google Scholar] [CrossRef]
  50. Comparison of Electricity Consumption for Ammonia and Freon Refrigeration Systems—CT-Technologies. Available online: http://www.ct-technologies.dk/comparison-of-electricity-consumption-for-ammonia-and-freon-refrigeration-systems/ (accessed on 12 October 2020).
  51. James, J.D.; Van, Y.C. Power to Ammonia Process Options. Available online: https://publicaties.ecn.nl/PdfFetch.aspx?nr=ECN-E--17-039 (accessed on 22 April 2022).
  52. News Waddenfonds—Battolyser Systems. 2018. Available online: https://www.battolysersystems.com/news-artcile (accessed on 8 February 2022).
  53. Schmidt, O.; Hawkes, A.; Gambhir, A.; Staffell, I. The future cost of electrical energy storage based on experience rates. Nat. Energy 2017, 2, 17110. [Google Scholar] [CrossRef]
  54. Jargstorf, B. Wind Power in the Caribbean–on-Going and Planned Projects. Castries, St. Lucia: CREDP/GTZ Project. 2011. Available online: http://scholar.google.com/scholar?hl=en&btnG=Search&q=intitle:Wind+Power+in+the+Caribbean+-+On-going+and+Planned+Projects#0 (accessed on 11 July 2021).
  55. Cesaro, Z.; Ives, M.; Nayak-Luke, R.; Mason, M.; Bañares-Alcántara, R. Ammonia to power: Forecasting the levelized cost of electricity from green ammonia in large-scale power plants. Appl. Energy 2020, 282, 116009. [Google Scholar] [CrossRef]
  56. IRENA; Ammonia Energy Association. Production, Market Status and Future Prospects of Renewable Ammonia. 2021. Available online: https://www.mendeley.com/catalogue/c3e24f79-8ae7-3625-8a4f-ee0da1faae5d/?utm_source=desktop&utm_medium=1.19.8&utm_campaign=open_catalog&userDocumentId=%7B82f97ed3-89af-44e3-99ac-32f8646e4e3b%7D (accessed on 22 April 2022).
  57. IRENA. Renewable Power Generation Costs in 2020. 2021. Available online: https://www.irena.org/-/media/Files/IRENA/Agency/Publication/2021/Jun/IRENA_Power_Generation_Costs_2020.pdf (accessed on 22 April 2022).
  58. Tancock, A. Green Ammonia at Oil and Gas Scale. In NH3 Energy Conference. Available online: https://www.ammoniaenergy.org/articles/green-ammonia-at-oil-and-gas-scale/ (accessed on 22 April 2022).
  59. Armijo, J.; Philibert, C. Flexible production of green hydrogen and ammonia from variable solar and wind energy: Case study of Chile and Argentina. Int. J. Hydrog. Energy 2019, 45, 1541–1558. [Google Scholar] [CrossRef]
  60. United Nations Sustainable Development. SAMOA Pathway. 2019. Available online: https://sustainabledevelopment.un.org/sids/samoareview (accessed on 28 March 2022).
  61. Nachmany, M.; Setzer, J. Policy Brief—Global Trends in Climate Change Legislation and Litigation: 2018 Snapshot. 2018. Available online: https://www.ipu.org/resources/publications/reports/2018-05/global-trends-in-climate-change-legislation-and-litigation-2018-snapshot (accessed on 11 July 2021).
  62. Niles, K.; Lloyd, B. Small Island Developing States (SIDS) & Energy Aid: Impacts on the Energy Sector in the Caribbean and Pacific. Energy Sustain. Dev. 2013, 17, 521–530. [Google Scholar] [CrossRef]
  63. Prasad, R.D.; Raturi, A. Low carbon alternatives and their implications for Fiji’s electricity sector. Util. Policy 2019, 56, 1–19. [Google Scholar] [CrossRef]
  64. ERA5 Monthly Averaged Data on Single Levels from 1979 to Present. 2021. Available online: https://cds.climate.copernicus.eu/cdsapp#!/dataset/reanalysis-era5-single-levels-monthly-means?tab=overview (accessed on 27 March 2022).
  65. Johnson, N.H.; Solomon, B.D. A net-present value analysis for a wind turbine purchase at a small US college. Energies 2010, 3, 943–959. [Google Scholar] [CrossRef] [Green Version]
  66. Fasihi, M.; Weiss, R.; Savolainen, J.; Breyer, C. Global potential of green ammonia based on hybrid PV-wind power plants. Appl. Energy 2021, 294, 116170. [Google Scholar] [CrossRef]
  67. Burgess, J.; Washington, T. Interview: World’s largest green hydrogen project eyes Australian ammonia exports. S&P Glob. Platts. 2021. Available online: https://www.spglobal.com/commodity-insights/pt/market-insights/latest-news/petrochemicals/050421-interview-worlds-largest-green-hydrogen-project-eyes-australian-ammonia-exports (accessed on 22 April 2022).
  68. Laval, A.; Hafnia, H.T.; Vestas, S.G. Ammonfuel—An Industrial View of Ammonia as a Marine Fuel. 2020. Available online: https://hafniabw.com/news/ammonfuel-an-industrial-view-of-ammonia-as-a-marine-fuel/ (accessed on 22 April 2022).
  69. Energy Information Administration, U. Capital Cost and Performance Characteristic Estimates for Utility Scale Electric Power Generating Technologies. 2020. Available online: https://www.eia.gov/analysis/studies/powerplants/capitalcost/ (accessed on 22 April 2022).
  70. Shea, R.P.; Ramgolam, Y.K. Applied levelized cost of electricity for energy technologies in a small island developing state: A case study in Mauritius. Renew. Energy 2019, 132, 1415–1424. [Google Scholar] [CrossRef]
  71. The Engineering Toolbox. Combustion of Fuels-Carbon Dioxide Emission. 2009. Available online: https://www.engineeringtoolbox.com/co2-emission-fuels-d_1085.html (accessed on 17 April 2021).
  72. Press Release New Fuel and Lpg Prices Friday. 30 July 2021. Available online: https://fccc.gov.fj/2021/07/30/new-fuel-and-lpg-prices-3/ (accessed on 7 February 2022).
  73. Malik, A.Q. Renewables for Fiji–Path for green power generation. Renew. Sustain. Energy Rev. 2021, 149, 111374. [Google Scholar] [CrossRef]
  74. United States Coal Reserves and Consumption Statistics-Worldometer. 2016. Available online: https://www.worldometers.info/coal/fiji-coal/ (accessed on 7 February 2022).
  75. Fiji diesel prices|GlobalPetrolPrices.com. 2021. Available online: https://www.globalpetrolprices.com/Fiji/diesel_prices/ (accessed on 7 February 2022).
  76. New Fuel and Lpg Prices–Effective from 1 December 2021–Fijian Competition & Consumer Commission. 2021. Available online: https://fccc.gov.fj/2021/11/29/new-fuel-and-lpg-prices-effective-from-1-december-2021/ (accessed on 7 February 2022).
  77. 1 FJD to USD-Fijian Dollars to US Dollars Exchange Rate. 2022. Available online: https://www.xe.com/currencyconverter/convert/?Amount=1&From=FJD&To=USD (accessed on 7 February 2022).
Figure 1. Technology benchmarking of energy storage, figure from [7], modified from [8].
Energies 15 03374 g001
Figure 2. Conceptual process flow diagram for power-to-ammonia-to-power (P2A2P), using a battolyser, pressure swing adsorption (PSA), and absorption-enhanced Haber–Bosch (AE-HB). Modified from [7].
Energies 15 03374 g002
Figure 3. Hourly (a) and monthly (b) wind patterns on Curaçao, data from ERA5 in years 2007–2020, and (c) annual wind speed distribution, together with modeled wind speed versus net capacity factor curve on Curaçao.
Energies 15 03374 g003
Figure 4. Battolyser energy flux and charging losses for Curaçao, based upon average wind speed and average demand pattern (a), and effective net capacity factor for Curaçao, corrected for battolyser RTE losses (b).
Energies 15 03374 g004
Figure 5. Annual energy demand and generation patterns for Curaçao (a), and the utilization of generated energy per month for Curaçao (b).
Energies 15 03374 g005
Figure 6. Ammonia import percentage versus import ammonia flows, average HB capacity, and max HB capacity for Curaçao, storage tank included as well.
Energies 15 03374 g006
Figure 7. Ammonia import percentage versus LCOE in USD/kWh, at 500 USD/ton NH3, for Curaçao.
Energies 15 03374 g007
Figure 8. LCOE of P2A2P compared with fossil-fuel-based alternatives for Curaçao, adapted and modified from reference [7].
Energies 15 03374 g008
Figure 9. Hourly (a) and monthly (b) wind patterns on Viti Levu, data from ERA5 in years 2007–2020. Wind speed distribution, together with modeled wind speed versus net capacity factor curve on Viti Levu (c).
Energies 15 03374 g009
Figure 10. Battolyser energy flux and charging losses for Viti Levu, based upon average wind speed and average demand pattern, dotted line for average daily charging losses (a). Effective net capacity factor for Viti Levu, corrected for battolyser RTE losses (b).
Energies 15 03374 g010
Figure 11. Ammonia import percentage versus import ammonia flows, average HB capacity, and max HB capacity for Viti Levu.
Energies 15 03374 g011
Figure 12. Ammonia import percentage versus LCOE in USD/kWh, at 500 USD/ton NH3, for Viti Levu.
Energies 15 03374 g012
Figure 13. LCOE and carbon footprint of P2A2P compared to fossil-fuel-based alternatives for Viti Levu.
Energies 15 03374 g013
Figure 14. LCOE in USD/kWh versus ammonia import percentage, at green ammonia total costs of 400, 600, and 800 USD/ton for Curaçao (a) and Viti Levu (b).
Energies 15 03374 g014
Table 1. Calculation methods as utilized in this work.
CalculationMethod
Wind turbine generation curvesMatlab, wind data from ERA5 database, example wind turbine from literature.
Demand curvesFrom literature, implemented in Matlab.
Haber–Bosch loopAspen Plus
Absorption columns in HB loop and other equipmentMatlab with property data from literature/Aspen Plus.
Equipment dimensionsIterative loop in Matlab until annual shortage = annual surplus = 0.
Costs and sensitivity analysesExcel, and imported to Matlab, or directly in Matlab.
Table 2. Energy consumption of the P2A2P process, in kWh/kg NH3. Comparable results shown in references [7,9].
ProcessEnergy in kWh/kg NH3Reference
Water desalination0.02[10,34]
Electrolysis8.75[47]
PSA0.35[48]
Ammonia synthesis loop2.76Absorption beds [49], rest Aspen Plus
Ammonia storage0.16[37,50]
Total12.0
Table 3. Conclusions from the results as found in this work.
CuraçaoViti Levu
Cheapest configurationWith ammonia importWith ammonia import
Isolated islanded systemEconomically feasibleNot economically feasible
Islanded system including ammonia importsEconomically feasibleNot economically feasible
Publisher’s Note: MDPI stays neutral with regard to jurisdictional claims in published maps and institutional affiliations.

