1. Introduction
Energy-system scenarios are widely used to depict developments in the energy supply and the resulting carbon-emission pathways that are related to different sets of political measures. In the past, scenario analyses have often been based on annual energy balances, such as roadmaps for the United States (US), by Jacobson et al. [
1]; long-term scenarios for the German energy transition, by Pregger et al. [
2]; the “Sustainable world energy outlook”, by Teske et al. [
3]; and the IEA World Energy Outlook until 2014 [
4]. These approaches cannot adequately capture the variability in renewable-energy (RE) resources. Since this is significant to ensuring an uninterrupted power supply, a new type of energy-system model that focuses on the power sector has been developed since the beginning of this century, which uses input data with high spatial and temporal resolutions. At the temporal scale, this typically means an hourly resolution, and, on the spatial scale, input data with resolutions of a few kilometres are commonly aggregated at the national or subnational levels. Collins et al. [
5] distinguish two types of such models: (1) Operational-power-system models, which analyse the operation of a given power system; and (2) Long-term energy-system optimisation models, which include investment decisions to generate scenarios of the evolution and operation of energy-supply systems. Operational-power-system models have successfully been used as a supplement to scenario analyses, and they simulate the operation of a given set of power generators by minimising the overall system-operation costs (e.g., [
6,
7]). Conversely, long-term energy-system-optimisation models are used as independent techno-economic assessment tools that generate complete system-structure and -operation scenarios. Such models can also focus on the power sector; we refer to them as “power-sector models” (PSMs). Well-known examples of PSMs are REMix [
8], PyPSA [
9], URBS [
10], and oemof [
11].
The combination of an optimisation approach with a focus on the technical properties can identify least-cost technically feasible solutions. However, if conducted without considering the social and political frameworks, it is also prone to produce questionable solutions, such as the high import dependencies of countries, which contradict their current political strategies, transmission-grid expansion, which lacks social acceptance, or an overly strong focus on one energy-conversion technology (see, for example, [
12,
13]). More plausible solutions can be obtained by adding specific constraints to the optimisation of PSMs, as described in [
14], such as setting a minimum amount of national power generation to cover the national demand.
Scenarios of the social, political, and economic development can be a source of information for the consistent PSM constraints and the parameter values. In the context of power-sector modelling, we call such scenarios, “framework scenarios”, because they outline the social, political, and economic frames of the investigated system. Framework scenarios facilitate the accessibility of the knowledge of not only a single-scenario analyst, but also of a number of experts in different fields. In the typical creation process of framework scenarios, the framework parameters, which are referred to as “descriptors” (e.g., GDP, population, or social values), and their possible states (e.g., increasing, decreasing or stagnant) are selected and are qualitatively or quantitatively defined through expert interviews before being accurately described in essays. The correlations between descriptors are defined again through expert judgments and discussions (e.g., an expert may consider that increasing population is likely to result in increasing GDP, but unlikely to result in decreasing GDP). The results of this process can be aggregated in a matrix and can be checked for unambiguous descriptor-state combinations by using a method called “cross-impact balance” (CIB), as, for example, developed by Weimer-Jehle et al., in [
15,
16,
17], and as later reviewed in [
18]. The result is a set of consistent framework scenarios that are supposed to cover the space of the possible futures of the investigated field, which can reflect the general global development, or which can be more specific (for example, in terms of geography), and the political or social sectors.
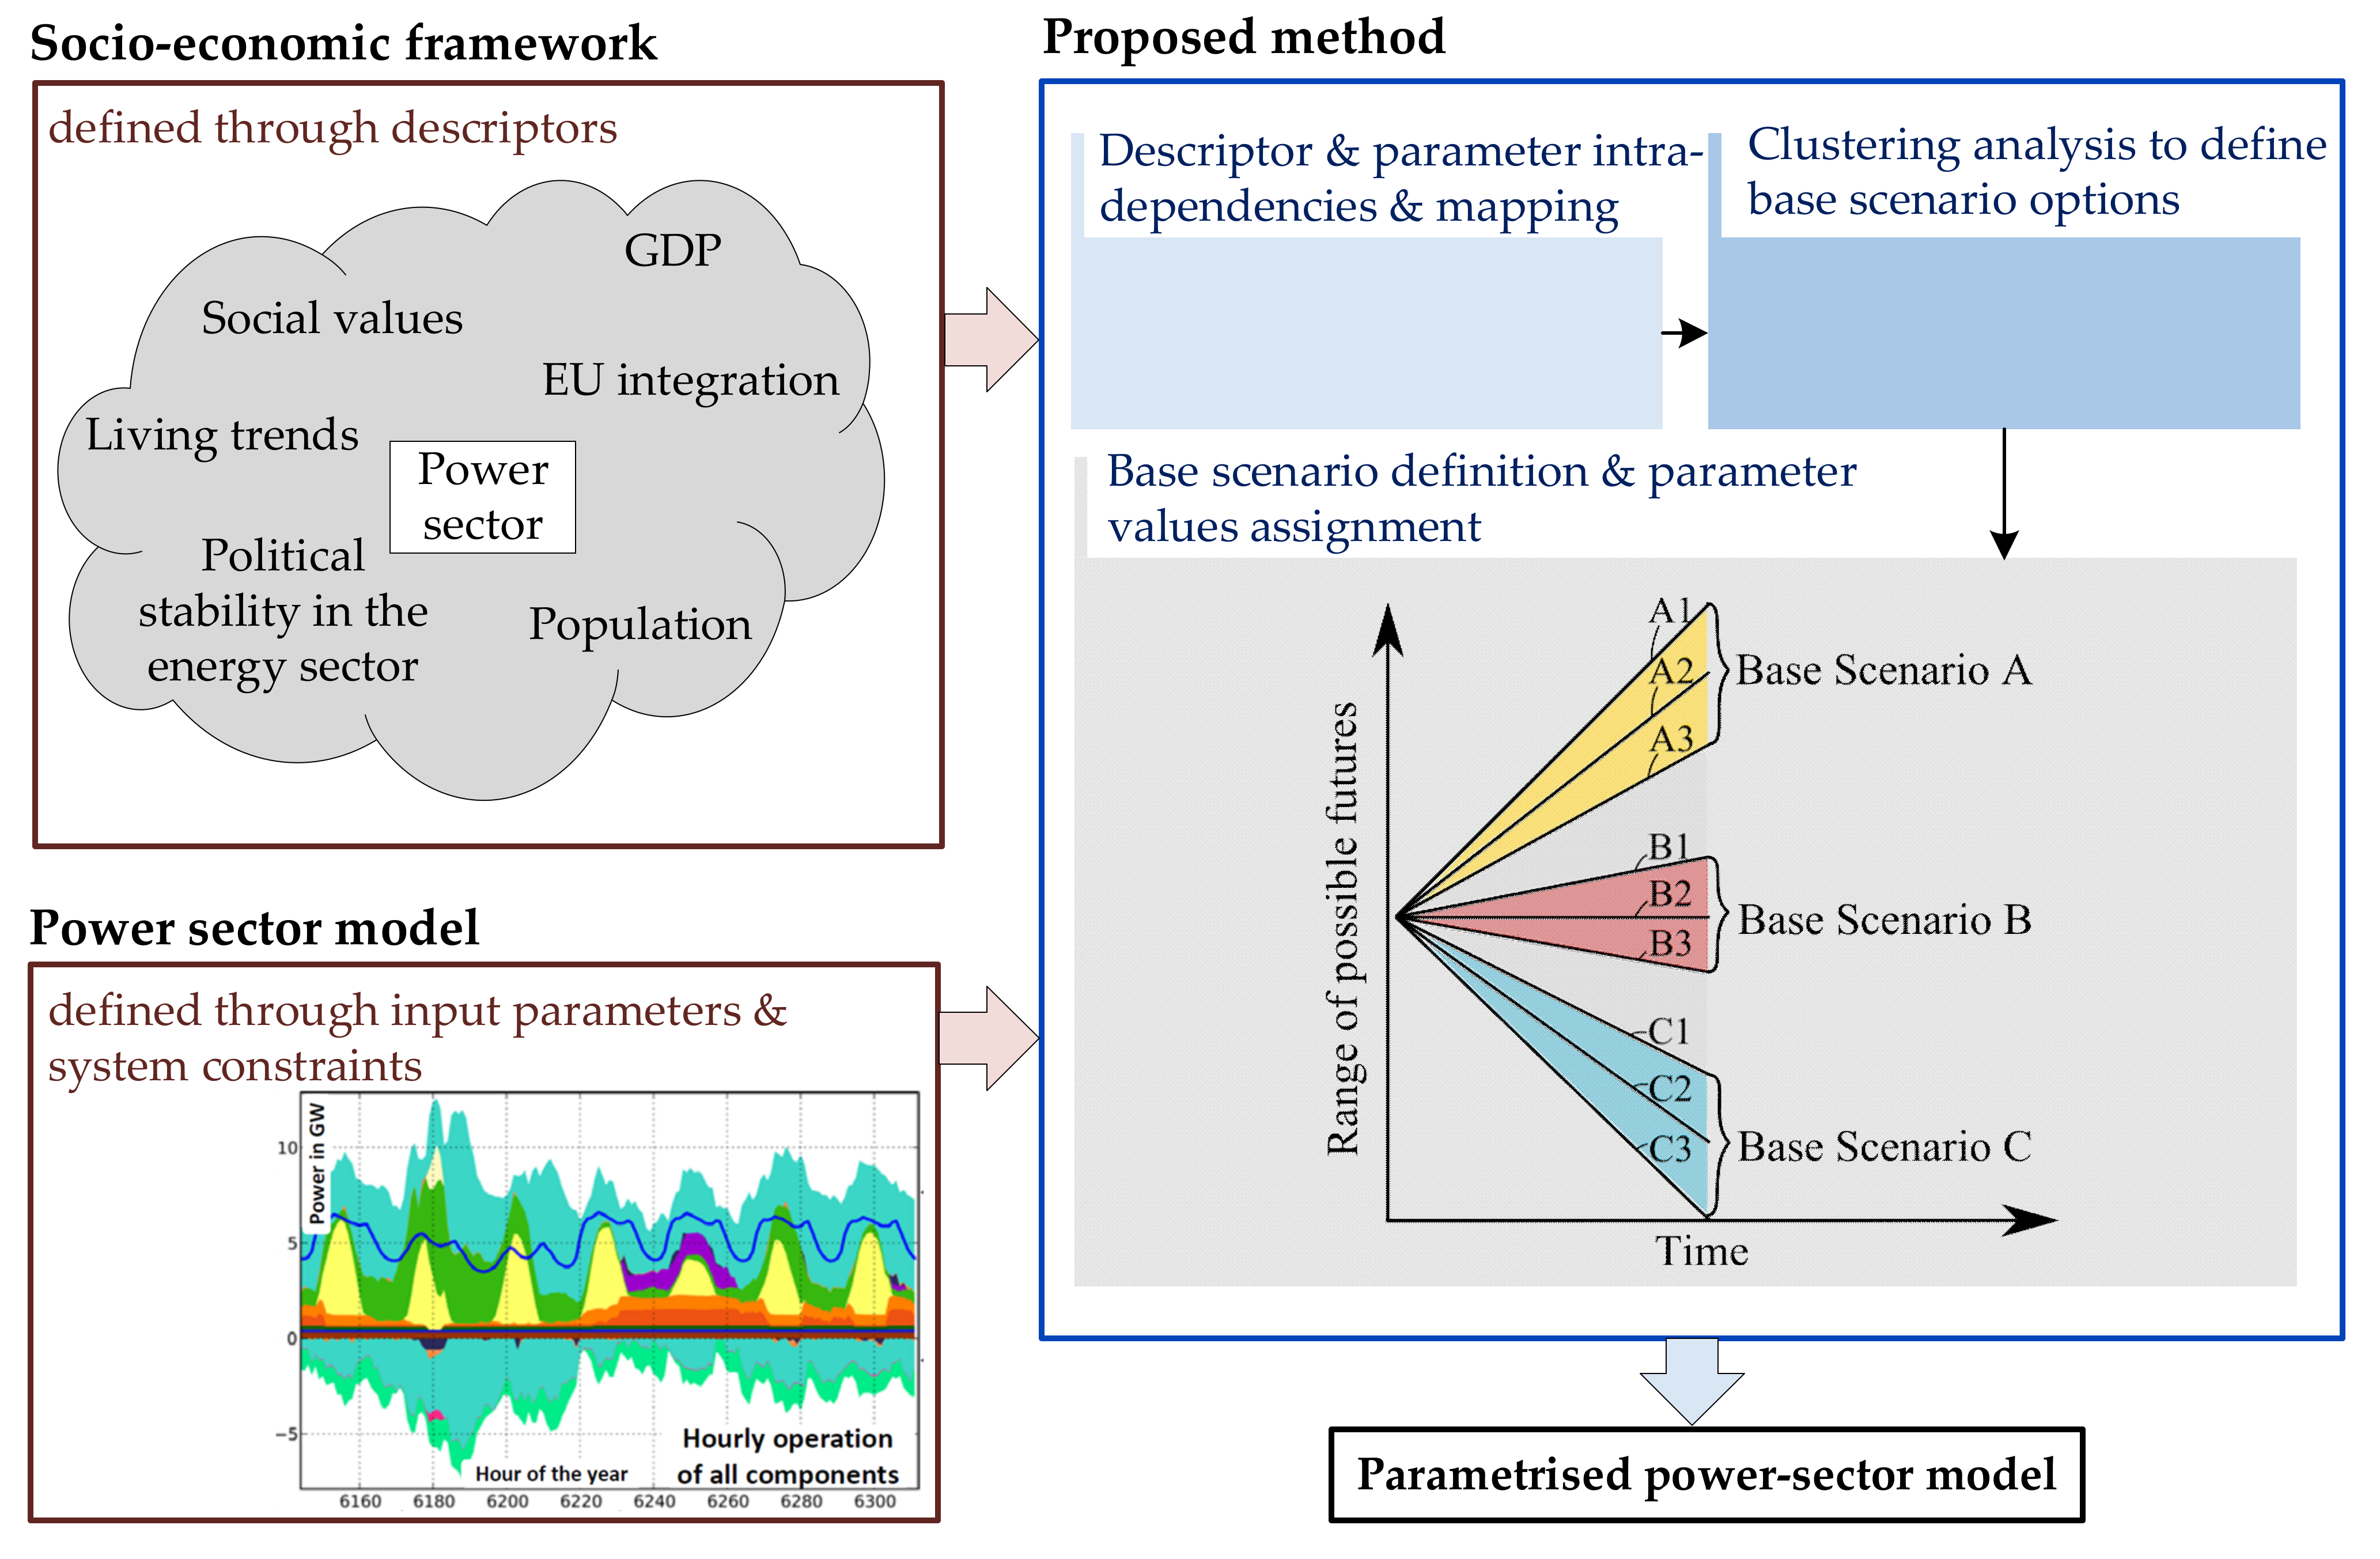
Given: (1) The lack of consistency and plausibility of some of the previously obtained results when focusing on technical system properties only; and (2) The existence of methods for producing consistent framework scenarios, in the present study, we propose linking the definition of the constraints and the relevant parameters of PSMs to social-, political- and economic-development scenarios for a consistent PSM parameterisation. How can such framework scenarios be applied to power-sector modelling studies transparently and reproducibly? We propose using complexity-management methods for incorporating the framework-scenario descriptors and their intradependencies into high-resolution power-sector modelling, as outlined in
Figure 1. We refer to this approach as “socio-technical power-sector modelling”. To demonstrate it, we ask a showcase research question: How does the power system need to develop to fulfil the European political goals until 2050? Such a development may occur in a number of framework scenarios, but may also be impossible in others (e.g., in a world in which the European Union falls apart and no agreement can be achieved between the member states). Additionally, such a question has a regional focus, rather than a global focus, and may be best answered with the help of high-resolution PSMs. In general, specific research questions may require a specific narrative (i.e., they may only be possible in the context of a subset of framework scenarios that can be described with a narrative). For this purpose, framework scenarios that are specific to power or energy systems with a geographical focus, such as [
18], can be developed and used in conjunction with PSMs. Apart from improving the consistency of the modelled scenarios, the proposed method for parameterising PSMs with the help of framework scenarios also allows modellers to develop their own scenario narratives on the basis of the research question and the relevant subset of framework scenarios. Finally, because of the more systematic link between the sociopolitical framework and the model results, the proposed method facilitates the derivation of policy recommendations. To the best of the authors’ knowledge, no previous methods have been proposed that allow modellers to develop their own scenario narratives, and no standard approach has been suggested to ensure that PSMs are consistent with the specific framework scenarios that are tailored to specific regions, or to answer a specific question of interest.
To provide further context with regard to the value and novelty of the proposed method, the main differences with the existing methods that are used in related fields are highlighted in this paragraph. Climate-change-impact, adaptation, and mitigation scenario analyses with integrated assessment models (IAMs) is a field where framework scenarios are commonly used. Global framework scenarios, which are called “Shared Socioeconomic Pathways” (SSPs) [
19,
20], provide a common basis for different IAMs. To generate a matrix of plausible framework scenarios, the CIB method is applied. These scenarios are then clustered into several narratives (i.e., the SSPs). Schweizer [
21] reflects on the CIB method by stating that it can identify the plausible pathways that may be “counterintuitive yet policy-relevant”, and that IAMs have shown the “quantitative realisations” of such pathways. The methods that are applied in IAMs for deriving the model parameters from the SSPs are, e.g., “demographic and economic assumptions […] in combination with technology and policy assumptions derived from the SSP narratives” [
22]. Such assumptions can include empirical correlations or algorithms of parameter-driver relationships; for example, the energy demand (model parameter) depending on the GDP per capita (SSP descriptor), as described by the International Institute for Applied Systems Analysis (IIASA) [
23] and the Netherlands Environmental Assessment Agency [
24]. While these methods are well developed and established for IAMs, they have not been used in PSMs. Furthermore, the methods that are available from the IAM community link the SSP descriptors to the IAM parameters that, because of their global scale, can be different from the PSM parameters; for example, in terms of the technological, spatial, or temporal details. Finally, although some model parameters are obtained through empirical correlations or algorithms of parameter-driver relationships, some parameters are not, and the proposed method may be transferable for a more consistent definition of the parameters with more complex or indirect correlations.
This study is organised as follows:
Section 2 describes the general methodology. In
Section 3, each step is exemplified in a case study, which shows how the development of the power-generation, storage, and transmission capacities and operations in European countries can be influenced by the course of the social, political, and economic frameworks in the coming three decades. In
Section 4, we discuss the limitations and perspectives of the methodology, and
Section 5 concludes this study.
2. Methodology
A research question to be worked on with a PSM typically involves an area under investigation, a time frame, and the question itself (e.g., “How can the Canary Islands be supplied with 100% renewable electricity by 2050?”, or “What is the role of hydrogen for a renewable-resource-based electricity supply in Europe in 2060?”). The PSM then needs to be parameterised and the relevant system constraints defined accordingly. To do so, the modeller needs to ask questions such as: “What will the power demand be in a system that enables such a development?”; “How will technologies develop in the course of the considered time frame?”; “Will the population approve of the capacity expansion or is it likely that there will be resistance to the associated land consumption?”. The answers can be interdependent. By leveraging framework scenarios together with complexity-management methods, the improved consistency of the model parametrisation can be ensured.
Subsets of framework scenarios can be identified that are particularly relevant for a research question. Such a subset defines a “base scenario”, as shown in
Figure 1. Within one base scenario there are a number of key descriptors (e.g., population development or fuel costs) with the same state (e.g., decreasing population development or increasing fuel costs). Other descriptors can assume a range of states, as long as these are consistent. These combinations are “base scenario variants”. In
Figure 1, this concept is illustrated with three base scenarios (A, B, and C) and their particular variants (1, 2, and 3). As described in [
25], this type of specialised conceptual approach is suitable for problems that deal with deep uncertainty, where multiple plausible futures exist that cannot be characterised with probability distributions. Since the framework descriptors are mapped onto the PSM parameters, the influenced model parameters can be identified, and their values are set accordingly.
The suitability of complexity-management methods, and particularly matrix-based methods, for this problem is introduced in
Section 2.1. How the framework-descriptor and PSM-parameter relationships can be represented in matrices is explained in
Section 2.2. On the basis of these, how to find the base-scenario options and how to define a base scenario are described in more detail in
Section 2.3 and
Section 2.4. The terminology that is used in this paper to refer to the various system components is summarised in
Table 1 to provide a common reference. Some of these concepts are introduced in further detail in the following subsections.
2.1. Complexity Management for Socio-Technical Power-Sector Modelling
Complexity-management methods are widely used, for example, in product development, in order to support the systematic management of projects, product portfolios, and organisational and communication flows [
26,
27]. They can also be applied to systematically analyse and manage other complex systems. Complex systems consist of various system elements and their correlations, which define the system structure and function. System properties can be described in matrices by recording the relations between the system components, such as the functional or geometrical dependencies. This type of property (that is, the existence or nonexistence of a link) can be represented in a binary matrix. Additionally, other types of relationships (for example, with qualitative differences in strength) that may be rated, for example, from 0 to 3 can be recorded so that the matrix entries assume numerical values.
Two basic types of matrices can be distinguished: (1) A design structure matrix (DSM) that contains intradependencies (dependencies within a domain); and (2) A domain-mapping matrix (DMM), which represents the interdependencies between two domains. Related DSM and DMM matrices can be grouped to form a multiple-domain matrix (MDM), which is a matrix of matrices. DSMs and DMMs are generally obtained through expert assessments and system analyses. Within an MDM, a DSM can be derived from a given and related DSM, and a DMM through matrix multiplications, to obtain the indirect intradependencies.
How Can These Methods Be Leveraged to Combine Framework Scenarios and a PSM?
The power system is a complex system that is represented in this study through two domains: one domain that comprises the framework descriptors, and one domain that comprises the PSM input parameters. A multiple-domain matrix approach can be applied to represent the intradependencies and interdependencies between these domains. Here, we propose a method to leverage this structured representation of how the framework descriptors and the PSM parameters are interlinked. This allows to more systematically and consistently parametrise power-sector models in accordance with framework scenarios.
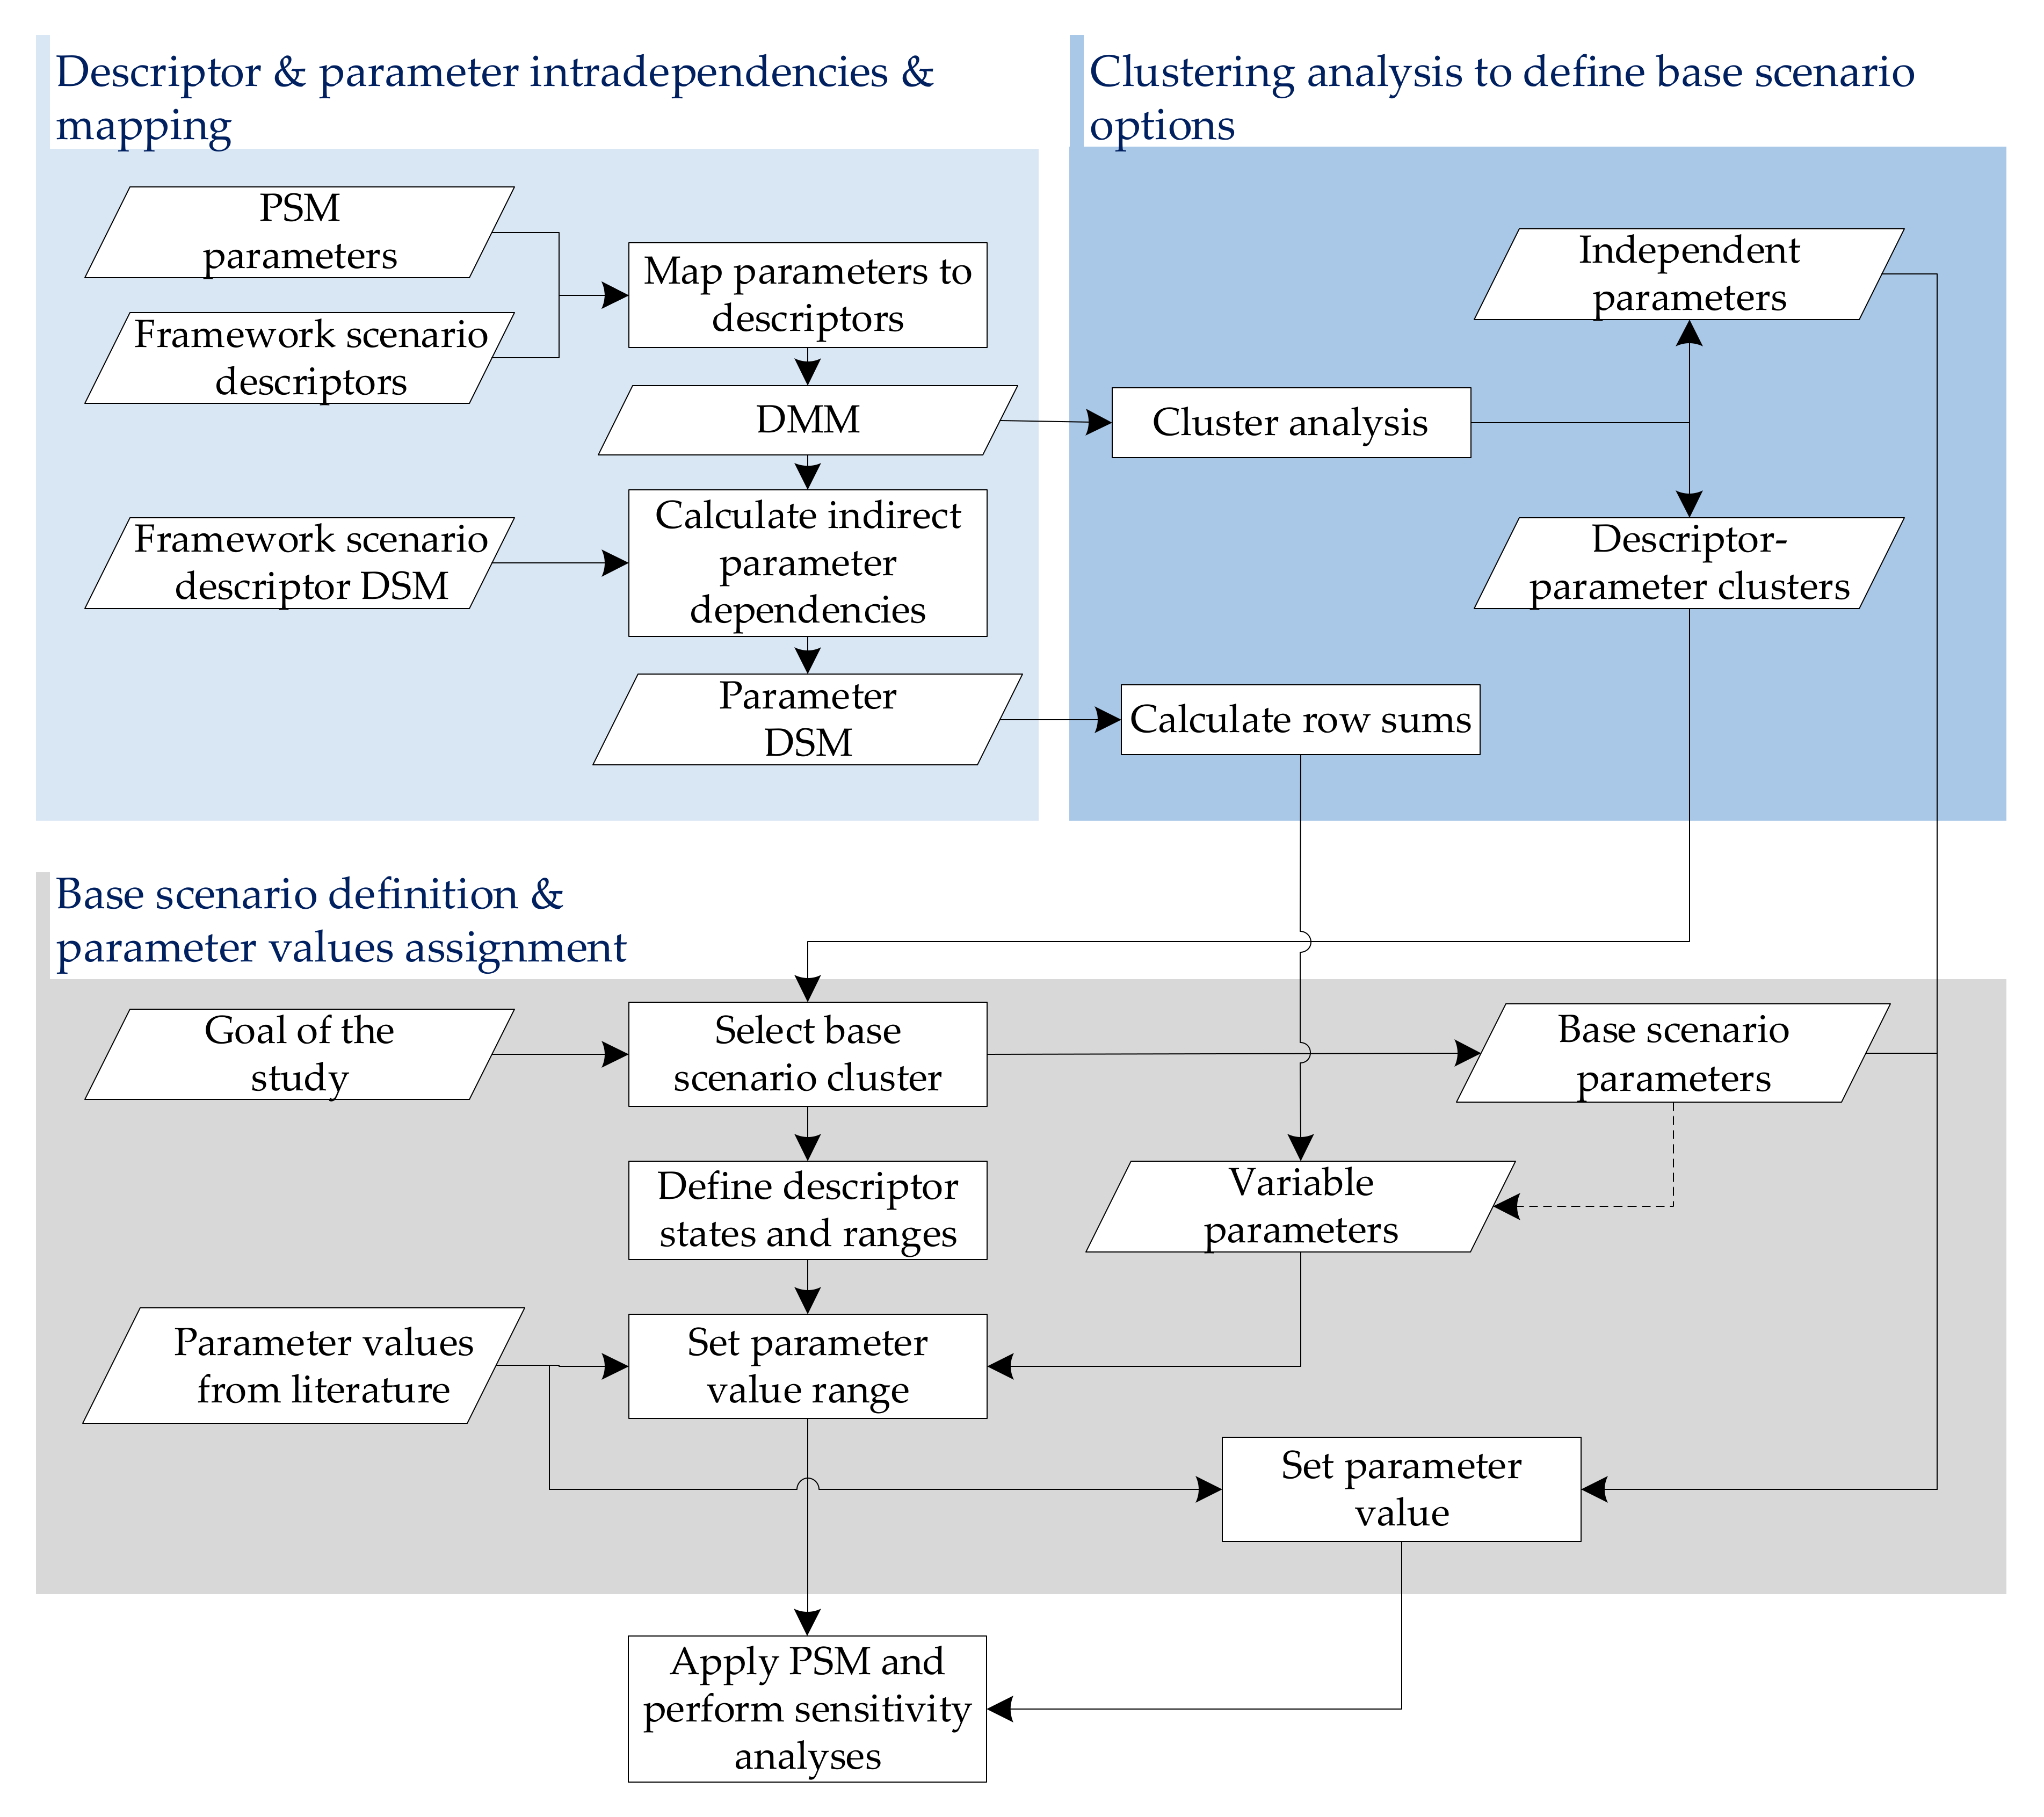
Figure 2 illustrates the inputs, outputs, and work steps of the proposed method: In the first step, the descriptor and parameter intradependencies and mapping are defined (
Section 2.2). Then, the descriptors and parameters are clustered to find alternative base-scenario options (
Section 2.3). Finally, the base-scenario cluster and descriptor states most suitable for the study at hand are chosen, and values are assigned to the corresponding parameters (
Section 2.4). The process is described in detail in the following subsections.
2.2. Descriptor and Parameter Intradependencies and Mapping
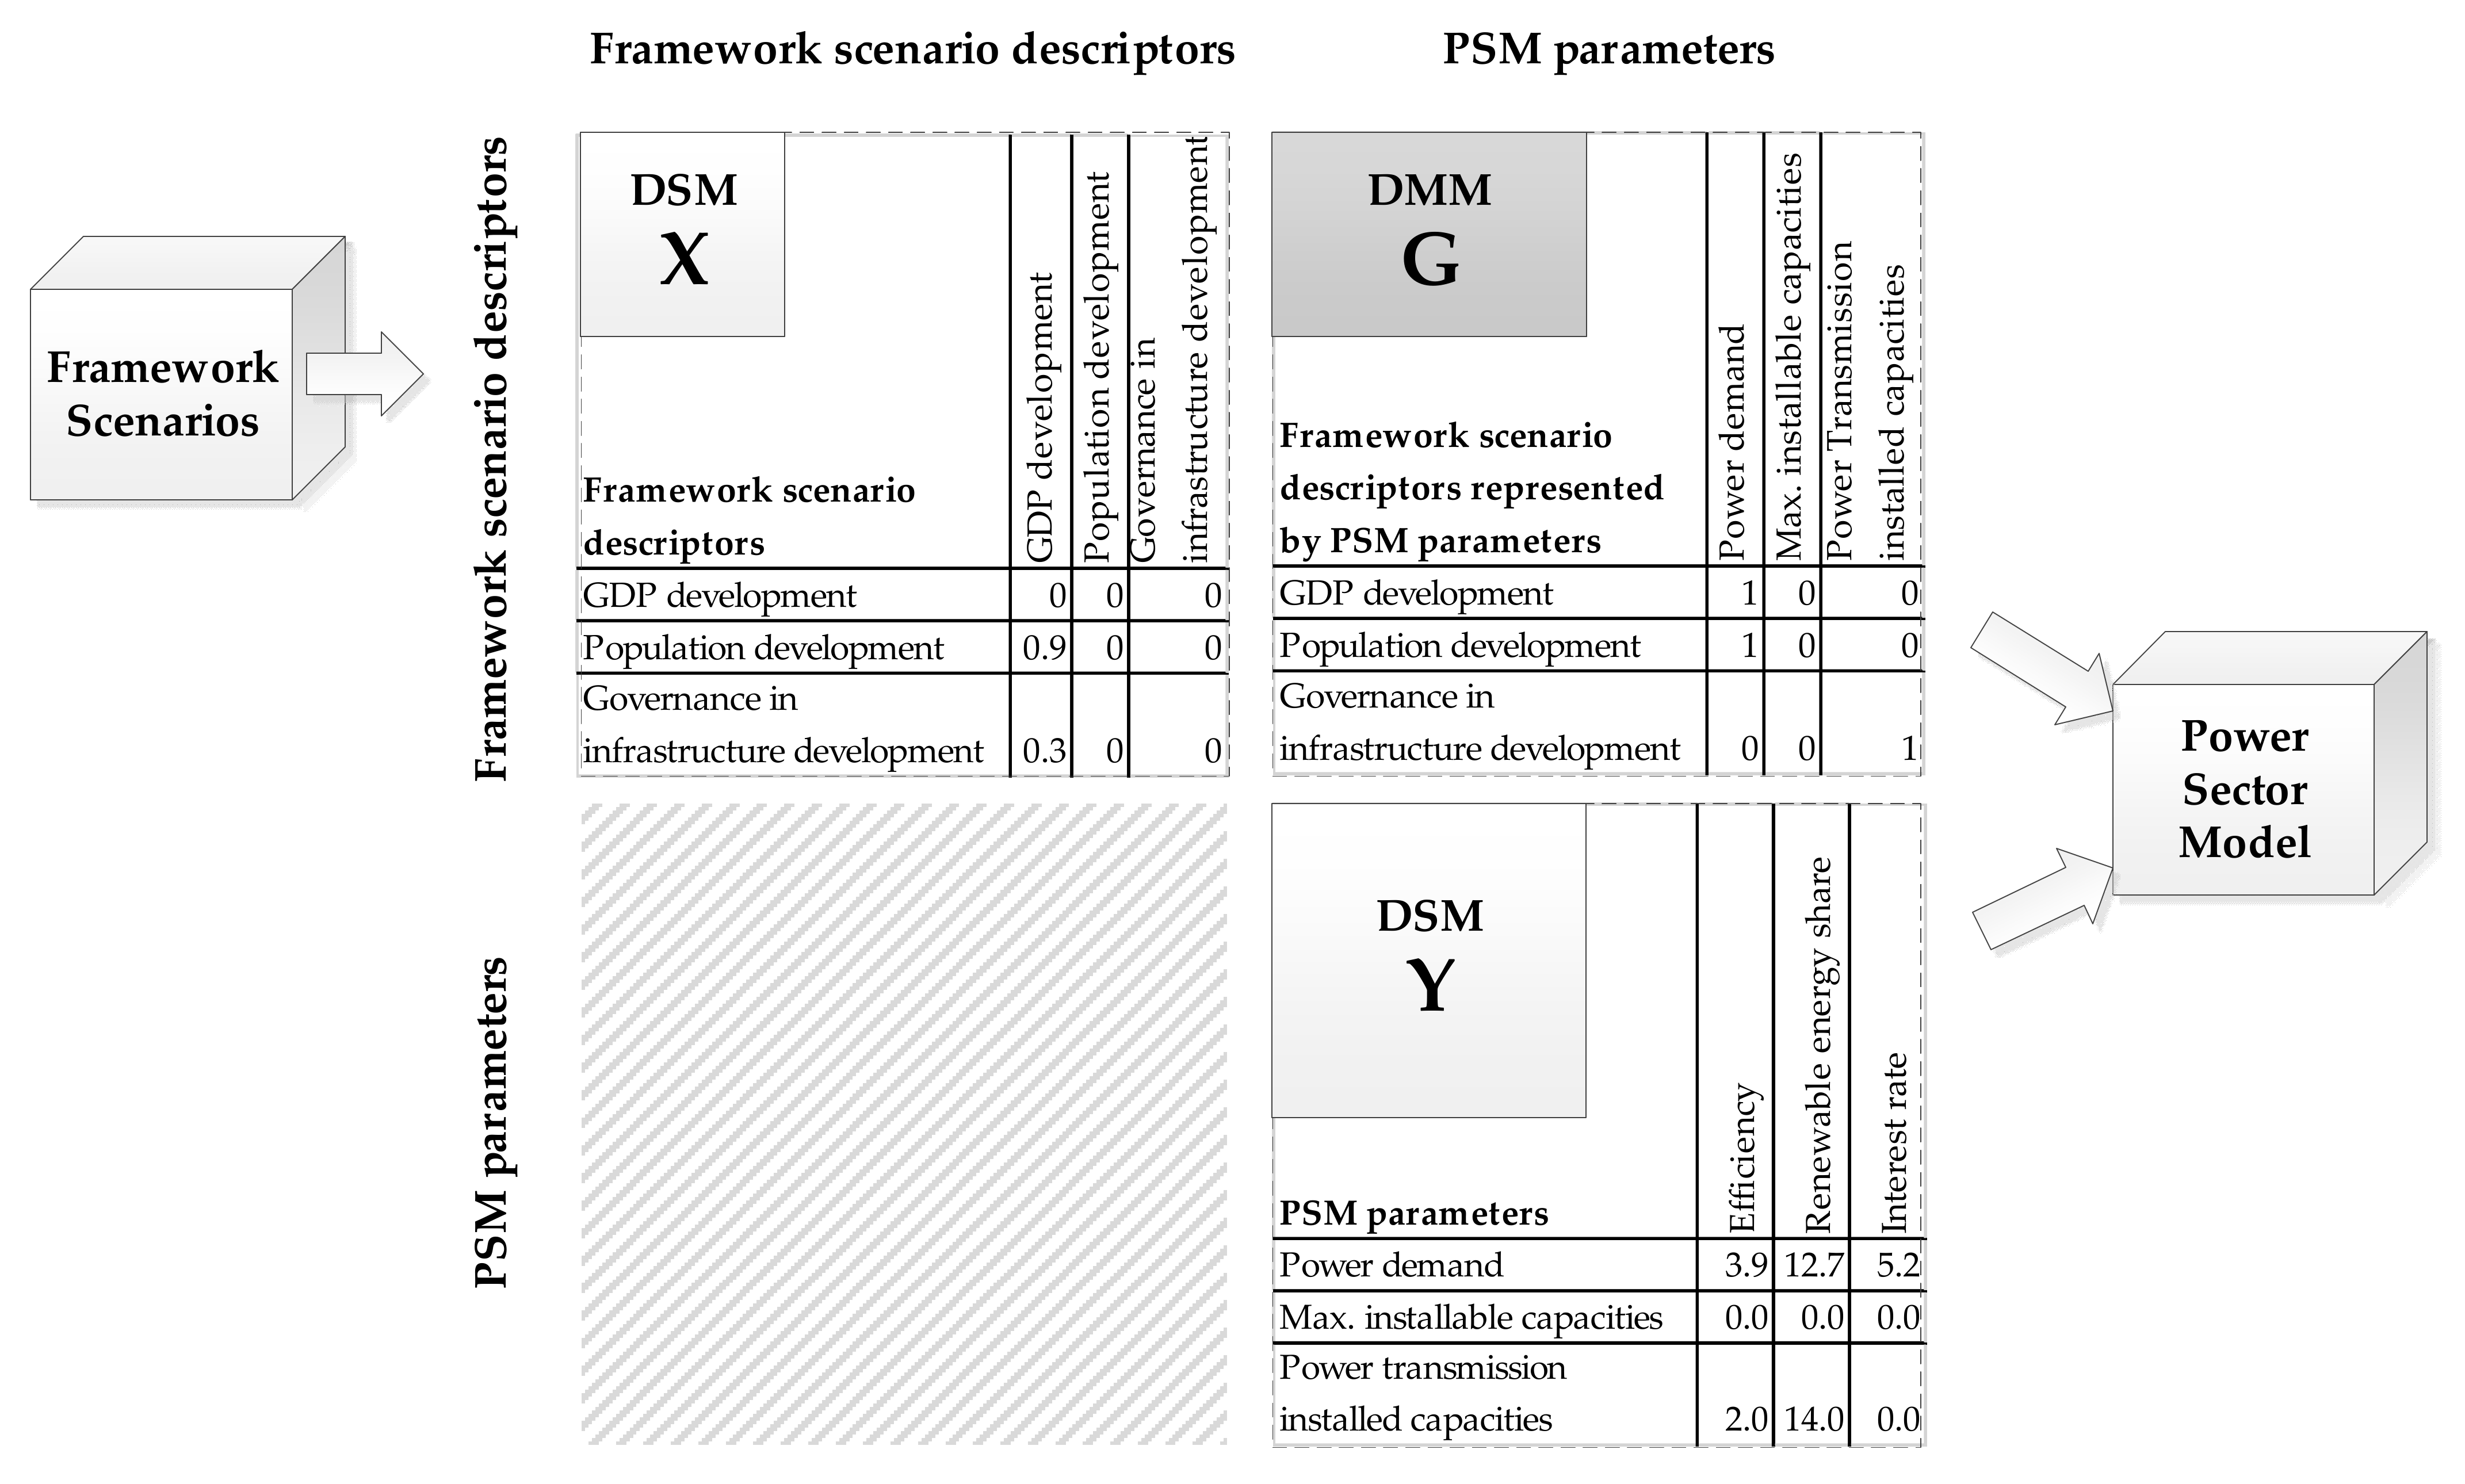
To visualise and record the links between the framework-descriptor domain and the PSM-input-parameter domain, a multiple-domain matrix approach is applied, as shown in
Figure 3. Domain intradependencies can be represented in their respective DSMs. A mapping of the descriptors onto the PSM parameters can be represented in a DMM, which expresses the interdependencies between these two domains.
The descriptor DSM (
X in
Figure 3) can be derived from the CIB method, which is used to define consistent framework scenarios. It aims to represent how, and how strongly, the descriptors are interlinked. It can be obtained through aggregating various single-expert-assessed cross-impact matrices, within which the sum of the moduli of the influence values of the different descriptor states for each descriptor pair is given. This means, for example, that if descriptors A and B have three possible states each, the experts assess how each state of A will impact each state of B, with a numerical value that is based on the strength of the impact. For the purposes of deriving the DSM that shows the descriptor intradependencies, the influences represented in this 3 × 3 matrix are aggregated into one positive value. Since each descriptor pair is assessed by more than one expert, the average value across the expert assessments is calculated. By doing this for all the descriptor pairs, a numerical DSM results, in which the averaged descriptor intradependencies are stored. A qualitative analysis of this matrix allows for the overall trend recognition. High numerical values indicate the strong impact of one descriptor on another; high row sums indicate an overall high impact of a descriptor on the framework.
The DMM (
G in
Figure 3) represents the mapping of the descriptors onto the PSM parameters (that is, it documents which PSM parameters represent a given descriptor). This is a matrix that indicates the existence or nonexistence of a relation, and it is therefore filled with ones and zeros. This is performed by comparing independent assessments and the consequent discussion and adaption of the mapping matrix by several power-sector modellers. The question that power-sector modellers have to answer is: “Will changes in framework descriptor, “x”, be represented through changes in the model parameter “y”?” It is recommended that as many modellers as possible participate in this exercise in order to improve the robustness of the method.
In the PSM-parameter DSM (
Y in
Figure 1), indirect correlations are derived from the given matrices through matrix multiplication, so that the intradependencies between the model parameters can be obtained according to Equation (1)—on the basis of the theory that is presented in [
26].
That is, for example, as recorded in , the “GDP development” descriptor may be represented in the model through the “Annual power demand” parameter, but also through the “Interest rate” parameter. Then, there will be an indirect dependency of the “Annual power demand” and the “Interest rate” since they both represent “GDP development”. If these two parameters were additionally both representing another common descriptor, then their indirect dependency would be stronger than if they coincided in the representation of one parameter only. Simultaneously, the “GDP development” is recorded to have an impact on multiple descriptors in . This results in parameters that represent the “GDP development” showing high intradependencies. Finally, “Interest rate” also represents other descriptors, such as the “Global development” descriptor, which, in turn, is represented through a number of PSM parameters. Because the “Interest rate” represents both the “GDP development” and the “Global development”, there are also parameter intradependencies between the parameters that represent these two descriptors, such as the “Annual power demand” and “Fuel prices”. Overall, this numerical matrix is relevant for the power-sector scenario definition, as it provides information on how the PSM parameters are related through the descriptors. Since Y is calculated from and G, two effects are represented in particular: (1) Because of the relationships stored in G, the model parameters that represent similar descriptors will show high intradependencies; (2) Because of the dependencies stored in X, these values will be higher if the parameters represent active descriptors. Active descriptors strongly influence other descriptors or influence a large number of descriptors.
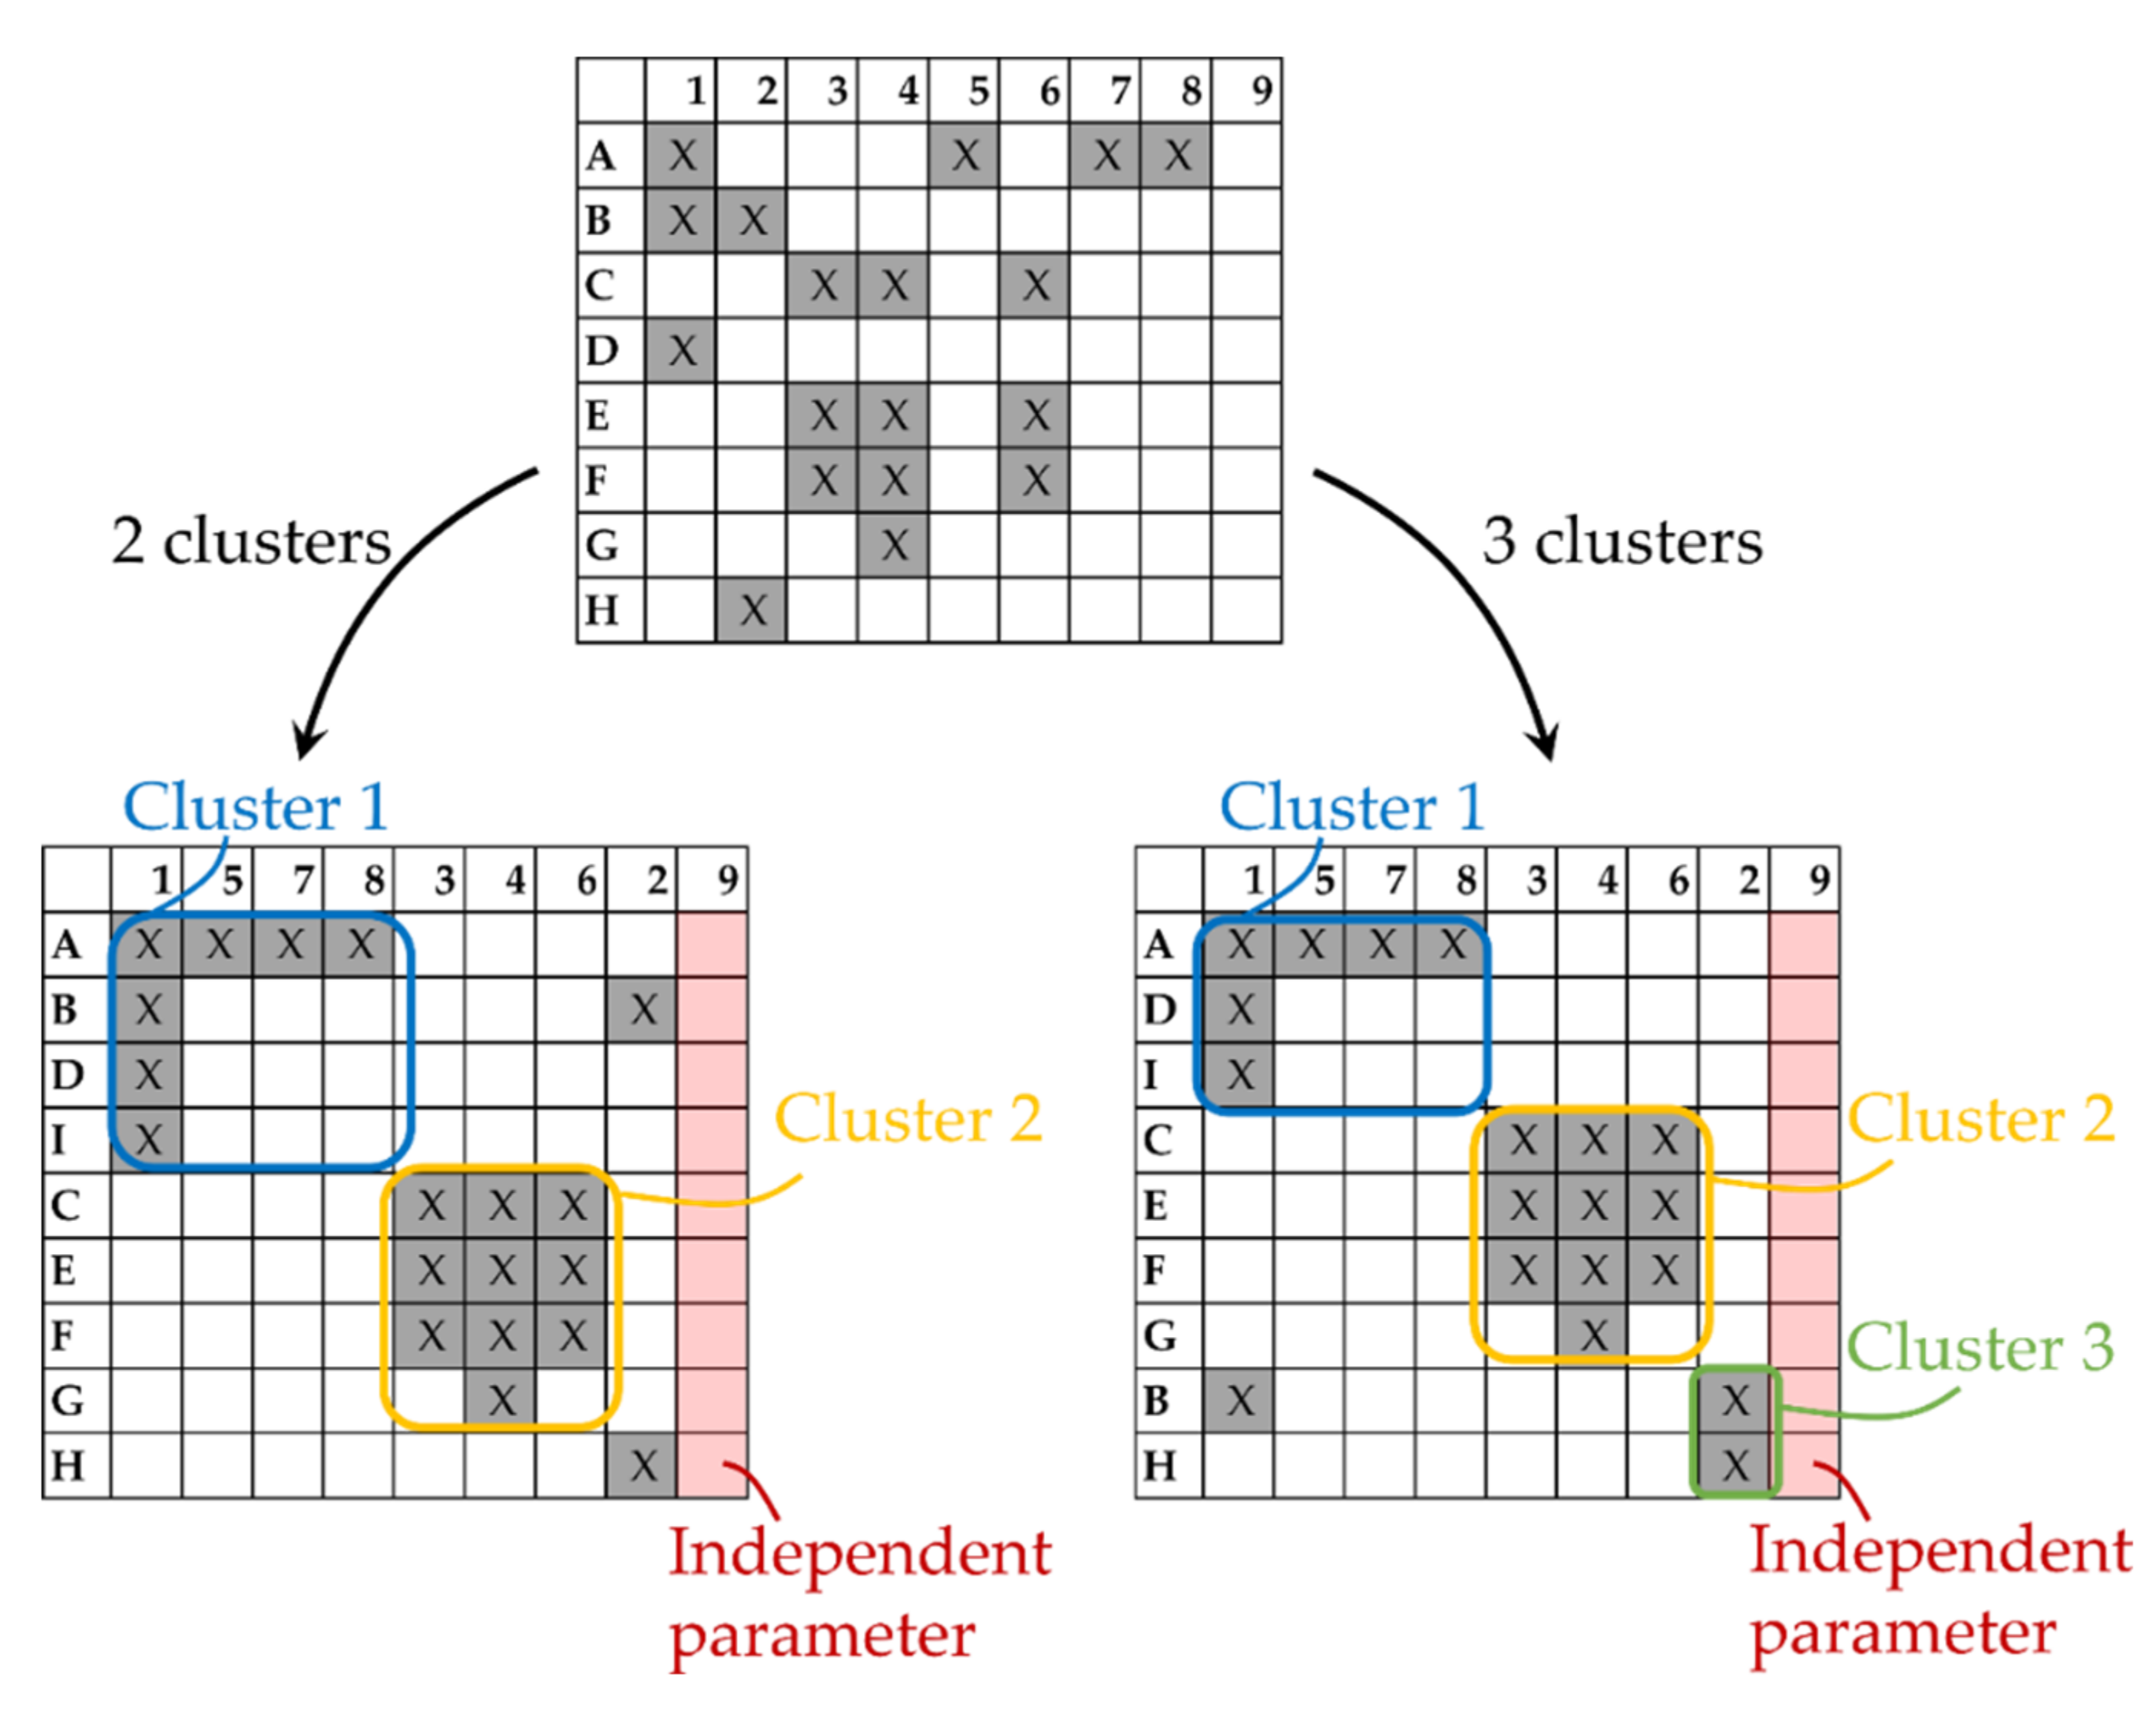
2.3. Clustering Analysis to Define Base-Scenario Options
A base scenario (i.e., A, B, or C in
Figure 1) is described by using the framework descriptors and their states. It represents a set of possible futures on a common basis. What characterises the common basis is a subset of descriptors that are highly interconnected so that varying the state of one is not possible without varying the state of the others. Simultaneously, other descriptors are not, or are only weakly, interconnected with this subset. Varying the states of these other descriptors does not change the common basis, which results in the base-scenario variants (1, 2, and 3 in
Figure 1). To identify the descriptor subsets that are highly interconnected, a clustering approach [
28] is employed. This approach could be applied to the framework-descriptor DSM; however, to ensure the possibility of defining scenarios for socio-technical power-sector modelling, the goal is to recognise groups of PSM parameters that represent similar descriptors. Hence, the clustering approach is applied to the DMM, where the mapping of the parameters onto the descriptors is recorded.
Figure 4 presents an illustration of this process. The result of this process is sensitive to the predefined number of clusters and it may require a few iterations to establish suitable and meaningful clustering.
Assuming that the clusters of the DMM group contain highly interconnected descriptors, each of the clusters can be used to define a base scenario. In our case study, this assumption proved valid: by consulting the framework-scenario developers, we found that the descriptors within a DMM cluster were highly interconnected, while the descriptors in different clusters were relatively independent from each other and could be varied. The variation in the descriptors outside of the chosen base-scenario cluster resulted in a number of base-scenario variants.
2.4. Base-Scenario Definition and Parameter-Value Assignment
The cluster that contains the descriptors and parameters that are most suitable for investigating a specific research question is selected by the power-sector modellers to define the base scenario.
2.4.1. Base-Scenario Parameters and Descriptors
The values for the base-scenario parameters are defined such that they represent the goals of the study. Not all parameters in the base-scenario cluster are assigned a value, but all parameters are required to represent the scenario of interest. The corresponding base-scenario-descriptor states are then derived. These are then cross-checked with the set of plausible framework scenarios for consistency. See the applied example in
Section 3.3.1.
2.4.2. Variable Parameters
Variable parameters are parameters that are not part of the base-scenario cluster, and they represent descriptors that can be assigned different states within the base scenario. They are, therefore, parameters that can be assigned a range of values while being consistent with the base-scenario assumptions. They represent the base-scenario variants and are therefore used for sensitivity analysis. Refer to
Section 3.3.2 to see the applied example.
Variable parameters are obtained from the parameter DSM (
in
Figure 3), which is calculated by the matrix multiplication of the descriptor DSM (
) and the DMM (
). The derived parameter DSM (
) is used for this purpose because variable parameters should be selected so that the range of the modelling results represents the full range of the base-scenario variants. If the DSM is only derived from the DMM (
), the DSM only contains information on which parameters represent a larger or lower number of descriptors. However, to be able to select relevant variable parameters for a sensitivity study, those with the largest expected impact on the modelling results should be selected. When deriving the parameter DSM from the DMM (
) and the descriptor DSM (
), the resulting numerical values also reflect whether the parameters represent active descriptors. The more active the descriptor, the higher the values recorded in the DSM (
) for the parameter that represents it. For this reason, we assume that, if the parameters show a high value for the sum of the row values of the DSM (
), which indicates that they represent active descriptors, the variation in this parameter can be expected to have a larger impact on the model results in terms of the deviation from the base-scenario results. This will, therefore, be a suitable parameter for the sensitivity analysis.
Each variable parameter represents a set of framework descriptors. Therefore, the variability of the single parameters must be defined consistently with the variability of the corresponding framework descriptors within the studied base scenario. In this case, the variable descriptors are all framework descriptors that are represented by the variable parameter, as recorded in
G, and which are not part of the base-scenario descriptors. Different strategies that are based on the variability of the descriptors can be used for this purpose. The systematic approach that is applied in this study consists of defining a point system to describe the maximal variability of the descriptors within a base scenario (e.g., from A1 to A3 in
Figure 1) with respect to their variability in the whole set of framework scenarios (e.g., from A1 to C3 in
Figure 1). For instance, if demand is represented by just two descriptors (population and GDP development), each of which can take three states (decreasing, stagnation, and increasing), each of these states is given 0, 1, and 2 points, respectively, which represent their effect on the power demand. The theoretical point range for these two descriptors is from 0 to 4 points. The occurrence in the whole set of framework scenarios might be from 1 to 4 points, if, for instance, no expert predicted a decrease in the population. Analogously, the occurrence in the base scenario could be 2 to 4 points; for example, a decrease in the GDP is not found to be compatible with the assumptions that are made for that base scenario. In this case, a decrease in the power demand could not be considered within this base scenario. If the maximum and minimum values for the power-demand development are taken from the literature, then the maximum values would be reached in the high-demand case, but the minimum values should not be assumed for the low-demand case. This is due to the descriptor combination that results in 1 point for the power demand not being part of the considered base scenario.
2.4.3. Independent Parameters
These are model parameters that are not found to represent any descriptor and, thus, do not vary with the social framework. The values are constant across all scenarios. Independent parameters can, for example, be parameters that describe technology-specific characteristics (e.g., the amounts of existing capacities). They can be identified from the DMM because they will be characterised by parameters where no relationship to a descriptor is found. This case is represented in
Figure 4 with the columns highlighted in red.
Some parameters are not fixed through the base-scenario definition, nor do they have a strong influence on other parameters. Varying their states can be expected to not significantly vary the model outcomes. For example, such parameters may represent exactly one descriptor that is not strongly interconnected with other descriptors, such that it can be varied independently from the rest. These parameters can be assigned fixed values, and they are therefore also classified as independent parameters.
The independent parameters will be assigned values on the basis of the state-of-the-art literature and expert assessment of the power-sector modellers.
3. Case Study: European Power-System Development until 2050
To illustrate the proposed methodology, we pose the following research question: “How does the power system need to develop to fulfil the European political goals until 2050?” (i.e., “How much power generation, storage, and transmission capacity is required, where should it be built, and how should it be operated?”). This research question was chosen as it was a task in the research project, “Energy-Trans”, during the scope of which we developed the presented methodology. However, as the methodology is simply based on the links and relations between the PSM parameters and the framework-scenario descriptors, it can be applied for any research question that can be answered with a PSM if appropriate framework scenarios are available.
3.1. Descriptor and Parameter Intradependencies and Mapping
3.1.1. Framework Scenarios
Weimer-Jehle et al., applied the CIB method to generate a first set of framework scenarios for the energy-system development in Germany, which resulted in 211 consistent scenarios. These framework scenarios were constructed by using 39 descriptors that reflected international, economic, political, societal, and cultural topics with an impact on energy—as well as topics directly related to energy.
Table S1 in the Supplementary Material contains a list of these framework-scenario descriptors. A detailed description of the descriptors and their future states are defined by Weimer-Jehle et al., in [
29]. Interpreting the whole set of scenarios, a variety of different societal-development scenarios were identified, including less dynamic societies, strongly liberalised and market-oriented societies, as well as societies that are changing towards postmaterial values [
17]. Each of these higher-level developments is linked to a different performance with respect to the energy transition, with variations within these. These scenarios are assumed to be transferable to the European framework development by considering the following: Some descriptors refer to international development and are, therefore, transferable; some descriptors are country specific, but are assumed to develop synchronously because of the countries’ economic–political linkages (e.g., GDP); and some can vary between countries (e.g., consumer behaviour). This is neglected here because the variations are assumed to be moderate within the European integration that is simulated in the base scenario that is used as a case study. The descriptor DSM derived from the CIB method data can be found in
Table S3 in the Supplementary Material.
3.1.2. Power-Sector Model—REMix (Renewable-Energy Mix)
The REMix model that was developed at the DLR is used in this study to simulate the power sector in Europe. It is a bottom-up deterministic program that is implemented in the GAMS (general algebraic modelling system). By solving a linear optimisation problem for cost minimisation and simultaneously considering the technological restrictions, REMix calculates the capacity expansion and operation of different technologies to ensure the coverage of the demand. Its modular structure allows for different factors and capacity-expansion possibilities to be considered, depending on the goal of the study. In the
Supplementary Material, Table S2 lists the basic PSM parameters.
Model runs were performed for the years 2020, 2030, and 2050, with an hourly resolution by using a myopic approach. This means that the modelled time frame (2020–2050) is divided into subframes (2020, 2030, and 2050) so that a continuous optimisation without a substantial increase in computational effort is achieved. The model results of one optimisation interval are forwarded as the inputs for the subsequent model run. With this approach, a limited-foresight situation is simulated, which accurately represents the actual decision environment [
30,
31], and which does not unrealistically exclude the lock-in effects of conventional technologies that can result in increased system costs [
32]. The myopic approach is well suited for the analysis of the possible development paths [
33] and of abrupt events along these paths [
34]. The possibility of using the myopic approach in the REMix model is implemented as part of this study. The implementation is described in
Section B in the Supplementary Material.
The spatial resolution is limited by the data availability and the computational effort of the power-sector simulation. For this reason, selected countries in the European study area were aggregated, which resulted in the following regions: Austria; BeNeLux (Belgium, Luxembourg, The Netherlands), Germany, Nordel (Denmark East, Finland, Norway, Sweden), Denmark_W (Denmark West), France, PolCzeSlk (Poland, Czech Republic, Slovakia), Iberia (Portugal, Spain), Italy, Switzerland (Switzerland, Liechtenstein), and UK_IE (UK, Ireland).
An introduction to the REMix model, and a detailed explanation of all the assumptions and of all the used numerical values that can be published, are included in
Supplementary Material Sections B–E. Detailed descriptions of the mathematical equations that model power-generation, storage, and transmission technologies, as well as of basic input data, such as the hourly time series of the power-generation potential and demand, are available in [
8,
35,
36].
3.1.3. Multiple-Domain Matrix
The descriptor DSM is derived from the framework-scenario matrices, as described in
Section 2.2 and can be found in
Table S3 in the Supplementary Material. We set up a domain-mapping matrix by mapping the framework descriptors onto the model parameters (see
Table S4 in the Supplementary Material) in a discussion among the users and developers of the REMix model. The model parameter DSM can then be calculated from the descriptor DSM and the DMM.
3.2. Clustering Analysis to Define Base-Scenario Options
The DMM cluster analysis, as described in
Section 2.3 results in the descriptor-parameter clusters that are specified in
Table 2. Each cluster contains highly interconnected descriptors. A base scenario can be defined by selecting a cluster, identifying the key descriptors, and fixing their states with regard to the given research question.
3.3. Base-Scenario Definition and Parameter-Value Assignment
On the basis of the topic of the study, one of the clusters (see
Table 2) (that is, one set of highly interconnected descriptors and related model parameters) is used to fix the base scenario. Since the base scenario needs to represent the fulfilment of the current European political goals, it can best be described by the parameters that are contained in the cluster that we named “EU achievements regarding energy supply” in
Table 2.
3.3.1. Base-Scenario Parameters and Descriptors
The PSM parameters within the base-scenario cluster that need to be defined to represent the fulfilment of the European political goals are as follows:
National vs. European supply security—assured capacity;
National vs. European supply security—share of nationally generated in nationally used energy;
RE share;
Power transmission: installed capacities;
Power transmission: max. installable capacities;
Regions.
These parameters only represent a subset of the descriptors that are grouped within that cluster. These are called the “core descriptors”. The remaining descriptors that are grouped within that cluster are also represented by other parameters, which the modellers did not require to be fixed to represent this base scenario, or some of which were also assigned to other clusters. As shown in
Figure 4, the clustering approach is not perfect, and when defining a limited number of clusters, there can be relationships that fall outside of those main clusters. The resulting core descriptors and the combination of their states that align with the base-scenario assumptions are listed in
Table 3. This combination of descriptor states can be found in 25 out of the 211 framework scenarios, which allows for the variation of further descriptors. They defined the base scenario.
The base parameter values are set to represent the fulfilment of the political energy-transition goals. These include RE shares, according to the Roadmap 2050 [
37], an expansion of the transmission lines that are tailored to suit the market needs, according to the Ten-Year Network Development Plan (TYNDP) [
38], and the fulfilment of the EU integration of the electric system, with the achievement of self-sufficient supply security, but with single countries reaching their proposed demand shares of RE generation locally [
39]. The corresponding parameter values can be found in
Section C and Section D in the Supplementary Material.
3.3.2. Variable Parameters
By using the domain-mapping and the descriptor design structure matrices, we calculated the indirect REMix-parameter intradependencies (that is, the REMix parameter design structure matrix according to
Section 2.4). From this DSM, the following parameters show the highest impacts on the system by having the highest row sums of indirect dependencies, in the order given below. Since power-transmission capacities and the RE share are already base-scenario parameters, the remaining five parameters that define the base-scenario variants are employed for sensitivity analysis.
17, 18 Annual power demand;
6 Renewable-energy share;
23, 24 Power-transmission capacities (installed and max. installable);
1 Usable areas for renewable-technology deployment;
13 Fuel prices;
15 Interest rate;
14 CO2-certificate prices.
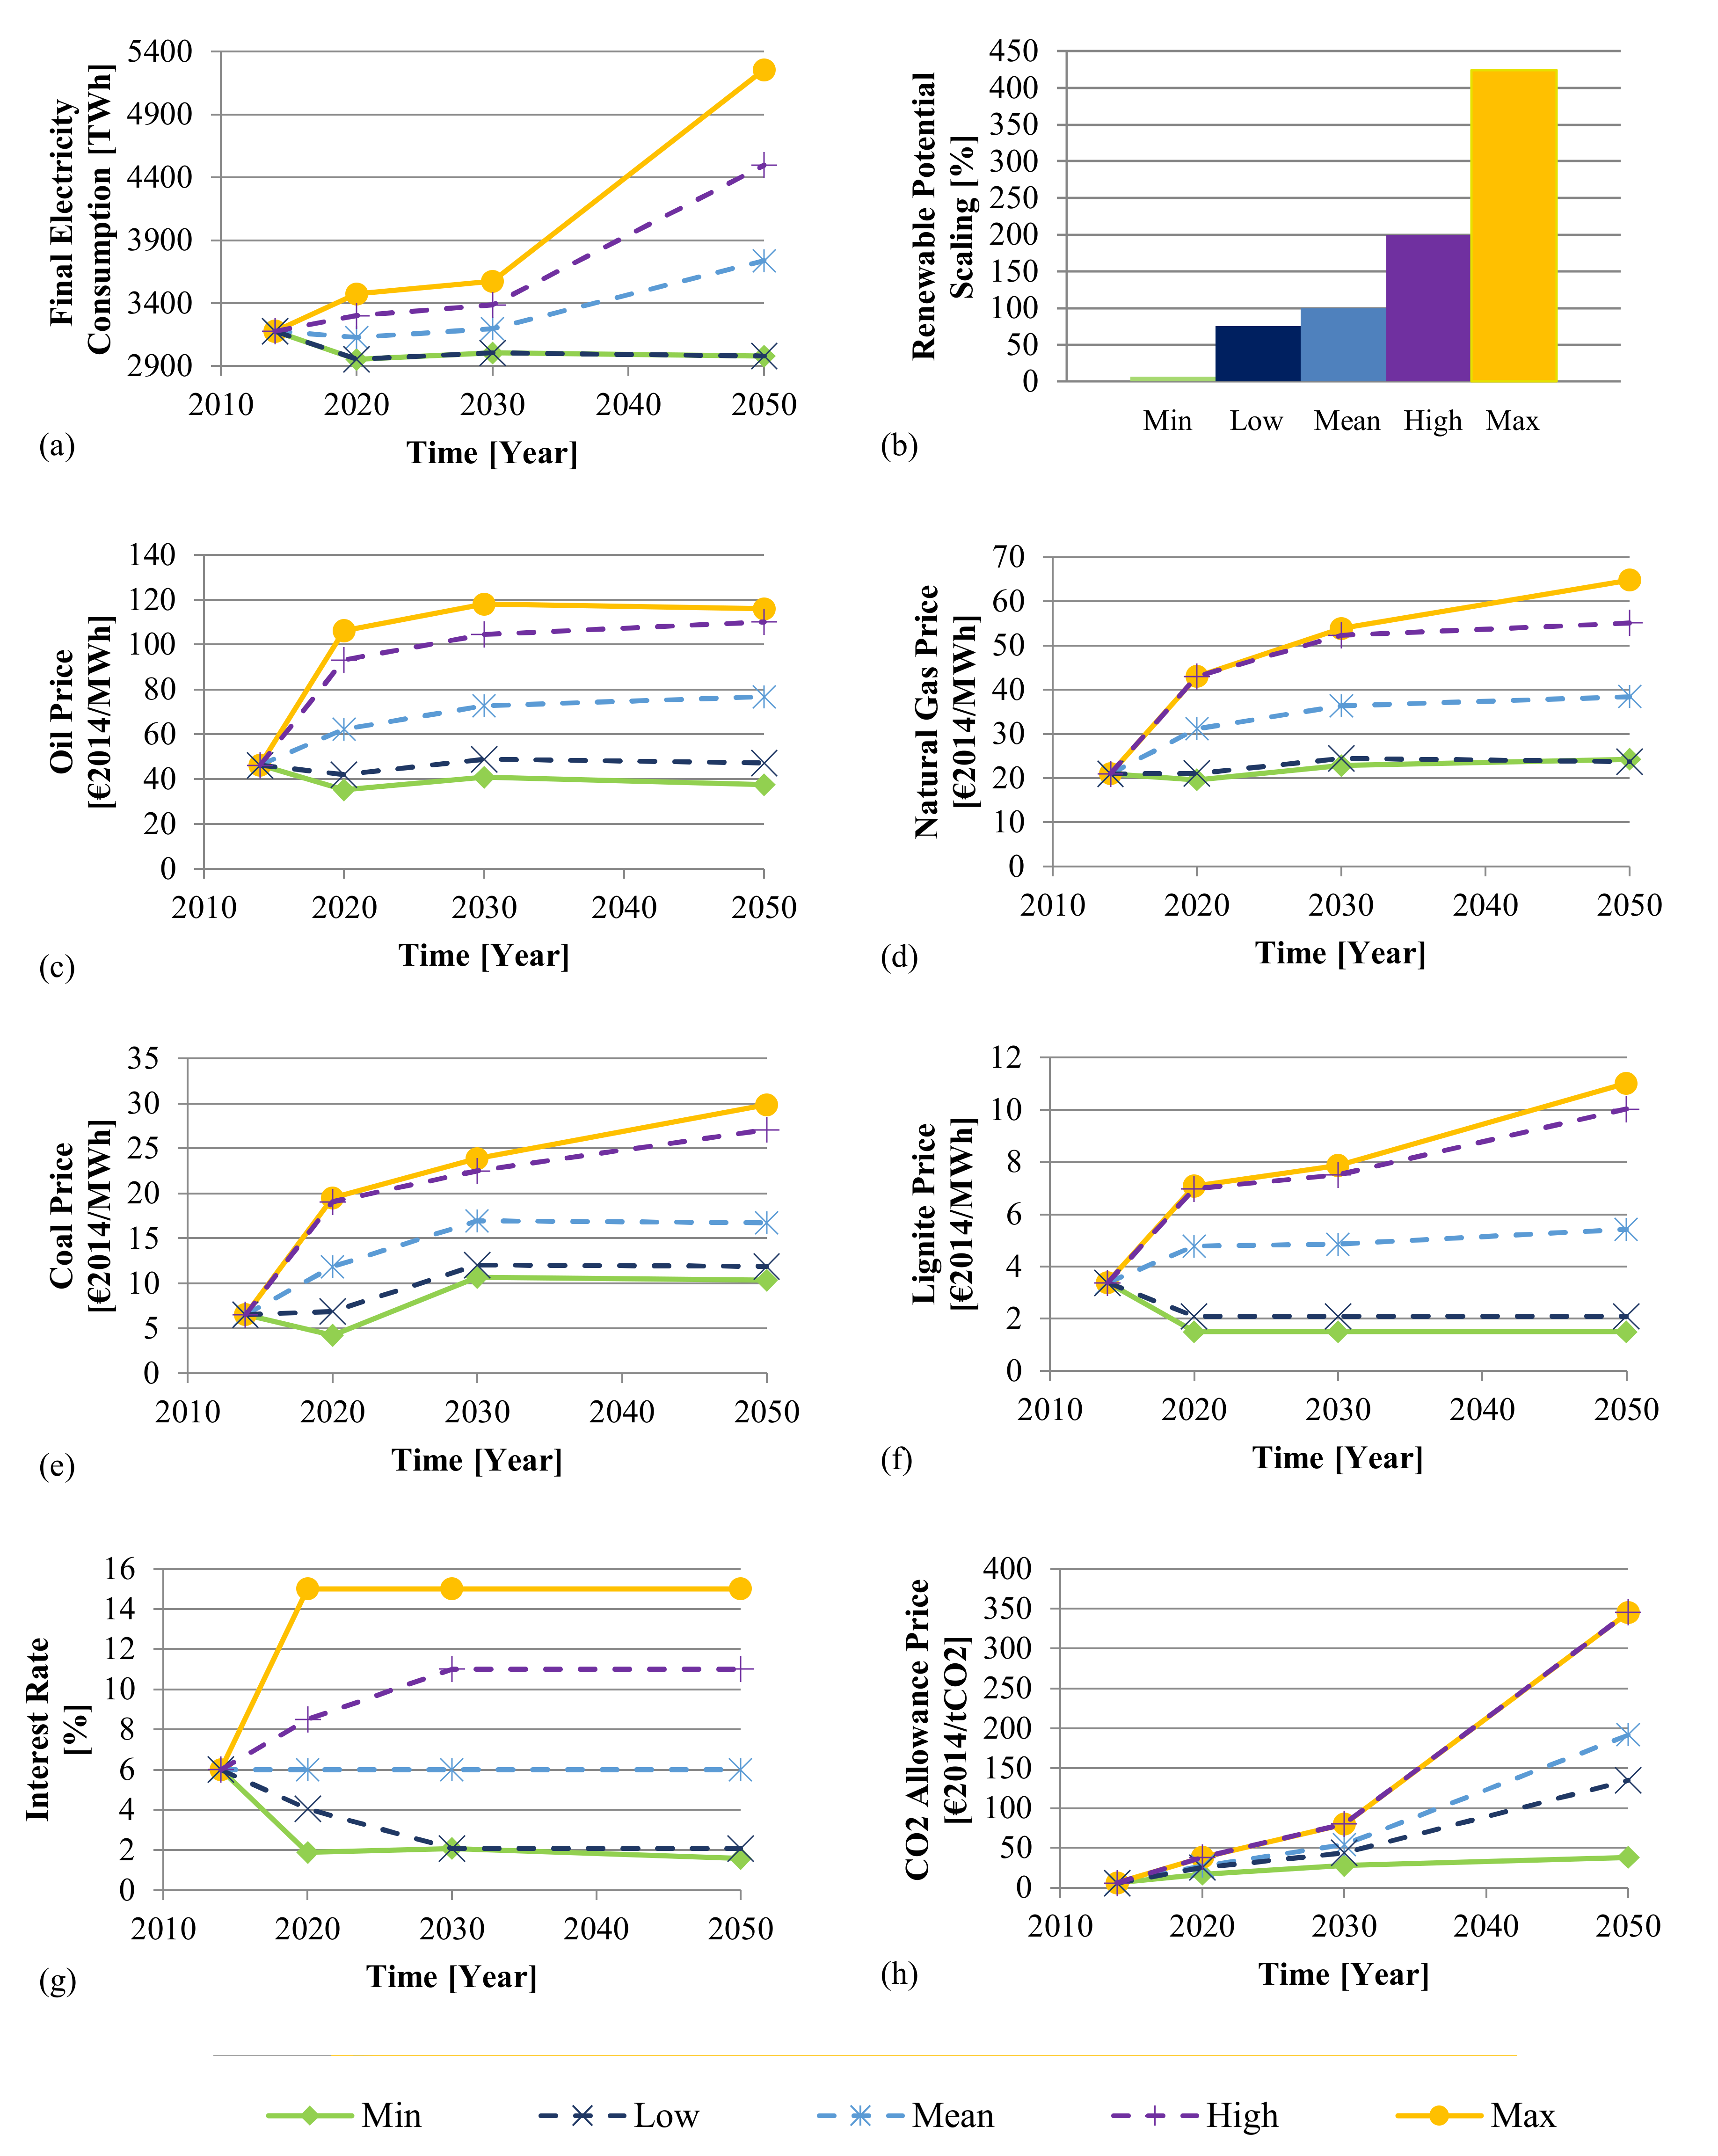
The maximum (Max), minimum (Min), and mean (Mean) parameter values for the variable parameters are taken from a number of references, which also consider multiple future scenarios and, therefore, represent the range of projections that is considered in the literature for each parameter (see
Section E in the Supplementary Material). The parameter ranges that are present in the base-scenario variants can be smaller. The reduction is derived for each parameter from the range and the consistent combination of the states of the corresponding descriptors that are identified in the 25 scenarios that constitute the base scenario (see also
Section E in the Supplementary Material on variation consistency). It is then translated into high and low trends of the parameter values by using different approaches. A point system is used as an option for a consistent definition of the parameter variability for the case where a large number of descriptors influence one parameter. In the case of the usable areas for renewable-technology deployment, the literature values use different assumptions to define the areas that are practically usable. This needs to be considered when defining the ranges of the possible values for this parameter. This is also true in the case of fuel prices, where the literature values vary considerably. The individual value-range definitions are described in the following paragraphs.
• Annual power demand
In the 211 framework scenarios (introduced in
Section 3.1.1), the demand is never predicted to be extremely high or low because of the contradiction of the implied assumptions. For example, high electric-car usage might considerably increase demand but is unlikely to coexist with low-efficiency improvements. Furthermore, individuals that actively lower their consumption by adapting their behaviour are considered unlikely in the framework scenarios.
On the basis of the links in the DMM, the following combination of descriptors is used as the indicator for the demand changes: the population development, the GDP development, the consumer behaviour, the system efficiencies (a, d, e, f), new automobile concepts, living trends, and rebound. Owing to the influence of a number of descriptors on this parameter, a point system is used, as described in
Section 2.4. The demand range that is present in the framework scenarios (211 scenarios) is compared to that in the base-scenario variants (25 scenarios). From the complete demand range (5–14 points) that is present in the 211 scenarios, the low-demand trend (5/14) can be found in the base-scenario selection, but not the high-demand trend. Therefore, when defining the demand trends for the sensitivity analysis, the lowest limit is reached by the low-demand trend, and the high-demand trend is defined through the maximally achievable ratio of the demand that is given by the point system of 11/14. On the basis of the demand change rate per year in the mean scenario that is chosen to represent (7/14), the change rate of the demand per year for the high and low cases is scaled with (11/14)–(7/14) and with (7/14)–(5/14), respectively. The resulting values are shown in
Figure 5a.
• Usable areas for renewable-technology deployment
The area availability is crucial for the amount of renewable-power-generation capacity that can be installed. As the relation between the two is proportional, changes in “usable areas” can be directly translated into the scaling factors for the capacity limits in the REMix. Three descriptors are represented by the usable areas, so that the variability of this parameter can be represented by analysing these descriptors and their trends. A positive attitude of the population towards the energy transition, and a moderately increasing technology acceptance, point to generally high-area usage in the framework base-scenario variants. Therefore, the lower trend variation is small; that is, 25% lower than the mean case. The mean case corresponds to the default setting of the usable-area shares in the REMix, as described in [
36]. The priorities of governance in infrastructure expansion vary in their complete range, so that further differentiation is possible, with the highest trend being 100% higher than the mean, but not reaching the maximum values that are found in the literature to avoid overly optimistic land-suitability assumptions [
40]. The obtained scaling factors (“Renewable Potential Scaling” in
Figure 5b) remain unchanged in the modelled time frame.
• Fuel prices
All the fuel-price trends are contained within the base-scenario variants. Therefore, three trends were defined by using the averages of the literature values. In the case of natural gas prices, these were adapted to follow past oil-price developments, by maintaining the natural gas price-to-oil price ratio between 0.45 and 0.6, without exceeding the literature limits. The fuel prices for nuclear power plants are set to 0.003 €
2014/kWh, and for biomass, to 0.036 €
2014/kWh, for all the years and scenario trends, as these are not subjected to the same risks and market mechanisms [
40,
41,
42]. These trends are shown in
Figure 5c–f.
• Interest rate
In the REMix model, the interest rate is not only a cost measure, but it is also understood from a politico-economic perspective. Thus, it is the same for all technologies. For instance, RE technologies have a higher environmental value and added value for the CO
2-allowances market compared to conventional power plants, which balance their higher initial economic risks. Descriptors A(I), A(III), and D are represented by the interest rate. A moderate increase in the real interest rate (A(III)-2) is common to all base-scenario variants, so that very high values are avoided. Global development spans all possible trends, which, combined with GDP development, allows for a broad variation within the remaining interest-rate scope. See
Figure 5g.
• CO2-certificate prices
Technology-unspecific political-steering measures are common to all 25 base-scenario variants. Currently, the most representative measure of this kind is the CO
2-certificate policy, so that a static increase in the CO
2-certificate prices can be implied. Because of the assumed EU integration and the implied basic agreement between EU countries, the possibility of very low CO
2 prices can be excluded. However, because of the possible different global development (A(I)) trajectories, a differentiation in the CO
2-certificate prices is possible. Therefore, the CO
2-certificate prices reach the upper range limit for the high-price trend and are relatively high for the low-price trend. The mean scenario trend is averaged between the literature limits. Trends are shown in
Figure 5h.
The parameter-value range definitions within the base scenario are relatively wide. The minimum, mean, maximum, high, and low parameter value trends for all considered variable parameters are shown in
Figure 5. Sensitivity analysis varies the model-parameter values in their identified ranges. This shows the effects that the variations of the model parameters have on the results and allows for the identification of the parameters with the highest impact.
3.3.3. Independent Parameters
The remaining parameters have 30% or less of the highest row-sum scores in the PSM-parameter DSM and they are treated as independent parameters because of their implied low impacts on the PSM results (for example, the electric-load time series). All the other independent parameters that are not related to any descriptor are listed in
Table 2. The parameters in the cluster, “Technological Development”, are also considered independent parameters because they represent only one descriptor, with weak descriptor intradependencies.
4. Results
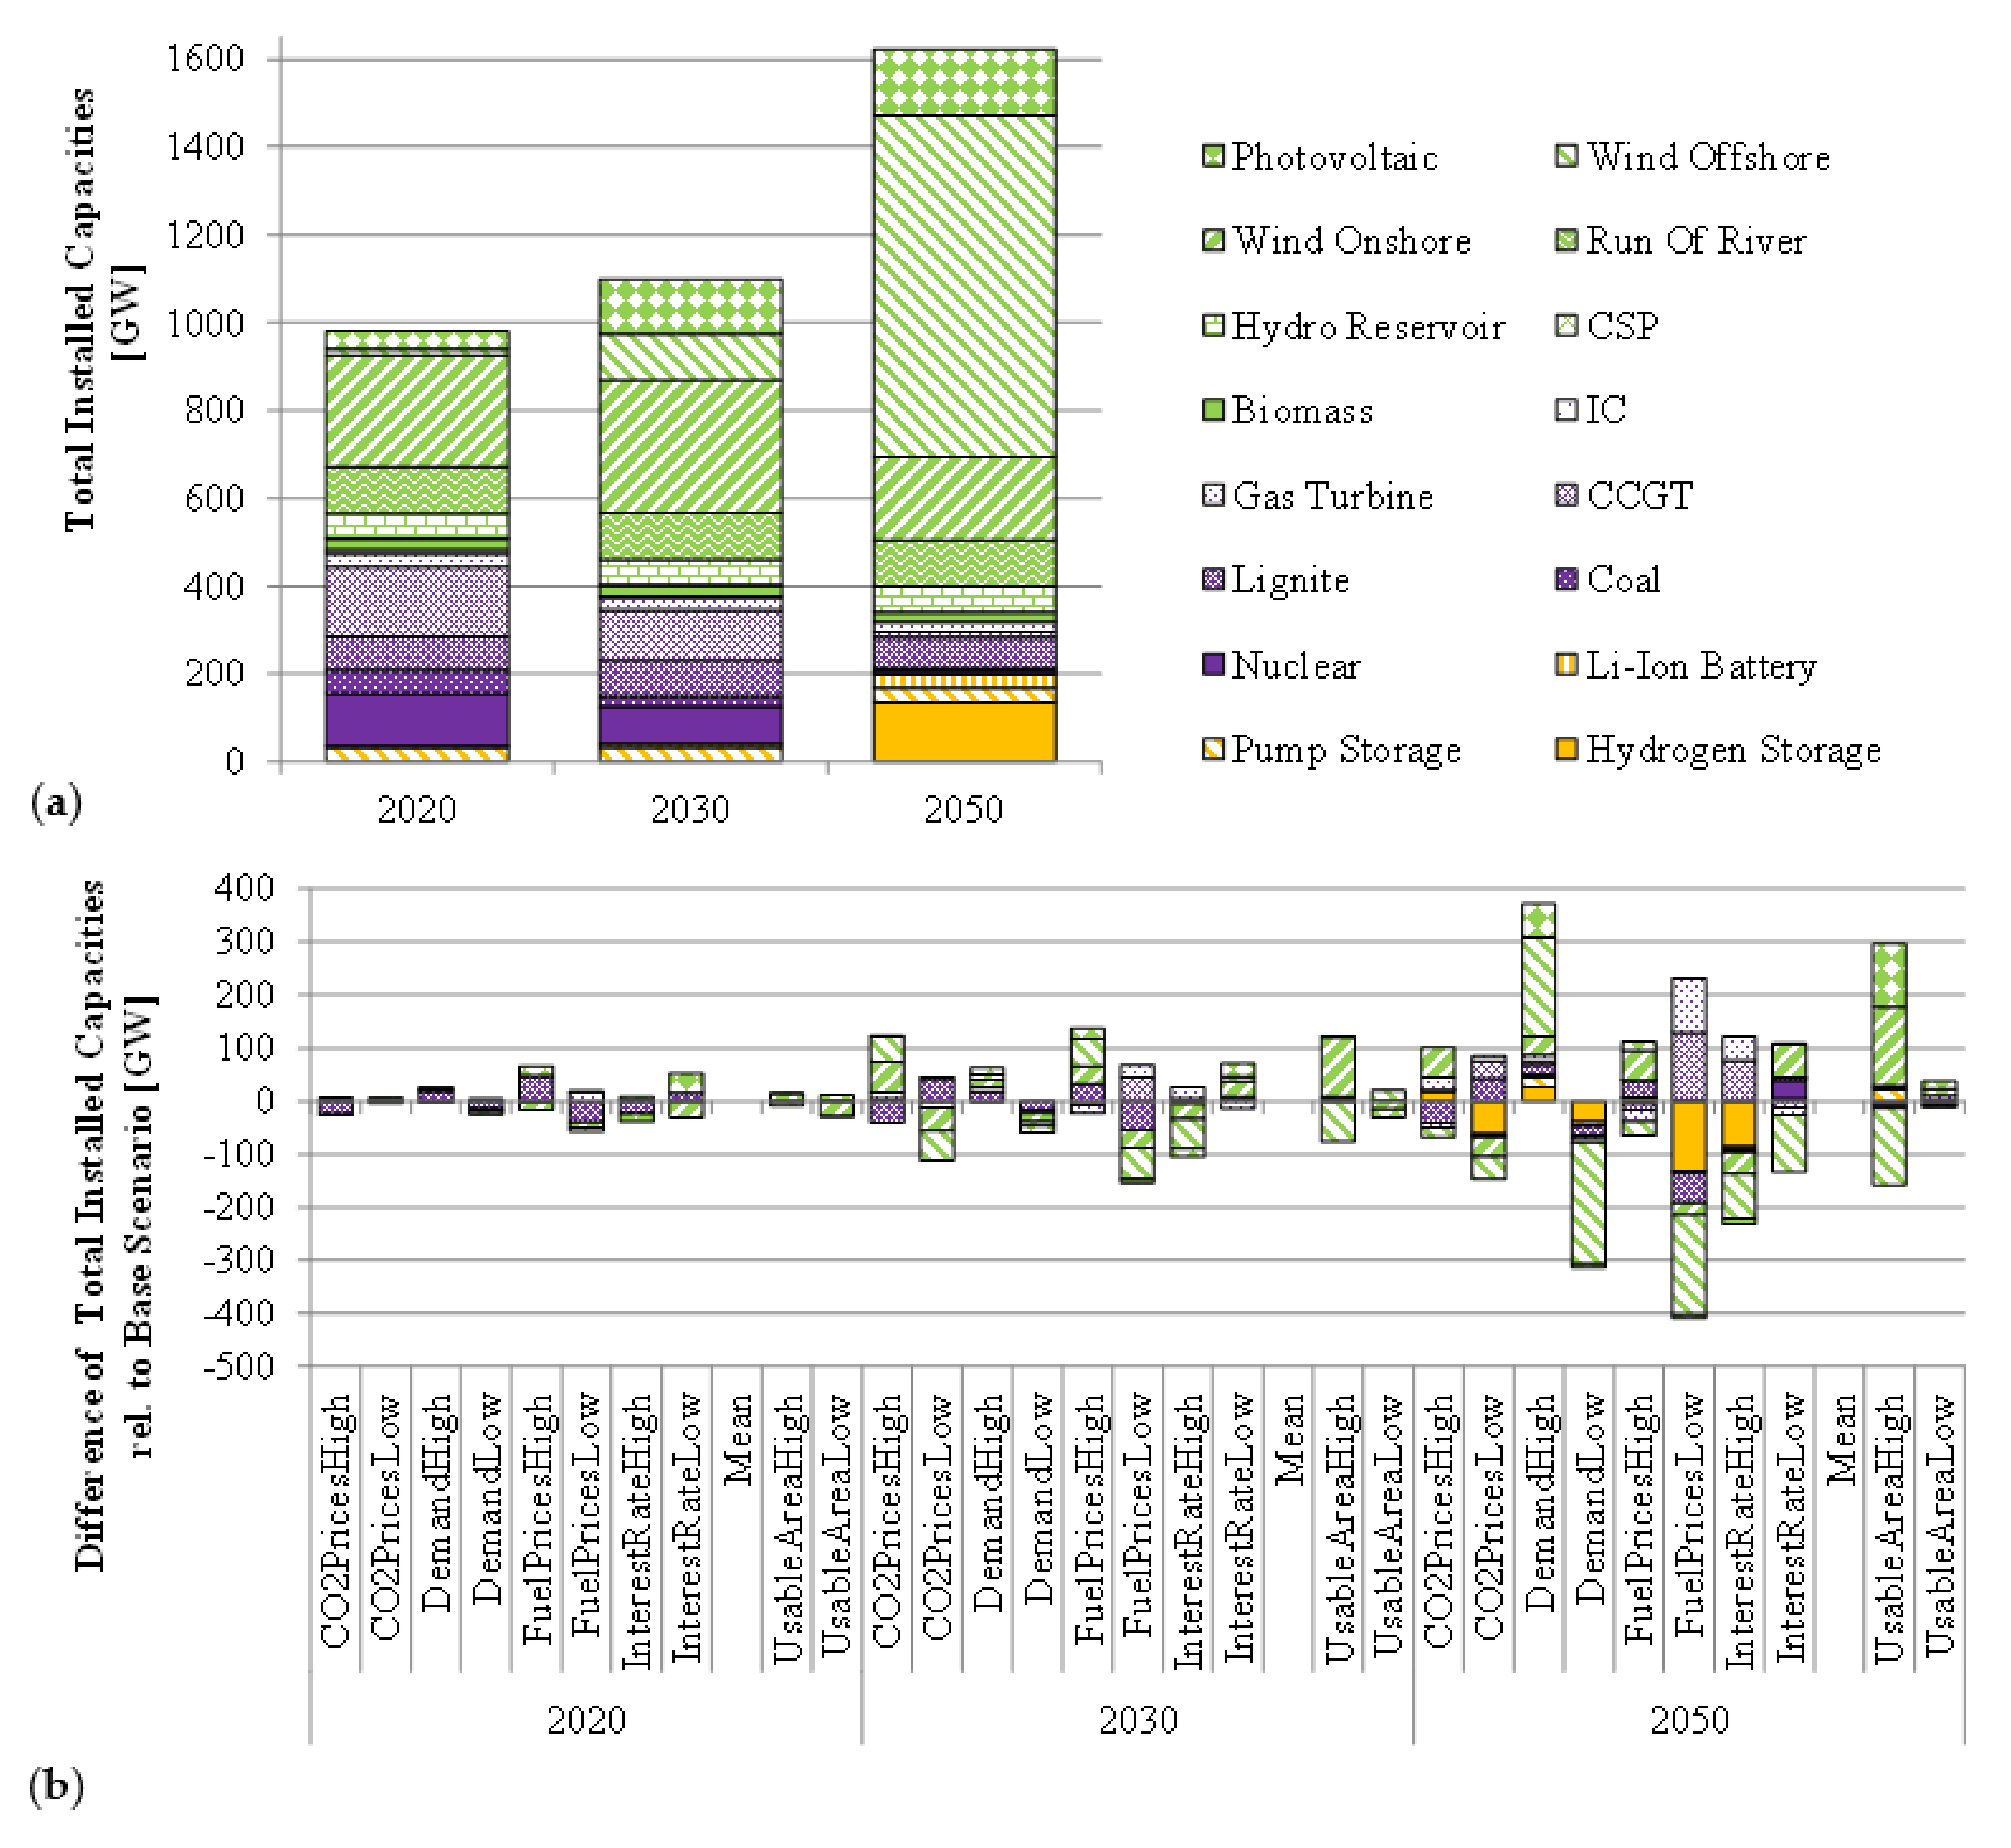
The proposed method defines a consistent scenario set by linking the definition of the constraints and the relevant parameters of the PSM to social-, political-, and economic-development scenarios. We use a specific research question to showcase the application of this methodology: “How does the power system need to develop to fulfil the European political goals until 2050?” (i.e., “How much power generation, storage, and transmission capacity is required, where should it be built, and how should it be operated?”). The application of the proposed methodology leads to modelling results that show a clear general trend. In
Figure 6, the general trend in the total installed capacities reflects that RE power plants are more cost efficient than conventional power plants in the long term, despite the highly implied transmission-line expansion. This involves large-capacity expansion in offshore wind in combination with long-term storage technologies, such as hydrogen.
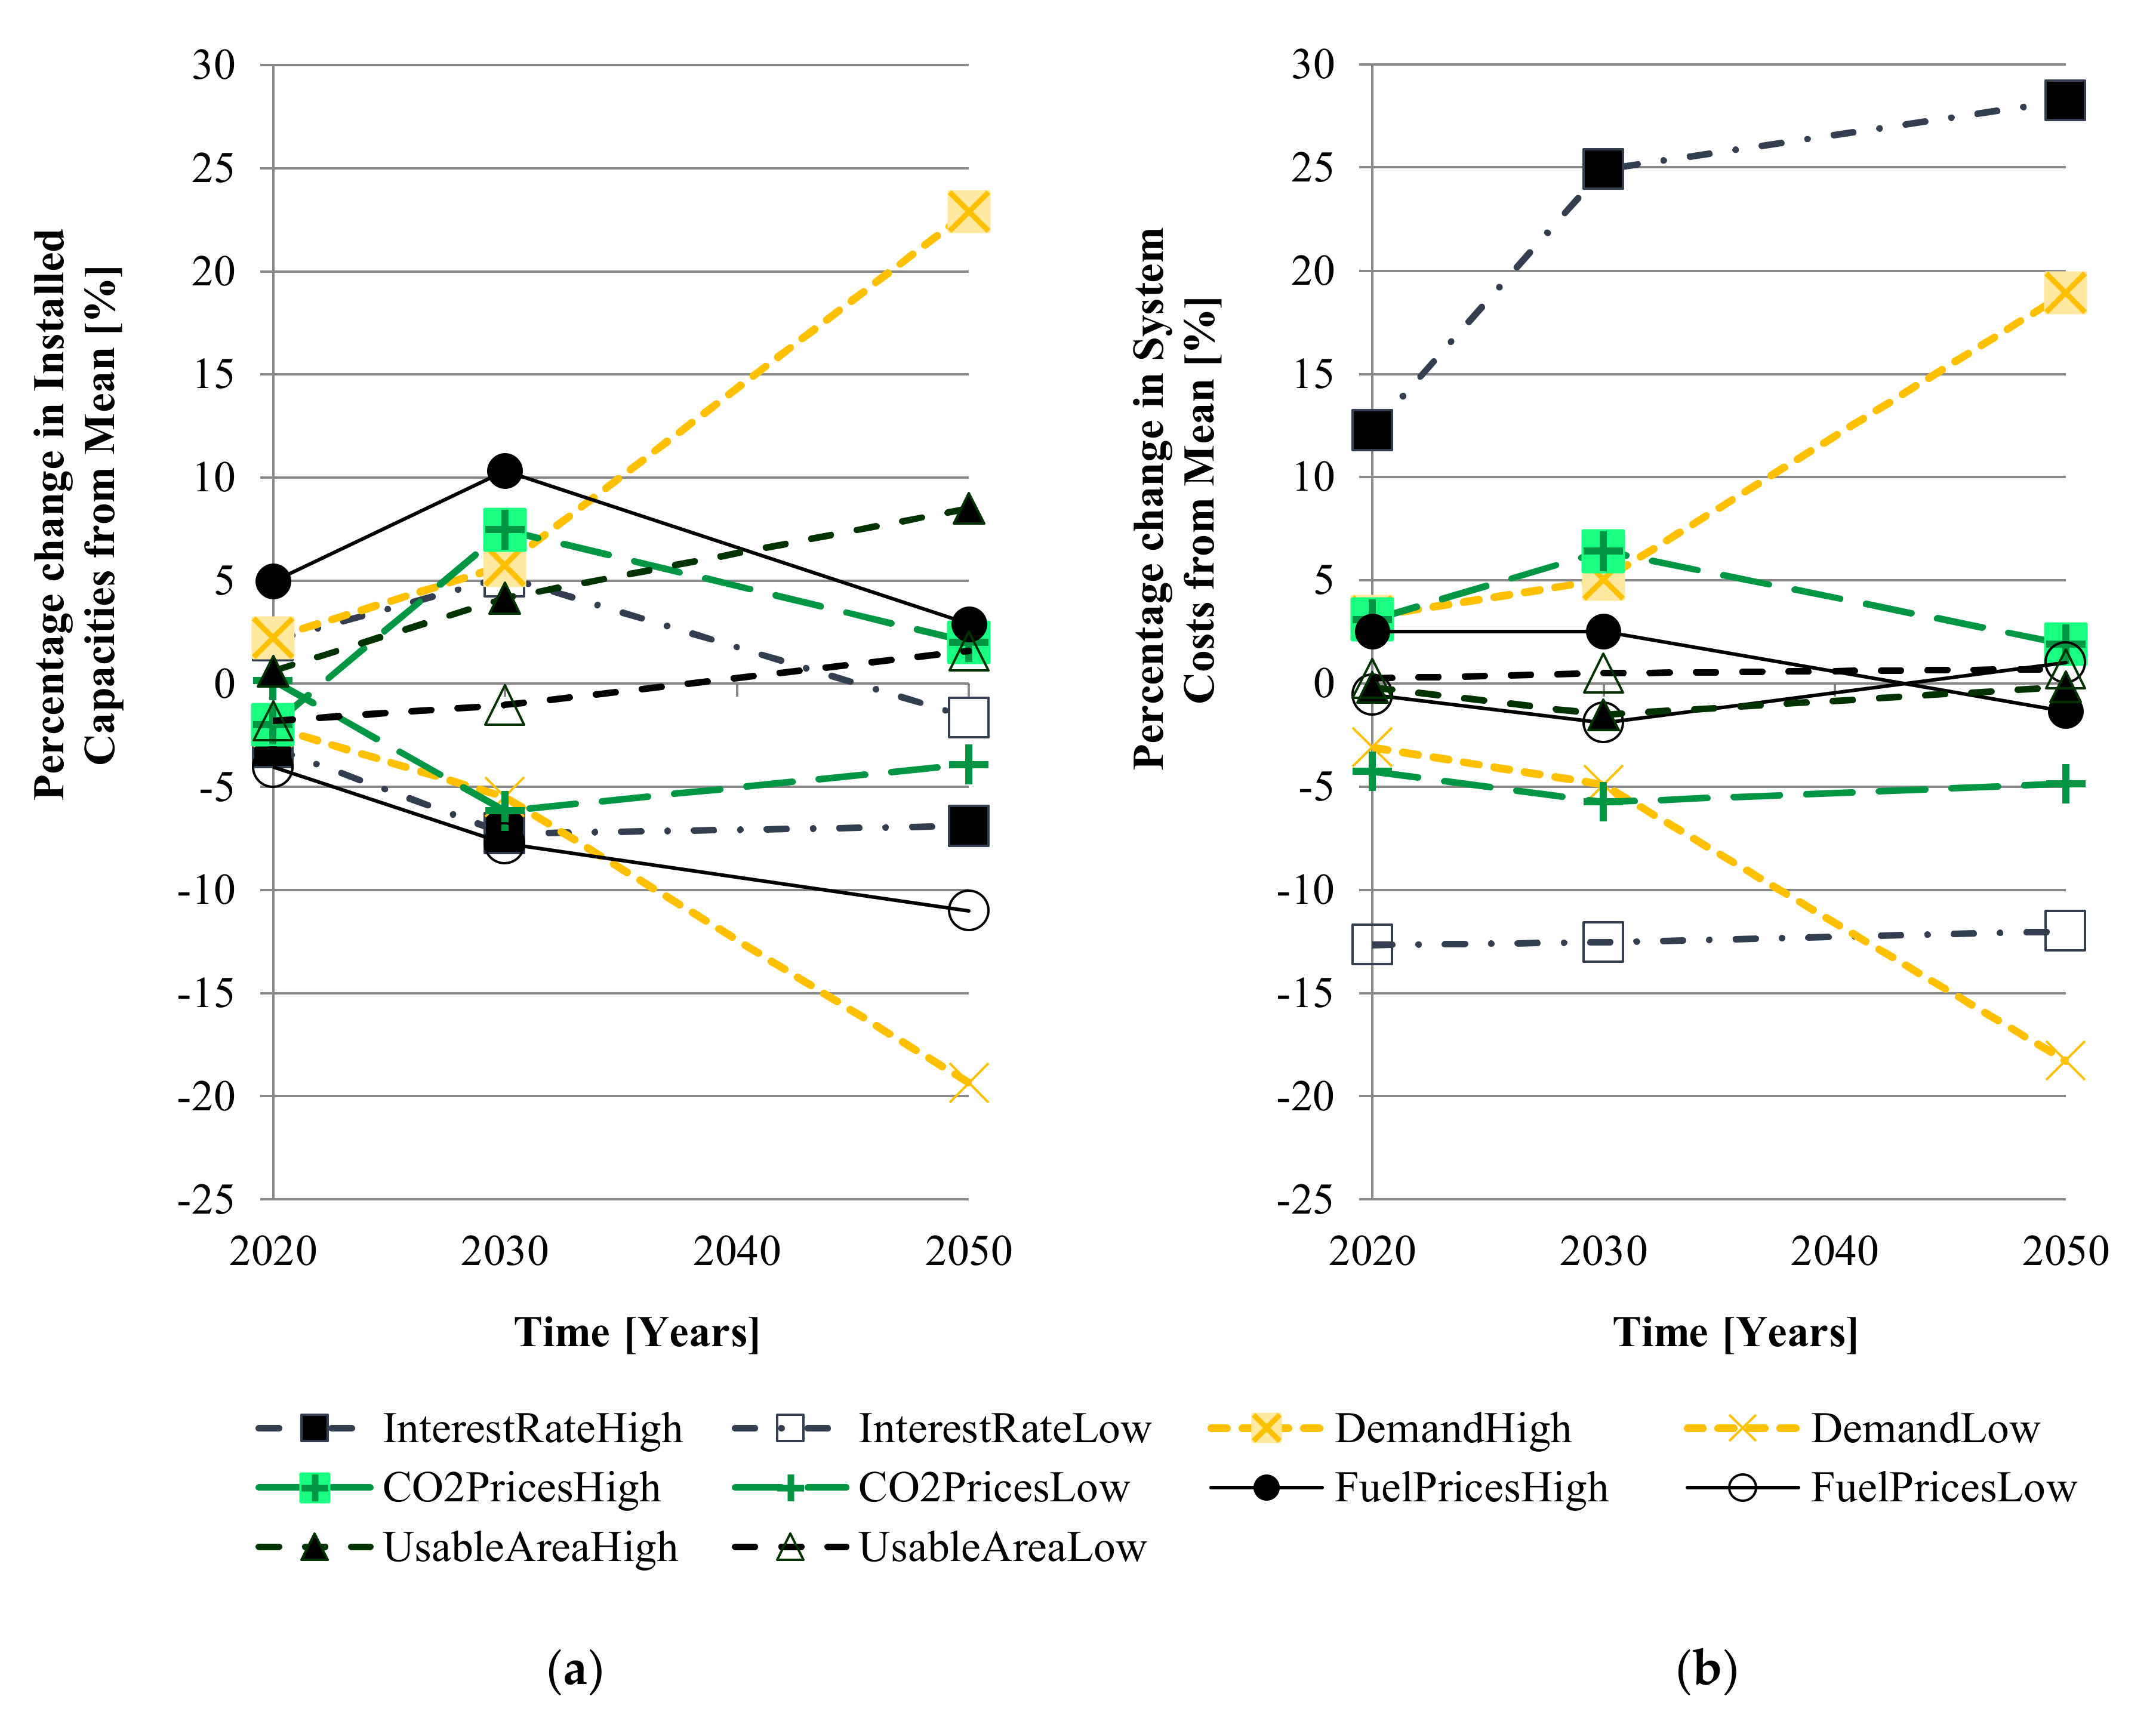
Changes in the demand resulted in the highest percentage change in the total amount of installed capacities with respect to the mean scenario (see
Figure 7a), with a ±20% change for a percentage change in the demand of −7 to +6%. The interest rate shows the strongest effect on the percentage change of the total system costs with respect to the mean scenario (see
Figure 7b), with −20 to +30% for a percentage change of −65 to +83%. The low and high fuel-price variations resulted in a −5 to +2% change in the total system costs, and in a −11 to +2.9% change in the installed capacities.
CO
2-allowance prices behave in a similar way to fuel prices but show a smaller impact on the results (see
Figure 6b), since CO
2-allowance-price scenarios are defined within a narrower range, according to the base-scenario variants. In both cases, high prices primarily foster the capacity expansion of long-term storage and RE technologies, while decreasing conventional technology expansion.
High shares of RE power plants (between 80 and 91%) within the scenario variations are cost efficient in 2050. This implies a transmission-grid expansion of 80 TWkm between 2020 and 2030, and of 224 TWkm between 2030 and 2050.
Conventional technologies remain for firm-capacity and back-up provisions. In 2020 and 2030, some minimum generation shares are not reached because the preset biomass capacities are not used for electricity generation because of the high fuel costs and, thus, they do not contribute to the fulfilment of the political goals, as envisaged. Contrary to the year 2050, other renewable-energy technologies are still not cost efficient enough to compensate for the lack of renewable power generation.
In terms of the installed capacity, it can be seen that high amounts of offshore wind are installed in all scenarios. The largest variation in the sensitivity study, in terms of the absolute numbers of the installed capacity, is also linked to offshore wind, where the capacity varies from 550 to 965 GW, which corresponds to a percentage change of −24 to 29%. This is associated with low- and high-demand cases, respectively. Similarly, the installed capacity of onshore wind is also expanded in all scenarios, with a percentage variation of −20 to 80% for the low-CO2-price and high-usable-area cases, respectively. This is consistent with the expansion in the hydrogen-storage capacities. However, hydrogen storage seems to be a more uncertain investment option, where a percentage change of −98 to 20% can be observed for the low-fuel-price and high-demand cases, respectively.
In the case of low fuel prices, the additional value of long-term storage in combination with high wind-electricity generation is lost, and almost no capacity is installed. The largest percentage change in the installed capacity is observed for CCGT (−100 to 1030%), followed by gas turbines (−100 to 494%), and nuclear (−73 to 444%). In the first two cases, the percentage change in the full-load hours range from −84 to 71% for CCGT, and from −58 to 166% for gas turbines, whereas for nuclear, the percentage changes range from −11 to 11%. This shows the existing uncertainty in investments in conventional technologies that are linked to varying fuel prices. The capacities of solar-power technologies and Li-ion-battery storage show a similar percentage-change range to that of onshore wind.
The high increase in the transmission-line capacity (304 TWkm until 2050) seems to originate from the assumed European integration, which results in the high import of offshore-wind generation from the United Kingdom. In other regions, such as Austria, Switzerland, or Denmark_W, the RE capacities are built only so that the exogenously set minimal demand share is covered, and the supply security relies on imports. Conventional power plants for base loads and firm capacities are built in Italy and Iberia to limit the transmission losses and costs. These are regions with little wind potential, and where PV power plants are built, which implies higher fluctuations in the electricity production.
Overall, the results of the sensitivity study with reduced variability have narrow volatility in terms of the total installed capacity and costs. Investigating the structure of the resulting power systems more closely reveals that, nevertheless, the capacity of individual technologies can vary by up to 30% for large contributors (offshore wind), and by even multiples of 5 to 10 for smaller contributors (gas turbines and CCGT). A robust capacity-expansion strategy (that is, a strategy that is valid for all scenario variants), therefore, would have to focus on the functions in the power-supply system rather than on fostering individual technologies. This is the case, even though the set of power-sector scenarios was narrowed down through the framework scenarios. Detailed modelling results can be found in
Section S6 in the Supplementary Material.
5. Discussion
Because of the process that is used to define the modelled scenarios by linking the constraints and relevant parameters of the PSM to social-, political-, and economic-development scenarios, the relation between the most cost-effective power system that fulfils the European political goals and the required framework and political measures can be made. Some of the basic framework requirements to achieve these goals are a cohesive, integrated European Union, with an internationally integrated grid, and political stability in the energy field, with clear goals for the renewable-energy contribution to the energy system—as highlighted by the selection of descriptor states that describe the base scenario in
Table 3. From the performed sensitivity, it also becomes clear that the steering instruments in the energy field can have a significant impact on the overall outcome within the modelled scenario. Within the considered base scenario, a preference for technology-agnostic measures was identified (see
Section 3.3.2). These measures are represented here through the CO
2-allowance prices. The results show that CO
2-allowance prices behave similarly to fuel prices, with high prices primarily fostering the capacity expansion of long-term storage and RE technologies. This points to the suitability of using this type of technology-agnostic economic measure to foster carbon-neutral power generation, as well as to reduce the effects of fuel-price fluctuations on the power-system development, if applied consistently. Additionally, it was shown that the interest rate had the strongest effect on the percentage change of the total system costs, despite the baseline case that considers moderately increasing CO
2-certificate prices and the achievement of the renewable-energy-capacity targets. Given the impact of variable interest rates on the results, specific measures to de-risk the investment in renewable-energy technologies should be put into place, in addition to setting defined capacity targets and leveraging economic measures, such as the CO
2 certificates.
Using complexity-management methods to link the framework scenarios to a power-sector model, defining the power-sector-model scenarios more systematically and consistently, and reducing and handling uncertainties proved possible in our case study on the development of the power sector under the assumption that the European political goals for 2050 are fulfilled. The following points require particular attention when applying and further developing this method.
Framework scenarios, as well as the mapping of the descriptors onto the power-sector-model parameters, are based on expert judgments about the future developments and the dependencies between changing social, political, economic, and technical conditions. Thus, they cannot be validated with measured data. Therefore, they need to be strengthened or improved through similar studies and ongoing scientific discussions.
Framework scenarios that are specific to the energy supply and to a given spatial and temporal scope may not always be available. Searching for framework scenarios in a similar region that may be considered applicable is a possibility. A preferable but also more resource-consuming option could be to generate the required framework scenarios, for example, in interdisciplinary teams of social scientists and energy-system modellers. An example of such a collaboration is [
17]. The software for performing CIB analyses is freely available from [
43], which might facilitate similar cooperative studies.
The need to consider the further political and social aspects in IAMs is highlighted by Peng et al., in [
44]. The introduced methodology was developed for use in high-resolution power-sector models. However, we assume that it is equally applicable to more comprehensive energy-system models or IAMs if the framework scenarios and the corresponding descriptor-state matrix are available and are suitable for the research questions, the spatial scope, and the time horizon. This is because the proposed methodology presents a systematic approach for mapping the model parameters and the framework descriptors. IAMs also have input model parameters and they are used together with framework scenarios, such as SSPs, which are developed through the CIB method (as discussed in
Section 1). Therefore, framework descriptors and framework-descriptor DSMs should be available from that process. Since equivalent model inputs, as required in the present study, should be available, the proposed method should be applicable.
In turn, there is knowledge in the IAM community that may improve the individual steps in our method. We determined the relationship between the framework descriptors and the power-sector-model parameters qualitatively; that is, the proposed method only observes whether a parameter is influenced by a descriptor. To quantify the model-parameter values by using the descriptor states that are given in a framework scenario, we combined the literature reviews with a point system (as described in
Section 2.4.2). Alternatively, just as in IAMs, specialised models, such as econometric models, could be used to further improve the relation between the framework scenarios and the power- or energy-system model applied (e.g., the power demand dependency on the GDP and the population).
If time and computational resources allow for it, an alternative to sensitivity analyses, with independently varied parameters, can be used to perform the model runs for each base-scenario variant. This reflects the combinations of model parameters that are defined by the descriptor states in the framework base-scenario variants instead of identifying the impact of the individual variable model-parameter variations.
The creation of clusters in the domain-mapping matrix, which are then used to identify the base-scenario parameters, is a semitransparent process; when varying the input assumption on the number of expected clusters, different clustering results may be observable, and more than one option may be possible. The choice of the most suitable clustering results requires an expert assessment for a given problem. In the current study, the number of clusters was continuously increased until little difference could be seen in the clustering results, which occurred at a predefined number of clusters (approximately six to seven). In the present case, the selected clustering approach and the combination of descriptor states proved consistent with the framework-scenario combinations. This may be different in other studies and require more than one iteration.
The discussed limitations point to the next research steps in further developing the proposed method. However, the method proved advantageous in our case study in its current form. It can be especially useful for power-sector modellers with research questions that require more specific framework scenarios than global SSPs. Furthermore, it enables the definition of a narrative and its representation by framework descriptors and the corresponding power-sector-model parameters. It can support the planning of political strategies, as it relates the results from a power-sector model to their social, economic, and political implications. The implications of political measures and social behaviour are reflected in the power-sector parameters through the contextualisation of the power-sector-development scenarios into framework scenarios. Changes in this framework have a quantifiable effect on the system. In this way, political strategies that affect the framework descriptors can be translated into changes in the model parameters, and power-sector-model results can be generated to evaluate the effectiveness of each measure. For example, the interaction of the CO2-allowance-price development with other political measures can be quantified in the power-sector model. Other political measures could be aiming to raise awareness about new energy technologies and storage methods, and to increase their acceptance, as well as to shift the value orientation that could result in changes in individual energy-consumption behaviour. The effects of these measures can be quantified by defining a corresponding variability range of the usable areas for renewable-energy potentials, and, in the latter, by adapting the variability range of the power demand within the studied base scenario. Additionally, because of the higher level of granularity, different interest rates can be considered in a PSM that includes country-specific differentiation.
6. Conclusions
Power-sector models (PSMs) with high spatial and temporal resolutions are designed to find technical solutions for the complex economic optimisation problem of renewable-energy-based power supplies. If not considered in the model’s parametrisation or constraints, these models lack the expert knowledge that is required to generate politically viable and socially acceptable energy-supply scenarios. In this study, we contribute to closing this gap by introducing a novel method to consistently define power-system scenarios by considering the social, political, and economic framework development through complexity-management methods. This enables the identification of the base scenarios that align with the research question at hand, as well as complexity handling and uncertainty reduction through a limited number of consistent base-scenario variants.
We describe the method and exemplify it step by step in a case study on fulfilling the European political goals until 2050. These steps are: (1) An analysis of the framework-descriptor and the PSM-parameter intradependencies and the mapping of the framework descriptors onto the PSM parameters; (2) The application of a clustering approach to define the base-scenario options; and (3) The definition of a base scenario and the assignment of the parameter values consistently, which thereby allows for the identification and reduction of uncertainties. Because of the process that is used to define the modelled scenarios, the link between the most cost-effective power system that fulfils the European political goals and the required framework and political measures can be established. The modelling results identify the demand and the interest rate as the most influential parameters on the overall capacity and system costs. They also show that, even in a scenario set with reduced uncertainty, backup and storage technologies have high investment risk and that, if applied consistently, technology-agnostic economic measures, such as CO2-certificate prices, can be used to counteract the effects of the fluctuations in fuel prices on the power-system development. Additionally, the impact of variable interest rates on the results highlights the need for additional measures to de-risk the investment in renewable-energy technologies.
To apply the introduced methodology, suitable framework scenarios may not be directly available for each research question; hence, additional work and expertise may be needed to provide them. However, framework scenarios represent a promising approach for the implementation of the energy transition at the local level, where the consideration of the social, political, and economic impacts is more important for stakeholders. Accordingly, the creation of regional energy-system-specific framework scenarios should be stimulated in order to facilitate and improve such applications. To fully benefit from the proposed method, we see an ongoing scientific discourse and the increasing experience from applications to be indispensable. Therefore, the next step for improvement is gaining more experience with a large variety of research questions and base scenarios.


 ,
, 


