
Effect of the Air Flow on the Combustion Process and Preheating Effect of the Intake Manifold Burner


Abstract
:1. Introduction
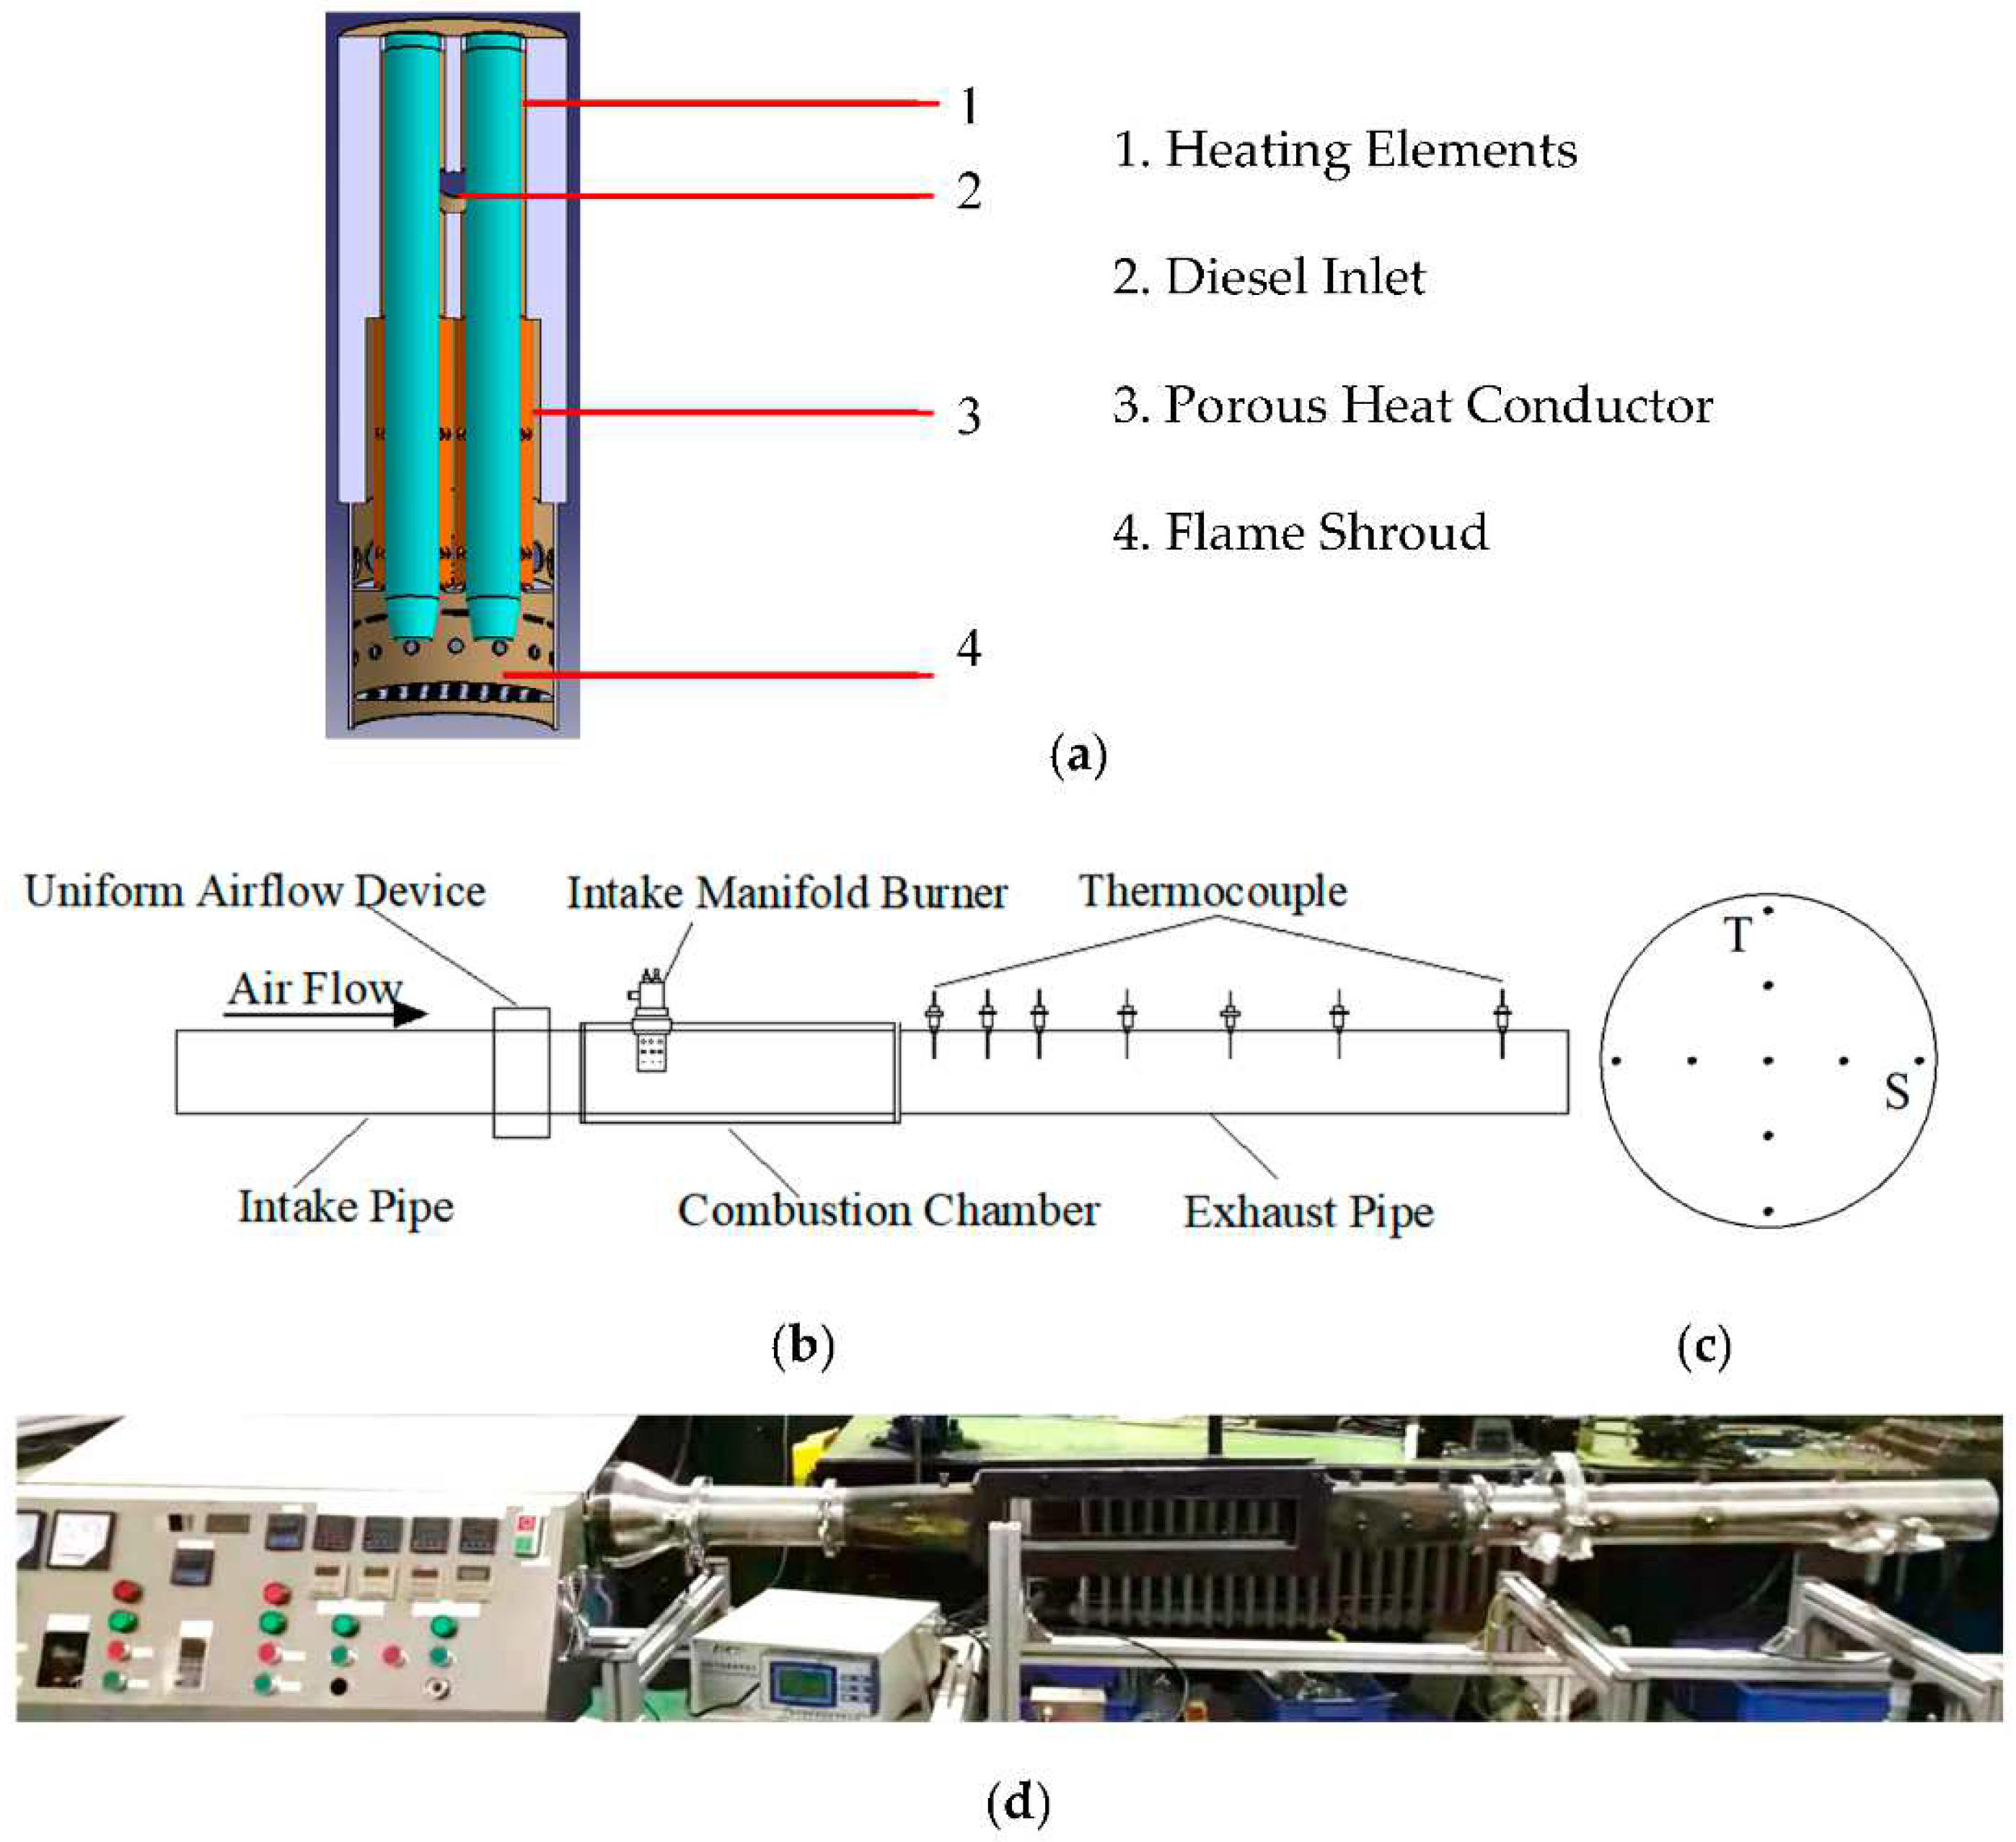
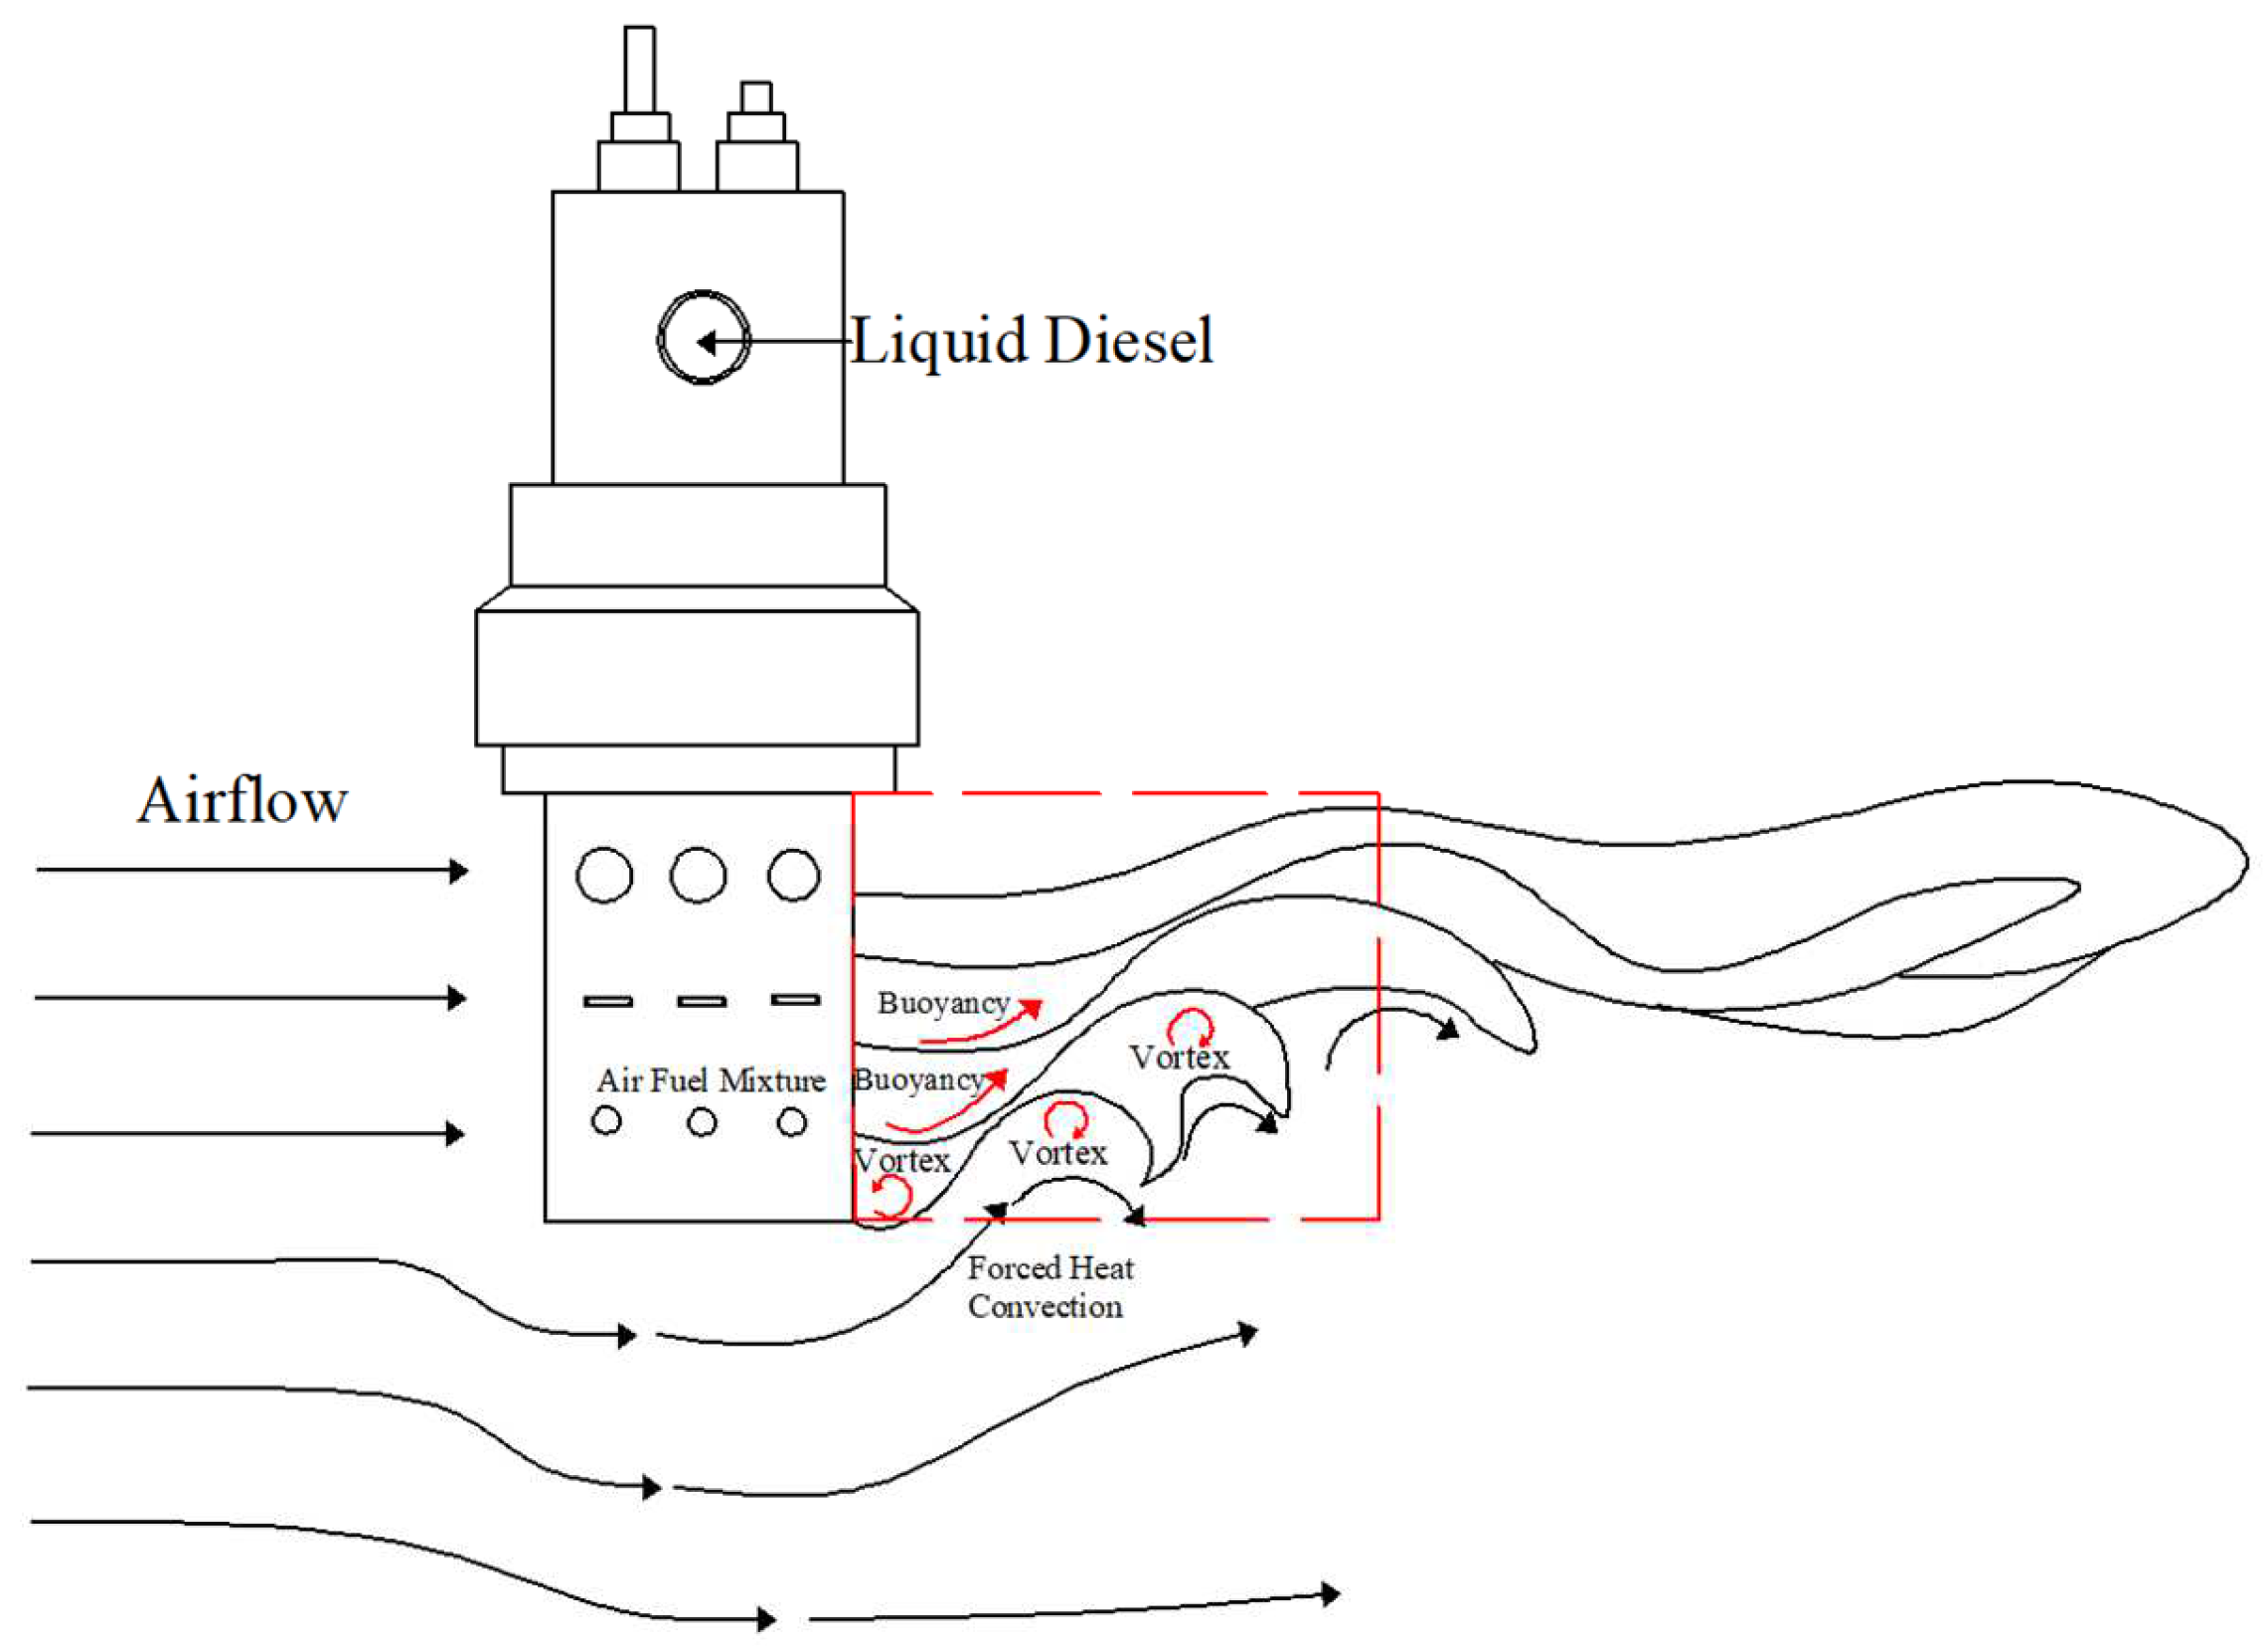
2. Experiment Setup
3. Test Fuel and Conditions
4. Results and Discussion
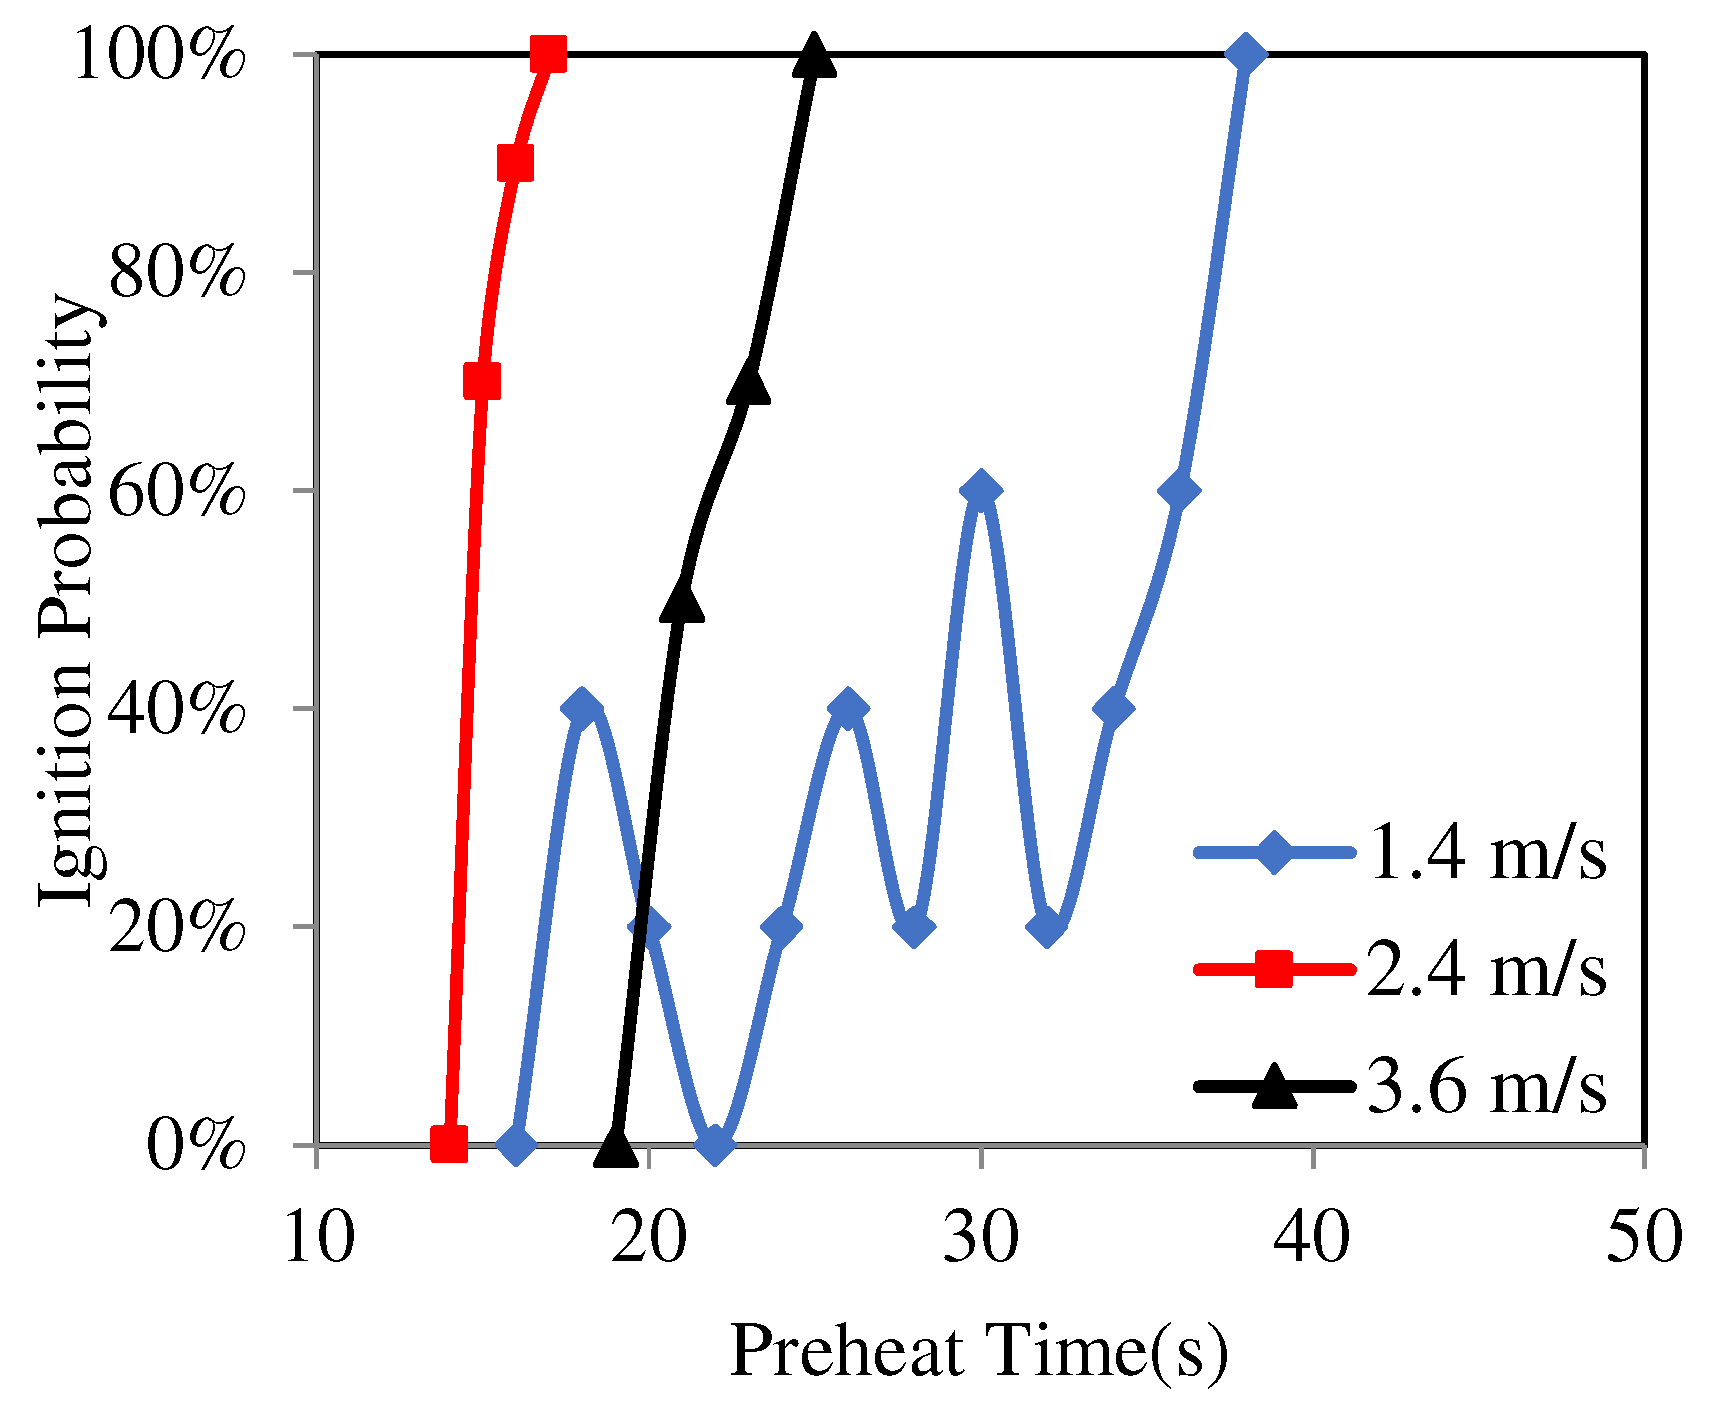
4.1. Ignition Probability
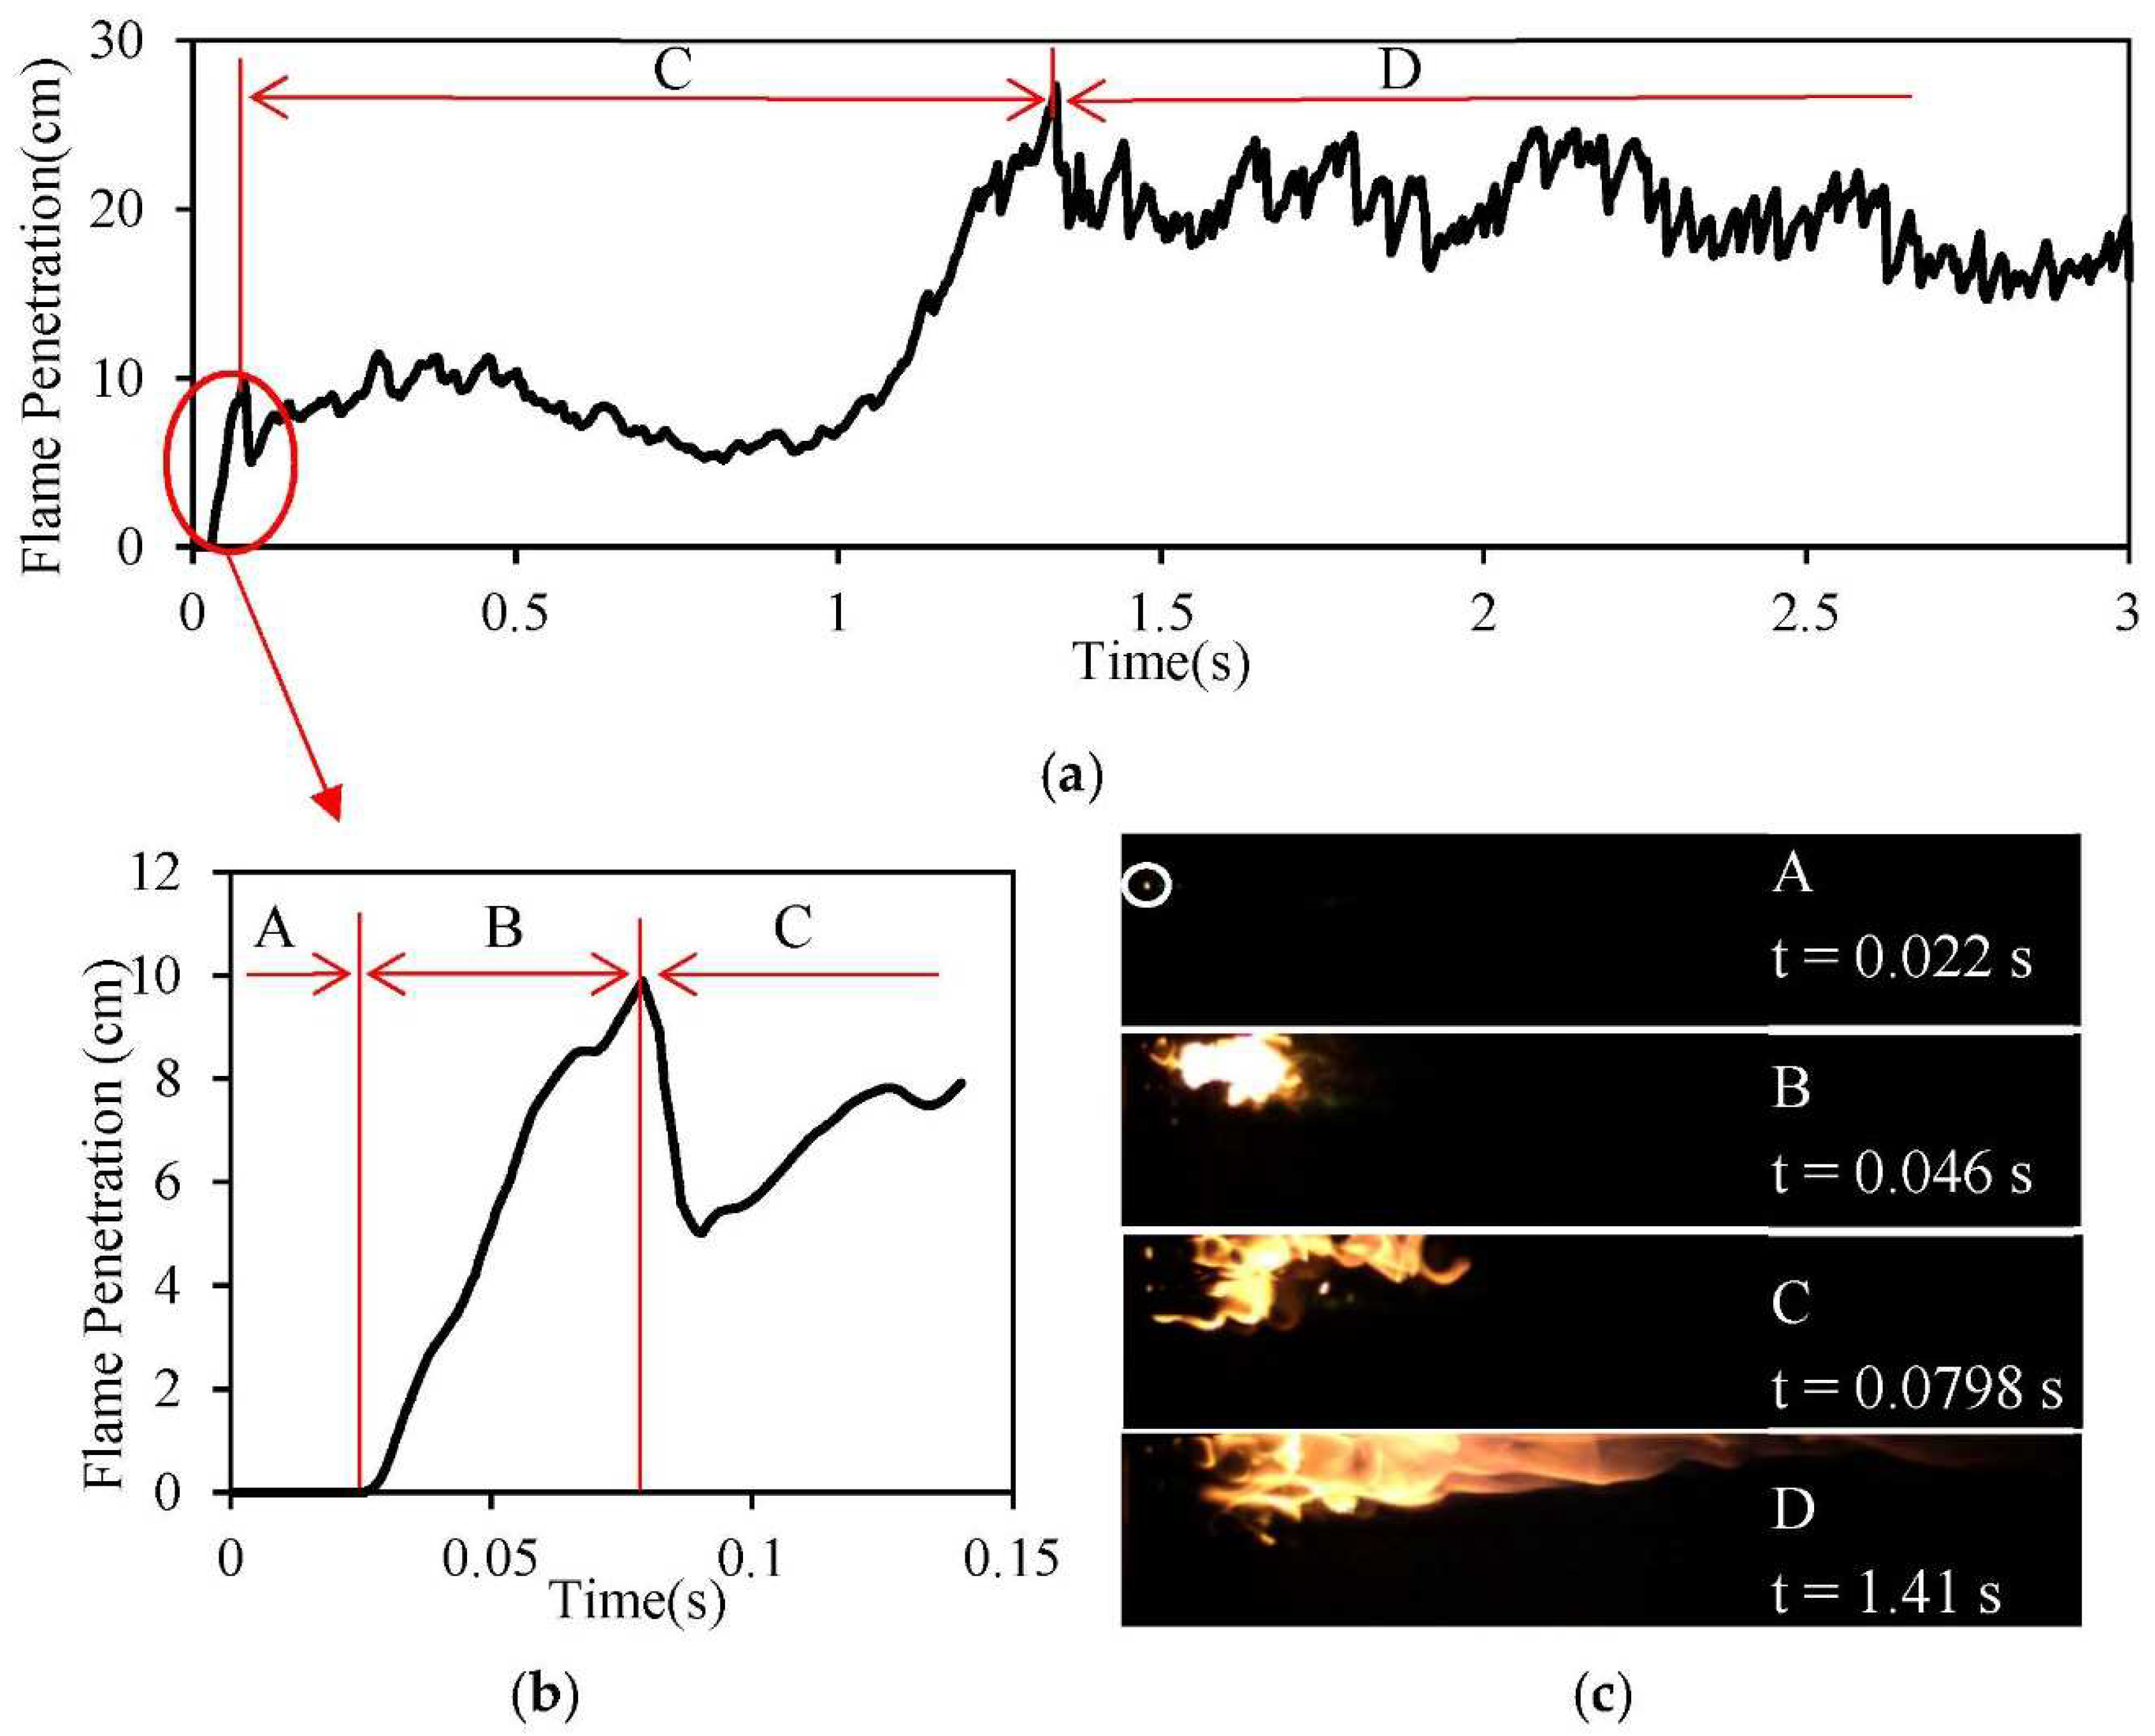
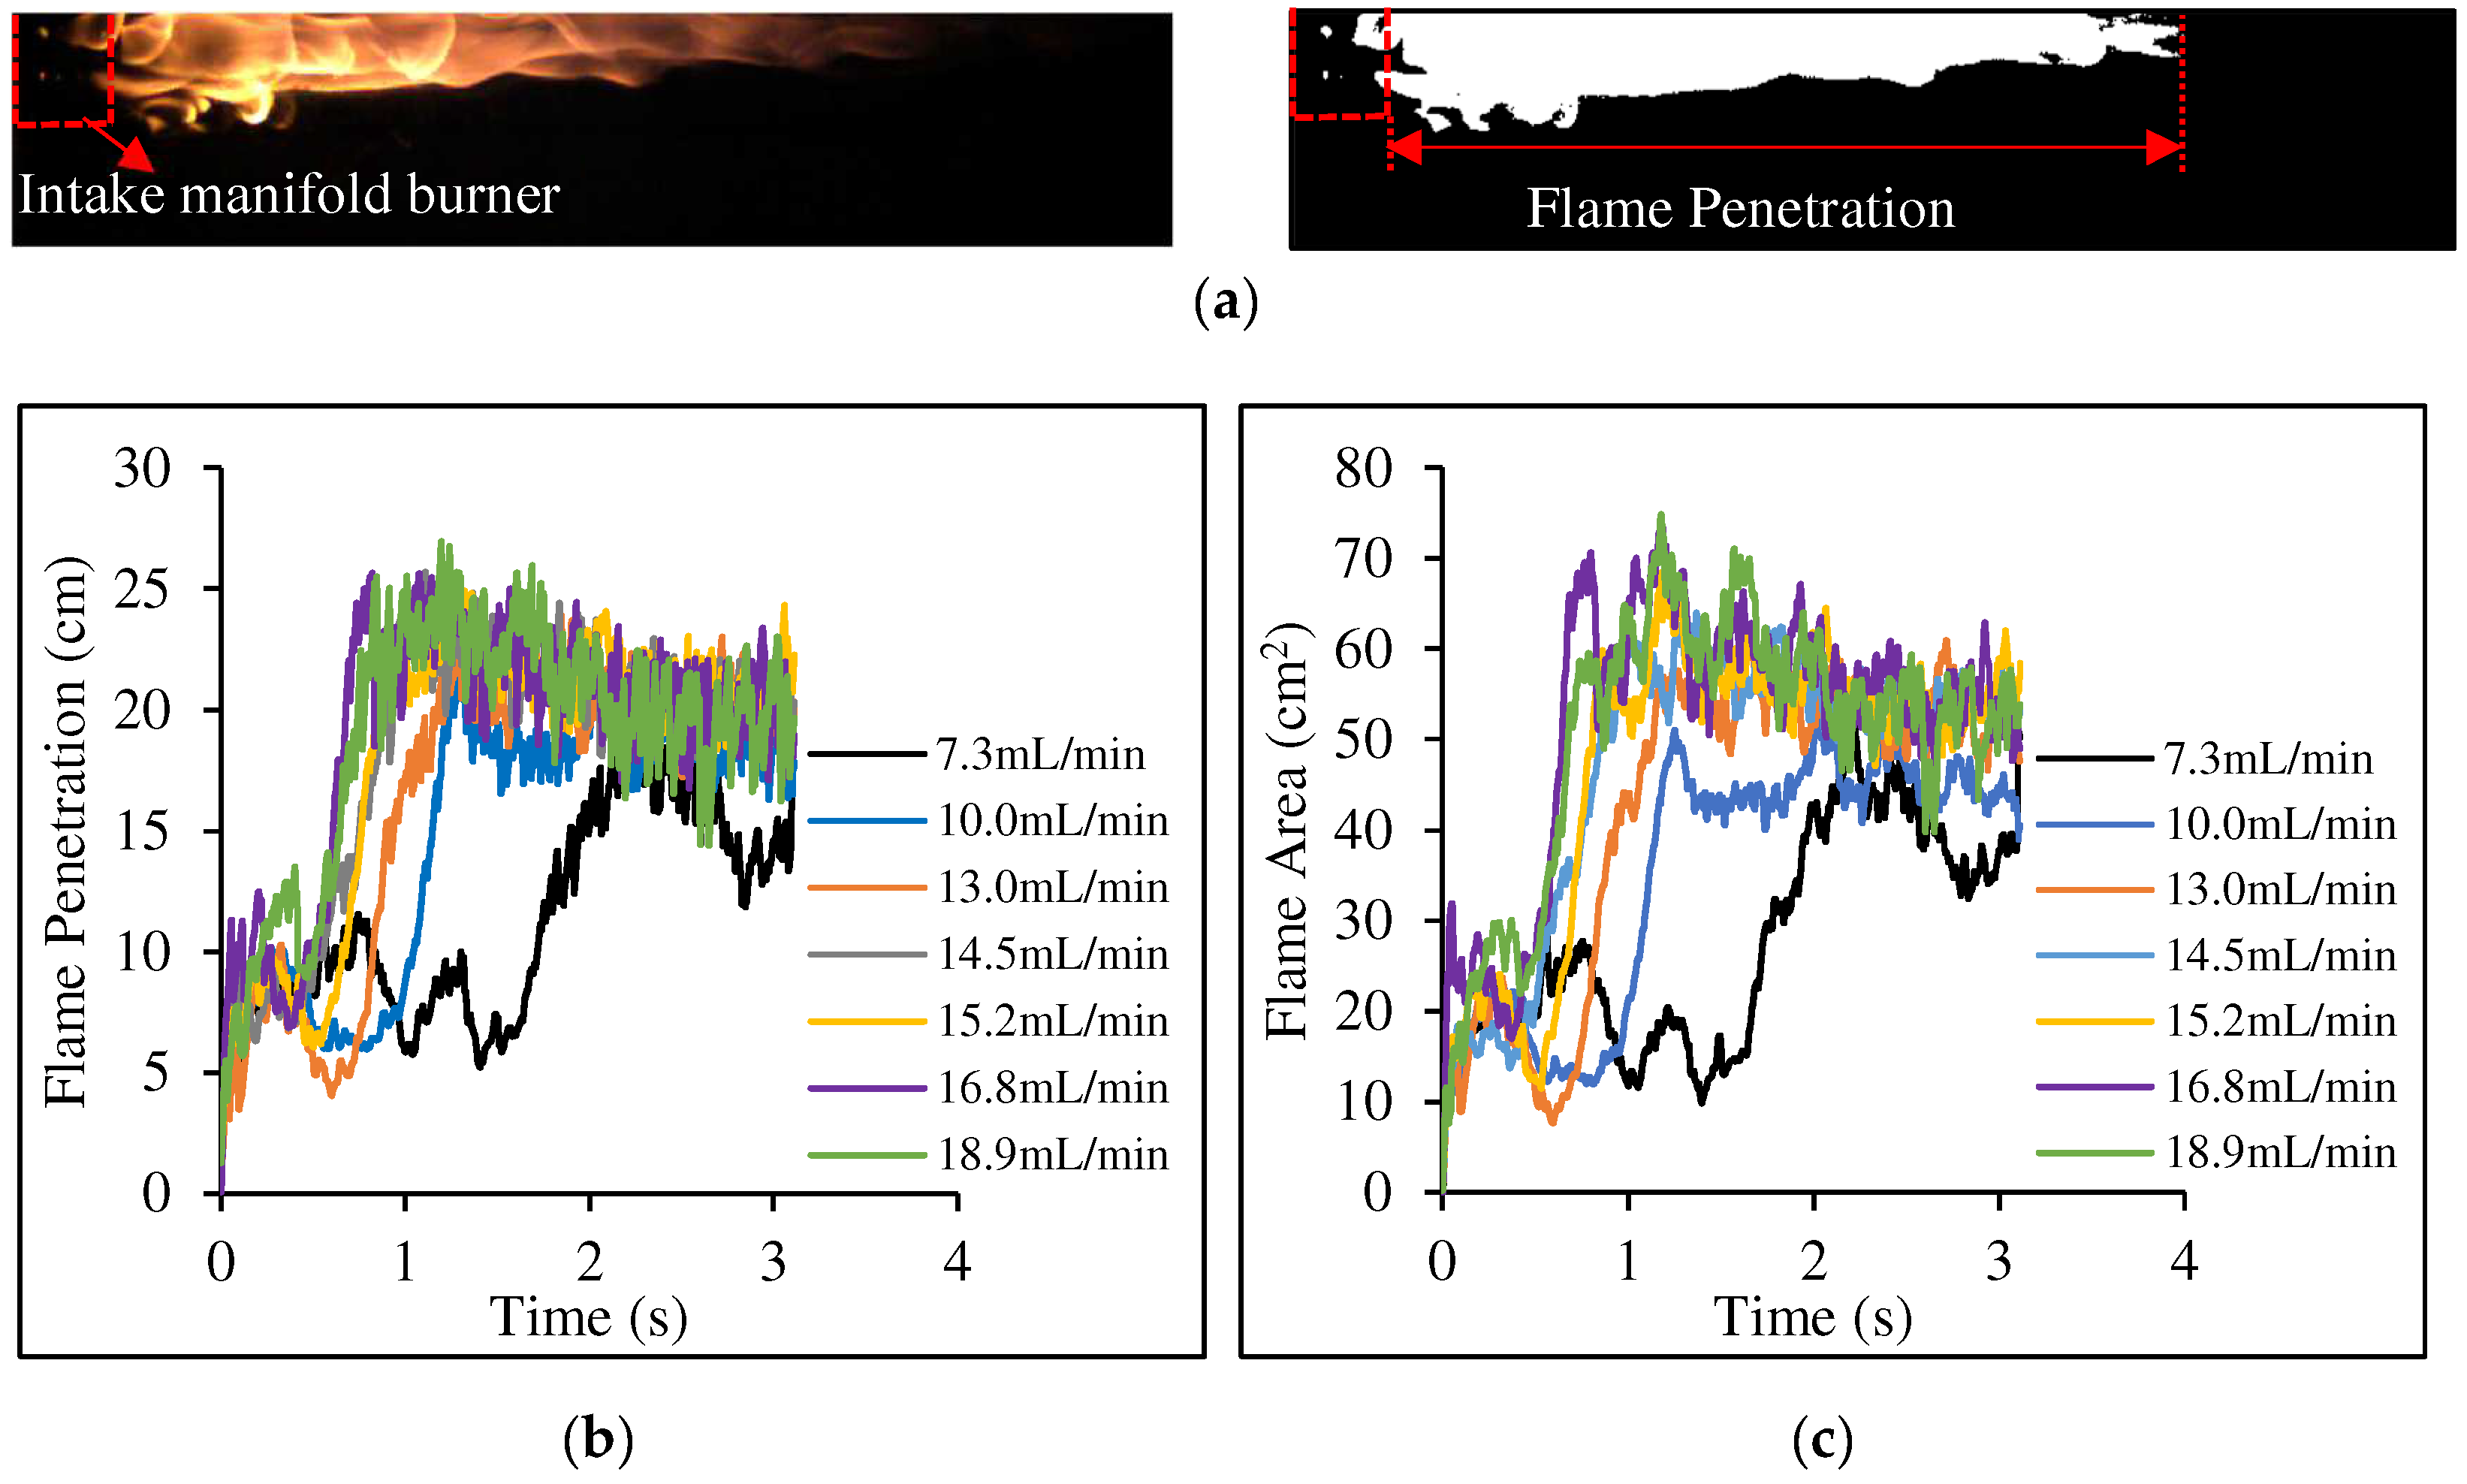
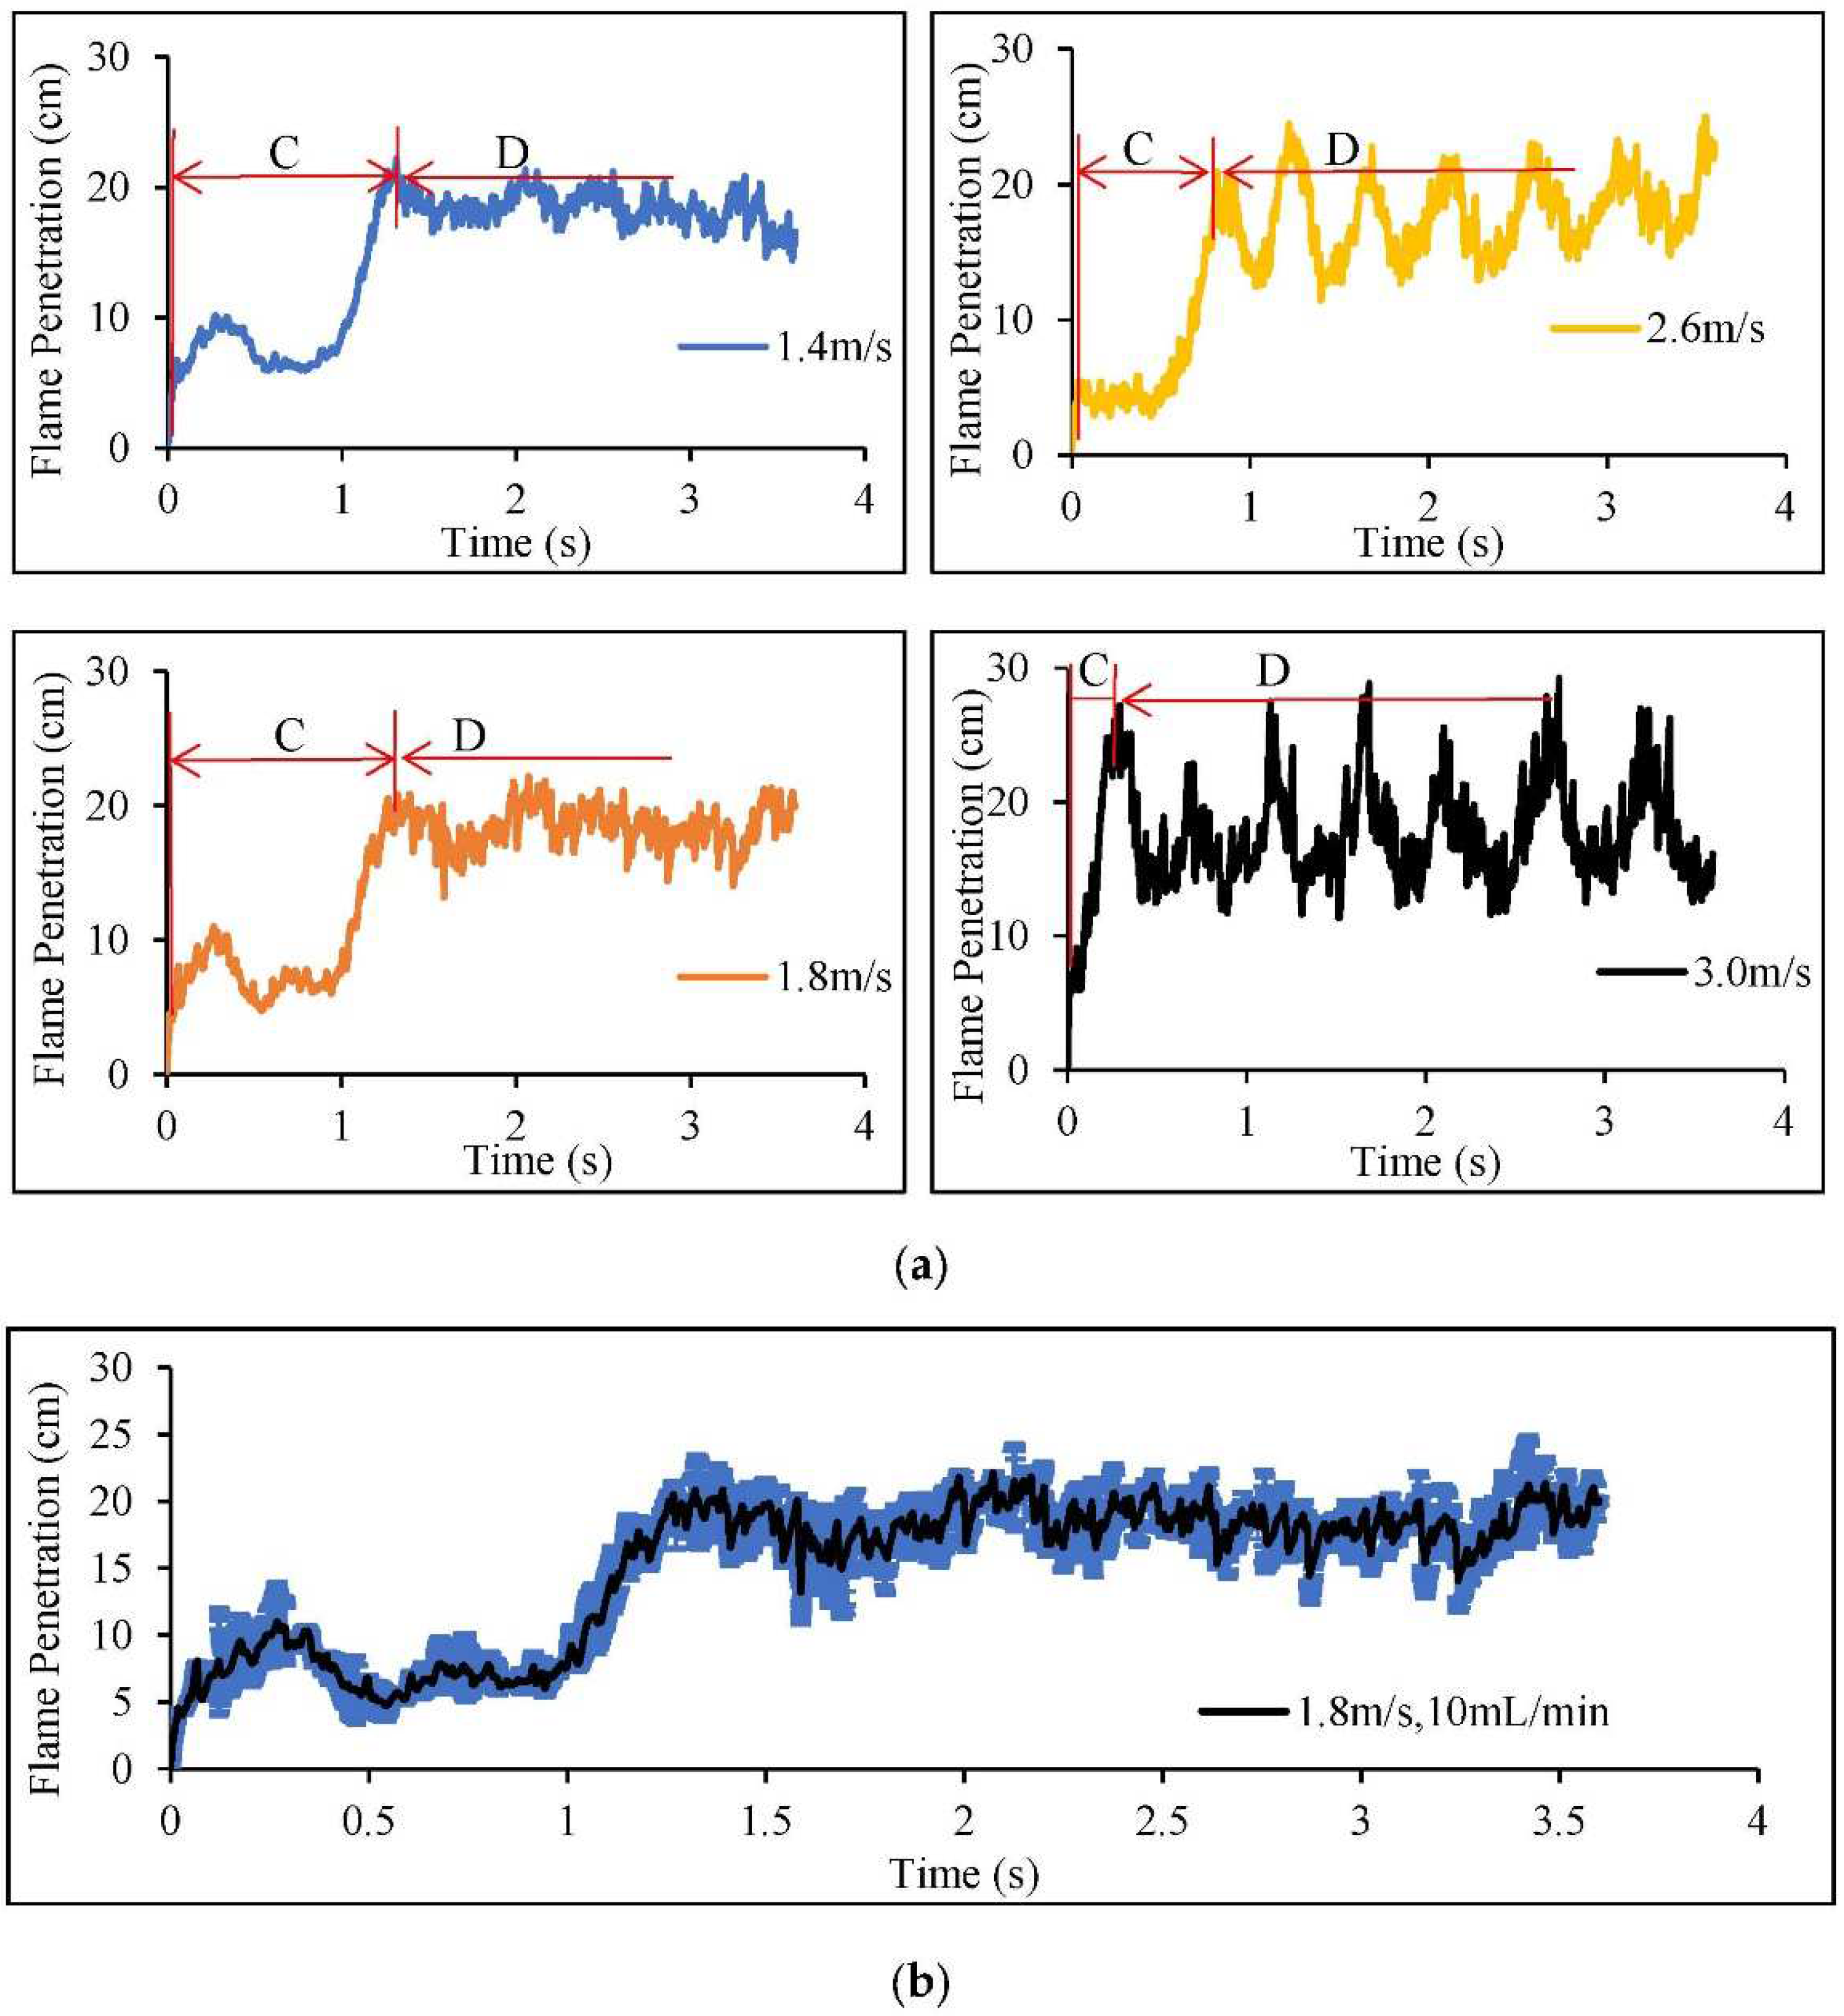
4.2. Flame Penetration
4.2.1. Effect of Diesel Flow Rate on the Flame Penetration
4.2.2. Effect of Intake Air Flow velocity on the Flame Penetration
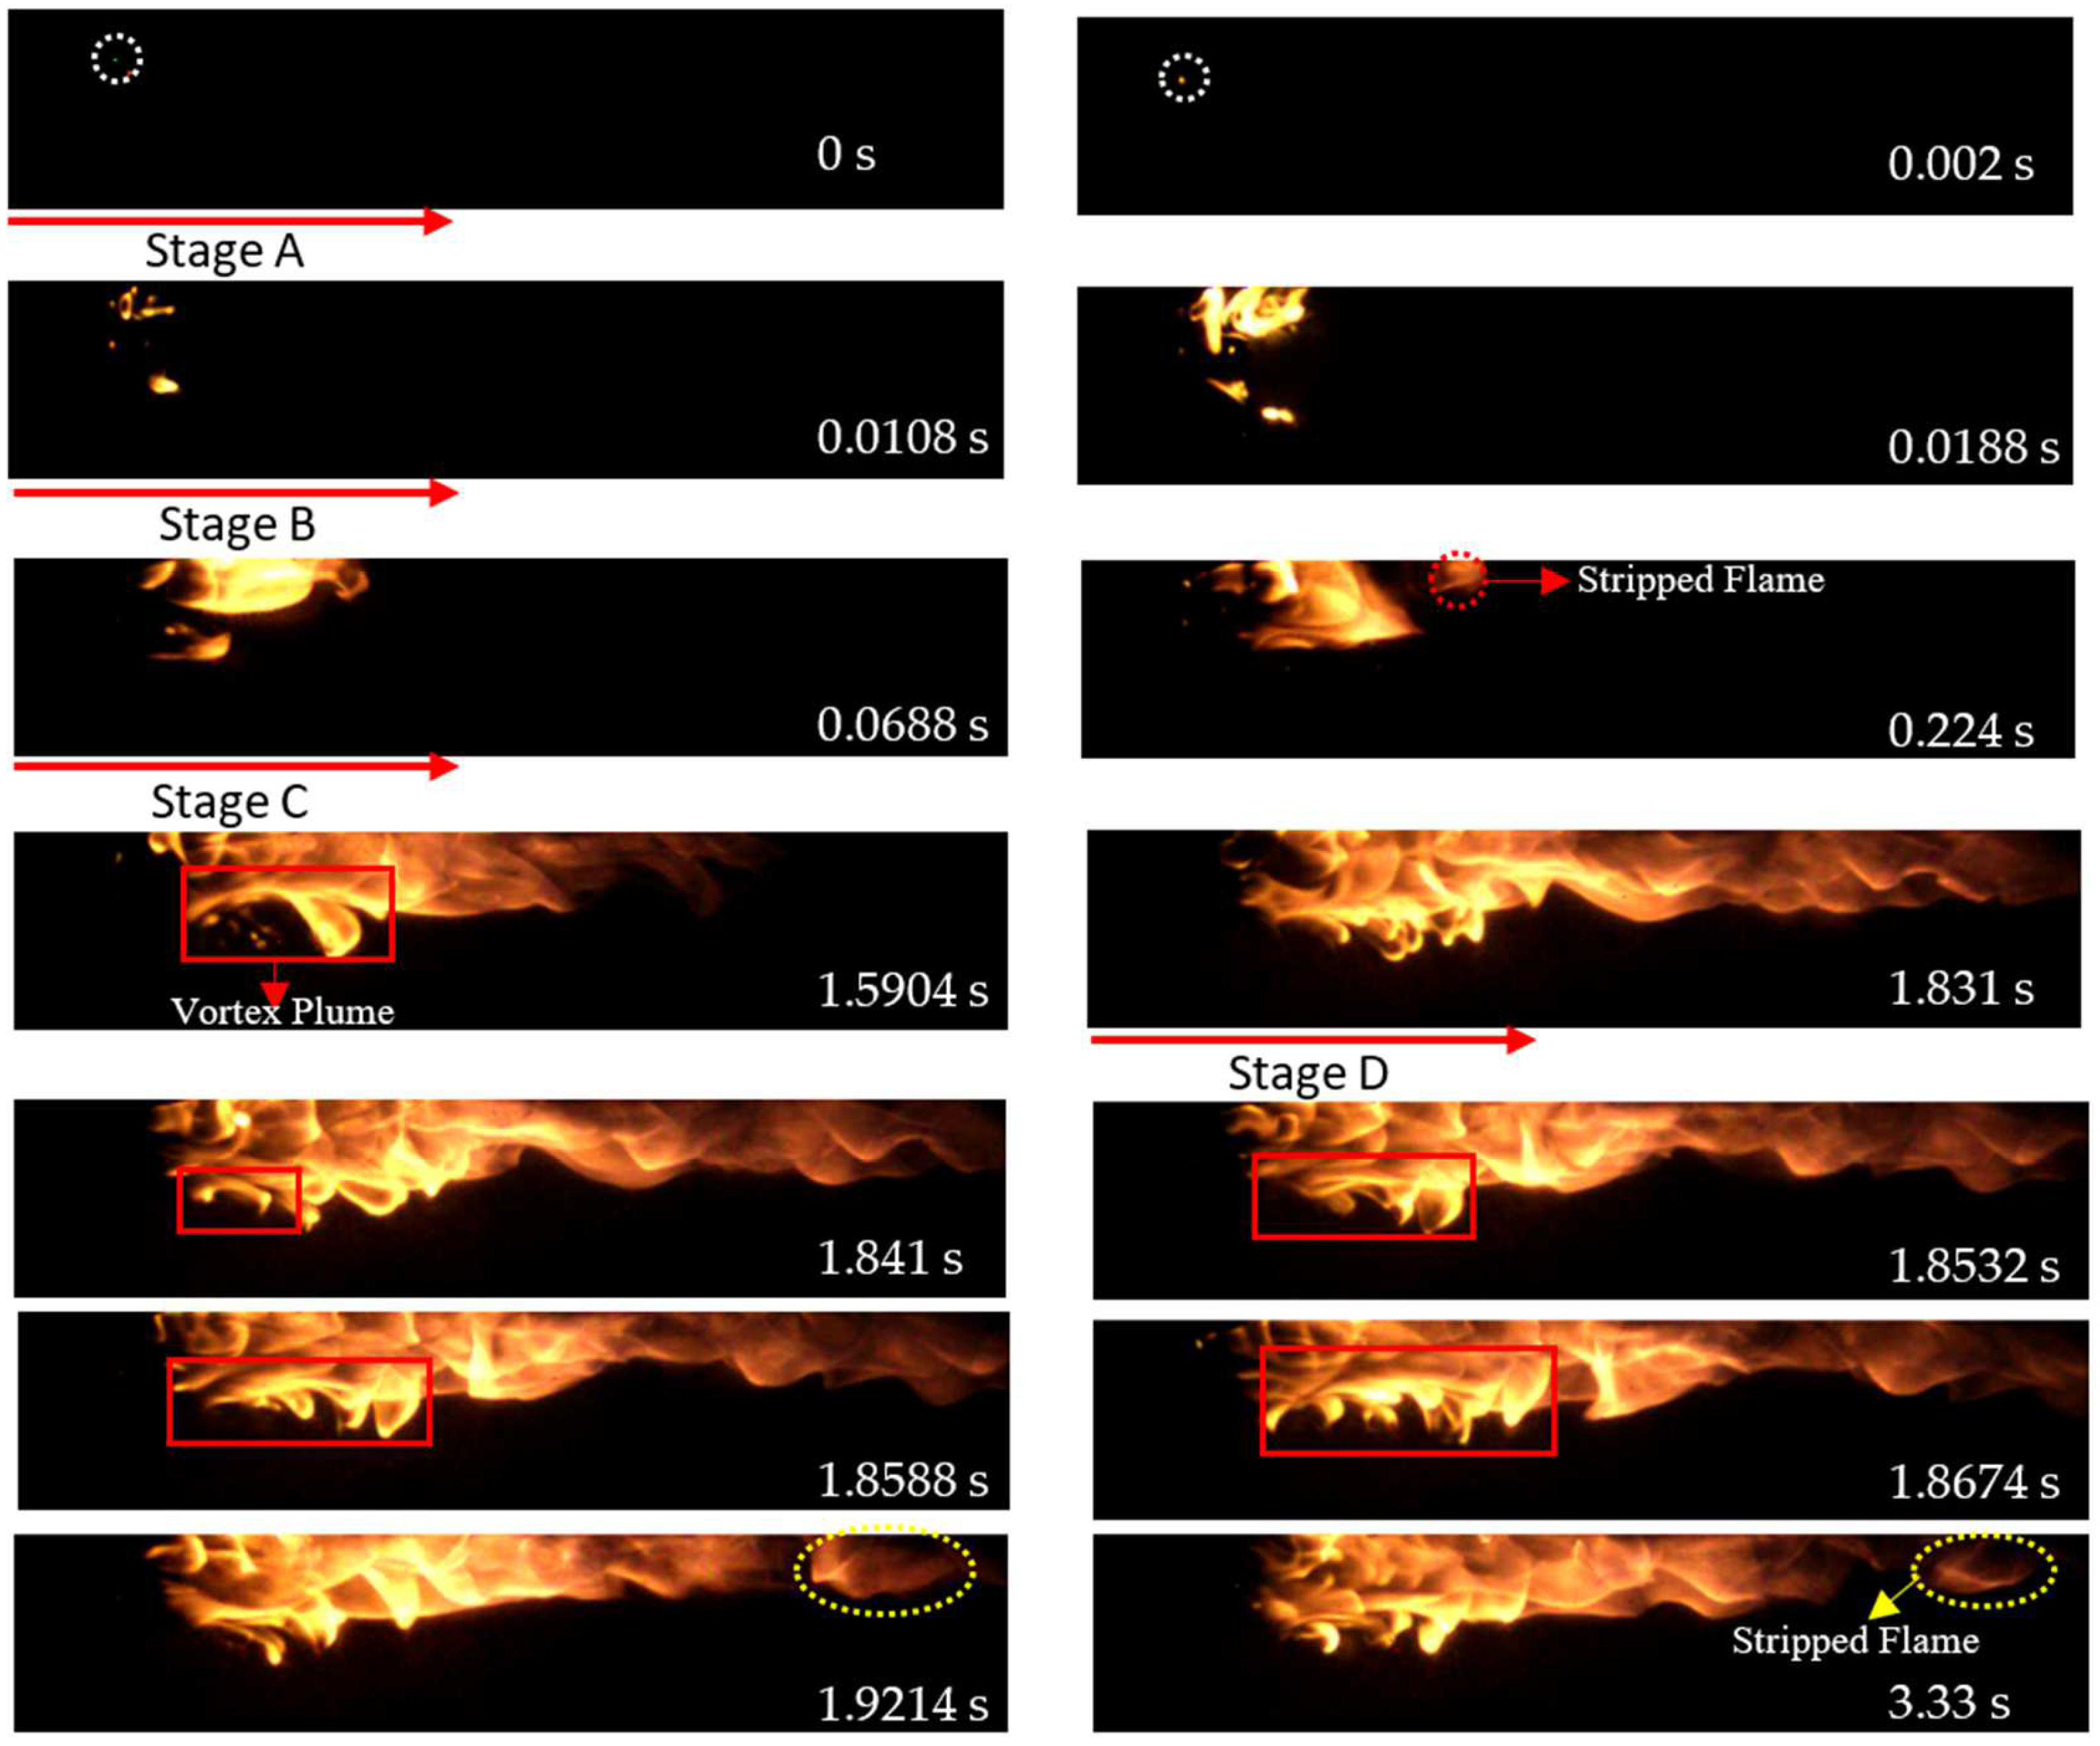
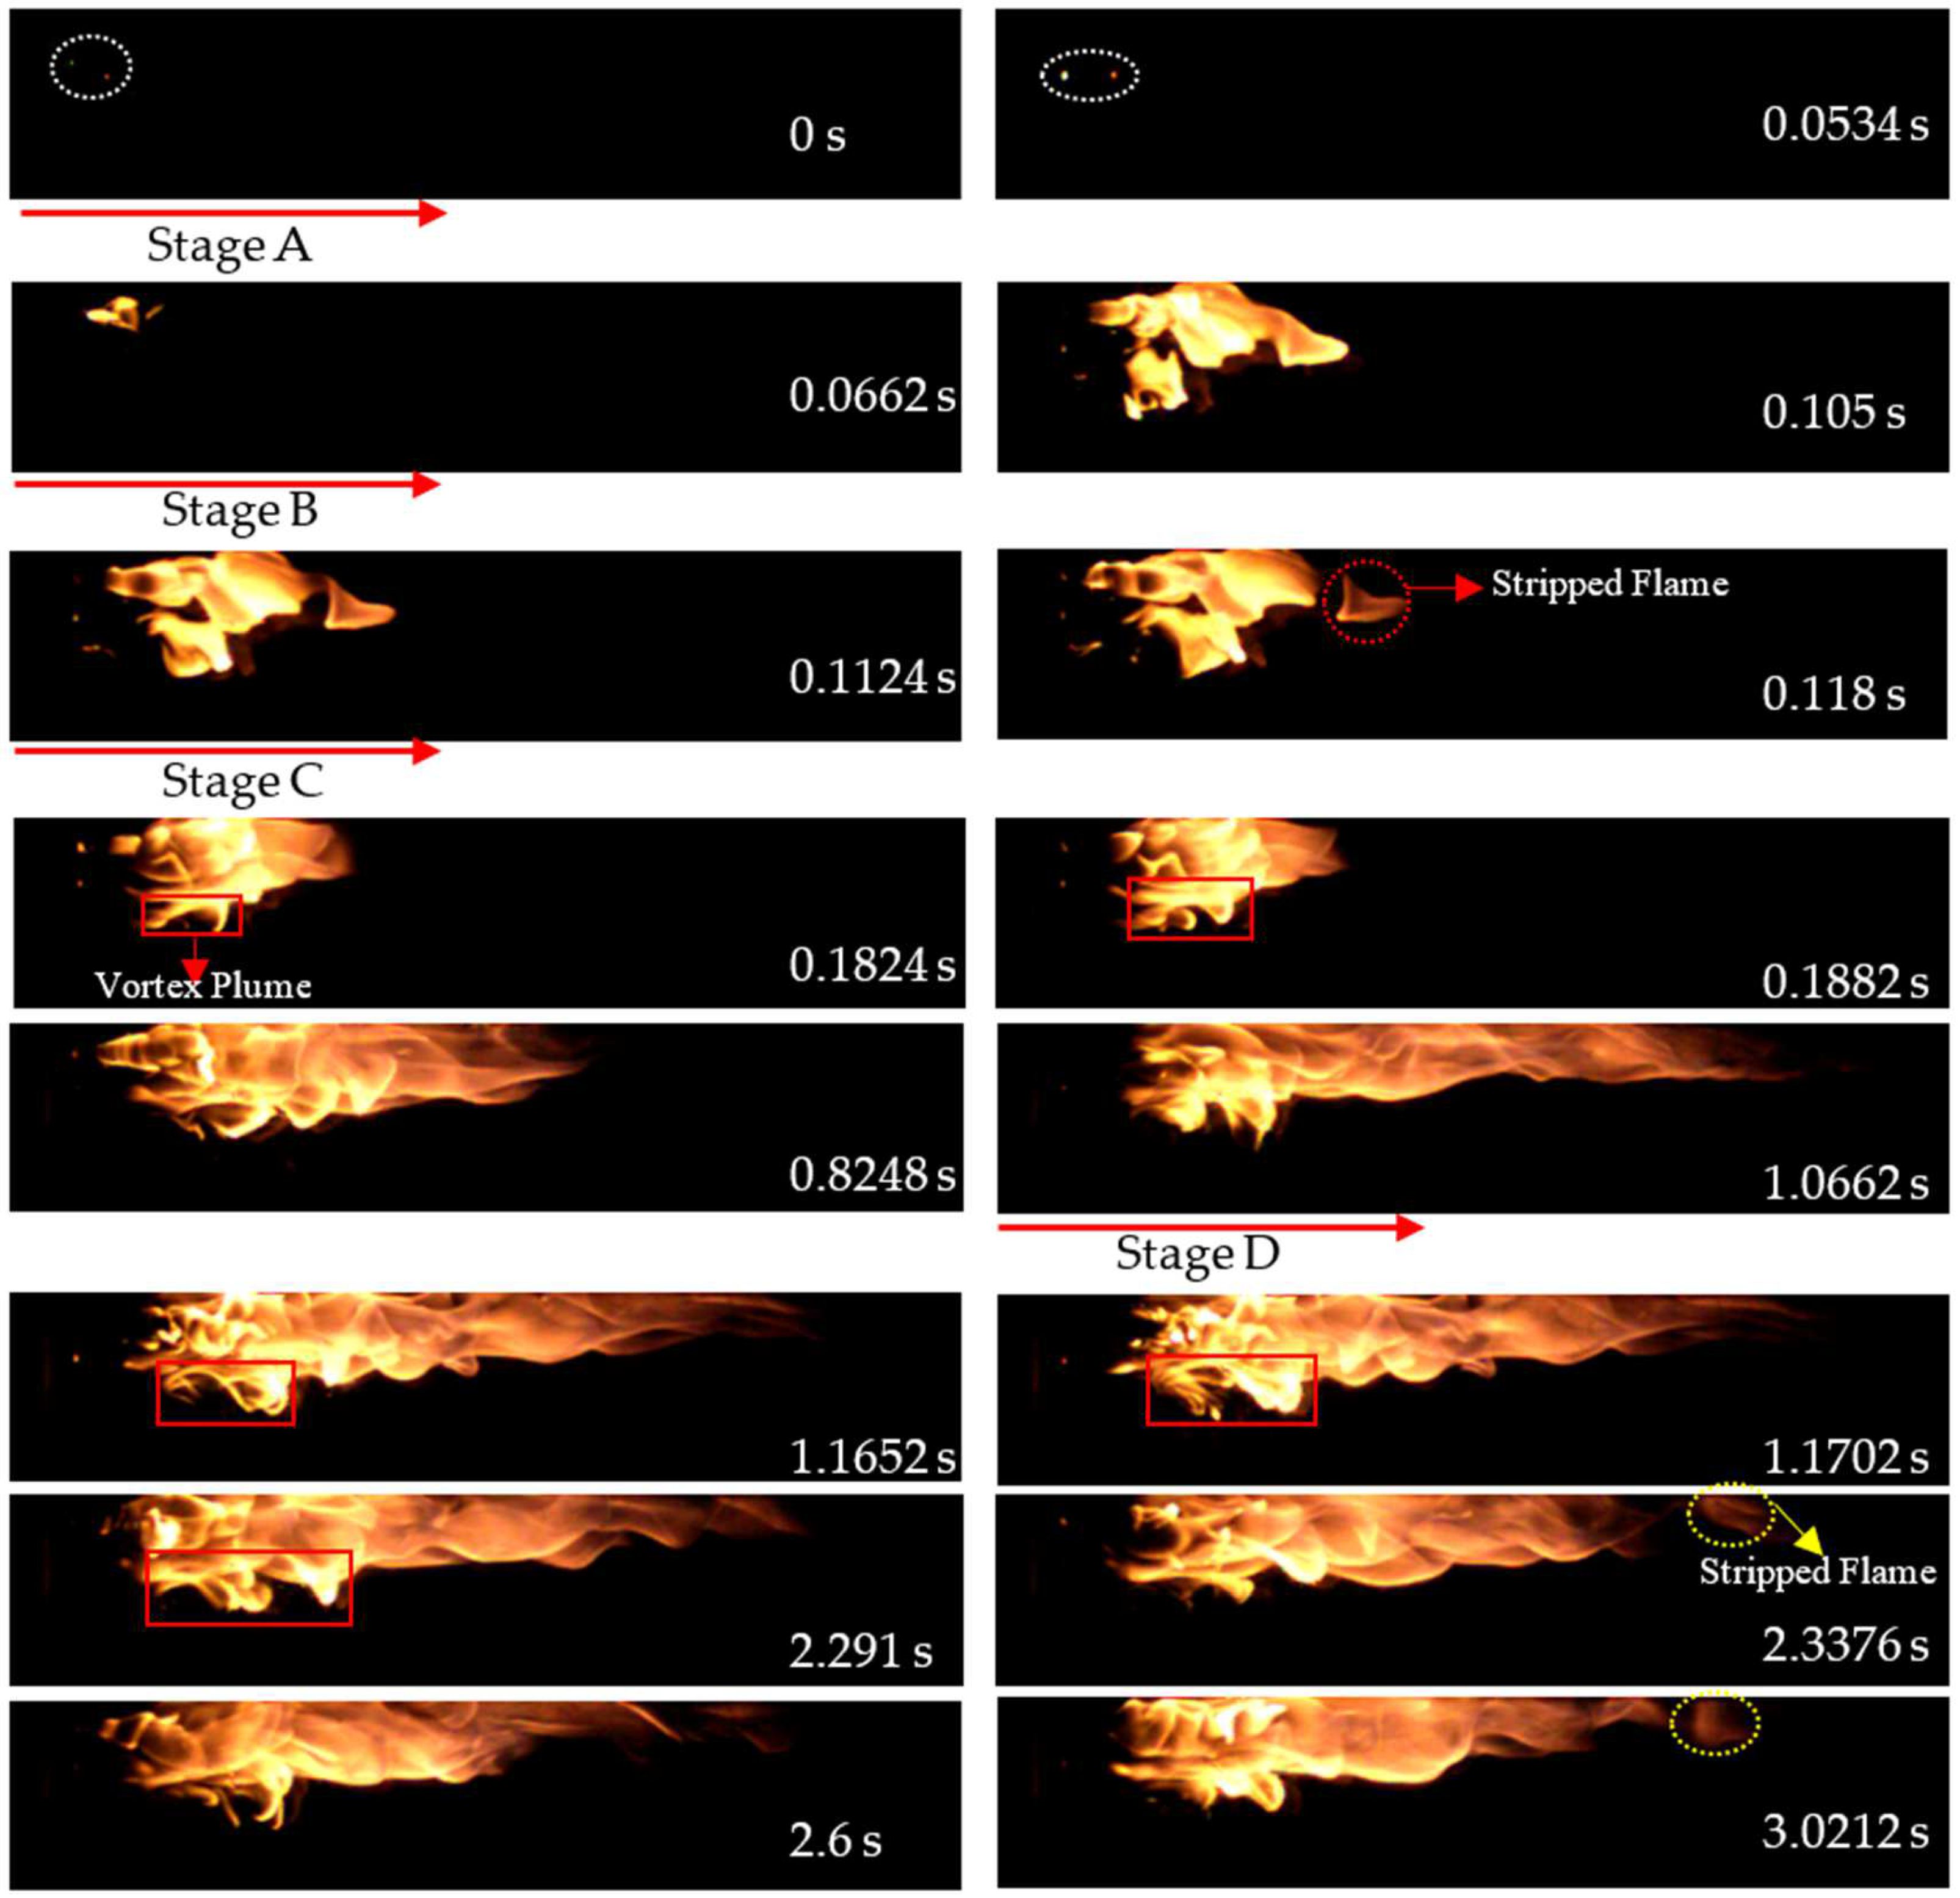
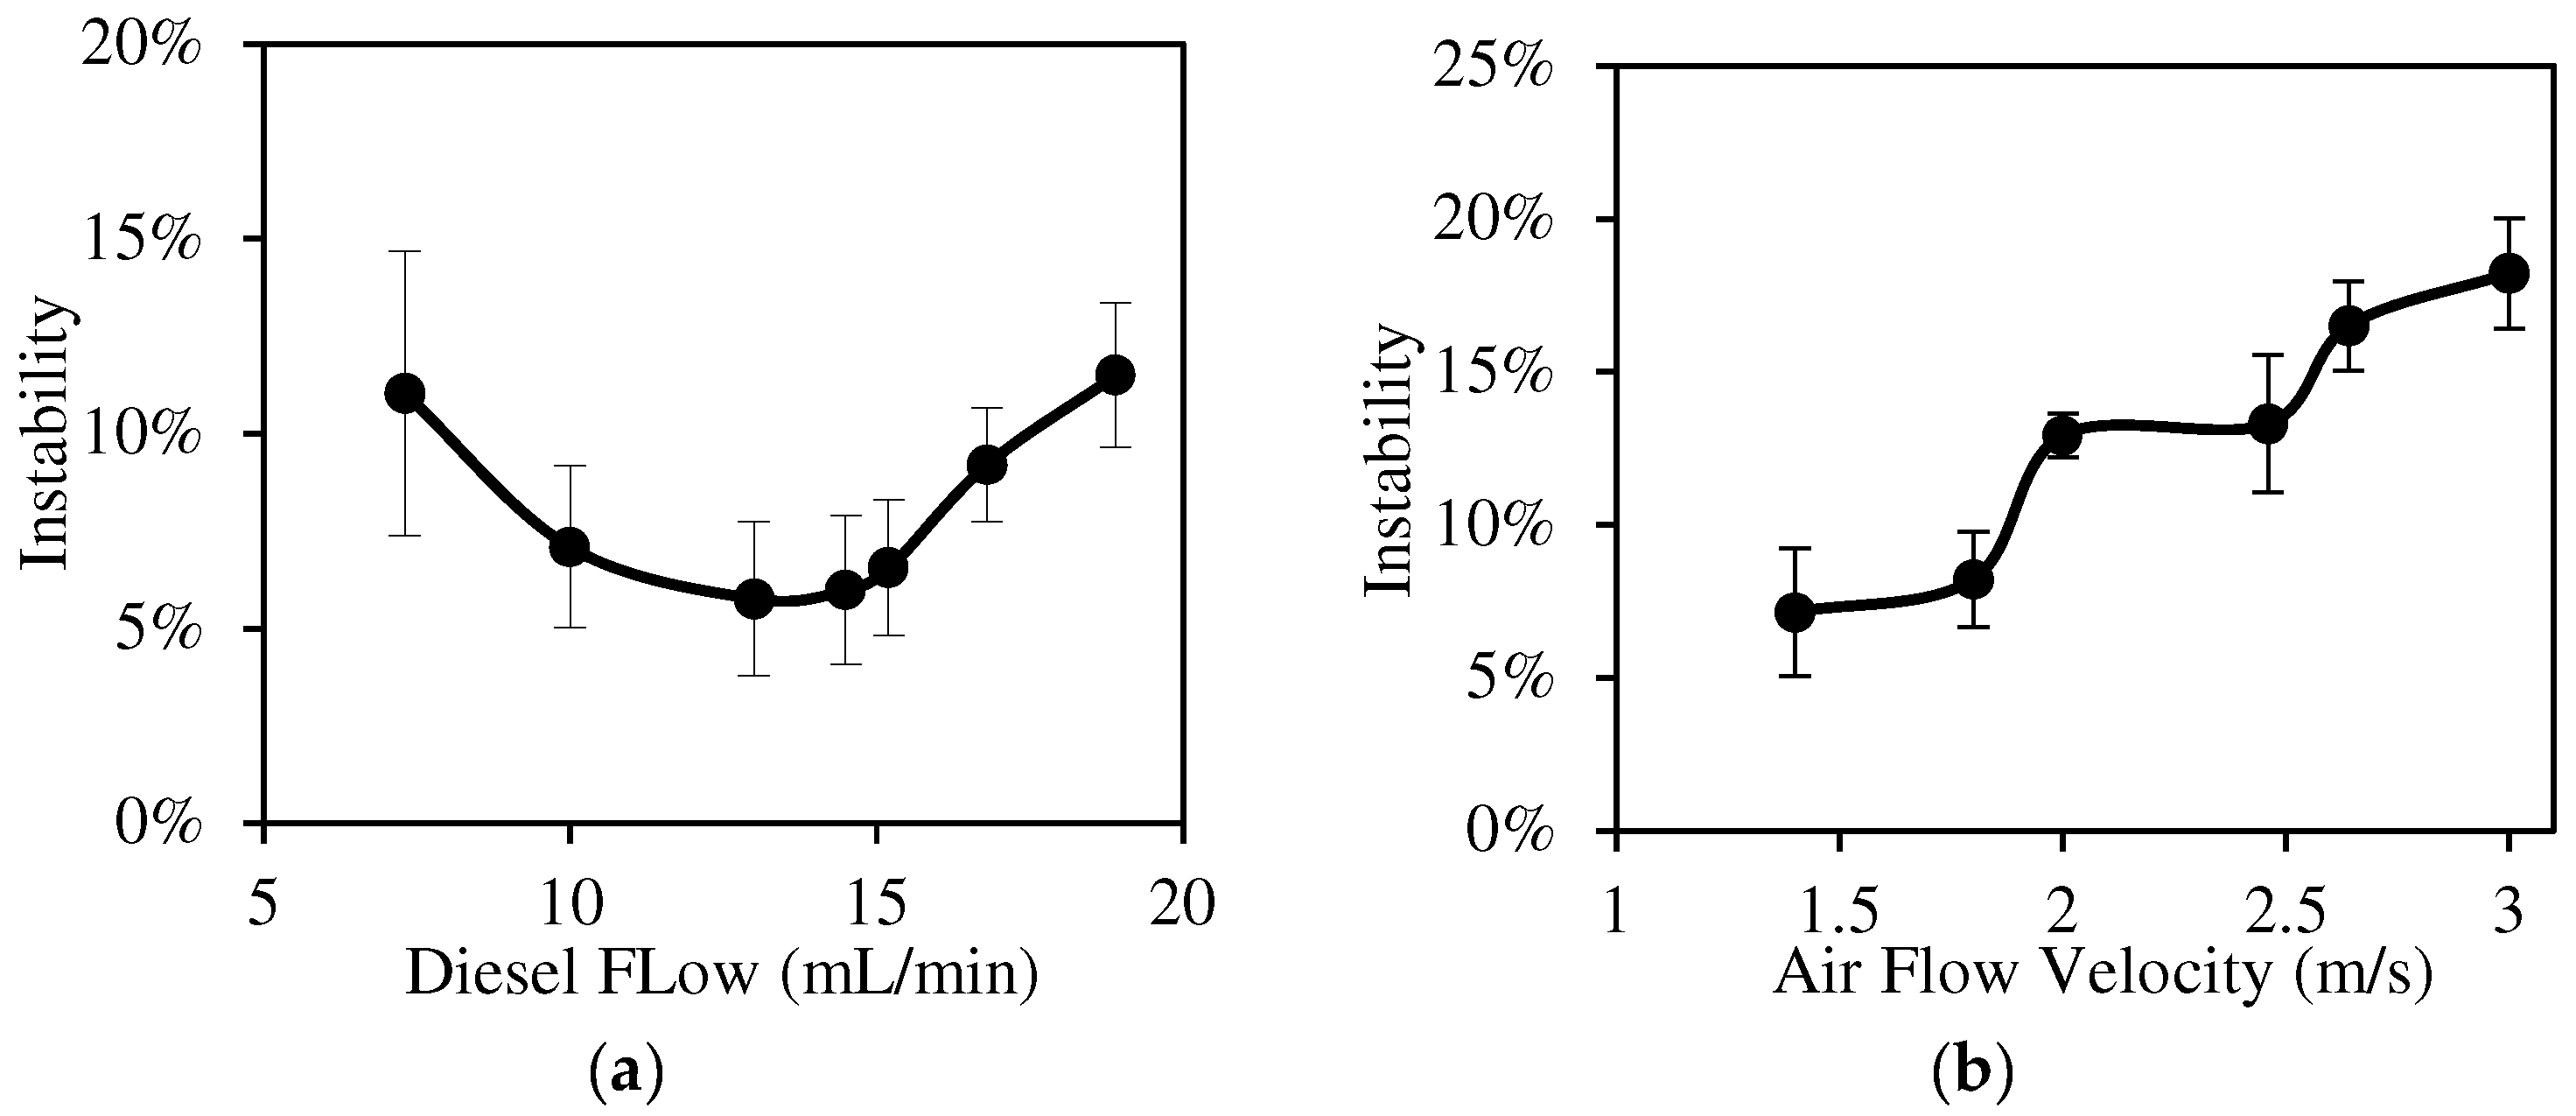
4.3. Combustion Instability
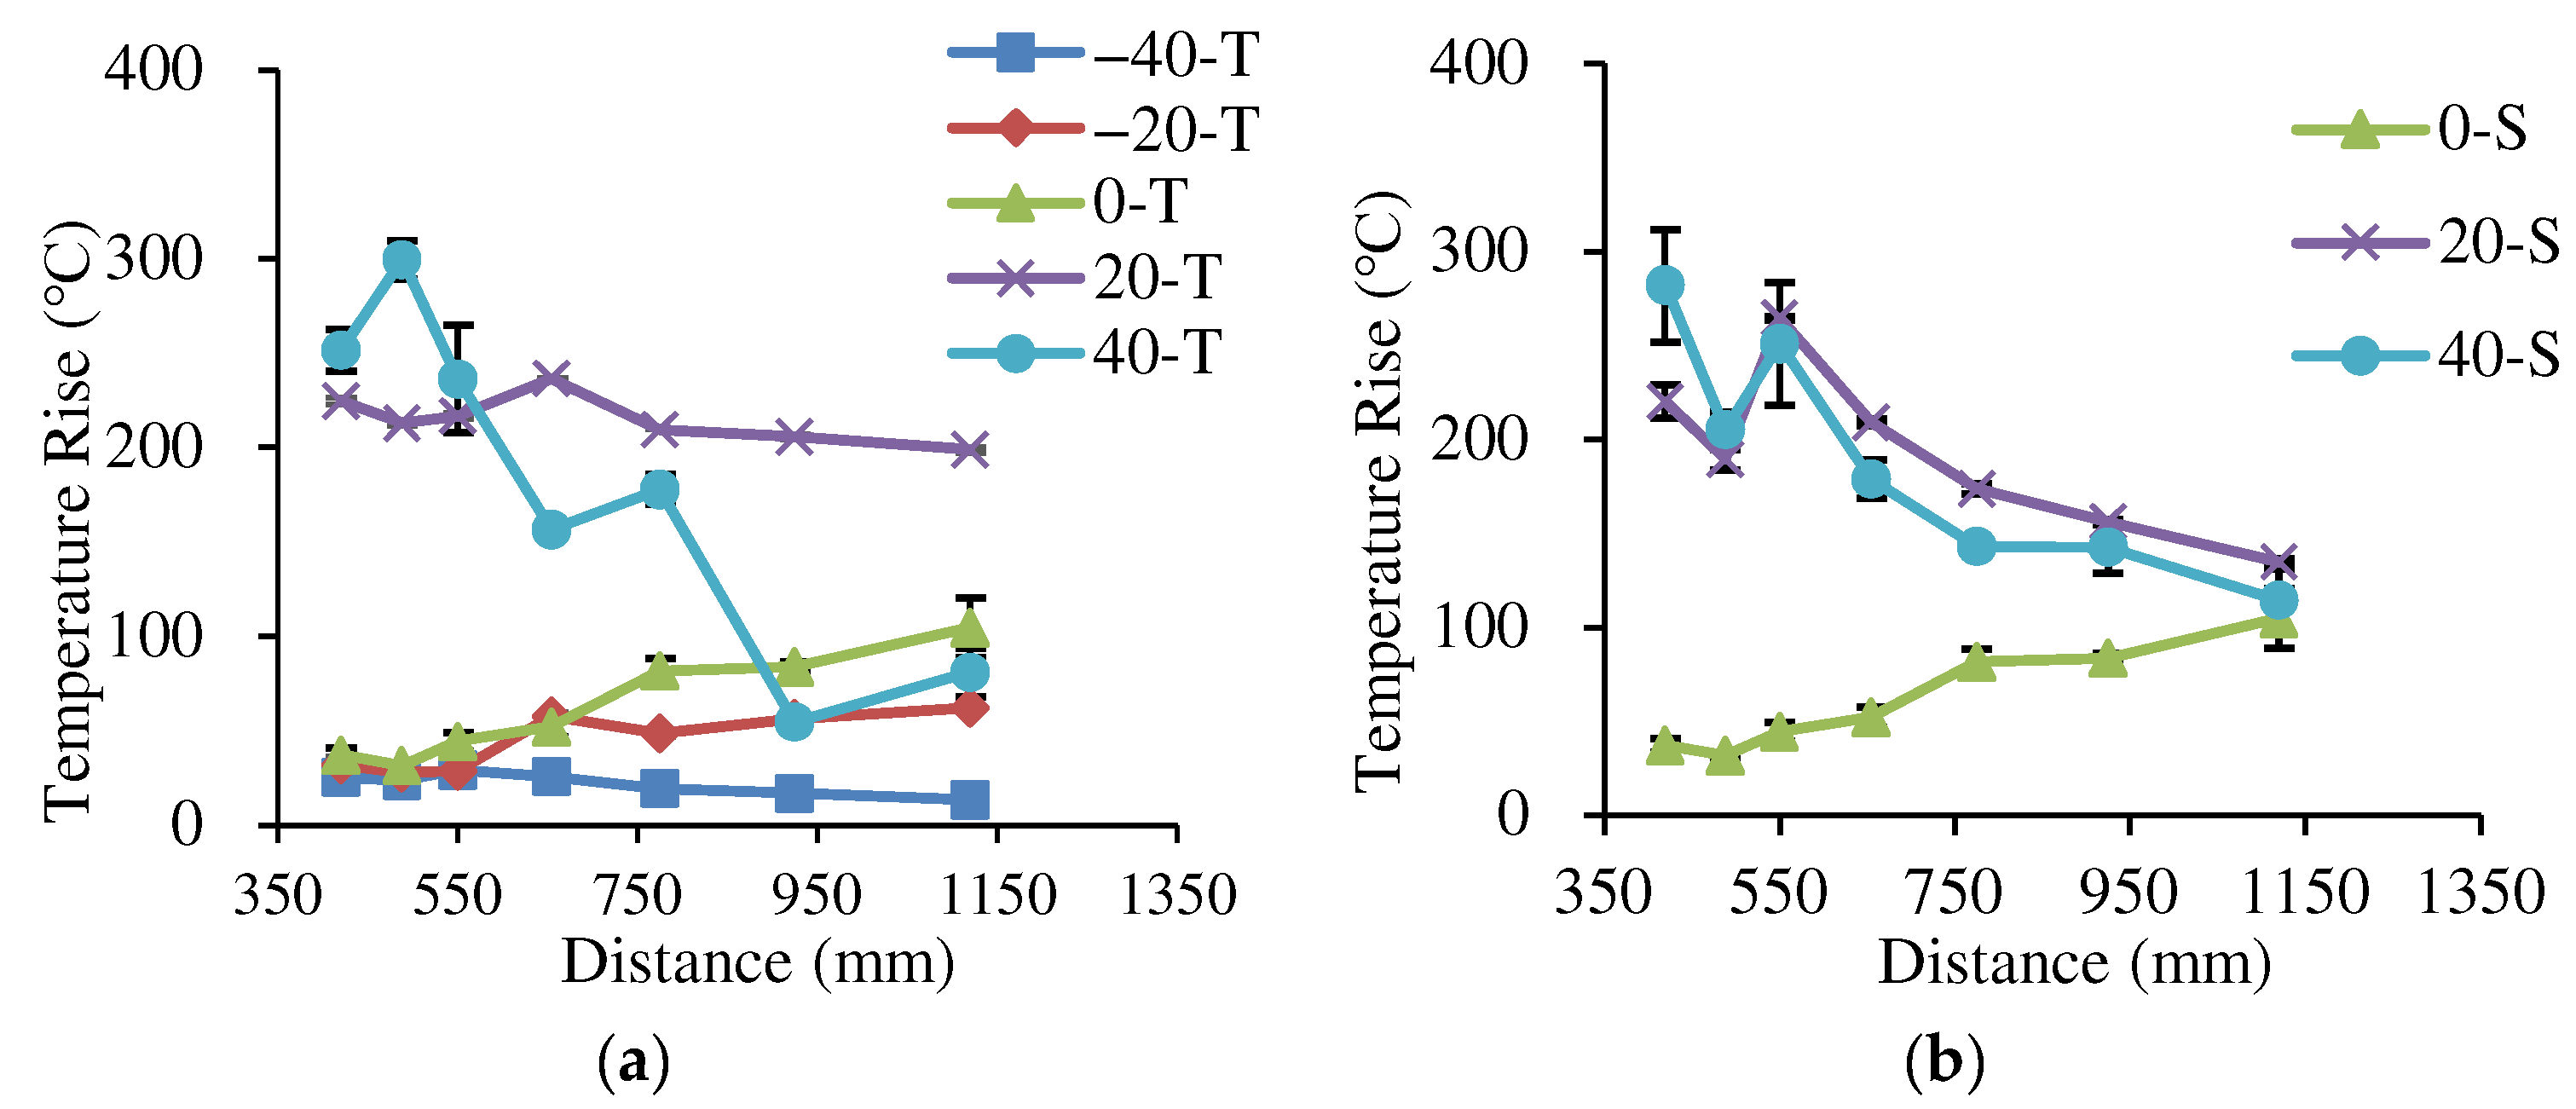
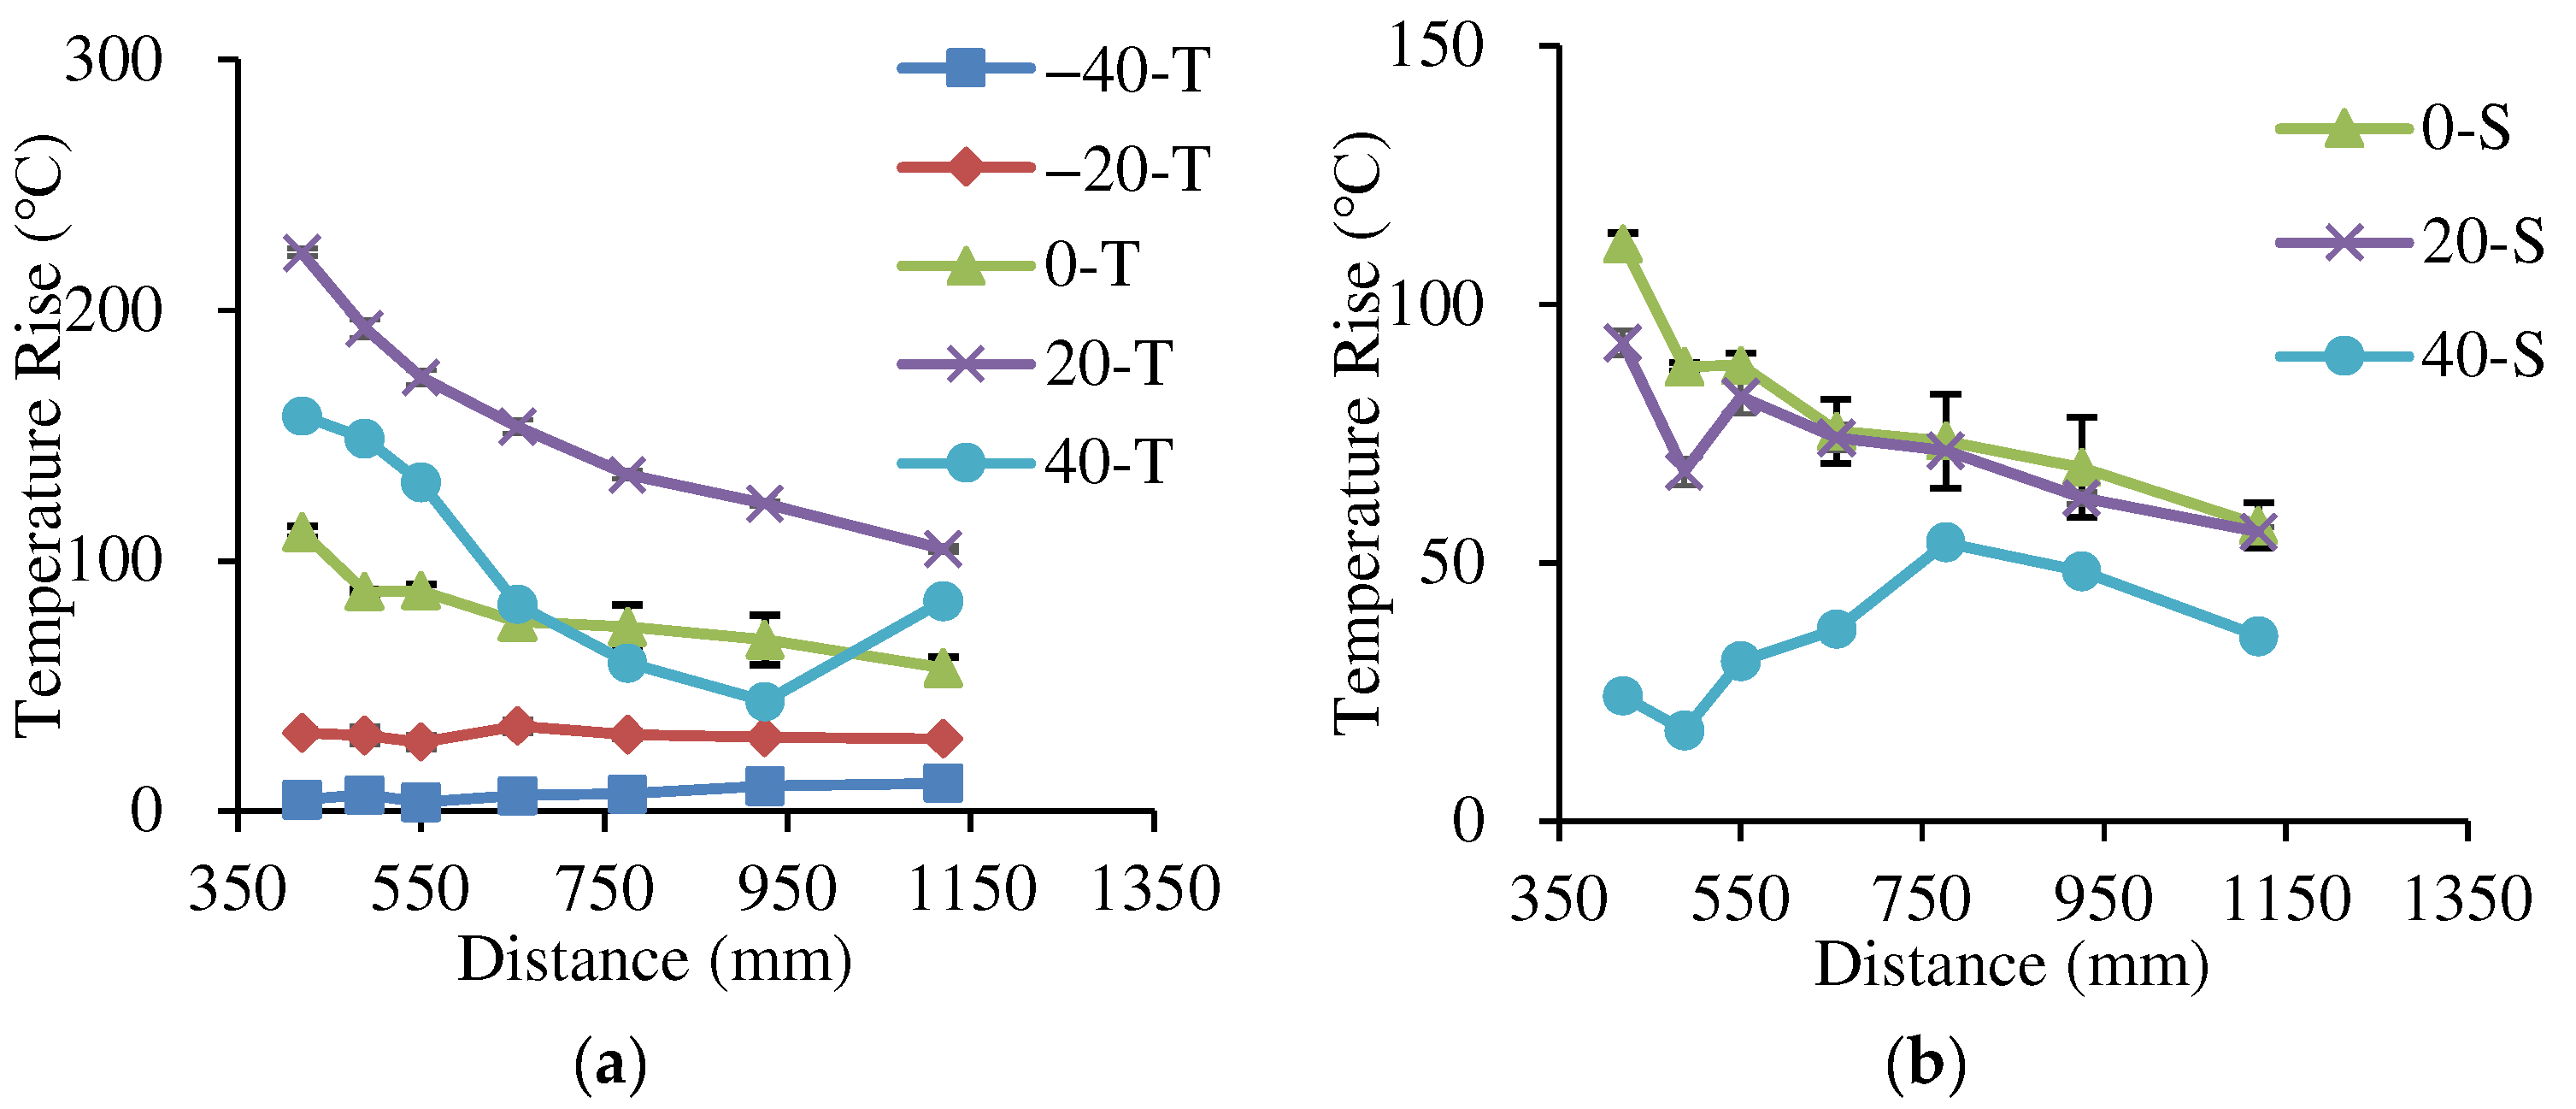
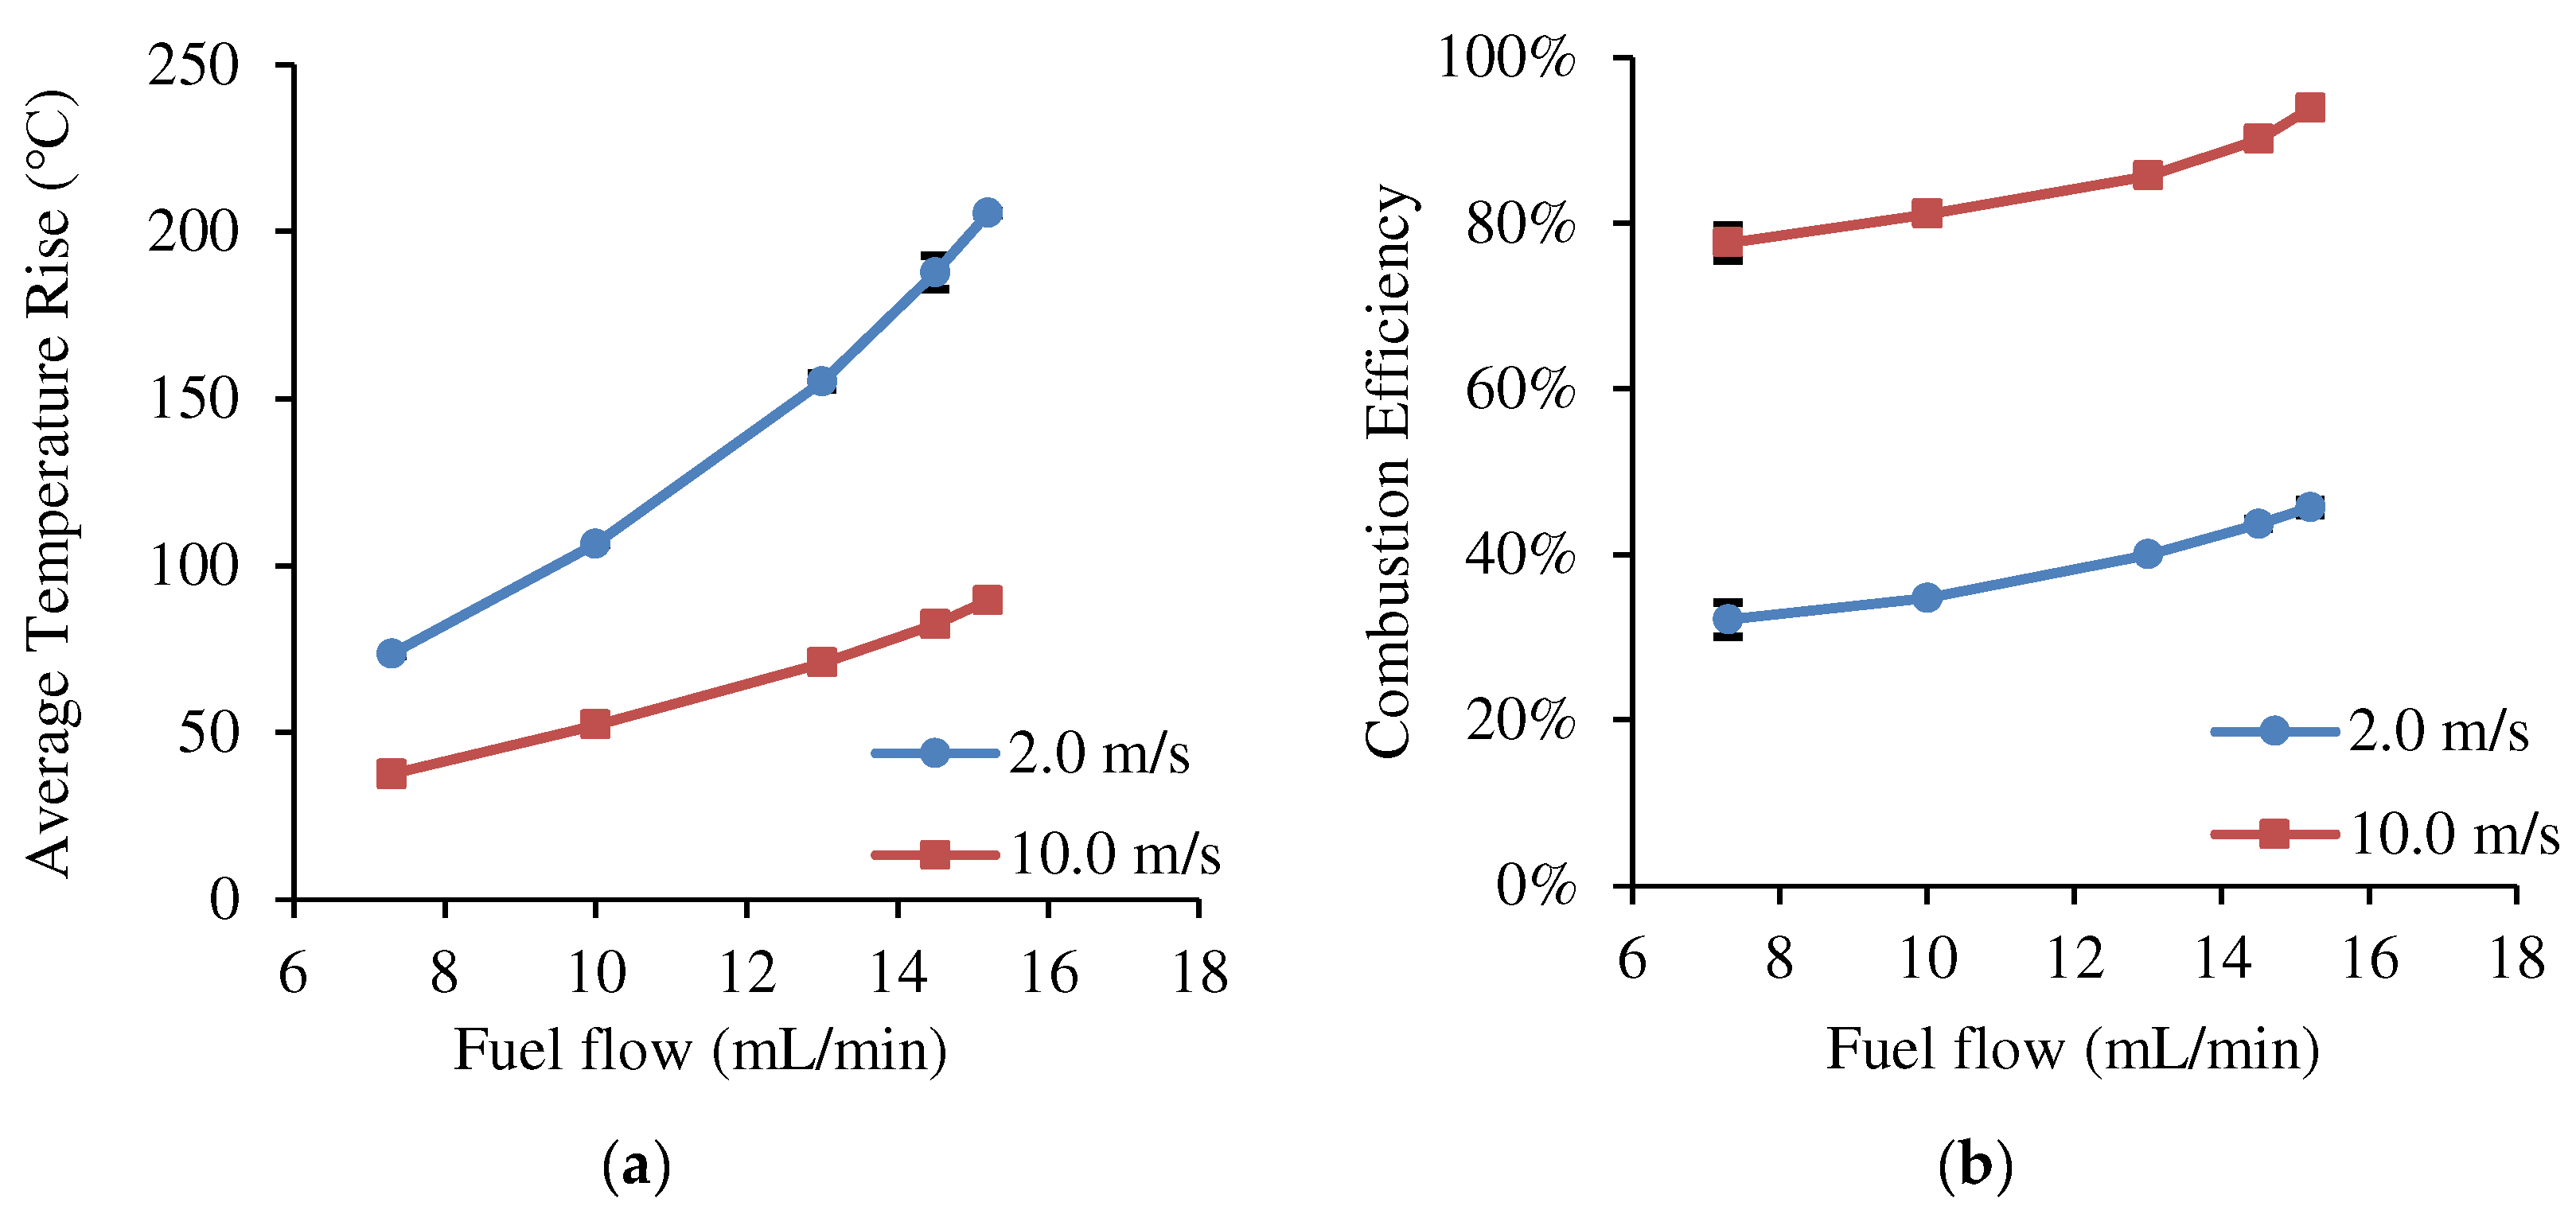
4.4. Preheating Effect of the Intake Manifold Burner
5. Summary and Conclusions
5.1. Conclusions
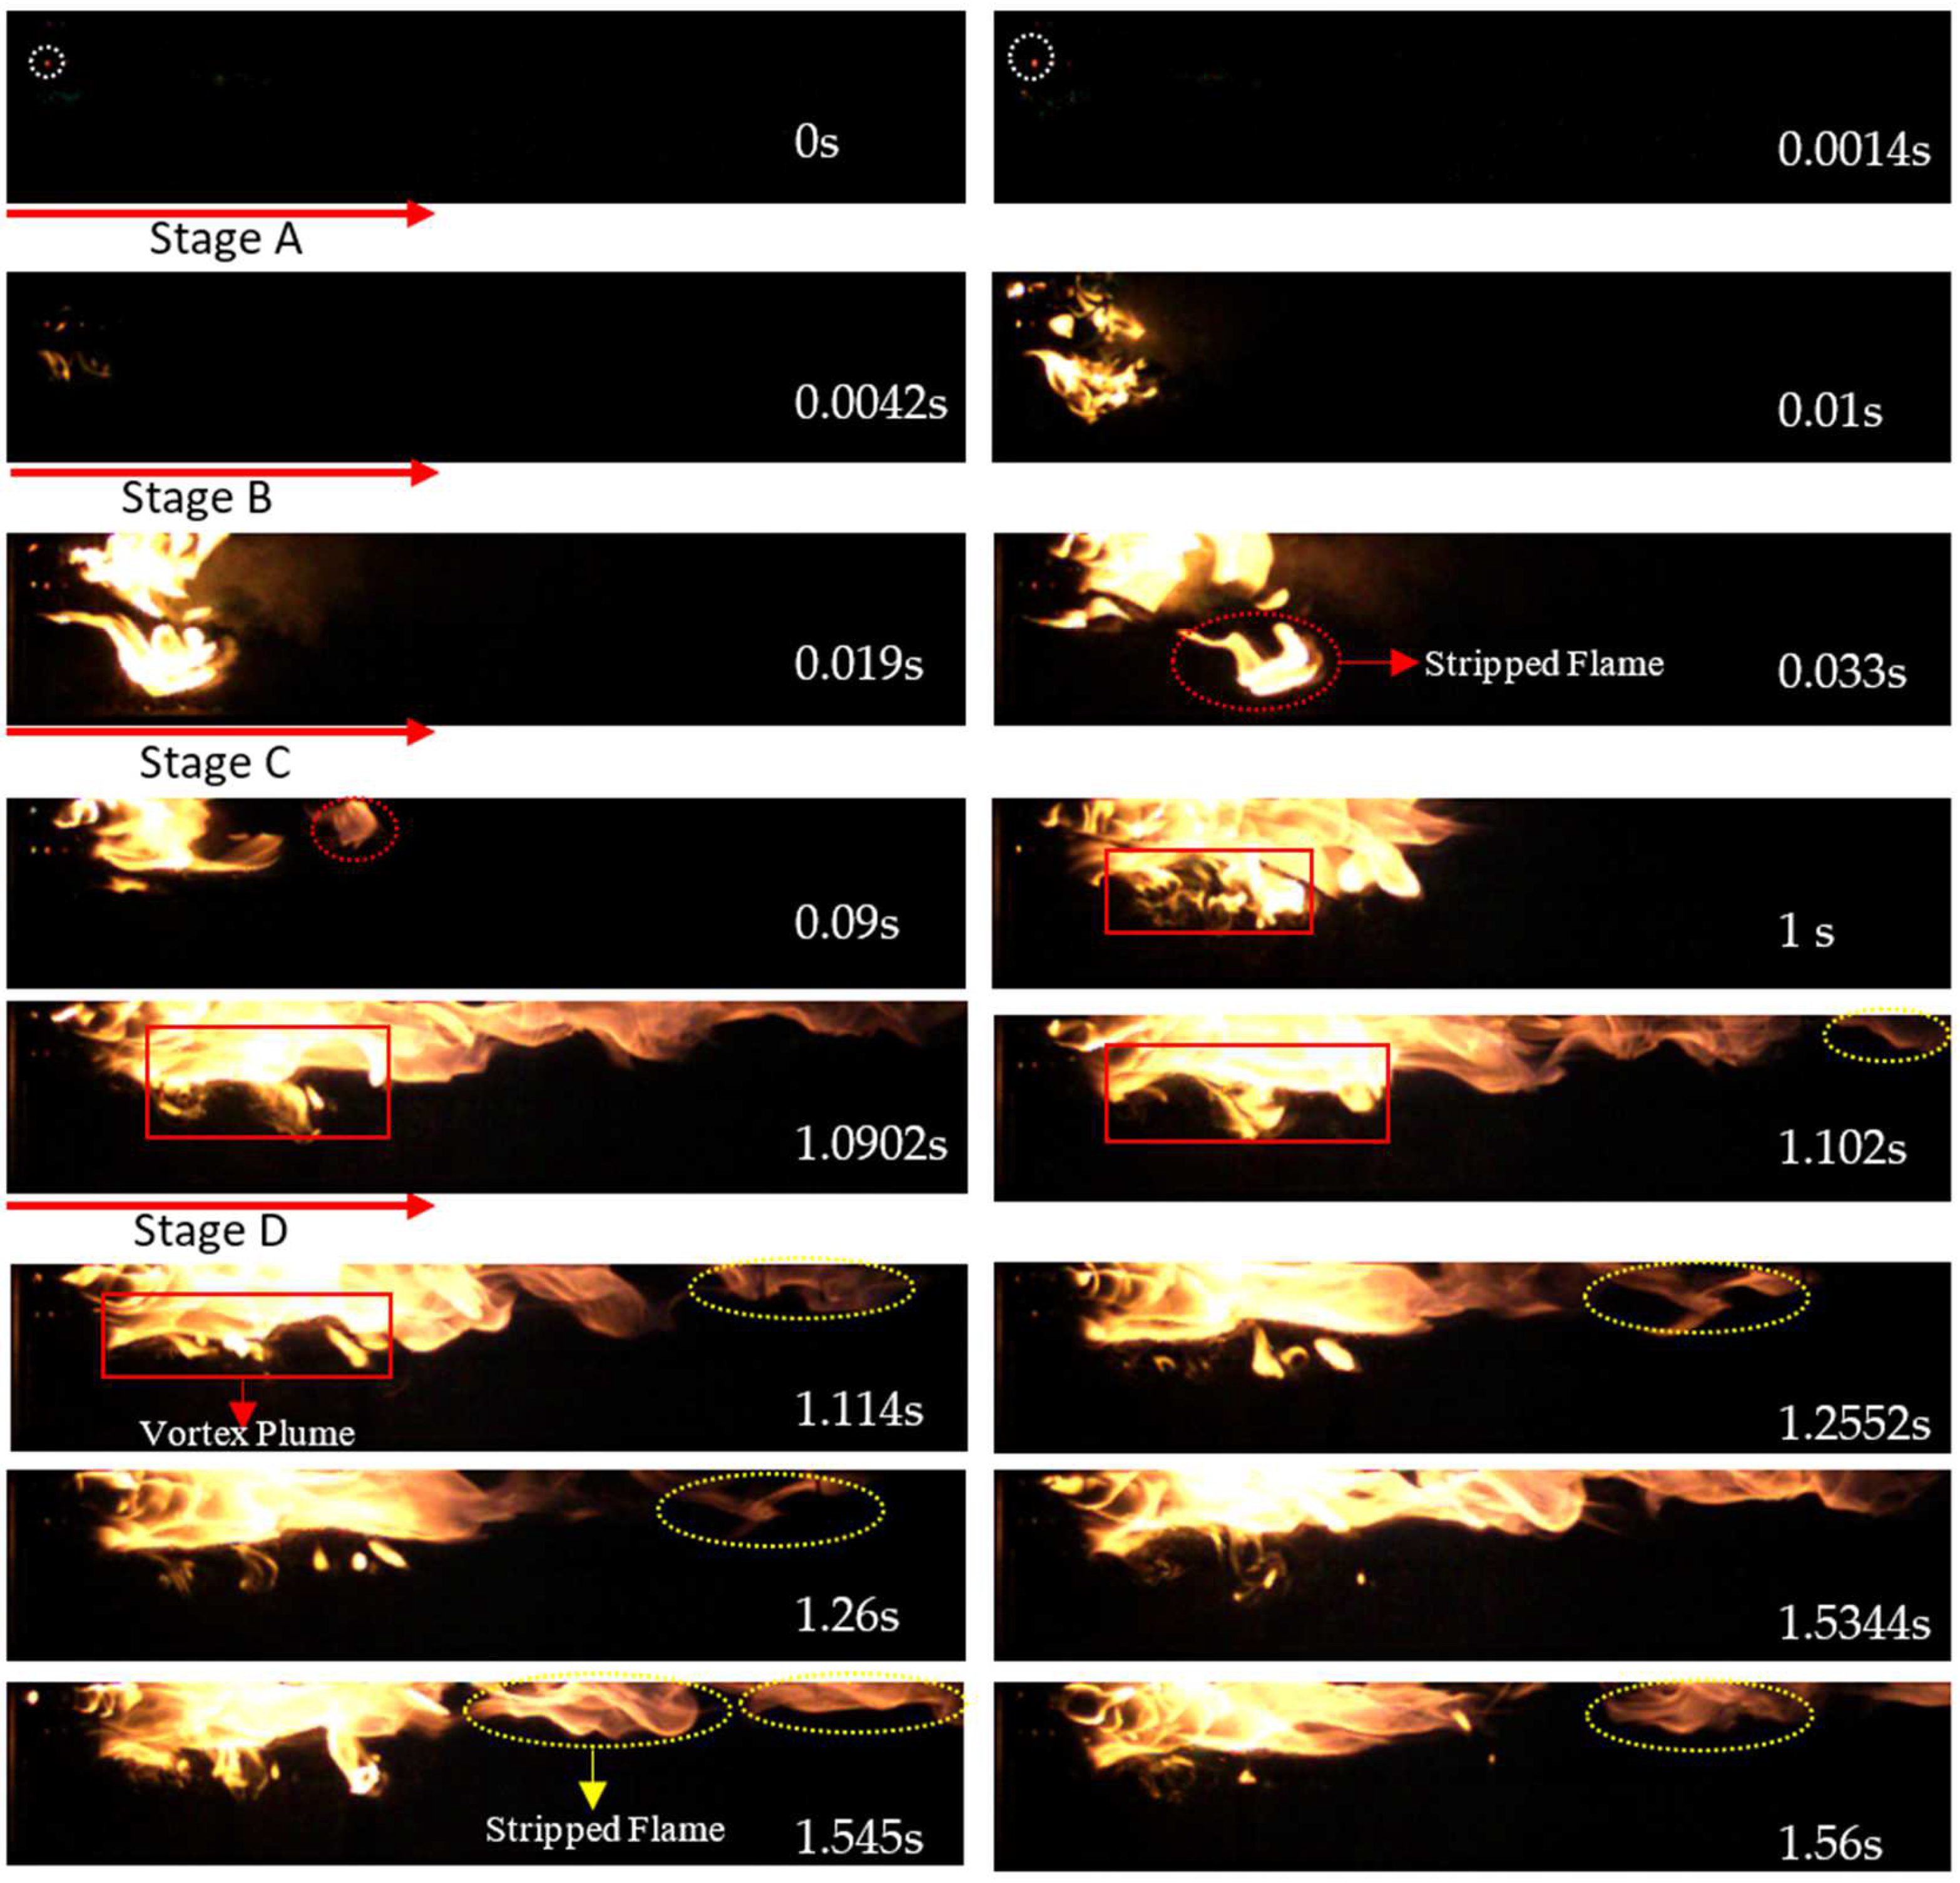
- The combustion process of the intake manifold burner showed four stages: preparing stage A, rapid development stage B, steady-development stage C, and stable stage D. Flame stripping was found in stage C and stage D due to the vortex in the combustion chamber.
- Air flow showed a significant effect on flame motion while the effect of diesel flow was negligible. The vortex was enhanced under high air flow velocity, generally leading to more stripped flames with higher brightness compared with that under low air flow velocity.
- The warm air concentrated in the upper region of the pipe first due to the thermal buoyancy, then the warm air moved downward. The warm air mainly gathered in the upper region of the pipe under 2.0 m/s while it mainly distributed in the center of the upper zone under 10.0 m/s.
- Though a lower average temperature rise was shown under 10.0 m/s, the corresponding combustion efficiency was higher than that under 2.0 m/s. Stronger cross wind enhanced the heat convection, leading to better uniformity and more concentrated temperature distribution in the exhaust pipe.
- Under the air flow velocity of 2.0 m/s and 10.0 m/s, the average temperature rise and combustion efficiency increased as the diesel flow rate increased. It could be seen that the combustion was enhanced with increasing diesel flow rate.
5.2. Recommendation
- Introduce the fluctuating intake air flow to replace the fixed air flow. Study the effect of the intake air flow fluctuation on the flame motion.
- Expand the waveform of the fluctuating intake air flow, further investigating the frequency and amplitude impacts on combustion instability of the intake manifold burner.
Author Contributions
Funding
Institutional Review Board Statement
Informed Consent Statement
Data Availability Statement
Conflicts of Interest
References
- O’Driscoll, R.; Stettler, M.E.J.; Molden, N.; Oxley, T.; ApSimon, H.M. Real world CO2 and NOx emissions from 149 Euro 5 and 6 diesel, gasoline and hybrid passenger cars. Sci. Total Environ. 2018, 621, 282–290. [Google Scholar] [CrossRef] [PubMed]
- Wang, Z.M.; Ding, H.C.; Ma, X.; Xu, H.M.; Wyszynski, M.L. Ultra-high speed imaging study of the diesel spray close to the injector tip at the initial opening stage with split injection. Appl. Energy 2016, 163, 105–117. [Google Scholar] [CrossRef]
- Martínez-Martínez, S.; de la Garza, O.A.; García-Yera, M.; Martínez-Carrillo, R.; Sánchez-Cruz, F.A. Hydraulic Interactions between Injection Events Using Multiple Injection Strategies and a Solenoid Diesel Injector. Energies 2021, 14, 3087. [Google Scholar] [CrossRef]
- Zarrinkolah, M.T.; Hosseini, V. Detailed Analysis of the Effects of Biodiesel Fraction Increase on the Combustion Stability and Characteristics of a Reactivity-Controlled Compression Ignition Diesel-Biodiesel/Natural Gas Engine. Energies 2022, 15, 1094. [Google Scholar] [CrossRef]
- Wang, Z.; Wu, S.; Huang, Y.; Chen, Y.; Shi, S.; Cheng, X.; Huang, R. Evaporation and ignition characteristics of water emulsified diesel under conventional and low temperature combustion conditions. Energies 2017, 10, 1109. [Google Scholar] [CrossRef] [Green Version]
- Yi, W.; Liu, H.; Feng, L.; Wang, Y.; Cui, Y.; Liu, W.; Yao, M. Multiple optical diagnostics on effects of fuel properties on spray flames under oxygen-enriched conditions. Fuel 2021, 291, 120129. [Google Scholar] [CrossRef]
- Henein, N.A.; Zahdeh, A.R.; Yassine, M.K.; Bryzik, W. Diesel engine cold starting: Combustion instability. SAE Trans. 1992, 101, 33–48. [Google Scholar]
- Mann, N.; Joppig, P.; Sommer, H.; Sulzbacher, W. Fuel Effects on the Low Temperature Performance of Two Generations of Mercedes-Benz Heavy-Duty Diesel Engines; SAE Technical Paper 1999-01-3594; SAE International: Warrendale, PA, USA, 1999. [Google Scholar]
- Ko, J.; Son, J.; Myung, C.-L.; Park, S. Comparative study on low ambient temperature regulated/unregulated emissions characteristics of idling light-duty diesel vehicles at cold start and hot restart. Fuel 2018, 233, 620–631. [Google Scholar] [CrossRef]
- Bielaczyc, P.; Merkisz, J.; Pielecha, J. Investigation of Exhaust Emissions from DI Diesel Engine During Cold and Warm Start; SAE Technical Paper 2001-01-1260; SAE International: Warrendale, PA, USA, 2001. [Google Scholar]
- Sakunthalai, R.A.; Xu, H.; Liu, D.; Tian, J.; Wyszynski, M.; Piaszyk, J. Impact of Cold Ambient Conditions on Cold Start and Idle Emissions from Diesel Engines; SAE Technical Paper 2014-01-2715; SAE International: Warrendale, PA, USA, 2014. [Google Scholar]
- Liu, H.; Ma, S.; Zhang, Z.; Zheng, Z.; Yao, M. Study of the control strategies on soot reduction under early-injection conditions on a diesel engine. Fuel 2015, 139, 472–481. [Google Scholar] [CrossRef]
- Roy, M.M.; Calder, J.; Wang, W.; Mangad, A.; Diniz, F.C.M. Cold start idle emissions from a modern Tier-4 turbo-charged diesel engine fueled with diesel-biodiesel, diesel-biodiesel-ethanol, and diesel-biodiesel-diethyl ether blends. Appl. Energy 2016, 180, 52–65. [Google Scholar] [CrossRef]
- Zare, A.; Nabi, M.N.; Bodisco, T.A.; Hossain, F.M.; Rahman, M.M.; Van, T.C.; Ristovski, Z.D.; Brown, R.J. Diesel engine emissions with oxygenated fuels: A comparative study into cold-start and hot-start operation. J. Clean. Prod. 2017, 162, 997–1008. [Google Scholar] [CrossRef] [Green Version]
- Park, H.; Bae, C.; Ha, C. A comprehensive analysis of multiple injection strategies for improving diesel combustion process under cold-start conditions. Fuel 2019, 255, 115762. [Google Scholar] [CrossRef]
- Rath, M.K.; Acharya, S.K.; Patnaik, P.P. CI engine performance during cold weather condition using preheated air and engine by waste energy. Int. J. Ambient Energy 2016, 38, 534–540. [Google Scholar] [CrossRef]
- Ramadhas, A.S.; Xu, H.M. Intake air heating strategy to reduce cold-start emissions from diesel engines. Biofuels 2018, 9, 405–414. [Google Scholar] [CrossRef]
- Dardiotis, C.; Martini, G.; Marotta, A.; Manfredi, U. Low-temperature cold-start gaseous emissions of late technology passenger cars. Appl. Energy 2013, 111, 468–478. [Google Scholar] [CrossRef]
- Pan, W.; Yao, C.; Han, G.; Wei, H.; Wang, Q. The impact of intake air temperature on performance and exhaust emissions of a diesel methanol dual fuel engine. Fuel 2015, 162, 101–110. [Google Scholar] [CrossRef]
- Yontar, A.A.; Zhou, M.; Ahmad, S. Influence of intake air temperature control on characteristics of a Homogeneous Charge Compression Ignition engine for hydrogen-enriched kerosene-dimethyl ether usage. Int. J. Hydrogen Energy 2020, 45, 22019–22031. [Google Scholar] [CrossRef]
- Broatch, A.; Ruiz, S.; Margot, X.; Gil, A. Methodology to estimate the threshold in-cylinder temperature for self-ignition of fuel during cold start of Diesel engines. Energy 2010, 35, 2251–2260. [Google Scholar] [CrossRef]
- Li, Q.; Shayler, P.J.; McGhee, M.; La Rocca, A. The initiation and development of combustion under cold idling conditions using a glow plug in diesel engines. Int. J. Engine Res. 2017, 18, 240–255. [Google Scholar] [CrossRef] [Green Version]
- Celik, A.; Yilmaz, M.; Yildiz, O.F. Effects of vortex tube on exhaust emissions during cold start of diesel engines. Appl. Energy Combust. Sci. 2021, 6, 100027. [Google Scholar] [CrossRef]
- Celik, A.; Yilmaz, M.; Yildiz, O.F. Improvement of diesel engine startability under low temperatures by vortex tubes. Energy Rep. 2020, 6, 17–27. [Google Scholar] [CrossRef]
- Deng, Y.; Liu, H.; Zhao, X.; Jiaqiang, E.; Chen, J. Effects of cold start control strategy on cold start performance of the diesel engine based on a comprehensive preheat diesel engine model. Appl. Energy 2018, 210, 279–287. [Google Scholar] [CrossRef]
- Yilmaz, N. Effects of intake air preheat and fuel blend ratio on a diesel engine operating on biodiesel–methanol blends. Fuel 2012, 94, 444–447. [Google Scholar] [CrossRef]
- Hákansson, N.O.; Kemlin, J.; Nilsson, R. Cold Starting the Volvo Way. SAE Trans. 1989, 98, 34–41. [Google Scholar]
- Broatch, A.; Luján, J.M.; Serrano, J.R.; Pla, B. A procedure to reduce pollutant gases from Diesel combustion during European MVEG-A cycle by using electrical intake air-heaters. Fuel 2008, 87, 2760–2778. [Google Scholar] [CrossRef]
- Payri, F.; Broatch, A.; Serrano, J.R.; Rodríguez, L.F.; Esmorís, A. Study of the potential of intake air heating in automotive DI diesel engines. SAE Trans. 2006, 115, 662–672. [Google Scholar]
- Lindl, B.; Schmitz, H.-G. Cold Start Equipment for Diesel Direct Injection Engines; SAE Technical Paper 1999-01-1244; SAE International: Warrendale, PA, USA, 1999. [Google Scholar]
- Isley, W. Development of Multifuel Features of the LD-465 and LDS-465 Military Engines; SAE Technical Paper No. 640371; SAE International: Warrendale, PA, USA, 1964. [Google Scholar]
- Sun, R.; Sweet, E.J.; Zurio, J.; Zurlo, J.; Pfefferie, W.C.; Pfefferle, W.C. Diesel engine cold starting with catalytically ignited recirculated exhaust gas. SAE Trans. 1994, 103, 18–31. [Google Scholar]
- Kreun, P.K.; Fajardo, C.M.; Baumann, A. Simulation of an Intake Manifold Preheater for Cold Engine Startup. J. Eng. Gas Turbines Power 2013, 135, 71505. [Google Scholar] [CrossRef]
- Zhang, C.; Liu, B.; Hu, J.; Yu, X.; Wang, X. Study on cold starting performance of a low compression ratio diesel engine by using intake flame preheating. Therm. Sci. 2020, 24, 51–62. [Google Scholar] [CrossRef]


| Conditions | Intake Air Flow Velocity (m/s) | Diesel Flow Rate (mL/min) | Air-Fuel Ratio |
|---|---|---|---|
| Combustion Process | 1.4 | 7.3–18.9 | 134.5–51.95 |
| 1.4–3.0 | 10.0 | 98.18–210.4 | |
| Temperature Rise | 2.0 | 7.3–15.2 | 192.15–92.28 |
| 10.0 | 960.75–461.4 |
Publisher’s Note: MDPI stays neutral with regard to jurisdictional claims in published maps and institutional affiliations. |
© 2022 by the authors. Licensee MDPI, Basel, Switzerland. This article is an open access article distributed under the terms and conditions of the Creative Commons Attribution (CC BY) license (https://creativecommons.org/licenses/by/4.0/).
Share and Cite
Li, Z.; Wang, Z.; Mo, H.; Wu, H. Effect of the Air Flow on the Combustion Process and Preheating Effect of the Intake Manifold Burner. Energies 2022, 15, 3260. https://doi.org/10.3390/en15093260
Li Z, Wang Z, Mo H, Wu H. Effect of the Air Flow on the Combustion Process and Preheating Effect of the Intake Manifold Burner. Energies. 2022; 15(9):3260. https://doi.org/10.3390/en15093260
Chicago/Turabian StyleLi, Zhishuang, Ziman Wang, Haoyang Mo, and Han Wu. 2022. "Effect of the Air Flow on the Combustion Process and Preheating Effect of the Intake Manifold Burner" Energies 15, no. 9: 3260. https://doi.org/10.3390/en15093260
APA StyleLi, Z., Wang, Z., Mo, H., & Wu, H. (2022). Effect of the Air Flow on the Combustion Process and Preheating Effect of the Intake Manifold Burner. Energies, 15(9), 3260. https://doi.org/10.3390/en15093260