Article

A New Adsorption Equation for Nano-Porous Shale Rocks and Its Application in Pore Size Distribution Analysis

1
Post-Doctoral Research Station of Geological Resource and Geological Engineering, Chengdu University of Technology, Chengdu 610059, China
2
College of Energy, Chengdu University of Technology, Chengdu 610059, China
3
Institute of Sedimentology, Chengdu University of Technology, Chengdu 610059, China
*
Author to whom correspondence should be addressed.
Energies 2022, 15(9), 3199; https://doi.org/10.3390/en15093199
Submission received: 9 February 2022 / Revised: 29 March 2022 / Accepted: 31 March 2022 / Published: 27 April 2022
(This article belongs to the Special Issue CO2 Injection and Storage in Reservoir)

Abstract

:
Adsorption equations are important to analyze the pore size distribution (PSD) of shale and the adsorption behavior on it. However, the accurate description of nitrogen adsorption on shale by current adsorption equations is difficult to achieve due to the heterogeneous pore structure of shale. In our study, new adsorption isotherms that can properly depict the adsorbed amount of nitrogen were built for shale rocks considering both the processes of nitrogen adsorption and the cylindrical pore shape property of shale. When performing a regression analysis on five sets of experimental adsorption data using the developed adsorption equations, the R-square ranged from 0.739 to 0.987. Based on the pore shape determined by adsorption–desorption curves, the distinct R-square indicated that our equation is not valid for shale samples with ink-bottle pores and pores formed by schistose materials, but that it is suitable for shale samples with cylindrical pores and slit pores. Meanwhile, we precisely analyzed the PSDs of shale rocks based on the developed adsorption equations as capillary condensation volume is involved in the total adsorbed amount. Thus, the PSDs of shale rocks with cylindrical pore and slit pore were analyzed by the new adsorption equation.

1. Introduction

As an unconventional gas reservoir, gas shale has become one of the major natural gas exploration targets in recent years [1,2]. Furthermore, the majority of nanopores in shale, which is a porous material, provide a large pore surface area for the storage of gases, such as methane, carbon dioxide and hydrogen. Because of shale’s gas storage property and its potentially large recoverability s, it attracts much attention; many investigations into the gas adsorption behavior in shale pore networks and the pore structures of shale reservoirs have been conducted to advance shale gas exploration [3,4].
Unlike in conventional reservoirs, the pores in shale reservoirs are predominantly nanopores in organic matter and clay minerals because shale contains large amounts of total organic carbon (TOC) and clay minerals [5,6,7]. Therefore, it is difficult to characterize shale pore structures by using common techniques [8]. Furthermore, the components of shale result in complex pore characteristics and wide pore size distributions. To investigate the pore structure of such heterogeneous reservoirs, a N2 adsorption–desorption experiment is normally performed to analyze the pore size distribution of shale [9]. However, there is no appropriate equation for the adsorption of N2 on shale. Thus, the PSD of shale can only be derived from discrete measuring points.
Unlike high-pressure methane adsorption, low-pressure and low-temperature N2 adsorption is dominated by monolayer adsorption, multilayer adsorption and capillary condensation, which is clarified by BDDT (Brunauer, Deming, Deming and Teller) adsorption isotherm classification [10,11]. As we know, the Langmuir adsorption equation is widely accepted to describe monolayer adsorption, which assumes only one type of adsorption site on the surface of the adsorbent [12,13,14,15,16,17,18,19,20,21,22,23,24]. In addition, the BET (Brunauer, Emmett and Teller) adsorption equation is the most popular equation for multilayer adsorption, which assumes that the interaction on the adsorbent surface is much larger than that between neighboring adsorbate molecules [25,26,27,28,29,30,31]. Moreover, capillary condensation obeys Kelvin theory, and it is depicted by empirical liquid-adsorption equations [32,33]. Thus, these frequently used adsorption equations, which are based on homogeneous models, cannot be applied to interpret the coexistence of monolayer adsorption, multi-layer adsorption, and capillary condensation simultaneously. In our previous work, we built an adsorption equation that includes adsorption processes such as monolayer adsorption, multilayer adsorption, and capillary condensation [10].
Adsorption behavior is not only influenced by the adsorption process but also by pore shape. Nanopores in shale are confirmed by the de Boer classification method as cylindrical pores closed at one end, parallel-plate pores, wedge-shaped pores, and slit pores [34]. Furthermore, pore models are widely considered in studies of adsorption properties, especially for conditions in which capillary condensation and desorption hysteresis take place during the pore size distribution analysis.
In terms of the conditions for the occurrence of capillary condensation, the cylindrical pore model is applied to analyze the key factors in capillary condensation, such as pore radius, solid–liquid surface tension, and temperature [35,36,37]. The slit pore model is the most popular method with which to analyze capillary condensation in micro scale [38,39]. In addition, the sphere pore model is chosen to analyze the influential factors in capillary condensation [40]. The adsorption–desorption hysteresis resulting from capillary condensation is also studied by given pore models. To clarify the hysteresis mechanism, the nucleation mechanism in nanopores, and the differential pressure between condensation and evaporation, pore models with cylindrical geometry are widely used [41,42]. Moreover, ink-bottle pores and the cone pore model are utilized to analyze hysteresis behavior [43,44]. Based on previous studies, the ink-bottle pore model, slit pore model and cylindrical pore model are frequently used to analyze the characteristics of adsorption in porous materials, and the cylindrical pore model was adopted to build a new adsorption equation in our study [45,46,47,48,49,50,51,52].
Additionally, the pore size distribution analysis of shale is usually dependent on nitrogen adsorption experiments. The common macroscale thermodynamic method of PSD analysis, the BJH (Barrett, Joyner and Halenda) method, the SF (Saito and Foley) theory, and the HK (Horváth–Kawazoe) model are widely used to fit in with the adsorption experimental data in pore size distribution algorithms [53]. The former two methods are developed considering cylindrical pores, in which the BJH method is the technique used for estimating the pore volume critically based on the Kelvin equation, and the SF model focuses on the pore potential equation. The third method, the HK model, evaluates the PSD through the differentiation of the adsorbate amount adsorbed [54]. All these methods estimate the PSD with a uniform interface model, which ignores the heterogeneous properties of shale caused by its complex components and pore structure.
In this study, we built an adsorbed volume occupied by multilayer adsorption and capillary condensation in shale based on the cylindrical pore model, and then integrated this into the developed adsorption equation. Furthermore, the experimental nitrogen adsorption data from different shale samples were also integrated into the new adsorption equation. Finally, in this study, the applicability of the developed adsorption equation to the pore size distribution calculation of shale is discussed.

2. Materials and Methods

We collected one shale sample (A3) from the Lower Sinian Doushantuo Formation and two shale samples (A1 and B2) from the Lower Cambrian Niutitang Formation in the Sichuan Basin, China, and two shale samples (A2 and B1) from the Yanchang Formation in the Ordos Basin in northern China, deposited in the late Triassic (Figure 1). These three shale formations were identified as prospective shale gas target layers in China due to their widespread burial thickness distribution and relatively high organic matter content, which indicate considerable gas-bearing potential and, therefore, that they should be given priority for shale gas exploration [55,56,57]. Geological characteristics of shale samples are shown in Table 1.
The tests were conducted by the Quadrasorb SI surface area and pore-size analyzer (Figure 2). In our experiment, nitrogen was used as the adsorbate. The lower limitation of the specific surface area was 0.01 m2/g for nitrogen. In the pore size distribution analysis, the minimum pore volume was 0.0001 cm3/g (at standard temperature and pressure), and the pore-size range was 0.35 to 400 nm.
All samples were crushed to 60 to 80 mesh (180 to 250 μm). The pulverized samples were dried and vacuumed at 353.15 K for 12 h for degassing in order to prepare the samples for the gas adsorption method. In the gas expansion process, the crushed samples were added in low-temperature-resistant test tubes in the experimental instrument, and N2 adsorption–desorption isotherms were obtained under relative pressure ranging from 0.01 to 0.995 at 77 K. The adsorption isotherm was derived point by point by measuring the quantity of nitrogen adsorbed ( V ) and the equilibrium pressure as the relative pressure ( P / P 0 ) increasing. By contrast, the desorption isotherm could be obtained by measuring the quantities of gas removed from the sample as pressure decreasing. With the QuadraWin software, the adsorption–desorption isotherm curves were generated automatically. The measured adsorption isotherms of N2 on shale samples are shown in Figure 3.

3. Results

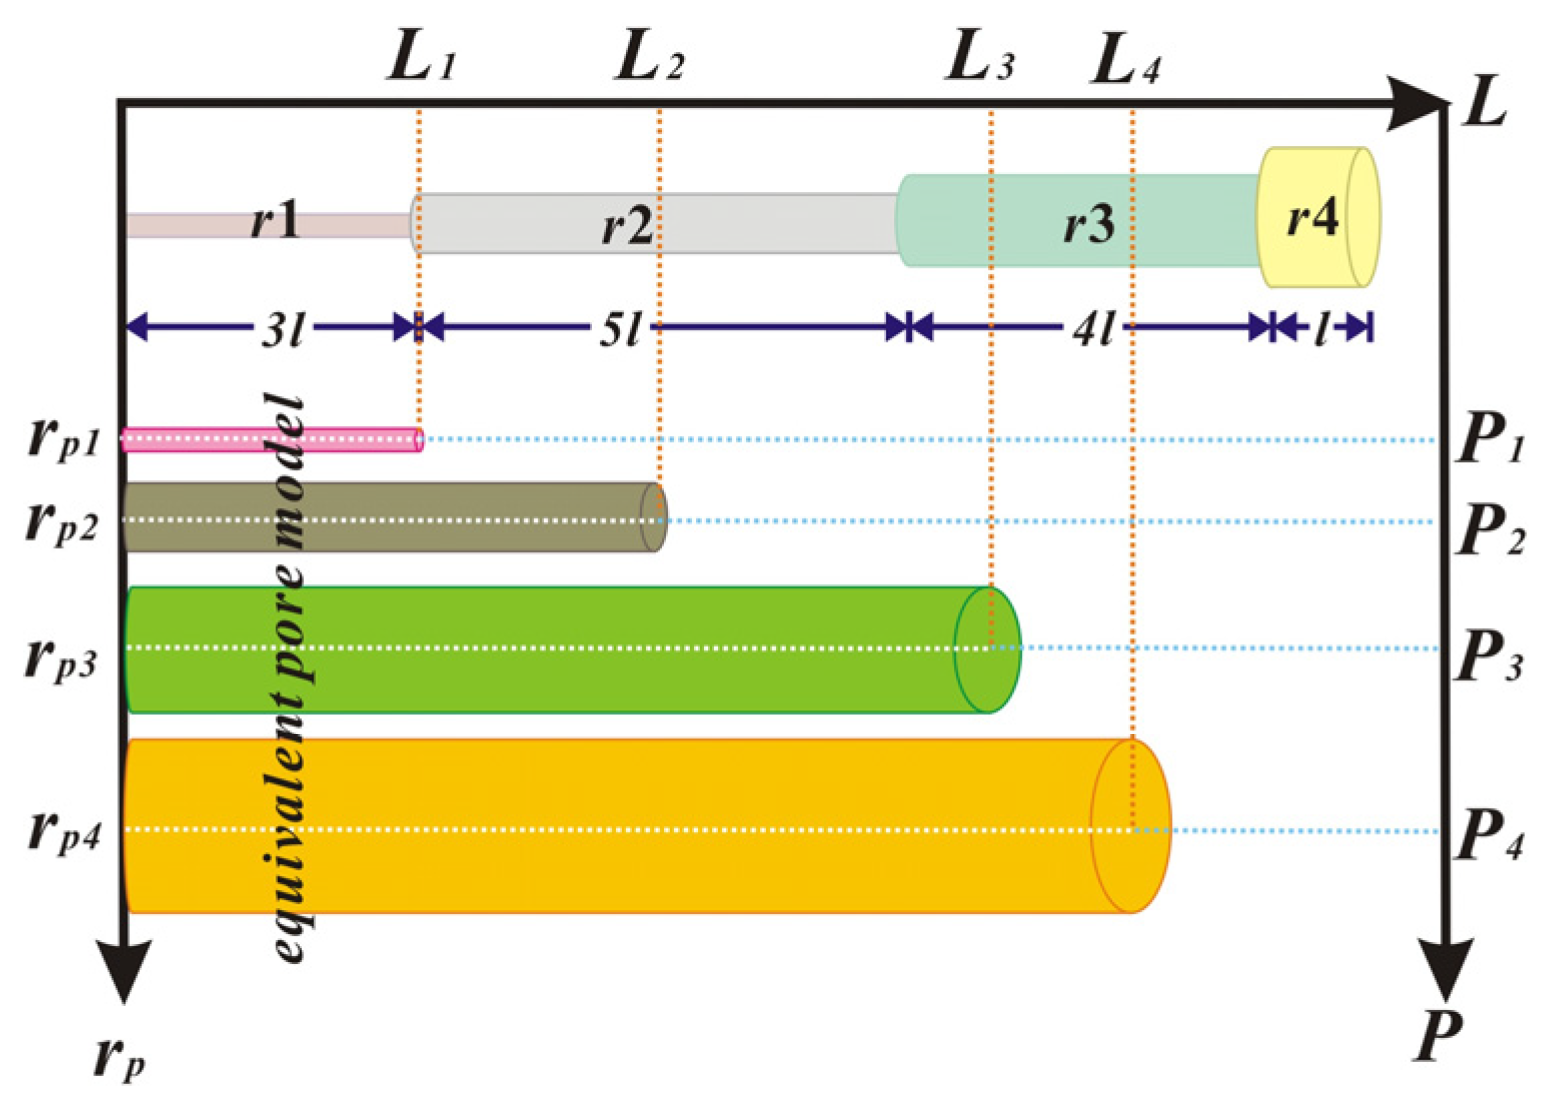
3.1. Adsorption Volume Constitution in Cylindrical Pores

Nitrogen adsorption isotherms belong to type IV, based on the BDDT adsorption isotherm classification [11], which indicates that the processes of nitrogen adsorption on shale includes monolayer adsorption, multilayer adsorption, and capillary condensation. At the initial stage of adsorption, only monolayer adsorption occurs, and free gas molecules are present in the pores. The number of molecule layers increases with the pressure and there are still some free gas molecules in the rest space of the pores. When the pressure rises to a certain value, capillary condensation starts to take place and all pores are filled gradually by gas molecules. Thus, the adsorbed volume can be divided into the volume of the multilayer adsorption and the volume of the capillary condensation [10].
Assuming that pores with various pore radii randomly distribute in the shale matrix (Figure 4), at any given pressure P i , pores with radii of less than r i are filled by adsorbate. Subsequently, all the filled pores can be simplified as an equivalent cylindrical pore model, characterized by length L i and radius r p i (Figure 5). Obviously, the radius of the equivalent model r p i is the same as the radii of the pores ( r i ) which can be filled by adsorbate at pressure P i . Furthermore, the length of the equivalent cylindrical pore L i is affected by the length l j ( j i ) of the pores with radii of less than r i , which is given as:
L i = j = 1 i l j π r j 2 π r p i 2
After assuming that the pores in the shale are cylindrical pores, the adsorbed adsorbate in shale nanopores can be depicted as the schematic in Figure 6. The cores of the cylindrical pores imply condensed liquid formation due to capillary condensation, and the external annular zone represents multilayer adsorption starting from the pore wall.

3.2. Construction of Adsorption Equation

It is clear that the main challenge of establishing the new adsorption equation is calculating the volumes occupied by multilayer adsorption and capillary condensation, respectively (Figure 4). When the pores are filled with adsorbate, the adsorbed volume is calculated by:
V a d = V m u l t i + V c c
As we know, the BET equation is usually used to determine the adsorbed amount of multilayer adsorption; thus, we discuss the applicability of the BET equation first. At low relative pressure, the BET equation depicts the adsorption data well. However, as the pressure increases ( P / P 0 > 0.4 ), the BET curve deviates from the experiment data (Figure 7). Compared to the adsorption–desorption curve in Figure 3, when P / P 0 > 0.4 , a hysteresis loop exists, which indicates that capillary condensation occurs at this pressure condition. Therefore, we infer that capillary condensation inhibits multilayer adsorption behavior, and that the BET equation is not applicable for multilayer adsorption when capillary condensation starts to take place.
Alternatively, the multilayer adsorption volume V m u l t i is a function of the adsorbed layer n and the maximum adsorbate volume of a single layer V m , and given as:
V m u l t i = V m n
The number of adsorbed layers n is depicted by the Halsey equation:
n = [ a R T ln ( P / P 0 ) ] 1 r
where a is a parameter that represents the homogeneity of uniform or non-uniform surfaces, and r reflects the attraction of the adsorbent for the adsorbate. The small r means that the force on the interface is van der Waals, which results in a greater attraction distance [58].
The volume of the capillary condensation V c c derived from the cylindrical model with equivalent length L is:
V c c = π r k 2 L
where r k is the radius of the capillary condensation, which is calculated by the Kelvin equation:
r k = 2 σ cos θ V M R T ln ( P / P 0 )
The value σ is the surface tension, θ is the contact angle, and V M is the molar mass of the adsorbate.
For the external annular zone, assume that it is filled by adsorbate, then:
V m n = π L ( 2 r k t + t 2 )
where t is the total thickness of the adsorbed layers and is given as:
t = t m [ a R T ln ( P / P 0 ) ] 1 r
where t m is the thickness of a single adsorbate layer.
Combining Equations (2) and (8), we develop a new adsorption equation, as follows:
V = V m ( a R T ) 1 r [ ln ( P P 0 ) ] 1 r [ 1 + 1 ( a R T ) 1 r t m R T σ cos θ V M [ ln ( P P 0 ) ] 1 1 r + 1 4 ( a R T ) 2 r t m 2 R 2 T 2 σ 2 cos 2 θ V M 2 [ ln ( P P 0 ) ] 2 2 r ]
If we define ( a / R T ) 1 r as A , 1 r as B , and t m R T / ( σ cos θ V M ) as C , then we obtain the simplified adsorption equation:
V = V m A [ ln ( P / P 0 ) ] B [ 1 + 1 A C [ ln ( P / P 0 ) ] 1 B + 1 4 ( A C ) 2 [ ln ( P / P 0 ) ] 2 2 B ]

4. Discussion

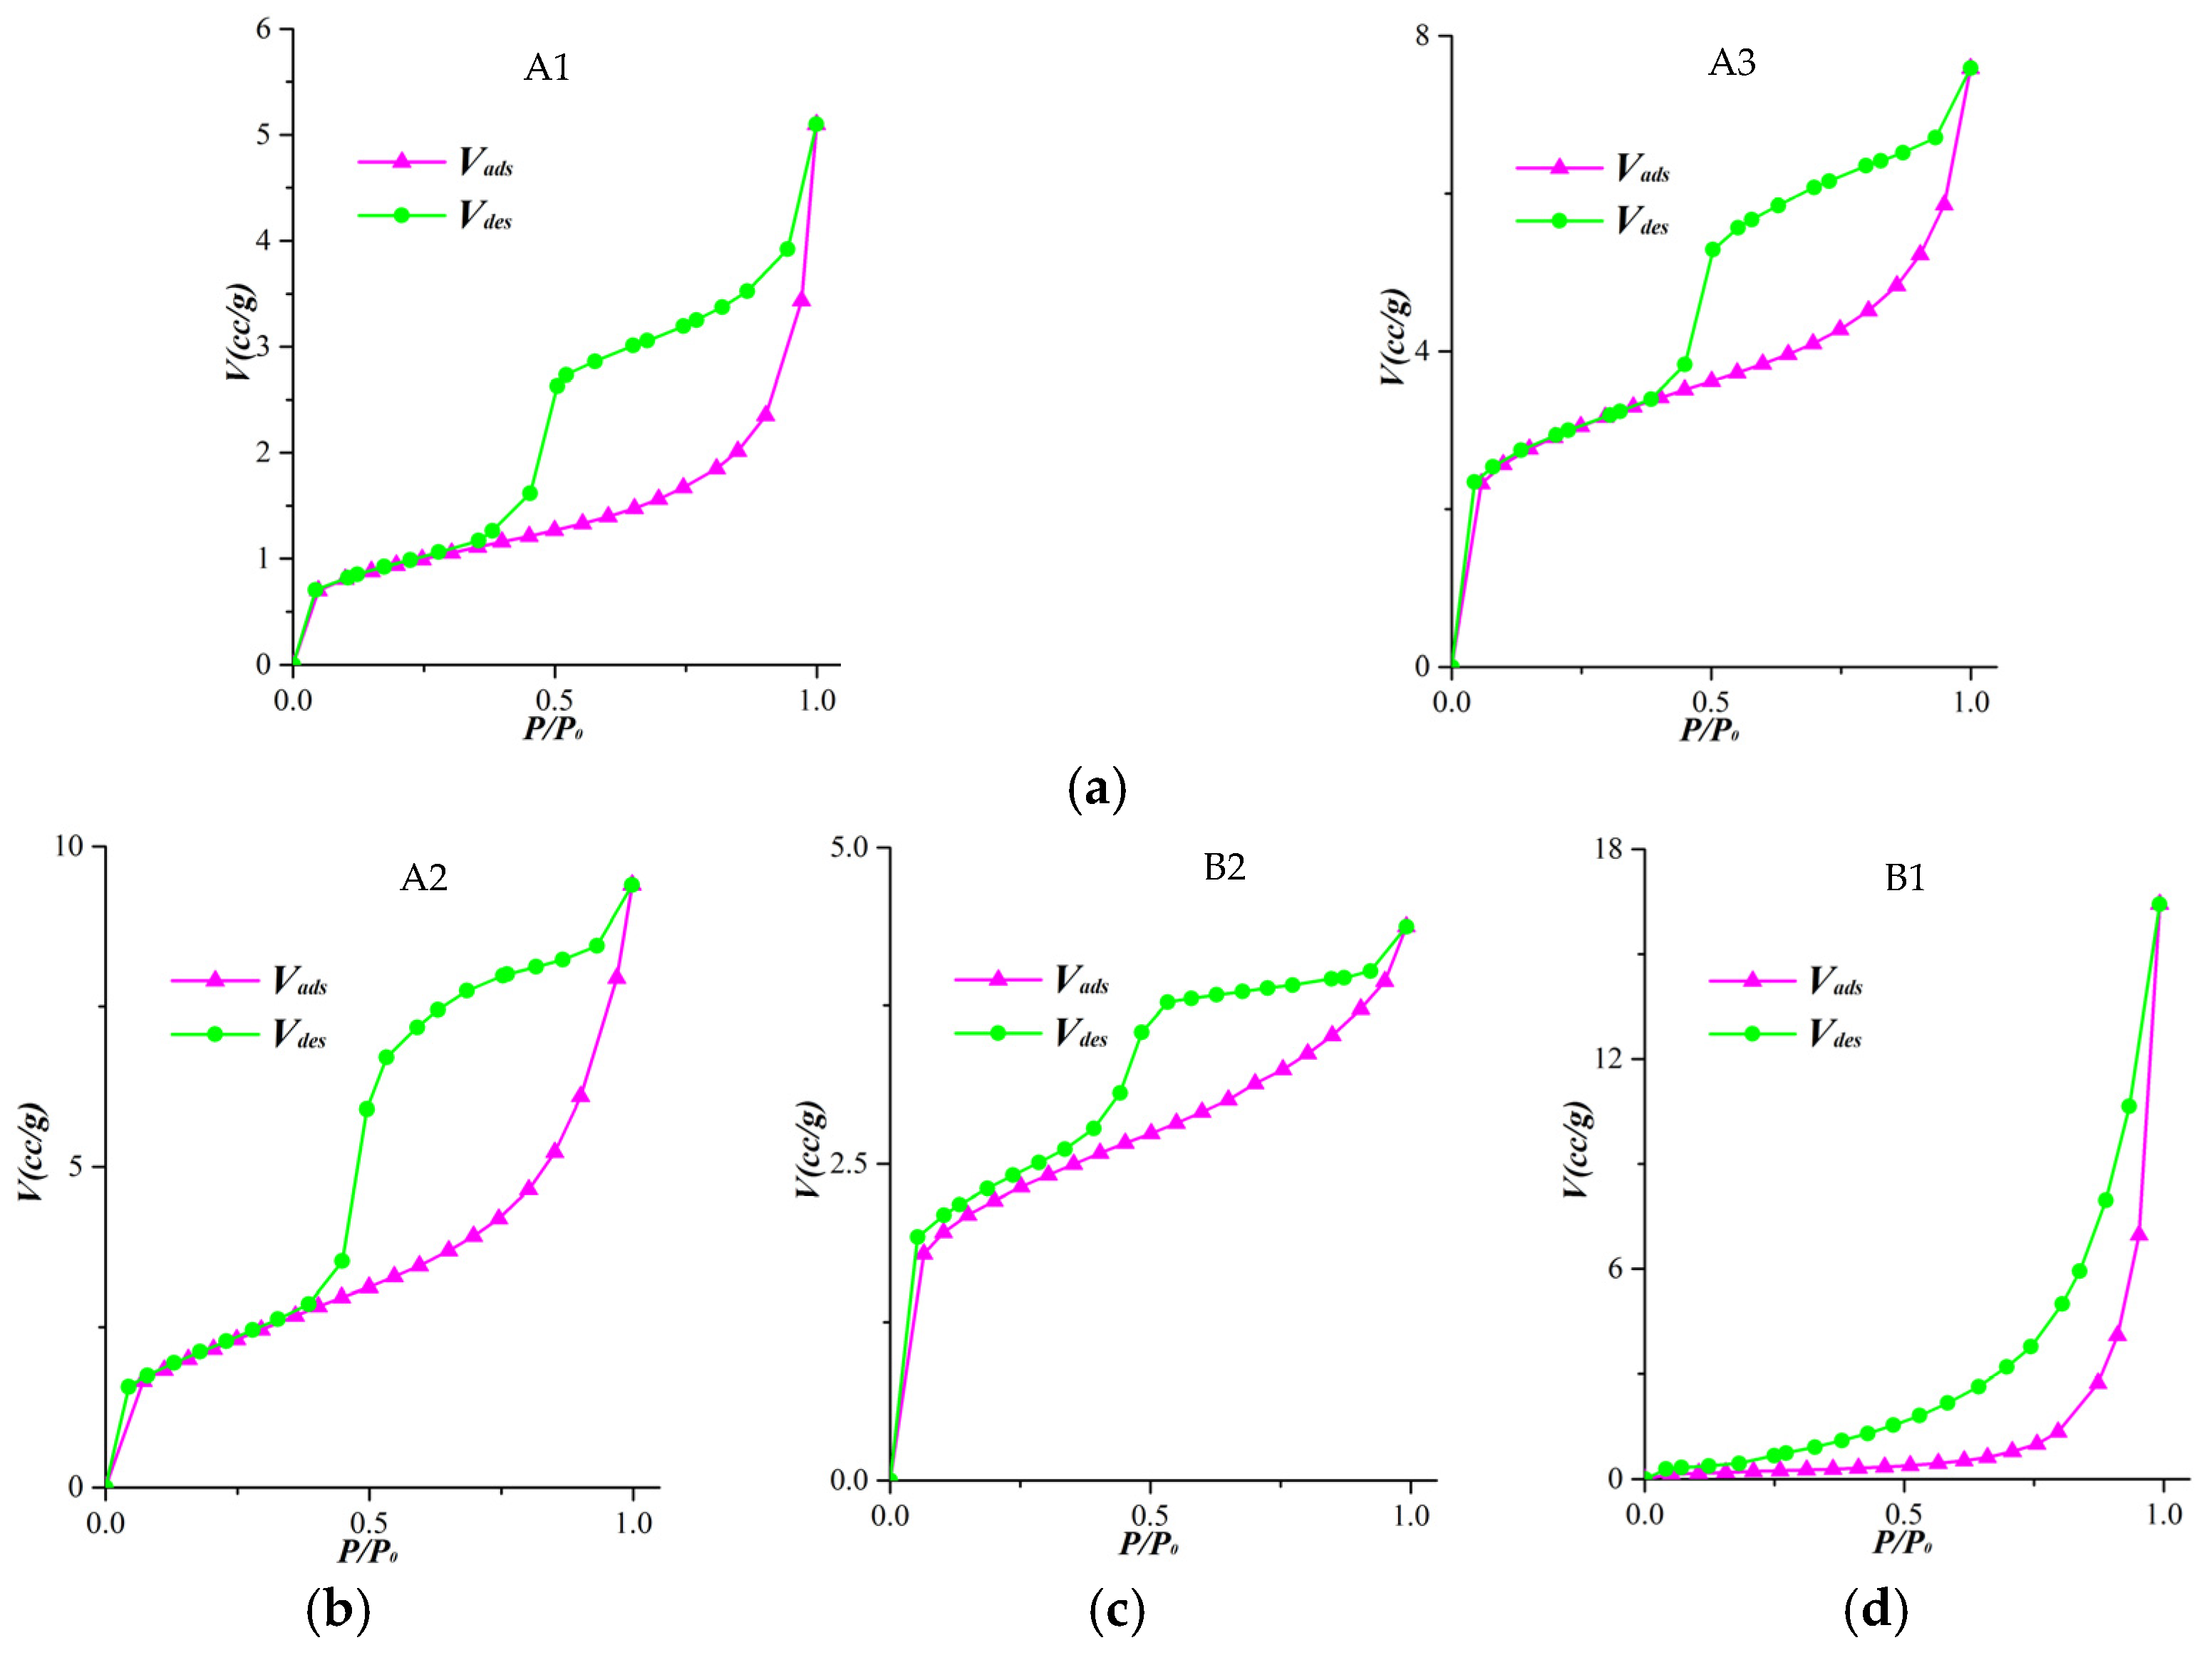
4.1. Adsorption Isotherm Confirmed by Adsorption Equation

The new adsorption equation was applied to perform a regression analysis on the adsorption isotherms of the nitrogen on the shales.The results are presented in Figure 8 and the fitting parameters are listed in Table 2.
Obviously, the developed adsorption equation is partially applicable to shale samples. The calculated adsorption isotherms match well with the experimental data for shales A1, A2, and A3, while they fail to match the experimental data for shales B1 and B2. For B1 and B2, the determined adsorption isotherms are greater than the experimental data at low relative pressure, but less than these experimental data at high relative pressure. In addition, the R-squares of the five curve fittings range from 0.73911 to 0.98719. It can be seen that the R-squares are all greater than 0.9 for A1, A2, and A3.
The V m , which represents the monolayer’s adsorption behavior, reveals that the interaction force between the shale (adsorbent) and the first adsorbed nitrogen layer for A3 is stronger than the values for A1 and A1. This observation corresponds to the position of the inflection point in Figure 6. However, if B2 and B3 are included in the analysis, there is an anomalous trend. The inflection point of A3 is higher than that of B2, but the V m for B2 is greater.
Combining Equations (8) and (10), the thickness of the adsorbed layer is calculated by:
t = t m A [ ln ( P / P 0 ) ] B
The t-curves for the five samples are exhibited in Figure 9. As the relative pressure rises to 0.9, all the t-curves of the five samples show steep sections. This indicates external interface adsorption at higher pressure. However, the curves are various when the relative pressure is less than 0.9. For A1, A2 and A3, the adsorbed layers increase rapidly at pressure P r < 0.1 , which may be caused by the strengthening of the interactions between the adsorbate and the adsorbent. At a pressure of 0.1 < P r < 0.9 , the adsorbed layers stop increasing and capillary condensation is predominant [59]. In addition, the t-curves of B1 and B2 are totally different from those of A1, A2 and A3. The adsorbed layers of B1 increase gradually, and there is no inflection point of monolayer adsorption or multilayer adsorption. B2 shows a different variation tendency in that the amount of multilayer adsorption is small and the thickness of the adsorbed layers always remains around 1 nm, even if the pressure almost reaches saturated vapor pressure.
After a comprehensive analysis of the curve fitting and physical meaning of variables A and B , it was found that the built adsorption equation is suitable for samples A1, A2 and A3, but not valid for B1 and B2. This may have resulted from the assumption of the pore shape in this study. As the pore model assumed cylindrical pores, only pore networks characterized by pores whose pore radius was constant could be depicted accurately by the new adsorption equation. When classifying the pore types of the five samples by de Boer classification [60], it was found that A1 and A3 belong to type B, with slit-shaped pores (Figure 10a) and that A2 belongs to type A, with cylindrical pores (Figure 10b).
Nevertheless, the pores in B2 are ink-bottle-shaped due to a typical type E adsorption–desorption isotherm (Figure 10c). Since the capillary condensation is governed by the ratio and range of the fluid–fluid interaction and the fluid–matrix interaction [61,62], variations in the pore diameter result in the disorder of the interfaces in ink-bottle pores [63]. The potential of the adsorbent and adsorbate system is affected by the position of the liquid–vapor interface. As a result, capillary condensation mechanisms in pores with ink-bottle shapes and cylindrical shapes are significantly different [64], and the adsorption equation for the cylindrical pore model obviously fails to depict the adsorption behavior of ink-bottle pores.
The shapes of the pores in B1 were ambiguous when they were analyzed by de Boer classification. Furthermore, B1 was a typical micropore sample that belonged to the type B adsorption isotherm on the basis of the BDDT adsorption isotherm classification (Figure 10d) [11]. This may have resulted from the capillary condensation already having taken place in the micropores before the onset of capillary condensation in the mesopores [65]. Therefore, the adsorption behavior and nucleation in the micropore-dominated sample B1 was different from that in the other samples with large amounts of mesopores and macropores.
In summary, it is appropriate to use the developed adsorption equation for shale samples with cylindrical pores and slit pores.

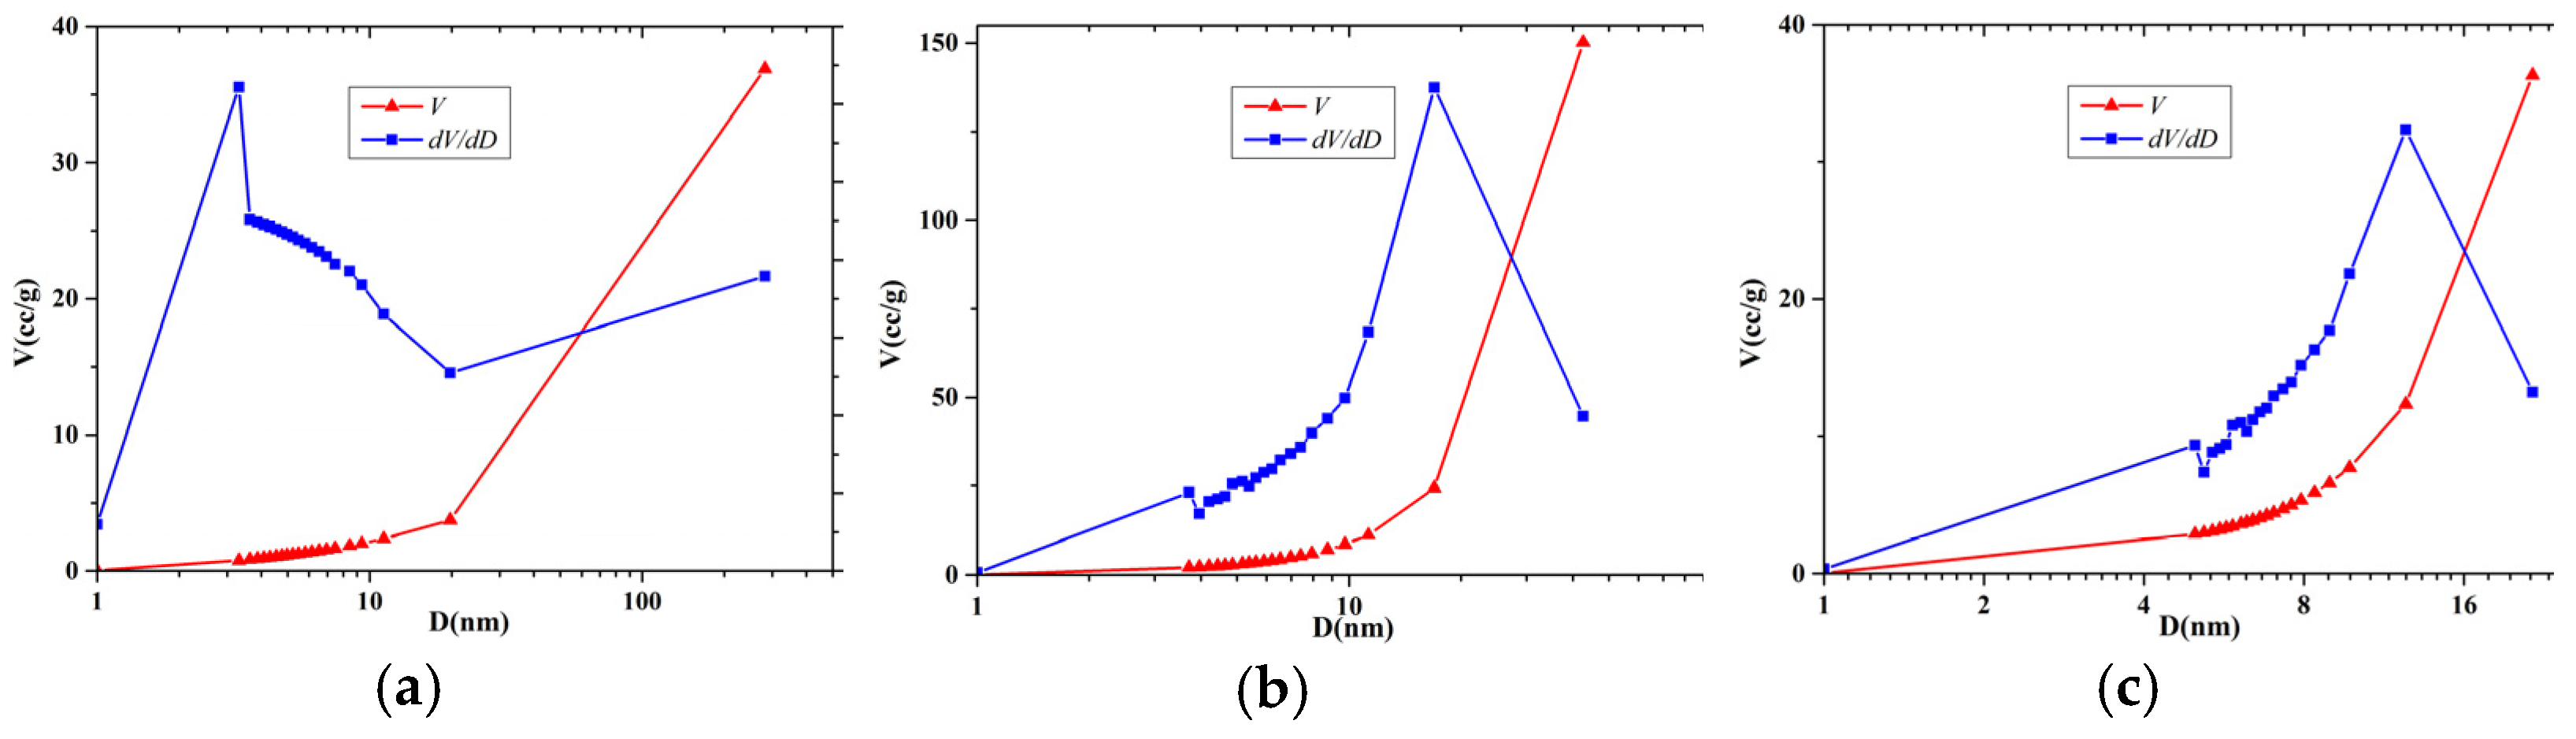
4.2. Pore Size Distribution Derived from Adsorption Equation

As mentioned in the BJH (Barrett, Joyner and Halenda) theory, pore volume substantially relates to the volume of capillary condensation. Based on Figure 6, the calculation of the pore volume V p is derived from the geometrical relationship between the Kelvin radius r k , the pore radius r p , and the inner capillary volume, V c c , as in [66]:
V p i = V k i r p i 2 r k i 2
Assume that when capillary condensation takes place in the pores, these pores are all filled with adsorbate at any given pressure P . Subsequently, the pore radius is given as:
r p = r k + t
Combining Equations (6) and (10), the Kelvin radius can be expressed as:
r k = 2 t m C ln ( P / P 0 )
Rearranging Equations (11), (13), and (14), r p is:
r p = t m A [ ln ( P / P 0 ) ] B 2 t m C ln ( P / P 0 )
Substituting Equations (14) and (15) into Equation (12), the pore volume V p i is:
V p i = [ 1 + A C ( ln ( P i / P ) 1 B 2 ] 2
Analyzing the pore size distribution of the shale samples A1, A2, and A3 with the new adsorption equation (Figure 11), the dominant pore diameters of these three shale samples are 3.32 nm, 16.94 nm, and 12.44 nm, respectively. Meanwhile, as shown in Figure 11, the pore volume of A2 is obviously larger than those of A1 and A3, and A1 has the smallest pore volume. This result matches the finding of Thommas’s research based on adsorption–desorption isotherms. Adsorbents with large pores result in the higher relative pressure of the start-point of capillary condensation and a wider hysteresis loop [67]. Analyzing the adsorption–desorption isotherms of three shale samples (Figure 10a,b), the pores in A1 are the smallest due to the lowest relative pressure. It is difficult to compare dominant pore sizes for A2 and A3 only from the start-point of capillary condensation because of their nearly identical relative pressure. However, when considering the width of the hysteresis loop, the dominant pore size can be ranked as A2 > A3 > A1, which verifies the result derived from pore size distribution analysis.

5. Conclusions

In this study, a new adsorption equation was developed to depict the adsorption behavior of nitrogen in shale nanopores. The application of this new equation on five shale samples was discussed regarding the curve fitting and variable analysis. In addition, we built a new approach to calculate the pore size distribution based on the developed adsorption equation. The major conclusions are summarized as follows:
1
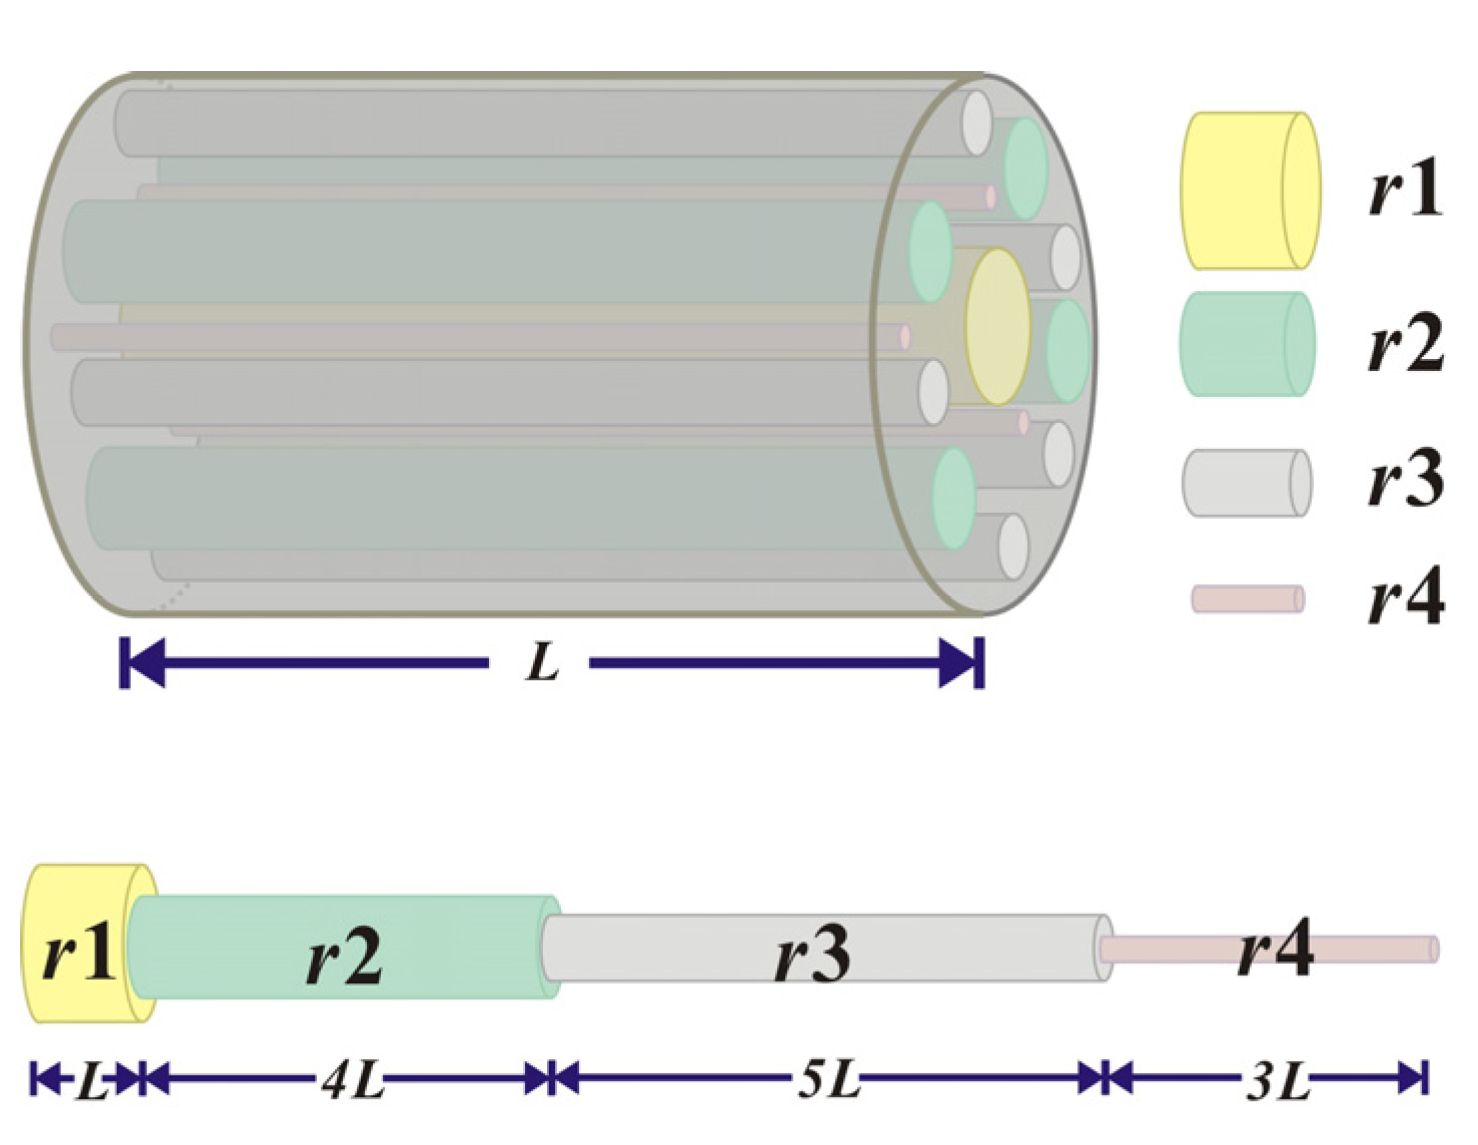
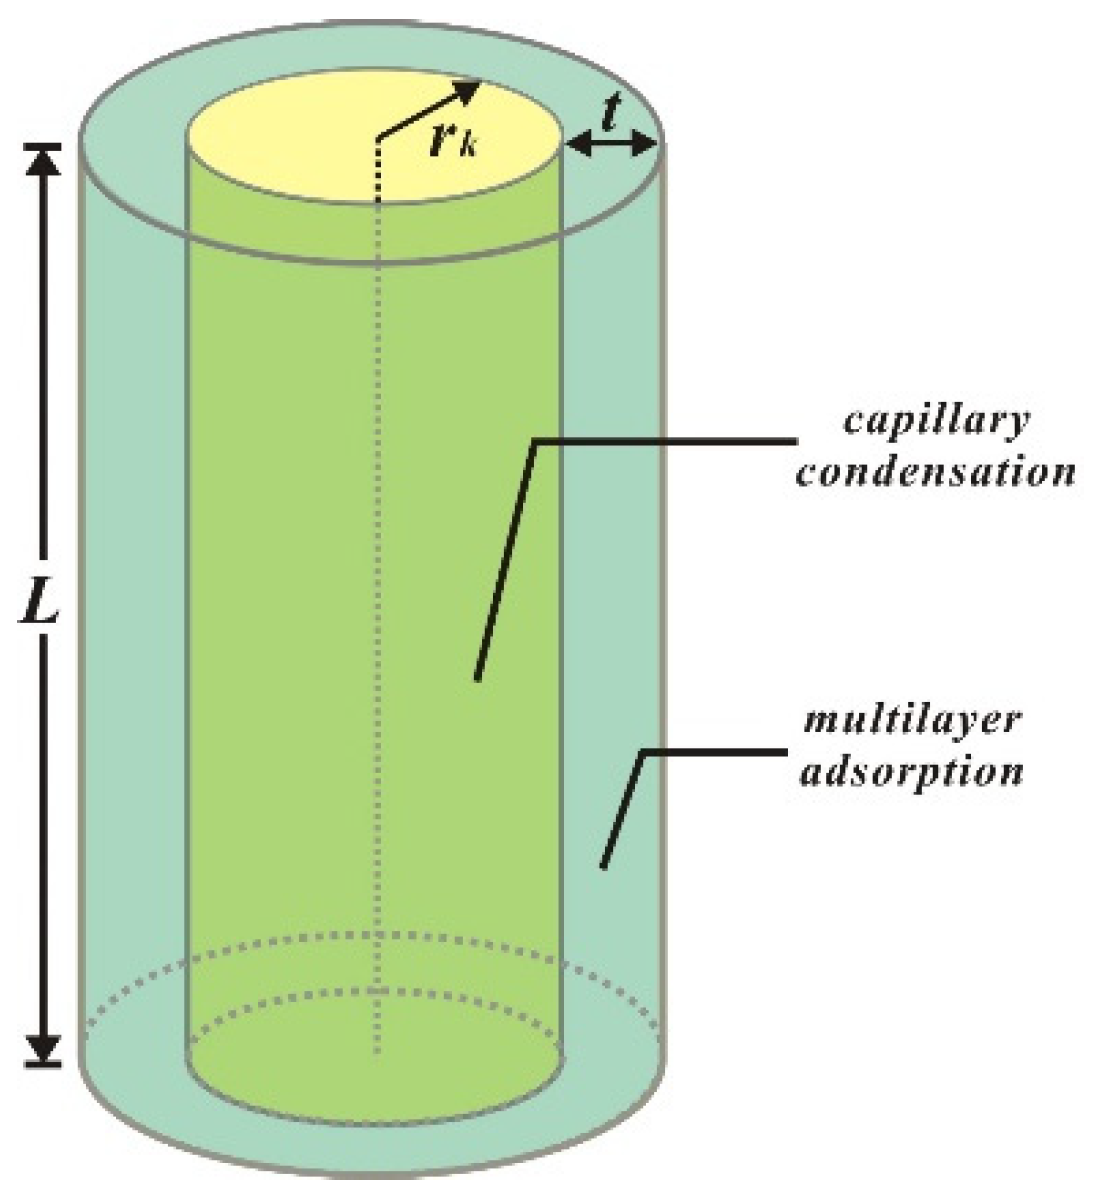
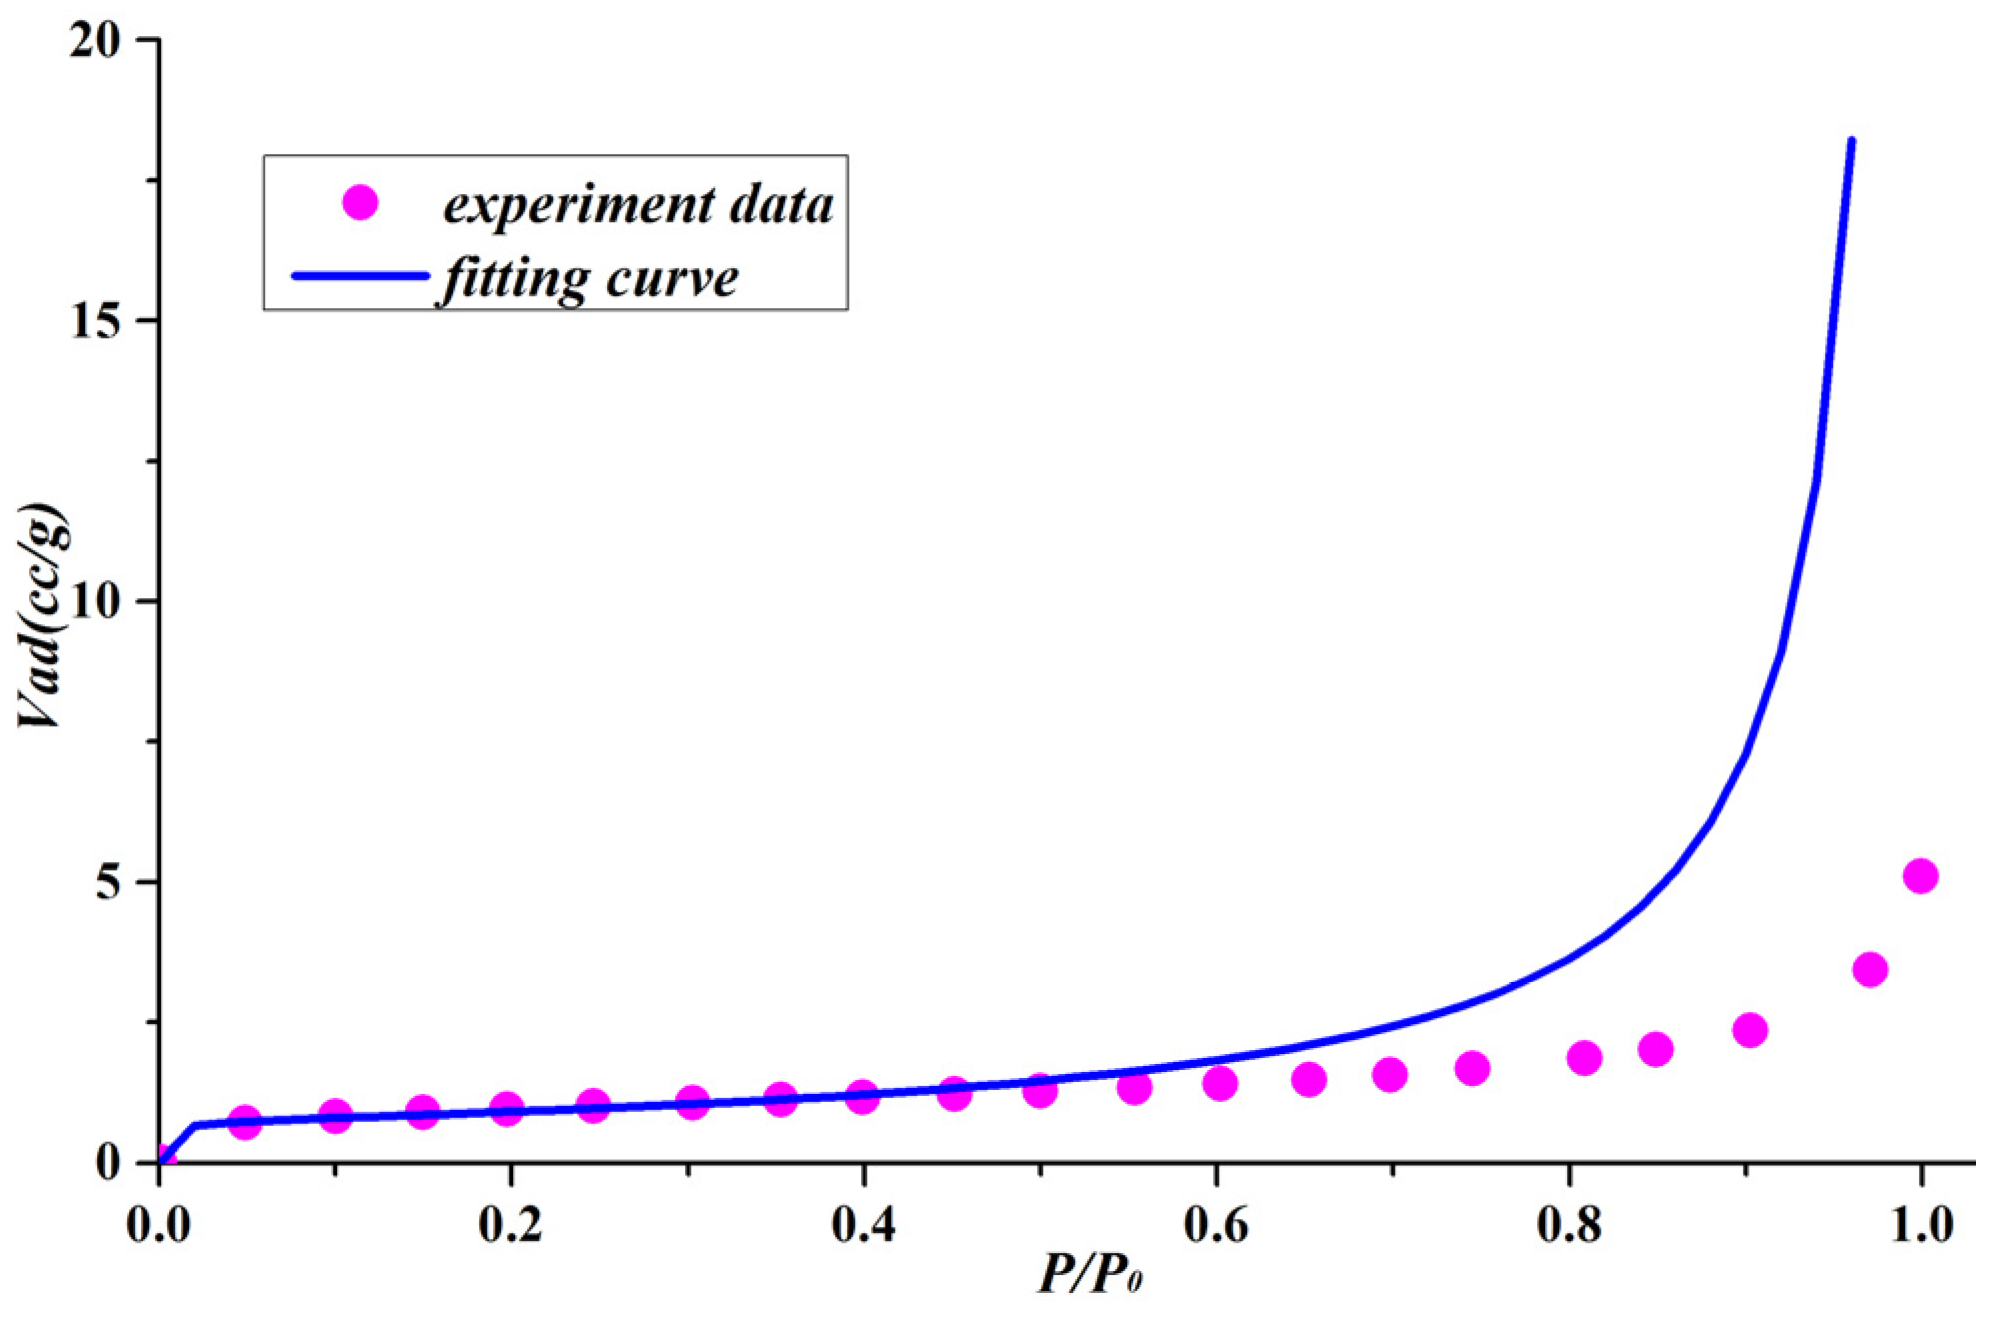
We propose a cylindrical pore model by simplifying complex pore networks as tubes with different radii. The model considers that the adsorption processes of nitrogen in shale nanopores are monolayer adsorption, multilayer adsorption, and capillary condensation. In addition, a new adsorption equation was derived from the cylindrical pore model by regarding the total adsorption volume as consisting of the inner capillary volume and the multilayer adsorption volume. The fitting results revealed that the adsorption equation is able to properly depict the experimental data for shales with cylindrical pores and slit pores.
2
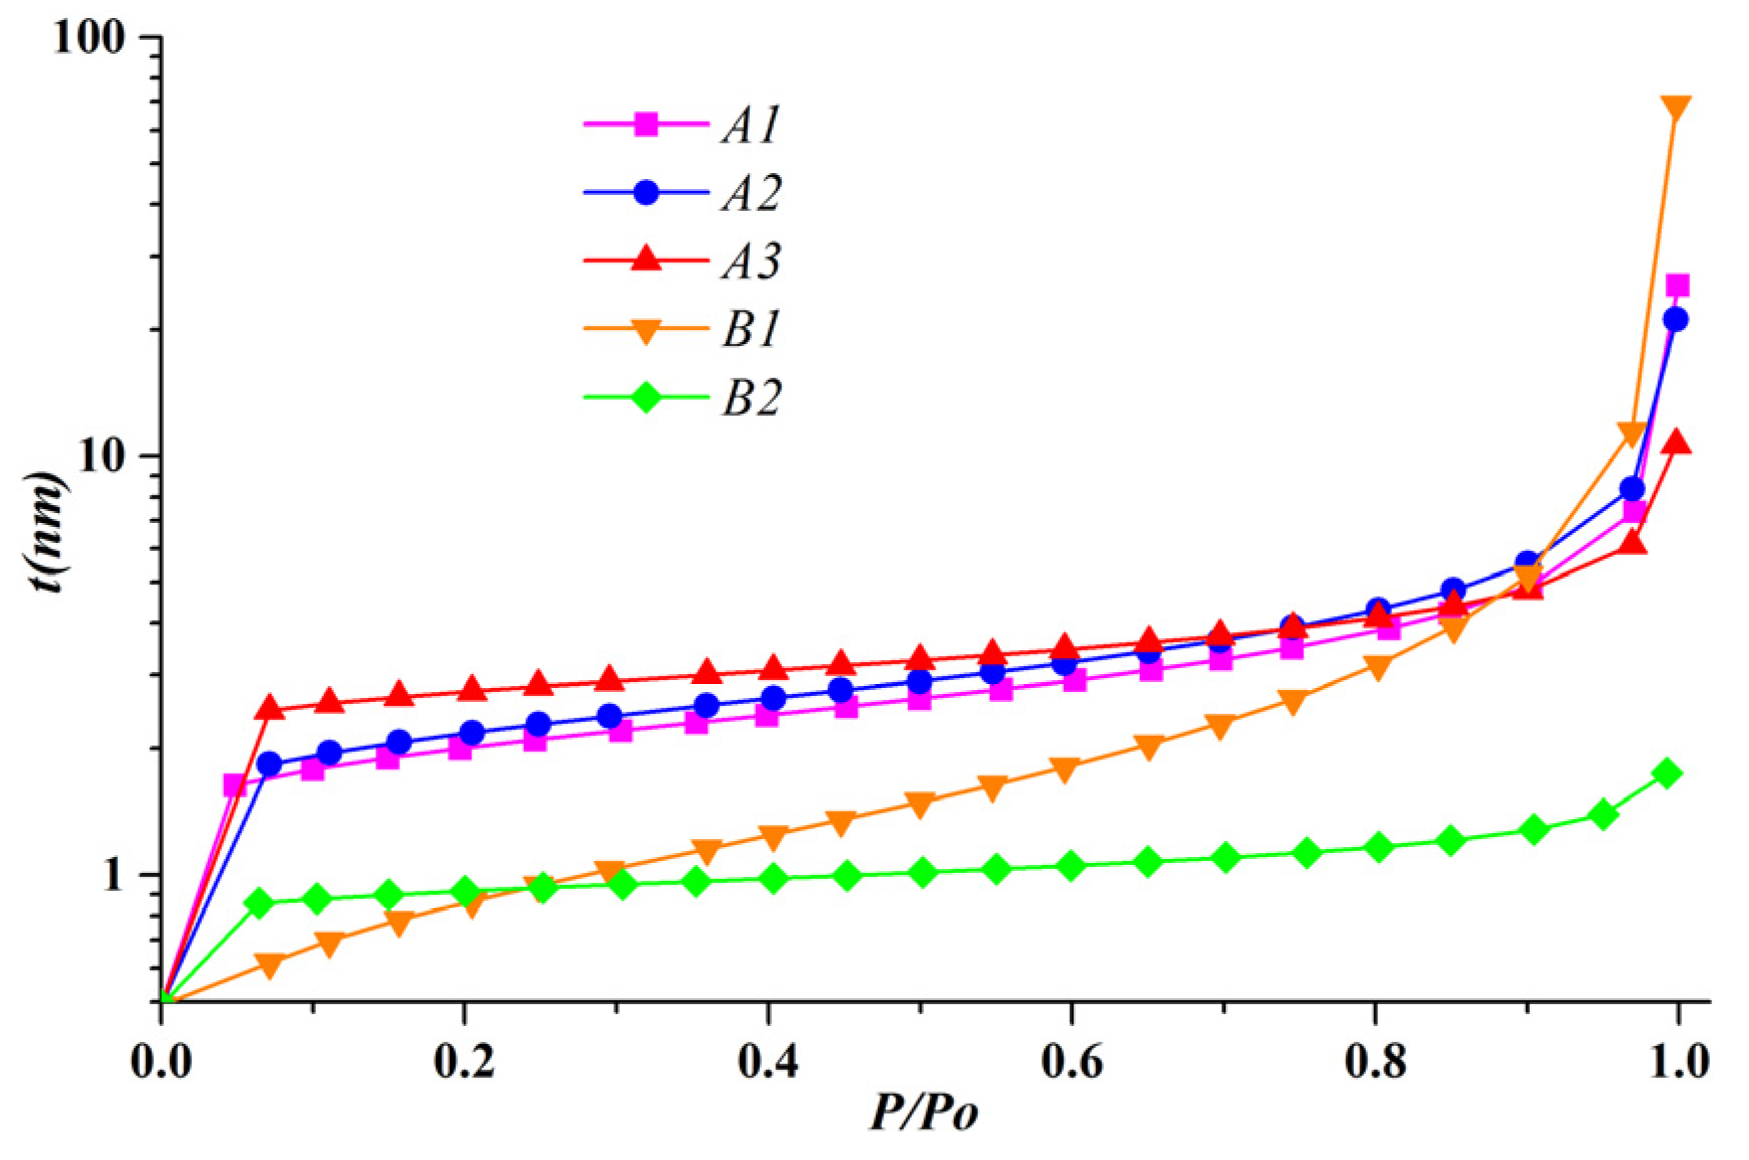
The t-curves derived from the parameters of the adsorption equation demonstrate the multilayer adsorption behavior in shale nanopores. When the relative pressure is less than 0.9, the microporous shale shows a steadily increasing t-curve because of the micropore filling. However, the inflection points at relative pressure around 0.1 indicate the saturated monolayer adsorption in other samples. When the relative pressure is greater than 0.9, the adsorption on the external interface results in a steep section on the.
3
For the cylindrical pore model, the pore volume is proportional to the inner capillary volume. When the capillary condensation volume at any relative pressure is calculated by the new adsorption isotherm, the pore size distributions of the shales can be determined successfully. In summary, it is a time-saving method to evaluate the pore volume and the dominant pore size.

Author Contributions

Conceptualization, Y.T. and Q.C.; data curation, Y.T., Y.H. (Yanqing He) and Y.H. (Yufeng He); resources, Q.C. and C.Y.; supervision, H.C.; writing—review and editing, Y.T. All authors have read and agreed to the published version of the manuscript.

Funding

This research received no external funding.

Institutional Review Board Statement

Not applicable.

Informed Consent Statement

Not applicable.

Data Availability Statement

Not applicable.

Acknowledgments

Thanks are due to Zhehui Jin (University of Alberta, Canada) for valuable discussion.

Conflicts of Interest

The authors declare no conflict of interest.

References

  1. Javadpour, F.; Fisher, D.; Unsworth, M. Nanoscale Gas Flow in Shale Gas Sediments. J. Can. Pet. Technol. 2007, 46, 55–61. [Google Scholar] [CrossRef]
  2. Pang, Y.; He, Y.; Chen, S. An innovative method to characterize sorption-induced kerogen swelling in organic-rich shales. Fuel 2019, 254, 115629. [Google Scholar] [CrossRef]
  3. Ross, D.J.; Bustin, R.M. Characterizing the shale gas resource potential of Devonian–Mississippian strata in the Western Canada sedimentary basin: Application of an integrated formation evaluation. AAPG Bull. 2008, 92, 87–125. [Google Scholar] [CrossRef]
  4. Pang, Y.; Chen, S.; Soliman, M.Y.; Morse, S.M.; Hu, X. Evaluation of Matrix Swelling Behavior in Shale Induced by Methane Sorption under Triaxial Stress and Strain Conditions. Energy Fuels 2019, 33, 4986–5000. [Google Scholar] [CrossRef]
  5. Yaalon, D.H. Mineral Composition of the Average Shale. Clay Miner. 1962, 5, 31–36. [Google Scholar] [CrossRef]
  6. Guo, T.; Zhang, H. Formation and enrichment mode of Jiaoshiba shale gas field, Sichuan Basin. Pet. Explor. Dev. 2014, 41, 31–40. [Google Scholar] [CrossRef]
  7. Ross, D.J.K.; Bustin, R.M. The importance of shale composition and pore structure upon gas storage potential of shale gas reservoirs. Mar. Pet. Geol. 2009, 26, 916–927. [Google Scholar] [CrossRef]
  8. Clarkson, C.; Solano, N.; Bustin, R.; Bustin, A.; Chalmers, G.; He, L.; Melnichenko, Y.; Radliński, A.; Blach, T. Pore structure characterization of North American shale gas reservoirs using USANS/SANS, gas adsorption, and mercury intrusion. Fuel 2013, 103, 606–616. [Google Scholar] [CrossRef]
  9. Chen, S.; Zhu, Y.; Wang, H.; Liu, H.; Wei, W.; Fang, J. Shale gas reservoir characterisation: A typical case in the southern Sichuan Basin of China. Energy 2011, 36, 6609–6616. [Google Scholar] [CrossRef]
  10. Chen, Q.; Tian, Y.; Li, P.; Yan, C.; Pang, Y.; Zheng, L.; Deng, H.; Zhou, W.; Meng, X. Study on Shale Adsorption Equation Based on Monolayer Adsorption, Multilayer Adsorption, and Capillary Condensation. J. Chem. 2017, 2017, 1496463. [Google Scholar] [CrossRef] [Green Version]
  11. Brunauer, S.; Deming, L.S.; Deming, W.E.; Teller, E. On a Theory of the van der Waals Adsorption of Gases. J. Am. Chem. Soc. 1940, 62, 1723–1732. [Google Scholar] [CrossRef]
  12. Langmuir, I. The constitution and fundamental properties of solids and liquids Part I. Solids. J. Am. Chem. Soc. 1916, 38, 2221–2295. [Google Scholar] [CrossRef] [Green Version]
  13. Langmuir, I. The constitution and fundamental properties of solids and liquids. part 2: Liquids. J. Am. Chem. Soc. 1917, 39, 1848–1906. [Google Scholar] [CrossRef] [Green Version]
  14. Butler, J.; Ockrent, C. Studies in electrocapillarity. III. J. Phys. Chem. 1930, 34, 2841–2859. [Google Scholar] [CrossRef]
  15. Markham, E.C.; Benton, A.F. The adsorption of gas mixtures by silica. J. Am. Chem. Soc. 1931, 53, 497–507. [Google Scholar] [CrossRef]
  16. Piñeiro, Á.; Brocos, P.; Amigo, A.; Gracia-Fadrique, J.; Lemus, M.G. Extended Langmuir isotherm for binary liquid mixtures. Langmuir 2001, 17, 4261–4266. [Google Scholar] [CrossRef]
  17. Besedová, E.; Bobok, D. Single-component and Binary Adsorption Equilibrium of 1,2 Dichloroethane and 1,2 Dichloropropane on Activated Carbon. Pet. Coal 2005, 47, 47–54. [Google Scholar]
  18. Jain, J.S.; Snoeyink, V.L. Adsorption from bisolute systems on active carbon. J. Water Pollut. Control. Fed. 1973, 45, 2463–2479. [Google Scholar]
  19. Ho, Y.; McKay, G. Correlative biosorption equilibria model for a binary batch system. Chem. Eng. Sci. 2000, 55, 817–825. [Google Scholar] [CrossRef]
  20. Toth, J. State equation of the solid-gas interface layers. Acta Chim. Hung. 1971, 69, 311–328. [Google Scholar]
  21. Terzyk, A.P.; Chatłas, J.; Gauden, P.A.; Rychlicki, G.; Kowalczyk, P. Developing the solution analogue of the Toth adsorption isotherm equation. J. Colloid Interface Sci. 2003, 266, 473–476. [Google Scholar] [CrossRef]
  22. Jaroniec, M.; Töth, J. Adsorption of gas mixtures on heterogeneous solid surfaces: I. Extension of Tóth isotherm on adsorption from gas mixtures. Colloid Polym. Sci. 1976, 254, 643–649. [Google Scholar] [CrossRef]
  23. Ruthven, D.M. Principles of Adsorption and Adsorption Processes; John Wiley & Sons: Hoboken, NJ, USA, 1984. [Google Scholar]
  24. Yao, C. Extended and improved Langmuir equation for correlating adsorption equilibrium data. Sep. Purif. Technol. 2000, 19, 237–242. [Google Scholar] [CrossRef]
  25. Brunauer, S.; Emmett, P.H.; Teller, E. Adsorption of Gases in Multimolecular Layers. J. Am. Chem. Soc. 1938, 60, 309–319. [Google Scholar] [CrossRef]
  26. Wang, G.; Wang, K.; Ren, T. Improved analytic methods for coal surface area and pore size distribution determination using 77 K nitrogen adsorption experiment. Int. J. Min. Sci. Technol. 2014, 24, 329–334. [Google Scholar] [CrossRef]
  27. Aranovich, G.L.; Donohue, M.D. A New Approach to Analysis of Multilayer Adsorption. J. Colloid Interface Sci. 1995, 173, 515–520. [Google Scholar] [CrossRef]
  28. Hill, T.L. Theory of Multimolecular Adsorption from a Mixture of Gases. J. Chem. Phys. 1946, 14, 268–275. [Google Scholar] [CrossRef]
  29. Bussey, B.W. Multicomponent Gas Adsorption of Ideal Mixtures. Ind. Eng. Chem. Fundam. 1966, 5, 103–106. [Google Scholar] [CrossRef]
  30. Tiren, G. The Comparison of Different BET-Type Mixed Adsorption Equations with Some Experimental Results. J. Chem. Ind. Eng. 1984, 1, 80–84. [Google Scholar]
  31. Tiren, G. The extended BET adsortion theory in mixture solution. Chemistry 1984, 9, 1–7. [Google Scholar]
  32. Fisher, L.; Israelachvili, J.N. Direct experimental verification of the Kelvin equation for capillary condensation. Nature 1979, 277, 548–549. [Google Scholar] [CrossRef]
  33. Fisher, L.; Gamble, R.A.; Middlehurst, J. The Kelvin equation and the capillary condensation of water. Nature 1981, 290, 575–576. [Google Scholar] [CrossRef]
  34. Wang, R.; Sang, S.; Zhu, D.; Liu, S.; Yu, K. Pore characteristics and controlling factors of the Lower Cambrian Hetang Formation shale in Northeast Jiangxi, China. Energy Explor. Exploit. 2017, 36, 43–65. [Google Scholar] [CrossRef]
  35. Voigt, E.M.; Tomlinson, R.H. The determination of pore size distribution and surface area from ADSO. Can. J. Chem. 1955, 33, 215–231. [Google Scholar] [CrossRef] [Green Version]
  36. Iijima, S. Helical microtubules of graphitic carbon. Nature 1991, 354, 56–58. [Google Scholar] [CrossRef]
  37. Wang, Y.; Do, D.; Nicholson, D. Study of heat of adsorption across the capillary condensation in cylindrical pores. Colloids Surf. A Physicochem. Eng. Asp. 2011, 380, 66–78. [Google Scholar] [CrossRef]
  38. Broekhof, J.C.; van Beek, W.P. Scanning studies on capillary condensation and evaporation of nitrogen. Part 1—Apparatus and calculation method. J. Chem. Soc. Faraday Trans. 1 Phys. Chem. Condens. Phases 1979, 75, 36–41. [Google Scholar] [CrossRef]
  39. Fan, C.; Do, D.D.; Nicholson, D. Condensation and Evaporation in Capillaries with Nonuniform Cross Sections. Ind. Eng. Chem. Res. 2013, 52, 14304–14314. [Google Scholar] [CrossRef]
  40. Vishnyakov, A.; Neimark, A.V. Monte Carlo Simulation Test of Pore Blocking Effects. Langmuir 2003, 19, 3240–3247. [Google Scholar] [CrossRef]
  41. Cohan, L.H. Sorption Hysteresis and the Vapor Pressure of Concave Surfaces. J. Am. Chem. Soc. 1938, 60, 433–435. [Google Scholar] [CrossRef]
  42. Zsigmondy, R. Structure of silicic acid gels and theory of dehydration. Z. Anorg. Chem. 1911, 71, 356–377. [Google Scholar] [CrossRef] [Green Version]
  43. Taylor’s, E.K.H. A Treatise on Physical Chemistry; Van Nostrand: New York, NY, USA, 1931; p. 1661. [Google Scholar]
  44. Nguyen, P.T.; Do, D.; Nicholson, D. Simulation study of hysteresis of argon adsorption in a conical pore and a constricted cylindrical pore. J. Colloid Interface Sci. 2013, 396, 242–250. [Google Scholar] [CrossRef] [PubMed]
  45. Evans, R.; Marconi, U.M.B.; Tarazona, P. Capillary condensation and adsorption in cylindrical and slit-like pores. J. Chem. Soc. Faraday Trans. 1986, 82, 1763–1787. [Google Scholar] [CrossRef]
  46. Kowalczyk, P.; Ciach, A.; Neimark, A.V. Adsorption-Induced Deformation of Microporous Carbons: Pore Size Distribution Effect. Langmuir 2008, 24, 6603–6608. [Google Scholar] [CrossRef]
  47. Terzyk, A.P.; Furmaniak, S.; Harris, P.J.; Gauden, P.A.; Włoch, J.; Kowalczyk, P.; Rychlicki, G. How realistic is the pore size distribution calculated from adsorption isotherms if activated carbon is composed of fullerene-like fragments? Phys. Chem. Chem. Phys. 2007, 9, 5919–5927. [Google Scholar] [CrossRef]
  48. de Oliveira, J.C.A.; López, R.H.; Toso, J.P.; Lucena, S., Jr.; Azevedo, D.; Zgrablich, G. On the influence of heterogeneity of graphene sheets in the determination of the pore size distribution of activated carbons. Adsorption 2011, 17, 845–851. [Google Scholar] [CrossRef]
  49. Jagiello, J.; Olivier, J.P. 2D-NLDFT adsorption models for carbon slit-shaped pores with surface energetical heterogeneity and geometrical corrugation. Carbon 2013, 55, 70–80. [Google Scholar] [CrossRef]
  50. Horváth, G.; Kawazoe, K. Method for the calculation of effective pore size distribution in molecular sieve carbon. J. Chem. Eng. Jpn. 1983, 16, 470–475. [Google Scholar] [CrossRef] [Green Version]
  51. Cheng, L.S.; Yang, R.T. Improved Horvath-Kawazoe Equations Including Spherical Pore Models for Calculating Micropore Size Distribution. Chem. Eng. Sci. 1994, 49, 2599–2609. [Google Scholar] [CrossRef]
  52. Rege, S.U.; Yang, R.T. Corrected Horváth-Kawazoe equations for pore-size distribution. AIChE J. 2000, 46, 734–750. [Google Scholar] [CrossRef] [Green Version]
  53. Yang, M.; Lin, M. A Novel Method for Analyzing Pore Size Distribution of Complex Geometry Shaped Porous Shale. Mater. Sci. Forum 2020, 1003, 134–143. [Google Scholar]
  54. Hashemipour, H.; Haghighatju, F.; Esmaeilzadeh, F. Estimation of the dimension of micropores and mesopores in single walled carbon nanotubes using the method Horvath and Kawazoe, Saito and Foley and BJH equations. Micro Nano Lett. 2016, 12, 1–5. [Google Scholar]
  55. Yang, W.; He, S.; Iglauer, S.; Guo, X.; Zhai, G.; Zhou, Z.; Dong, T.; Tao, Z.; Wei, S. Porosity characteristics of different lithofacies in marine shale: A case study of Neoproterozoic Sinian Doushantuo formation in Yichang area, China. J. Pet. Sci. Eng. 2019, 187, 106856. [Google Scholar] [CrossRef]
  56. Li, Z.; Zhang, J.; Gong, D.; Tan, J.; Liu, Y.; Wang, D.; Li, P.; Tong, Z.; Niu, J. Gas-bearing property of the Lower Cambrian Niutitang Formation shale and its influencing factors: A case study from the Cengong block, northern Guizhou Province, South China. Mar. Pet. Geol. 2020, 120, 104556. [Google Scholar] [CrossRef]
  57. Wang, P.; Zhang, C.; Li, X.; Zhang, K.; Yuan, Y.; Zang, X.; Cui, W.; Liu, S.; Jiang, Z. Organic matter pores structure and evolution in shales based on the he ion microscopy (HIM): A case study from the Triassic Yanchang, Lower Silurian Longmaxi and Lower Cambrian Niutitang shales in China. J. Nat. Gas Sci. Eng. 2020, 84, 103682. [Google Scholar] [CrossRef]
  58. Halsey, G. Physical adsorption on non-uniform surfaces. J. Chem. Phys. 1948, 16, 931–937. [Google Scholar] [CrossRef]
  59. Grosman, A.; Ortega, C. Capillary Condensation in Porous Materials. Hysteresis and Interaction Mechanism without Pore Blocking/Percolation Process. Langmuir 2008, 24, 3977–3986. [Google Scholar] [CrossRef] [PubMed] [Green Version]
  60. de Boer, J.H.; Lippens, B.C. Studies on pore systems in catalysts II. The shapes of pores in aluminum oxide systems. J. Catal. 1964, 3, 38–43. [Google Scholar] [CrossRef]
  61. Derjaguin, B. A theory of capillary condensation in the pores of sorbents and of other capillary phenomena taking into account the disjoining action of polymolecular liquid films. Prog. Surf. Sci. 1992, 40, 46–61. [Google Scholar] [CrossRef]
  62. Dietrich, S. Phase Transitions and Critical Phenomena; Academic Press: Cambridge, MA, USA, 1988; Volume 12, p. 1. [Google Scholar]
  63. Wallacher, D.; Künzner, N.; Kovalev, D.; Knorr, N.; Knorr, K. Capillary Condensation in Linear Mesopores of Different Shape. Phys. Rev. Lett. 2004, 92, 195704. [Google Scholar] [CrossRef]
  64. Morishige, K.; Tateishi, N. Adsorption hysteresis in ink-bottle pore. J. Chem. Phys. 2003, 119, 2301–2306. [Google Scholar] [CrossRef]
  65. Morishige, K.; Kittaka, S. Kinetics of Capillary Condensation of Water in Mesoporous Carbon: Nucleation and Meniscus Growth. J. Phys. Chem. C 2015, 119, 18287–18292. [Google Scholar] [CrossRef]
  66. Barrett, E.P.; Joyner, L.G.; Halenda, P.P. The Determination of Pore Volume and Area Distributions in Porous Substances. I. Computations from Nitrogen Isotherms. J. Am. Chem. Soc. 1951, 73, 373–380. [Google Scholar] [CrossRef]
  67. Thommes, M. Physical Adsorption Characterization of Nanoporous Materials. Chem. Ing. Tech. 2010, 82, 1059–1073. [Google Scholar] [CrossRef]
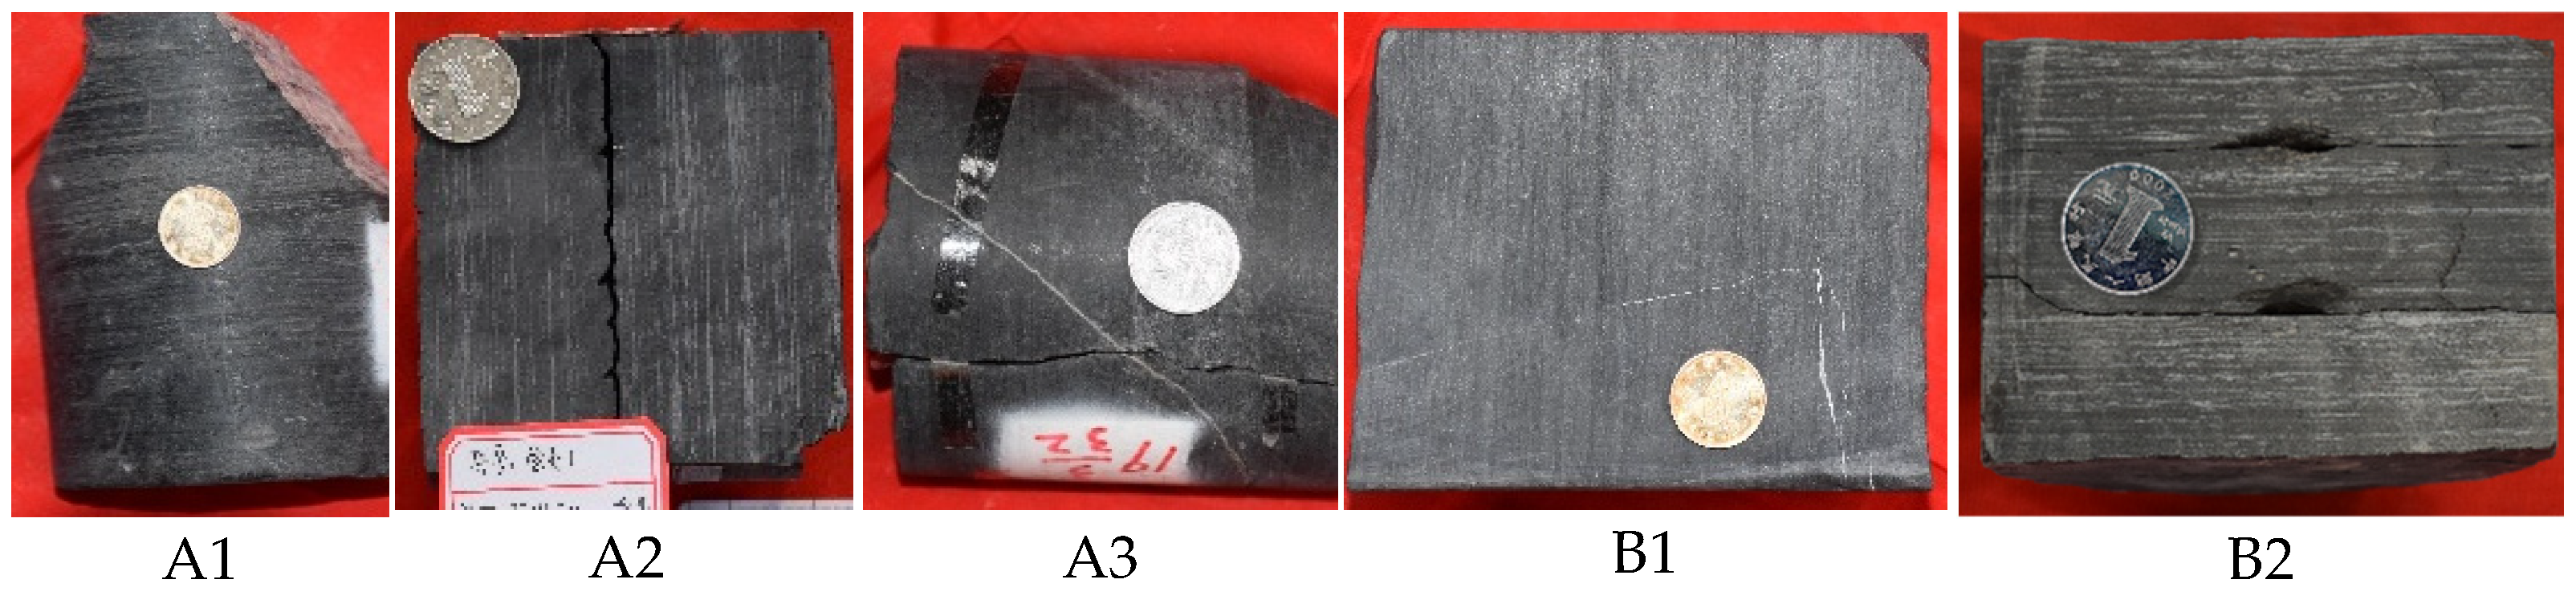
Figure 1. Images of shale samples selected from Ordos basin and Sichuan basin.
Energies 15 03199 g001
Figure 2. Diagram of the Quadrasorb SI instrument.
Energies 15 03199 g002
Figure 3. Shale adsorption isotherms (A1).
Energies 15 03199 g003
Figure 4. Schematic diagram of cylindrical pores in shale.
Energies 15 03199 g004
Figure 5. Equivalent cylindrical pore model for pore network in shale.
Energies 15 03199 g005
Figure 6. Volume division of cylindrical pore.
Energies 15 03199 g006
Figure 7. Regression of experimental data by BET adsorption equation.
Energies 15 03199 g007
Figure 8. Experimental adsorption data and relevant adsorption isotherms fitted by new adsorption equation.
Energies 15 03199 g008
Figure 9. The t-curves of five shale samples.
Energies 15 03199 g009
Figure 10. Adsorption–desorption isotherms of shale samples. (a) Slit-pore samples (A1 and A3); (b) cylindrical pore sample (A2); (c) ink-bottle-shaped sample (B2); (d) micropore-dominated samples (B1).
Energies 15 03199 g010
Figure 11. Pore size distribution of shale samples. (a) A1; (b) A2; (c) A3.
Energies 15 03199 g011
Table 1. Geological characteristics of shale samples.
Sample IDBasinLithologyFormation
A1Sichuan basinDark-black shaleNiutitang
A2Ordos basinDark-black shaleYanchang7
A3Sichuan basinBlack shaleDoushantuo
B1Ordos basinPale-black shaleYanchang7
B2Sichuan basinPale-black shaleNiutitang
Table 2. Value of variables for five shale samples.
SampleVmABCR-Square
A10.168356.615490.325249.534520.98719
A20.3651247.2358910.342359.458120.95000
A30.383368.525410.204519.824510.97331
B10.203593.315990.659498.858400.76594
B20.902222.740840.122318.793500.73911
Publisher’s Note: MDPI stays neutral with regard to jurisdictional claims in published maps and institutional affiliations.

