Article

Assessment of Environmental Loads in the Life Cycle of a Retail and Service Building

1
Faculty of Civil and Environmental Engineering, Gdansk University of Technology, 80-233 Gdansk, Poland
2
Faculty of Mechanical Engineering, Bydgoszcz University of Technology, 85-796 Bydgoszcz, Poland
3
Faculty of Civil Engineering and Architecture, Lublin University of Technology, 20-618 Lublin, Poland
4
Faculty of Mechanical Engineering, Gdansk University of Technology, 80-233 Gdansk, Poland
*
Author to whom correspondence should be addressed.
Energies 2022, 15(9), 3144; https://doi.org/10.3390/en15093144
Submission received: 17 March 2022 / Revised: 10 April 2022 / Accepted: 21 April 2022 / Published: 25 April 2022
(This article belongs to the Special Issue Energy Efficiency Improvements in Buildings to Achieve Climate Goals)

Abstract

:
In order to achieve the European Union’s climate and energy goals, investments are required, mainly in the areas of energy efficiency, renewable energy sources and infrastructure. Buildings are responsible for almost half of total energy consumption, and nearly 80% of them are energy and ecologically inefficient. The policy of European countries is increasingly more focused on facilities with the highest potential in the areas of energy and matter saving and the possibly circular economy. The aim of the work was to assess the environmental loads occurring in the life cycle of an existing retail and service building. The analysis was performed using the Life Cycle Assessment (LCA) method. By using the IMPACT 2002+ model, it has become possible to assess the impact of the life cycle of the studied facility on human health, environmental quality, climate change and raw material resources. The highest level of negative consequences in the above-mentioned areas was recorded for the life cycle with the disposal in the form of landfill storage. The operational stage was the stage in the life cycle that caused the most harmful impacts on the environment. Therefore, it is necessary to optimize the ecological and energy consumption of resources, for example, by selecting the size and cubature of the facility for its function, maintaining good technical condition, introducing improvements in the usage processes or implementing solutions aimed at reducing media consumption. As a result of the conducted analyses, it can be noticed that in the future, the reduction in energy consumption in the operation of buildings will be of fundamental importance.

1. Introduction

As part of each type of economic activity, natural resources are used to obtain products or end objects through their processing. Manufacturing processes produce many different substances and wastes that can be released directly or are discharged into the environment, creating burdens that cause significant changes to the environment over a specific period of time. Changes in nature are also caused by the loss of environmental resources obtained, for example, for the construction of commercial and service facilities. As a result, most of these types of processes are characterized by a certain share in the impact on the environment, which is manifested by the introduction of various loads causing its degradation [1,2].
The activities of nowadays societies, in which the environment was treated as a source of necessary raw materials, resulted in the depletion of natural resources and the degradation of the environment both on a local and global scale. Today, however, most countries and international organizations are intensifying activities aimed at mitigating the negative effects of this type of impact on the environment [3,4]. For this reason, the sustainable management of raw materials is crucial. An example may be the substitution of materials whose production significantly pollutes the environment by substitutes or recycling materials. An example is the use of natural zeolite as a partial replacement for cement in concrete. The use of zeolite not only contributes to the reduction in CO2 emissions but also gives measurable economic effects through improved properties and durability of the concrete [5].
Human activities have an impact on the biophysical world and vice versa—humans are also directly affected. Human societies influence the world of plants and animals, change water conditions and even affect the climate of the Earth’s surface, thus disturbing the environmental balance. Loads and disturbances reach ecosystems in the form of gases (nitrogen oxides, sulfur, fluorine, etc.), dust (e.g., metals), wastewater, carcinogens, toxic chemicals, noise, vibration, radiation, heat or light, and are characterized by a destructive effect.
Compliance with environmental protection laws is necessary to maintain the ability to control the relations between the economy and the environment that determine social and economic development. Obtaining the desired balance between human activity, development and environmental protection requires that the latter be taken into account in economic policy, including legal conditions concerning retail and service buildings [6,7].
Due to changes in the economic situation and social expectations, also in the life cycles of buildings, in addition to construction and manufacturing aspects, the goals of respecting the environment should be considered. Suitable tools for assessing are therefore indispensable for this, as they enable emerging environmental problems to be taken into account. The basic tool used for this type of assessment is an environmental analysis covering the full life cycle, known as LCA (Life Cycle Assessment).
The first recorded mention of this type of technique was in 1969 when Harold Smith presented the results of his research at the World Energy Conference. They concerned the production of selected types of energy in various chemical processes and were analyzed from the stage of obtaining raw materials to obtaining the final product [8]. LCA began to be used as a tool to create the creation of environmental policy.
In the 1970s, a significant number of research reports based on the LCA technique appeared, the main cause of which were successive energy crises. Later, the interest in LCA issues increased on a global scale, which resulted in efforts to standardize the methodology. The International Journal of LCA has been regularly published since 1995 on ongoing research in the life cycle assessment.
LCA is a technique aimed at assessing potential threats to the environment, made by identifying and determining the number of used materials, energy and waste substances released into the environment in all phases of the facility’s life cycle [9].
After introducing the standards from the ISO 14000 family, the LCA methodology became more and more known in the world. It is an evaluation tool that ensures comparable analytical results while considering many different environmental problems. Environmental analysis of, for example, commercial and service facilities allows for orderly consideration of complex issues related to the effects on the environment, considering their entire life cycle [10,11,12].
LCA was recognized internationally as a successful tool for assessing the environmental impact of facilities. The analyses are carried out to answer the question of what damage is inflicted to the environment as a result of the impact of the life cycle of, for example, a building. Influences resulting from the use of natural resources as well as the generation of waste and pollution introduced into the environment are significant. However, the literature lacks comprehensive studies on the environmental impact of retail and service buildings [13,14].
Therefore, the main objective of the study was to assess the environmental loads in the life cycle of a retail and service building. It is based on a real case study—a facility located in Poland.

2. Materials and Methods

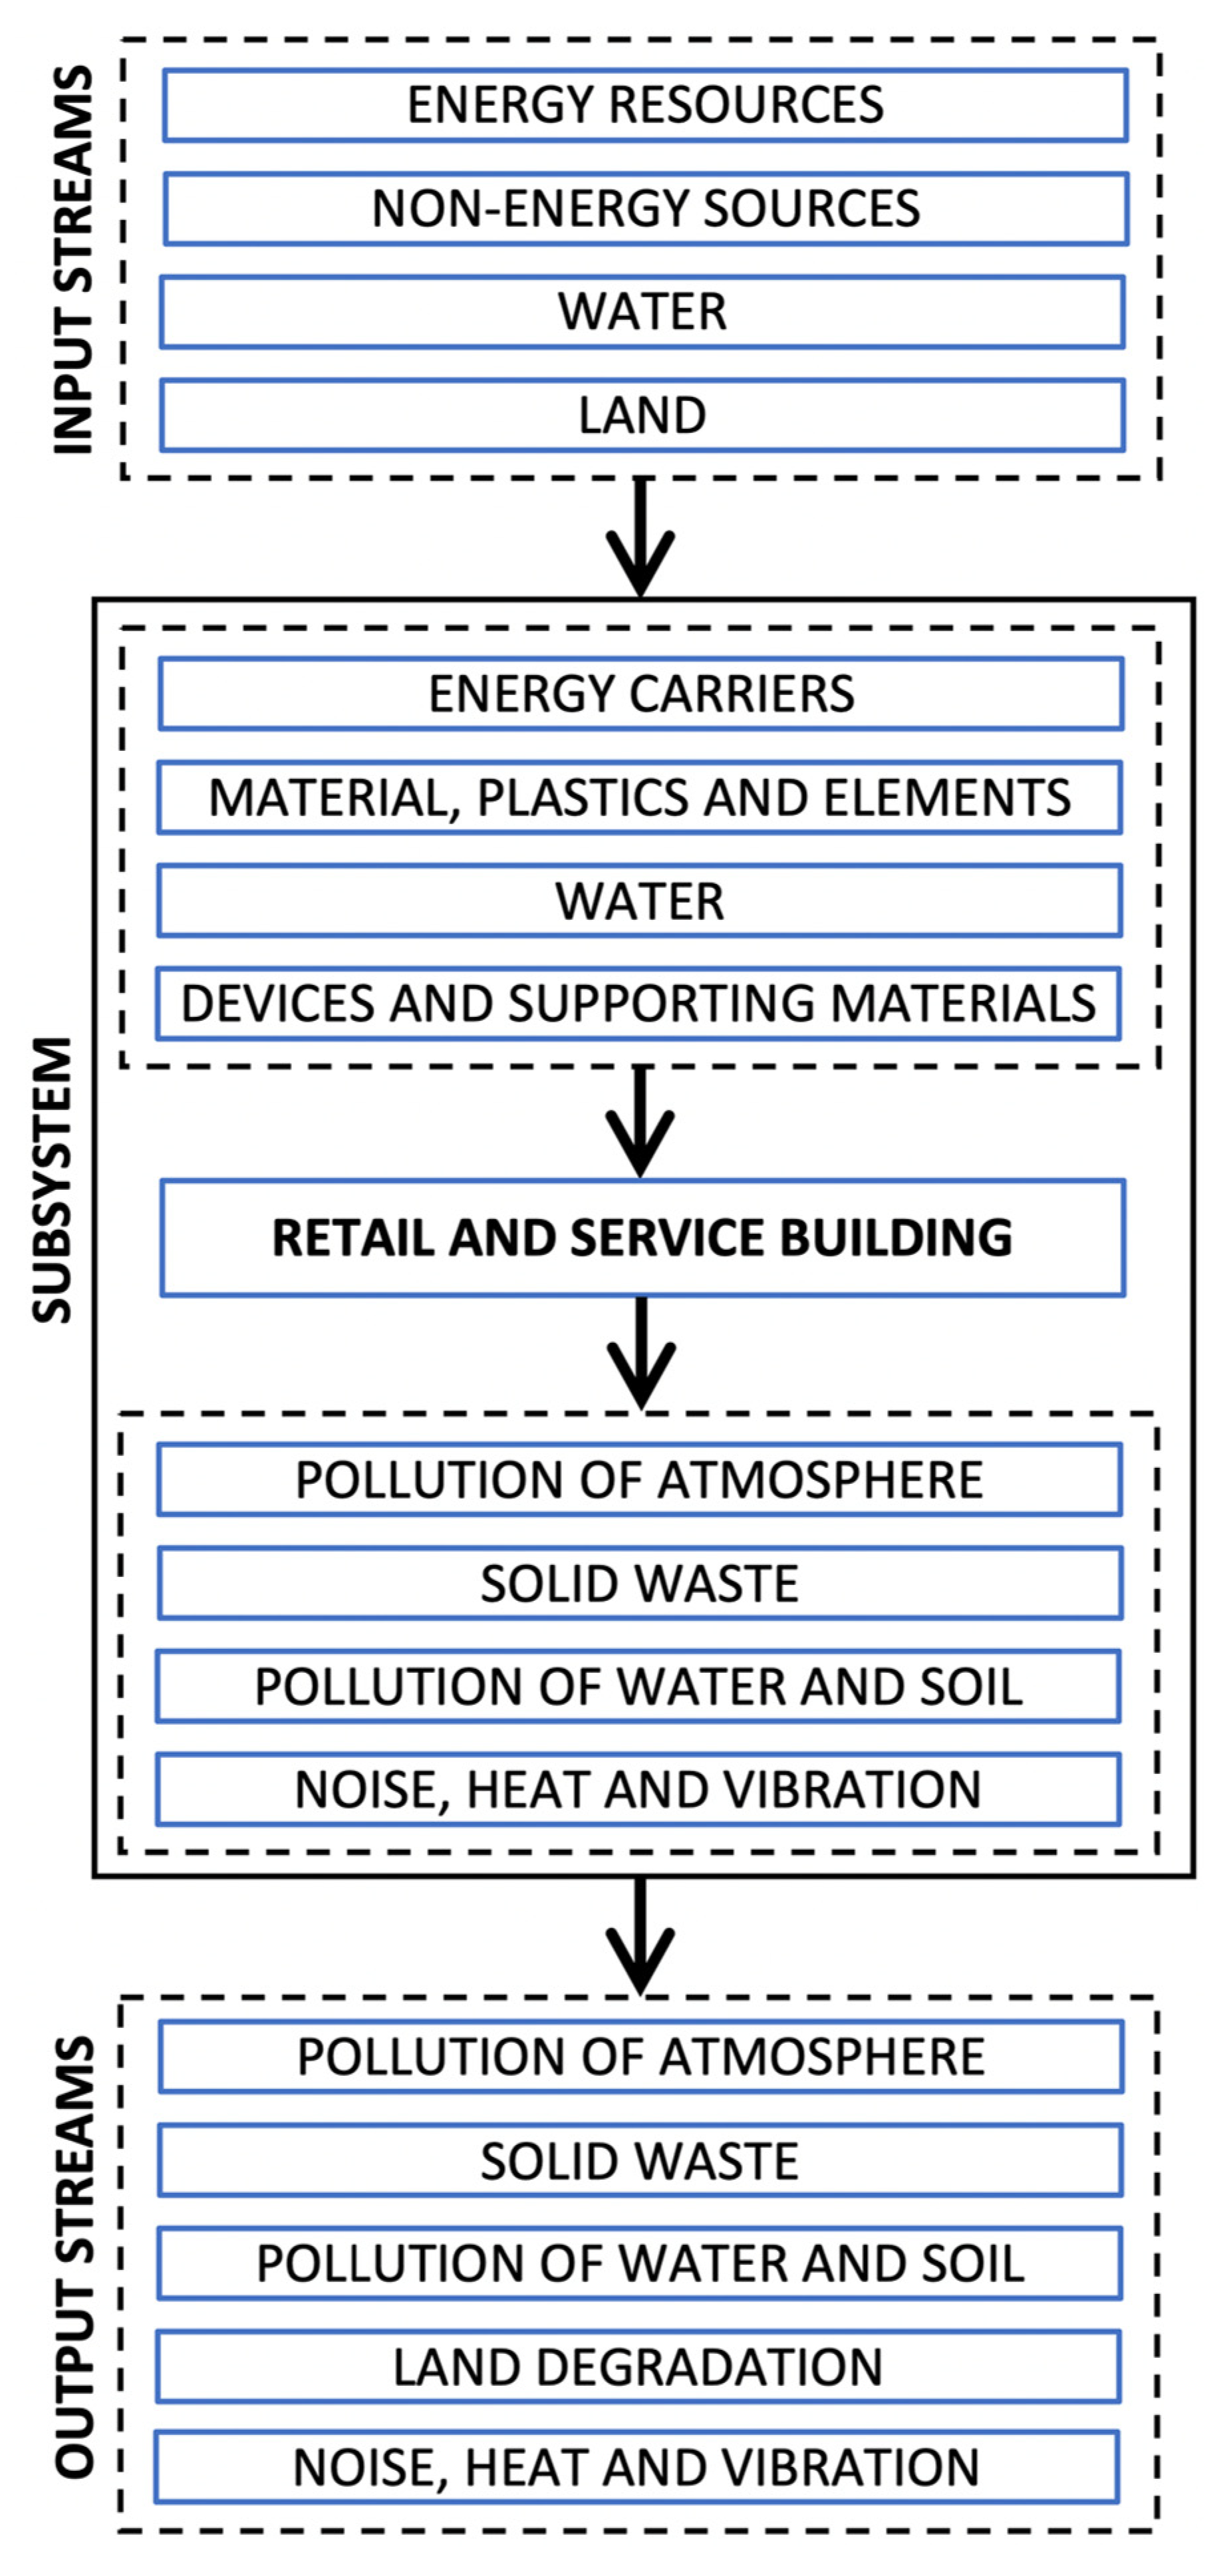
2.1. Research Object and Methods

The researched object was a commercial and service building located in Janikowo in the central part of Poland with access roads, pavements and parking lots.
A retail and service building can be considered a specific subsystem in the eco-industrial facility system (Figure 1). The area between the system and subsystem boundaries of a building object fills the environment of the subsystems, ensuring the production of plastics, components, semi-finished products, energy carriers, water preparation, auxiliary and consumables, waste management and wastewater treatment, etc. The boundaries of the subsystem of the retail and service building during construction are determined by the space of the construction site and during operation—by the area not only of the external partitions of the building but also of the parking lot and access roads. The consumption of previously prepared factors in other subsystems constitutes the input to this subsystem. Input streams are consumed during construction, operation and post-use [15,16].
The general entry into the eco-industrial facility system is the consumption of energy and non-energy resources, water and land use. The outputs are, in the life cycle, emissions of pollutants into the atmosphere, water and soil, and also waste, heat, noise, vibration, radiation and land degradation. The environment of the analyzed system is the natural environment, including natural resources and climatic conditions, as well as the economic system, including economic policy and legal regulations. An extremely important element of the environment is also the industry, which has specific possibilities of producing building materials and techniques for the construction of commercial and service facilities. The environmental conditions in which a building is located, dictated by the climate and surroundings, have an impact on its operation and durability. Therefore, the environment has an impact on the behavior of the eco-industrial system of the facility and the obtained results of analyses, which also depend on the parameters characterizing the impact of other subsystems [15,16].
LCA (Life Cycle Assessment) was selected as the method to assess the effect of the analyzed object on the environment. According to the guidelines included in ISO 14040 (environmental management, life cycle assessment, principles and framework) and ISO 14044 (environmental management, life cycle assessment, requirements and guidelines) standards, the analysis consisted of four stages: determination of goal and scope (Section 2.2), life cycle inventory (Section 2.3), life cycle impact assessment (Section 2.4) and interpretation (Section 2.5) [17,18].
The area of the analysis was determined using the system boundaries. Most of the processes taking place within the analyzed phases of the life cycle of a retail and service building, i.e., manufacture, exploitation and post-use management, are taking place in Europe; therefore, it was adopted as the geographical boundary of research. The time range covers the 40-year period of use of the facility, incl. renovations. Each phase of the life cycle was characterized by strictly defined time limits: the manufacturing phase covered the period from the beginning of the design to the handover of the finished building, the exploitation phase—from the start of use by employees and customers at its completion, and the post-use management phase—from the beginning of demolition work operations to transfer the generated waste to a landfill or to a recycling plant. As a functional unit 1 m2 of the analyzed facility was identified. It applies to the entire system of a retail and service building and corresponds to its operational properties and functions. The cut-off criterion was less than 0.01% share of the entire life cycle and the environmental impact at the level of a particular cycle phase.
The analysis was carried out based on the LCA methodology using the IMPACT 2002+ method for 14 impact categories, taking into account the manufacturing, exploitation and post-use in the form of disposal on landfills and recycling (excluding the stages of storage, distribution and sale of plastics, materials and construction elements) as the basic stages of selected building object life cycle and separately—related to construction works, sanitary and electrical installations, roads and parking lots. An analysis of environmental impacts was also performed in the main areas of impact, i.e., human health, environmental quality, climate change and raw materials resources. The analysis was carried out for real data for a selected building object as input data, assuming the consumption of materials (e.g., sand, lime, wood, kaolin, clinker, etc.), utilities (mainly gas and electricity) and human work converted into the consumption of energy.
In order to determine the cumulative environmental load in the life cycle of a retail and service building, it is necessary to know the number of materials and building elements used, energy, etc., and the corresponding cumulative load indicators. The total cumulative environmental load in the life cycle of a retail and service building (OjBHU) is the sum of:
OjBHU = OwBHU + OeBHU + OzBHU
where:
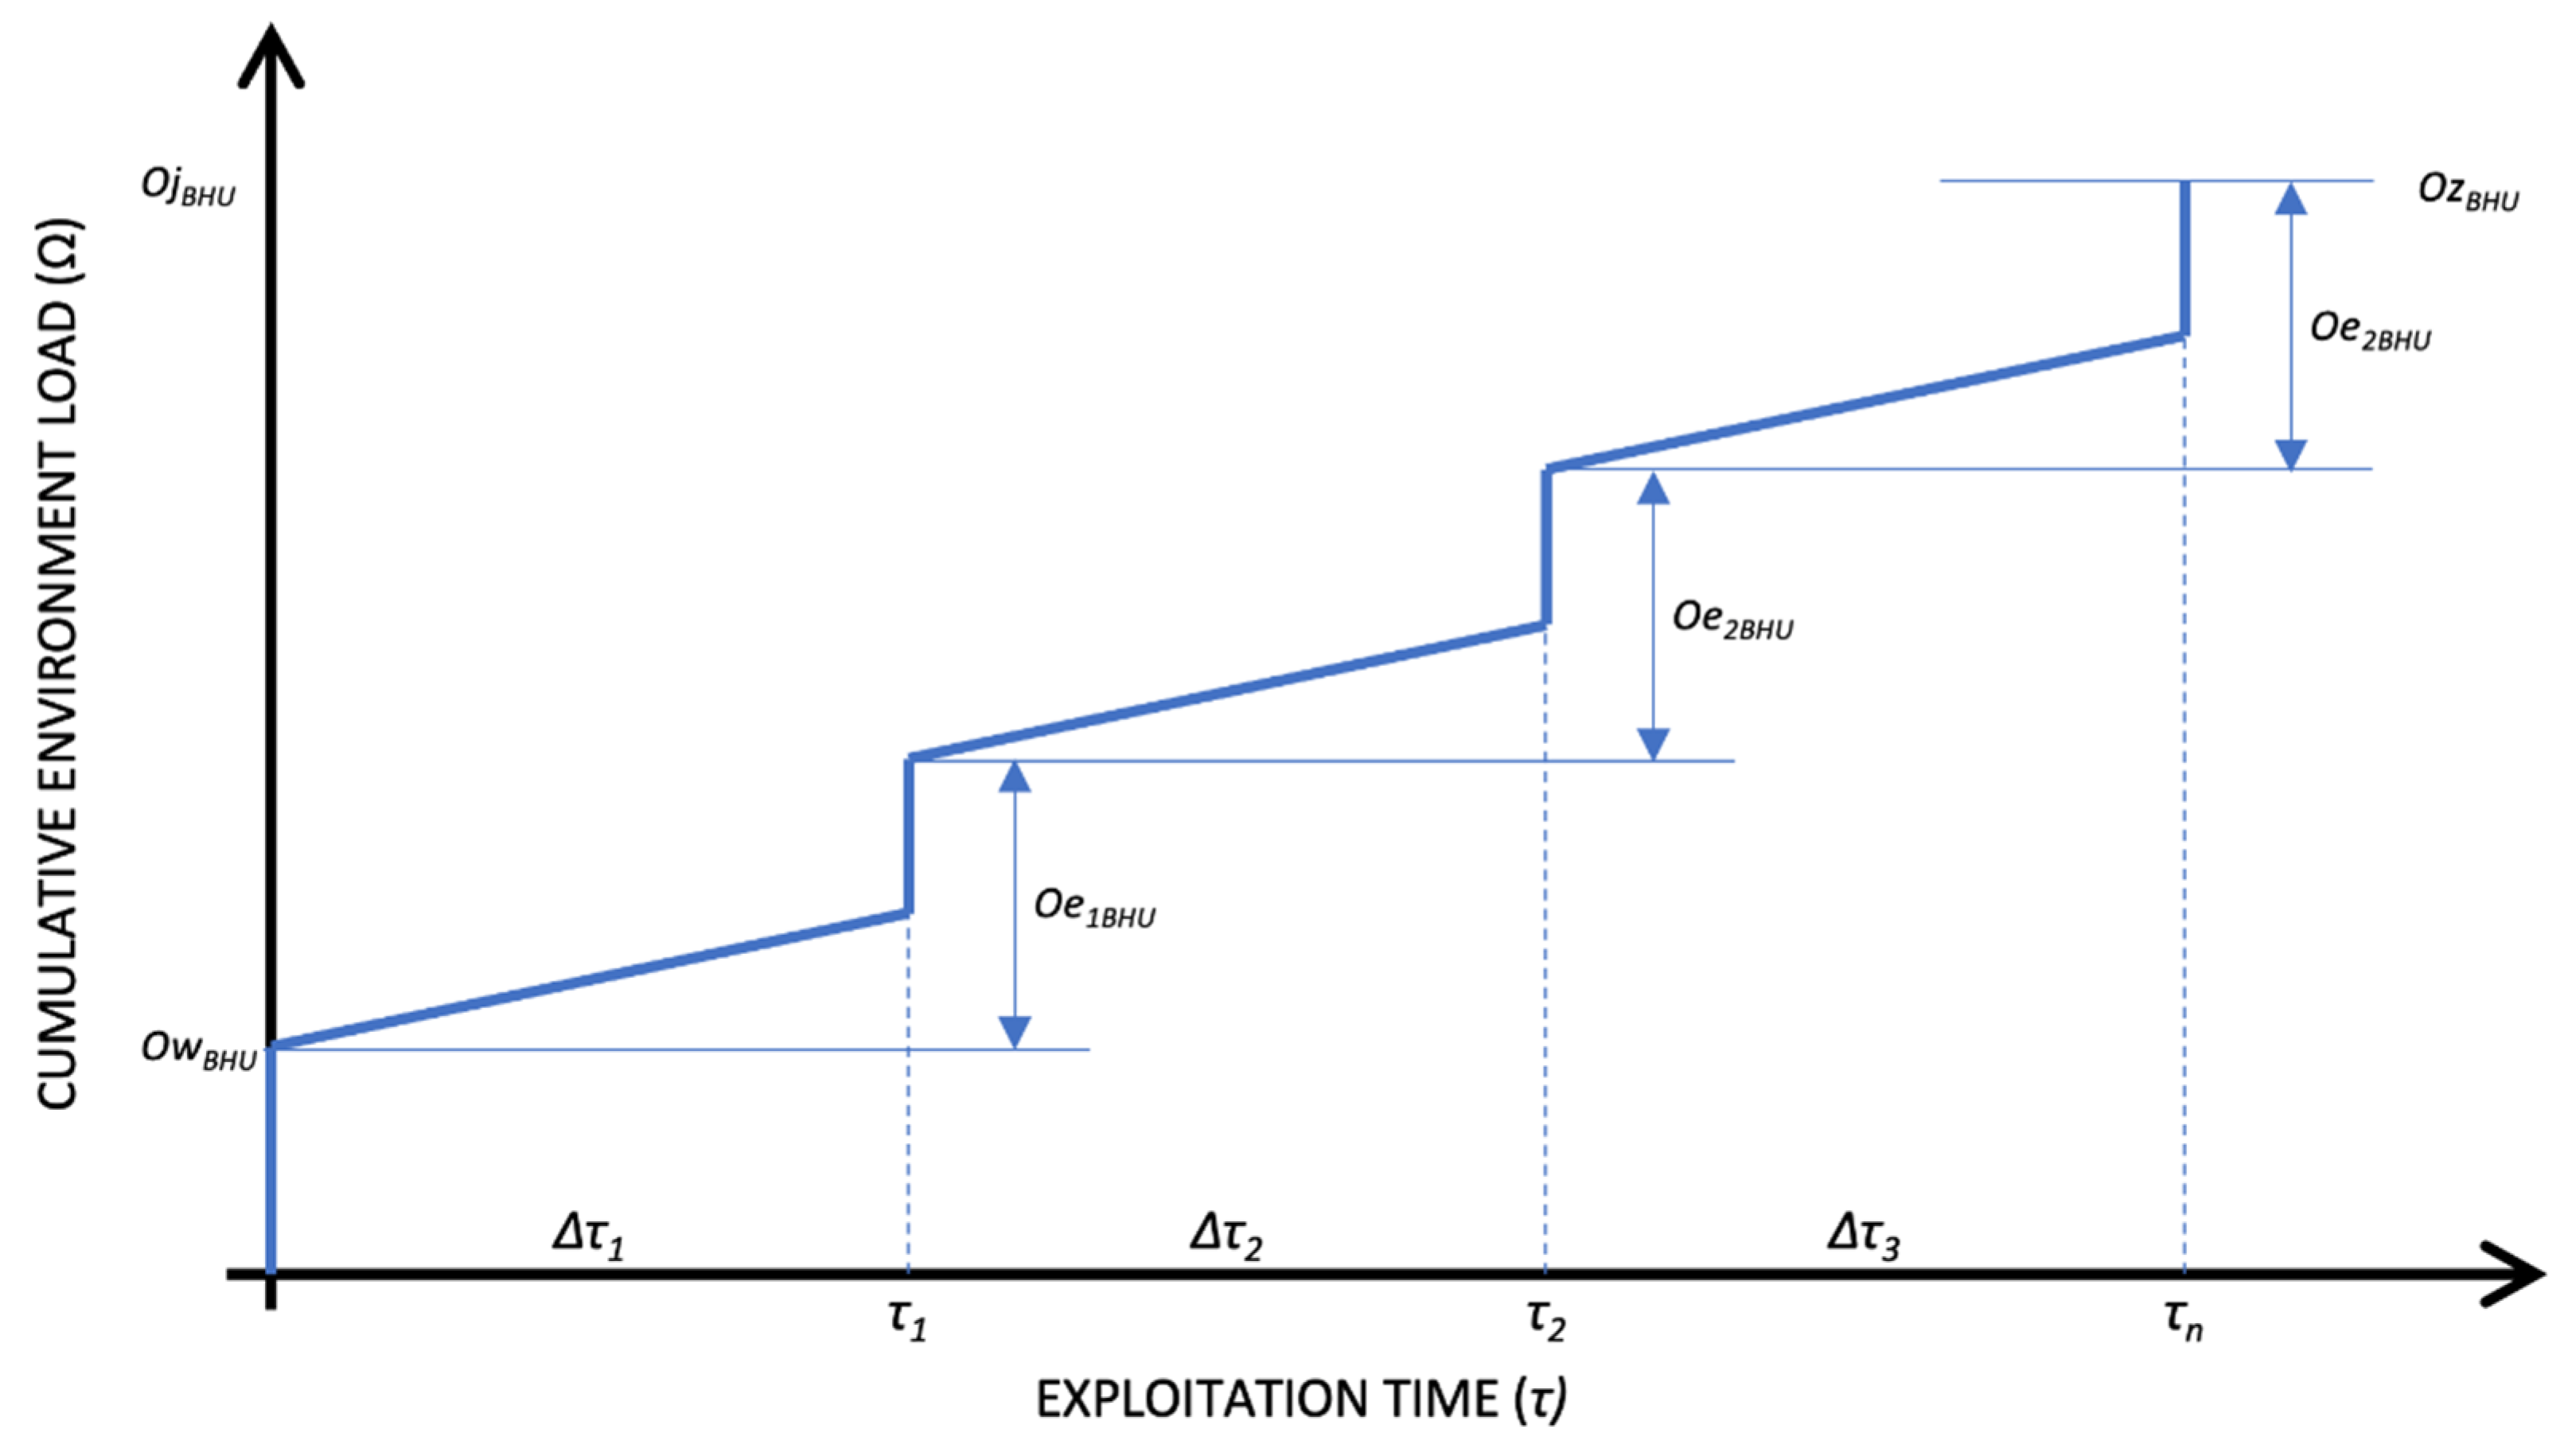
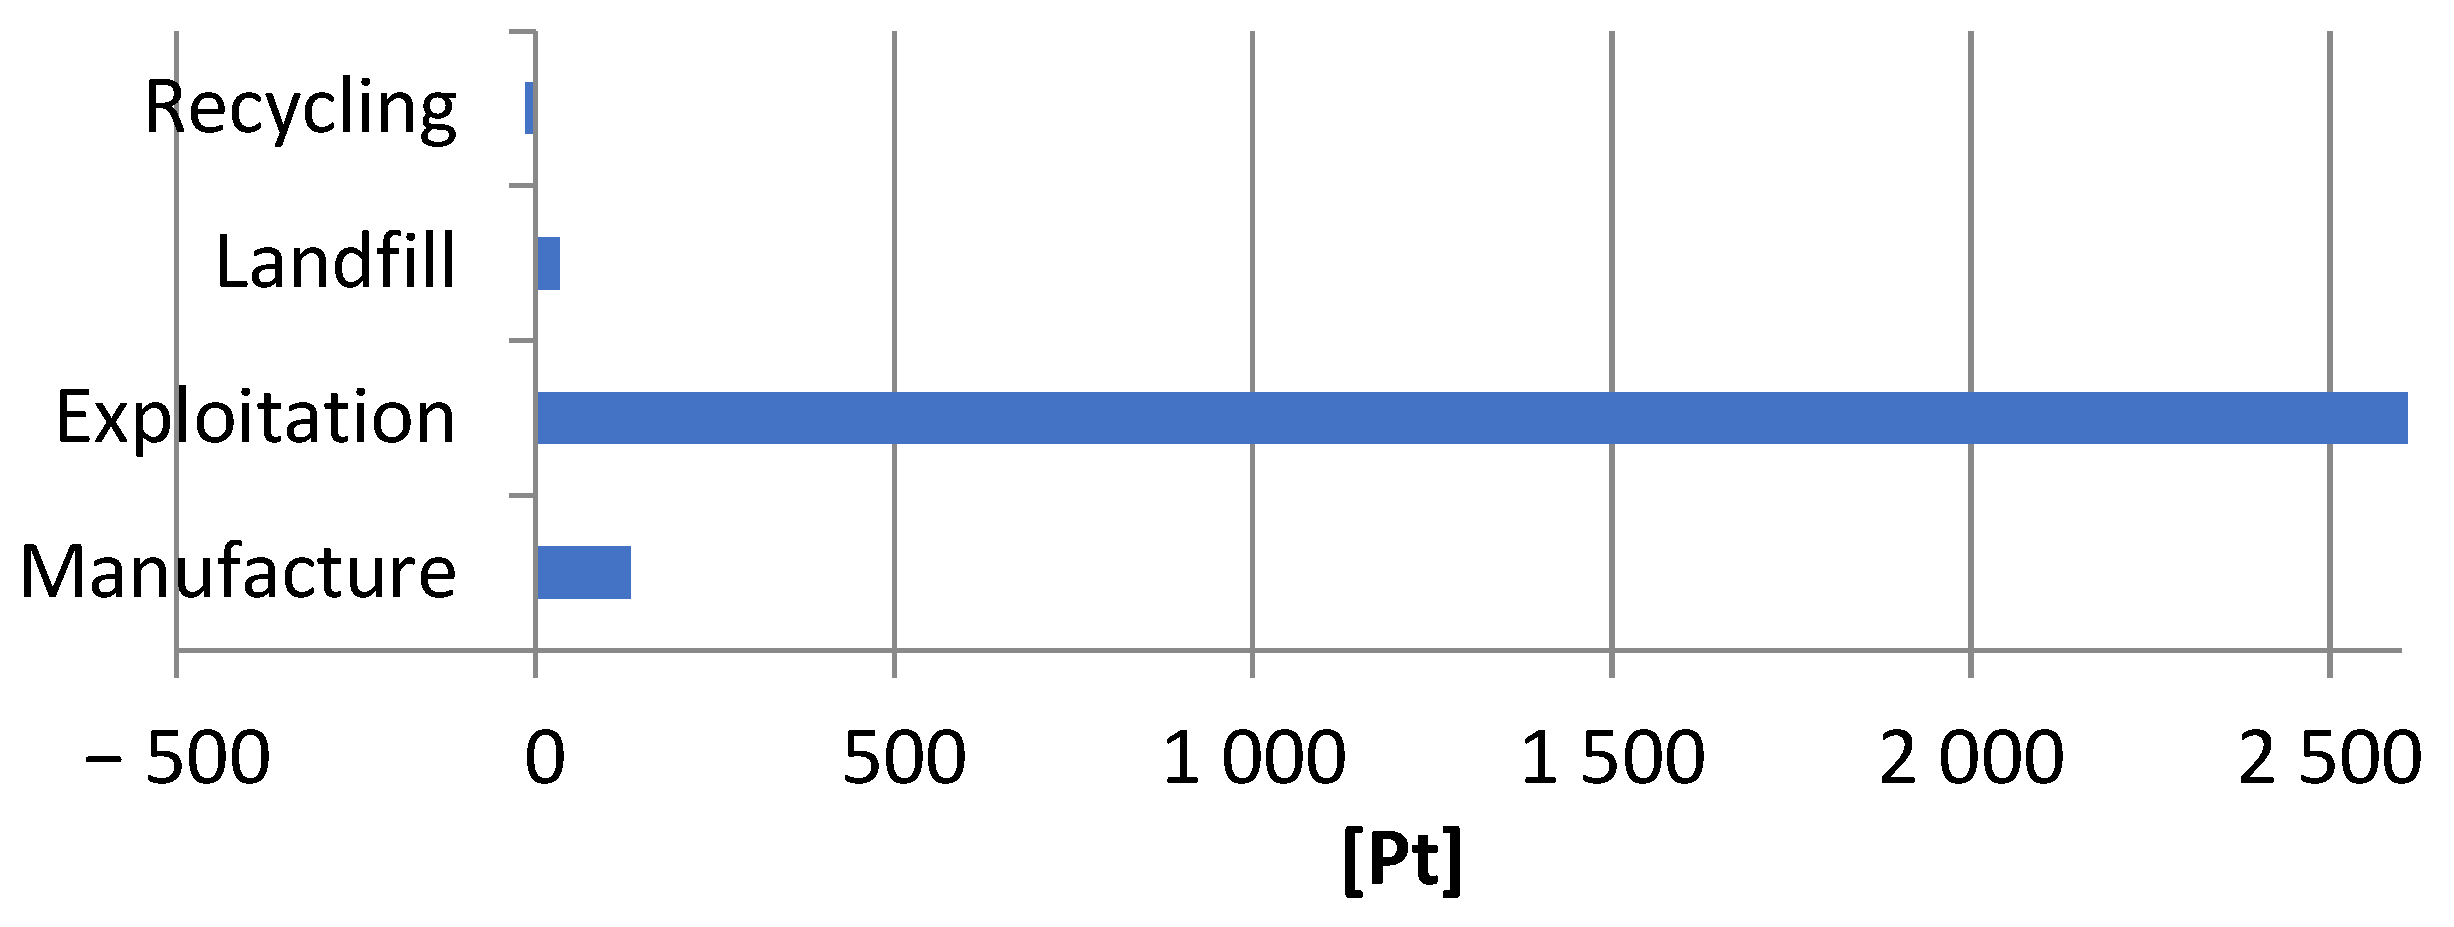
  • OwBHU—cumulative environmental load in the production phase, including production of plastics, materials and elements as well as the construction of building objects;
  • OeBHU—cumulative environmental load in the operation phase, taking into account the consumption of energy and matter during use and periodic repairs;
  • OzBHU—cumulative environmental load in the post-consumer phase, for example, landfilling or recycling [15].
The course of the cumulative environmental load-in time (Figure 2) is the sum of the loads in individual phases of the life cycle and is calculated based on the known characteristics of the building and its operation plan, which should contain a precise description of all operation and renovation works and the corresponding consumption of materials, energy carriers, water, etc. in the assumed period of operation [15].
At the moment τ = 0, the construction of a retail and service building is completed, and thus, the production phase ends. At the same time, its operation phase begins. At the start of this phase, the building is characterized by the cumulative OwBHU load discharged into the environment in the previous phase. In the period τ = 0 − τ1, an approximately linear increase in the cumulative load is recorded, which is the result of the relatively constant consumption of energy carriers each year. In fact, these values may fluctuate to some extent, depending on, for example, weather conditions. At the moment τ = τ1, there is an increase in the cumulative environmental load as a result of periodic repairs. After the end of the operation of the facility (τ = τn), the cumulative environmental load increases by the value of OzBHU, which is a consequence of incurring energy and material expenditure on demolition works. After the end of the post-use development processes, the environmental load reaches the value of OjBHU, which is the total cumulative environmental load for the entire life cycle of the retail and service building. Its value may be reduced, for example, through the use of recycling processes [15].

2.2. Determination of Goal and Scope

The first stage of the analysis was to define the purpose and scope. The paper presents an assessment of environmental loads in the life cycle of a retail and service building. The type of conducted analysis is non-comparative. Additionally, the most important areas of the positive and negative impact of the facility on the environment and human health were indicated. The analysis was primarily used to assess the existing facility (LCA retrospective), but it also allows for the modeling of future changes, e.g., selecting alternative materials and formulating recommendations that allow for the creation of more environmentally friendly solutions (LCA prospective).
The stages of storage, distribution and sale of plastics, materials and construction elements were excluded from the LCI model and hence not investigated. The main reason was the possibility of obtaining large discrepancies in the data obtained at these stages. For example, storage could last from several days to several months, and distribution could take place at distances from several dozen to several hundred or more kilometers.
The assessment carried out for the purposes of this study can be classified as bottom-up—the main point of interest was seeking to identify profitable opportunities of a strictly defined system, presented in a very detailed, micro scale way. The advanced level of the research places it among the detailed analyses. The data used in the analysis were obtained from the investor, manufacturers of plastics, materials and construction elements, or from the SimaPro 8.1 databases.

2.3. Life Cycle Inventory (LCI)

In the next stage of the analysis, the LCI model was prepared, which is a specific image of the structure of the system of the examined retail and service facility. Its smallest elements form unit processes that are connected with each other by material and energy streams. The data collected as part of the work were aggregated and collected in inventory tables. These include physical inputs and outputs, mainly raw materials, semi-finished products, water, energy, emissions to water, soil and atmosphere, waste, human labor inputs, etc. After defining the unit processes, they were validated in the form of a bilateral balance sheet mass and energy. The models were constructed systematically and then filled with data, with the size of the inputs always being balanced by the size of the outputs.
During the conducted analyses, there was no problem with allocation. The information provided by the investor and the producers made it possible to precisely determine the number of used plastics, materials, elements and energy in the life cycle of the research object. Detailed inventory data were covered by a confidentiality agreement.
The research object was a retail and service building with a usable area of 842.2 m2 and a traffic area of 86.3 m2, in a total of 1008 m2 and a cubature of 6309 m3, located in Janikowo, Kuyavian-Pomeranian Voivodeship in central Poland with access roads, pavements and a car park with a total area of 2556.5 m2. The analyzed building includes a one-story pavilion with a social and office part. The single-nave hall has a span of 24 m, and the roof is hipped, covered with ceramic tiles, curtain walls and brick (Figure 3) [investor’s data].
Plastics, materials and elements necessary for the construction of the researched object were divided into four groups of installations related to construction works, sanitary installations, electrical installations, roads and parking lots.
As part of the construction works related to the construction of the analyzed facility, the following work was performed: earthworks, building foundations, reinforced concrete elements, blacksmith and locksmith construction elements, brick structures, roof, roofing, insulation, internal plaster, construction joinery, floors and floors, suspended ceilings and painting. Almost 130 different materials and elements were used during construction works. As part of the installation of sanitary installations of the analyzed facility, the following was performed: water supply, rainwater drainage, sanitary sewage installation, central heating installation, natural gas installation and ventilation installations. During the implementation of sanitary installations, almost 200 different materials and elements were used. As part of the electrical installations assembly of the analyzed object, the following were made: the electrical installation of the internal power line and the lightning protection system. During the construction of electrical installations, 45 different materials and elements were used. During the construction of roads and parking lots, 15 different materials and elements were used [investor’s data].
Figure 4 presents the materials with the largest total mass share used during the construction of the analyzed retail and service building. The maximum material demand was recorded for sand—over 5.6 thousand tons [investor’s data].
Figure 5 summarizes the amount of human work that is necessary during the construction of the analyzed retail and service building in terms of energy consumption. The largest number of man-hours was at the construction work stage—14,095 man-hours, which translates into almost 5000 kWh [investor’s data].
Figure 6 shows the consumed energy (kWh) and fuel (liters) by the equipment used in the construction of the retail and service building under study. The highest demand for fuel was found in construction works (9458 L), while the maximum electricity consumption was recorded during electrical installations (953 kWh) and construction works (804 kWh) [investor’s data].
Based on the data from electricity meters and gas consumption meters for the period of 5 years, the average annual and forecast media consumption during 40 years of building operation was determined (Table 1).

2.4. Life Cycle Impact Assessment (LCIA)

The next stage of the analysis was to determine the relations with the environment of all inputs and outputs included in the LCA model and to estimate the impact of the entire life cycle of the analyzed facility on all elements of the environment. In order to transform the LCI data into impact category indicators and to obtain the indicator value for individual impact categories, the following mandatory elements had to be performed under the LCIA: selection of impact categories, category indicator and characterization models assigning the LCI results to impact categories (classification) and calculating the value of the indicator category (characterization). As a result of these activities, an environmental profile was created, which was subject to additional analyses as part of optional elements, including normalization, grouping and weighting [19,20,21].
The assessment has been carried out with the SimaPro 8.4 software (Ecoinvent 3.4 database) using the method IMPACT 2002+.
As part of the IMPACT 2002+ method, experts created new concepts, incl. comparative assessment of human toxicity and ecotoxicity based on a midpoint. This allows using the advantages of both indicators based on midpoints, as in the CML model and methodologies based on the assessment in end points, as for Eco-indicator 99. Harmful factors for humans are calculated not only for carcinogens but also for other substances. There are fifteen impact categories in total, presented in units specific for each stage as an equivalent of a given substance: carcinogens (kg C2H3Cl eq), non-carcinogens (kg C2H3Cl eq), respiratory inorganics (kg PM 2.5 eq), ionizing radiation (Bq C-14 eq), ozone layer depletion (kg CFC-11 eq), respiratory organics (kg C2H4 eq), aquatic ecotoxicity (kg TEG (triethylene glycol) water), terrestrial ecotoxicity (kg TEG soil), terrestrial acid/nutri (kg SO2 eq), land occupation (m2 org. arable), aquatic acidification (kg SO2 eq), aquatic eutrophication (kg PO4 P-lim), global warming (kg CO2 eq), non-renewable energy (MJ primary) and mineral extraction (MJ surplus). After normalization, the results were grouped and weighting in four areas of influence, human health, ecosystem quality, climate change and resources, and presented in environmental points (Pt) [22,23].
Classification assigns the LCI results to an impact category. The use of the SimaPro software made it possible to automate this stage. Characterization and conversion of LCI results into impact categories are complex processes. LCI results should be converted using appropriate characterization parameters and presented in the form of relative shares in each of the impact categories. The calculation procedure used in the analysis was the IMPACT 2002+ method [22,24].
Normalization consists of determining the value of the category indicator in relation to a specific reference value by dividing the indicator value by the latter one. Usually, entire or mean impacts value for specific areas, for example, Europe, are taken as reference. Normalization makes it possible to determine the share of the considered effect in the total consequence. This leads to a standardized environmental description. By means of normalization, dimensionless results are obtained, constituting the basis for further analyses, such as weighting. It is also necessary to assess the distance between the considered quantity and the target values that should be obtained. Additionally, it facilitates the interpretation and understanding of weighting. It is also a specific illustration of the effects represented in the final result of the calculations. In this study, normalization was carried out with the SimaPro software [22,25,26].
After the normalization was carried out, grouping began, consisting in assigning impact categories to one or more groups, consistent with the previously established purpose and scope of the research. Grouping results in ordering and possibly prioritizing impact categories. In the LCIA stage, the values of the category index can be weighted and summed to obtain the environmental effect. Weighting is based on assigning weight to each impact category so that they can be compared with each other. The key actions are given the greatest importance and are then considered first. The result of weighting is presented in environmental points (Pt). The value of 1000 Pt reflects the environmental impact in Europe per inhabitant in one year. Grouping and weighting in the conducted research were carried out with the SimaPro software [22,27,28,29].
The results of the analyses are presented for all phases of the life cycle, i.e., manufacture, exploitation, landfill and recycling in relation to the entire retail and service building, and separately—related to construction works, sanitary installations, electrical installations, roads and parking lots.

2.5. Interpretation

Interpretation is the last stage of LCA analyses, which is understood as a systematic procedure for identifying, qualifying, checking and evaluating information obtained at the LCI and LCIA stages. Its primary purpose is to present the results in a consistent, complete form that is easy to understand. The interpretation carried out under the LCA is to lead to the formulation of final conclusions, clarification of possible limitations and determination of recommendations to minimize the negative impact on the surroundings of the facility under consideration [8,19,20].
The interpretation stage is not only the last element of the LCA study, as it is present at all times of the analysis and should be conducted in accordance with the adopted purpose. LCA is an iterative technique in which the interpretation of the results obtained at each stage determines whether the initial assumptions remain unchanged or are subject to some modifications [9].
Interpretation of the life cycle of a retail and service building enables the identification of those elements, materials or materials for which the risk of negative impact in relation to the environment is the highest. On the basis of the obtained numerical results, it becomes possible to find out which processes in the LCA analysis are characterized by the greatest harmful impact on the environment and which of them are less or negligible. Usually, the higher the numerical value of the considered process or element, the greater its negative effect on the environment. This allows indicating an area where improvements should be made. It is also the basis for determining a method that allows for reducing energy consumption, material consumption or the amount of generated waste. This can happen by changing the techniques of production, construction, post-consumer waste management, transport, etc. [22,30,31,32].

3. Results

The obtained research results are presented with division into three sections. Section 3.1 presents a comparison of the results of the potential impact on the surroundings of the life cycle of the analyzed retail and service building, divided into 15 impact categories. The data were compiled for the entire life cycle, taking into account post-use management in the form of landfill storage or recycling, and broken down into individual life cycle stages, which are manufacture, exploitation, landfill and recycling. Additionally, the potential impact on the environment of individual stages of the life cycle was compiled and broken down into main groups of installations, which are construction works, sanitary installations, electrical installations, roads and parking lots.
Section 3.2 presents selected results of grouping and weighting, taking into account impact categories, and Section 3.3—areas of influence. The impact category, which causes the most negative environmental consequences in the life cycle of the analyzed retail and service building, such as compounds causing global warming and for the same reason area of influence related to climate change, was discussed in detail. The obtained results were also grouped into four areas of influence, i.e., human health, ecosystem quality, climate change and resources, and then compared within the different life cycle stages and main groups of building installations.

3.1. Characterization

In fourteen impact categories, the life cycle of a retail and service building with post-use management in the form of storage is characterized by a higher level of negative environmental consequences compared to the cycle in which recycling processes were used. Only one category is an exception, the processes related to the use of land, for which, in both cases, analogous numerical values were obtained (1.20 × 10⁴ m2 org. arable) due to the similar area occupied by a building structure, regardless of the method of subsequent development of its materials and elements (Table 2).
The exploitation stage of a retail and service building has the most negative environmental consequences in almost all impact categories due to the use of conventional energy sources to cover the building’s heat and electricity needs. Two exceptions were noted. The first is the category of compounds that increase the eutrophication of waters, in which the most harmful impacts are caused by the post-use management stage in the form of landfilling (2.36 × 10² kg PO4 P-lim), which is related to the impact on the surroundings of the stored elements. The second is a category of processes related to the extraction of mineral raw materials, for which the greatest demand occurs during the manufacture of plastics, materials and elements (2.12 × 10⁵ MJ surplus) (Table 3).
The most negative environmental consequences at the manufacturing stage of a retail and service building were recorded for construction works. The maximum values of harmful impacts in nine categories were due to the enormous material consumption of this part of the building. A significant amount of destructive impacts, especially those related to the acidification of the environment, took place during the production of electrical installations with the highest level of negative impacts in four categories—inorganic compounds causing respiratory diseases: 2.85 × 10² kg PM 2.5 eq, compounds increasing soil acidification: 4.13 × 10³ kg SO2 eq, compounds increasing acidification of water: 3.49 × 10³ kg SO2 eq and processes related to the extraction of mineral resources: 1.74 × 10⁵ MJ surplus. It was largely related to the processes of extracting copper ores and cable production, which is an extremely energy-consuming process associated with significant environmental degradation. Copper is most often obtained (90%) from ore mined in opencast mines. The copper content of the ore is usually between 0.2 and 2.5%. The impact on the surroundings of opencast copper mines includes, for example, destruction of soil cover, changes in water conditions due to surface drainage, air pollution, excessive noise emission, seismic shocks, impact on fauna and flora or the formation of hazardous waste and sewage. Copper is produced in several steps: the output is floated, during which the copper sulfides are separated from the gangue. In this way, concentrates are obtained, which in turn are used to form cathodes, used for the production of copper products. The use of copper scrap for the production of new products would reduce the energy and material consumption of the processes, and thus, their negative impact on the environment (Table 4).
The highest level of harmful impact at the exploitation stage of a retail and service building, in all impact categories, was recorded for utility consumption, which mainly covers the demand for gas and electricity, which, in Poland, is associated mainly with the use of conventional energy sources (Table 5).
The stage of storing plastics, materials and elements necessary in the life cycle of roads, parking lots and construction works was the source of the greatest number of negative environmental consequences in all analyzed impact categories. These are groups of installations that are distinguished by the highest material consumption (Table 6).
The use of recycling processes in the life cycle of a building is associated with many positive environmental consequences. In the most impact categories, there has been a reduction in the level of harmful impacts over the entire life cycle, especially for construction works. The exception was the category of compounds increasing the ecotoxicity on land, for which the recycling processes caused some negative environmental effects due to energy needs, materials, reagents and other chemicals needed for the processes. However, the negative environmental impacts were lower than in the case of landfilling processes (construction works: 1.79 × 10⁴ kg TEG soil, electrical installations: 2.80 × 10³ kg TEG soil, sanitary installations: 1.60 × 10³ kg TEG soil roads and parking lots: 2.96 × 10² kg TEG soil) (Table 7).

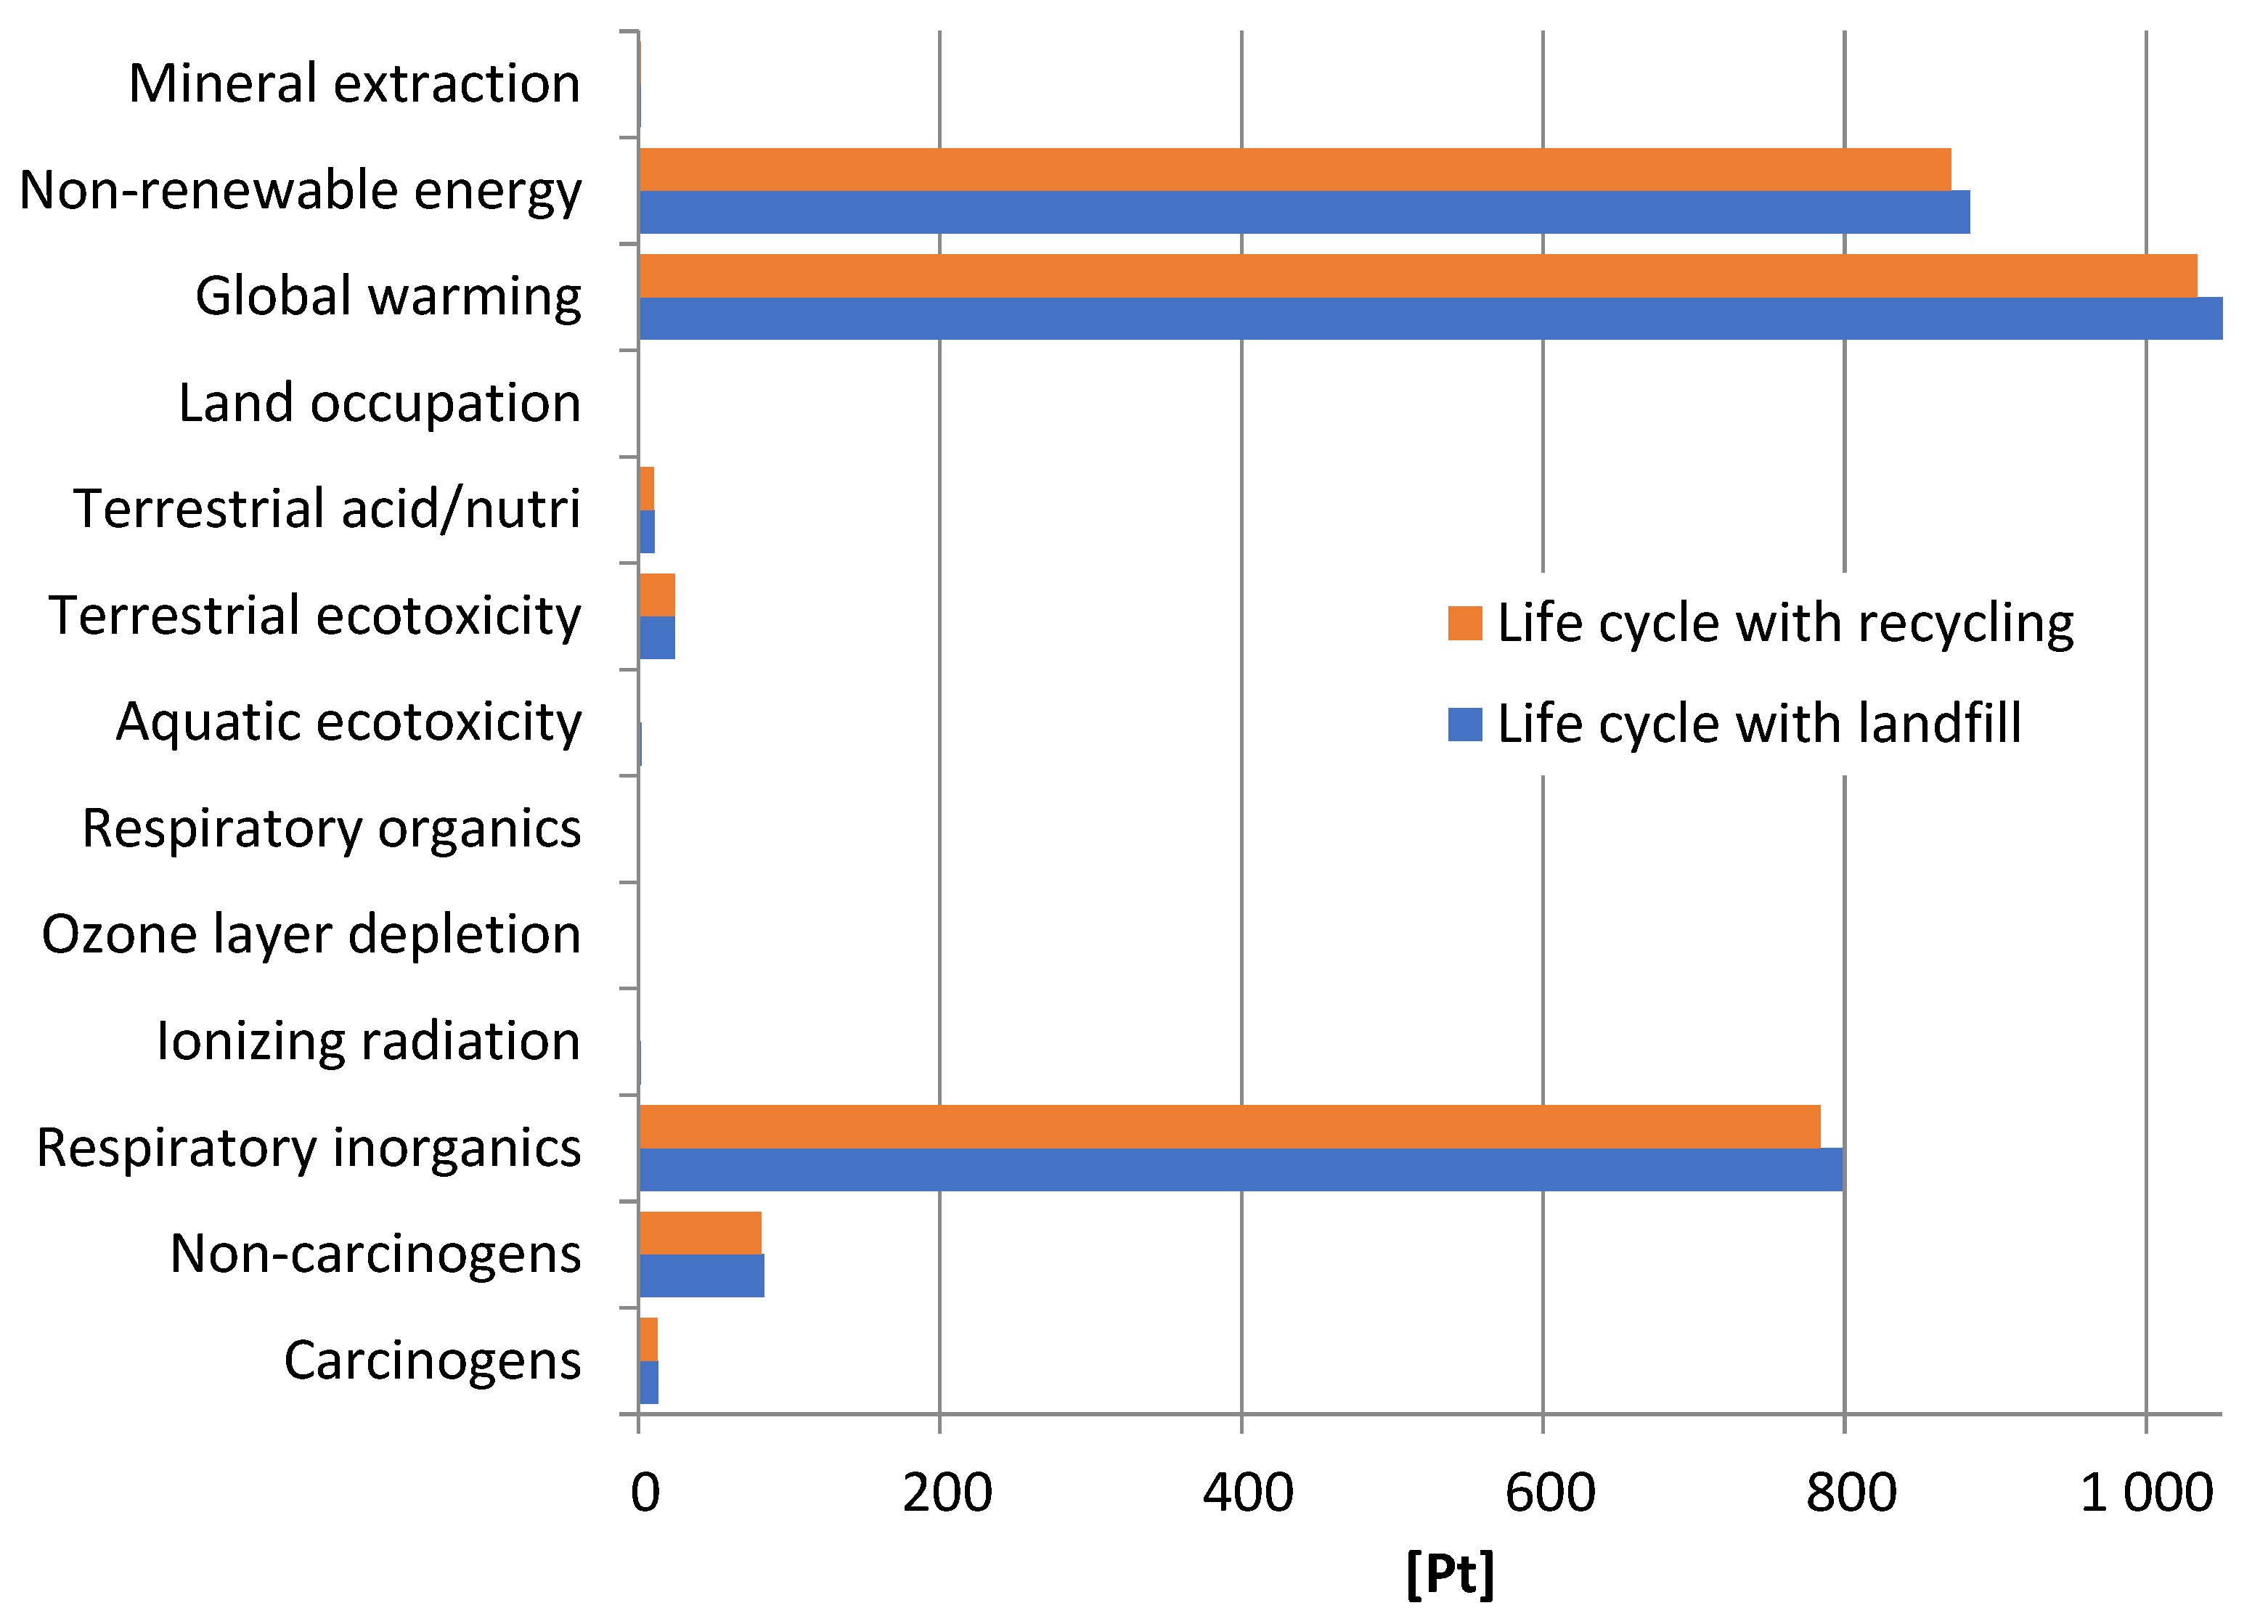
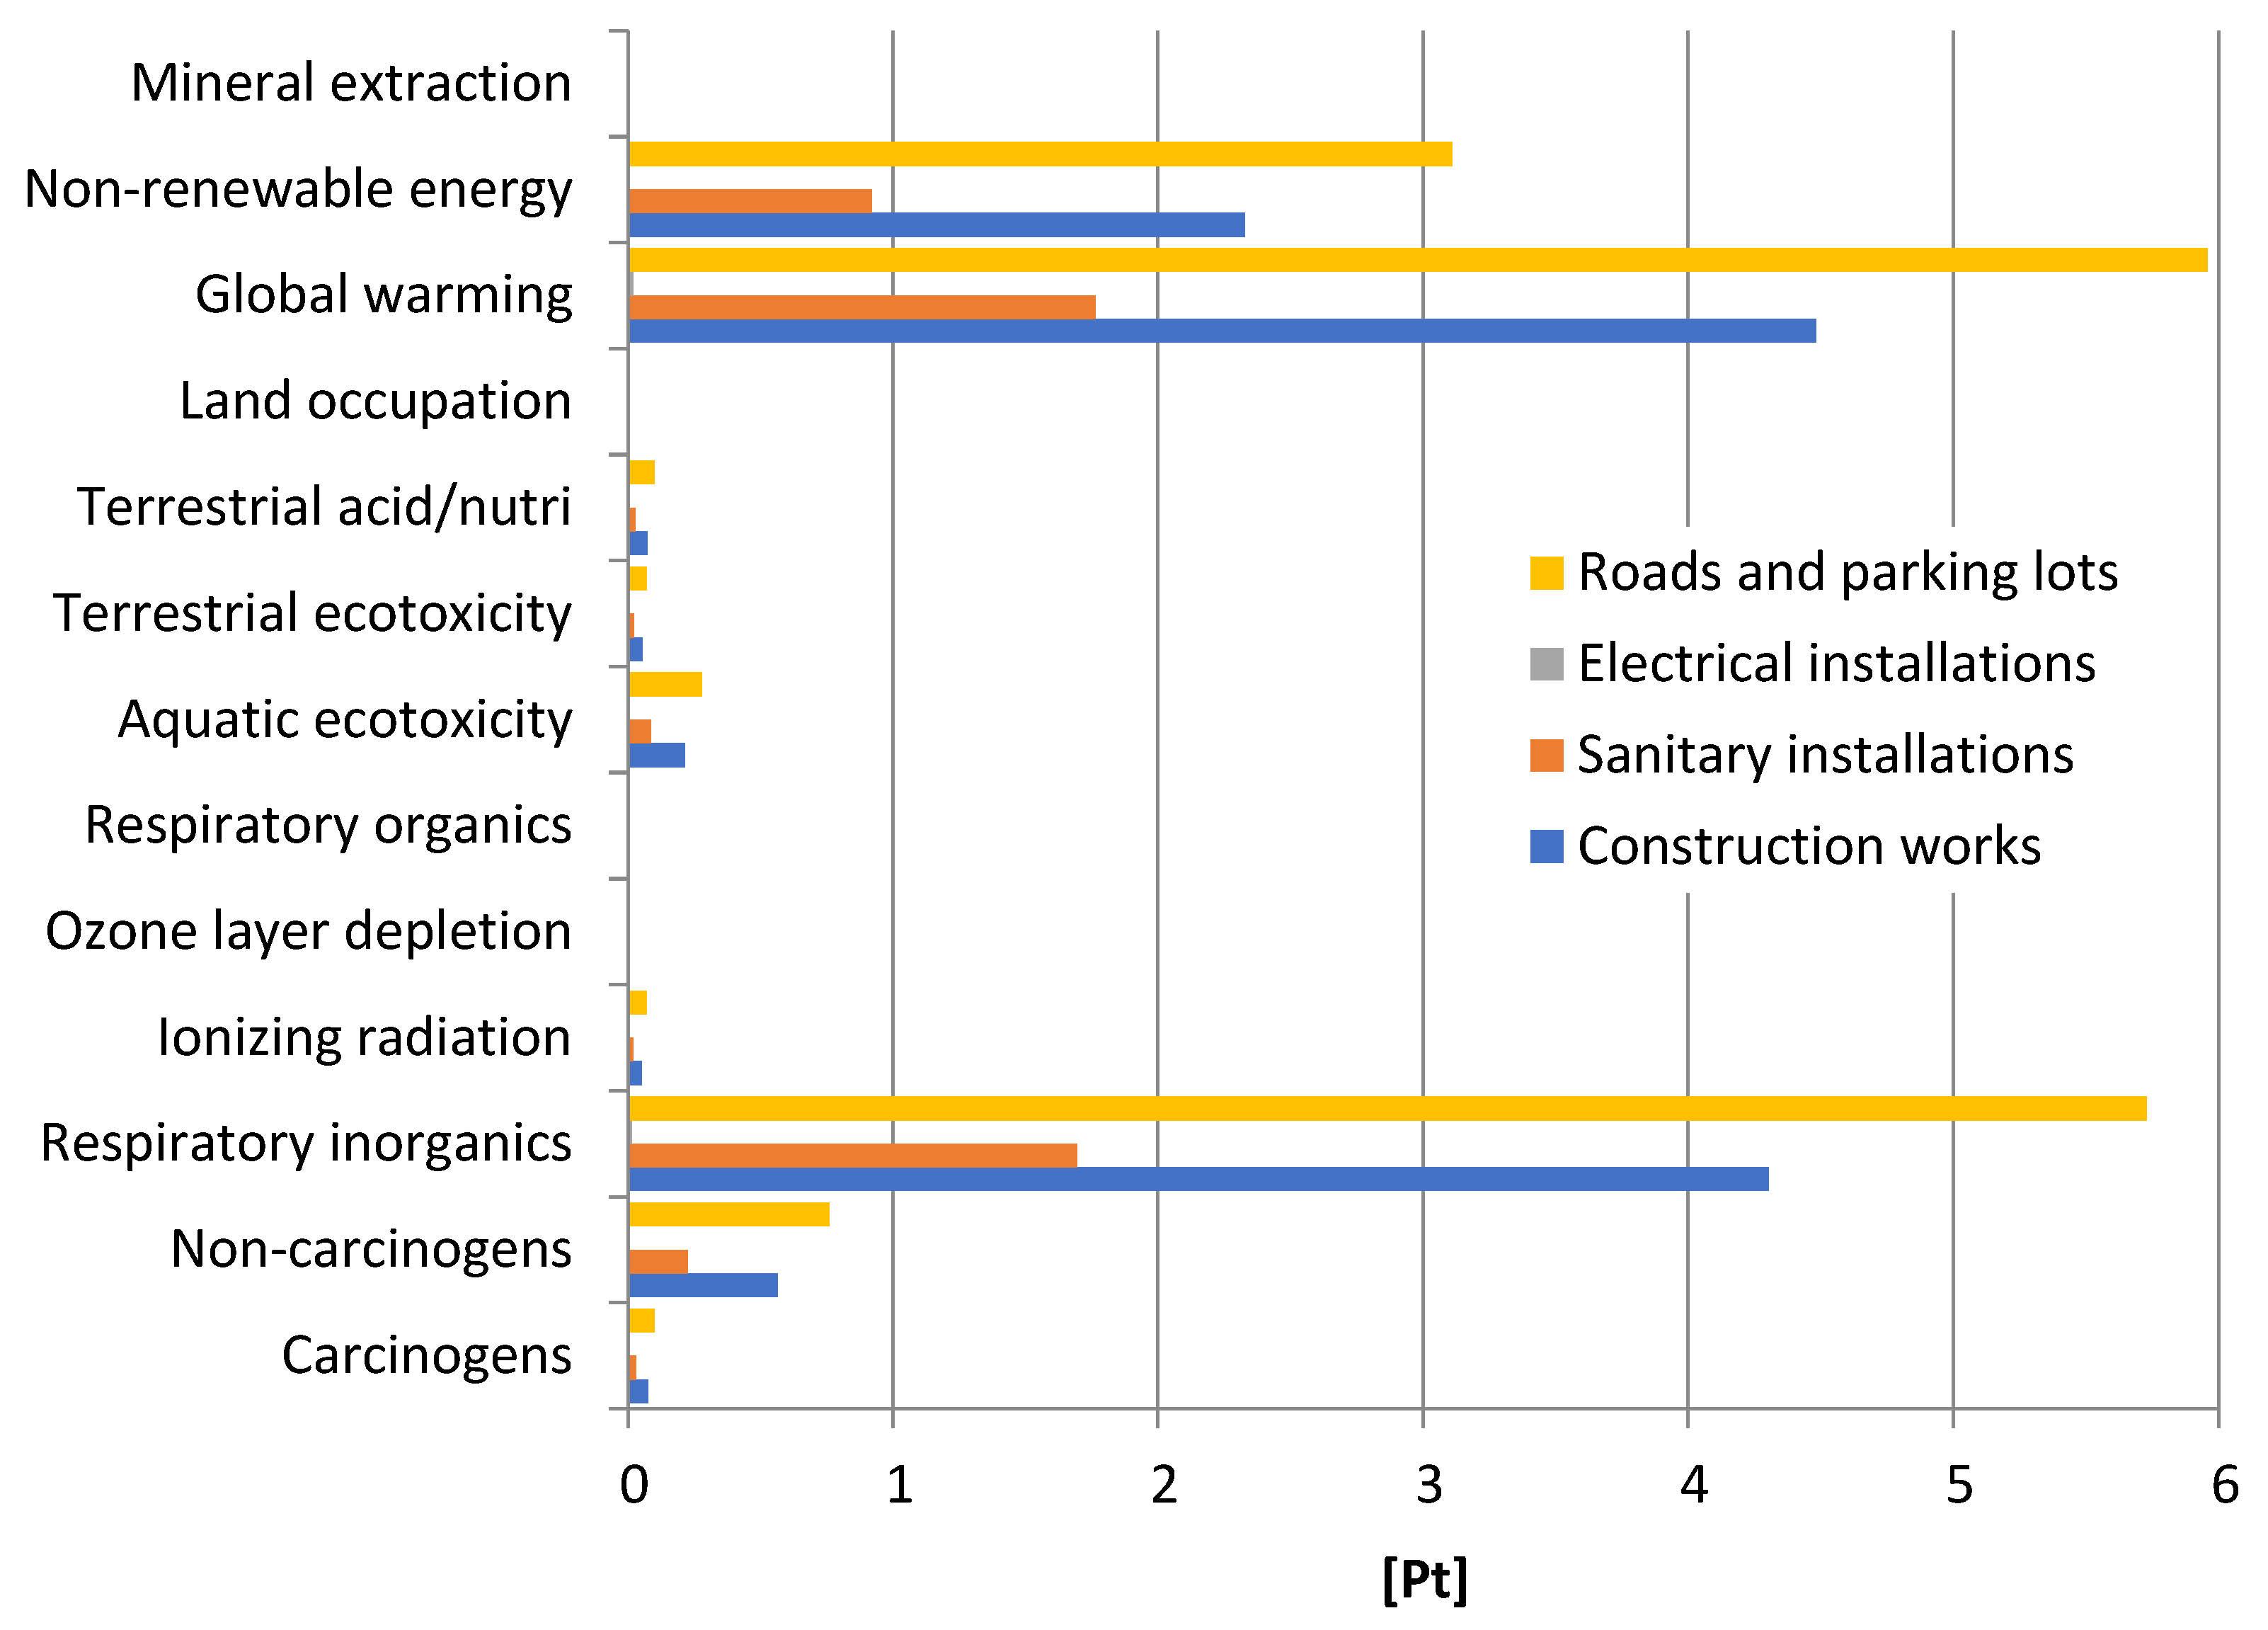
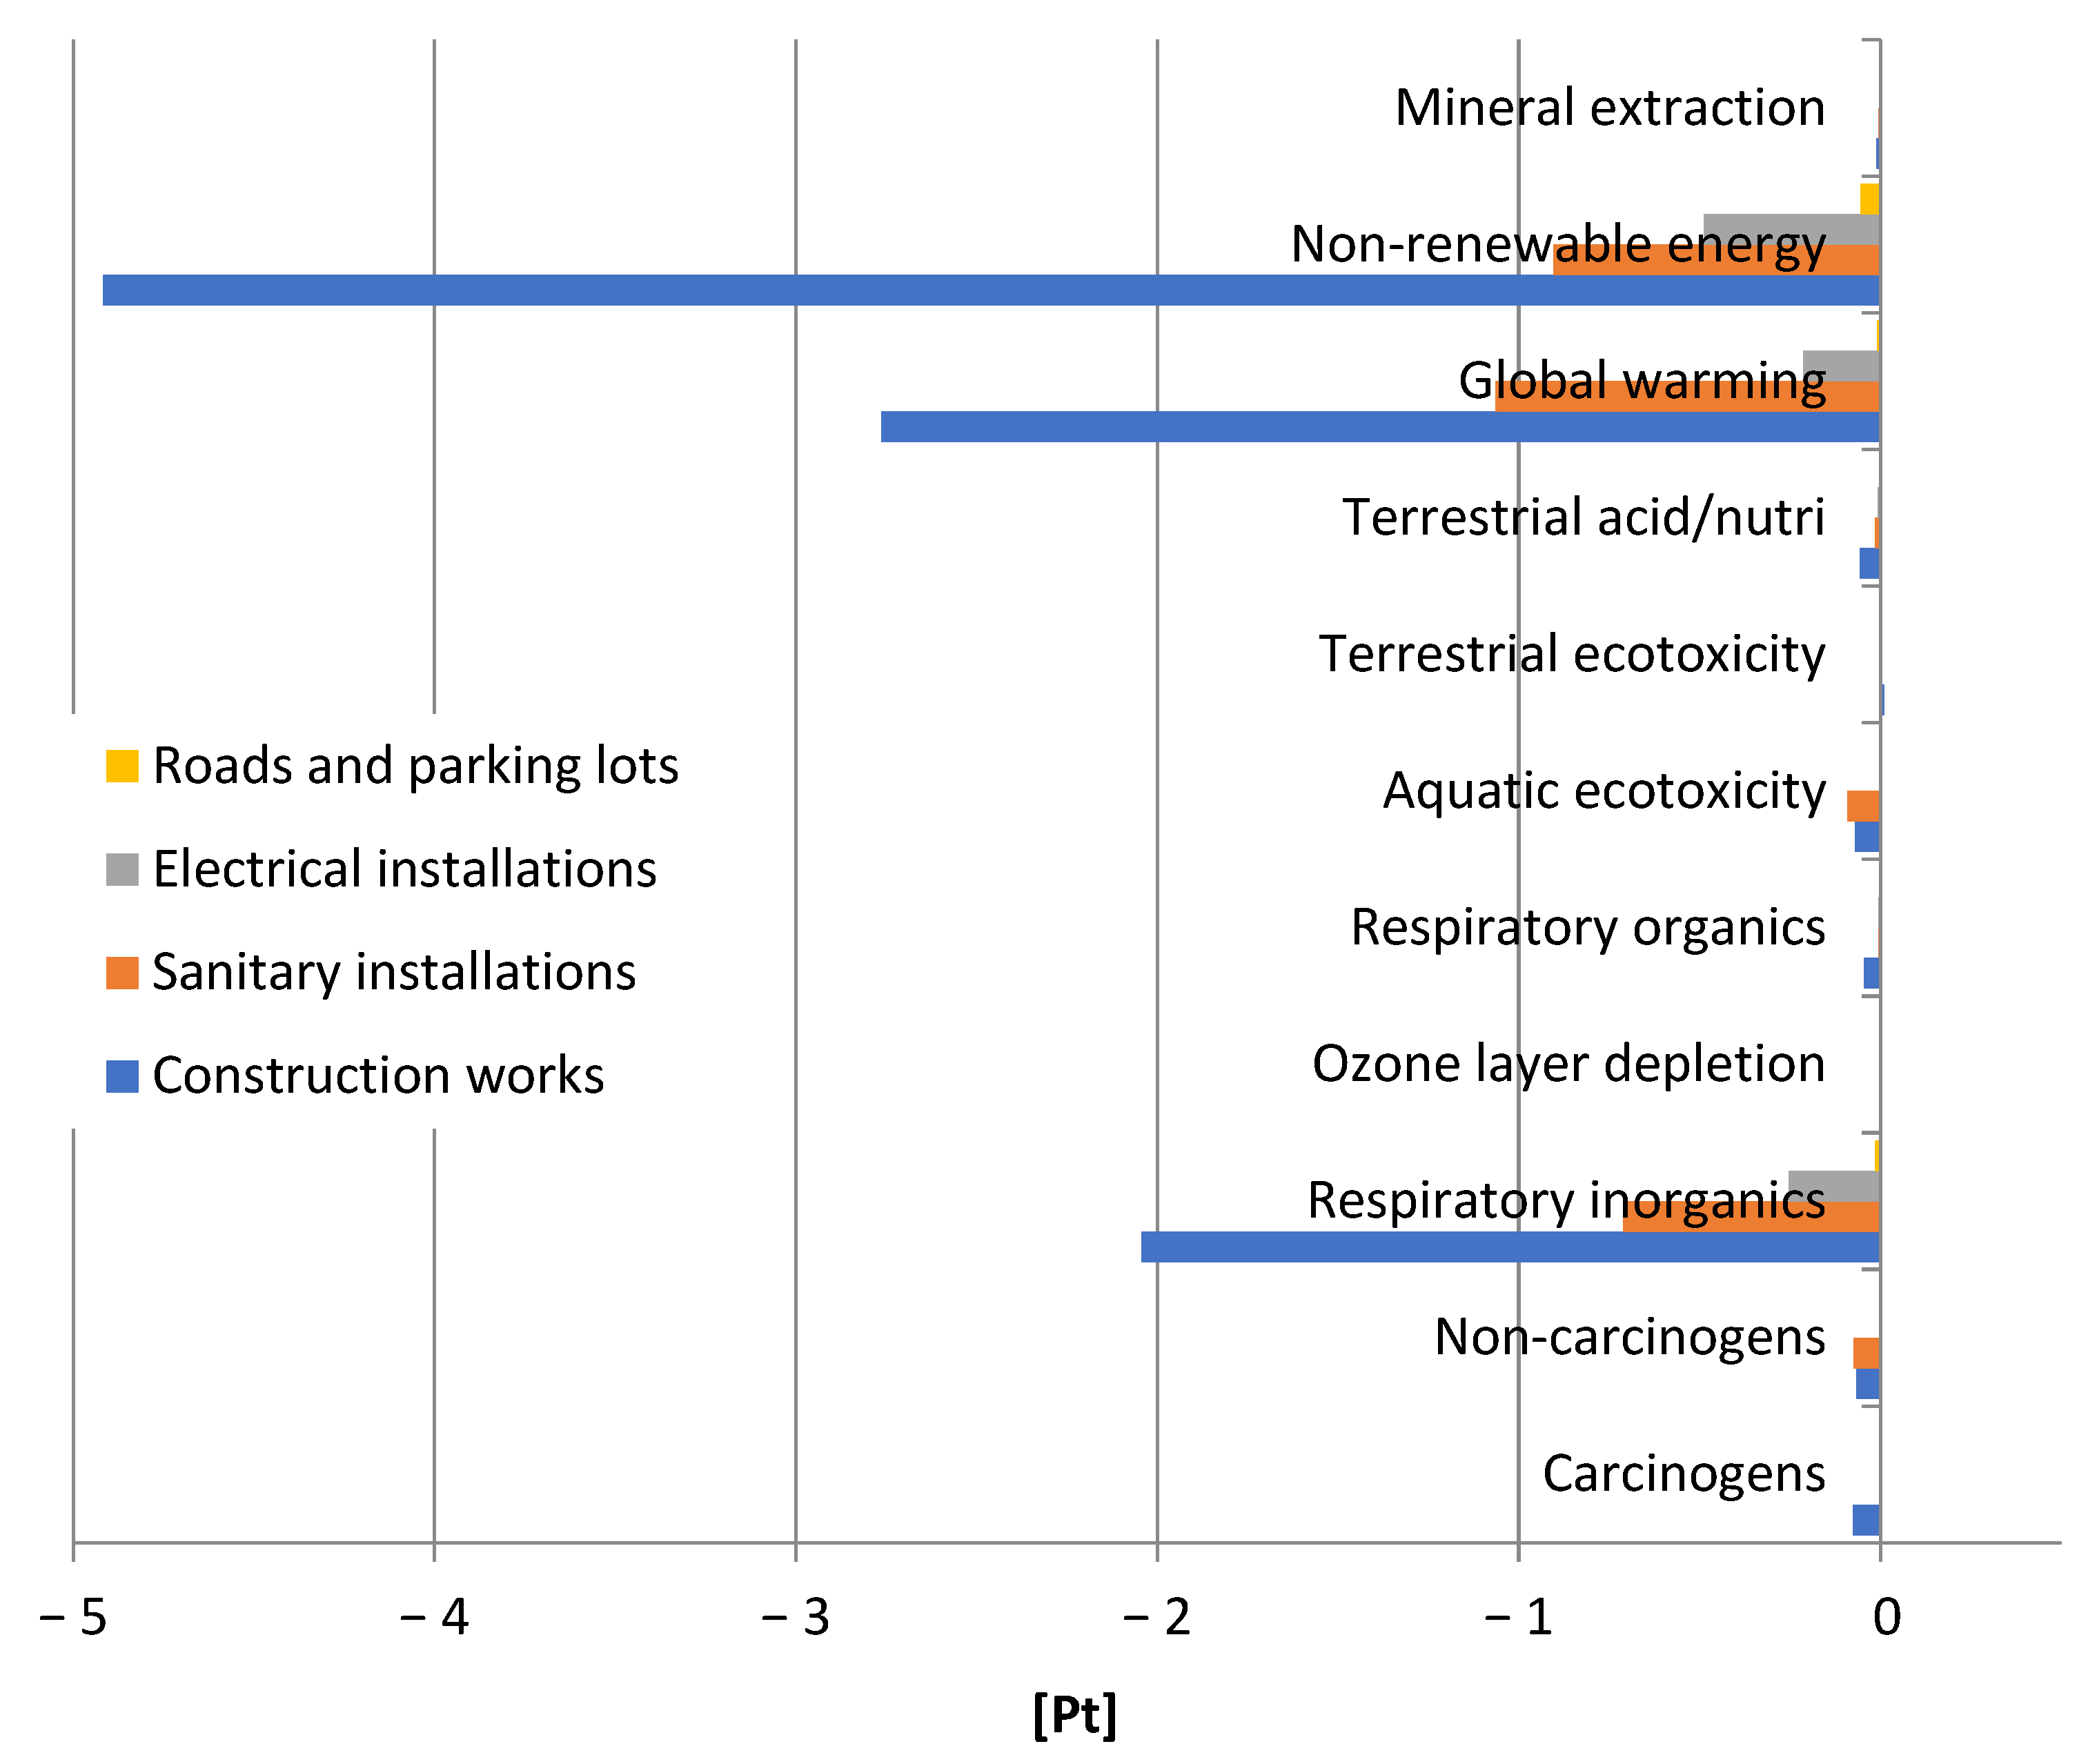
3.2. Grouping and Weighing—Impact Categories

Grouping the results that were obtained by applying the IMPACT 2002+ procedure made it possible to assign impact categories to four collections, known as areas of influence, i.e., human health, ecosystem quality, climate change and resources. The obtained category indicators values were weighed and summed to determine the weight of the ecological effect. Carrying out the weighing process allowed to obtain the results in environmental points (Pt). The life cycle of a commercial and service facility, including the storage of plastics, materials and elements in a landfill, had a total of more negative environmental effects (2.87 × 10³ Pt) compared to the cycle with post-use management in the form of recycling (2.82 × 10³ Pt) (Figure 7) [22].
By analyzing the various stages of the life cycle of the studied object, it is clear that exploitation is the greatest source of harmful effects on the environment. As already mentioned, this is due to the high demand for utilities necessary for the proper functioning of the retail and service building—mainly gas and electricity, which in Poland is produced primarily in processes using conventional, fossil sources. Hence, there are slight differences in the total level of impact on the building surroundings with post-use management in the form of storage and recycling because the operating costs for both cases are comparable (Figure 8).
In each of the analyzed impact categories, the life cycle with post-use management in the form of storage contributed to the emergence of more negative environmental consequences than the cycle with management in which recycling processes were used. Three categories had the strongest negative impact on the environment compared to the others; they were compounds causing global warming (landfill: 1.05 × 10³ Pt, recycling: 1.03 × 10³ Pt), processes related to obtaining non-renewable energy (landfill: 8.83 × 10² Pt, recycling: 8.71 × 10² Pt) and inorganic compounds causing respiratory diseases (landfill: 7.99 × 10² Pt, recycling: 7.84 × 10² Pt). Therefore, it was decided to discuss the category of compounds causing global warming in more detail (Figure 9).
Today, climate change is one of the key environmental problems around the world. It is most often considered in the context of global warming caused by greenhouse gas emissions (GHG). One of the most important factors contributing to the aggravation of this problem is the use of conventional energy sources. For this reason, in the lifecycle of a retail and service facility, the consumption of utilities produced from conventional sources at the stage of exploitation was distinguished by the highest level of emissions of compounds causing global warming (1.01 × 10³ Pt) (Figure 10).
In the case of plastics, materials and components used in construction works, landfilling after exploitation is the source of the highest emission of substances causing global warming (total: 4.48 × 100 Pt). They mainly include the harmful effects of carbon dioxide (2.77 × 100 Pt) and methane (1.55 × 100 Pt). Post-use management in the form of recycling would allow minimizing the negative impacts in this regard, in the perspective of the entire life cycle of the analyzed object (in total by 2.76 × 100 Pt), especially in the case of carbon dioxide emissions (−2.48 × 100 Pt) (Table 8).
In the life cycle of sanitary installations, the manufacturing stage causes the most emissions of compounds contributing to the aggravation of the global warming problem (total: 5.53 × 100 Pt). The level of negative environmental consequences in this area is mainly influenced by the influence of carbon dioxide (in total: 5.29 × 100 Pt). Recycling plastics, materials and components after completing their exploitation would significantly reduce the degree of total harmful impacts (by 1.06 × 100 Pt), especially in the context of CO2 emissions (−9.29 × 10⁻¹ Pt) (Table 9).
As in the case of sanitary installations, the production of electrical installations is associated with the greatest number of negative environmental consequences throughout their life cycle (total: 4.48 × 100 Pt), and carbon dioxide emissions (total: 4.40 × 100 Pt) are of key importance for their size. Recycling processes would make it possible to reduce the level of harmful impact in the considered range (by 2.14 × 10⁻¹ Pt in total), especially in relation to CO2 (−2.05 × 10⁻¹ Pt) (Table 10).
In the roads and parking lots cycle, the manufacturing and storage stages are characterized by the highest degree of harmful impact on the environment in terms of the emission of compounds causing global warming (respectively, 8.89 × 100 Pt and 5.96 × 100 Pt). In both cases, these values are mainly conditioned by the emission level of carbon dioxide (manufacture: 9.02 × 100 Pt, landfill: 3.68 × 100 Pt). In addition, landfilling of plastics, materials and end-of-life elements is also distinguished by significant methane emissions (2.07 × 100 Pt). Carbon dioxide plays an important role in the greenhouse effect. Its concentration varies seasonally and depending on latitude. Changes can also be noted locally, especially near the Earth’s surface. Methane is also an important greenhouse factor. It is true that it is present in the atmosphere at a much lower concentration than CO2, but its greenhouse potential is almost 20 times greater (Table 11) [33].
By analyzing the individual stages of the life cycle by the dividing into the types of installations of the retail and service building under study, it is visible that during the manufacture of plastics, materials and elements of this object, the highest level of harmful impact on the environment was noted for the emission of inorganic compounds causing respiratory diseases, substances that deepen global warming and processes related to obtaining non-renewable energy. The magnitude of the impact of the first of these categories was determined mainly by the impact of electrical installations largely related to the use of copper elements, the second, roads and parking lots, and the third, construction works, where the greatest demand for material takes place (Figure 11).
The level of negative environmental consequences at the exploitation stage is essentially shaped by the amount of utility consumption in the life cycle of a retail and service building. Processes related to the extraction of fossil fuels and their processing generate many harmful emissions, mainly compounds causing global warming, inorganic substances causing respiratory diseases and those characteristic of processes related to obtaining non-renewable energy. As part of the ecological and energy optimization of buildings, particular attention should be paid to the issue of supplying them with heat and electricity, which should come from alternative sources as much as possible (Figure 12).
Similarly, to the manufacturing stage, during post-use disposal in the form of landfill storage, the most negative environmental consequences are caused by high emissions of inorganic compounds causing respiratory diseases, greenhouse gases and the impact of processes related to obtaining non-renewable energy. In all of the above-mentioned areas, the storage of plastics, materials and elements, which cannot be operated any longer from installations with the highest material consumption, i.e., construction works and roads and parking lots, had the maximum impact on the magnitude of the harmful effect (Figure 13).
Recycling is a form of post-use management of retail and service buildings, which can bring many positive consequences for the environment, including limiting the production of plastics, materials and components from primary raw materials. The use of secondary raw materials, mainly in the area of basic construction works, results in a reduction in the demand for energy, which currently comes mainly from non-renewable sources, and thus, a reduction in emissions of compounds that contribute to the deepening of the greenhouse effect and substances that are the cause of many respiratory diseases (Figure 14).
For all types of installations located in the commercial and service facility in question, the manufacturing stage of plastics, materials and elements was associated with a particularly high level of destructive impacts on the environment, reaching the maximum for construction works due to high material consumption and electrical installations due to the use of large quantities of components made of copper. The second very important factor in this regard was the form of post-use management. Landfilling causes many negative environmental consequences, especially for installations with the highest material demand, such as roads and parking lots and construction works (Figure 15).

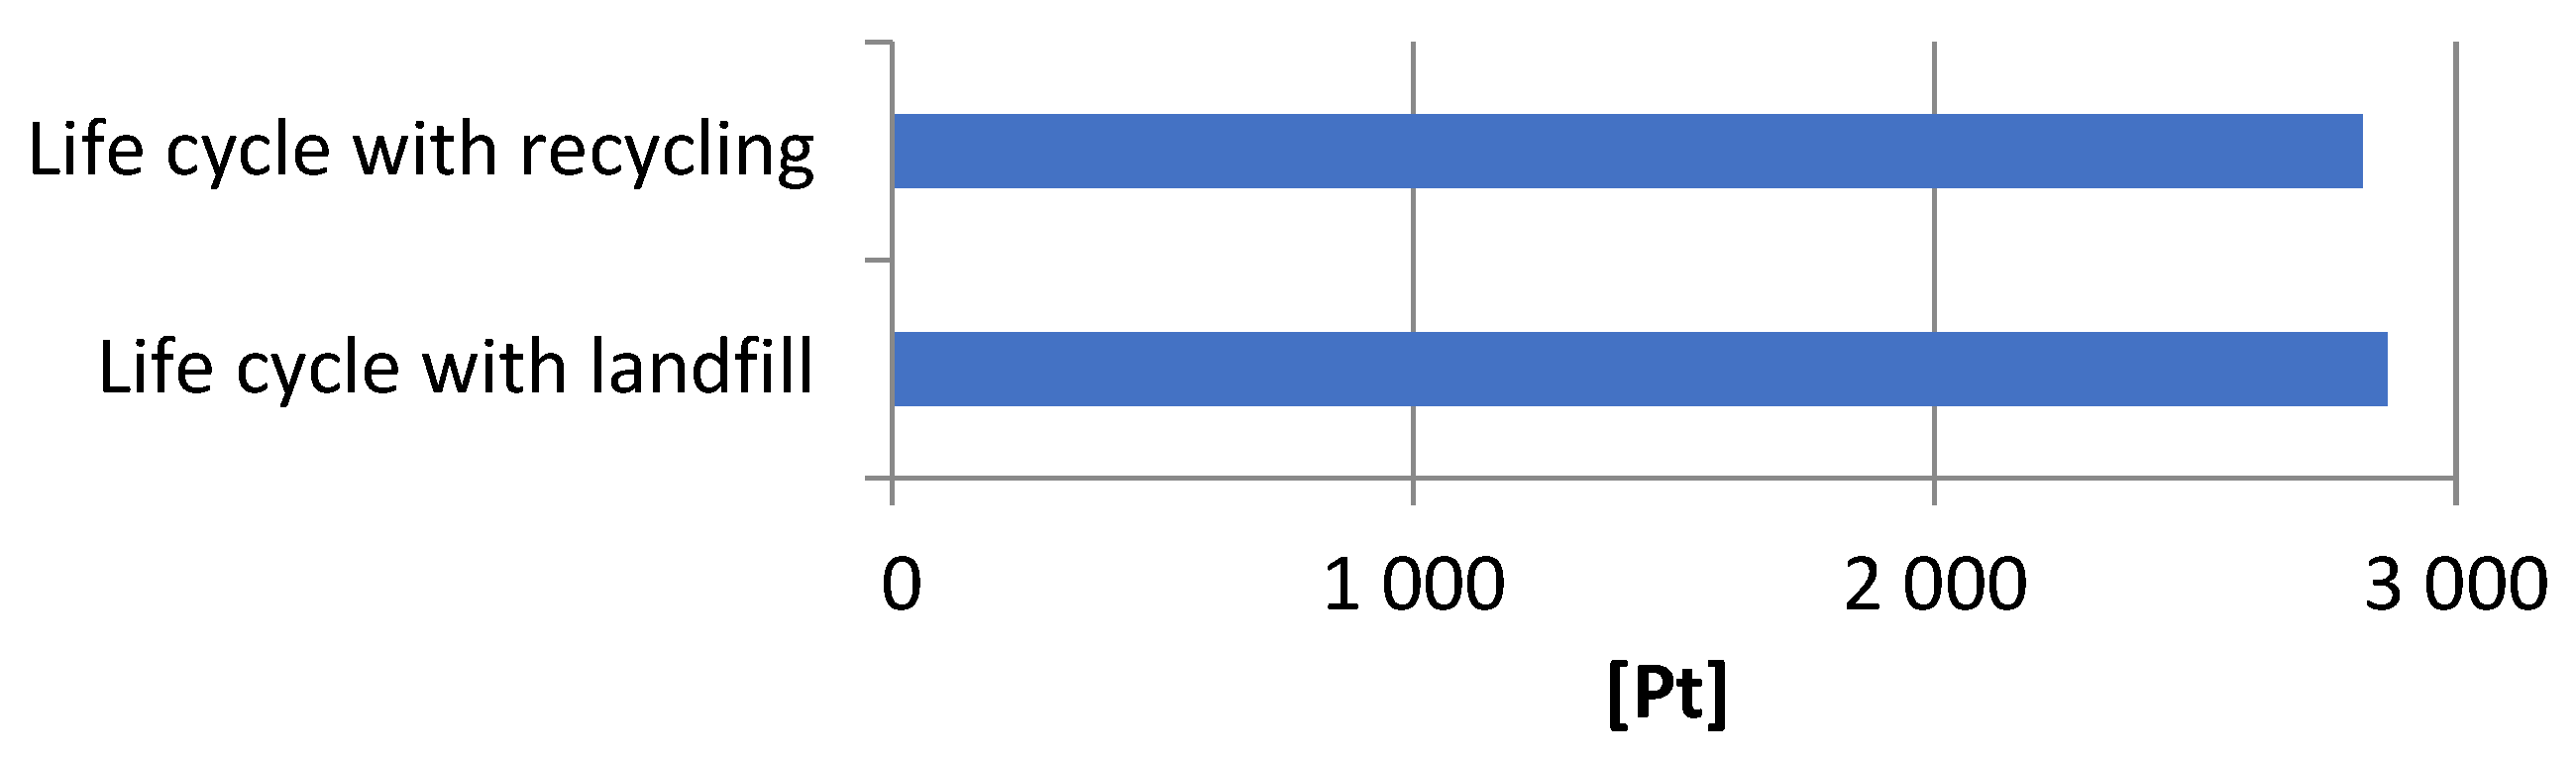
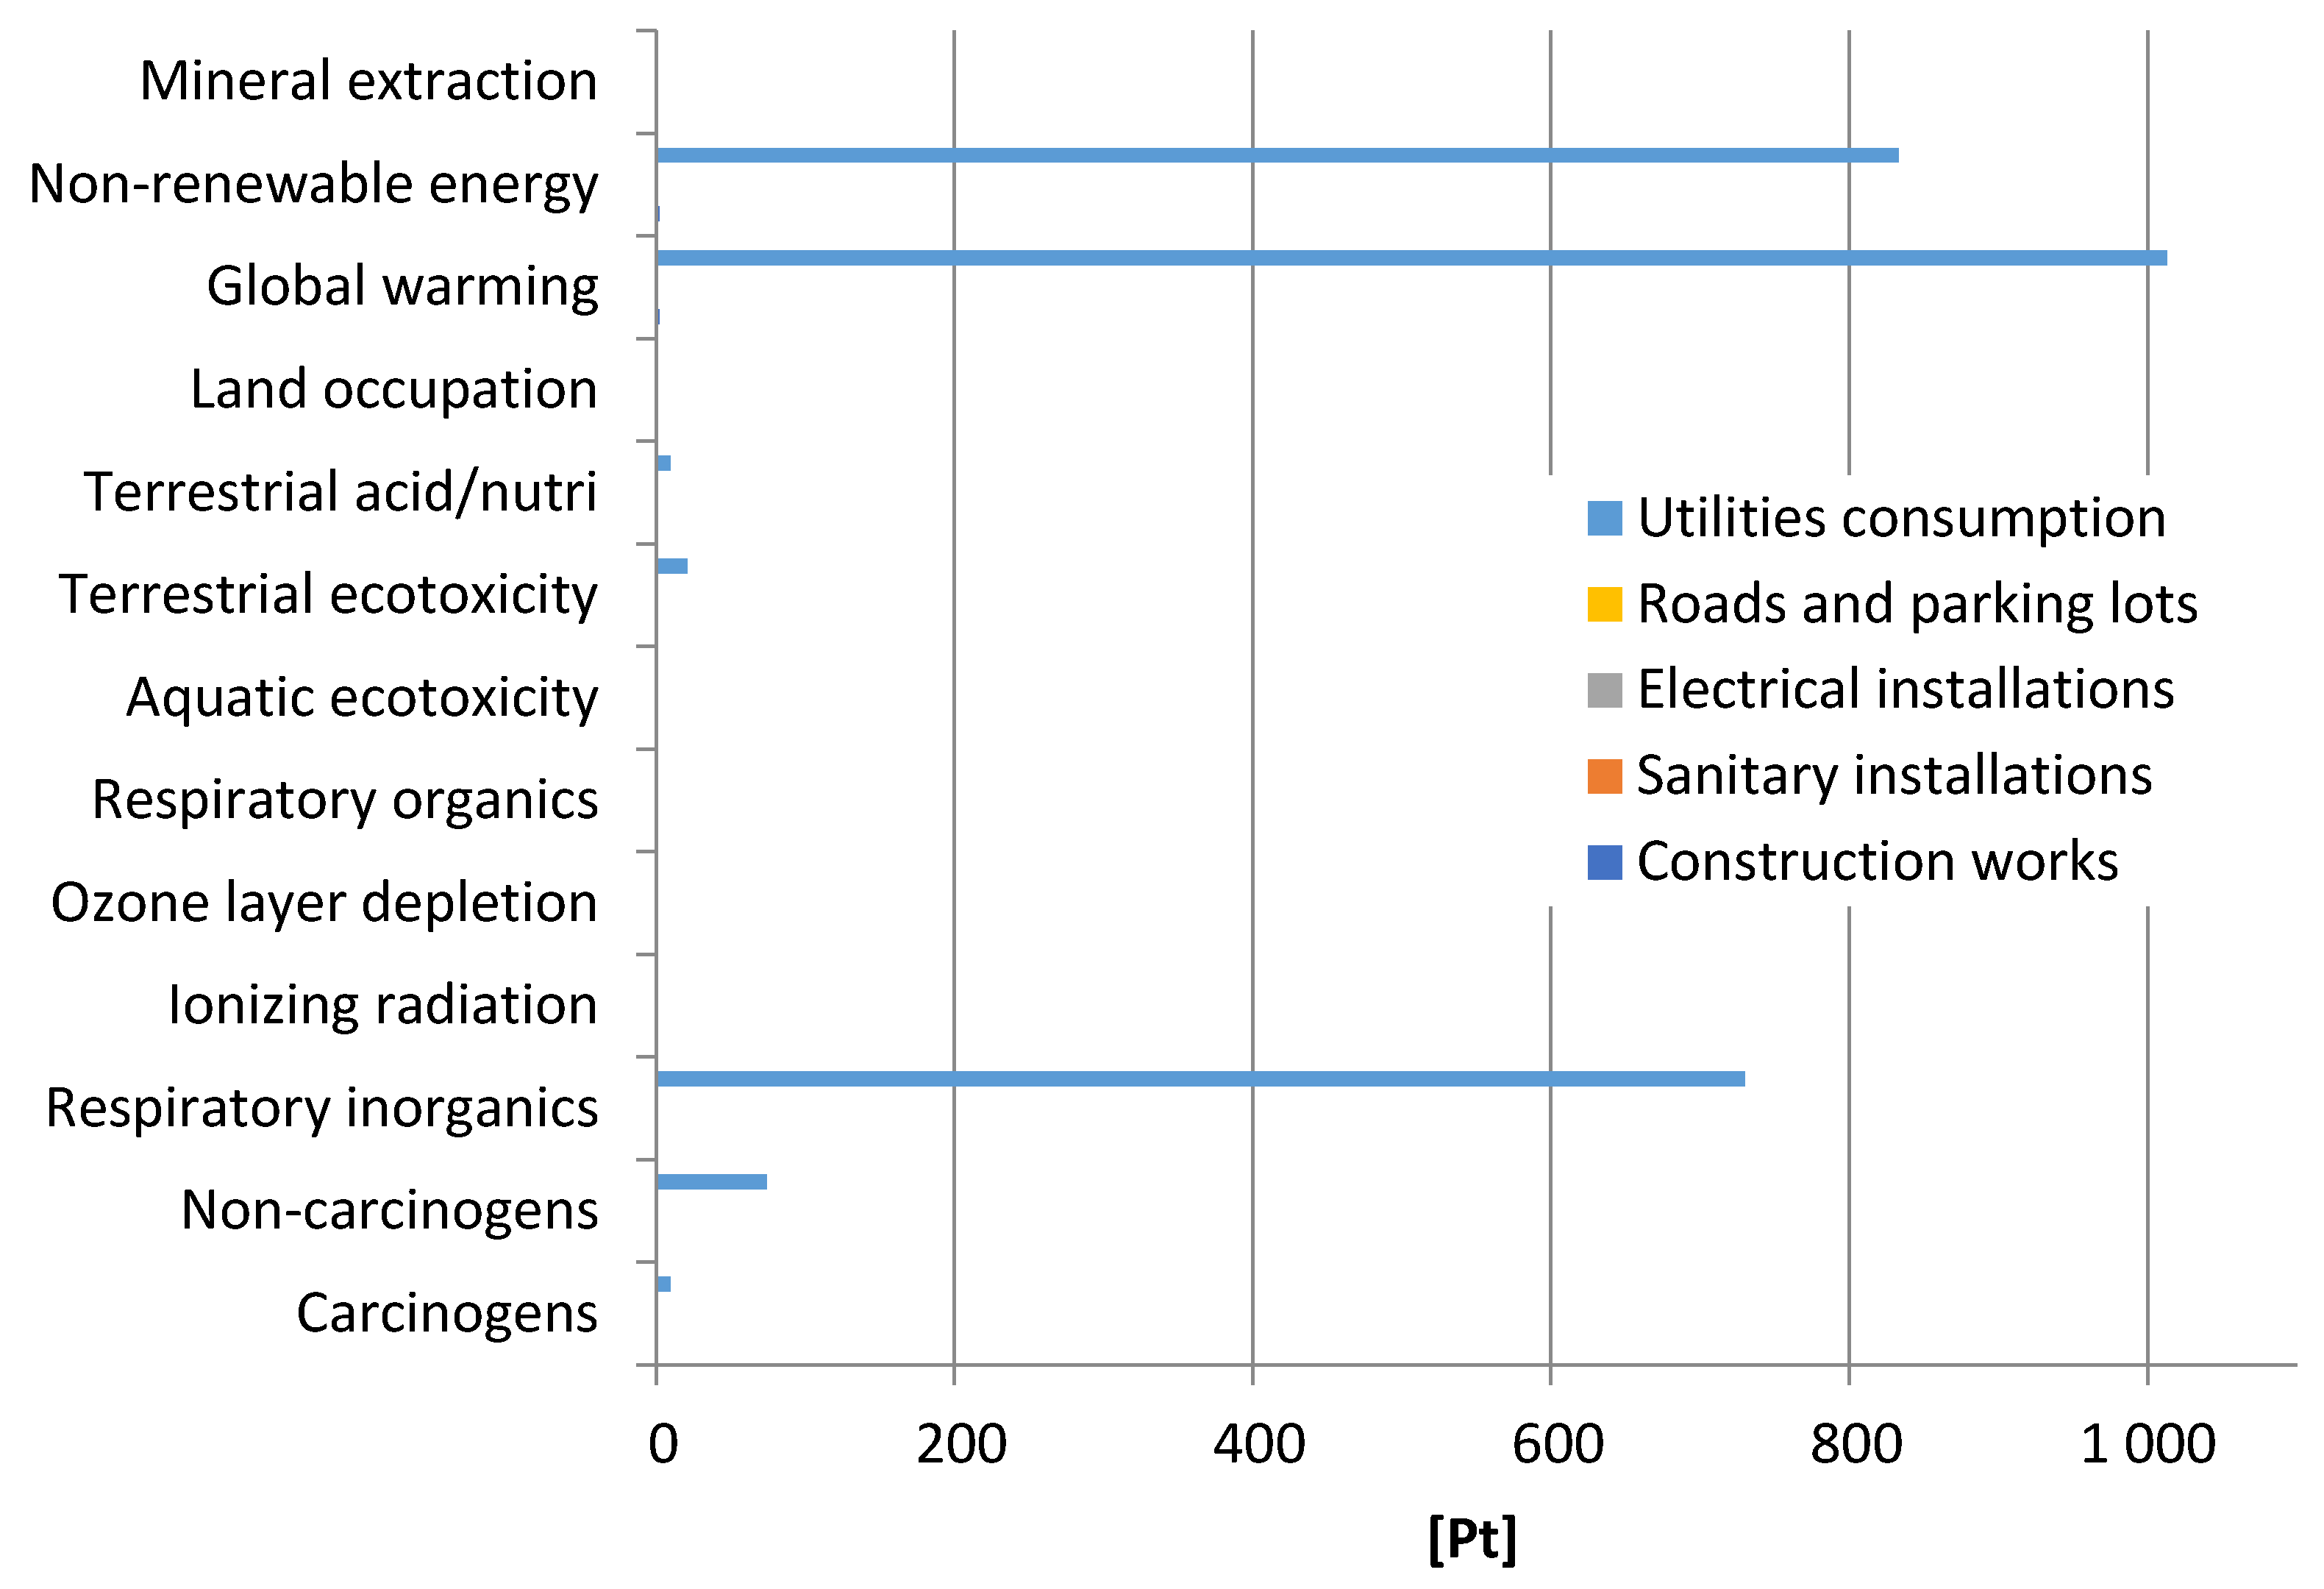
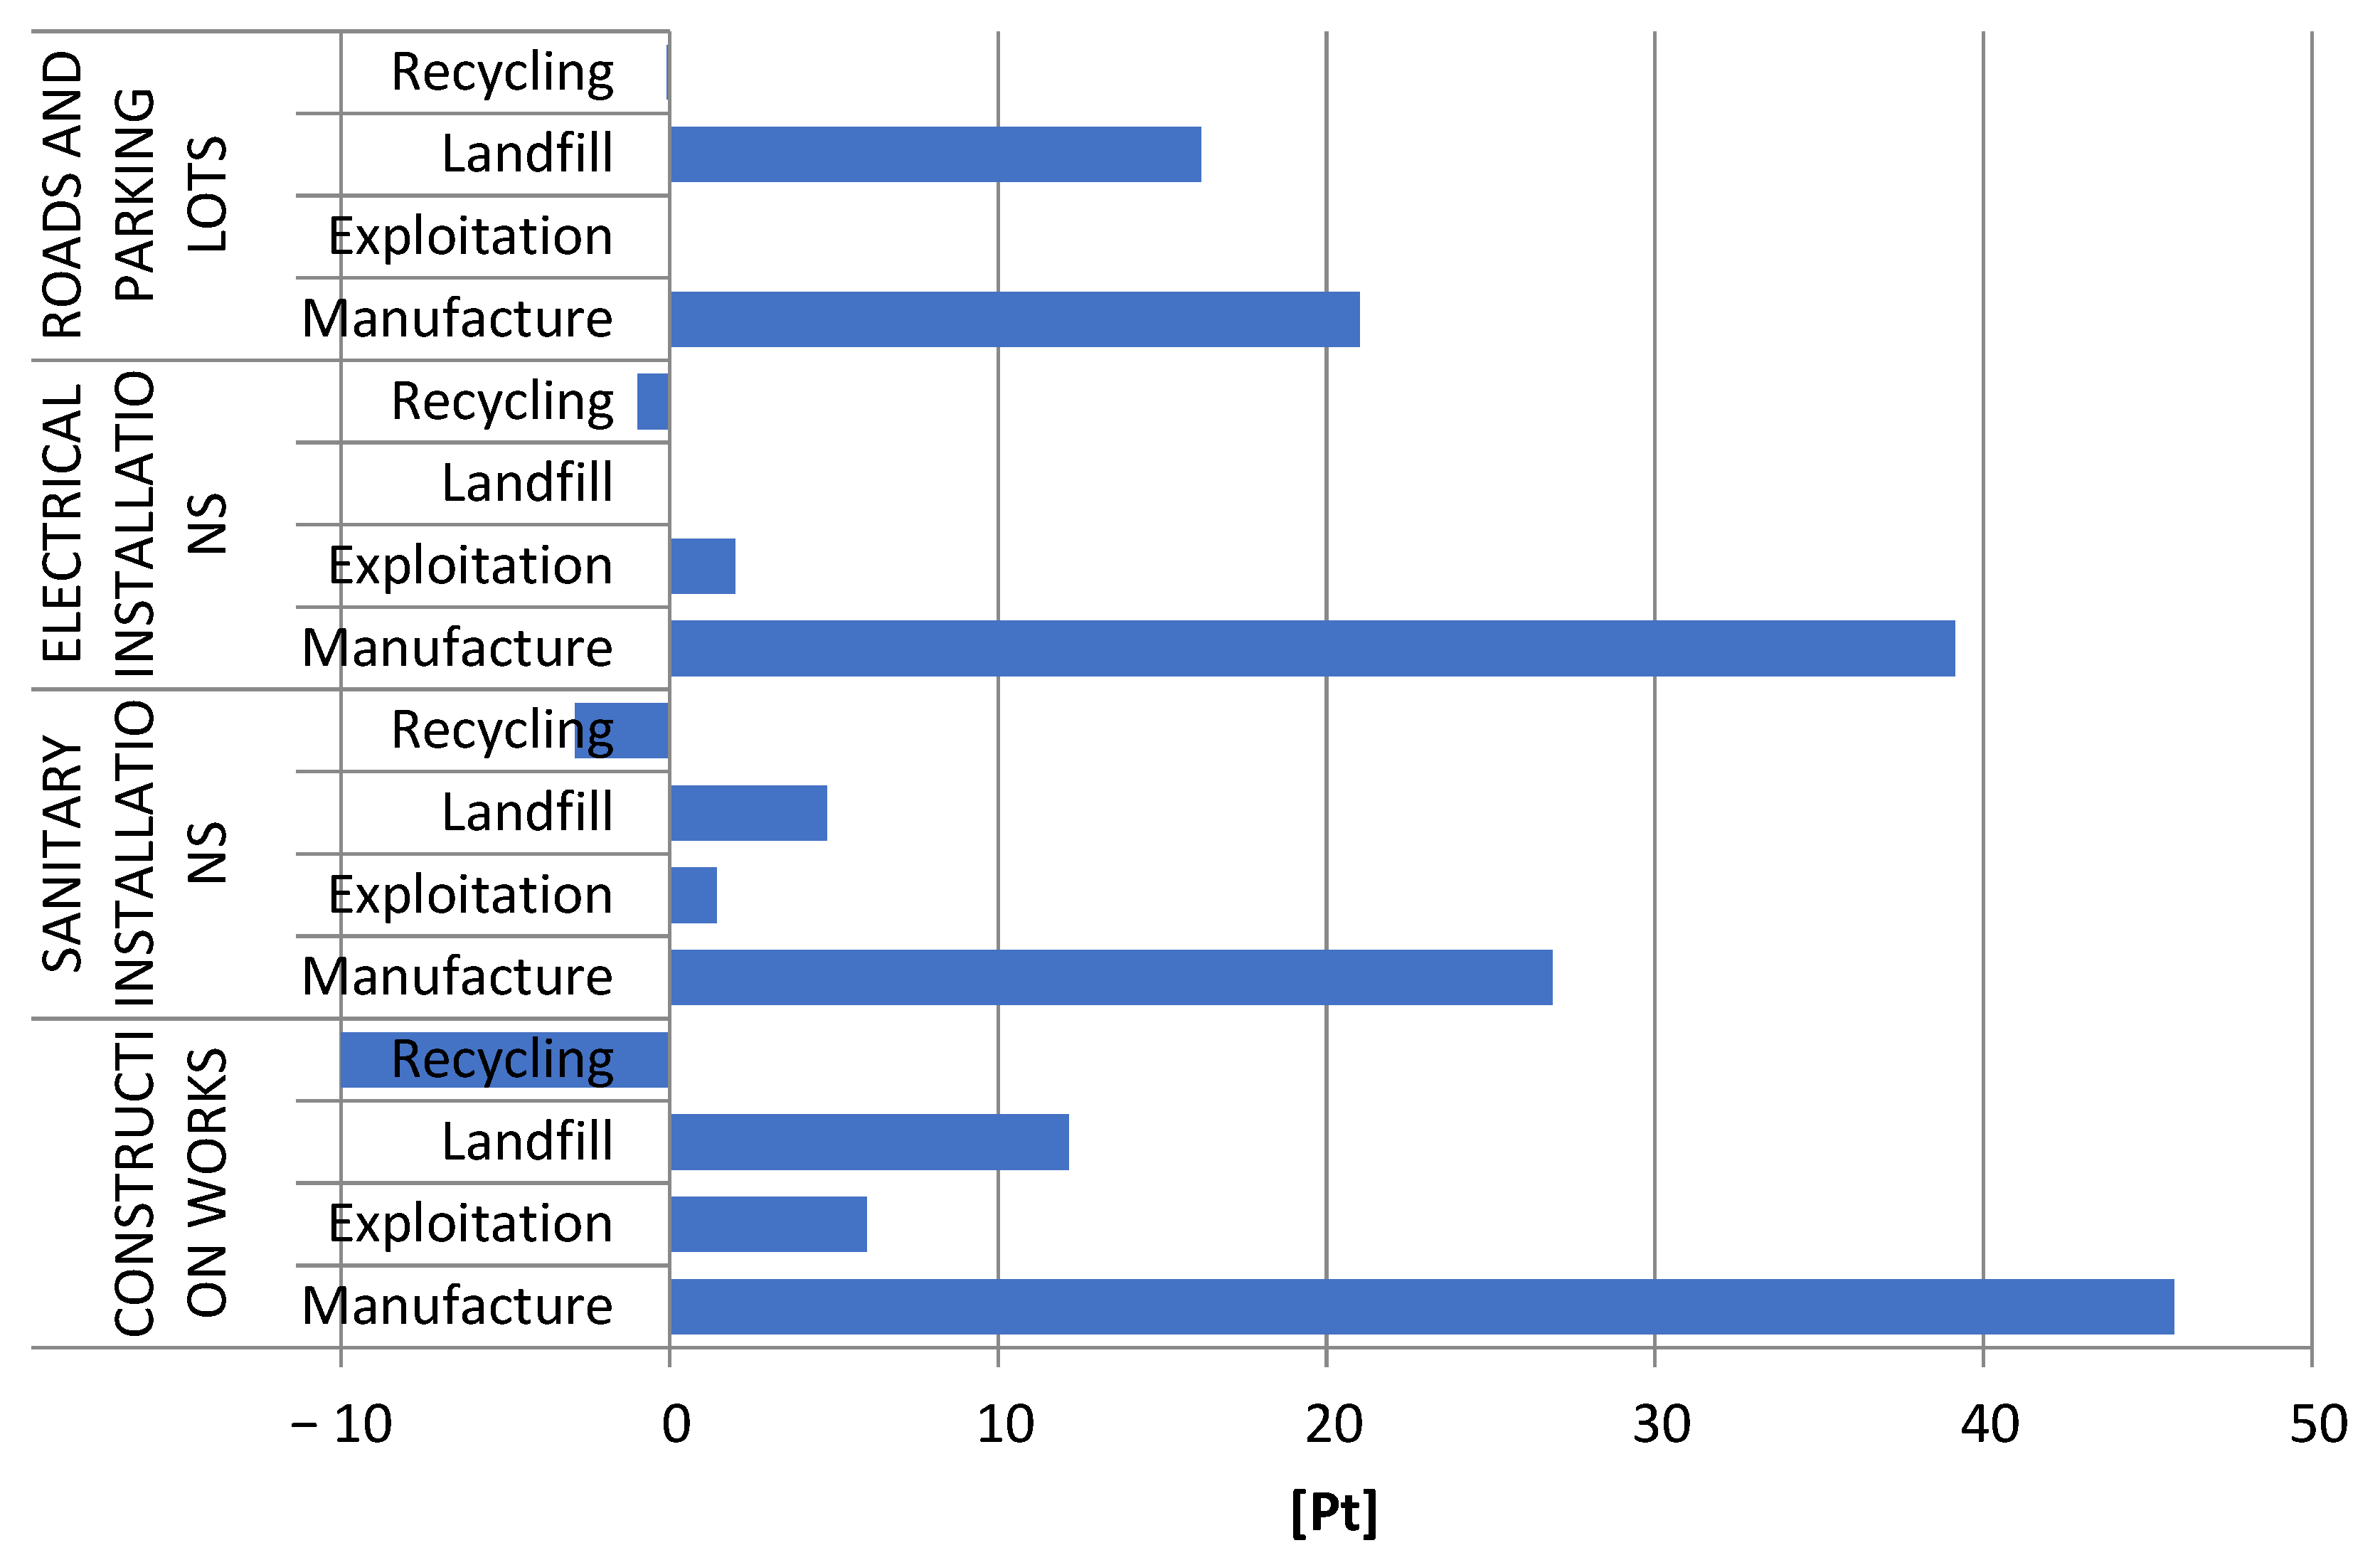
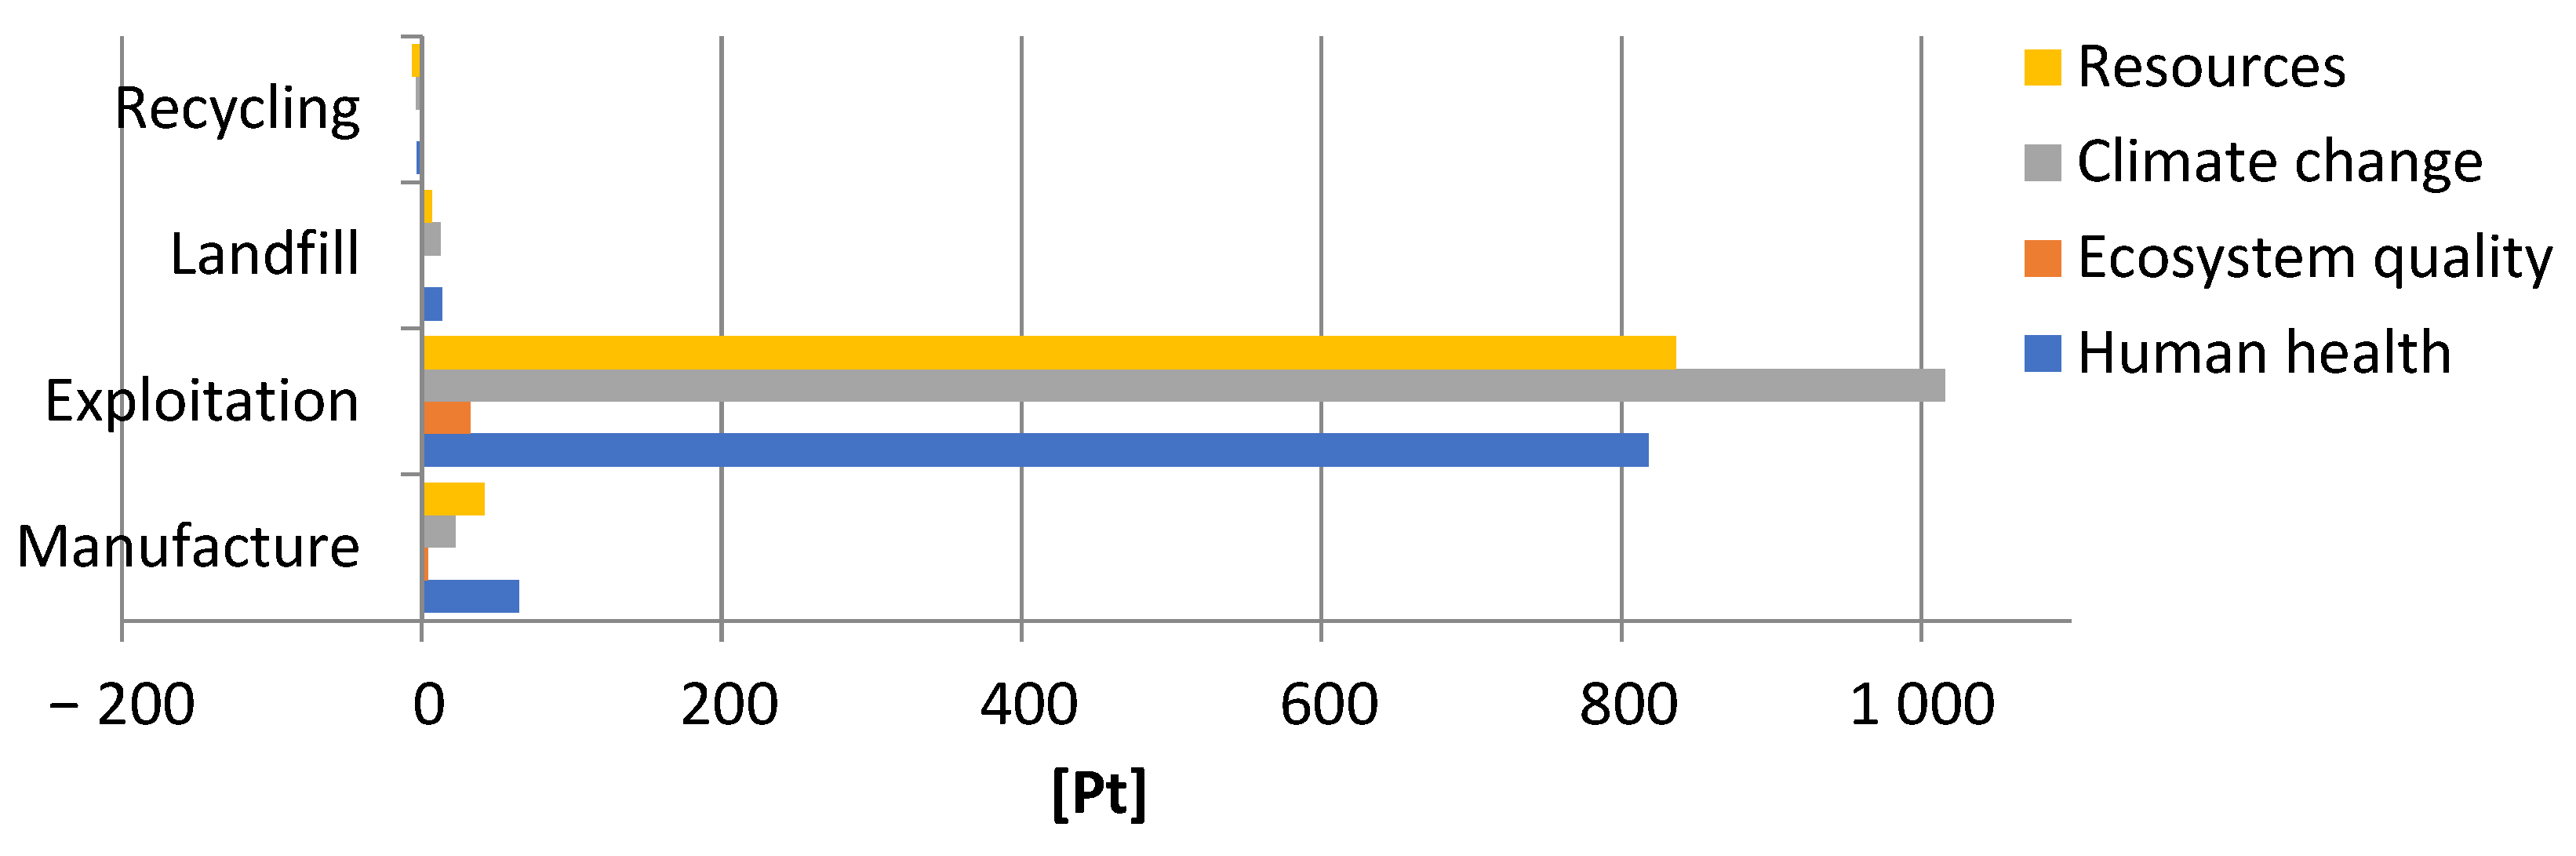
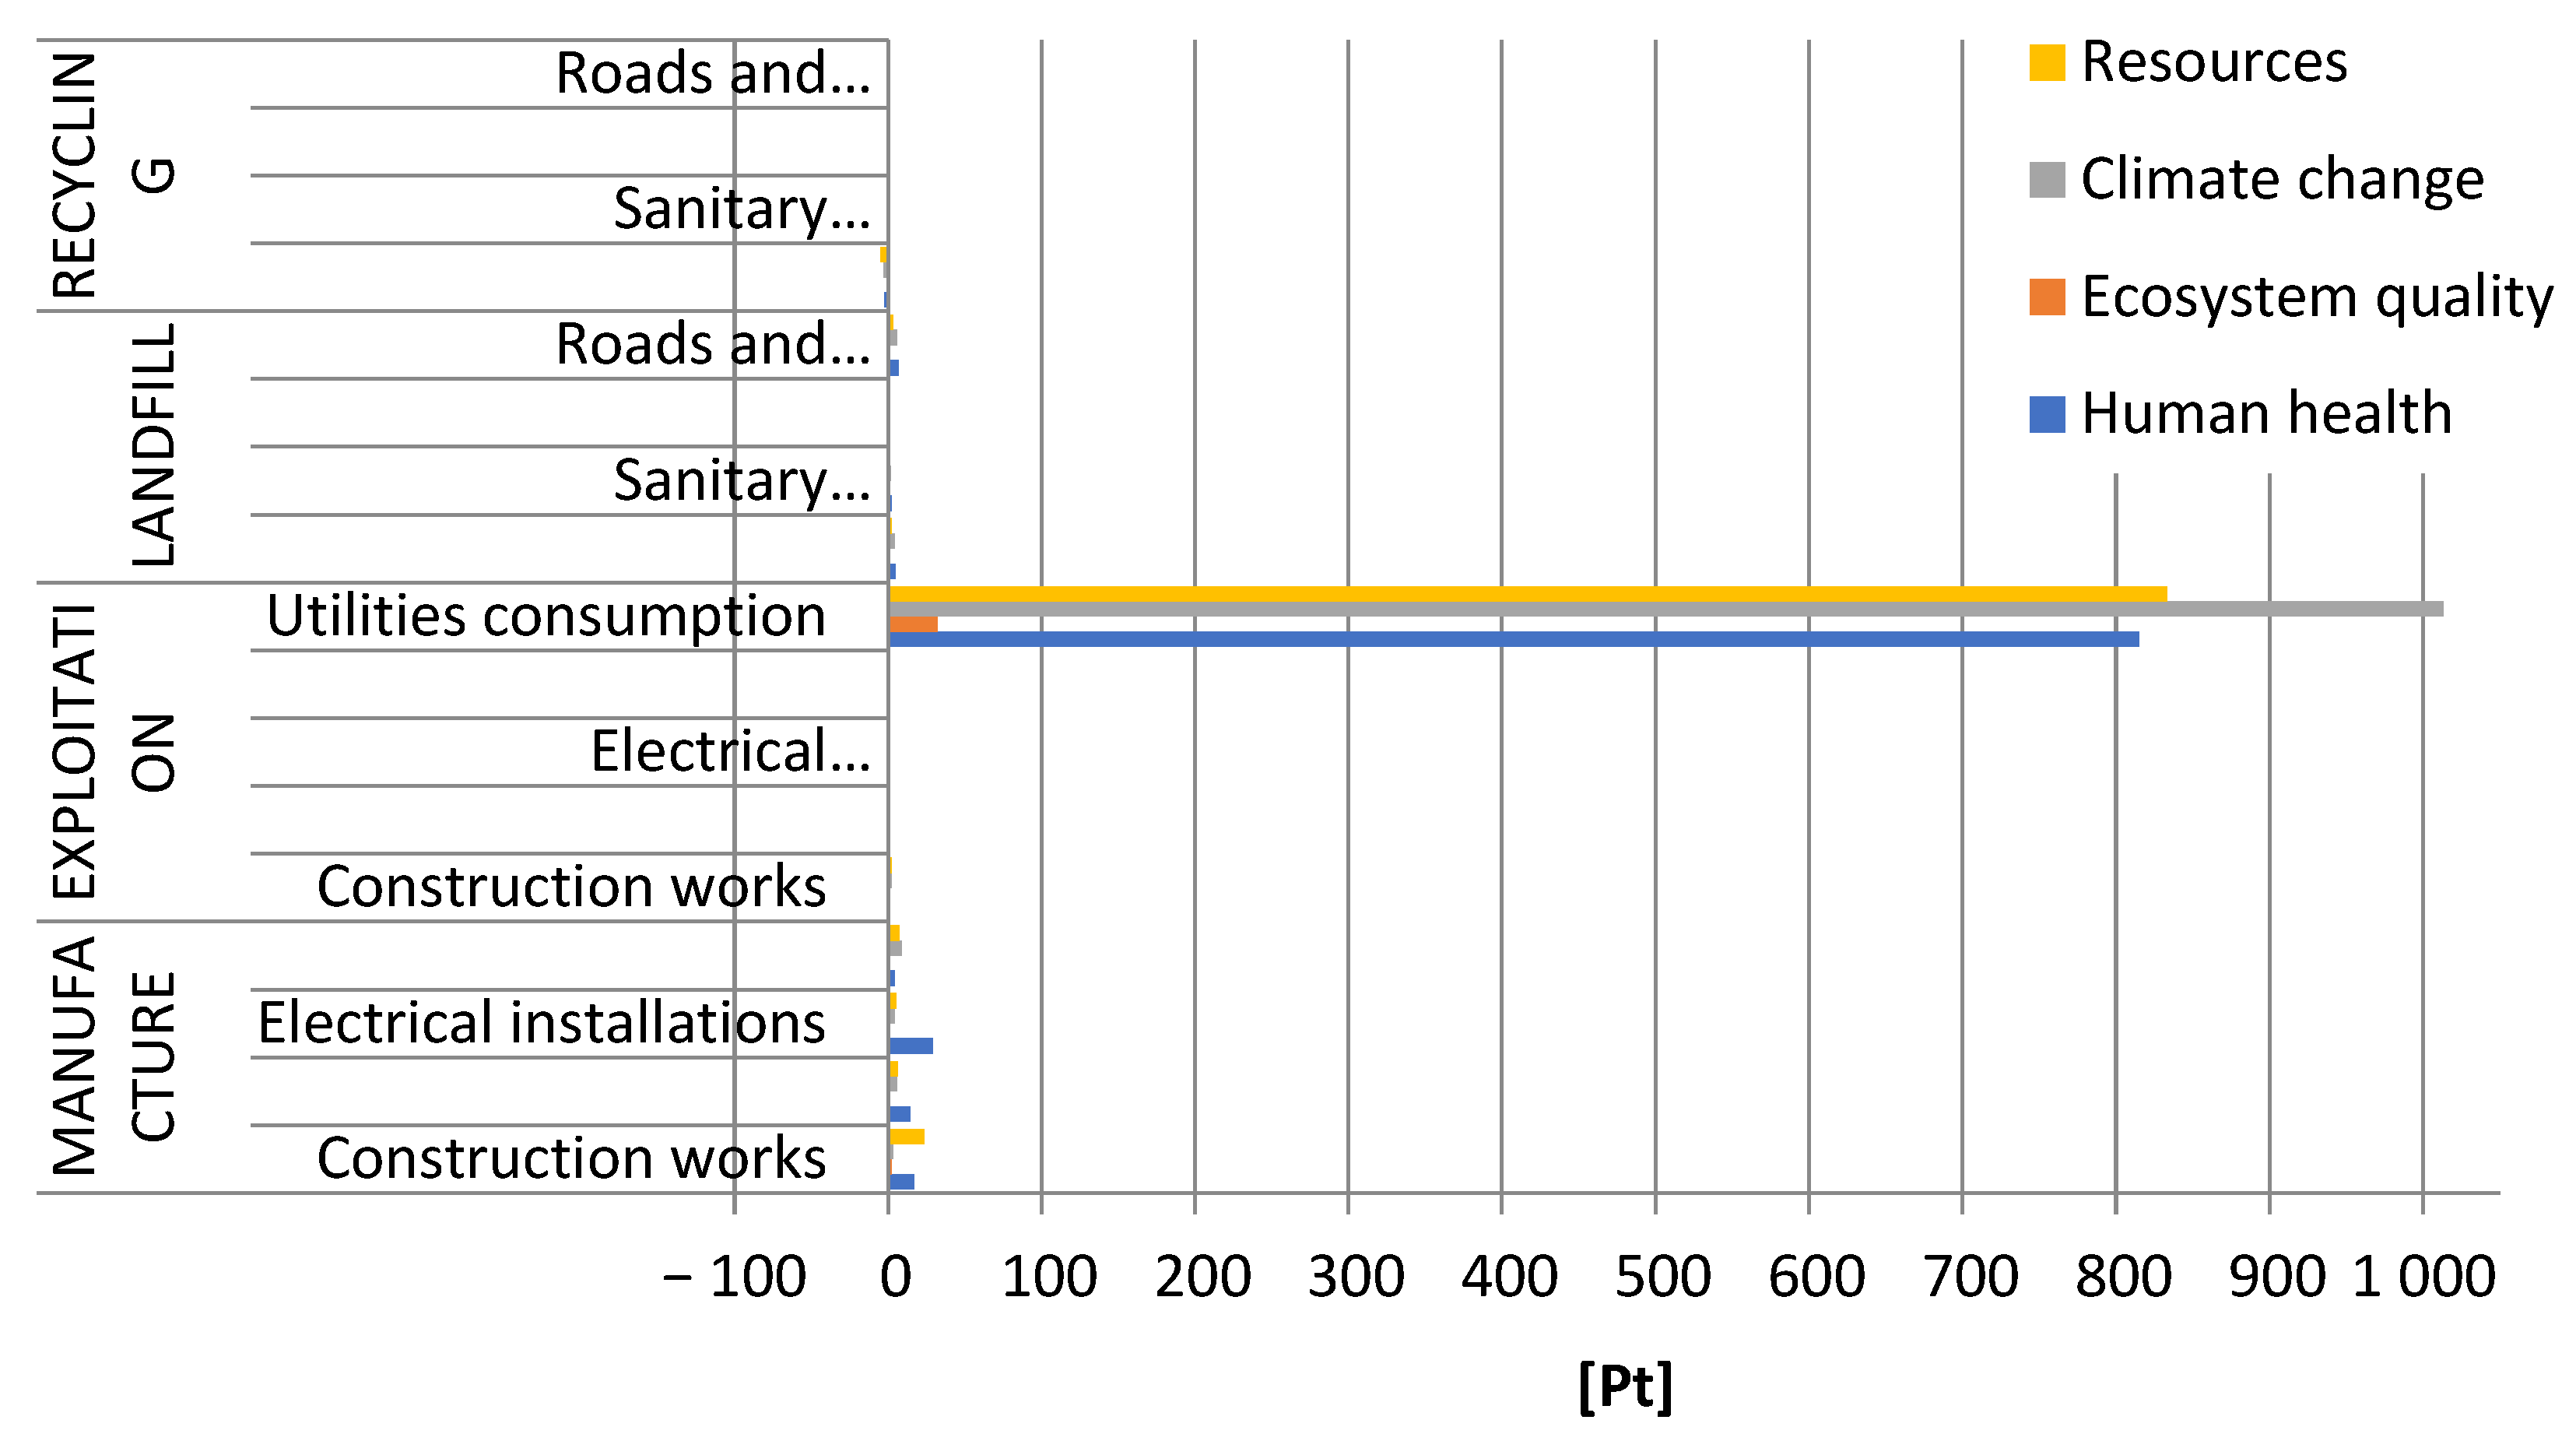
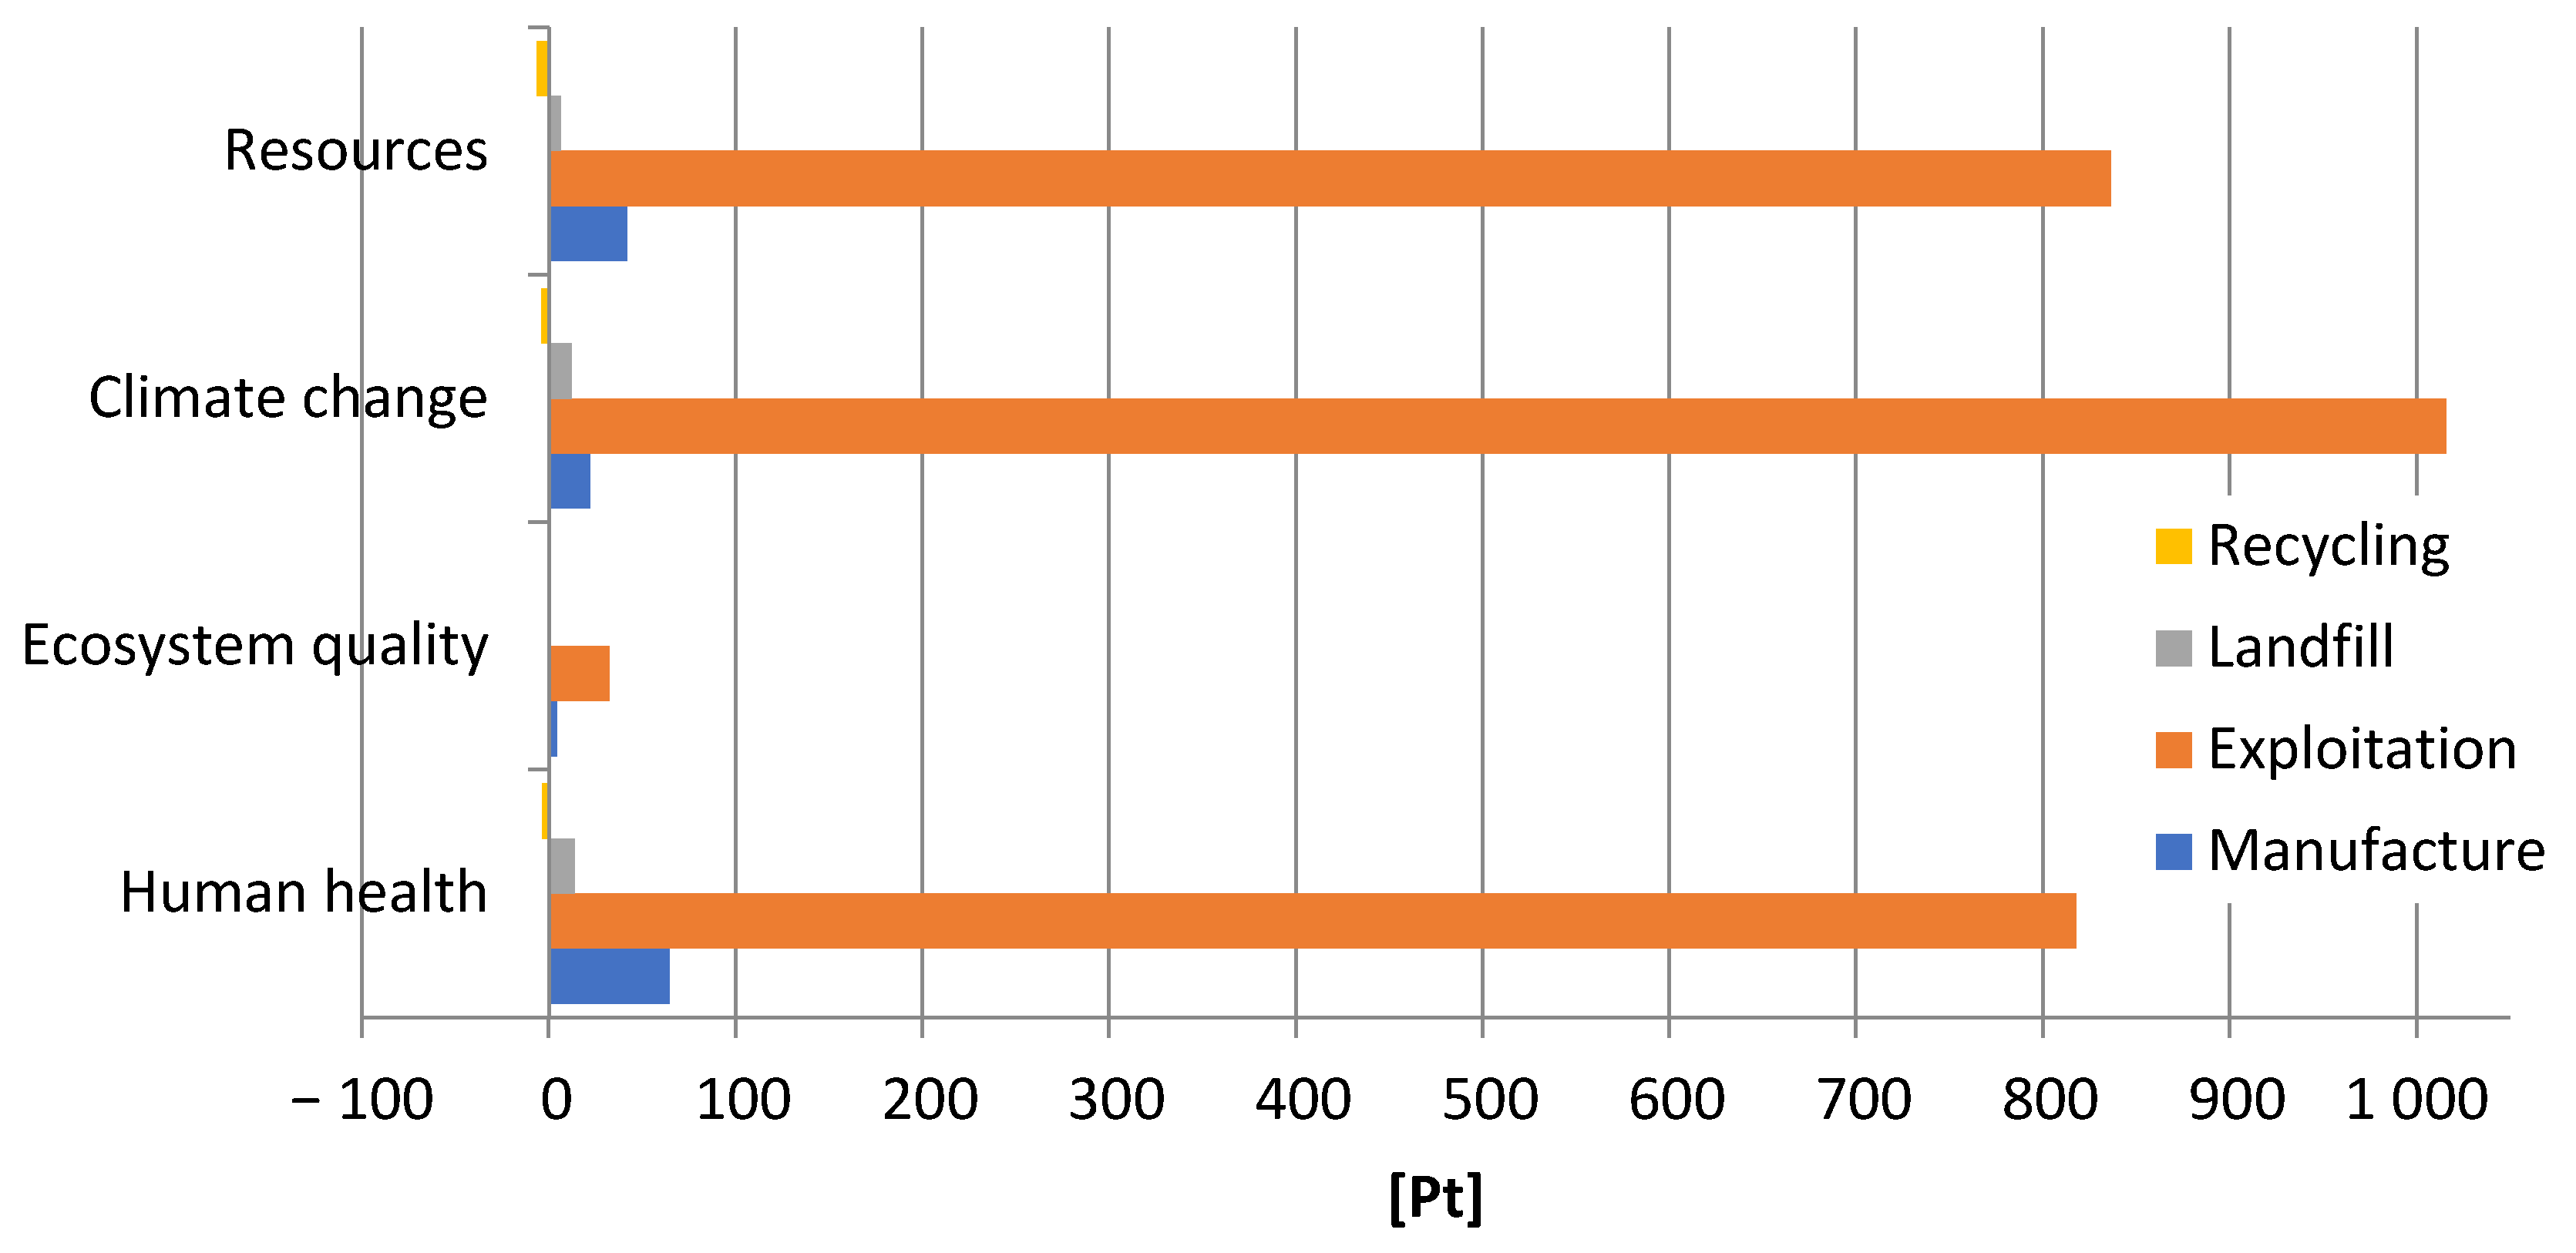
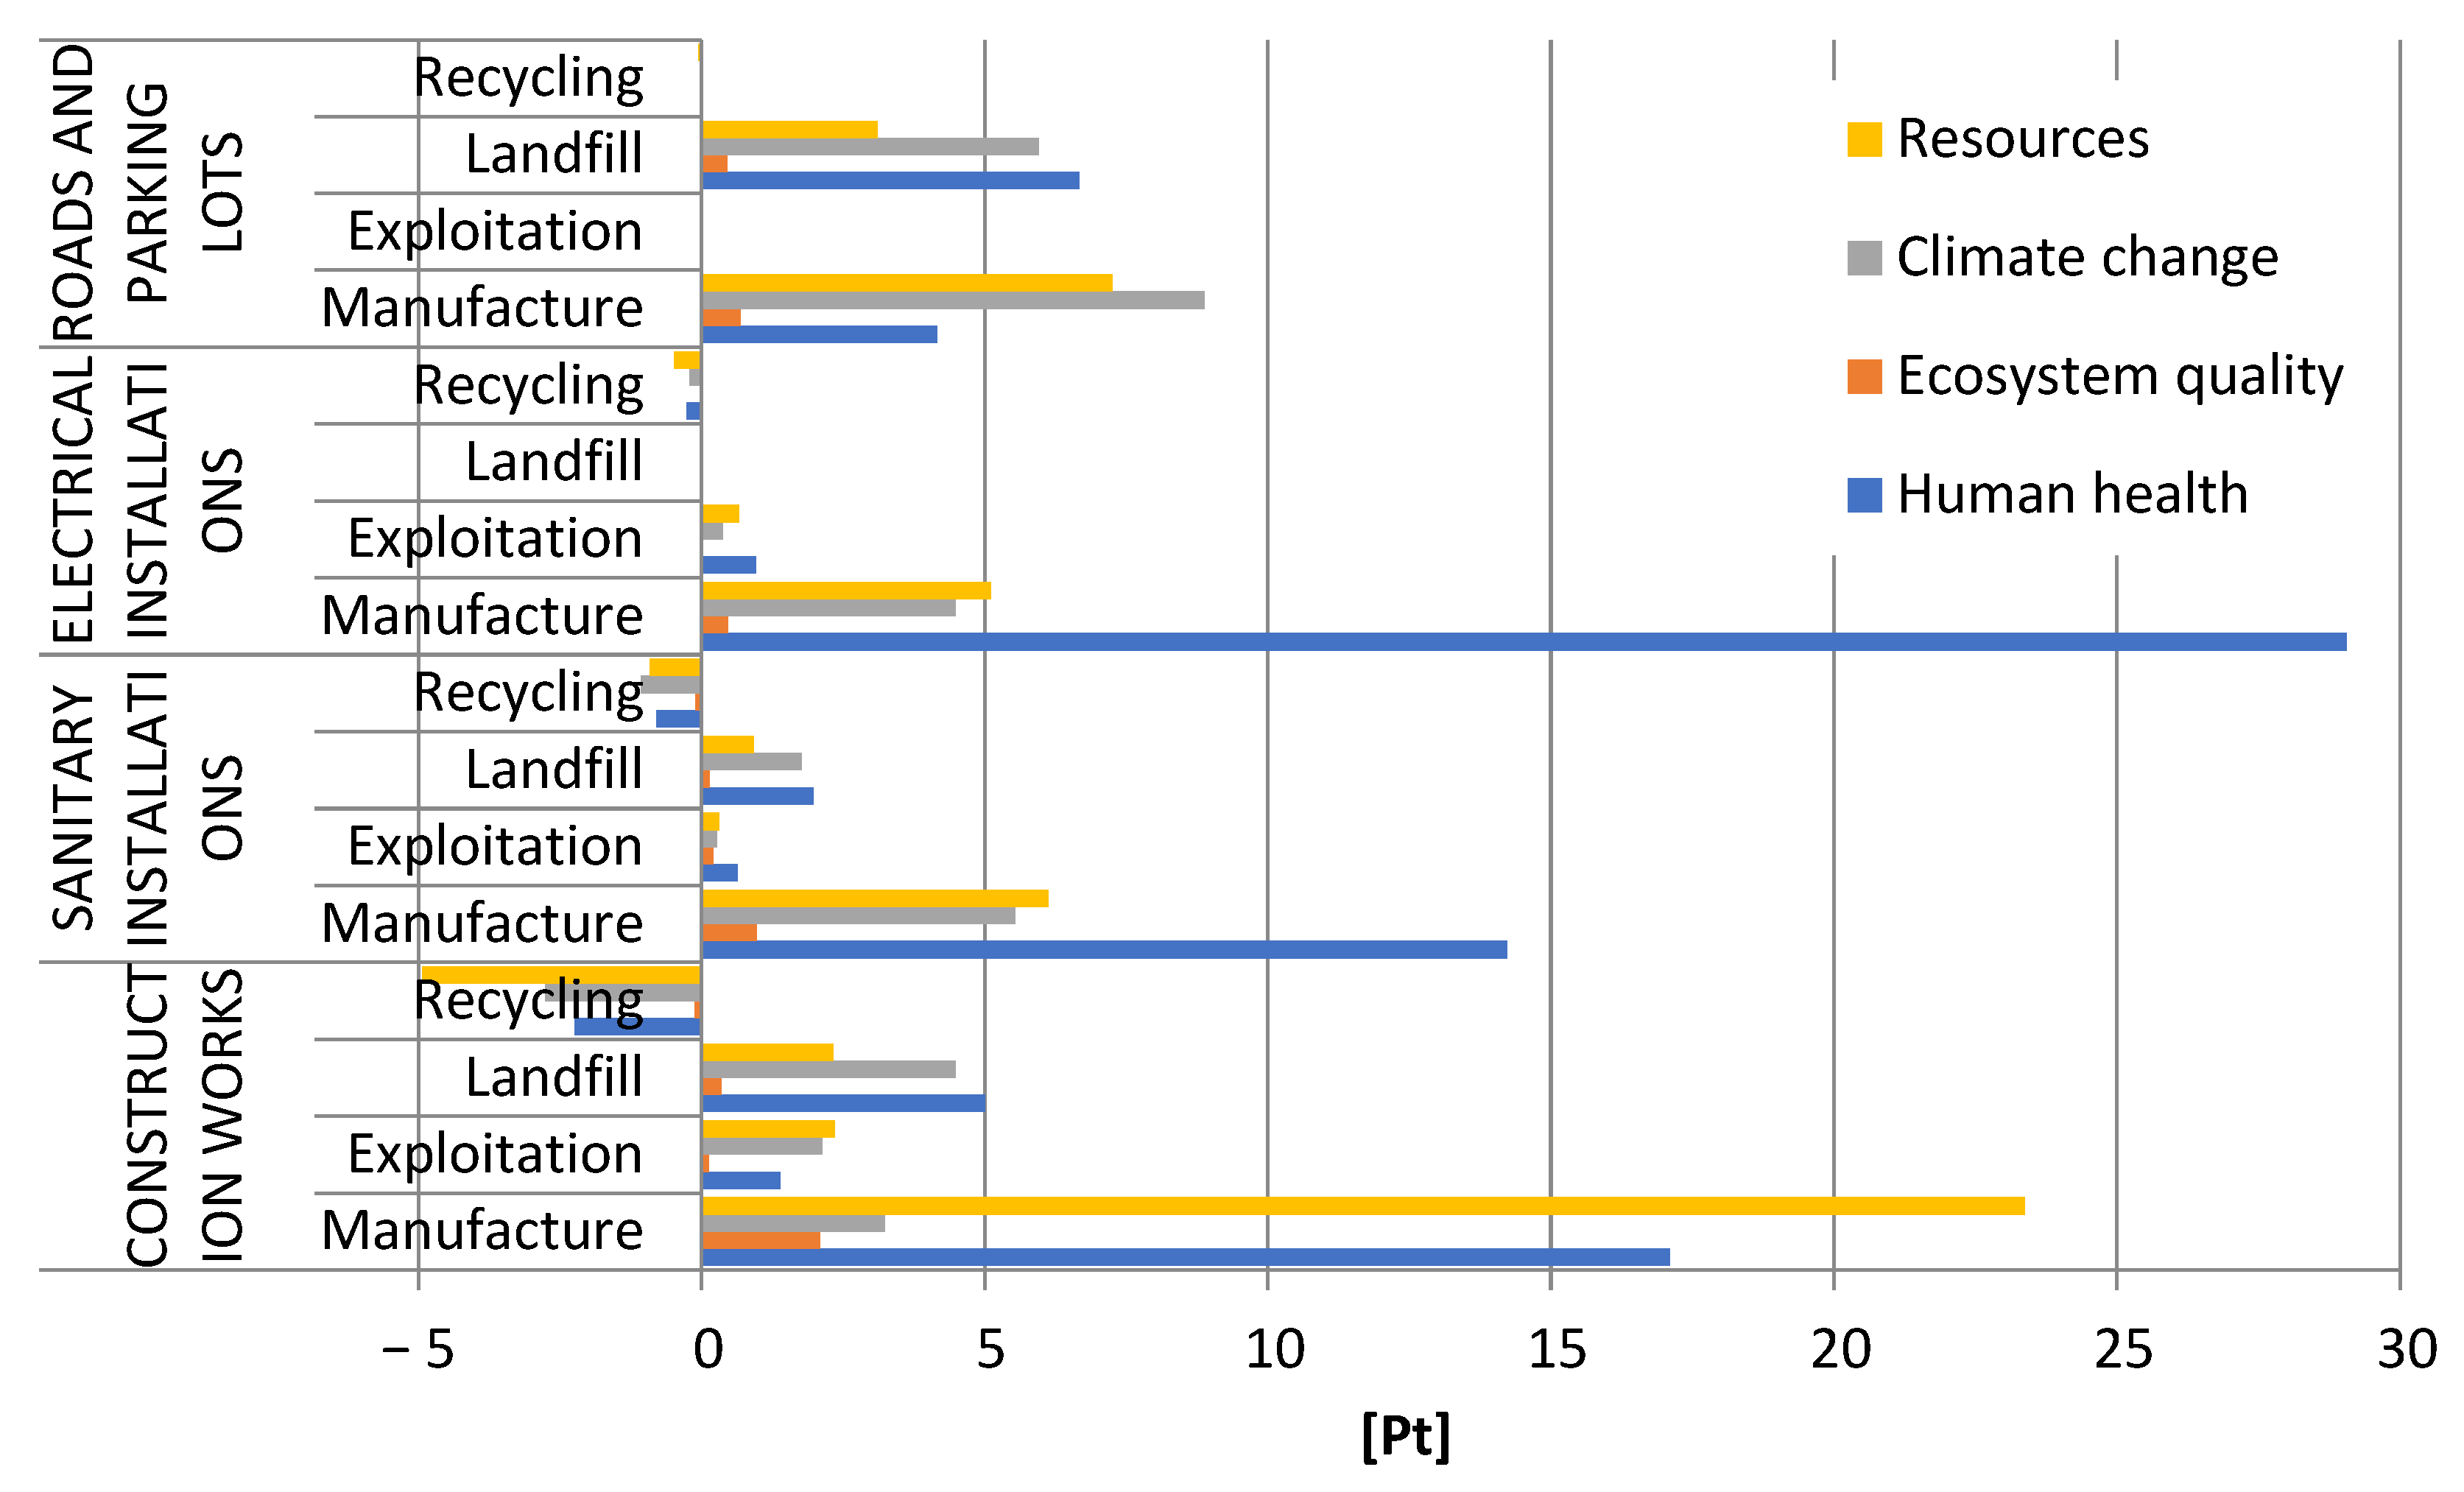
3.3. Grouping and Weighing—Areas of Influence

As already mentioned, in the IMPACT 2020+ method, the obtained results of the analyses can be grouped into four areas of influence—human health, ecosystem quality, climate change and resources. In each of the above-mentioned areas, the life cycle of a retail and service building, taking into account post-use management in the form of a landfill, has more negative environmental consequences compared to the life cycle with management in the form of recycling. The most harmful impacts were recorded in the field of climate change (landfill: 1.05 × 10³ Pt, recycling: 1.03 × 10³ Pt), impact on human health (landfill: 8.96 × 10² Pt, recycling: 8.79 × 10² Pt) and resource depletion (landfill: 8.85 × 10² Pt, recycling: 8.72 × 10² Pt) (Figure 16).
The highest level of negative environmental consequences in the life cycle of a retail and service building occurred during the exploitation stage, especially in the area of climate change (1.02 × 10³ Pt), depletion of raw materials (8.36 × 10² Pt) and harmful effects on human health (8.18 × 10² Pt) due to the use of conventional sources in the production of heat and electricity supplied to the building. The second stage, which also has a significant impact in this regard, is the manufacture of plastics, materials and components. It causes a number of destructive influences, mainly in terms of impact on human health (6.45 × 101 Pt) and depletion of non-renewable resources (4.19 × 101 Pt), due to the high energy and material consumption of such processes (Figure 17).
The highest level of harmful impacts on the environment in the life cycle of the considered facility, noted at the exploitation stage, was related to the consumption of utilities, mainly natural gas and electricity. It was the cause of a number of negative impacts on the environment, especially in the area of emissions of compounds causing climate change (1.01 × 10³ Pt), impact on human health (8.15 × 10² Pt) and processes related to the use of non-renewable resources (8.33 × 10² Pt) (Figure 18).
Due to the fact that the area of impact related to climate change causes the most negative environmental consequences in the life cycle of a retail and service building, it was decided to discuss the related emissions in more detail.
The Earth’s climate is primarily influenced by the temperature of the air, water, soil surface, rainfall and solar radiation. The natural greenhouse effect is caused by water vapor, carbon dioxide, tropospheric ozone, nitrous oxide, methane, aerosols and cloud particles, all present in the atmosphere in small amounts as well as other trace gases. The key contribution to the increase in the greenhouse effect is CO2, of which the greatest anthropogenic sources are the combustion of fossil fuels and deforestation. CH4 emissions (e.g., fossil fuels, waste, breeding, rice crops), freons (e.g., aerosols, foams) or nitrogen oxides (e.g., eutrophication, deforestation, biomass combustion) are also important. A rise in temperature on the Earth’s surface due to the excessive greenhouse effect can lead to severe climate change [33].
In the life cycle of plastics, materials and elements used for construction works, the landfill stage is associated with the highest negative environmental impact in terms of emissions of climate change compounds (in total: 4.48 × 100 Pt). Its size is significantly influenced by the harmful effect of carbon dioxide (2.77 × 100 Pt) and methane (1.55 × 100 Pt). Changing the post-use disposal method from landfilling to recycling would allow for a significant reduction in the level of negative impacts in the perspective of the entire life cycle (by a total of 2.76 × 100 Pt) (Table 12).
In the case of sanitary installations, the most destructive environmental consequences in the analyzed area were those recorded for the manufacturing stage (total: 5.53 × 100 Pt). They were conditioned mainly by the level of harmful influence of carbon dioxide emission (in total: 5.29 × 100 Pt). The use of recycling processes would make it possible to significantly reduce the degree of negative impacts throughout the entire life cycle of the installation (by 1.06 × 100 Pt in total) (Table 13).
Manufacture of materials and elements of electrical installations, similar to sanitary installations, is the source of the largest emissions of compounds causing climate change (total: 4.48 × 100 Pt). Carbon dioxide (in total: 4.40 × 100 Pt) stands out as a key factor in shaping this quantity. Post-use management in the form of recycling, to some extent, could reduce the negative impact on the environment in the considered scope (in total by 2.14 × 10⁻¹ Pt) (Table 14).
In the road and parking lots cycle, the maximum level of emissions of substances having a negative impact on climate change was recorded at the stage of manufacture (total: 8.89 × 100 Pt) and the landfill (total: 5.96 × 100 Pt). In both cases, their size was mainly conditioned by the impact on the environment of carbon dioxide (manufacture: 9.02 × 100 Pt, landfill: 3.68 × 100 Pt). Recycling processes of plastics, materials and components would result in a certain reduction in the level of the analyzed harmful impacts in the perspective of the entire life cycle (by a total of 9.24 × 10⁻³ Pt) (Table 15).
If the analyses include the consumption of utilities necessary for the exploitation of the analyzed building, it becomes evident that this is the stage causing the most harmful emissions for human health, lowering the quality of the environment, aggravating climate change and depleting the resources of raw materials (Figure 19).
Considering the materials and elements included in the individual groups of installations in the analyzed building, the highest level of emissions of substances harmful to human health stands out for the stage of their manufacture in relation to electrical installations due to the high proportion of elements made of copper, sanitary installations due to significant share of ceramic elements and made of polymer plastics and construction works due to enormous material consumption. The maximum negative impact on the quality of the environment and the depletion of raw materials resources has, in turn, the manufacturing stage of materials necessary during construction works (Figure 20).
Since during the conducted analyses, a large number of detailed results were obtained, it was decided to present in the article only those selected—the most important in terms of the issues raised.

4. Summary

In recent years, a particularly dynamic increase in the importance of the role of environmental problems can be observed, the failure to take them into account in the future, for example, creating barriers to economic development. New legal regulations and standards modify the existing rules of business activity, also referring to building structures. Hence, it becomes justified to run analyses pointed at the ecological and energy optimization of retail and service buildings, of which more and more are being built every year. It is also necessary to rationalize individual stages of their life cycle [34,35,36].
The main objective of the study was achieved thanks to the assessment of environmental loads in the life cycle of the analyzed retail and service building.
By taking into account the form of post-consumer management of plastics, materials and elements of a retail and service building, the obtained results indicate that its life cycle with landfill storage has a significantly higher level of harmful impact on the environment and is a source of significantly higher greenhouse gas emissions to the atmosphere, than in the case of a life cycle where recycling processes have been used.
The highest degree of harmful environmental impacts and the highest level of greenhouse gas emissions in the life cycle of the analyzed building were recorded for the exploitation stage, during which high consumption of energy from conventional energy sources was noted due to the demand for heat and electricity.
Climate change, resource depletion and human health are among the main areas of influence with the highest negative impacts. On the other hand, in the case of impact categories, the emissions of substances causing climate change, processes related to the extraction of fossil fuels and emissions of inorganic compounds causing respiratory system diseases stood out with the greatest harmful impact on the environment.
The results of the conducted environmental impact analysis refer to a specific case of a commercial and service building, and the level of detail and error in estimating these impacts depends primarily on the accuracy and quality of the collected input data. In the presented analysis, the data on the consumption of materials are actual data, while the data on the consumption of utilities and energy resulting from human work inputs are estimated data. The consumption of utilities and energy was adopted as the average annual consumption, and for this type of input data, the final impacts were determined, giving an approximate value of the impacts. Reducing or increasing energy consumption results in an increase or decrease in environmental impacts, respectively. By taking into account the assumed life cycle length (40 years), the impact result does not take into account changes, for example, in the structure of the energy system and the use of renewable energy sources, which in the future may reduce or increase environmental impacts depending on the share of renewable energy sources. The analysis also does not take into account technological progress over time and increasing the recyclability of materials and components, which would ultimately also affect the level of environmental impacts.
Further research on environmental impacts in the life cycle of service buildings could be supplemented with prospective studies determining the levels of environmental effects for alternative, possible future development paths for commercial and service buildings, which could include the aforementioned scenarios for the share of renewable energy in the national energy mix, the share of recycled materials or the use of new technological solutions. Such action would allow for the formulation of conclusions and guidelines for building structures.

5. Conclusions

The life cycle of retail and service buildings is characterized by a very high level of energy consumption and the emission of harmful substances caused by it. Reducing the consumption of conventional energy resources, in addition to increasing energy efficiency, can be achieved through the use of renewable energy sources. In the construction industry, the energy demand covers mainly four areas of operation—the production of plastics, materials and components, their transport to the construction site, construction of the facility and its operation. Depending on the technology used, the amount of energy accumulated in building materials is large and may range from 5.5 to 6.5 GJ⋅Mg−1. The material that significantly increases the level of accumulated energy is cement because its production is very energy-consuming. The second essential material influencing the amount of energy consumption is reinforcing and structural steel. Increasing the use of lightweight concretes and insulating materials makes it possible to reduce the energy demand in the manufacturing phase significantly. In addition, their use is also of key importance in reducing operational energy consumption [15,37,38].
During the exploitation of a retail and service building, it is possible to optimize the ecological and energy consumption of resources, for example, by selecting the size and cubature of the object for its function, maintaining a good technical condition, introducing improvements in the operation and use processes or implementing solutions aimed at reducing media consumption. As a consequence of the conducted analyses, it can be noted that the reduction in energy consumption in their exploitation will be of fundamental importance for the ecological and energy modernization of buildings [39,40].
One of the basic activities in the field of sustainable development is the enhancement of already known processes and the search for new technologies. Moreover, in the lifecycle of commercial and service buildings, the concept of the best available technique (BAT) is of particular importance as it has become an important tool in this area. The best available technique is understood as the methods of producing plastics, materials and elements, methods of constructing buildings, their operation and post-use management in an environmentally friendly manner [15,41,42].
In the case of retail and service facilities, the best available technique, optimal in terms of ecological and energy, involving the principle of preventing or, if not possible, reducing the generation of waste and pollution, takes into account in particular:
-
Use of non-waste or low-waste technologies;
-
Use of non-toxic substances or those with possibly low toxicity;
-
Recovery of plastics, materials and components used at different phases of the life cycle of buildings and as much waste generated during their lifetime as possible;
-
Using analogous processes, methods and technologies that have been successfully applied in other facilities;
-
Tracking scientific and technological development;
-
Reduction in energy and material consumption throughout the life cycle;
-
The need to increase durability and prevent failures and reduce their consequences on the environment [43,44,45].

Author Contributions

Conceptualization, D.T., W.F. and R.K.; methodology, W.F. and R.K.; software, D.T., R.K. and K.D.; validation, D.T., R.K. and K.D.; formal analysis, W.F.; investigation, D.T., R.K. and K.D.; resources, D.T.; data curation, D.T., R.K. and K.D.; writing—original draft preparation, D.T., W.F., R.K. and K.D.; writing—review and editing, D.T., W.F., R.K. and K.D.; visualization, D.T., W.F., R.K. and K.D.; supervision, R.K. and W.F.; project administration, D.T. and R.K.; funding acquisition, D.T. and R.K. All authors have read and agreed to the published version of the manuscript.

Funding

This research received no external funding.

Institutional Review Board Statement

Not applicable.

Informed Consent Statement

Not applicable.

Data Availability Statement

The data in the study are available on request from the corresponding author. The data are not publicly available due to privacy policies.

Conflicts of Interest

The authors declare no conflict of interest.

References

  1. Pharino, C. Challenges for Sustainable Solid Waste Management; Springer Nature Singapore: Singapore, 2017; pp. 1–27. [Google Scholar] [CrossRef]
  2. Singh, R.; Kumar, S. Green Technologies and Environmental Sustainability; Springer International Publishing: Cham, Switzerland, 2017; pp. 1–43. [Google Scholar] [CrossRef]
  3. McLellan, B. Sustainable Future for Human Security. Environment and Resources; Springer Nature Singapore: Singapore, 2018; pp. 29–47. [Google Scholar] [CrossRef]
  4. Yang, M.; Yu, X. Energy Efficiency. Benefits for Environment and Society; Springer: London, UK, 2015; pp. 11–42. [Google Scholar] [CrossRef]
  5. Markiv, T.; Sobol, K.; Franus, M.; Franus, W. Mechanical and Durability Properties of Concretes Incorporating Natural Zeolite; Archives of Civil and Mechanical Engineering: Amsterdam, The Netherlands, 2016; pp. 554–562. [Google Scholar] [CrossRef]
  6. Ekardt, F. Sustainability. Transformation, Governance, Ethics, Law; Springer Nature Switzerland: Cham, Switzerland, 2020; pp. 61–109. [Google Scholar] [CrossRef]
  7. Marczuk, A.; Misztal, W.; Słowik, T.; Piekarski, W.; Bojanowska, M.; Jackowska, I. Chemical determinants of the use of recycled vehicle components. Przem. Chem. 2015, 10, 1867–1871. [Google Scholar] [CrossRef]
  8. Guinée, J.; Heijungs, R.; Huppes, G.; Zamagni, A.; Masoni, P.; Buonamici, R.; Rydberg, T. Life Cycle Assessment: Past, present, and future. Environ. Sci. Technol. 2011, 1, 90–96. [Google Scholar] [CrossRef]
  9. Kulczycka, J.; Lelek, Ł.; Lewandowska, A.; Zarębska, J. Life Cycle Assessment of municipal solid waste management—comparison of results using different LCA models. Pol. J. Environ. Stud. 2015, 1, 125–140. [Google Scholar] [CrossRef]
  10. Dastbaz, M.; Gorse, C. Sustainable Ecological Engineering Design; Springer International Publishing: Cham, Switzerland, 2016; pp. 45–123. [Google Scholar] [CrossRef]
  11. Flizikowski, J.; Bieliński, K. Technology and Energy Sources Monitoring: Control, Efficiency and Optimization; IGI Global: Hershey, PA, USA, 2013; pp. 6–29. ISBN 9781466626645. [Google Scholar]
  12. Frankl, P.; Rubik, F. Life Cycle Assessment in Industry and Business; Springer: Berlin/Heidelberg, Germany, 2000; pp. 43–51. [Google Scholar] [CrossRef]
  13. Curran, M.A. Goal and Scope Definition in Life Cycle Assessment; Springer Science + Business Media: Dordrecht, The Netherlands, 2017; pp. 1–167. [Google Scholar] [CrossRef]
  14. Kłos, Z. Ecobalancial assessment of chosen packaging processes in food industry. Int. J. Life Cycle Assess 2002, 7, 309. [Google Scholar] [CrossRef]
  15. Górzyński, J. Podstawy Analizy Środowiskowej Wyrobów i Obiektów; Wydawnictwa Naukowo-Techniczne: Warsaw, Poland, 2007; pp. 5–487. ISBN 978-83-204-3252-9. (In Polish) [Google Scholar]
  16. Klostermann, J.E.M.; Tukker, A. Product Innovation and Eco-Efficiency; Springer Science + Business Media: Dordrecht, The Netherlands, 2008; pp. 199–223. [Google Scholar] [CrossRef]
  17. Goedkoop, M.; Oele, M.; Vieira, M.; Leijting, J.; Ponsioen, T.; Meijer, E. Introduction into LCA Methodology and Practice with SimaPro, SimaPro User Manual; PréConsultants: Amersfoort, The Netherlands, 2016; Available online: Pre-sustainability.com/download/SimaPro8IntroductionToLCA.pdf (accessed on 10 July 2021).
  18. Klinglmair, M.; Sala, S.; Brandão, M. Assessing resource depletion in LCA: A review of methods and methodological issues. Int. J. Life Cycle Assess 2014, 19, 580–592. [Google Scholar] [CrossRef]
  19. ISO 14040:2006: Environmental Management—Life Cycle Assessment—Principles and Framework. Available online: Iso.org/standard/37456.html (accessed on 17 July 2021).
  20. ISO 14044:2006: Environmental Management—Life Cycle Assessment—Requirements and Guidelines. Available online: Iso.org/standard/38498.html (accessed on 17 July 2021).
  21. Ulgiati, S.; Raugei, M.; Bargigli, S. Overcoming the in adequacy of single-criterion approaches to Life Cycle Assessment. Ecol. Modell. 2006, 3, 432–442. [Google Scholar] [CrossRef]
  22. Guineé, J. Handbook on Life Cycle Assessment: Operational Guide to the ISO Standards; Springer Science + Business Media: Berlin, Germany, 2002; pp. 5–644. [Google Scholar] [CrossRef]
  23. Jolliet, O.; Margni, M.; Charles, R.; Humbert, S.; Payet, J.; Rebitzer, G.; Rosenbaum, R. IMPACT 2002+: A new life cycle impact assessment methodology. Int. J. Life Cycle Assess 2003, 8, 324–329. [Google Scholar] [CrossRef] [Green Version]
  24. Kurczewski, P.; Kłos, Z. Technical objects classification for environmental analyses. Zag. Ekspl. Masz. 2005, 2, 127–138. [Google Scholar]
  25. Fernández, R.Á.; Zubelzu, S.; Martínez, R. Carbon Footprint and the Industrial Life Cycle; Springer International Publishing: Cham, Switzerland, 2017; pp. 3–176. [Google Scholar] [CrossRef]
  26. Tomporowski, A.; Flizikowski, J.; Kruszelnicka, W.; Piasecka, I.; Kasner, R.; Mroziński, A.; Kovalyshyn, S. Destructiveness of profits and outlays associated with operation of offshore wind electric power plant. Part 1: Identification of a model and its components. Pol. Marit. Res. 2018, 2, 132–139. [Google Scholar] [CrossRef] [Green Version]
  27. Goedkoop, M.; Oele, M.; Vieira, M.; Leijting, J.; Ponsioen, T.; Meijer, E. SimaPro 7. Tutorial; PréConsultants: Amersfoort, The Netherlands, 2016; Available online: Pre-sustainability.com/download/SimaPro8Tutorial.pdf (accessed on 10 July 2021).
  28. Rebitzer, G.; Loerincik, Y.; Jolliet, O. Input-Output Life Cycle Assessment: From Theory to Applications. Int. J. Life Cycle Assess 2002, 3, 174–176. [Google Scholar] [CrossRef] [Green Version]
  29. Recchia, L.; Boncinelli, P.; Cini, E.; Vieri, M.; Garbati Pegna, F.; Sarri, D. Multicriteria Analysis and LCA Techniques; Springer: London, UK, 2011; pp. 5–25. [Google Scholar] [CrossRef]
  30. Finkbeiner, M. Special Types of Life Cycle Assessment; Springer Science + Business Media: Dordrecht, The Netherlands, 2016; pp. 115–332. [Google Scholar] [CrossRef]
  31. Hauschild, M.; Rosenbaum, R.K.; Olsen, S. Life Cycle Assessment. Theory and Practice; Springer Science + Business Media: Dordrecht, The Netherlands, 2018; pp. 9–55. [Google Scholar] [CrossRef]
  32. Tomporowski, A.; Piasecka, I.; Flizikowski, J.; Kasner, R.; Kruszelnicka, W.; Mroziński, A.; Bieliński, K. Comparison analysis of blade life cycles of land-based and offshore wind power plants. Pol. Marit. Res. 2018, 25, 225–233. [Google Scholar] [CrossRef] [Green Version]
  33. Sasmal, J. Resources, Technology and Sustainability; Springer Nature Singapore: Singapore, 2016; pp. 79–235. [Google Scholar] [CrossRef]
  34. Affolderbach, J.; Schulz, C. Green Building Transitions; Springer International Publishing: Cham, Switzerland, 2018; pp. 3–45. [Google Scholar] [CrossRef]
  35. Bauer, M.; Mösle, P.; Schwarz, M. Green Building; Springer: Berlin/Heidelberg, Germany, 2010; pp. 8–143. [Google Scholar] [CrossRef]
  36. Motoasca, E.; Agarwal, A.K.; Breesch, H. Energy Sustainability in Built and Urban Environments; Springer Nature Singapore: Singapore, 2019; pp. 139–164. [Google Scholar] [CrossRef]
  37. Plastrik, P.; Cleveland, J. Life After Carbon. The Next Global Transformation of Cities; Island Press: Washington, DC, USA, 2018; pp. 13–213. [Google Scholar] [CrossRef]
  38. Yang, F.; Chen, L. High-Rise Urban Form and Microclimate; Springer Nature Singapore: Singapore, 2020; pp. 3–74. [Google Scholar] [CrossRef]
  39. Mercader-Moyano, P. Sustainable Development and Renovation in Architecture; Springer International Publishing: Cham, Switzerland, 2017; pp. 227–449. [Google Scholar] [CrossRef]
  40. Oladokun, M.G.; Aigbavboa, C. Simulation-Based Analysis of Energy and Carbon Emissions in the Housing Sector. A System Dynamics Approach; Springer International Publishing: Cham, Switzerland, 2018; pp. 1–225. [Google Scholar] [CrossRef]
  41. Matsumoto, M.; Masui, K.; Fukushige, S.; Kondoh, S. Sustainability Through Innovation in Product Life Cycle Design; Springer Nature Singapore: Singapore, 2017; pp. 385–536. [Google Scholar] [CrossRef]
  42. Piasecka, I.; Bałdowska-Witos, P.; Piotrowska, K.; Tomporowski, A. Eco-energetical life cycle assessment of materials and components of photovoltaic power plant. Energies 2020, 13, 1385. [Google Scholar] [CrossRef] [Green Version]
  43. Drück, H.; Mathur, J.; Panthalookaran, V. Green Buildings and Sustainable Engineering; Springer Nature Singapore: Singapore, 2020; pp. 139–245. [Google Scholar] [CrossRef]
  44. Graczyk, M.; Rybaczewska-Błażejowska, M. Continual improvement as a pillar of environmental management. Management 2010, 1, 297–305. [Google Scholar]
  45. Littlewood, J.; Howlett, R.J.; Capozzoli, A.; Jain, L.C. Sustainability in Energy and Buildings; Springer Nature Singapore: Singapore, 2020; pp. 37–47. [Google Scholar] [CrossRef]
Figure 1. Diagram presenting a commercial and service building as a subsystem in an ecosystem with flow streams. Own elaboration based on [15].
Energies 15 03144 g001
Figure 2. Graph presenting the course of the cumulative environmental load Ω in the life cycle of a retail and service building over time τ. Own study based on [15].
Energies 15 03144 g002
Figure 3. Object of research—retail and service building.
Energies 15 03144 g003
Figure 4. Materials with the highest mass share used during the construction of the research object [own study based on the investor’s data].
Energies 15 03144 g004
Figure 5. Human workload during the construction of the research object converted into energy consumption [own study based on the investor’s data].
Energies 15 03144 g005
Figure 6. Energy (kWh) and fuel (liters) consumed by the equipment used in the construction of the research object [own study based on the investor’s data].
Energies 15 03144 g006
Figure 7. The results of grouping and weighing the environmental consequences occurring in the life cycle of the research object by the form of post-use management.
Energies 15 03144 g007
Figure 8. The results of grouping and weighing the environmental consequences occurring at individual stages of the life cycle of the research object.
Energies 15 03144 g008
Figure 9. The results of grouping and weighing the environmental consequences occurring in the life cycle of the research object by the form of post-use development and the impact categories.
Energies 15 03144 g009
Figure 10. Results of grouping and weighing the environmental consequences of emissions of compounds causing global warming occurring in the life cycle of the research object.
Energies 15 03144 g010
Figure 11. The results of grouping and weighing the environmental consequences occurring at the stage of production of the research object by thirteen impact categories and groups of installations.
Energies 15 03144 g011
Figure 12. Results of grouping and weighing the environmental consequences occurring at the stage of operation of the research object by thirteen impact categories and groups of installations.
Energies 15 03144 g012
Figure 13. The results of grouping and weighing the environmental consequences occurring at the post-use development stage (in the form of storage) of the research object by thirteen impact categories and groups of installations.
Energies 15 03144 g013
Figure 14. The results of grouping and weighing the environmental consequences occurring at the post-use development stage (in the form of recycling) of the research object by thirteen impact categories and groups of installations.
Energies 15 03144 g014
Figure 15. The results of grouping and weighing the environmental consequences occurring at individual stages of the life cycle of the research object by groups of installations.
Energies 15 03144 g015
Figure 16. The results of grouping and weighing the environmental consequences occurring in the life cycle of the research object by the form of post-use development and areas of influence.
Energies 15 03144 g016
Figure 17. The results of grouping and weighing the environmental consequences occurring at individual stages of the life cycle of the research object by areas of influence.
Energies 15 03144 g017
Figure 18. The results of grouping and weighing the environmental consequences occurring at individual stages of the life cycle of the research object by areas of influence.
Energies 15 03144 g018
Figure 19. The results of grouping and weighing the environmental consequences occurring at individual stages of the life cycle of the research object by areas of influence.
Energies 15 03144 g019
Figure 20. The results of grouping and weighing the environmental consequences occurring at individual stages of the life cycle of the research object by areas of influence.
Energies 15 03144 g020
Table 1. Average annual and total forecasted consumption of utilities for the research object [own study based on the investor’s data].
MediaAverage Annual ConsumptionForecast Consumption
40 Years of Operation
Unit
Gas11,366454,640m3
Electricity212,5838,503,320kWh
Table 2. The results of characterizing the environmental consequences in the life cycle of the research object by the form of post-use development.
Impact CategoryUnitLife Cycle
with Landfill
Life Cycle
with Recycling
Carcinogenskg C2H3Cl eq3.27 × 1043.19 × 104
Non-carcinogenskg C2H3Cl eq2.10 × 1052.06 × 105
Respiratory inorganicskg PM 2.5 eq8.09 × 1037.94 × 103
Ionizing radiationBq C-14 eq3.87 × 1073.38 × 107
Ozone layer depletionkg CFC-11 eq3.71 × 10−13.51 × 10⁻¹
Respiratory organicskg C2H4 eq7.26 × 1025.06 × 102
Aquatic ecotoxicitykg TEG water5.06 × 1083.03 × 108
Terrestrial ecotoxicitykg TEG soil4.18 × 1074.15 × 107
Terrestrial acid/nutrikg SO2 eq1.39 × 1051.35 × 105
Land occupationm2 org. arable1.20 × 1041.20 × 104
Aquatic acidificationkg SO2 eq6.05 × 1045.87 × 104
Aquatic eutrophicationkg PO4 P-lim2.80 × 1024.23 × 101
Global warmingkg CO2 eq1.04 × 1071.02 × 107
Non-renewable energyMJ primary1.35 × 1081.33 × 108
Mineral extractionMJ surplus2.17 × 1052.14 × 105
Table 3. The results of characterizing the environmental consequences occurring at individual stages of the life cycle of the research object.
Impact CategoryUnitManufactureExploitationLandfillRecycling
Carcinogenskg C2H3Cl eq6.04 × 1032.61 × 1045.21 × 102−1.93 × 10²
Non-carcinogenskg C2H3Cl eq1.80 × 1041.88 × 1053.93 × 103−3.61 × 10²
Respiratory inorganicskg PM 2.5 eq5.56 × 1027.42 × 1031.19 × 102−3.06 × 101
Ionizing radiationBq C-14 eq3.60 × 1063.02 × 1074.89 × 106×
Ozone layer depletionkg CFC-11 eq8.64 × 10−22.79 × 10−15.11 × 10−3−1.50 × 10⁻²
Respiratory organicskg C2H4 eq9.56 × 1015.99 × 1023.09 × 101−1.89 × 10²
Aquatic ecotoxicitykg TEG water1.01 × 1082.46 × 1081.59 × 108−4.44 × 10⁷
Terrestrial ecotoxicitykg TEG soil5.05 × 1063.65 × 1072.52 × 1052.26 × 104
Terrestrial acid/nutrikg SO2 eq9.66 × 1031.26 × 1052.67 × 103−1.05 × 10³
Land occupationm2 org. arable2.55 × 1039.45 × 1037.30 × 100×
Aquatic acidificationkg SO2 eq5.88 × 1035.30 × 1041.58 × 103−1.75 × 10²
Aquatic eutrophicationkg PO4 P-lim1.48 × 1012.85 × 1012.36 × 102−1.06 × 100
Global warmingkg CO2 eq2.19 × 1051.01 × 1071.21 × 105−4.01 × 10⁴
Non-renewable energyMJ primary6.15 × 1061.28 × 1089.67 × 105−9.68 × 10⁵
Mineral extractionMJ surplus2.12 × 1054.73 × 1033.55 × 101−2.48 × 10³
Table 4. The results of characterizing the environmental consequences occurring at the production stage of the research object by the groups of installations.
Impact CategoryUnitManufacture
Construction WorksSanitary
Installations
Electrical
Installations
Roads and
Parking Lots
Carcinogenskg C2H3Cl eq2.95 × 1031.93 × 1039.17 × 1022.39 × 102
Non-carcinogenskg C2H3Cl eq8.24 × 1037.85 × 1031.50 × 1034.28 × 102
Respiratory inorganicskg PM 2.5 eq1.28 × 1021.05 × 1022.85 × 1023.92 × 101
Ionizing radiationBq C-14 eq1.68 × 1068.27 × 1052.30 × 1058.63 × 105
Ozone layer depletionkg CFC-11 eq5.97 × 10−21.44 × 10−22.54 × 10−39.80 × 10⁻³
Respiratory organicskg C2H4 eq4.27 × 1012.30 × 1014.01 × 1002.59 × 101
Aquatic ecotoxicitykg TEG water3.69 × 1075.06 × 1071.08 × 1072.97 × 106
Terrestrial ecotoxicitykg TEG soil2.75 × 1061.11 × 1061.61 × 1051.04 × 106
Terrestrial acid/nutrikg SO2 eq2.83 × 1031.67 × 1034.13 × 1031.03 × 103
Land occupationm2 org. arable1.96 × 1032.46 × 1022.97 × 1024.14 × 101
Aquatic acidificationkg SO2 eq1.07 × 1031.08 × 1033.49 × 1032.38 × 102
Aquatic eutrophicationkg PO4 P-lim7.11 × 1002.97 × 1003.51 × 10−14.41 × 100
Global warmingkg CO2 eq3.21 × 1045.48 × 1044.44 × 1048.80 × 104
Non-renewable energyMJ primary3.55 × 1069.00 × 1056.04 × 1051.10 × 106
Mineral extractionMJ surplus6.50 × 1033.16 × 1041.74 × 1055.61 × 101
Table 5. The results of characterizing the environmental consequences occurring at the stage of operation of the research object by the groups of installations.
Impact CategoryUnitExploitation
Construction WorksSanitary
Installations
Electrical
Installations
Roads and
Parking Lots
Utilities
Consumption
Carcinogenskg C2H3Cl eq1.91 × 1026.85 × 1011.71 × 1032.58 × 10−12.41 × 10⁴
Non-carcinogenskg C2H3Cl eq1.88 × 1022.16 × 1021.24 × 1009.30 × 10−11.88 × 10⁵
Respiratory inorganicskg PM 2.5 eq1.22 × 1015.24 × 1002.97 × 1005.71 × 10−27.40 × 10³
Ionizing radiationBq C-14 eq5.70 × 1057.73 × 1042.09 × 1012.78 × 1032.95 × 107
Ozone layer depletionkg CFC-11 eq1.26 × 10−18.52 × 10−41.40 × 10−71.35 × 10−41.52 × 10−1
Respiratory organicskg C2H4 eq6.66 × 1003.13 × 1007.19 × 10−12.10 × 10−15.89 × 102
Aquatic ecotoxicitykg TEG water2.64 × 1066.54 × 1054.66 × 1053.24 × 1042.42 × 108
Terrestrial ecotoxicitykg TEG soil1.34 × 1053.45 × 1052.42 × 1021.28 × 1033.60 × 107
Terrestrial acid/nutrikg SO2 eq2.63 × 1027.58 × 1017.84 × 1011.04 × 1001.26 × 105
Land occupationm2 org. arable2.54 × 1026.08 × 1012.96 × 1016.61 × 10−19.10 × 10³
Aquatic acidificationkg SO2 eq8.64 × 1012.28 × 1012.00 × 1014.79 × 10−15.29 × 10⁴
Aquatic eutrophicationkg PO4 P-lim7.38 × 10−11.53 × 10−15.28 × 10−28.61 × 10−42.76 × 101
Global warmingkg CO2 eq2.11 × 1042.66 × 1033.67 × 1035.32 × 1011.00 × 107
Non-renewable energyMJ primary3.58 × 1054.56 × 1041.00 × 1051.39 × 1031.27 × 108
Mineral extractionMJ surplus2.47 × 1021.88 × 1031.00 × 1002.37 × 10−22.60 × 10³
Table 6. The results of characterizing the environmental consequences occurring at the post-use development stage (in the form of storage) of the research object by the groups of installations.
Impact CategoryUnitLandfill
Construction WorksSanitary
Installations
Electrical
Installations
Roads and
Parking Lots
Carcinogenskg C2H3Cl eq1.90 × 1027.56 × 1016.13 × 10−12.55 × 10²
Non-carcinogenskg C2H3Cl eq1.43 × 1035.71 × 1024.44 × 1001.93 × 103
Respiratory inorganicskg PM 2.5 eq4.36 × 1011.72 × 1011.53 × 10−15.81 × 101
Ionizing radiationBq C-14 eq1.78 × 1067.08 × 1055.53 × 1032.40 × 106
Ozone layer depletionkg CFC-11 eq1.88 × 10−37.37 × 10−46.69 × 10−62.49 × 10⁻³
Respiratory organicskg C2H4 eq1.14 × 1014.45 × 1004.29 × 10−21.50 × 101
Aquatic ecotoxicitykg TEG water5.89 × 1072.38 × 1071.81 × 1057.58 × 107
Terrestrial ecotoxicitykg TEG soil9.30 × 1043.72 × 1042.95 × 1021.21 × 105
Terrestrial acid/nutrikg SO2 eq9.80 × 1023.86 × 1023.48 × 1001.30 × 103
Land occupationm2 org. arable2.66 × 1001.06 × 1008.35 × 10−33.58 × 100
Aquatic acidificationkg SO2 eq5.77 × 1022.29 × 1022.26 × 1007.72 × 102
Aquatic eutrophicationkg PO4 P-lim8.58 × 1013.43 × 1012.56 × 10−11.16 × 10²
Global warmingkg CO2 eq4.44 × 1041.75 × 1042.10 × 1025.90 × 104
Non-renewable energyMJ primary3.54 × 1051.40 × 1051.20 × 1034.72 × 105
Mineral extractionMJ surplus1.29 × 1015.14 × 1003.83 × 10−21.74 × 101
Table 7. The results of characterizing the environmental consequences occurring at the post-use development stage (in the form of recycling) of the research object by the groups of installations.
Impact CategoryUnitRecycling
Construction WorksSanitary
Installations
Electrical
Installations
Roads and
Parking Lots
Carcinogenskg C2H3Cl eq−1.94 × 1022.79 × 100−9.74 × 1007.86 × 100
Non-carcinogenskg C2H3Cl eq−1.68 × 10²−1.86 × 10²−1.00 × 1013.84 × 100
Respiratory inorganicskg PM 2.5 eq−2.07 × 101−7.20 × 100−2.56 × 100−1.55 × 10⁻¹
Ionizing radiationBq C-14 eq−1.18 × 10⁻²−2.09 × 10⁻³−1.00 × 10⁻³−1.20 × 10⁻⁴
Ozone layer depletionkg CFC-11 eq−1.51 × 10²−1.82 × 101−1.79 × 101−2.29 × 100
Respiratory organicskg C2H4 eq−1.90 × 10⁷−2.50 × 10⁷−1.02 × 1065.76 × 105
Aquatic ecotoxicitykg TEG water1.79 × 1041.60 × 1032.80 × 1032.96 × 102
Terrestrial ecotoxicitykg TEG soil−7.59 × 10²−1.85 × 10²−1.01 × 10²−8.37 × 100
Terrestrial acid/nutrikg SO2 eq−1.12 × 10²−4.90 × 101−1.36 × 101−4.66 × 10⁻¹
Land occupationm2 org. arable−5.84 × 10⁻¹−4.26 × 10⁻¹−5.52 × 10−24.42 × 10−3
Aquatic acidificationkg SO2 eq−2.74 × 10⁴−1.05 × 10⁴−2.11 × 10³−9.15 × 101
Aquatic eutrophicationkg PO4 P-lim−7.47 × 10⁵−1.38 × 10⁵−7.43 × 10⁴−8.44 × 10³
Global warmingkg CO2 eq−1.63 × 10³−7.80 × 10²−6.23 × 101−3.83 × 10⁻²
Table 8. The results of grouping and weighing the environmental consequences of emissions of compounds causing global warming due to construction works occurring at individual stages of the life cycle of the research object.
NoSubstanceCompartmentConstruction Works
ManufactureExploitationLandfillRecycling
1Carbon dioxideAir−4.40 × 1002.19 × 10−1 × −2.48 × 100
2Carbon dioxide, in groundAir7.22 × 1001.84 × 1002.77 × 100 ×
3Carbon monoxideAir5.71 × 10−2 × × −2.48 × 10⁻²
4Carbon monoxide, in groundAir7.58 × 10−3 × 5.14 × 10−3 ×
5Dinitrogen monoxideAir2.74 × 10−25.37 × 10−31.48 × 10−12.33 × 10⁻³
6Ethane, hexafluoro-, HFC-116Air3.10 × 10−22.46 × 10−31.94 × 10−6 ×
7MethaneAir6.85 × 10−23.43 × 10⁻³ × −6.16 × 10⁻²
8Methane, in groundAir8.23 × 10−22.89 × 10−21.55 × 100 ×
9Methane, tetrafluoro-, CFC-14Air1.38 × 10−11.10 × 10−28.60 × 10−6−2.00 × 10⁻¹
10Sulfur hexafluorideAir × × 3.33 × 10−3 ×
11Remaining substances × 7.91 × 10−31.66 × 10−23.01 × 10⁻⁴−2.68 × 10⁻⁴
TOTAL3.24 × 1002.13 × 1004.48 × 100−2.76 × 100
Table 9. The results of grouping and weighing the environmental consequences of emissions of compounds causing global warming due to sanitary installations occurring at individual stages of the life cycle of the research object.
NoSubstanceCompartmentSanitary Installations
ManufactureExploitationLandfillRecycling
1Carbon dioxideAir2.67 × 1002.58 × 10−2×−9.29 × 10⁻¹
2Carbon dioxide, in groundAir2.62 × 1002.36 × 10−11.09 × 100×
3Carbon monoxideAir2.13 × 10−2××−1.19 × 10⁻²
4Carbon monoxide, in groundAir×8.36 × 10⁻⁴××
5Dinitrogen monoxideAir1.38 × 10−21.33 × 10−35.89 × 10−2−2.69 × 10⁻⁵
6Ethane, hexafluoro-, HFC-116Air1.94 × 10−2×7.71 × 10−7×
7MethaneAir7.14 × 10−26.15 × 10⁻⁴×−2.93 × 10⁻²
8Methane, in groundAir1.96 × 10−23.13 × 10−36.12 × 10−1×
9Methane, tetrafluoro-, CFC-14Air9.33 × 10−26.04 × 10−43.43 × 10−6×
10Remaining substances×5.48 × 10−35.35 × 10−43.46 × 10⁻³−9.48 × 10⁻²
TOTAL5.53 × 1002.69 × 10−11.76 × 100−1.06 × 100
Table 10. The results of grouping and weighing the environmental consequences of emissions of compounds causing global warming due to electrical installations occurring at different stages of the life cycle of the research object.
NoSubstanceCompartmentElectrical Installations
ManufactureExploitationLandfillRecycling
1Carbon dioxideAir4.19 × 1003.33 × 10−1×−2.05 × 10⁻¹
2Carbon dioxide, in groundAir2.10 × 10−12.54 × 10−21.26 × 10−2 ×
3Carbon monoxideAir6.87 × 10−36.42 × 10⁻⁴ × −2.04 × 10⁻³
4Dinitrogen monoxideAir5.03 × 10−3×4.45 × 10−43.48 × 10−4
5Ethane, hexafluoro-, HFC-116Air8.46 × 10−3×6.03 × 10−9×
6MethaneAir2.05 × 10−29.04 × 10⁻³×−5.91 × 10⁻³
7Methane, in groundAir4.50 × 10−31.94 × 10−38.21 × 10−3×
8Methane, tetrafluoro-, CFC-14Air3.77 × 10−2×2.68 × 10−8−1.08 × 10⁻³
9Remaining substances×4.27 × 10−48.19 × 10−53.11 × 10⁻⁵−2.28 × 10⁻⁵
TOTAL4.48 × 1003.71 × 10−12.13 × 10⁻²−2.14 × 10⁻¹
Table 11. Results of grouping and weighing the environmental consequences of emissions of compounds causing global warming due to roads and parking lots occurring at individual stages of the life cycle of the research object.
NoSubstanceCompartmentRoads and Parking Lots
ManufactureExploitationLandfillRecycling
1Carbon dioxideAir−2.07 × 10−14.12 × 10−3×−9.29 × 10⁻³
2Carbon dioxide, in groundAir9.02 × 1001.13 × 10−33.68 × 100×
3Carbon monoxideAir×1.86 × 10⁻⁵××
4Dinitrogen monoxideAir1.48 × 10−2×1.99 × 10−14.64 × 10−5
5MethaneAir×8.51 × 10⁻⁵××
6Methane, in groundAir5.60 × 10−21.89 × 10−52.07 × 100×
7Remaining substances×9.60 × 10−31.35 × 10−51.17 × 10−21.88 × 10−7
TOTAL8.89 × 1005.38 × 10−35.96 × 100−9.24 × 10⁻³
Table 12. The results of grouping and weighing the environmental consequences of emissions of compounds causing climate change due to construction works occurring at individual stages of the life cycle of the research object.
NoSubstanceCompartmentConstruction Works
ManufactureExploitationLandfillRecycling
1Carbon dioxideAir−4.40 × 1002.19 × 10−1×−2.48 × 100
2Carbon dioxide, in groundAir7.22 × 1001.84 × 1002.77 × 100×
3Carbon monoxideAir5.71 × 10−2××−2.48 × 10⁻²
4Carbon monoxide, in groundAir7.58 × 10−3×5.14 × 10−3×
5Dinitrogen monoxideAir2.74 × 10−25.37 × 10−31.48 × 10−12.33 × 10⁻³
6Ethane, hexafluoro-, HFC-116Air3.10 × 10−22.46 × 10−31.94 × 10−6×
7MethaneAir6.85 × 10−23.43 × 10⁻³ × −6.16 × 10⁻²
8Methane, in groundAir8.23 × 10−22.89 × 10−21.55 × 100×
9Methane, tetrafluoro-, CFC-14Air1.38 × 10−11.10 × 10−28.60 × 10−6−2.00 × 10⁻¹
10Sulfur hexafluorideAir××3.33 × 10−3×
11Remaining substances×7.91 × 10−31.66 × 10−23.01 × 10⁻⁴−2.68 × 10⁻⁴
TOTAL3.24 × 1002.13 × 1004.48 × 100−2.76 × 100
Table 13. The results of grouping and weighing the environmental consequences of emissions of compounds causing climate change due to sanitary installations occurring at individual stages of the life cycle of the research object.
NoSubstanceCompartmentSanitary Installations
ManufactureExploitationLandfillRecycling
1Carbon dioxideAir2.67 × 1002.58 × 10−2×−9.29 × 10⁻¹
2Carbon dioxide, in groundAir2.62 × 1002.36 × 10−11.09 × 100×
3Carbon monoxideAir2.13 × 10−2××−1.19 × 10⁻²
4Carbon monoxide, in groundAir×8.36 × 10⁻⁴××
5Dinitrogen monoxideAir1.38 × 10−21.33 × 10−35,89 × 10−2−2.69 × 10⁻⁵
6Ethane, hexafluoro-, HFC-116Air1.94 × 10−2×7.71 × 10−7×
7MethaneAir7.14 × 10−26.15 × 10⁻⁴×−2.93 × 10⁻²
8Methane, in groundAir1.96 × 10−23.13 × 10−36.12 × 10−1×
9Methane, tetrafluoro-, CFC-14Air9.33 × 10−26.04 × 10−43.43 × 10−6×
10Remaining substances × 5.48 × 10−35.35 × 10−43.46 × 10⁻³−9.48 × 10⁻²
TOTAL5.53 × 1002.69 × 10−11.76 × 100−1.06 × 100
Table 14. The results of grouping and weighing the environmental consequences of emissions of compounds causing climate change due to electrical installations occurring at individual stages of the life cycle of the research object.
NoSubstanceCompartmentElectrical Installations
ManufactureExploitationLandfillRecycling
1Carbon dioxideAir4.19 × 1003.33 × 10−1×−2.05 × 10⁻¹
2Carbon dioxide, in groundAir2.10 × 10−12.54 × 10−21.26 × 10−2×
3Carbon monoxideAir6.87 × 10−36.42 × 10⁻⁴×−2.04 × 10⁻³
4Dinitrogen monoxideAir5.03 × 10−3×4.45 × 10−43.48 × 10−4
5Ethane, hexafluoro-, HFC-116Air8.46 × 10−3×6.03 × 10−9×
6MethaneAir2.05 × 10−29.04 × 10⁻³×−5.91 × 10⁻³
7Methane, in groundAir4.50 × 10−31.94 × 10−38.21 × 10−3×
8Methane, tetrafluoro-, CFC-14Air3.77 × 10−2×2.68 × 10−8−1.08 × 10⁻³
9Remaining substances×4.27 × 10−48.19 × 10−53.11 × 10⁻⁵−2.28 × 10⁻⁵
TOTAL4.48 × 1003.71 × 10−12.13 × 10⁻²−2.14 × 10⁻¹
Table 15. The results of grouping and weighing the environmental consequences of emissions of compounds causing climate change due to roads and parking lots occurring at individual stages of the life cycle of the research object.
NoSubstanceCompartmentRoads and Parking LOTS
ManufactureExploitationLandfillRecycling
1Carbon dioxideAir−2.07 × 10−14.12 × 10−3×−9.29 × 10⁻³
2Carbon dioxide, in groundAir9.02 × 1001.13 × 10−33.68 × 100×
3Carbon monoxideAir×1.86 × 10⁻⁵××
4Dinitrogen monoxideAir1.48 × 10−2×1.99 × 10−14.64 × 10−5
5MethaneAir×8.51 × 10⁻⁵××
6Methane, in groundAir5.60 × 10−21.89 × 10−52.07 × 100×
7Remaining substances×9.60 × 10−31.35 × 10−51.17 × 10−21.88 × 10−7
TOTAL8.89 × 1005.38 × 10−35.96 × 100−9.24 × 10⁻³
Publisher’s Note: MDPI stays neutral with regard to jurisdictional claims in published maps and institutional affiliations.

