Article

Influence of a Better Prediction of Thermal Satisfaction for the Implementation of an HVAC-Based Demand Response Strategy

1
Department of Architectural Engineering, Kangwon National University, Kangwon-do 24341, Korea
2
Department of Integrated Energy and Infra System, Kangwon National University, Kangwon-do 24341, Korea
3
School of Architecture, Chonnam National University, Gwangju 61186, Korea
*
Author to whom correspondence should be addressed.
Energies 2022, 15(9), 3094; https://doi.org/10.3390/en15093094
Submission received: 14 March 2022 / Revised: 20 April 2022 / Accepted: 21 April 2022 / Published: 23 April 2022
(This article belongs to the Topic Building Energy and Environment)

Abstract

:
Building system operation faces the challenge of reducing energy use and implementing a demand response, which can be defined as a temporary modification in energy loads affecting dynamic energy price and reliability information. The heating, ventilation, and air-conditioning (HVAC) system in buildings provides an opportunity for implementing demand response strategies due to the thermal inertia in building zones. However, an HVAC-based demand response is not a prevalent strategy in actual facility management due to the lack of understanding among building operators of their facilities and occupants. Herein, we focus on developing a better understanding of the occupant side by obtaining a reliable prediction of occupants’ thermal satisfaction. We evaluate the prediction performance of a probabilistic model provided in our previous paper using a case study with a subset of the ASHRAE Global Thermal Comfort Database II. The influence of a better prediction of thermal satisfaction on the implementation of the HVAC-based demand response strategy is further discussed. The conventional method overestimates productivity deterioration due to changes in the thermal environment, making it challenging to implement an HVAC-based demand response strategy aggressively. A robust prediction model using a probabilistic approach can solve this problem, allowing building operators to adopt an aggressive stance for implementing a demand response. The results of this study offer fresh insight into the impact of a probabilistic model in the prediction of thermal satisfaction for establishing an HVAC-based demand response strategy.

1. Introduction

The purpose of heating, ventilation, and air-conditioning (HVAC) systems is to maintain desired environmental conditions in a specific physical space. These conditions are collectively referred to as the conditions for human thermal comfort, which is defined as a mental state of satisfaction with the thermal environment [1]. The term satisfaction is often synonymously used with acceptability [2]. A thermally comfortable environment ensures that the conditions are satisfactory/acceptable to most occupants (i.e., more than 80%, according to ASHRAE Standard 55 [3]) within a specific physical space. HVAC systems are responsible for efficiently maintaining the desired service level in accordance with ASHRAE Standard 55.
Recently, energy use in buildings has emerged as an important issue. Building operators and facility managers face the challenge of reducing energy costs to temporarily reduce the load in response to the spike in electricity prices [4,5], which is called a demand response. HVAC systems, along with lighting, are most commonly adjusted to achieve energy savings in demand response strategies in buildings. This is because HVAC systems are well-suited to a demand response strategy that evenly distributes the burden across the facility, which is least likely to have negative effects on building occupants. Furthermore, large thermal inertia in an occupied space allows HVAC systems to be temporarily unloaded without an immediate negative impact on the occupants. However, despite this potential for energy saving, the HVAC-based demand response is not a prevalent strategy in actual facility management. One reason is the lack of automated HVAC control systems required during demand response events [6]. Because of a lack of hardware, simple strategies are typically prioritized, such as the global temperature adjustments of spaces (e.g., turning the cooling thermostat up by 3 °C) [7]. However, applying the demand response strategy also requires software that determines proper operating points. In this study, we focused on a software approach to develop a successful HVAC-based demand response strategy (e.g., a setpoint temperature adjustment), for example a predictive model capable of accurately predicting occupants’ thermal satisfaction under varying thermal conditions.
In implementing HVAC-based demand response strategies, building operators and facility managers should consider meeting energy saving targets while minimizing the negative impacts on occupants’ thermal comfort, because thermal discomfort due to reduced service levels can harm occupants’ productivity, leading to economic losses [8,9,10,11,12]. In other words, changes in thermal satisfaction due to setpoint temperature adjustments not within acceptable boundaries can result in the further deterioration of the occupants’ well-being and lead to an expected loss of productivity, which is the most significant concern for building operators. To this end, a multi-objective optimizer for HVAC control is sometimes installed and tested. Homod et al. [13] proposed a fuzzy forward control strategy to simultaneously balance energy saving and achieve occupant satisfaction. Schito et al. [14] demonstrated the multi-objective optimization of the HVAC control in museums to achieve visitors’ comfort and energy savings without compromising the integrity of the artwork. Reena et al. [15] and Turley et al. [16] presented a framework for energy and comfort management in buildings. Although these previous works are meaningful advances in this field, there are limitations associated with simulation-based approaches and with using the existing thermal comfort index, such as the predicted mean vote (PMV) and predicted percentage of dissatisfied (PPD) proposed by Fanger [17]. In reality, even a simple strategy, such as setpoint adjustment, is difficult to aggressively implement for achieving energy saving goals because building operators and facility managers are generally afraid of not meeting the desired service level and facing complaints from occupants as a result [18]. To successfully implement an HVAC control that meets both the thermal comfort and energy saving requirements, a technique that can offer reliable data on occupants’ thermal satisfaction should be developed.
For over 50 years, PMV and PPD have been widely employed to assess the indoor climate and thermal satisfaction of occupants. As addressed by Benton et al. [19], several studies have validated the relationship between indoor climate and occupants’ thermal satisfaction provided by the PMV–PPD model. However, several studies, such as those by Schiller [20] and Xavier and Lamberts [21], reported discrepancies between the PPD and occupant dissatisfaction in practical scenarios. Recent advancements in data science have facilitated overcoming this prediction failure. Katić et al. [22] and Ghahramani et al. [23] focused on individuals’ thermal comfort responses and developed a personal comfort prediction model by adopting machine learning algorithms such as support vector machines and ensemble algorithms. Li et al. [24] proposed a high accuracy comfort prediction method using an artificial neural network with three physiological input parameters. Although the intrinsic objective of these studies and our study was to improve prediction performance, we mainly focused on strategies to reflect the stochastic characteristics of thermal satisfaction in the prediction model.
We believe that the reported failure in the prediction by Fanger’s model may be a result of inherent limits in the deterministic approach used to provide a link between environmental conditions and human sensations. Additionally, nonthermal factors (such as race, age, gender, ethnicity, and region), which are not considered in typical deterministic PMV models but make the prediction highly uncertain, may also cause a prediction failure.
In the authors’ previous study [25], a stochastic model which is distinct from the existing simple linear regression methods and can probabilistically reproduce dispersed occupants’ response to thermal sensation, was developed. Compared with the deterministic method based on Fanger’s PMV–PPD model, our model adequately provides the stochastic characteristics of dispersed thermal sensation votes across occupants and a robust prediction of thermal satisfaction.
In this study, we present an argument that the reliable prediction of thermal satisfaction can assist building operators and facility managers in aggressively implementing demand response strategies, ever since determining that proper operating points can reduce energy use while minimizing deterioration in productivity and thermal comfort. To support this argument, we compared a conventional prediction model (i.e., Fanger’s PMV–PPD model [17]) for thermal satisfaction with a data-driven probabilistic prediction model proposed in our previous research [25]. In addition, we also discussed the influence of the differences in prediction accuracy for the implementation of an HVAC-based demand response strategy.
The remainder of this paper is structured as follows. In Section 2, the field survey data used in the case study are briefly presented. Thereafter, in Section 3 and Section 4, the prediction performance is tested with publicly available data on occupants’ response to thermal sensation (ASHRAE Global Thermal Comfort Database II [26]), emphasizing thermal satisfaction, and compared with that of the conventional method. In addition, the impact of the better prediction of occupants’ thermal satisfaction on the prediction of occupants’ productivity is quantified. The significance of implementing HVAC-based demand response strategies is also discussed. Finally, the limitations of this study and the conclusions, along with directions for future studies, are presented in Section 5 and Section 6, respectively.

2. Data Description

A subset of ASHRAE Global Thermal Comfort Database II [26] was used to base the discussion on thermal satisfaction and productivity on real-world data. Although the database is a collection of field surveys performed under various conditions (climate, building type, experimental range, etc.), we extracted and used only specific field survey data collected from an air-conditioned office in the Midlands, UK (number of data: n = 4316; monitoring data measured continuously for one week in summer), which was also used by Oseland [27]. Table 1 lists the contents of the dataset used. Three additional indices related to thermal comfort, i.e., the PMV, PPD, and operative temperature (OT), were then calculated for each observed value by guidance in engineering references [1,3,28].

3. Limitations of the Conventional TSV Model

A field survey is considered in which participants are requested to vote their thermal sensation on a seven-point scale, and the measured OT value defines the indoor thermal condition.
In surveys, the measured PMV value often disagrees with the thermal sensation perceived by the occupants because the psychological and behavioral factors influencing the occupants’ perceptions are not fully considered in the PMV model. Consequently, the actual TSVs are often biased towards the warm or cool sides compared with the measured PMV. Figure 1 shows the OT–TSV and OT–PMV relationships obtained from the survey. These relationships show a bias between TSV and PMV that often exceeds 1 scale unit. Fortunately, a least-squares line can provide a good approximation of the mean TSV for each OT level ( r 2 0.94 ).
A comfort zone [3] can be deduced as the OT range from 20.05 to 23.37 °C using a least-squares line (the blue line in Figure 1). Table 2 lists the statistics of the TSVs made in this range. Although this range should be equivalent to 90% satisfaction, the actual percentage of thermally satisfied occupants in this range is approximately 76%. This is attributed to the discrepancy in the deterministic estimation approach that solely produces the mean vote and ignores its variation. This limitation is closely associated with the conventional method of predicting thermal satisfaction.
Generally, a simple linear regression model based on constant variance is used to derive the dose–response relationship between a given thermal condition and the consequent thermal sensation in occupants, presumably owing to its mathematical simplicity. However, this is an optional method, and its results may not necessarily be linked to the prediction of thermal satisfaction.
Figure 2 shows the percentage of dissatisfied occupants as determined using the field survey dataset, wherein the data points are organized in terms of OT. The following components are listed in the legend:
(a)
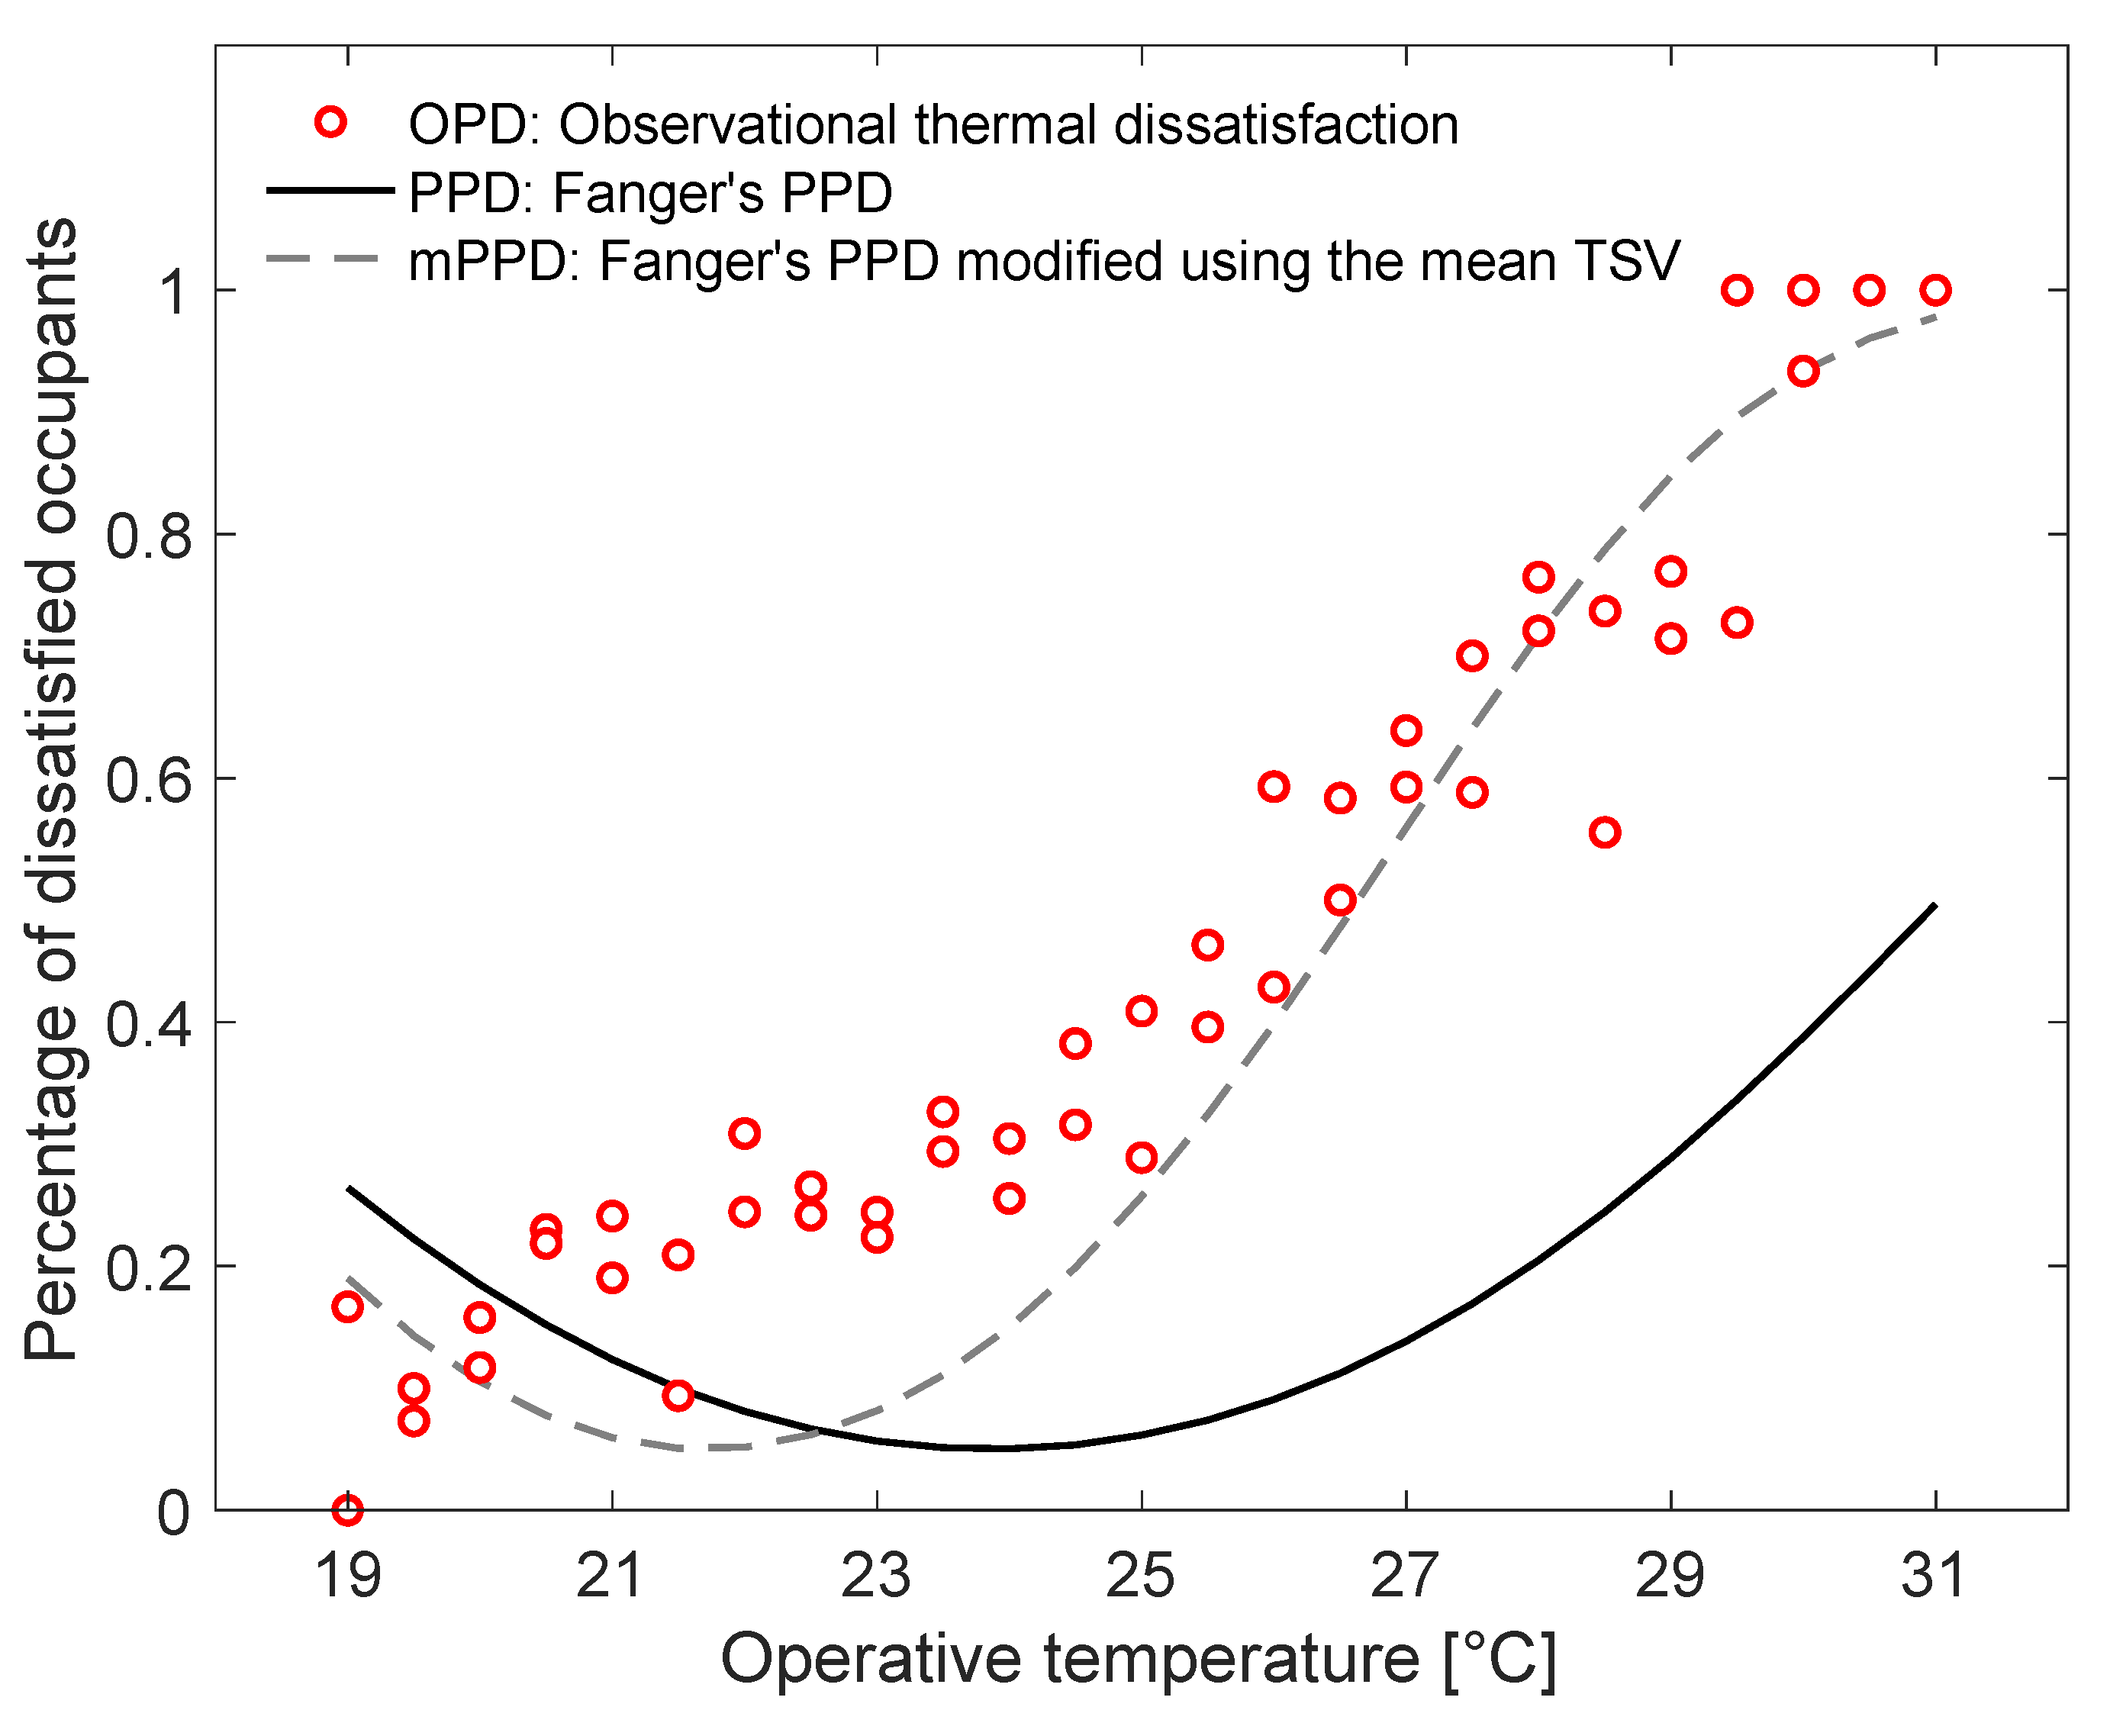
OPD: Observational thermal dissatisfaction (percentage of occupants voting for a thermal sensation of cold, cool, warm, or hot for each data bin divided into 0.5 °C OT intervals).
(b)
PPD: Percentage of dissatisfied occupants calculated using Fanger’s PMV–PPD equation.
(c)
mPPD: Percentage of dissatisfied occupants calculated using Fanger’s PMV–PPD equation modified with the mean TSV (the blue line in Figure 1). Many studies on the modification of the thermal comfort model based on field surveys have used this approach [29,30,31,32].
The following discussion is only concerned with the results between the OTs of 20 and 30 °C because the data from the other ranges were insufficient.
In Figure 2, the observed thermal satisfaction was the highest (i.e., the lowest OPD) at an OT of ~22 °C. The mPPD captured the OT range wherein the lowest thermal dissatisfaction was observed. However, the PPD did not reflect this observation, as it was biased to the higher OT side. Furthermore, both the PPD and mPPD predicted an extremely low dissatisfaction rate (approximately 5%) in the thoroughly conditioned environment. However, in a field survey, more than 20% of the occupants remained thermally dissatisfied even within the OT range, where the lowest thermal dissatisfaction appeared.

4. Results

This section aims to emphasize the performance of our model in predicting thermal sensation and thermal satisfaction and discuss its importance in implementing HVAC-based demand response strategies. First, the predicted results of applying the probabilistic model proposed in our previous study [25] are presented; this is based on a case study with the data presented in Section 3. The used model was validated by k-fold cross-validation ( k = 5 ) to prevent overfitting to the specific training data. Then, the influence of a better prediction of thermal satisfaction by using the probabilistic prediction approach for the implementation of an HVAC-based demand response strategy is discussed. Although the essence of the prediction method is briefly described below, the details of the prediction method are omitted here to avoid obscuring the focus of this paper (for details, see Lim et al. [25]).
The prediction model comprises a statistical framework for estimating model parameters and a regression method for considering the impact of the measured (thermal) and non-measured (nonthermal) factors on thermal sensation. Our model, including the variance parameter defined as a thermal-condition-dependent variable, provides a reliable prediction of the distribution of thermal sensations in a given indoor climate. This consideration can generate reliable information on the thermal satisfaction of occupants.

4.1. Model-Predicted Thermal Sensation

Figure 3 shows the observed probability of occupants responding to each category of the seven-point scale TSV in given OT conditions. Figure 4 presents the prediction results obtained from the conventional and proposed models in given thermal conditions. The predictions shown in Figure 4a were deterministically established as 0 or 1 according to the pseudocode listed in Algorithm 1. Figure 4b shows the probability distribution of the occupant response in each TSV category. A comparison of Figure 3 and Figure 4 indicates that the proposed model reflects the observations better compared to the prediction by a simple linear regression. Therefore, the proposed model can provide a thermal sensation profile reflecting the inherent stochastic characteristics of the actual TSV.
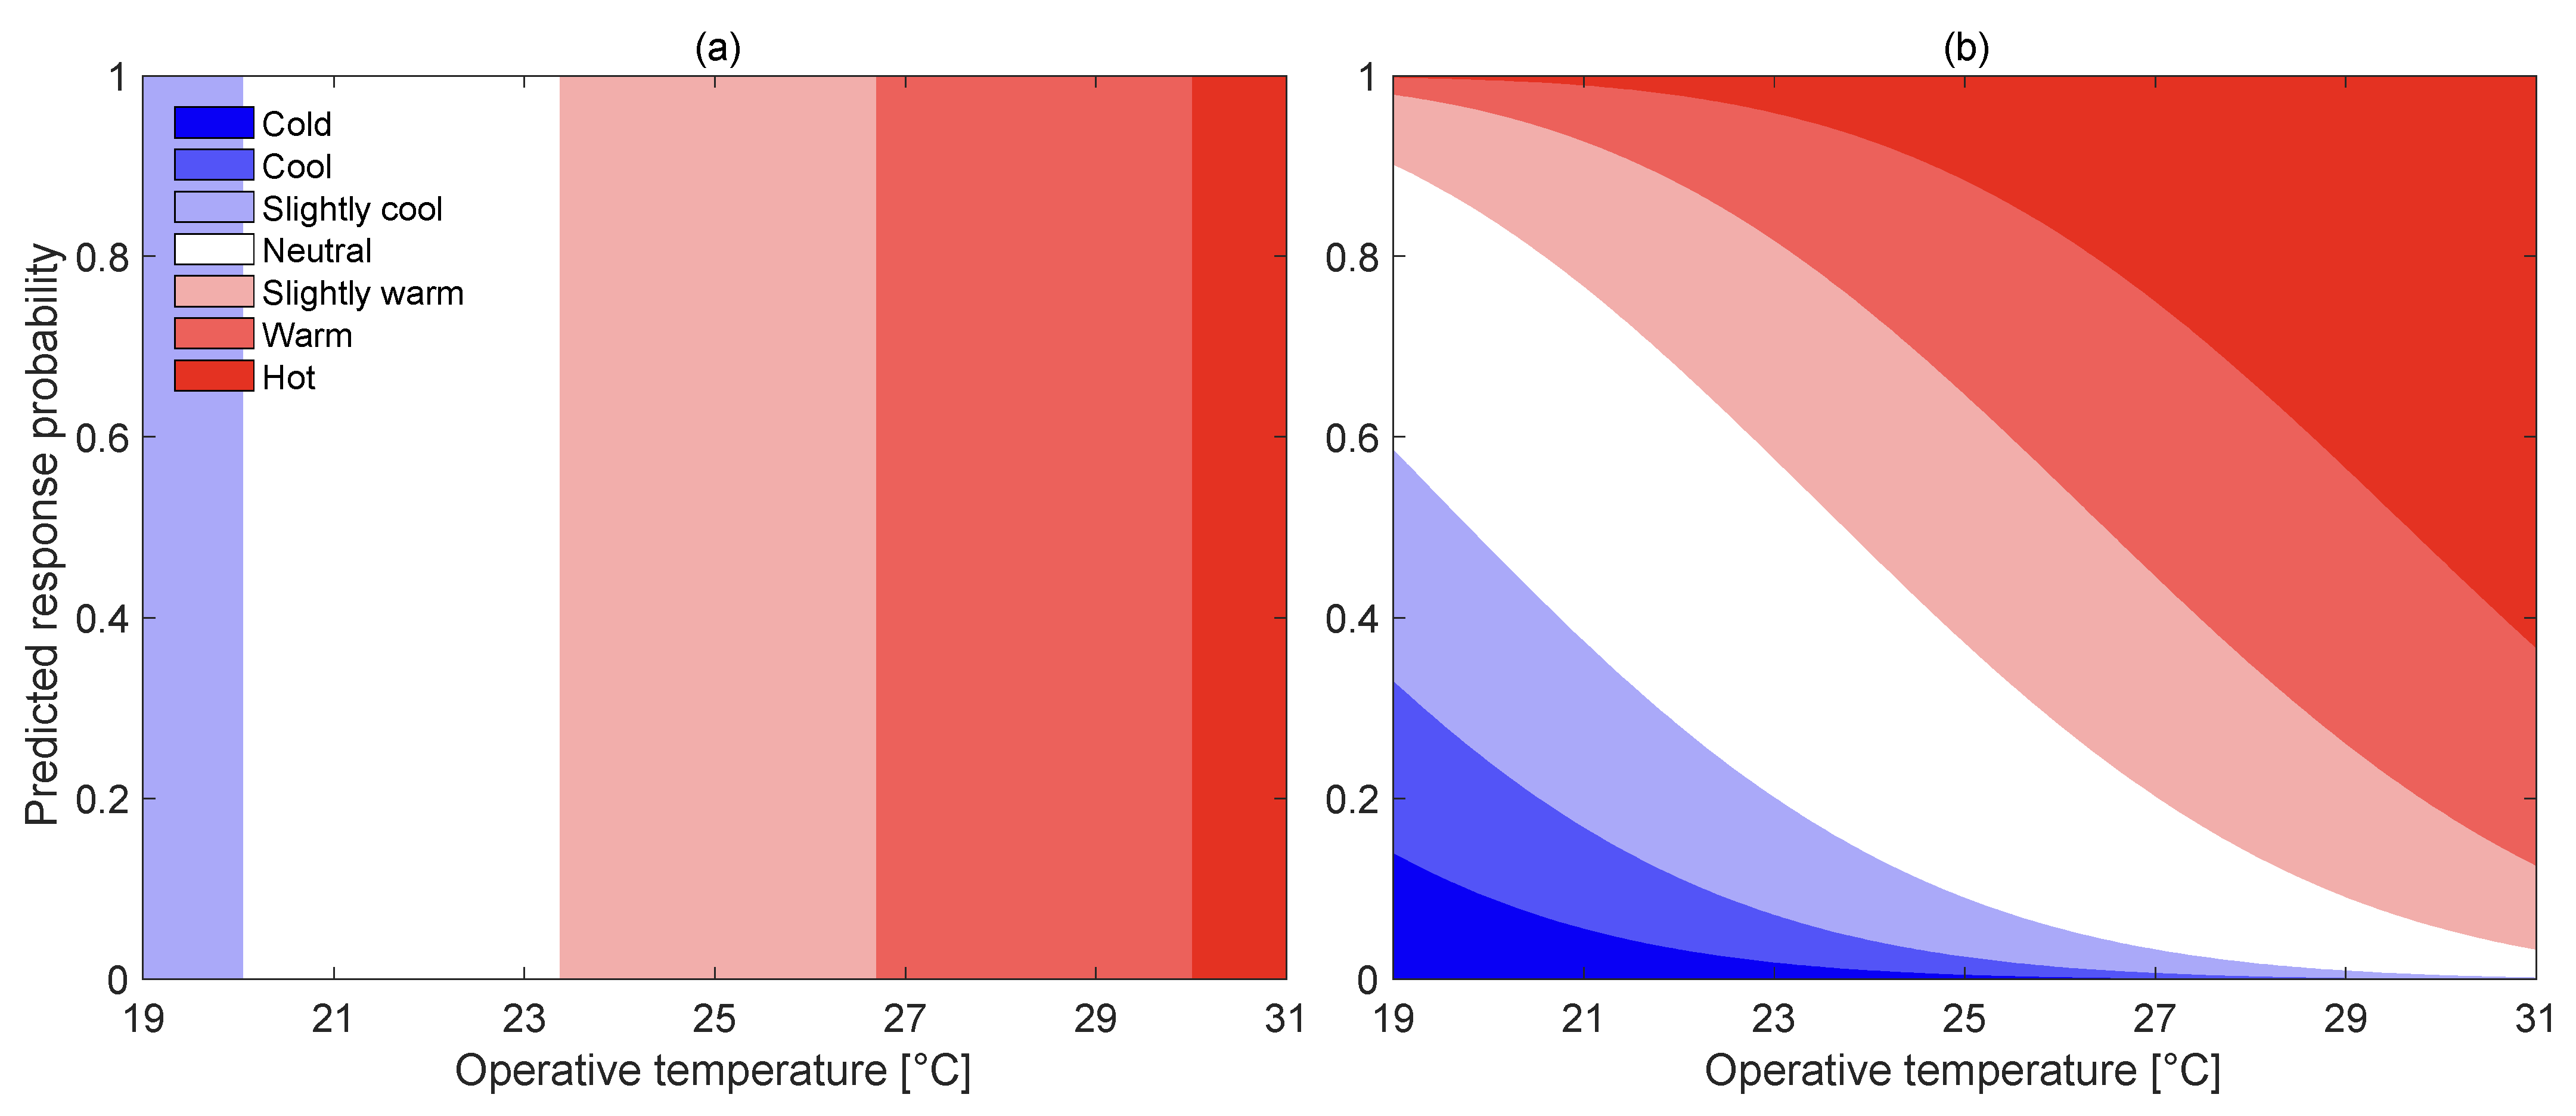
Algorithm 1. Pseudocode for deterministically establishing the response probability for each TSV category.
mean TSV = −6.5368 + 0.3011 × OT (based on the blue line in Figure 1).
If mean TSV < −2.5 then “thermal sensation of cold”
  elseif mean TSV < −1.5 then “thermal sensation of cool”
  elseif mean TSV < −0.5 then “thermal sensation of slightly cool”
  elseif mean TSV < 0.5 then “thermal sensation of neutral”
  elseif mean TSV < 1.5 then “thermal sensation of slightly warm”
  elseif mean TSV < 2.5 then “thermal sensation of warm”
  elseif “thermal sensation of hot”
end

4.2. Model-Predicted Thermal Dissatisfaction

In Figure 5, the model-predicted thermal dissatisfaction (MPD) data are superimposed on the observed data, and the data predicted using the conventional methods plotted in Figure 3. The MPD, the percentage of dissatisfied occupants, was predicted using our model proposed in [33], which was generated with points estimated from the MAP and a 99% credible interval (CI). In our model, the MPD predicted thermal satisfaction (i.e., the percentage of thermally satisfied occupants) more accurately (without overestimation) and captured the thermal conditions that yielded the highest thermal satisfaction. In addition, the probabilistic prediction results using the 99% CI of the estimated model parameters showed good agreement with the observations compared to other prediction results.

4.3. Impact on the Implementation of the HVAC-Based Demand Response Strategy

As indicated by the scenario mentioned in Section 1, HVAC engineers must determine a demand response strategy that temporarily decreases energy use. For example, HVAC engineers must tune the indoor climate such that a suboptimal environment is obtained. The advantages (the financial incentives earned by limiting and/or shifting power demands) and disadvantages (the economic losses due to the deterioration of the occupants’ performance resulting from a sub-optimal indoor environment) of this choice must be balanced. In this section, the implications of a better prediction of thermal satisfaction while achieving this balance are discussed.
Such discussions can be ineffective because of the variation in the occupants’ performance with the quality of the indoor environment, which often depends on indirect evidence [1]. In such cases, measurement results such as [9,10,34,35] serve as references. Herein, the discussion presented is based on a meaningful relationship between the relative occupant performance (RP) and TSV, which was reported by Jensen et al. [9] and is expressed as follows:
RP = 0.0069 × TSV 2 0.0123 × TSV + 0.9945
It is concluded that the initial approximation of the prediction of practical office work performance and the generated OT–RP relationship shown in Figure 6 is based on Equation (1). When deterministically approaching the TSV, the RP is calculated by applying the TSV–OT relationship based on the blue line shown in Figure 1. When probabilistically approaching the TSV using the proposed model, the RP at a given OT is calculated as follows:
RP = [ P ( TSV = 3 ) P ( TSV = 2 ) P ( TSV = 2 ) P ( TSV = 3 ) ] T × [ 0.0069 × ( 3 ) 2 0.0123 × ( 3 ) + 0.9945 0.0069 × ( 2 ) 2 0.0123 × ( 2 ) + 0.9945 0.0069 × ( 2 ) 2 0.0123 × ( 2 ) + 0.9945 0.0069 × ( 3 ) 2 0.0123 × ( 3 ) + 0.9945 ]
where each element in the left vector is the probability of the TSV being −3, …, 3, which can be obtained from Figure 4b.
As shown in Figure 6, the deterministic approach overestimates the occupant performance around the comfort zone. The overestimation level decreases with increasing OT and eventually proceeds to an underestimation after a certain OT point. Further investigation is required to quantitatively prove the gap between the two curves shown in Figure 6 because Equation (1) is one of the numerous indicators of occupants’ performance over a wide range of tasks in indoor environments, for which there are different scientific arguments. It is noteworthy that, despite the lack of quantitative agreement, it is agreed that lowering indoor environmental quality decreases productivity [1], which indicates the wider implications of the proposed model. The proposed method predicts that occupant performance would more smoothly decrease with increasing OT than the occupant performance predicted using the conventional method. In addition, the proposed method provides more accurate predictions. This allows HVAC engineers to aggressively tune the indoor climate to meet energy-saving goals. Using such temporary demand response strategies, HVAC engineers and building operators can permanently improve the energy efficiency of HVAC systems while maintaining acceptable levels of occupant productivity.

5. Discussion

The results suggest that building operators and facility managers can more actively utilize demand response strategies if the prediction accuracy of thermal sensation and thermal satisfaction is improved by using a data-driven probabilistic approach. Therefore, the probabilistic prediction method proposed in this study can not only improve the understanding of thermal comfort exhibited by occupants in a specific space but also be used as an HVAC control technology considering the trade-off relationship between the energy use of building facilities and the service level.
Despite our attempt to provide a comprehensive description of the impact of thermal satisfaction prediction on implementing an HVAC-based demand response strategy, this study should be regarded as a case study using in situ experimental data. The results of this study (Figure 6) reveal an apparent change in the productivity level due to environmental variations. However, further research is required to determine how well the relative difference value represents the actual differences. Herein, we adopted the claims of the existing research (i.e., Equation (1)) to quantify relative occupant performance; however, quantitative evidence on productivity deterioration due to the changes in the thermal environment by demand response control is scarce.
The probabilistic prediction method for thermal satisfaction proposed in this study was verified using subset data of the ASHRAE Global Thermal Comfort Database II. To generalize the prediction performance of this model, validations using various field survey data on changes in thermal comfort and occupant performance should be accompanied in the future.

6. Conclusions

Thermal satisfaction contributes to productivity in daily life. Therefore, it is an important criterion that designers and engineers in charge of building projects must consider. Recently, as energy use in buildings has emerged as a significant issue, the real challenge is balancing thermal satisfaction with energy use for HVAC systems. HVAC-based demand response control is an important technology for reducing energy use while minimizing the negative impacts on occupants’ thermal satisfaction, and this can be achieved using both hardware and software development. As it is costly to replace the control hardware of existing buildings, improvement using software will attract attention in the future.
This study provides new insights into the important issue faced by building operators and facility managers, which is achieving energy savings targets while maintaining the desired level of service. An improved thermal satisfaction prediction, a type of software improvement, allows building operators and facility managers to operate their systems more flexibly, which helps to aggressively implement HVAC-based demand response strategies, such as a setpoint temperature adjustment. In addition, the results of this study will be helpful for studies that require a deep understanding of thermal comfort, such as PMV-based HVAC controls, and future research on effective strategies for implementing HVAC-based demand responses.

Author Contributions

Conceptualization, J.L. and W.C.; Methodology, J.L. and W.C.; Software, J.L.; Writing—Original Draft Preparation, J.L.; Writing—Review and Editing, J.L. and W.C.; Visualization, J.L. and W.C. All authors have read and agreed to the published version of the manuscript.

Funding

This work was partly supported by the 2020 Research Grant from Kangwon National University and the National Research Foundation of Korea (NRF) grant funded by the Korean Government (MSIT) (No. NRF-2020R1F1A1068197).

Data Availability Statement

Data sharing is not applicable.

Conflicts of Interest

The authors declare no conflict of interest.

References

  1. ASHRAE. ASHRAE Handbook: Fundamentals; ASHRAE: Atlanta, GA, USA, 2013. [Google Scholar]
  2. de Dear, R.J.; Brager, G.S. Thermal Comfort in Naturally Ventilated Buildings: Revisions to ASHRAE Standard 55. Energy Build. 2002, 34, 549–561. [Google Scholar] [CrossRef] [Green Version]
  3. ASHRAE. ASHRAE Standard 55—Thermal Environmental Conditions for Human Occupancy; ASHRAE: Atlanta, GA, USA, 2017. [Google Scholar]
  4. Guo, H.; Qiao, W.; Liu, J. Dynamic Feedback Analysis of Influencing Factors of Existing Building Energy-Saving Renovation Market Based on System Dynamics in China. Sustainability 2019, 11, 273. [Google Scholar] [CrossRef] [Green Version]
  5. Hoyo-Montaño, J.; Valencia-Palomo, G.; Galaz-Bustamante, R.; García-Barrientos, A.; Espejel-Blanco, D. Environmental Impacts of Energy Saving Actions in an Academic Building. Sustainability 2019, 11, 989. [Google Scholar] [CrossRef] [Green Version]
  6. Goldman, C.; Hopper, N.; Sezgen, O.; Moezzi, M.; Bharvirkar, R. Does Real-Time Pricing Deliver Demand Response? A Case Study of Niagara Mohawk’s Large Customer RTP Tariff. In Proceedings of the ACEEE 2004 Summer Study on Energy Efficiency in Buildings; 2004. Available online: https://www.aceee.org/files/proceedings/2004/data/papers/SS04_Panel5_Paper10.pdf (accessed on 20 April 2022).
  7. Watson, D.S.; Kiliccote, S.; Motegi, N.; Piette, M.A. Strategies for Demand Response in Commercial Buildings. In Proceedings of the ACEEE Summer Study on Energy Efficiency in Buildings, Pacific Grove, CA, USA, 13–18 August 2006. [Google Scholar]
  8. Lan, L.; Wargocki, P.; Lian, Z. Quantitative Measurement of Productivity Loss Due to Thermal Discomfort. Energy Build. 2011, 43, 1057–1062. [Google Scholar] [CrossRef]
  9. Jensen, K.L.; Toftum, J.; Friis-Hansen, P. A Bayesian Network Approach to the Evaluation of Building Design and Its Consequences for Employee Performance and Operational Costs. Build. Environ. 2009, 44, 456–462. [Google Scholar] [CrossRef]
  10. Seppänen, O.; Fisk, W.J.; Lei, Q.H. Room Temperature and Productivity in Office Work; Lawrence Berkeley National Laboratory: Berkeley, CA, USA, 2006; Available online: https://escholarship.org/uc/item/9bw3n707 (accessed on 20 April 2022).
  11. Adams, J.N.; Bélafi, Z.D.; Horváth, M.; Kocsis, J.B.; Csoknyai, T. How Smart Meter Data Analysis Can Support Understanding the Impact of Occupant Behavior on Building Energy Performance: A Comprehensive Review. Energies 2021, 14, 2502. [Google Scholar] [CrossRef]
  12. Ali, Q.; Thaheem, M.J.; Ullah, F.; Sepasgozar, S.M.E. The Performance Gap in Energy-Efficient Office Buildings: How the Occupants Can Help? Energies 2020, 13, 1480. [Google Scholar] [CrossRef] [Green Version]
  13. Homod, R.Z.; Sahari, K.S.M.; Almurib, H.A.F.; Nagi, F.H. Gradient Auto-Tuned Takagi–Sugeno Fuzzy Forward Control of a HVAC System Using Predicted Mean Vote Index. Energy Build. 2012, 49, 254–267. [Google Scholar] [CrossRef]
  14. Schito, E.; Conti, P.; Urbanucci, L.; Testi, D. Multi-Objective Optimization of HVAC Control in Museum Environment for Artwork Preservation, Visitors’ Thermal Comfort and Energy Efficiency. Build. Environ. 2020, 180, 107018. [Google Scholar] [CrossRef]
  15. Mary Reena, K.E.; Mathew, A.T.; Jacob, L. A Flexible Control Strategy for Energy and Comfort Aware HVAC in Large Buildings. Build. Environ. 2018, 145, 330–342. [Google Scholar] [CrossRef]
  16. Turley, C.; Jacoby, M.; Pavlak, G.; Henze, G. Development and Evaluation of Occupancy-Aware HVAC Control for Residential Building Energy Efficiency and Occupant Comfort. Energies 2020, 13, 5396. [Google Scholar] [CrossRef]
  17. Fanger, P.O. Thermal Comfort, 1st ed.; McGraw-Hill: New York, NY, USA, 1972. [Google Scholar]
  18. Chen, J.; Augenbroe, G.; Wang, Q.; Song, X. Uncertainty Analysis of Thermal Comfort in a Prototypical Naturally Ventilated Office Building and Its Implications Compared to Deterministic Simulation. Energy Build. 2017, 146, 283–294. [Google Scholar] [CrossRef]
  19. Benton, C.C.; Bauman, F.S.; Fountain, M.E. A Field Measurement System for the Study of Thermal Comfort. ASHRAE Trans. 1990, 96, 623–633. [Google Scholar]
  20. Schiller, G.E. A Comparison of Measured and Predicted Comfort in Office Buildings. ASHRAE Trans. 1990, 96, 609–622. [Google Scholar]
  21. de Paula Xavier, A.A.; Lamberts, R. Indices of Thermal Comfort Developed from Field Survey in Brazil. ASHRAE Trans. 2000, 106, 45–58. [Google Scholar]
  22. Katić, K.; Li, R.; Zeiler, W. Machine Learning Algorithms Applied to a Prediction of Personal Overall Thermal Comfort Using Skin Temperatures and Occupants’ Heating Behavior. Appl. Ergon. 2020, 85, 103078. [Google Scholar] [CrossRef]
  23. Ghahramani, A.; Tang, C.; Becerik-Gerber, B. An Online Learning Approach for Quantifying Personalized Thermal Comfort via Adaptive Stochastic Modeling. Build. Environ. 2015, 92, 86–96. [Google Scholar] [CrossRef] [Green Version]
  24. Li, D.; Menassa, C.C.; Kamat, V.R. Personalized Human Comfort in Indoor Building Environments under Diverse Conditioning Modes. Build. Environ. 2017, 126, 304–317. [Google Scholar] [CrossRef]
  25. Lim, J.; Choi, W.; Akashi, Y.; Yoshimoto, N.; Ooka, R. Bayesian Prediction Model of Thermally Satisfied Occupants Considering Stochasticity Due to Inter- and Intra-Individual Thermal Sensation Variations. J. Build. Eng. 2022, 52, 104414. [Google Scholar] [CrossRef]
  26. Földváry Ličina, V.; Cheung, T.; Zhang, H.; de Dear, R.; Parkinson, T.; Arens, E.; Chun, C.; Schiavon, S.; Luo, M.; Brager, G.; et al. Development of the ASHRAE Global Thermal Comfort Database II. Build. Environ. 2018, 142, 502–512. [Google Scholar] [CrossRef] [Green Version]
  27. Oseland, N.A. Acceptable Temperature Ranges in Naturally Ventilated and Air-Conditioned Offices. ASHRAE Trans. 1998, 104, 1018–1030. [Google Scholar]
  28. ISO 7730:2005; Ergonomics of the Thermal Environment: Analytical Determination and Interpretation of Thermal Comfort Using Calculation of the PMV and PPD Indices and Local Thermal Comfort Criteria. International Organization for Standardization: Geneva, Switzerland, 2005.
  29. Majewski, G.; Orman, Ł.J.; Telejko, M.; Radek, N.; Pietraszek, J.; Dudek, A. Assessment of Thermal Comfort in the Intelligent Buildings in View of Providing High Quality Indoor Environment. Energies 2020, 13, 1973. [Google Scholar] [CrossRef]
  30. Lin, T.-P. Thermal Perception, Adaptation and Attendance in a Public Square in Hot and Humid Regions. Build. Environ. 2009, 44, 2017–2026. [Google Scholar] [CrossRef]
  31. Hwang, R.-L.; Lin, T.-P. Thermal Comfort Requirements for Occupants of Semi-Outdoor and Outdoor Environments in Hot-Humid Regions. Archit. Sci. Rev. 2007, 50, 357–364. [Google Scholar] [CrossRef]
  32. Spagnolo, J.; de Dear, R. A Field Study of Thermal Comfort in Outdoor and Semi-Outdoor Environments in Subtropical Sydney Australia. Build. Environ. 2003, 38, 721–738. [Google Scholar] [CrossRef] [Green Version]
  33. Lim, J.; Akashi, Y.; Yoshimoto, N. Bayesian Inference for Predicting an Inter-Individual Variation of Thermal Sensation Votes. In Proceedings of the Building Simulation 2019: 16th Conference of IBPSA, Rome, Italy, 2–4 September 2019. [Google Scholar]
  34. Roelofsen, P. The Design of the Work Place as a Strategy for Productivity Enhancement. In Proceedings of the 7th REHVA World Congress (CLIMA 2000), Napoli, Italy, 15–18 September 2001. [Google Scholar]
  35. Berglund, L.G.; Gonzales, R.R.; Gagge, A.P. Predicted Human Performance Decrement from Thermal Discomfort and ET*. In Proceedings of the Indoor Air ’90, Toronto, ON, Canada, 29 July–3 August 1990. [Google Scholar]
Figure 1. OT−TSV and OT−PMV relationships. The mean TSV and mean PMV are plotted against OTs binned in 0.5 °C increments. Least-squares lines are generated using weighted regression to account for the number of votes in each OT bin.
Energies 15 03094 g001
Figure 2. Relationship between the operative temperature and the percentage of dissatisfied occupants.
Energies 15 03094 g002
Figure 3. Observational percentage of occupants responding to each TSV category from the (a) training and (b) validation datasets. Each stacked bar was drawn using bin width of 0.5 °C.
Energies 15 03094 g003
Figure 4. Thermal sensation profiles based on the (a) conventional and (b) probabilistic models.
Energies 15 03094 g004
Figure 5. Relationship between the operative temperature and the percentage of dissatisfied occupants.
Energies 15 03094 g005
Figure 6. Relationship between the operative temperature and the relative performance of occupants carrying out regular office work.
Energies 15 03094 g006
Table 1. Dataset contents.
VariableDescription
Thermal sensation vote (TSV)The seven-point scaled thermal sensation
−3: cold, −2: cool, −1: slightly cool, 0: neutral,
1: slightly warm, 2: warm, 3; hot
Thermal acceptability0: unacceptable, 1: acceptable
Clothing insulation [clo]Intrinsic clothing ensemble insulation of the subject
Metabolic rate [met]Average activity level of the subject
Air temperature [°C]Air temperature 1.1 m above the floor
Globe temperature [°C]Globe temperature 1.1 m above the floor
Relative humidity [%]Relative humidity
Air velocity [m/s]Airspeed 1.1 m above the floor
Table 2. TSV statistics obtained at the comfort zone identified in the survey data.
Thermal SensationColdCoolSlightly CoolNeutralSlightly WarmWarmHot
Counts4611825156128013739
Share3.2%8.2%17.5%39.2%19.6%9.6%2.7%
Publisher’s Note: MDPI stays neutral with regard to jurisdictional claims in published maps and institutional affiliations.

